
Basic Linear Regression tutorial using GraphPad … · Basic Linear Regression tutorial using...
4
Basic Linear Regression tutorial using GraphPad Prism S-Cubed Website: www.scubed.org.mt Email: [email protected] April 2013
-
Upload
duongthien -
Category
Documents
-
view
234 -
download
0
Transcript of Basic Linear Regression tutorial using GraphPad … · Basic Linear Regression tutorial using...
Basic Linear Regression tutorial using
GraphPad Prism
S-Cubed
Website: www.scubed.org.mt
Email: [email protected]
April 2013

S-Cubed 2
Introduction GraphPad Prism, available for both Windows and Mac computers, combines scientific
graphing, comprehensive curve fitting (nonlinear regression), understandable statistics, and
data organization.
GraphPad Prism was originally designed for experimental biologists in medical schools and
drug companies, especially those in pharmacology and physiology. Prism is now used much
more broadly by all kinds of biologists, as well as social and physical scientists. More than
200,000 scientists in over 110 countries rely on Prism to analyze, graph and present their
scientific data. It is also widely used by undergraduate and graduate students.
1. Downloading GraphPad Prism This software is shareware and a fully functional 30-day trial can be downloaded from
http://www.graphpad.com/demos/
2. Constructing a Linear regression 1. Open Prism and the welcome screen will appear.
2. Select XY from New
Table & Graph Menu
3. Select your preferred way
to input Y-values from
Enter/import data list
4. Select linear regression –
compare slopes from the Use
sample data list
5. Input the title and the
values for the independent
(x) variable
6. Input the title and the
values for the dependent
(Y) variable
Note: More than one dataset can be
inputted which would result in more than
one linear regression on the same plot
7. To perform the
linear regression
click on Analyze

S-Cubed 3
8. Select Linear
regression from XY
analyses menu
9. Select which
datasets to be
analyzed
10. Tick this option to test
if the slopes are
significantly different
Note: Usually the following are reported:
Slope (+/-)
Intercept (+/-)
Regression coefficient (R-square)
Sy.x (Standard Error of the Estimate)
P-value (the p-value for determining
the slope if it is significantly non-zero).
A p-value below 0.05 means that the
difference is statistically significant.
11. Click on
Results to
report the
required
linear
regression
parameters
12. Click on
Graphs to go
to the plot
S-Cubed 4
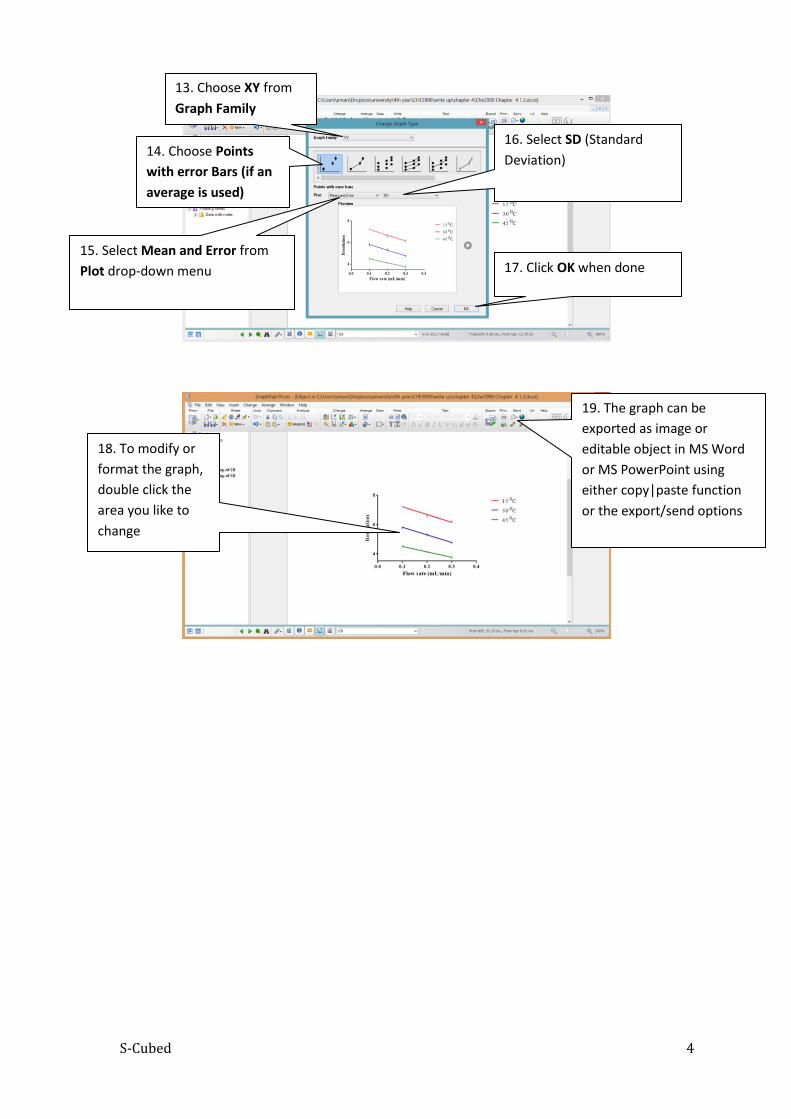
18. To modify or
format the graph,
double click the
area you like to
change
19. The graph can be
exported as image or
editable object in MS Word
or MS PowerPoint using
either copy|paste function
or the export/send options
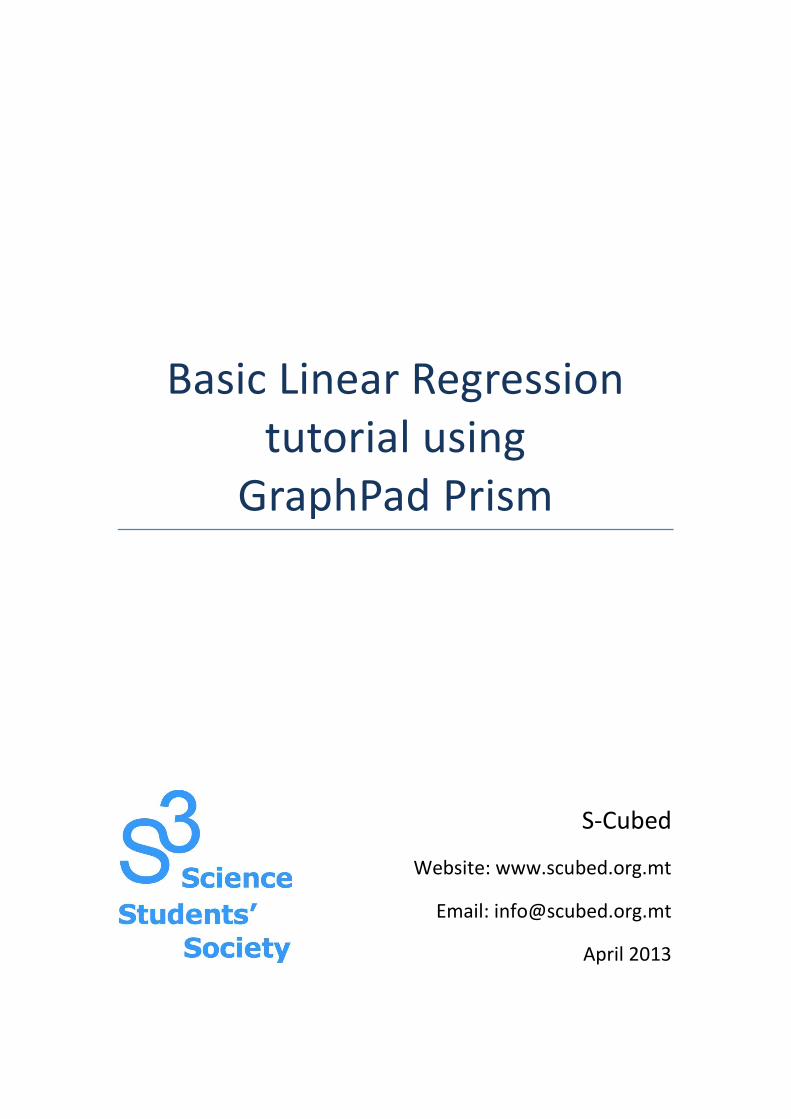
13. Choose XY from
Graph Family
14. Choose Points
with error Bars (if an
average is used)
15. Select Mean and Error from
Plot drop-down menu
16. Select SD (Standard
Deviation)
17. Click OK when done


