Basic Formation Evaluation - IEEE Student Branch...
57
Introduction to Wireline Engineering and its application to Formation Evaluation Asfan Hasbiantoro
-
Upload
trinhkhanh -
Category
Documents
-
view
288 -
download
16
Transcript of Basic Formation Evaluation - IEEE Student Branch...

Introduction to Wireline Engineeringand its application to Formation Evaluation
Asfan Hasbiantoro

Personal Introduction
Asfan Hasbiantoro
Yogyakarta, Jan 25th , 1979
Gadjah Mada University, 1997-2002.
2002-2004 Sumatra, Wireline Engineer, Schlumberger
2005-2008 Mumbai, Wireline Engineer in Charge, Schlumberger
2008-2010 Sudan, Field Service Manager, Schlumberger
2010-2013 Jakarta, Account Manager, Schlumberger
2013-Now Jakarta, Director, PT Iliadi Cipta Energi

Introduction

Which one will you pick ??

Oil Well Life Cycles

Goal of Formation Evaluation
• To evaluate the presence or absence of
commercial quantities of hydrocarbons in
formations penetrated by, or lying near the
wellbore.
• To determine static and dynamic
characteristics of productive reservoir.
• To detect small quantities of hydrocarbon
which nevertheles may be very significant from
an exploration standpoint.
• To provide a comparison of an interval in one
well to the correlation interval in another well.

Evaluation Sequence
Reservoir or Non-Reservoir
Hydrocarbon or Water
Gas and or Oil EVALUATE
Locate the Reservoir
Detect the Hydrocarbon
Differentiate between Gas
Oil

Formation Evaluation is Critical
to understand the Reservoir
• Hydrocarbon Thickness
• Porosity
• Saturation
• Area
• Hydrocarbon type
What is the value of Hydrocarbon in Place
(Hydrocarbon Potential)
• Permeability
• Pressure
How easily can Hydrocarbon can flow
out the well
• Lithology
• Depth, Pressure, Temperature
How easy is it to drill to the reservoir (cost of drilling, completions,
etc ..)

Formation Evaluation Methods
• Mud Logging
• Coring
• Wireline Logging
• Testing and Sampling

Mud Logging
• A well logging process in which drilling
mud and drill bit cuttings from the
formation are evaluated during drilling and
their properties recorded on a strip chart
as a visual analytical tool and stratigraphic
cross sectional representation of the well.

Conventional Coring
• Coring - Conventional Taking a core requires that the regular drill bit be removed from the hole. It is replaced with a "core bit", which is capable of grinding out and retrieving the heavy cylinder of rock.
• The core bit is usually coated with small, sharp diamonds that can grind through the hardest rock. A core bit cuts very slowly.
• A core is a solid cylinder of rock about 4-5 inches in diameter, and a single core will usually be about 30 feet long.

Side Wall Coring
• This method is cheaper than
the conventional coring
• Cores can be taken in
hours, instead of days
• In sidewall coring, a slim
wireline coring tool is run
into the hole. The tool may
be of two general types;
either "rotary sidewall" or
"percussion“
• Typically, cores about 1" in
diameter and 1" to 2" long
can be retrieved with this
method.

Wireline Logging
• What :
• In situ (vs Depth) measurement of Rock and
Fluid Properties
• When :
• Open Hole (before casing set) :
– While drilling (LWD)
– After Drilling (Wireline)
• Cased Hole
– Analysis Behind Casing (CO Log, etc)
– Production Logging
• Interpretation for :
• Geological properties
• Geophysical properties
• Petrophysical properties
• Reservoir properties

Testing (Drill Stem Testing)
and Sampling
• Used to provide a more definitive idea of the production capacity of the well
• Drill Stem Tests identify the types of fluids within the well, as well as the flowrate of these fluids, formation permeability and reservoir pressure.
• Drill stem tests involve connecting a measurement device to the bottom of the drill stem, also in place of the drillbit, and lowering the system into the well, all the way to the formation.
• The instrument is activated at the bottom of the well, measuring the flow of oil or gas for a specified amount of time, usually on hourly basis.

Wireline Logging

Well Logging (WIRELINE)
Well Logging data is critical to
have for Formation Evaluation
Reservoir or Non-Reservoir
Hydrocarbon or Water
Gas and or Oil EVALUATE
Locate the Reservoir
Detect the Hydrocarbon
Differentiate between Gas Oil
• Hydrocarbon Thickness
• Porosity
• Saturation
• Area
• Hydrocarbon type
What is the value of Hydrocarbon in
Place (Hydrocarbon Potential)
•Permeability
•Pressure
How easily can Hydrocarbon can flow out the well
•Lithology
•Depth, Pressure, Temperature
How easy is it to drill to the reservoir
(cost of drilling, completions, etc ..)

Value and Limitation Wireline Log
DataValue Limitation
Provide remotely sensed value of
reservoir properties and fluids
Indirect measurement
Among the most abundant reservoir
data
Vertical resolution
Presentation result fairly standardized Depth of investigation
Allow evaluation of lateral (map) and
vertical (cross section) changes in
reservoir data

Wireline Logging Data User
Wireline logging output can be used in a
number of ways by a number of people to
provide solutions to questions they have about a
particular well. Some of the ways different
people in an office will use these logs are:
Geophysics look to logs for:
– Where are my tops (as predicted?)
– Does seismic interpretation agree with log
data?
– How is my synthetic doing with this new
information?
Geologists look to logs for:
– Where are my tops ?
– Do I have any reservoir ?
– Is there any Hydrocarbon in the well ?
– What type of Hydrocarbon(s) is there ?
– How good is my reservoir ?
– What kind of reserves do I have ?
– How does this tie in to my offsets ?
Drilling Engineers are looking for:
What is my hole volume (cement) ?
What is my dog leg severity ?
Where can I get a good packer seat for testing ?
Where can I set up my whipstock ?
Production Engineers are looking for:
Where should complete this well ?
What will be my expected production rates ?
Will I have to deal with water ?
How should I complete this well ?
Do I need to stimulate this well ?
How should I stimulate it ?

Wireline Log Type
Typically Wireline Logging data classified into 3 board categories depending on well condition logged :
• Open Hole : Log which done right away after drilling process completed prior to case the well.
• Cased Hole : Log done after well been cased
• Production Log : Log done after well been produced or fluid flowing
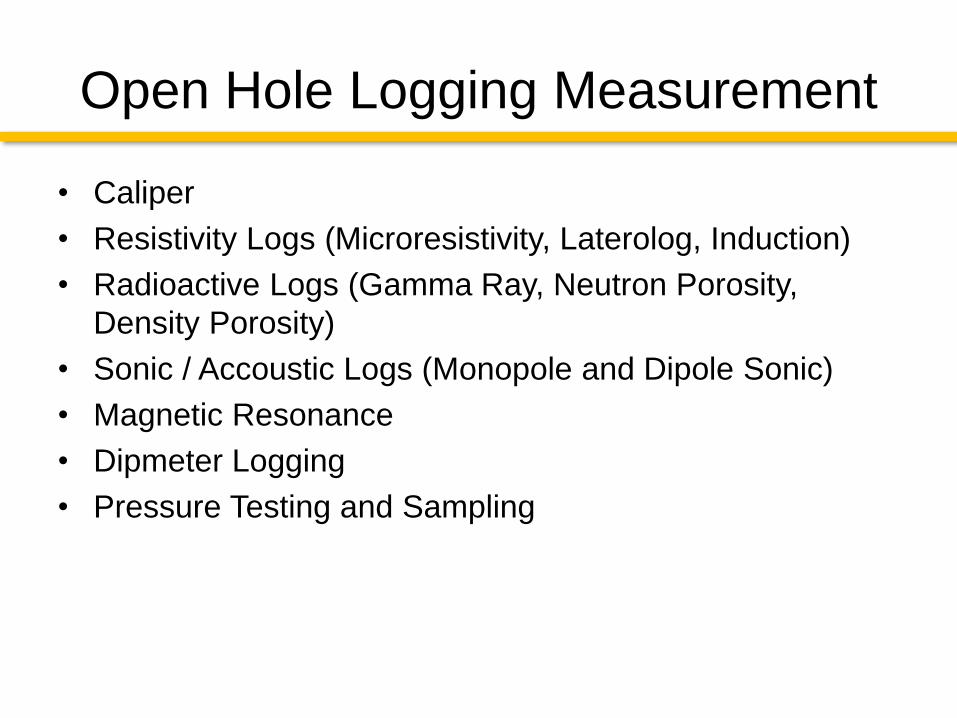
Open Hole Logging Measurement
• Caliper
• Resistivity Logs (Microresistivity, Laterolog, Induction)
• Radioactive Logs (Gamma Ray, Neutron Porosity,
Density Porosity)
• Sonic / Accoustic Logs (Monopole and Dipole Sonic)
• Magnetic Resonance
• Dipmeter Logging
• Pressure Testing and Sampling

Cased Hole Logging Measurement
• Radioactive Log
– Gamma Ray
– Neutron Porosity
– Carbon-Oxygen Log
• Sonic / Accoustic Log
– Cement Bond Log / Ultrasonic log

Production Logging Measurement
• Nuclear (Gamma Ray)
• Flow meter
• Hold up meter
• Pressure
• Temperature

Open Hole Wireline Logging

Resistivity
• Resistivity-Saturation Relation
Water
Wat er
Hydrocarbons
Water
Matrix
Water
Hydrocarbons
Matrix
Rt Rw
Rt 1/ Sw
Rt 1/F
Rt Sw F
Rw
Rt =Rw
Fn
Sw
ma

Mud Invasion Profile
COMMON TERMINOLOGY
• Borehole
• Rm : Borehole mud resistivity
• Rmc : Mudcake resistivity
• Invaded zone
• Rmf : Mud filtrate resistivity
• Rxo : Invaded zone resistivity
• Sxo : Invaded zone water saturation
• Uninvaded zone
• Rw : Interstitial water resistivity
• Rt : Uninvaded zone resistivity
• Sw : Uninvaded zone water saturation

Laterolog Resistivity
• Current lines parallel and radial outwards
• Represents tool in a borehole
• Io = Total Current DV = V0 - VV0
• Resistivity = K V0/I0
• K = Geometrical Factor --- Cylinder
I0
V= V0V= 0
L
r

Induction Resistivity
• Laterolog used in
conductive mud
environment, Induction
tool used in non-
conductive mud
environment.
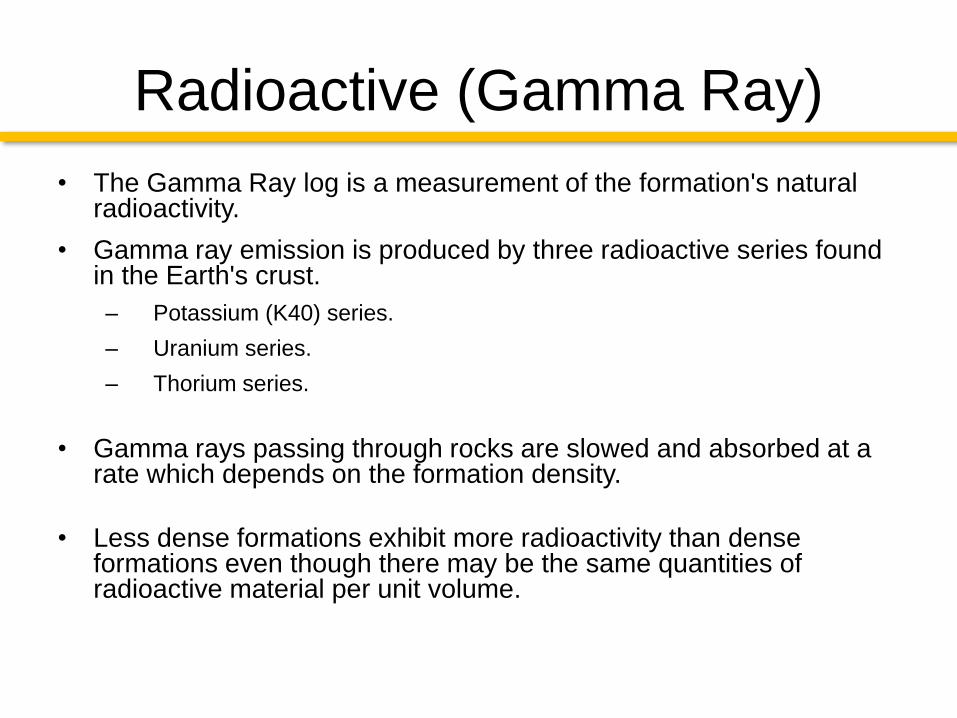
Radioactive (Gamma Ray)
• The Gamma Ray log is a measurement of the formation's natural radioactivity.
• Gamma ray emission is produced by three radioactive series found in the Earth's crust.
– Potassium (K40) series.
– Uranium series.
– Thorium series.
• Gamma rays passing through rocks are slowed and absorbed at a rate which depends on the formation density.
• Less dense formations exhibit more radioactivity than dense formations even though there may be the same quantities of radioactive material per unit volume.

Natural Gamma Ray
• The tool reacts if the shale is
radioactive (usually the case), hence
show the sands and shales, the
permeable zones and the non-
permeable zones.
• Computation of the amount of shale:
The minimum value gives the clean
(100%) shale free zone, the maximum
100% shale zone. All other points can
then be calibrated in the amount of
shale.
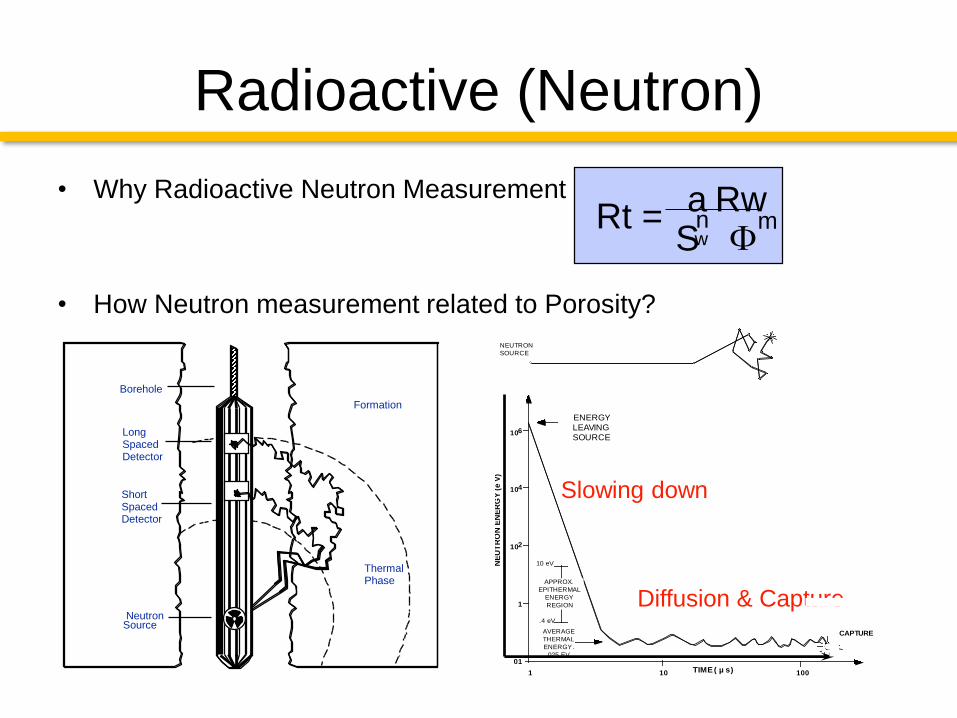
Radioactive (Neutron)
• Why Radioactive Neutron Measurement ?
• How Neutron measurement related to Porosity?
Rt =RwF
nSw
ma
NeutronSource
Short SpacedDetector
Long SpacedDetector
Borehole
Formation
ThermalPhase
NEUTRON
SOURCE
TIME ( µ s)
CAPTUREAVERAGE
THERMAL
ENERGY.
025 EV
.4 eV
10 eV
100
ENERGY LEAVING SOURCE
1 10
01
1
102
104
106
APPROX.
EPITHERMAL
ENERGY
REGION
NE
UT
RO
N E
NE
RG
Y (
e V
)
Diffusion & Capture
Slowing down

Neutron Porosity
• HYDROGEN very effective in slowing down
Neutrons
• commonly found in formation fluids
• CHLORINE is a good absorber (Capture)
• dissolved salts in formation water
• CADMIUM - excellent as a shield
Element
Atomic No.
Element
Symbol
Capture
Cross Section
(Barns)
Scattering
Cross Section
(Barns)
Average No. of
Collisions to reduce
Neutron energy from
2MeV to 0.025eV
1 H 0.3 20 18
6 C 0.0032 4.8 115
8 O 0.0002 4.1 150
14 Si 0.13 1.7 261
17 Cl 31.6 10 329
48 Cd 2500 5.3 1028

Neutron Porosity
Summary
HGNS detects “ Thermal “ neutrons .
>“ Hydrogen Index “ .
>Porosity and Gas content.
Why ?
Pore Space is filled with fluids (commonly water, oil and gas)
Formation fluids contain hydrogen
Hydrogen has a high scattering X-section
Gas has a low concentration of hydrogen
Chlorine (common in water) has a high capture X-section
How?
A two detector system reduces environmental effects
The ratio of Near (cps) over Far (cps) is related to H.I.

Radioctive Density
• Density measurement is as important as Porosity Measurement
(Formation Density 1/Formation Porosity)
• Density Tool measure Formation Density through Measuring
Electron Density in the formation
• GR Interaction : Compton Scattering
2650 Kg/m3 2485 Kg/m3 2320 Kg/m3 2145 Kg/m3>>>
Formation Density gm/ cc PEF
Sandstone 2.65 1.8
Limestone 2.71 5.1
Dolomite 2.81 3.1
Anhydrite 2.98 5.1
Salt 2.03 4.6
Shale 2.1 – 2.8 1.8 – 6.3

Sonic Logging
• Mechanical property analysis
– sanding analysis
– fracture height
– wellbore stability
• Formation evaluation
– gas detection
– fractures
– permeability
• Geophysical interpretation
– synthetic seismograms
– VSP
– AVO
Compressional
body wave
Compressional
head waves
Shear head wave
Shear body wave

Sonic Logging –
Dynamic Elastis Property
v Poisson’s Ratio
G Shear Modulus
E Young’s Modulus
Kb Bulk Modulus
Cb Bulk Compressibility
(with porosity)
Lateral strain 1/2 (DTS / DTC) 2 – 1
Longitudinal strain (DTS / DTC) 2 – 1
Applied stress pb
Shear strain DTS 2
Applied uniaxial stress
Normal strain 2G (1 + v)
Hydrostatic pressure
Volumetric strain
1 4
DTC2 3DTS2[ ]x a
Volumetric deformation
Hydrostatic pressure
1
Kb
pb

Magnetic
Resonance
• Nuclear Magnetic
Resonance logging utilizing
magnetic to manipulate
hydrogen atom in fluid
which resulting T2
amplitude indicate
permeability measured fluid.
0
5
10
15
20
25
30
0.0 0.2 0.4 0.6 0.8 1.0
sig
nal a
mp
litu
de
time (sec) 0
0.1
0.2
0.3
0.4
0.5
0.6
0.7
0.8
0.9
1
0.3 0.5 0.7 0.9 2.0 4.0 6.0 8.0 10.0 30.0 50.0 70.0 90.0 200.0 400.0 600.0 800.0 1000.0 3000.0
no
rma
lize
d s
ign
al a
mp
litu
de
T2 (ms)

Magnetic Resonance Logging
Porosity = 20%
Permeability= 7.5 md
Porosity = 19.5%
Permeability= 279 md
T2 timek = 279 md
Signaldistribution
Increasing relaxation time
T2 timek = 7.5 md
Signaldistribution
Increasing relaxation time

Dipmeter Logging and Borehole Imaging
• High resolution electrical image
• Structural analysis (structural dip, faults,
fractures, complex structures)
• Rock Sedimentary Features (sedimentary dips, anisotropy & permeability barriers, thin beds analysis)
• Evaluate Rock Textures
• Depth matching, orientation and substitution of cores

Dipmeter Logging
0 10 20 30 60 90
Dip magnitude
Dip azimuth

Pressure Test and Sampling
• Pressure Test logging on wireline done thru Logging tools which designed to have packer and probe as formation fluid inlet, for pressure measurement or sampling
• Latest advancement on Fluid Analyzer module has made possibility to do ‘lab work’ downholewithout sampling the formation fluid.

Fluid Analyzer
Spectrometer
(Gas Analyzer)
Sample Flow
Fluorescence Detector
Lamp
Flowline

Production Logging

Production Logging
• Measurement of fluid
parameters zone by zone
basis to yields information
about the type and
movement of fluid within and
near wellbore.

Applications
• Evaluation of Completion Performance
– Perforation effectiveness
– Stimulation evaluation
– Formation damage identifications
• Monitor Reservoir Performance and variations
– New well performance vs prediction
– Time lapse profile monitoring
– Layered Reservoir Testing
• Diagnose Well Problems
– Source of high : Gas to Oil Ratio or High Water Cut
– Detection of leaks or crossflow
– Flow behind casing
• Others
– Guidance for workover planning
– Improved/Enhanced Oil Recovery Projects
– Identify boundary for field development

Production Logging Sensor
Casing Collar Locator
Gamma Ray Detector
Telemetry
Interfaces
Optional
Sensors
-Gradiomanometer
-Pressure
-Temperature
Flowmeter (fullbore)
Standard
Sensors
Quartz Pressure
Gauge
Caliper
In line flowmeter
Petal basket flowmeter
Nuclear Fluid
Densitometer
Hold-Up Meter
O- Probes (GHOST)
E- Probes (FloView)
Noise Tool
Tracer Ejector
Special
Applications
PVL/WFL
Special
Applications

Basic Interpretation
• Monophase Flow Rate
= Velocity x Area Q=VxA
• Multiphase Flow Rate
= Phase Velocity x Phase Area
= Phase Velocity x (Area x Phase Hold
Up)
VhyVw

PL Sensor Output
• Mixture Velocity
– Spinner
• Hold Up
– Fluid Density, Capacitance,
Local Probes
• Phase Velocity
– Correlations
Gradiomanometer Nuclear Capacitance Probe Tools

Hold Up Concept
- Hold up is a DOWNHOLE measurement:- Area fraction of the pipe occupied by the phase of interest.
• For oil-water flows: yw + yo = 1
• For oil-water-gas flows: yw + yo + yg = 1
Water holdup = volume of water
total volume
- Water cut is a SURFACE measurement:- Ratio of flowrates. For instance in an oil-water flow, water cut is
given by –
• WC (%) = qw/(qo + qw)
• and more generally by:
• WC (%) = qw/qt
Water-cut = Volume of water
Total liquid
Water Holdup Water Cut

Flowmeter
• Continuous
Spinner Not collapsible
Measurements in Tubing &
Casing
Not sensitive to small flow
variations
Low resolution
• Fullbore SpinnerMeasurements in Casing only
Maximum CSID coverage
Collapsible
Very sensitive
High resolution

E-Probe (Flowview)
Ground electrode
(For oil continuous phases)
Conductive Tip
Ground electrode(for oil continuousphase)
• Four probes sense local fluid impedance
• Oil and gas -- > high electrical impedance
• Water --> low electrical impedance = fn(salinity)
• Computations:
• Probe architecture
Water Holdup =Time in low impedance
Total time1.
2. Bubble count = Number of transitions
Total time
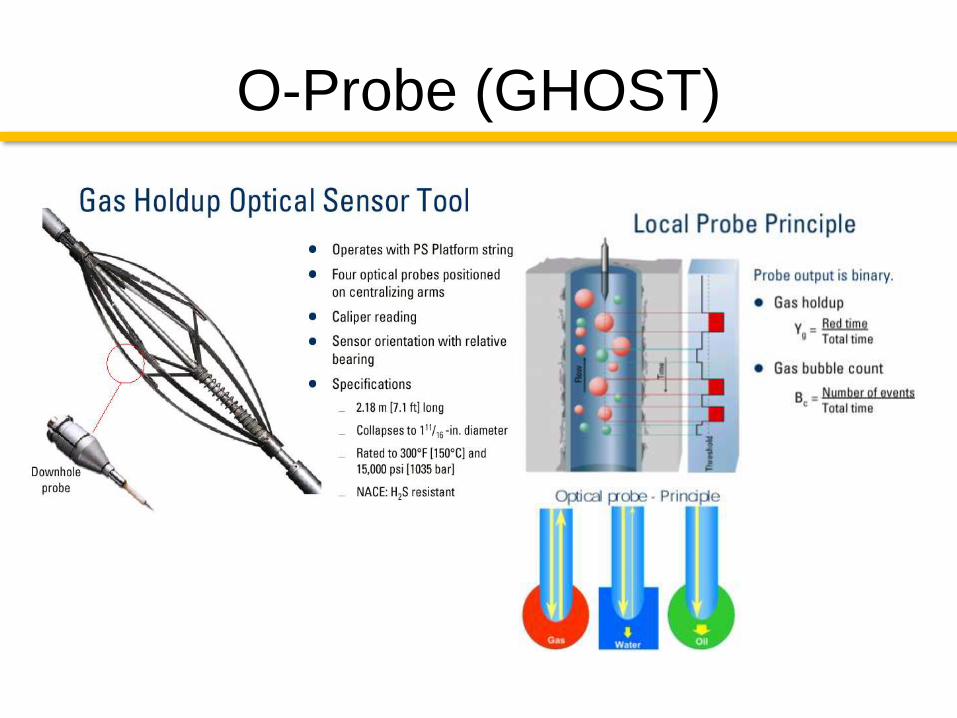
O-Probe (GHOST)

Gradiomanometer
Output : Fluid Density
Application :
• Fluid Type Determination
• Hold up calculation
• Hydrostatic Pressure
Measurement
• Pa = Pb + (pfluid x g x h) P1
P2
Diaphragm
h
PA
PB
Silicone
Oil
Wellbore
fluid

Typical PL Program• Shut-In conditions
- RIH and ….• Determine fluid levels
• Detect Cross-flows (if any)
• Get a BASE log (eg.Temp)
• Flowing conditions
- Wait for stable flow
pressure, spinner, density ?
- Wait for well stabilization
Required for WT jobs
- Log interval of interest
Flowing profile & cross-flow
Fluid entries
- Log stations if requested

Flow Profile (ex. 1)
• Well flowing at constant
choke:– Zone Contribution
– Downhole reservoir data
– Absorption profile for injector wells
– Identification of production
problems
• Different flowing Choke:
- Selective inflow performance
surveyGas
OIL
Water
spinner density
Temperature

Flow Profile (ex. 2)
• Well shut in – Flow between two
perforation (Reservoir
pressure difference)
Gas
OIL
Water
spinner density
Temperature
Sump
water

Conclusion
• Wireline Engineering application to Formation
Evaluation is critical factor for evaluating commercial
content Hydrocarbon in reservoir
• Formation Evaluation source of data can be
gathered from many sources : Mud Logging, Coring,
Wireline Logging, Pressure Test and Sampling
• More data can be collected more precise decision
can be made and minimize formation uncertainty