BASIC FINANCIAL RATIO ANALYSIS AND IMPLICATION · · 2016-11-23include the following types of...
85
1 BASIC FINANCIAL RATIO ANALYSIS AND IMPLICATION Dr. Eden Chow Hang Seng Management College 19 November 2016 © Hong Kong Institute of Certified Public Accountants, 2016. All rights reserved.
-
Upload
vuongkhanh -
Category
Documents
-
view
215 -
download
1
Transcript of BASIC FINANCIAL RATIO ANALYSIS AND IMPLICATION · · 2016-11-23include the following types of...
1
BASIC FINANCIAL RATIO
ANALYSIS AND IMPLICATION Dr. Eden Chow Hang Seng Management College 19 November 2016
© Hong Kong Institute of Certified Public Accountants, 2016. All rights reserved.
Annual reports as a communication tool
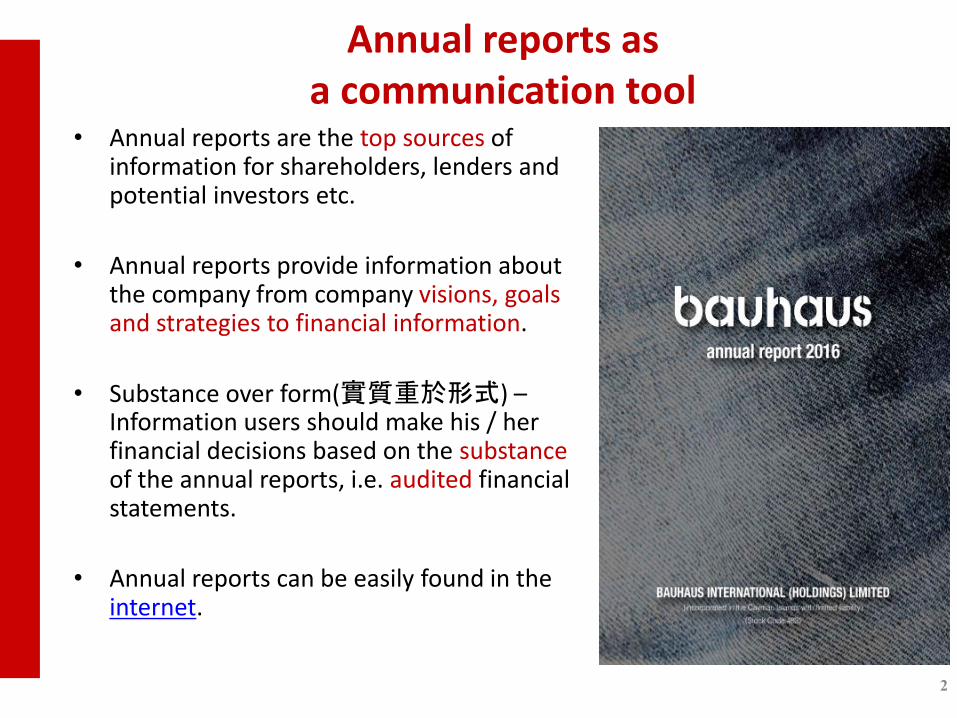
• Annual reports are the top sources of information for shareholders, lenders and potential investors etc.
• Annual reports provide information about the company from company visions, goals and strategies to financial information.
• Substance over form(實質重於形式) – Information users should make his / her financial decisions based on the substance of the annual reports, i.e. audited financial statements.
• Annual reports can be easily found in the internet.
2
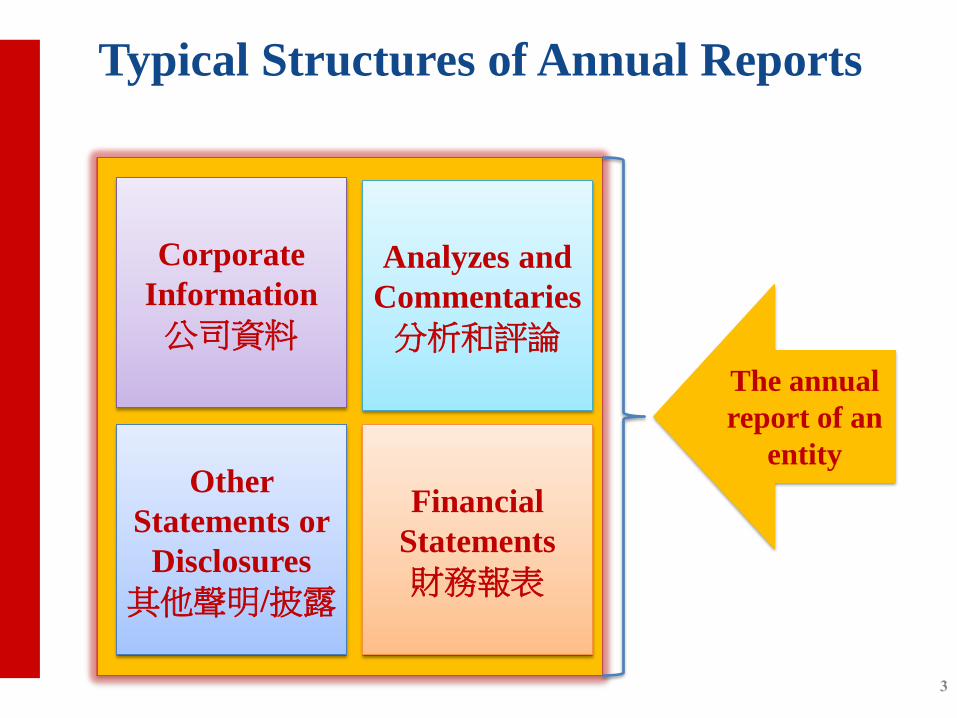
Typical Structures of Annual Reports
3
The annual
report of an
entity
Corporate
Information
公司資料
Analyzes and
Commentaries
分析和評論
Other
Statements or
Disclosures
其他聲明/披露
Financial
Statements
財務報表
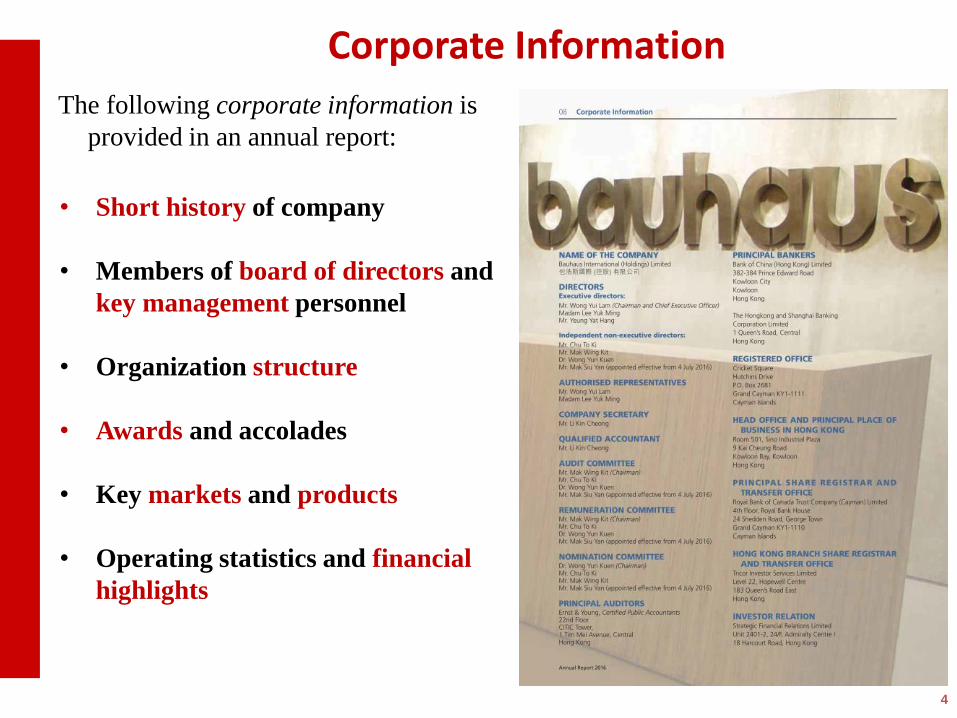
Corporate Information
4
The following corporate information is
provided in an annual report:
• Short history of company
• Members of board of directors and
key management personnel
• Organization structure
• Awards and accolades
• Key markets and products
• Operating statistics and financial
highlights
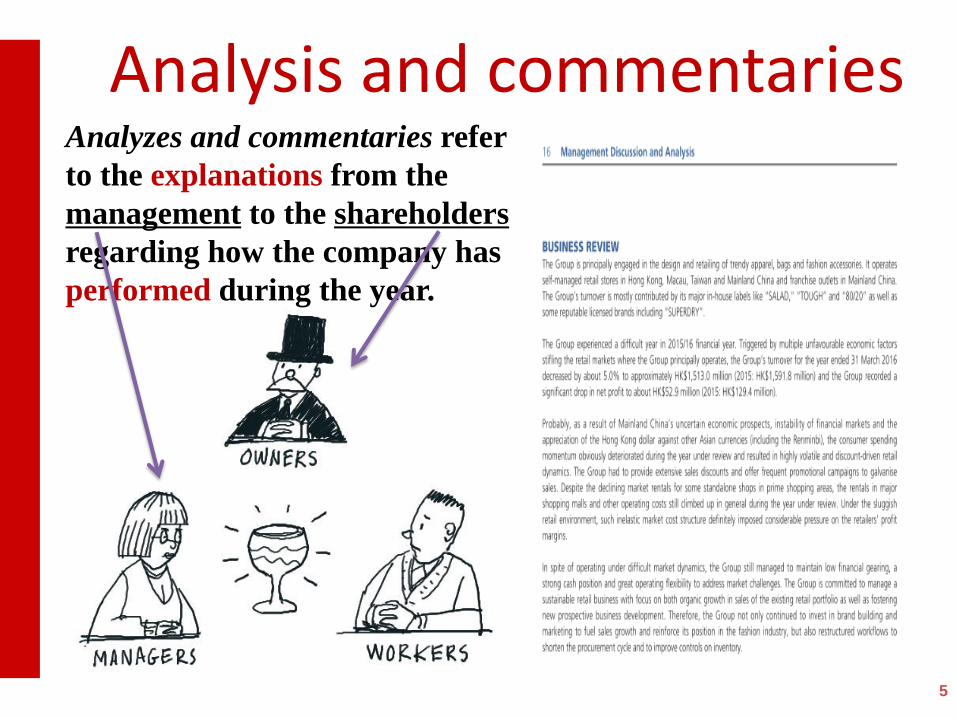
Analysis and commentaries
5
Analyzes and commentaries refer
to the explanations from the
management to the shareholders
regarding how the company has
performed during the year.
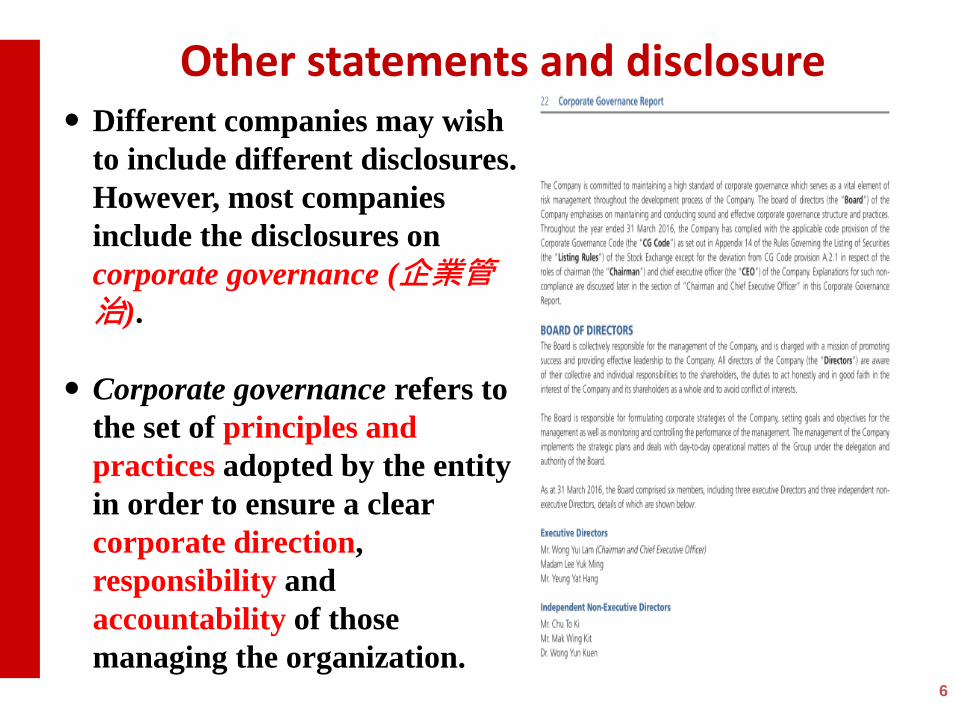
Other statements and disclosure
6
Different companies may wish
to include different disclosures.
However, most companies
include the disclosures on
corporate governance (企業管治).
Corporate governance refers to
the set of principles and
practices adopted by the entity
in order to ensure a clear
corporate direction,
responsibility and
accountability of those
managing the organization.
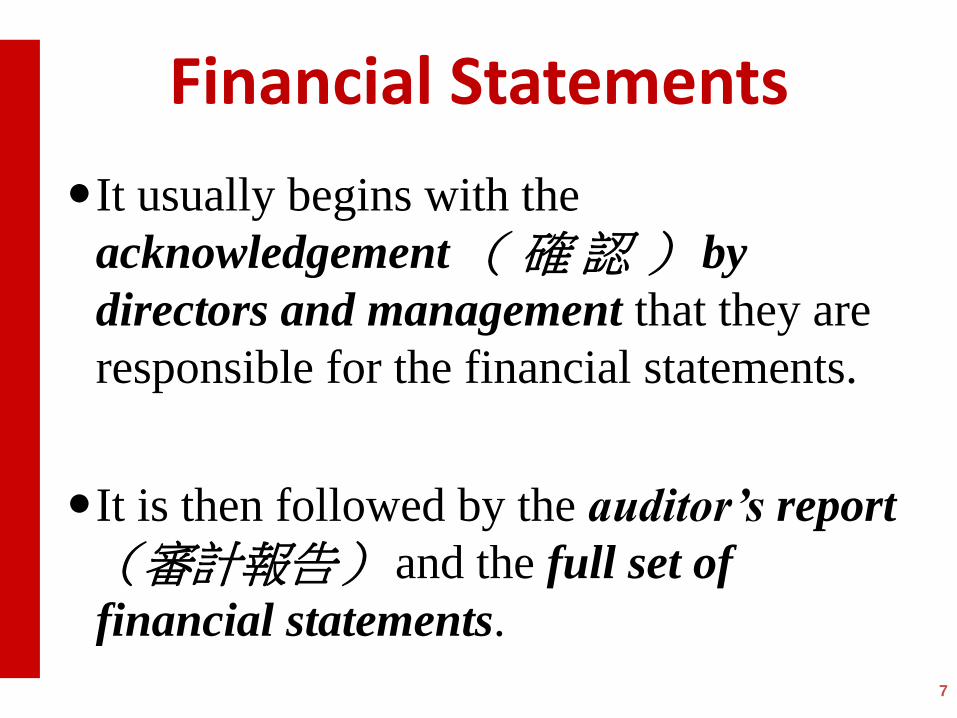
Financial Statements
It usually begins with the
acknowledgement ( 確 認 ) by
directors and management that they are
responsible for the financial statements.
It is then followed by the auditor’s report
(審計報告) and the full set of
financial statements.
7
8
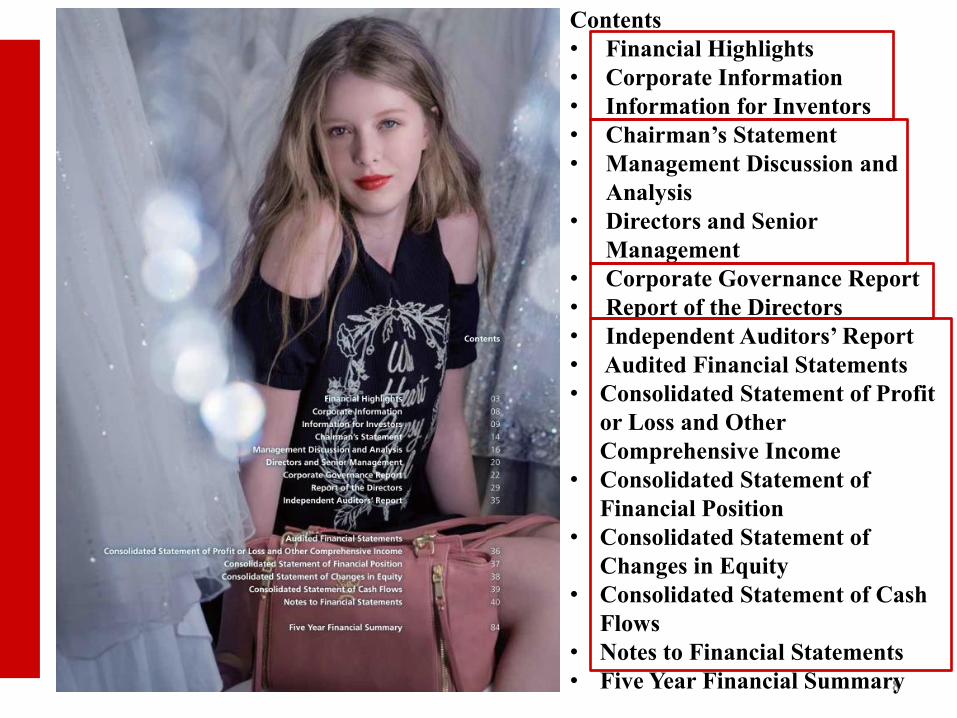
Contents
• Financial Highlights
• Corporate Information
• Information for Inventors
• Chairman’s Statement
• Management Discussion and
Analysis
• Directors and Senior
Management
• Corporate Governance Report
• Report of the Directors
• Independent Auditors’ Report
• Audited Financial Statements
• Consolidated Statement of Profit
or Loss and Other
Comprehensive Income
• Consolidated Statement of
Financial Position
• Consolidated Statement of
Changes in Equity
• Consolidated Statement of Cash
Flows
• Notes to Financial Statements
• Five Year Financial Summary
9
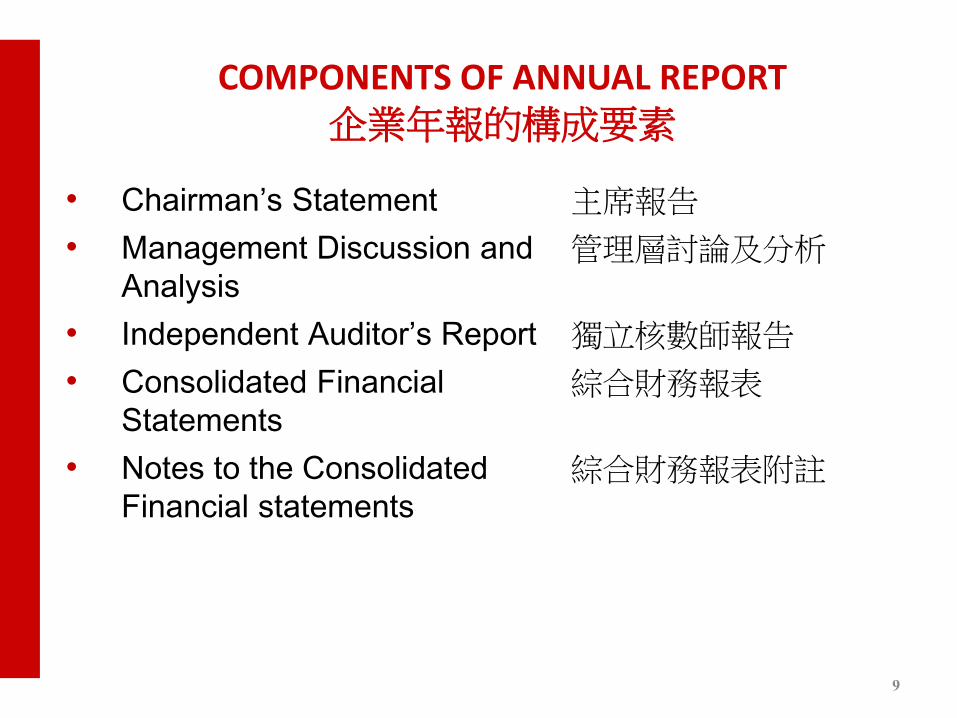
COMPONENTS OF ANNUAL REPORT 企業年報的構成要素
• Chairman’s Statement 主席報告
• Management Discussion and
Analysis
管理層討論及分析
• Independent Auditor’s Report 獨立核數師報告
• Consolidated Financial
Statements
綜合財務報表
• Notes to the Consolidated
Financial statements
綜合財務報表附註

10
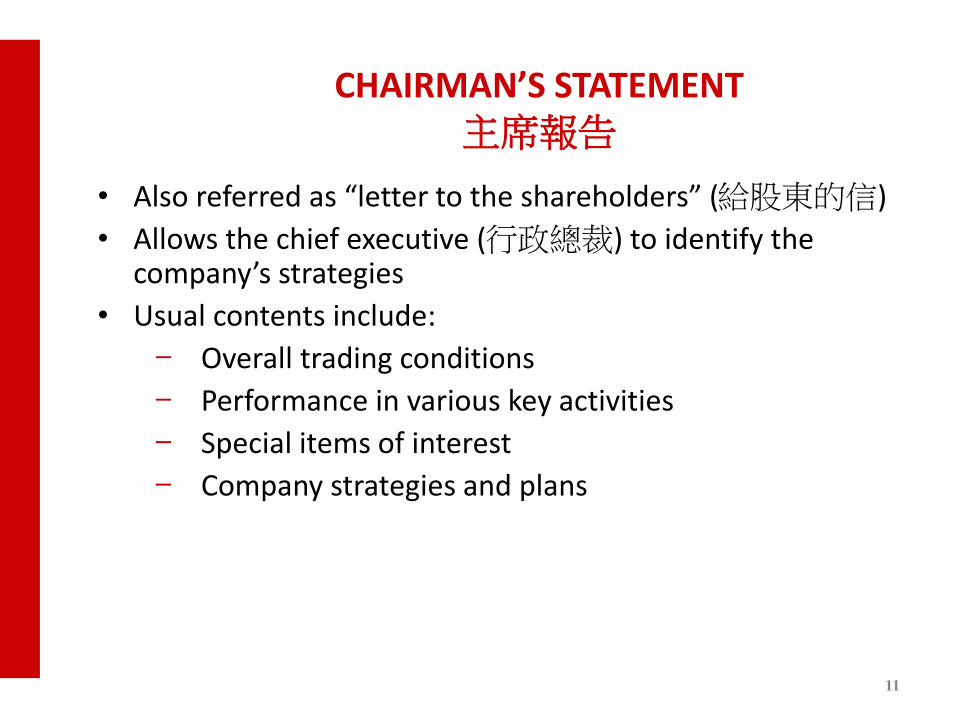
CHAIRMAN’S STATEMENT 主席報告
11
CHAIRMAN’S STATEMENT 主席報告
• Also referred as “letter to the shareholders” (給股東的信)
• Allows the chief executive (行政總裁) to identify the company’s strategies
• Usual contents include:
− Overall trading conditions
− Performance in various key activities
− Special items of interest
− Company strategies and plans
12
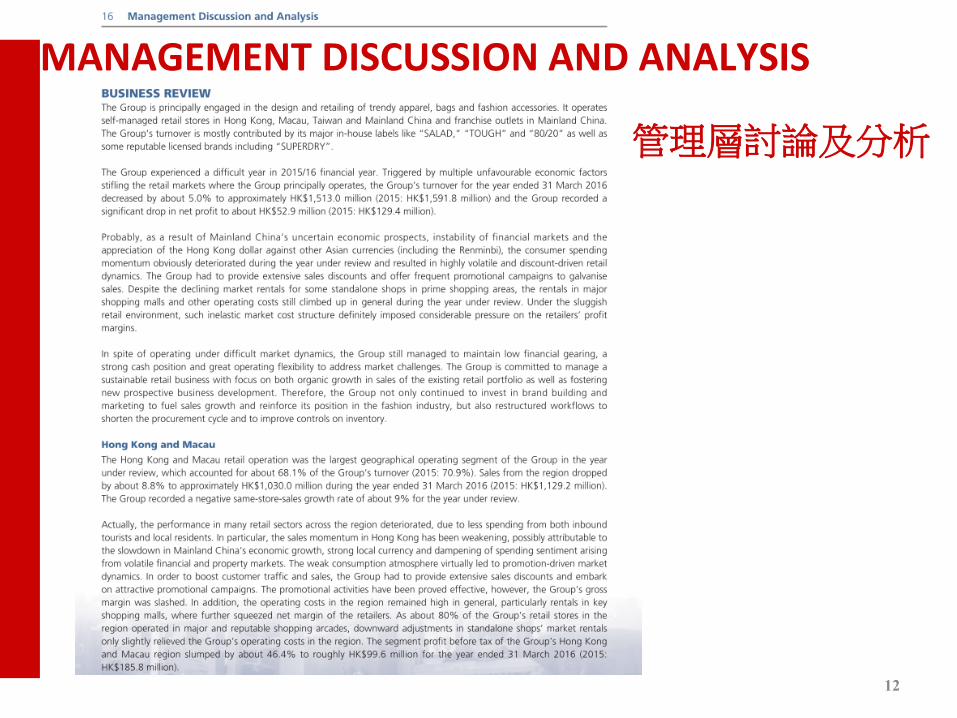
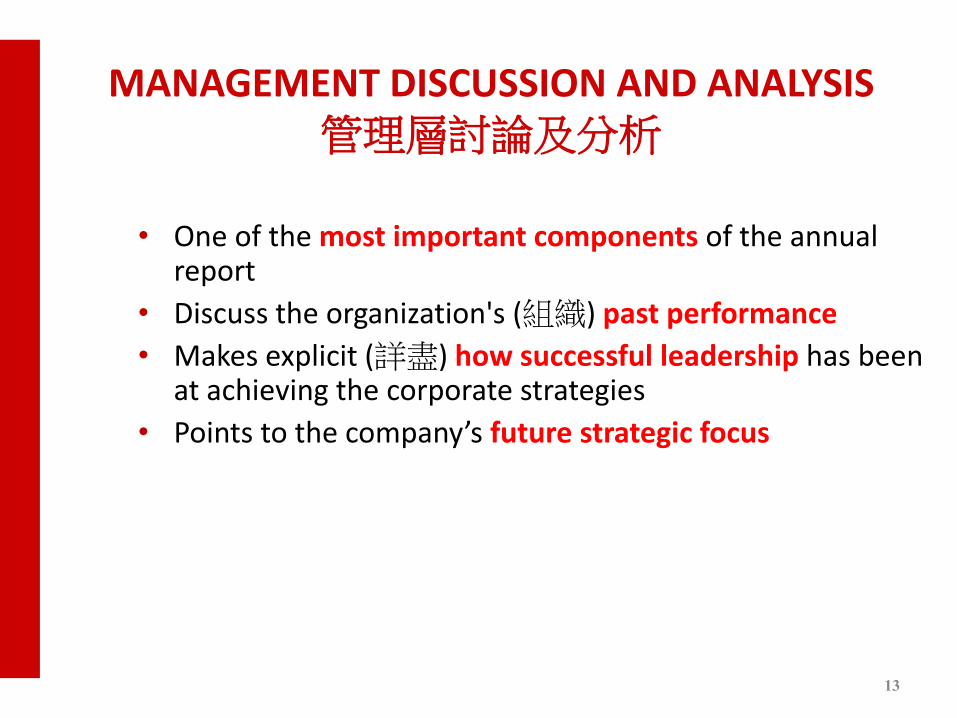
MANAGEMENT DISCUSSION AND ANALYSIS
管理層討論及分析
13
MANAGEMENT DISCUSSION AND ANALYSIS 管理層討論及分析
• One of the most important components of the annual report
• Discuss the organization's (組織) past performance
• Makes explicit (詳盡) how successful leadership has been at achieving the corporate strategies
• Points to the company’s future strategic focus
14
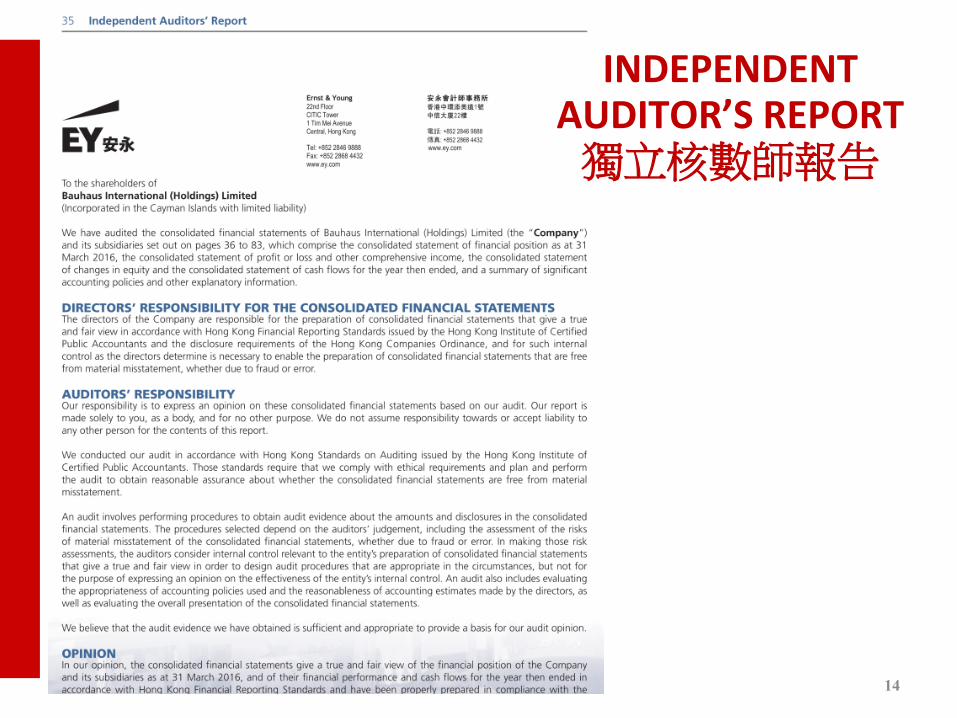
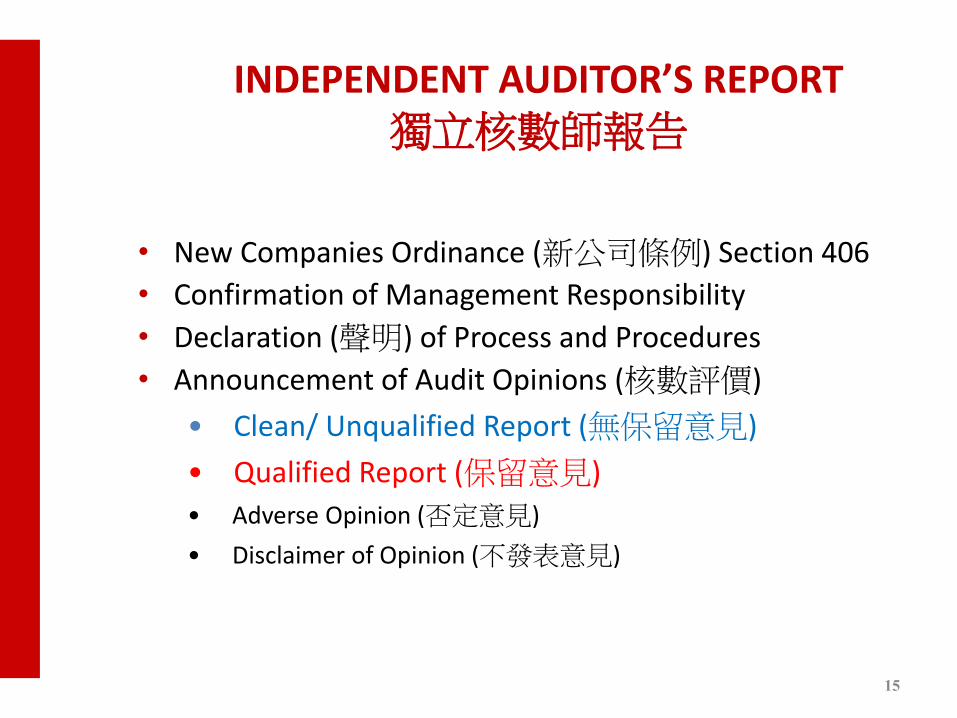
INDEPENDENT AUDITOR’S REPORT 獨立核數師報告
15
INDEPENDENT AUDITOR’S REPORT 獨立核數師報告
• New Companies Ordinance (新公司條例) Section 406
• Confirmation of Management Responsibility
• Declaration (聲明) of Process and Procedures
• Announcement of Audit Opinions (核數評價)
• Clean/ Unqualified Report (無保留意見)
• Qualified Report (保留意見)
• Adverse Opinion (否定意見)
• Disclaimer of Opinion (不發表意見)
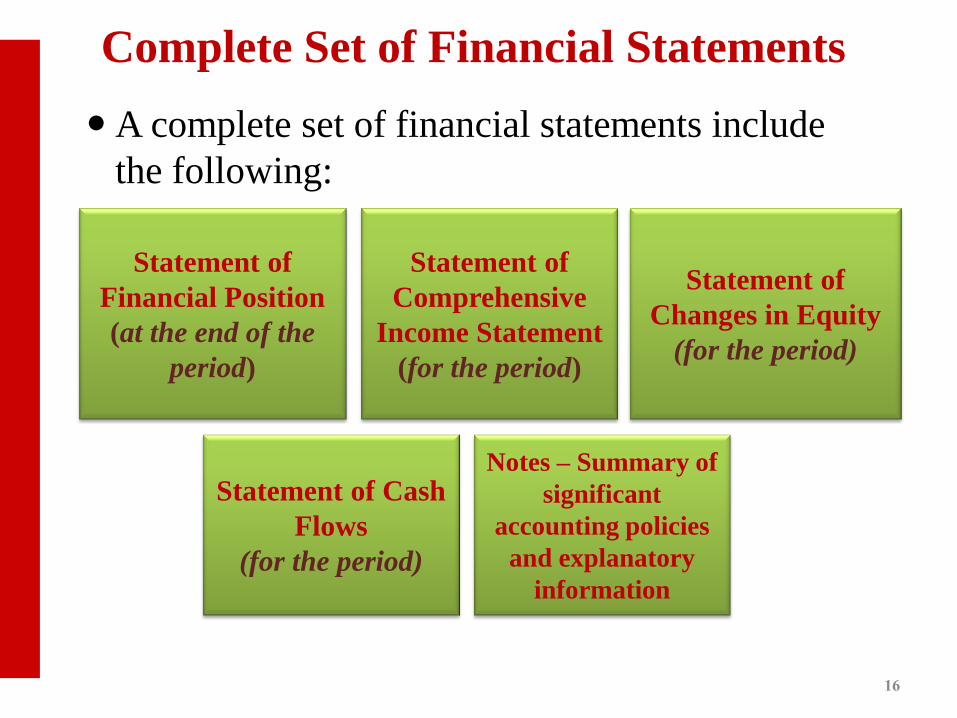
Complete Set of Financial Statements
A complete set of financial statements include
the following:
16
Statement of
Financial Position
(at the end of the
period)
Statement of
Comprehensive
Income Statement
(for the period)
Statement of
Changes in Equity
(for the period)
Statement of Cash
Flows
(for the period)
Notes – Summary of
significant
accounting policies
and explanatory
information
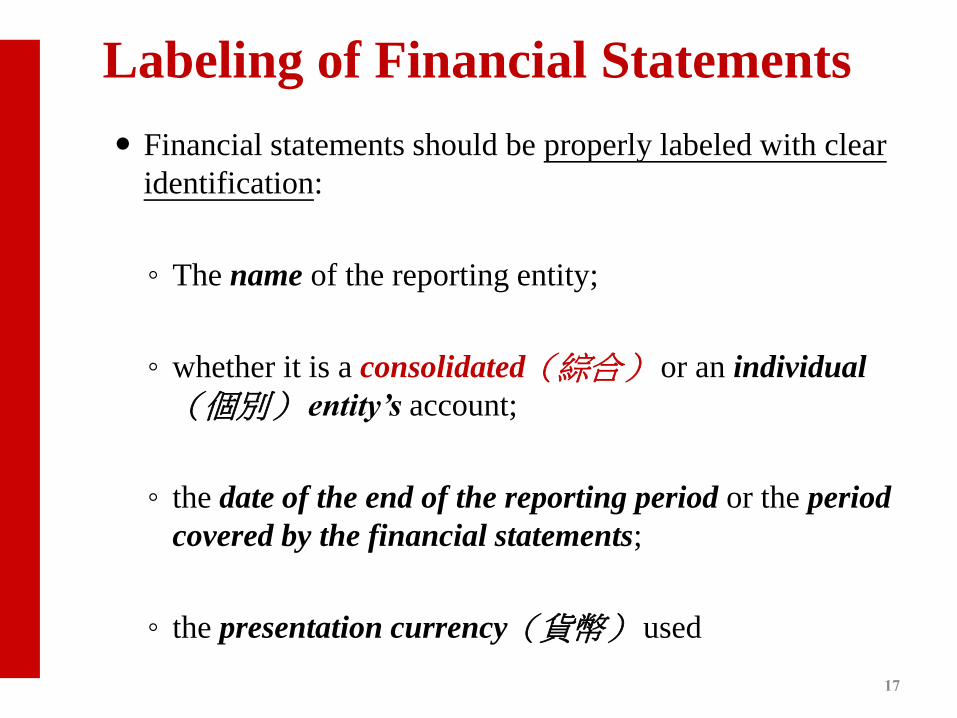
Labeling of Financial Statements
Financial statements should be properly labeled with clear
identification:
◦ The name of the reporting entity;
◦ whether it is a consolidated(綜合) or an individual
(個別) entity’s account;
◦ the date of the end of the reporting period or the period
covered by the financial statements;
◦ the presentation currency(貨幣) used
17

18
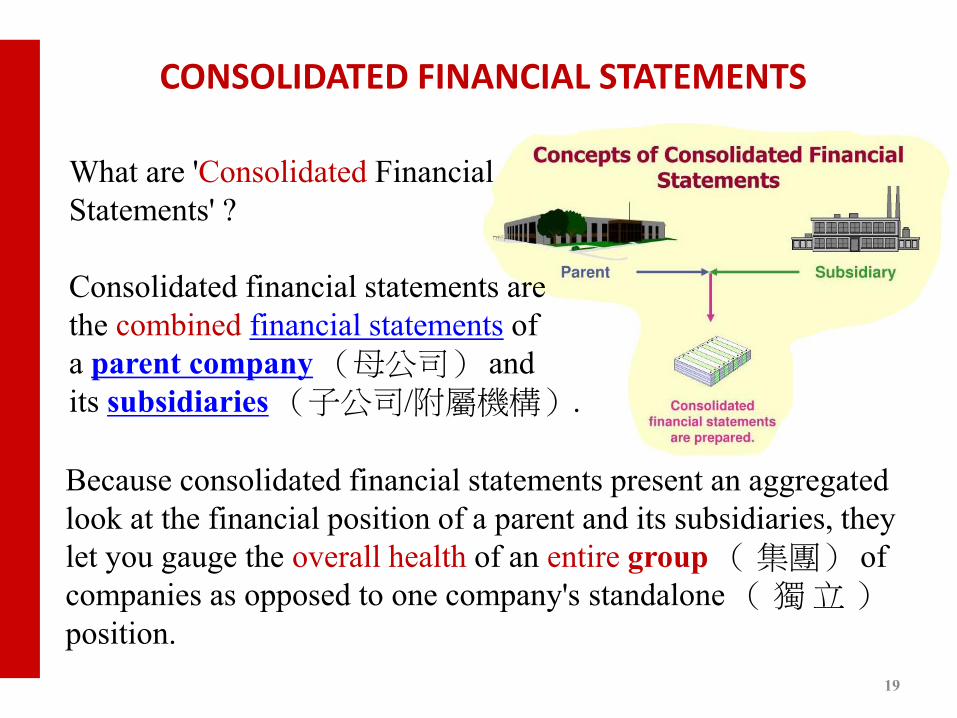
CONSOLIDATED FINANCIAL STATEMENTS
19
What are 'Consolidated Financial
Statements' ?
Consolidated financial statements are
the combined financial statements of
a parent company (母公司) and
its subsidiaries (子公司/附屬機構).
Because consolidated financial statements present an aggregated
look at the financial position of a parent and its subsidiaries, they
let you gauge the overall health of an entire group ( 集團) of
companies as opposed to one company's standalone ( 獨 立 )
position.
20
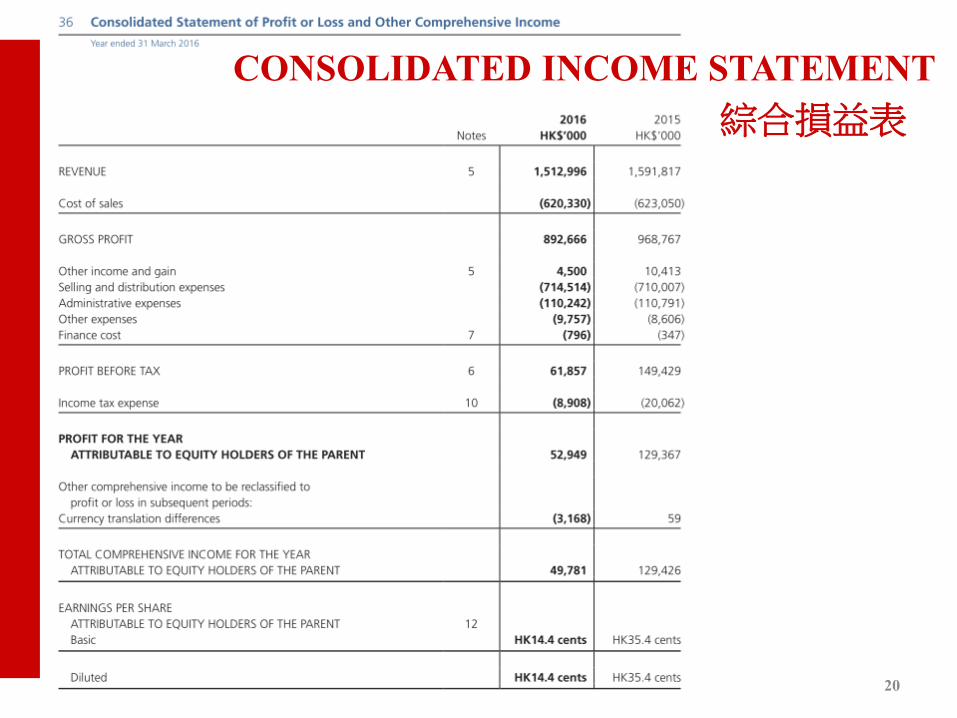
CONSOLIDATED INCOME STATEMENT
綜合損益表

21
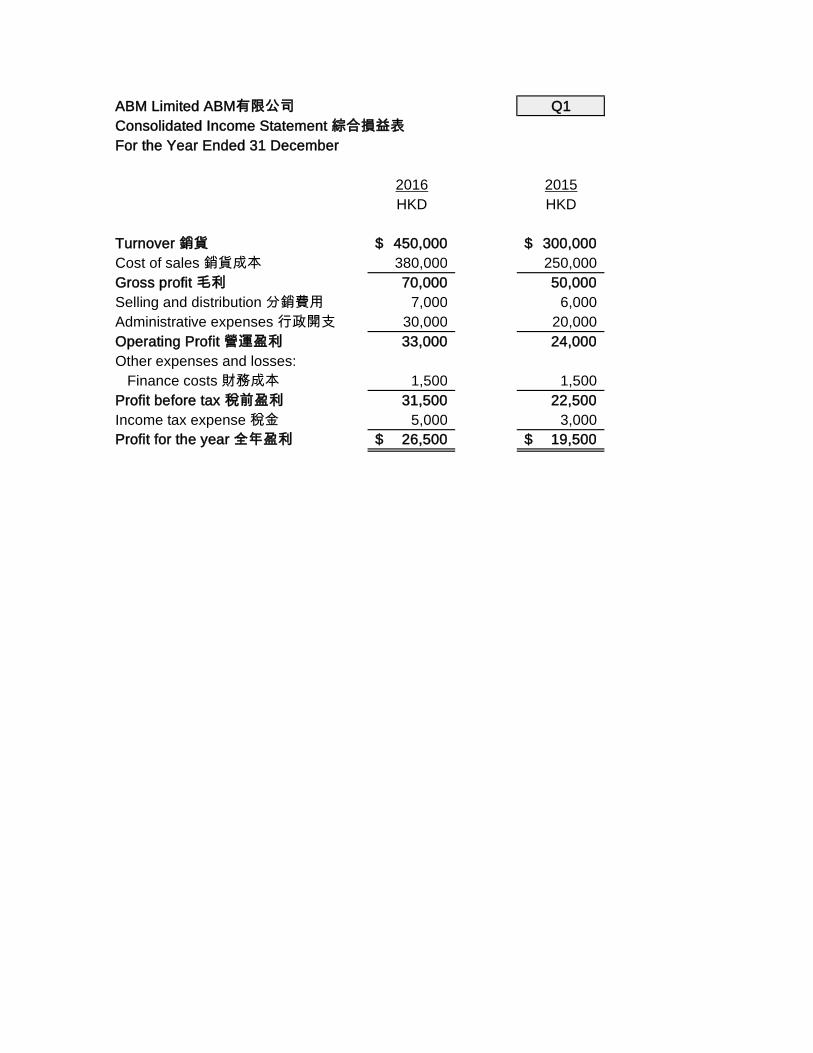
CONSOLIDATED INCOME STATEMENT/
CONSOLIDATED STATEMENT OF PROFIT OR LOSS AND OTHER COMPREHENSIVE INCOME
綜合損益表
Function of Expense Method (按開支功能歸類)
• Classifies expenses according to their functions as cost of sales, selling and distribution costs, or administrative expenses
• This method can provide more relevant information to users, but allocating costs to functions may require arbitrary allocations and involve considerable judgment
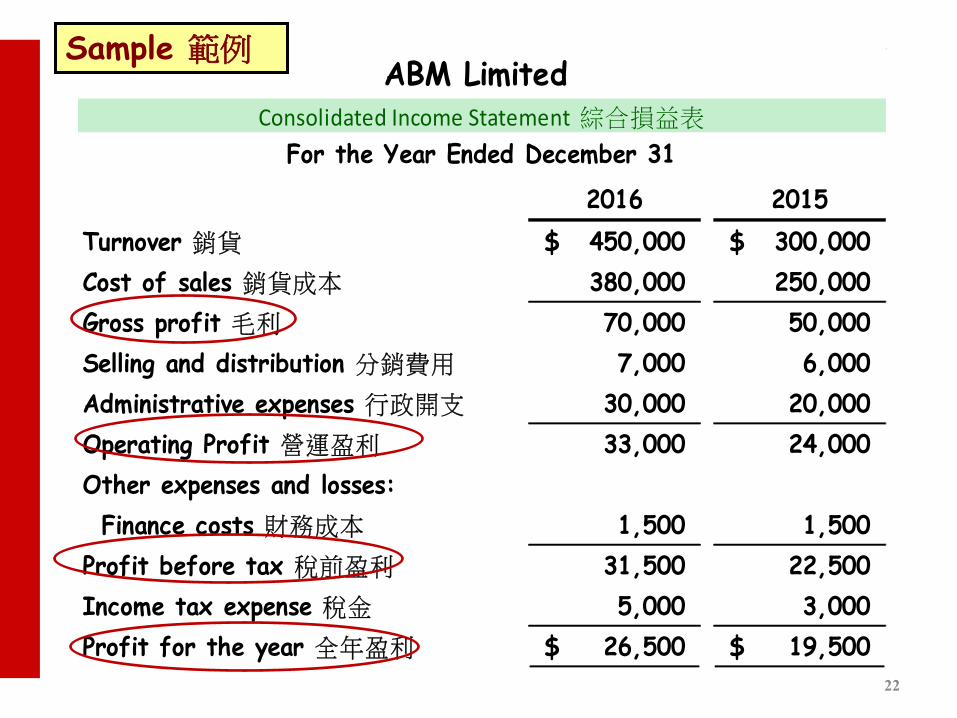
2016 2015
Turnover 銷貨 450,000$ 300,000$
Cost of sales 銷貨成本 380,000 250,000
Gross profit 毛利 70,000 50,000
Selling and distribution 分銷費用 7,000 6,000
Administrative expenses 行政開支 30,000 20,000
Operating Profit 營運盈利 33,000 24,000
Other expenses and losses:
Finance costs 財務成本 1,500 1,500
Profit before tax 稅前盈利 31,500 22,500
Income tax expense 稅金 5,000 3,000
Profit for the year 全年盈利 26,500$ 19,500$
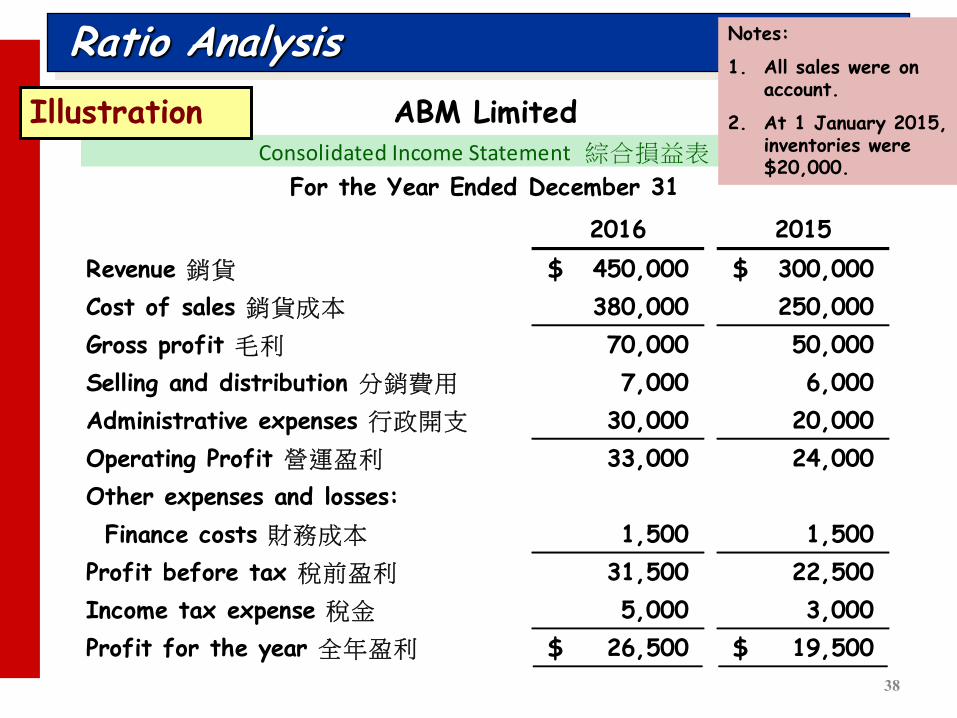
ABM Limited Consolidated Income Statement 綜合損益表
For the Year Ended December 31
Sample 範例
22

23
CONSOLIDATED BALANCE SHEET 綜合資產負債表
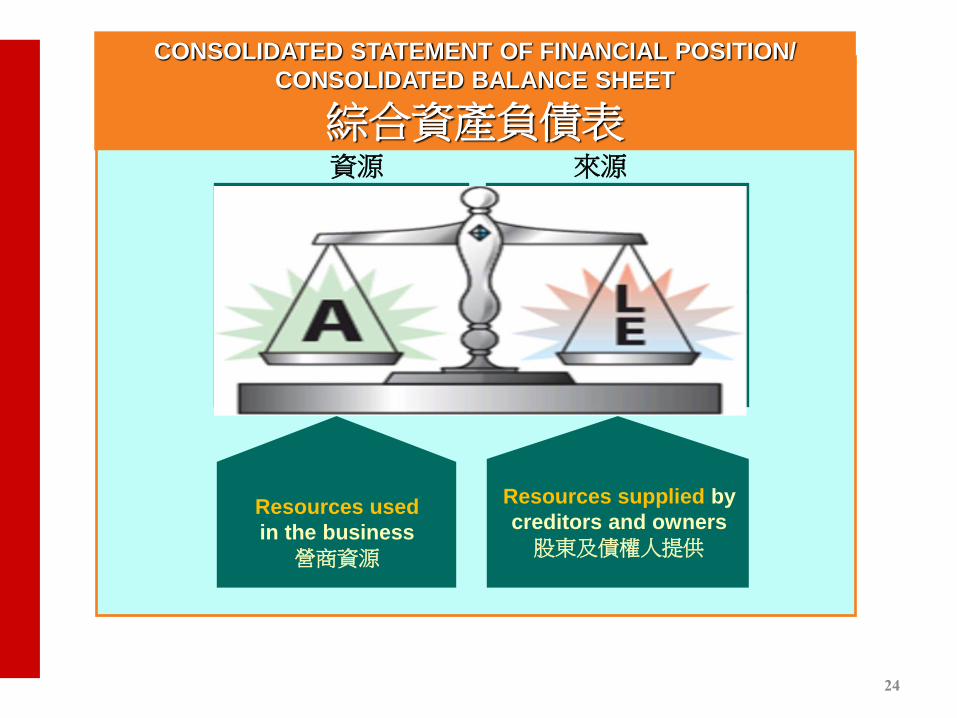
Assets
資產 Liabilities 負債
Equity 股本
Resources = Sources
Resources used
in the business
營商資源
Resources supplied by
creditors and owners
股東及債權人提供
CONSOLIDATED STATEMENT OF FINANCIAL POSITION/
CONSOLIDATED BALANCE SHEET
綜合資產負債表 資源 來源
24
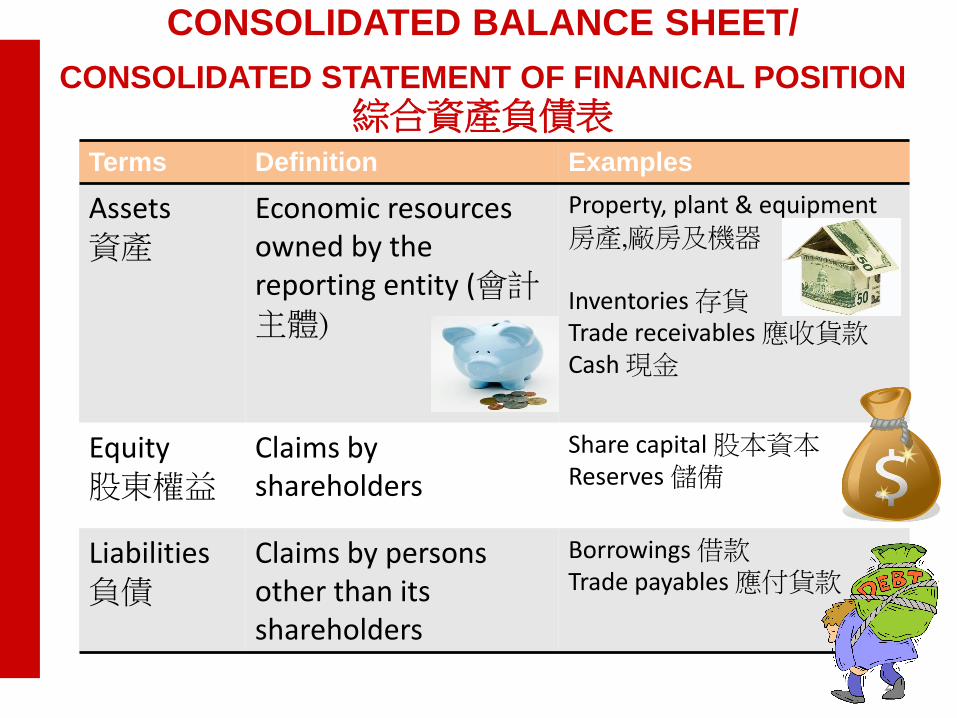
CONSOLIDATED BALANCE SHEET/
CONSOLIDATED STATEMENT OF FINANICAL POSITION
綜合資產負債表
Terms Definition Examples
Assets 資產
Economic resources owned by the reporting entity (會計主體)
Property, plant & equipment 房產,廠房及機器 Inventories 存貨 Trade receivables 應收貨款 Cash 現金
Equity 股東權益
Claims by shareholders
Share capital 股本資本 Reserves 儲備
Liabilities 負債
Claims by persons other than its shareholders
Borrowings 借款 Trade payables 應付貨款
25
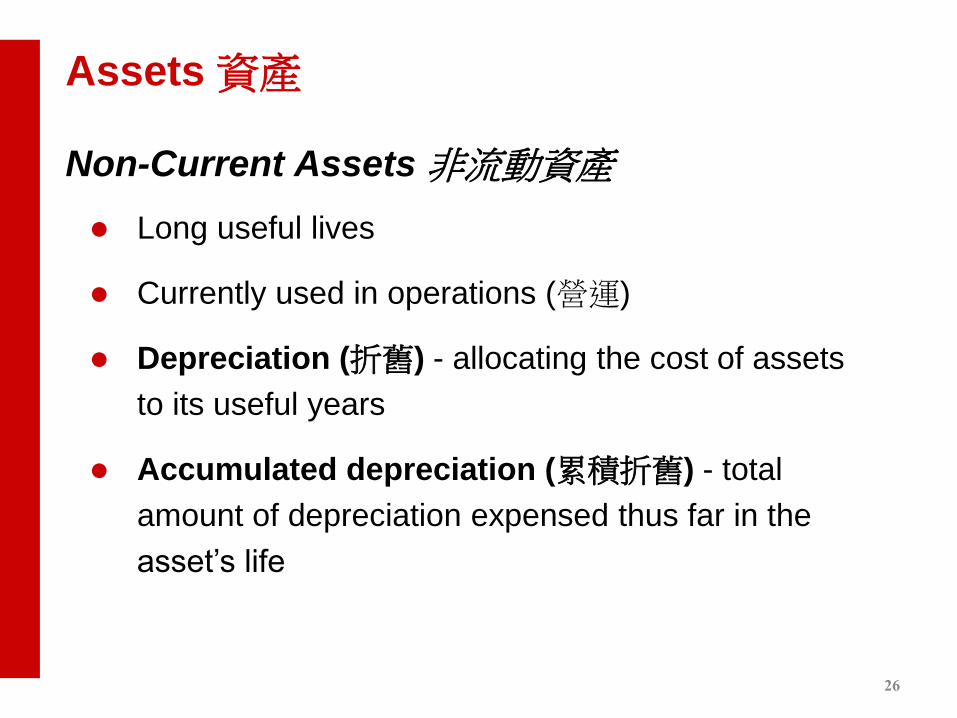
Long useful lives
Currently used in operations (營運)
Depreciation (折舊) - allocating the cost of assets
to its useful years
Accumulated depreciation (累積折舊) - total
amount of depreciation expensed thus far in the
asset’s life
Non-Current Assets 非流動資產
Assets 資產
26
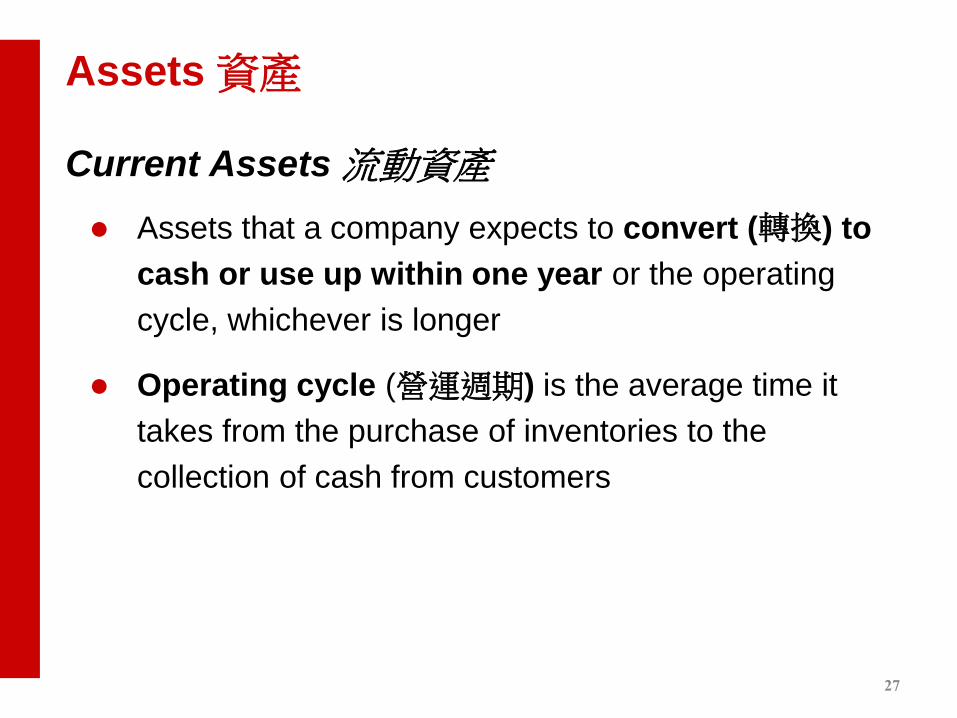
Assets that a company expects to convert (轉換) to
cash or use up within one year or the operating
cycle, whichever is longer
Operating cycle (營運週期) is the average time it
takes from the purchase of inventories to the
collection of cash from customers
Current Assets 流動資產
Assets 資產
27
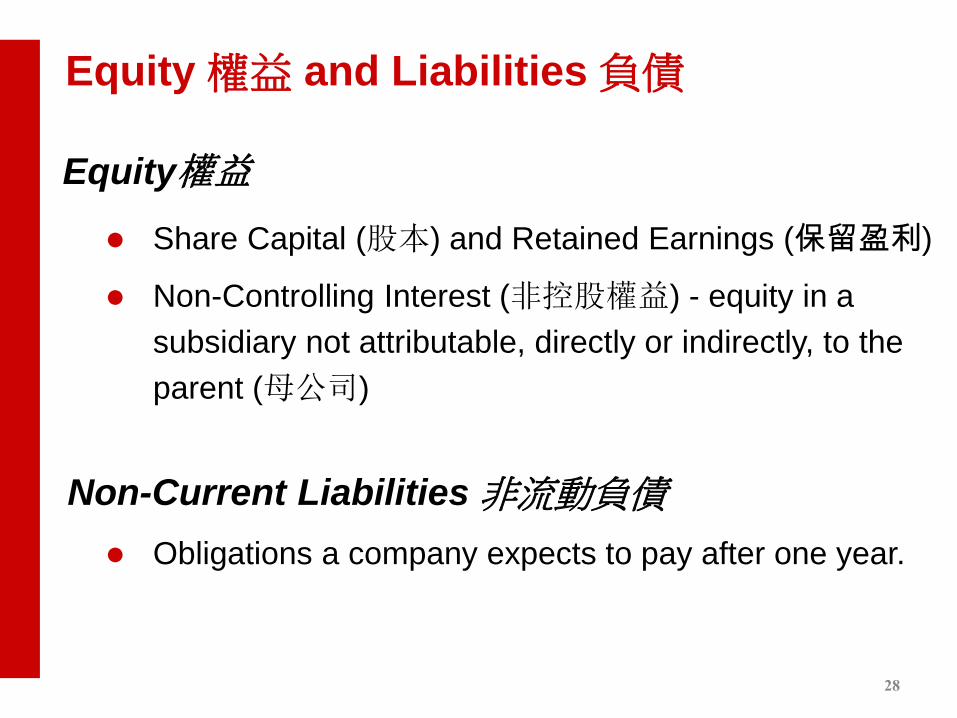
Obligations a company expects to pay after one year.
Non-Current Liabilities 非流動負債
Equity 權益 and Liabilities 負債
Equity權益
Share Capital (股本) and Retained Earnings (保留盈利)
Non-Controlling Interest (非控股權益) - equity in a
subsidiary not attributable, directly or indirectly, to the
parent (母公司)
28

Obligations (負債) a company is to pay within the
coming year or its operating cycle, whichever is
longer
Liquidity (流動性) - ability to pay obligations
expected to be due within the next year
Current Liabilities 流動負債
Equity 權益 and Liabilities 負債
29
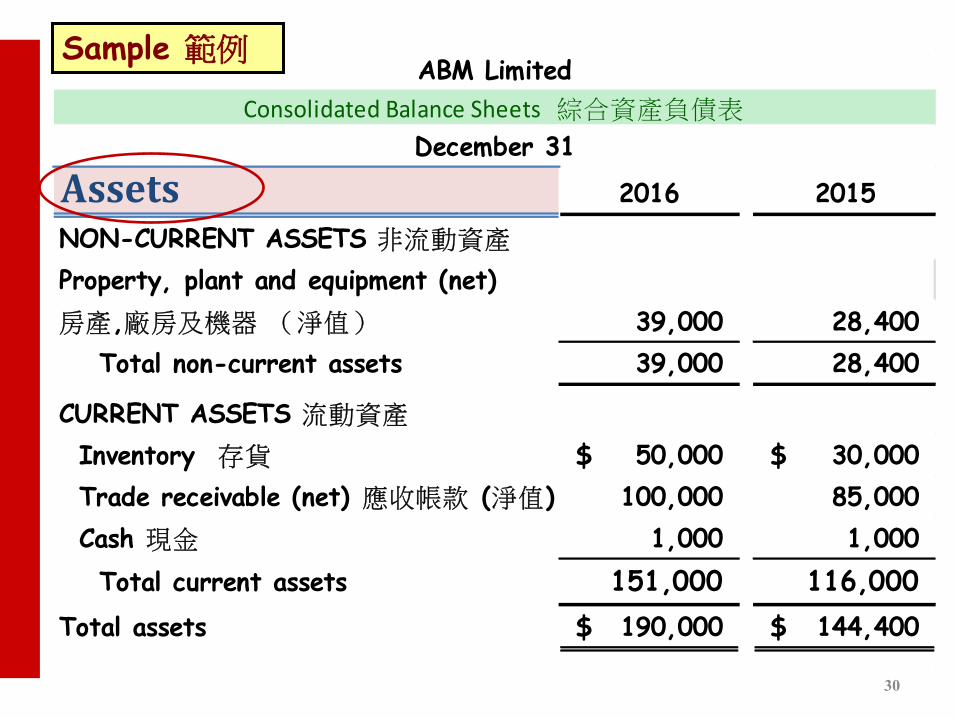
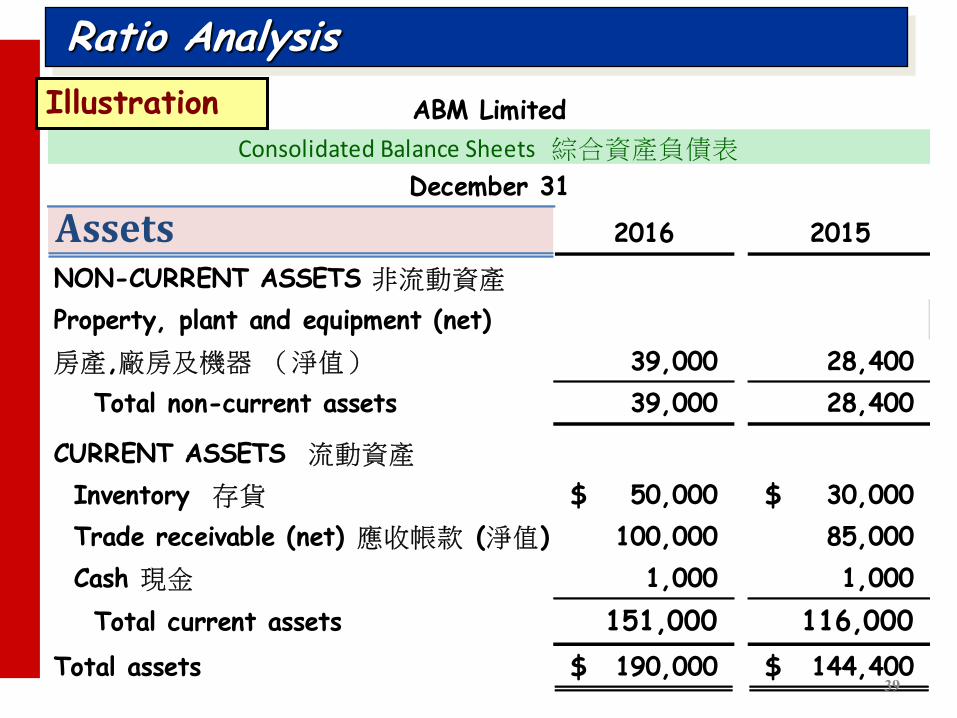
Assets 2016 2015
NON-CURRENT ASSETS 非流動資產
Property, plant and equipment (net)
房產,廠房及機器 (淨值) 39,000 28,400
Total non-current assets 39,000 28,400
CURRENT ASSETS 流動資產
Inventory 存貨 50,000$ 30,000$
Trade receivable (net) 應收帳款 (淨值) 100,000 85,000
Cash 現金 1,000 1,000
Total current assets 151,000 116,000
Total assets 190,000$ 144,400$
ABM Limited
Consolidated Balance Sheets 綜合資產負債表
December 31
Sample 範例
30
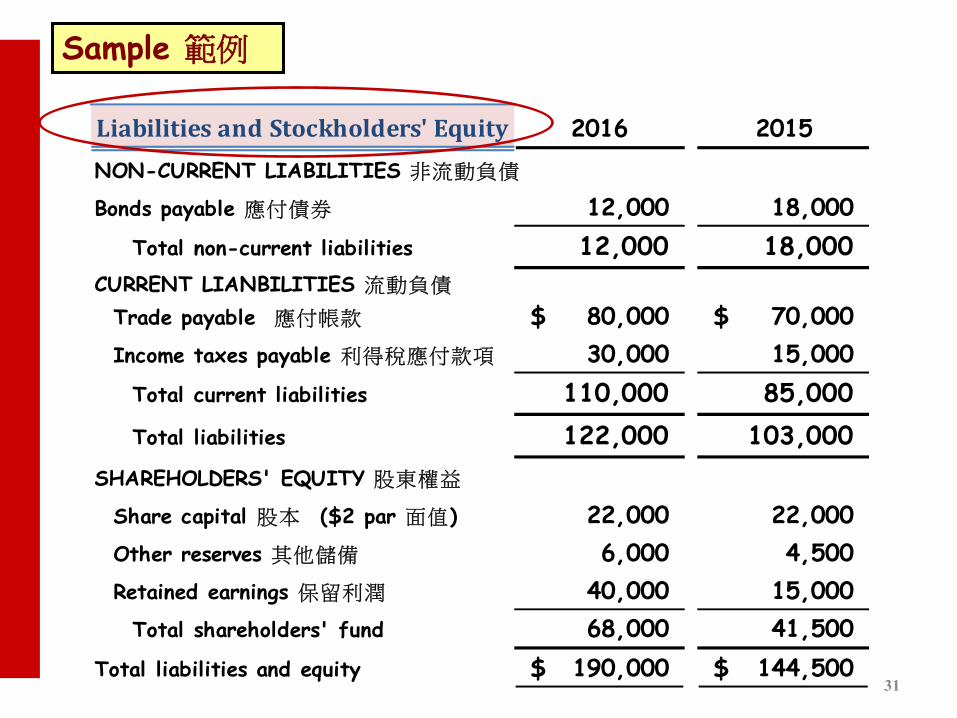
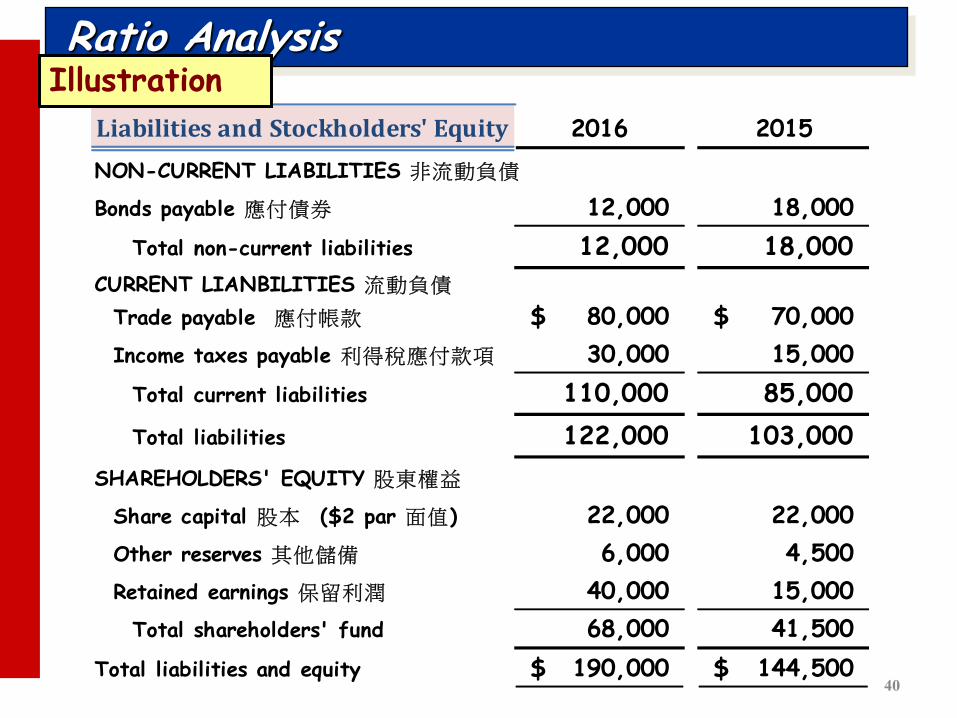
Liabilities and Stockholders' Equity 2016 2015
NON-CURRENT LIABILITIES 非流動負債
Bonds payable 應付債券 12,000 18,000
Total non-current liabilities 12,000 18,000
CURRENT LIANBILITIES 流動負債
Trade payable 應付帳款 80,000$ 70,000$
Income taxes payable 利得稅應付款項 30,000 15,000
Total current liabilities 110,000 85,000
Total liabilities 122,000 103,000
SHAREHOLDERS' EQUITY 股東權益
Share capital 股本 ($2 par 面值) 22,000 22,000
Other reserves 其他儲備 6,000 4,500
Retained earnings 保留利潤 40,000 15,000
Total shareholders' fund 68,000 41,500
Total liabilities and equity 190,000$ 144,500$
Sample 範例
31
32
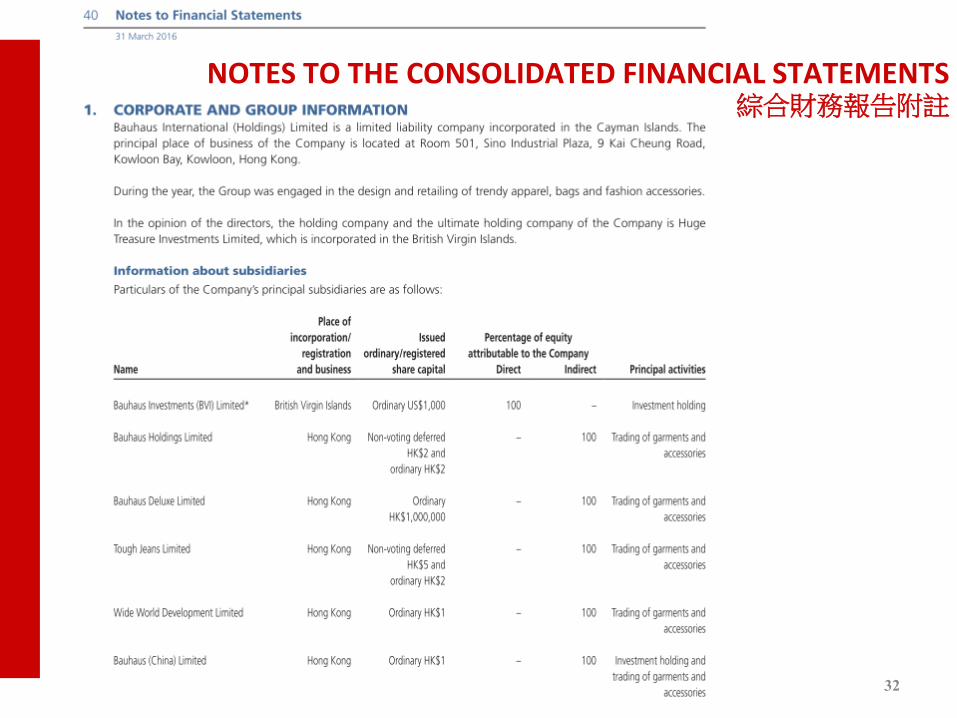
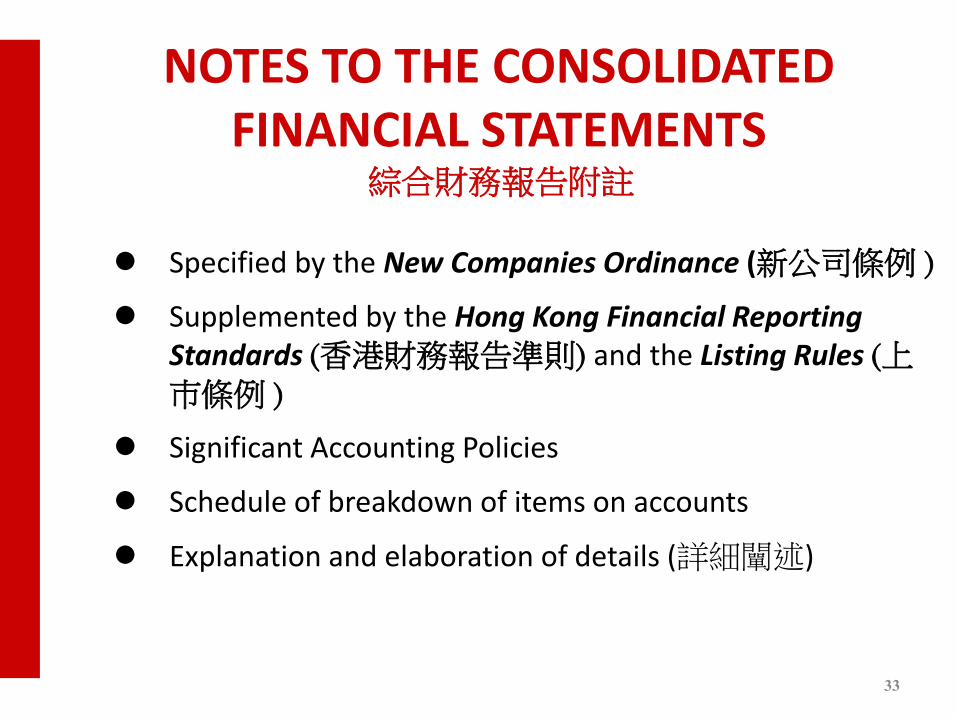
NOTES TO THE CONSOLIDATED FINANCIAL STATEMENTS 綜合財務報告附註
33
NOTES TO THE CONSOLIDATED FINANCIAL STATEMENTS
綜合財務報告附註
Specified by the New Companies Ordinance (新公司條例 )
Supplemented by the Hong Kong Financial Reporting Standards (香港財務報告準則) and the Listing Rules (上巿條例 )
Significant Accounting Policies
Schedule of breakdown of items on accounts
Explanation and elaboration of details (詳細闡述)
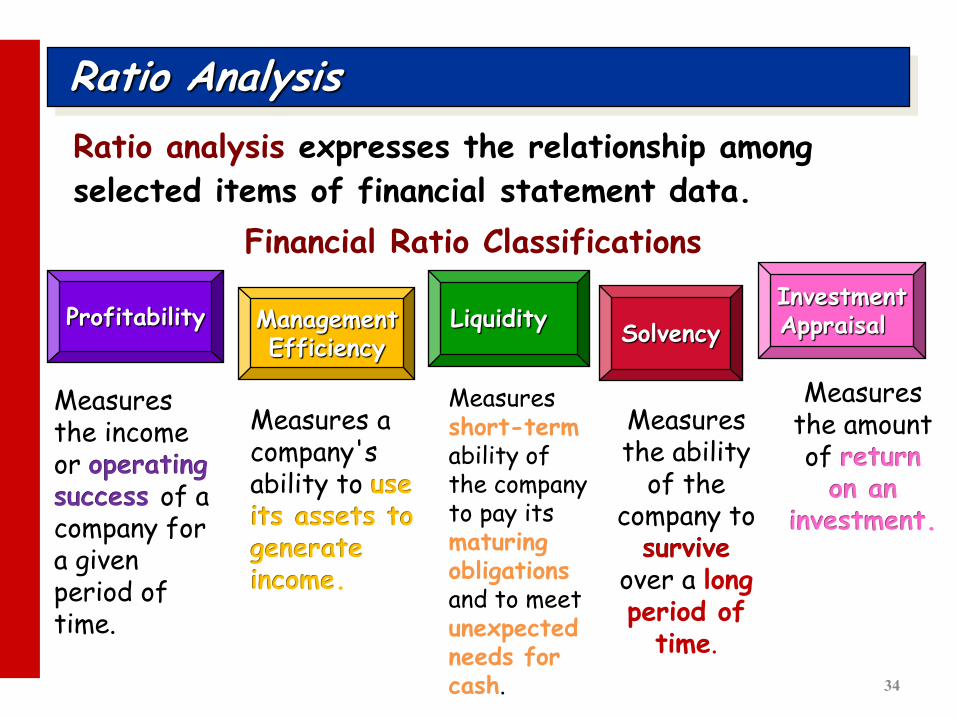
Ratio Analysis
Ratio analysis expresses the relationship among
selected items of financial statement data.
Liquidity Profitability Solvency
Measures short-term ability of the company to pay its maturing obligations and to meet unexpected needs for cash.
Financial Ratio Classifications
Measures the income or operating success of a company for a given period of time.
Measures the ability
of the company to
survive over a long period of
time.
Measures a company's ability to use its assets to generate income.
Management Efficiency
Investment Appraisal
Measures the amount of return
on an investment.
34

Ratio Analysis
The discussion of ratios will
include the following types of
comparisons.
A single ratio by itself is not very meaningful.
2015 2016
35
Ratio Analysis
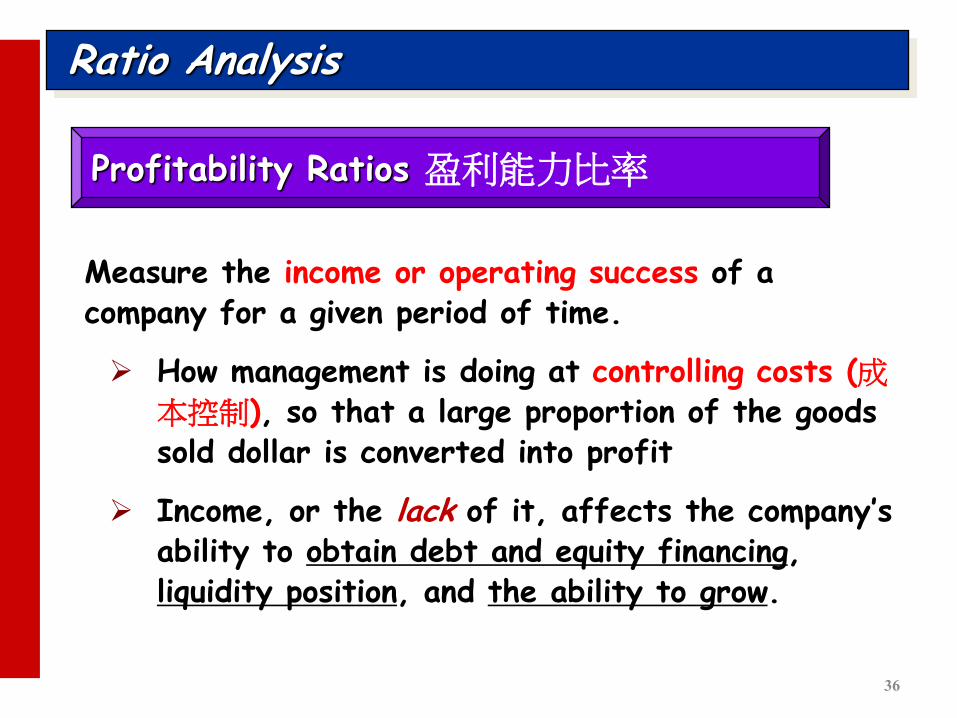
Profitability Ratios 盈利能力比率
Measure the income or operating success of a company for a given period of time.
How management is doing at controlling costs (成本控制), so that a large proportion of the goods sold dollar is converted into profit
Income, or the lack of it, affects the company’s ability to obtain debt and equity financing, liquidity position, and the ability to grow.
36
37
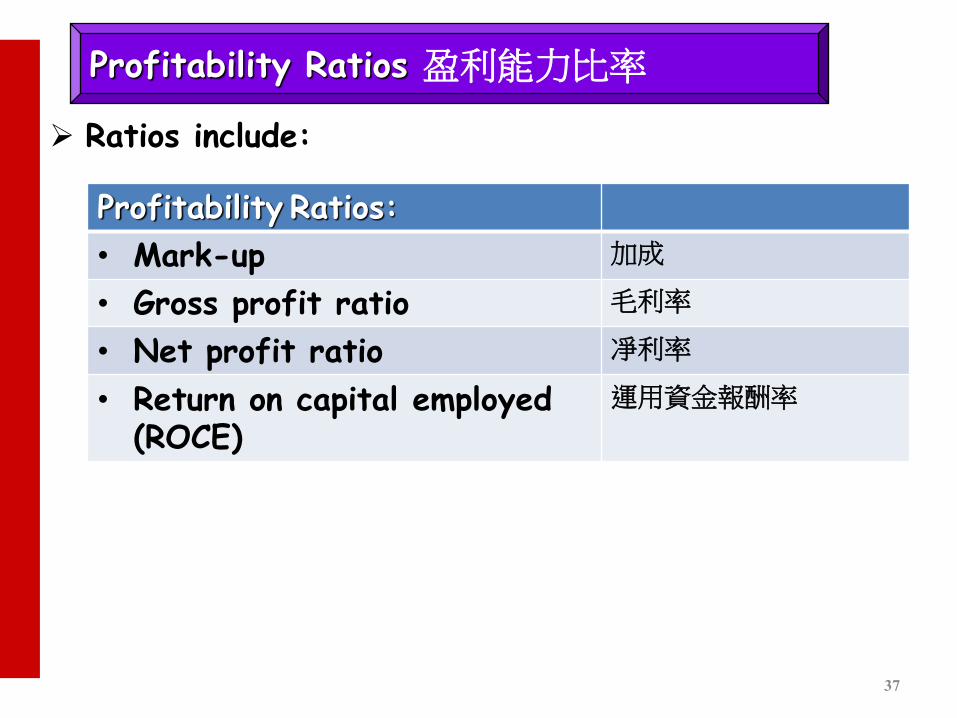
PROFITABILITY RATIOS 盈利能力比率
Ratios include:
Profitability Ratios:
• Mark-up 加成
• Gross profit ratio 毛利率
• Net profit ratio 凈利率
• Return on capital employed (ROCE)
運用資金報酬率
Profitability Ratios 盈利能力比率
2016 2015
Revenue 銷貨 450,000$ 300,000$
Cost of sales 銷貨成本 380,000 250,000
Gross profit 毛利 70,000 50,000
Selling and distribution 分銷費用 7,000 6,000
Administrative expenses 行政開支 30,000 20,000
Operating Profit 營運盈利 33,000 24,000
Other expenses and losses:
Finance costs 財務成本 1,500 1,500
Profit before tax 稅前盈利 31,500 22,500
Income tax expense 稅金 5,000 3,000
Profit for the year 全年盈利 26,500$ 19,500$
ABM LimitedConsolidated Income Statement 綜合損益表
For the Year Ended December 31
Ratio Analysis Notes:
1. All sales were on account.
2. At 1 January 2015, inventories were $20,000.
Illustration
38
Ratio Analysis
Assets 2016 2015
NON-CURRENT ASSETS 非流動資產
Property, plant and equipment (net)
房產,廠房及機器 (淨值) 39,000 28,400
Total non-current assets 39,000 28,400
CURRENT ASSETS 流動資產
Inventory 存貨 50,000$ 30,000$
Trade receivable (net) 應收帳款 (淨值) 100,000 85,000
Cash 現金 1,000 1,000
Total current assets 151,000 116,000
Total assets 190,000$ 144,400$
ABM Limited
Consolidated Balance Sheets 綜合資產負債表
December 31
Illustration
39
Ratio Analysis
Liabilities and Stockholders' Equity 2016 2015
NON-CURRENT LIABILITIES 非流動負債
Bonds payable 應付債券 12,000 18,000
Total non-current liabilities 12,000 18,000
CURRENT LIANBILITIES 流動負債
Trade payable 應付帳款 80,000$ 70,000$
Income taxes payable 利得稅應付款項 30,000 15,000
Total current liabilities 110,000 85,000
Total liabilities 122,000 103,000
SHAREHOLDERS' EQUITY 股東權益
Share capital 股本 ($2 par 面值) 22,000 22,000
Other reserves 其他儲備 6,000 4,500
Retained earnings 保留利潤 40,000 15,000
Total shareholders' fund 68,000 41,500
Total liabilities and equity 190,000$ 144,500$
Illustration
40
Ratio Analysis
Compute the Mark Up for 2015.
Measures the profit earned for each one dollar of cost of goods sold.
$50,000
$250,000 = 20.00%
Gross Profit 毛利
Cost of goods sold 銷貨成本
Mark Up 加成 =
Profitability Ratios 盈利能力比率
For every $100 cost of a product sold, $20 is generated to gross profit.
41
Ratio Analysis
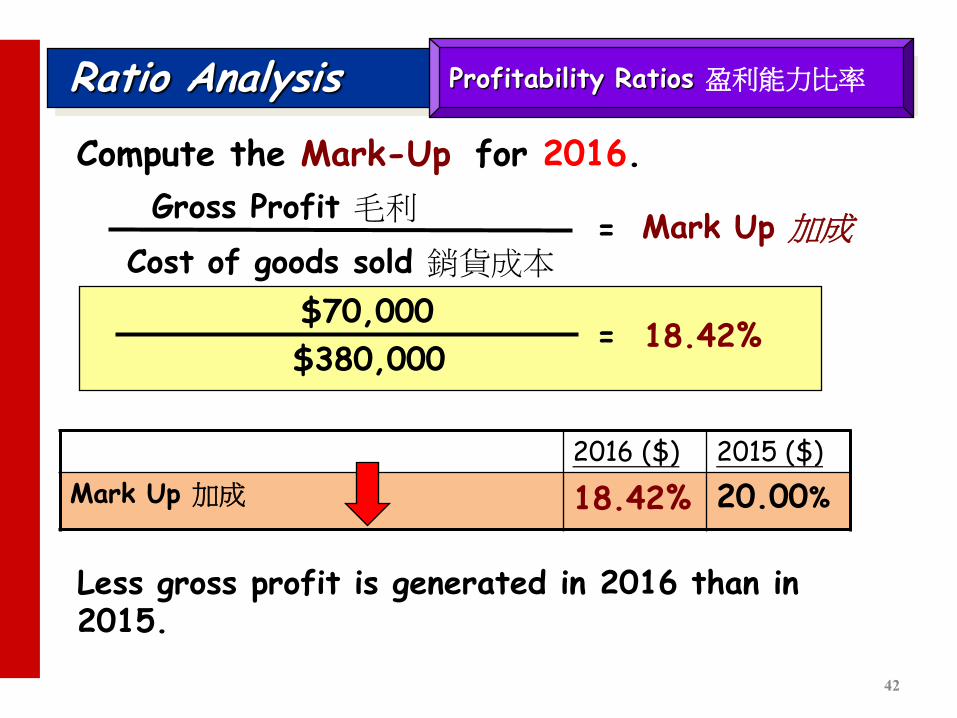
Compute the Mark-Up for 2016.
$70,000
$380,000 = 18.42%
Gross Profit 毛利
Cost of goods sold 銷貨成本 Mark Up 加成 =
2016 ($) 2015 ($)
Mark Up 加成 20.00%
18.42%
Profitability Ratios 盈利能力比率
Less gross profit is generated in 2016 than in 2015.
42
Ratio Analysis
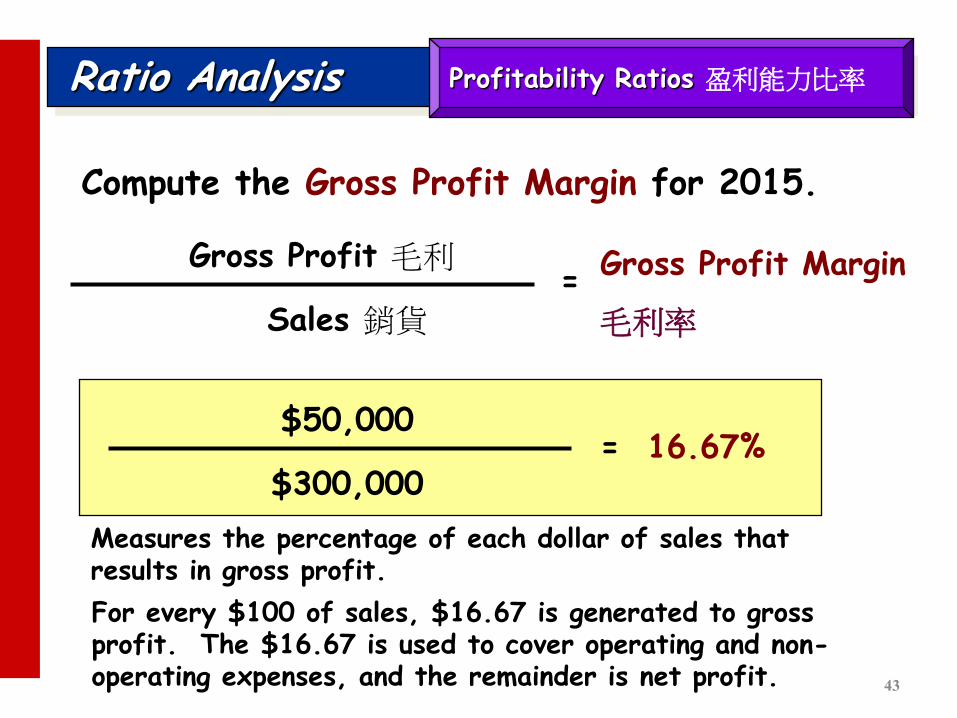
Compute the Gross Profit Margin for 2015.
Measures the percentage of each dollar of sales that results in gross profit.
$50,000
$300,000 = 16.67%
Gross Profit 毛利
Sales 銷貨
Gross Profit Margin
毛利率 =
Profitability Ratios 盈利能力比率
For every $100 of sales, $16.67 is generated to gross profit. The $16.67 is used to cover operating and non- operating expenses, and the remainder is net profit. 43
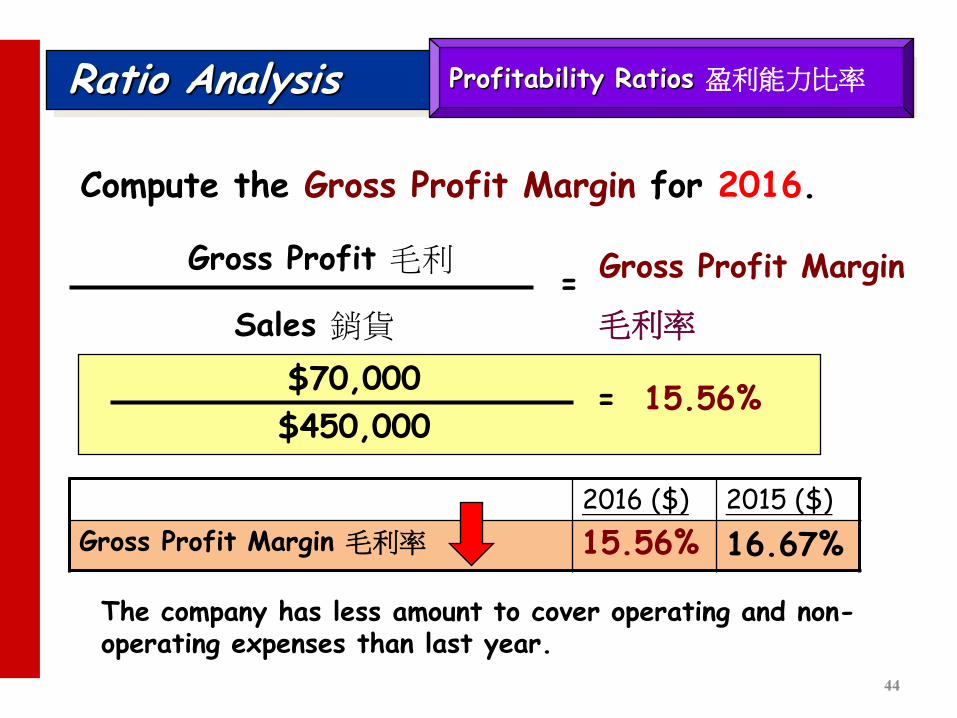
Ratio Analysis
Compute the Gross Profit Margin for 2016.
$70,000
$450,000 = 15.56%
Gross Profit 毛利
Sales 銷貨
Gross Profit Margin
毛利率 =
2016 ($) 2015 ($)
Gross Profit Margin 毛利率 16.67% 15.56%
Profitability Ratios 盈利能力比率
The company has less amount to cover operating and non- operating expenses than last year.
44

Ratio Analysis
Compute the Net Profit Margin for 2015.
Measures the percentage of each dollar of sales that results in net income.
$22,500
$300,000 = 7.50%
Net Profit before tax 稅前淨利
Sales 銷貨
Net Profit Margin
凈利率 =
Profitability Ratios 盈利能力比率
For every $100 of sales, $7.50 is generated to operating profit.
45
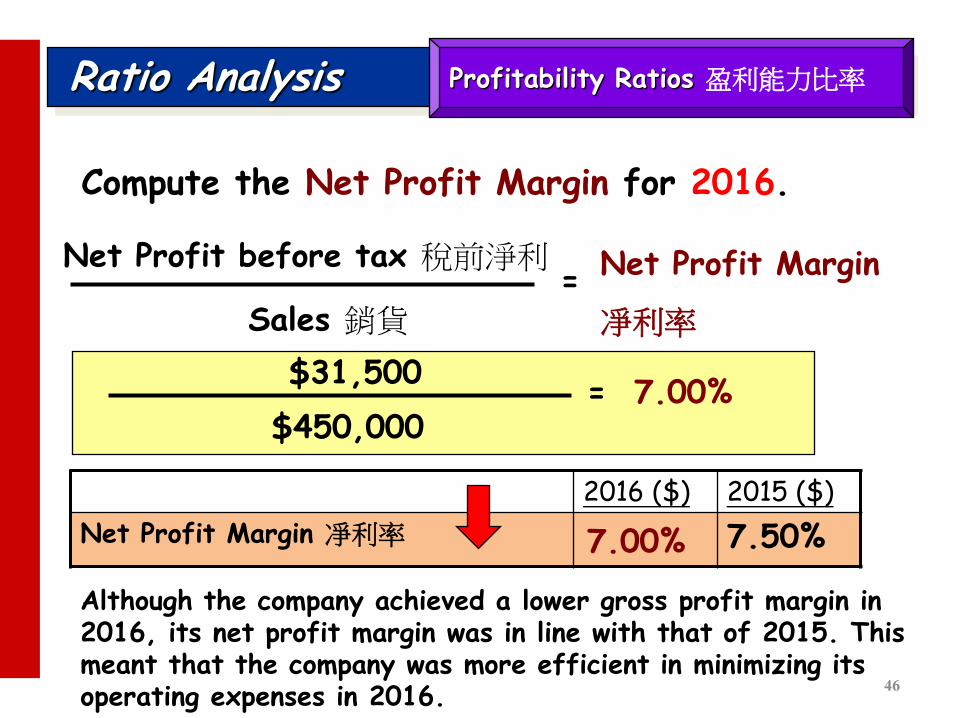
Ratio Analysis
Compute the Net Profit Margin for 2016.
$31,500
$450,000 = 7.00%
Net Profit before tax 稅前淨利
Sales 銷貨
Net Profit Margin
凈利率 =
2016 ($) 2015 ($)
Net Profit Margin 凈利率 7.50% 7.00%
Profitability Ratios 盈利能力比率
Although the company achieved a lower gross profit margin in 2016, its net profit margin was in line with that of 2015. This meant that the company was more efficient in minimizing its operating expenses in 2016.
46

Ratio Analysis
Compute the Return on Capital Employed (ROCE) for 2015.
$24,000
($41,500 + $18,000) = 40.34%
Profit before interest and tax 利息及稅前淨利 Return on Capital Employed
運用資金報酬率
= Capital Employed 運用資金
Rate of return based on the book value of long term capital investment made in the business.
Equity 股本 + Non-current liabilities 非流動負債
Operating Profit 營運盈利
Profitability Ratios 盈利能力比率
For every $100 of long term capital investment made in the business, $40.34 is operating profit generated for the year. 47

Ratio Analysis
Compute the Return on Capital Employed (ROCE) for 2016.
$33,000
($68,000 + $12,000) = 41.25%
Profit before interest and tax 利息及稅前淨利 Return on Capital Employed
運用資金報酬率
= Capital Employed 運用資金
2016 ($) 2015 ($)
ROCE 運用資金報酬率 40.34% 41.25%
Profitability Ratios 盈利能力比率
Much more income is earned in 2016 base on the book value of long term capital investment made in the business.
48
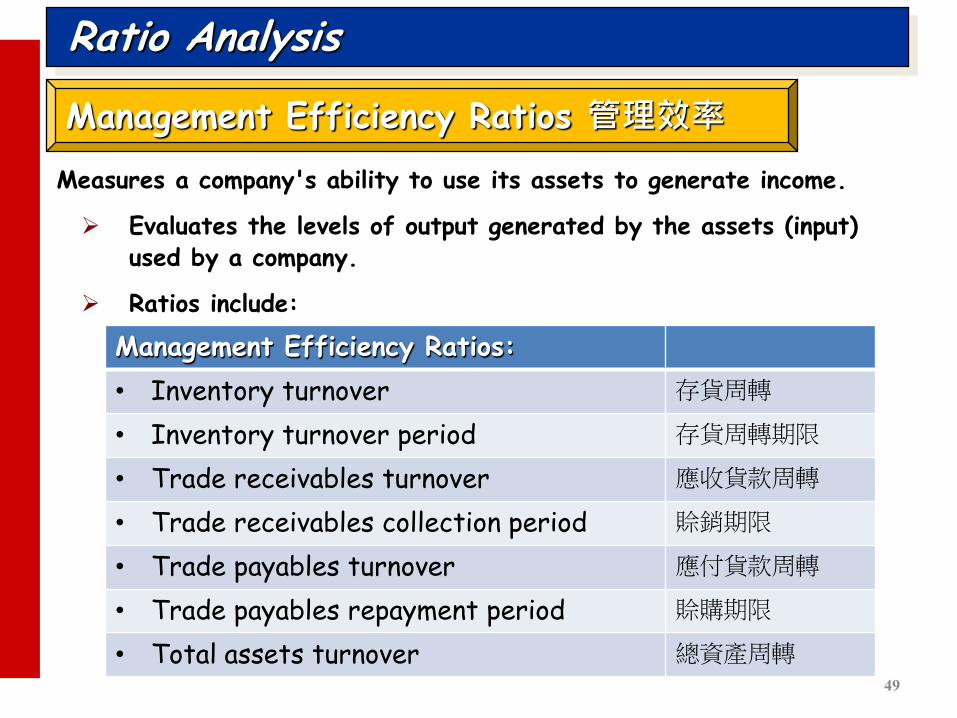
Ratio Analysis
Measures a company's ability to use its assets to generate income.
Evaluates the levels of output generated by the assets (input) used by a company.
Ratios include:
Management Efficiency Ratios 管理效率
Management Efficiency Ratios:
• Inventory turnover 存貨周轉
• Inventory turnover period 存貨周轉期限
• Trade receivables turnover 應收貨款周轉
• Trade receivables collection period 賒銷期限
• Trade payables turnover 應付貨款周轉
• Trade payables repayment period 賒購期限
• Total assets turnover 總資產周轉 49
Ratio Analysis
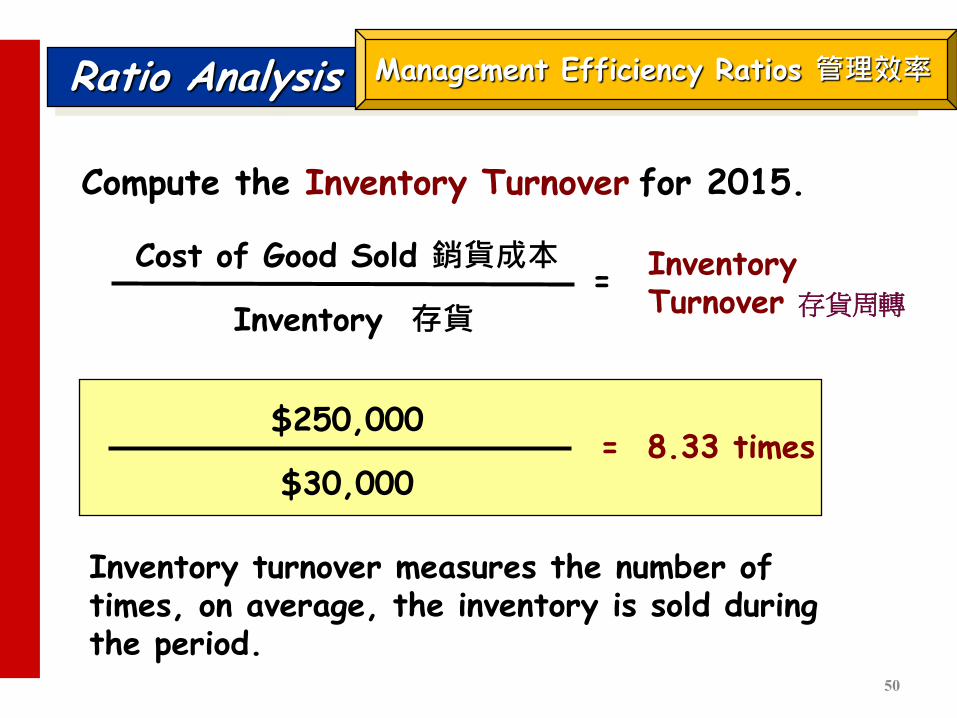
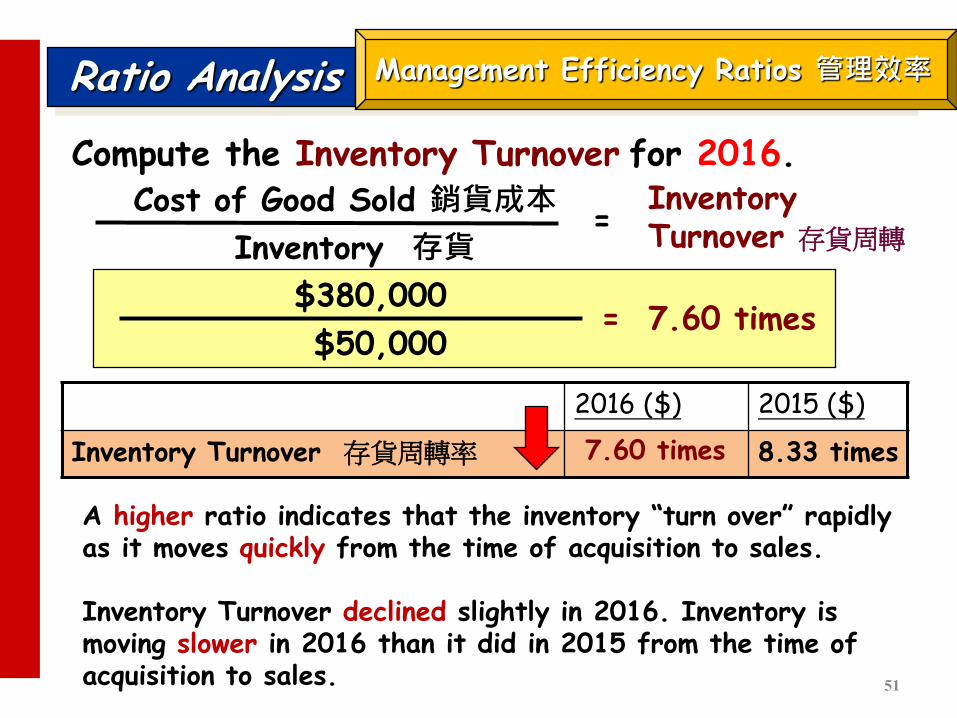
Compute the Inventory Turnover for 2015.
Inventory turnover measures the number of times, on average, the inventory is sold during the period.
$250,000
$30,000 = 8.33 times
Cost of Good Sold 銷貨成本
Inventory 存貨
Inventory Turnover 存貨周轉
=
Management Efficiency Ratios 管理效率
50
Ratio Analysis
Compute the Inventory Turnover for 2016.
$380,000
$50,000 = 7.60 times
Cost of Good Sold 銷貨成本
Inventory 存貨
Inventory Turnover 存貨周轉
=
2016 ($) 2015 ($)
Inventory Turnover 存貨周轉率 8.33 times
51
7.60 times
Management Efficiency Ratios 管理效率
A higher ratio indicates that the inventory “turn over” rapidly as it moves quickly from the time of acquisition to sales. Inventory Turnover declined slightly in 2016. Inventory is moving slower in 2016 than it did in 2015 from the time of acquisition to sales.
Ratio Analysis
Compute the Inventory Turnover Period for 2015.
Measures the average number of days the company holds its inventory before selling it.
$30,000 x 365 days
$250,000 = 43.80 days
Cost of Good Sold 銷貨成本
Inventory 存貨 = x 365 days
Inventory Turnover Period
存貨周轉期限
Management Efficiency Ratios 管理效率
52
Ratio Analysis
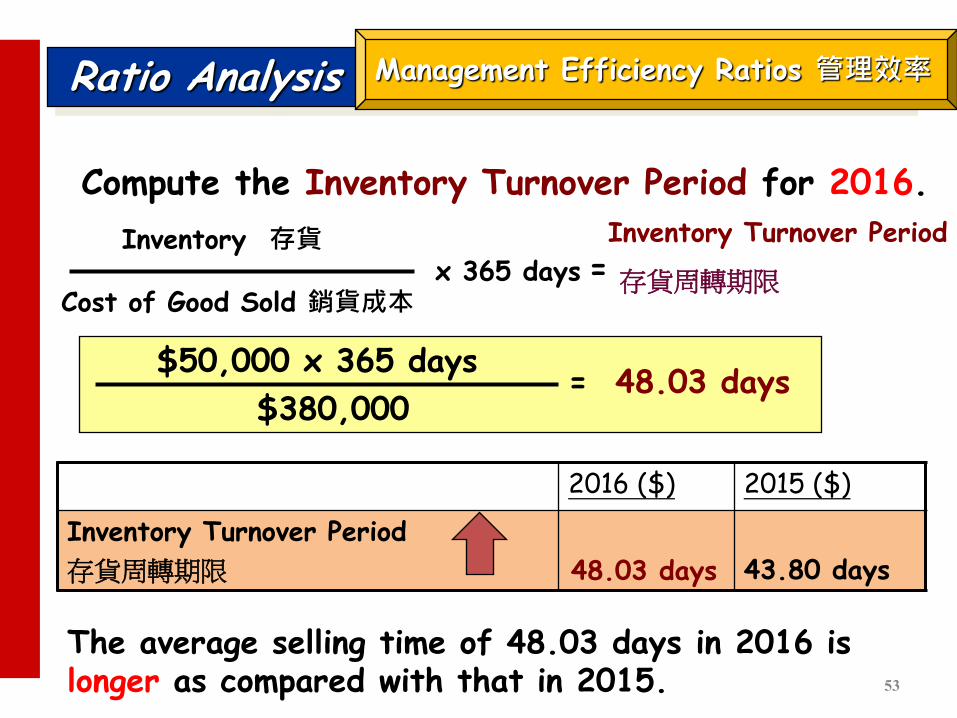
Compute the Inventory Turnover Period for 2016.
$50,000 x 365 days
$380,000 = 48.03 days
Cost of Good Sold 銷貨成本
Inventory 存貨 Inventory Turnover Period
存貨周轉期限
= x 365 days
2016 ($) 2015 ($)
Inventory Turnover Period
存貨周轉期限
43.80 days
53
48.03 days
Management Efficiency Ratios 管理效率
The average selling time of 48.03 days in 2016 is longer as compared with that in 2015.
Ratio Analysis
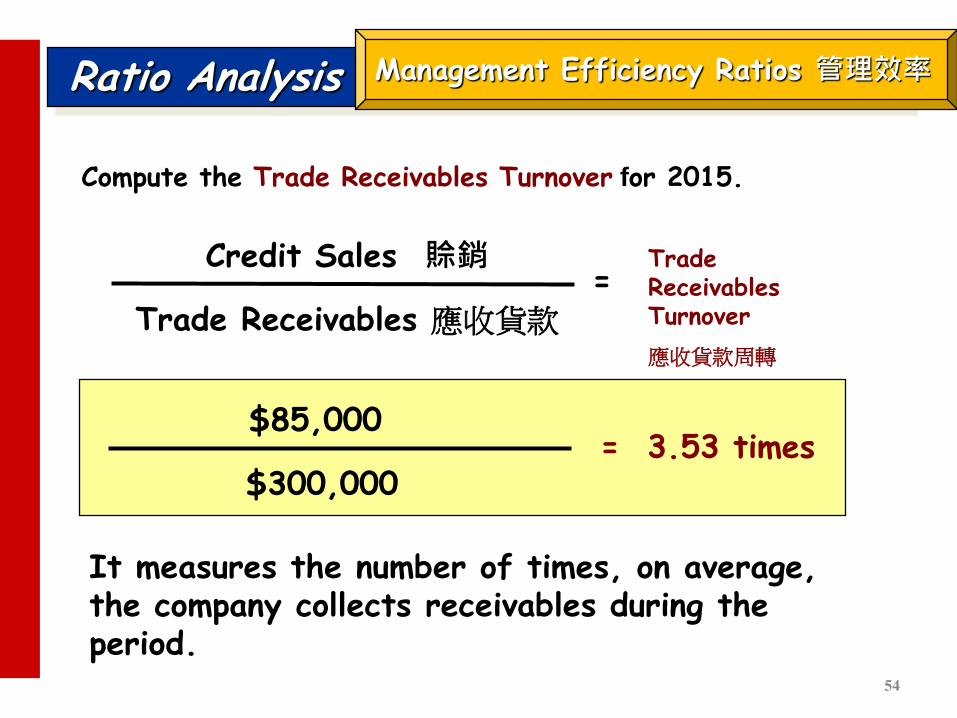
Compute the Trade Receivables Turnover for 2015.
It measures the number of times, on average, the company collects receivables during the period.
$85,000
$300,000 = 3.53 times
Credit Sales 賒銷
Trade Receivables 應收貨款
Trade Receivables Turnover
應收貨款周轉
=
Management Efficiency Ratios 管理效率
54

Ratio Analysis
Compute the Trade Receivables Turnover for 2016.
$100,000
$450,000 = 4.50 times
Credit Sales 賒銷
Trade Receivables 應收貨款
Trade Receivables Turnover
應收貨款周轉
=
2016 ($) 2015 ($)
Trade Receivables Ratio
應收貨款周轉
3.53 times
55
4.50 times
Management Efficiency Ratios 管理效率
Trade Receivables Turnover improved in 2016.

Ratio Analysis
Compute the Trade Receivables Collection Period for 2015.
It assesses the effectiveness of a company’s credit and collection policies.
This ratio means that receivables are collected on average every 103.42 days.
$85,000 x 365 days
$300,000 = 103.42 days
Credit Sales 賒銷
Trade Receivables 應收貨款 Trade Receivables Collection Period
賒銷期限
= x 365 days
Management Efficiency Ratios 管理效率
56
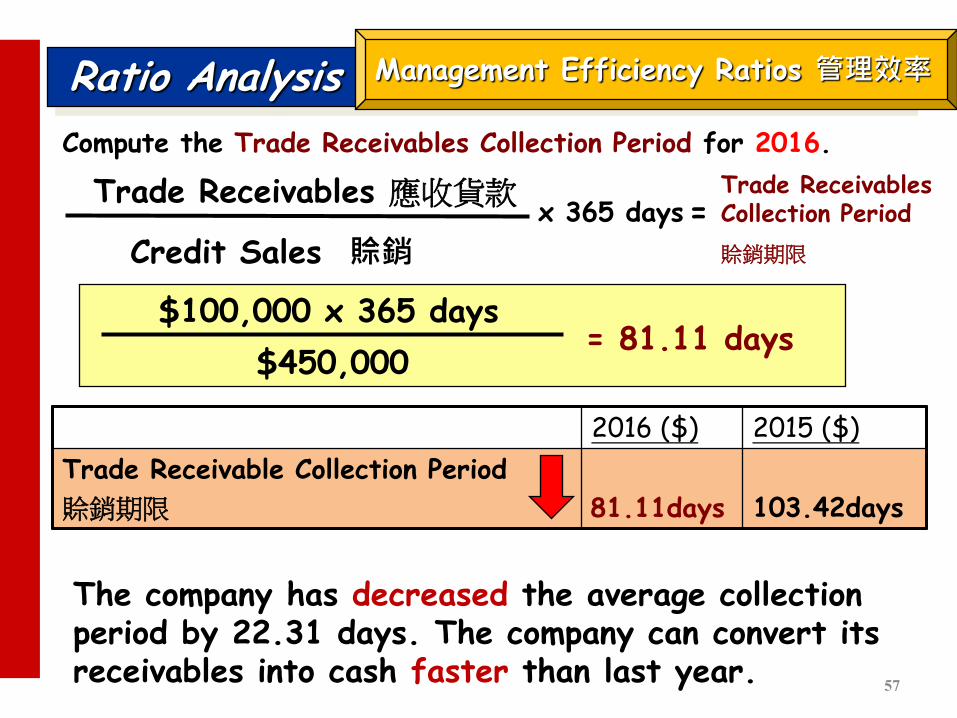
Ratio Analysis
Compute the Trade Receivables Collection Period for 2016.
$100,000 x 365 days
$450,000 = 81.11 days
Credit Sales 賒銷
Trade Receivables 應收貨款 Trade Receivables Collection Period
賒銷期限
= x 365 days
2016 ($) 2015 ($)
Trade Receivable Collection Period
賒銷期限
103.42days
57
81.11days
Management Efficiency Ratios 管理效率
The company has decreased the average collection period by 22.31 days. The company can convert its receivables into cash faster than last year.
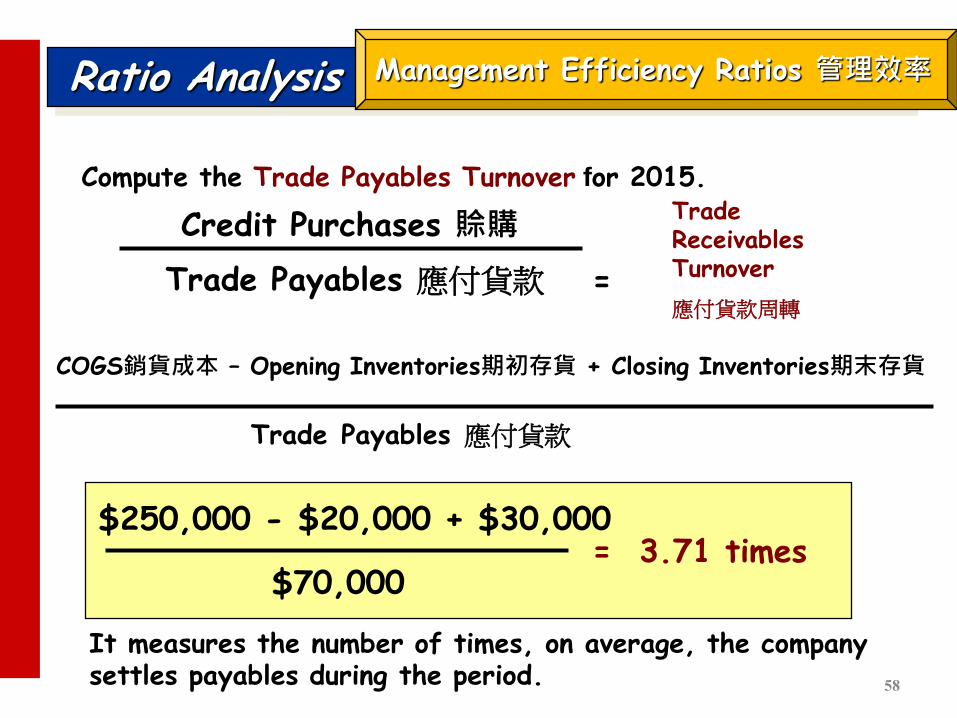
Ratio Analysis
Compute the Trade Payables Turnover for 2015.
It measures the number of times, on average, the company settles payables during the period.
$250,000 - $20,000 + $30,000
$70,000 = 3.71 times
Credit Purchases 賒購
Trade Payables 應付貨款
Trade Receivables Turnover
應付貨款周轉
=
Trade Payables 應付貨款
COGS銷貨成本 – Opening Inventories期初存貨 + Closing Inventories期末存貨
Management Efficiency Ratios 管理效率
58
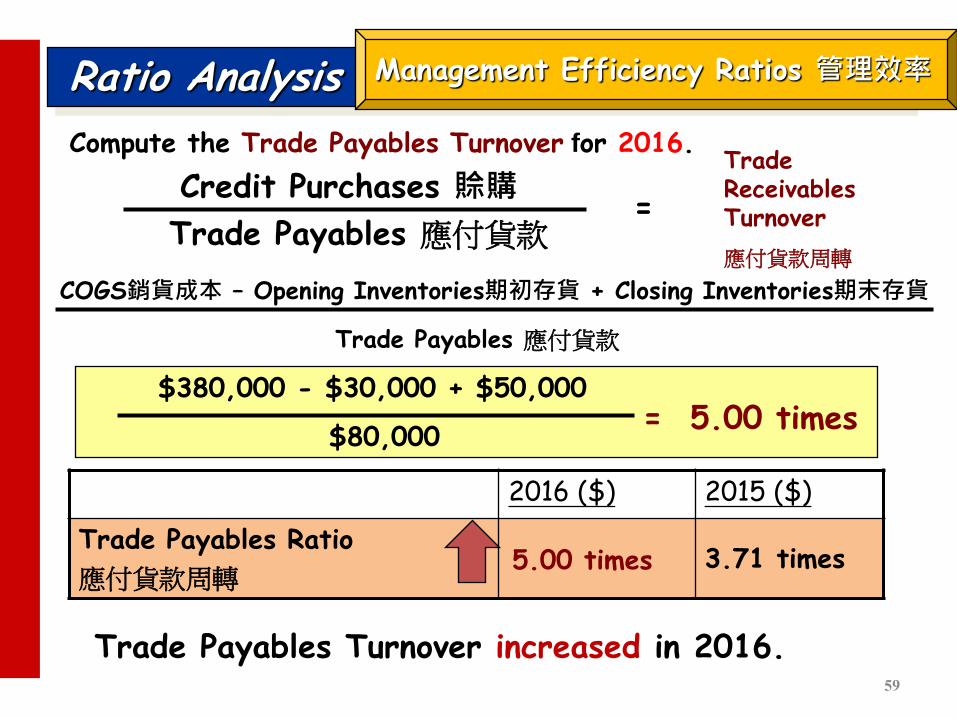
Ratio Analysis
Compute the Trade Payables Turnover for 2016.
$380,000 - $30,000 + $50,000
$80,000 = 5.00 times
Credit Purchases 賒購
Trade Payables 應付貨款
Trade Receivables Turnover
應付貨款周轉
=
Trade Payables 應付貨款
COGS銷貨成本 – Opening Inventories期初存貨 + Closing Inventories期末存貨
2016 ($) 2015 ($)
Trade Payables Ratio
應付貨款周轉 3.71 times
59
5.00 times
Management Efficiency Ratios 管理效率
Trade Payables Turnover increased in 2016.

Ratio Analysis
Compute the Trade Payables Repayment Period for 2015.
$70,000 x 365 days = 98.27 days
Credit Purchases 賒購
Trade Payables 應付貨款 Trade Payables Repayment Period
賒購期限
= x 365 days
$250,000 - $20,000 + $30,000
Indicates average length of time in days within which a company must pay for its credit purchases (賒購). This means that payables are settled on average every 98.27 days.
Management Efficiency Ratios 管理效率
60
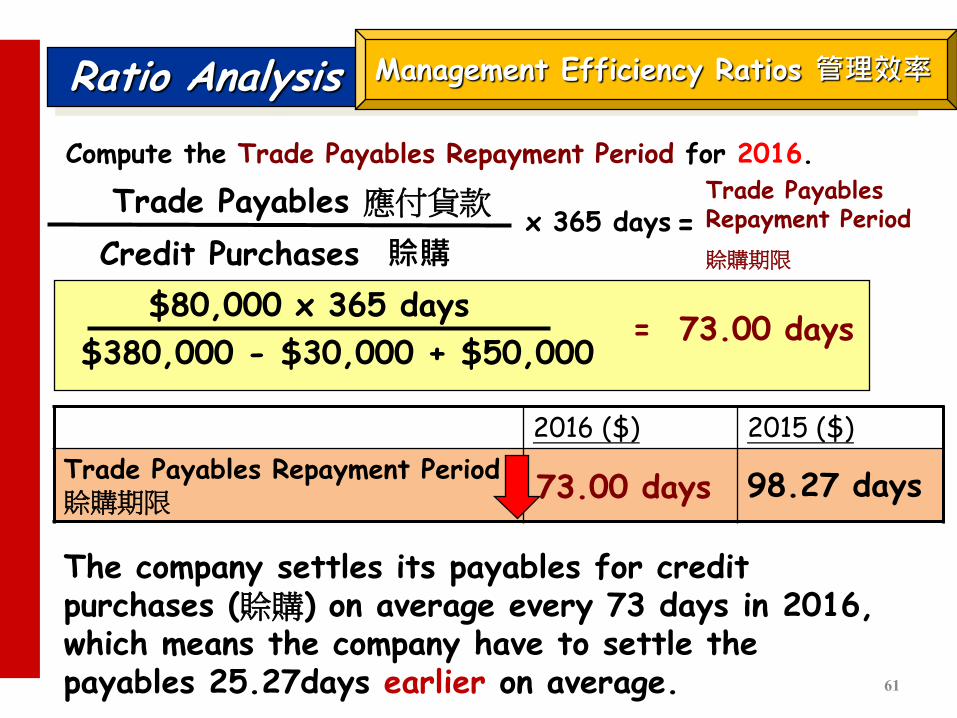
Ratio Analysis
Compute the Trade Payables Repayment Period for 2016.
$80,000 x 365 days = 73.00 days
Credit Purchases 賒購
Trade Payables 應付貨款 Trade Payables Repayment Period
賒購期限
= x 365 days
$380,000 - $30,000 + $50,000
2016 ($) 2015 ($)
Trade Payables Repayment Period 賒購期限 98.27 days
61
73.00 days
Management Efficiency Ratios 管理效率
The company settles its payables for credit purchases (賒購) on average every 73 days in 2016, which means the company have to settle the payables 25.27days earlier on average.
Ratio Analysis
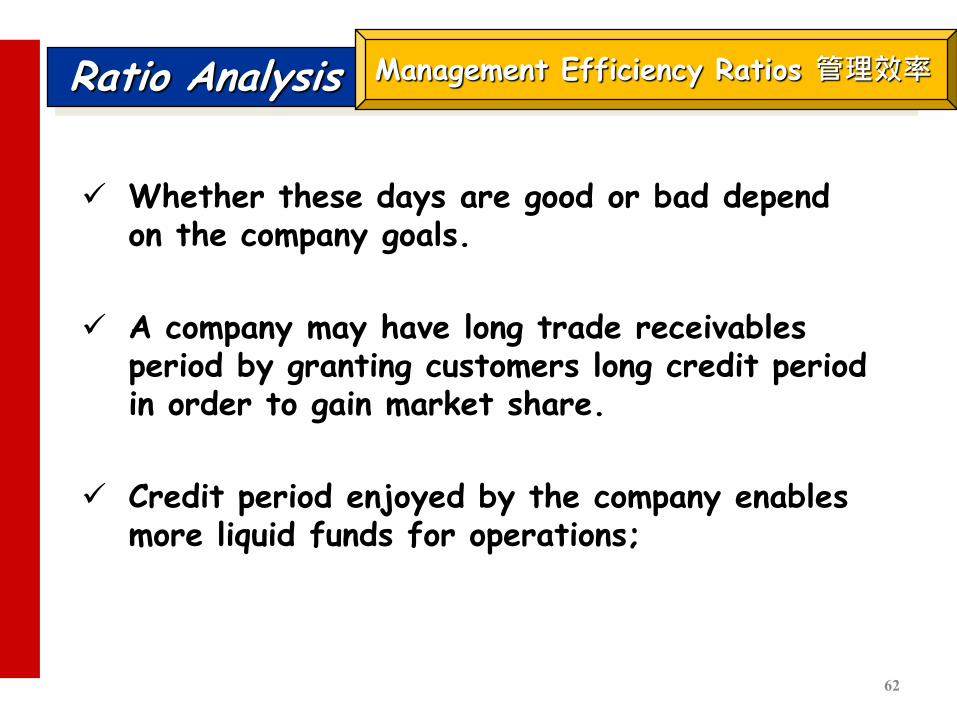
Whether these days are good or bad depend on the company goals.
A company may have long trade receivables period by granting customers long credit period in order to gain market share.
Credit period enjoyed by the company enables more liquid funds for operations;
Management Efficiency Ratios 管理效率
62
Ratio Analysis
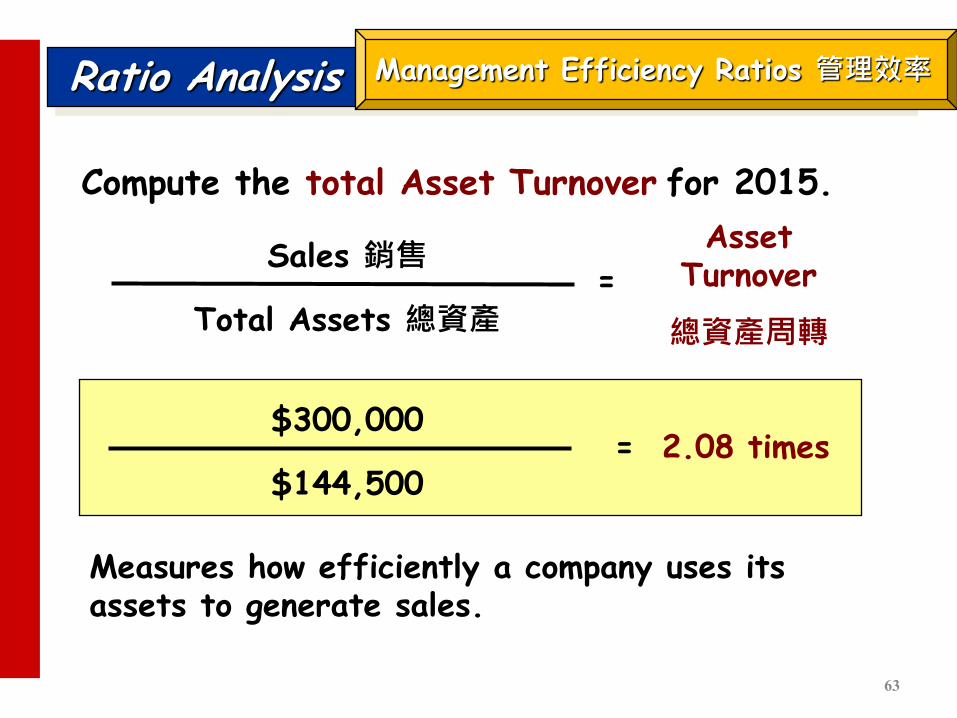
Compute the total Asset Turnover for 2015.
Measures how efficiently a company uses its assets to generate sales.
$300,000
$144,500 = 2.08 times
= Sales 銷售
Total Assets 總資產
Asset Turnover
總資產周轉
Management Efficiency Ratios 管理效率
63
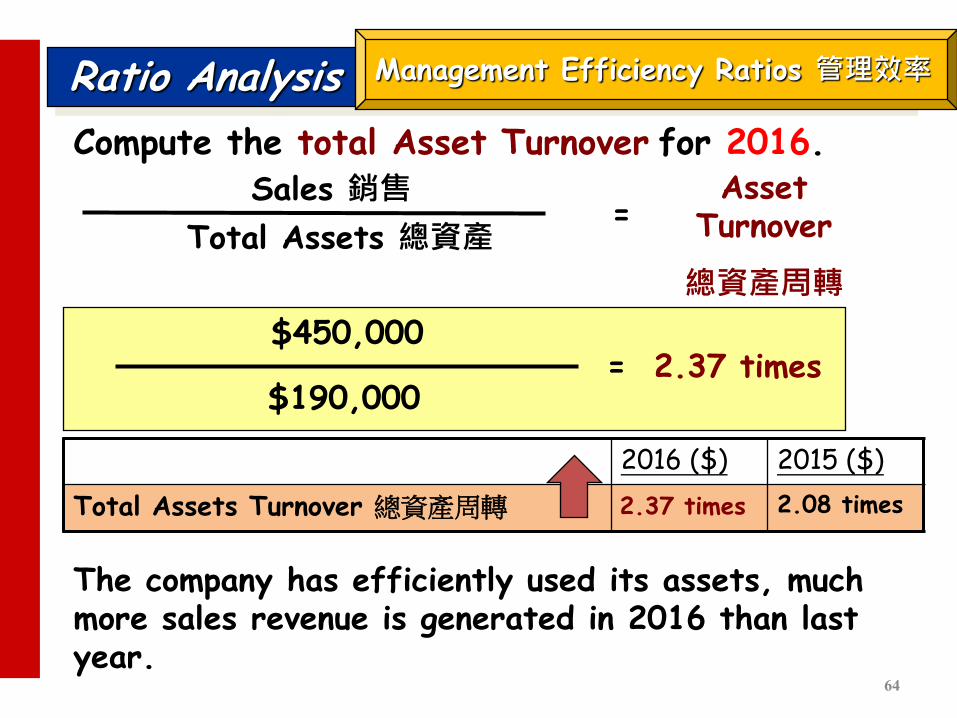
Ratio Analysis
Compute the total Asset Turnover for 2016.
$450,000
$190,000 = 2.37 times
Sales 銷售
Total Assets 總資產
Asset Turnover
總資產周轉
=
2016 ($) 2015 ($)
Total Assets Turnover 總資產周轉 2.08 times 2.37 times
Management Efficiency Ratios 管理效率
The company has efficiently used its assets, much more sales revenue is generated in 2016 than last year.
64
Ratio Analysis
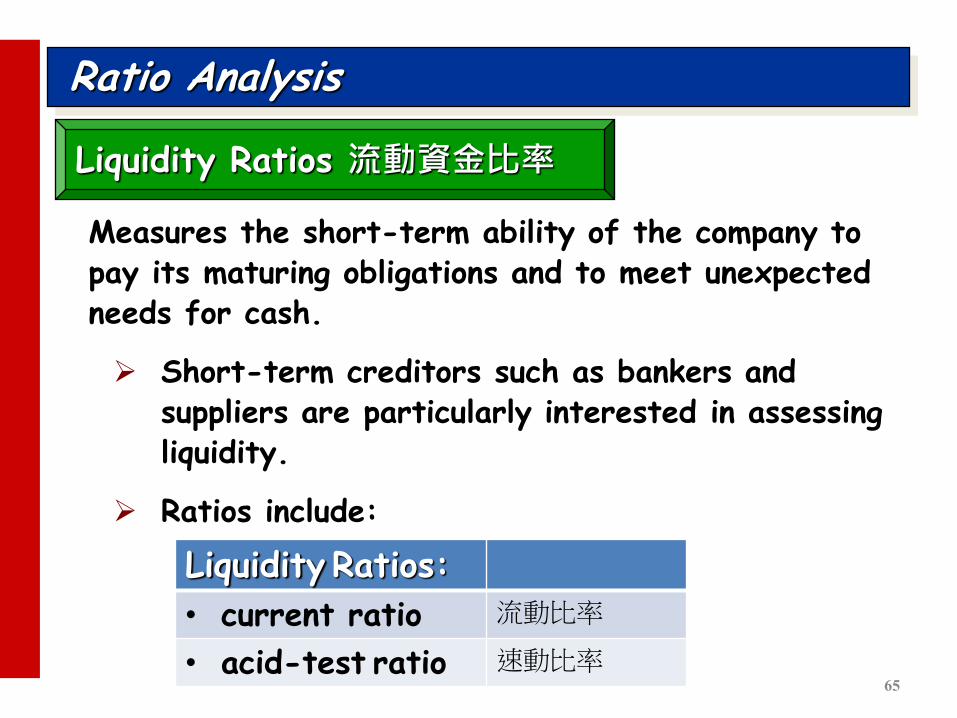
Measures the short-term ability of the company to pay its maturing obligations and to meet unexpected needs for cash.
Short-term creditors such as bankers and suppliers are particularly interested in assessing liquidity.
Ratios include:
Liquidity Ratios:
• current ratio 流動比率
• acid-test ratio 速動比率
Liquidity Ratios 流動資金比率
65
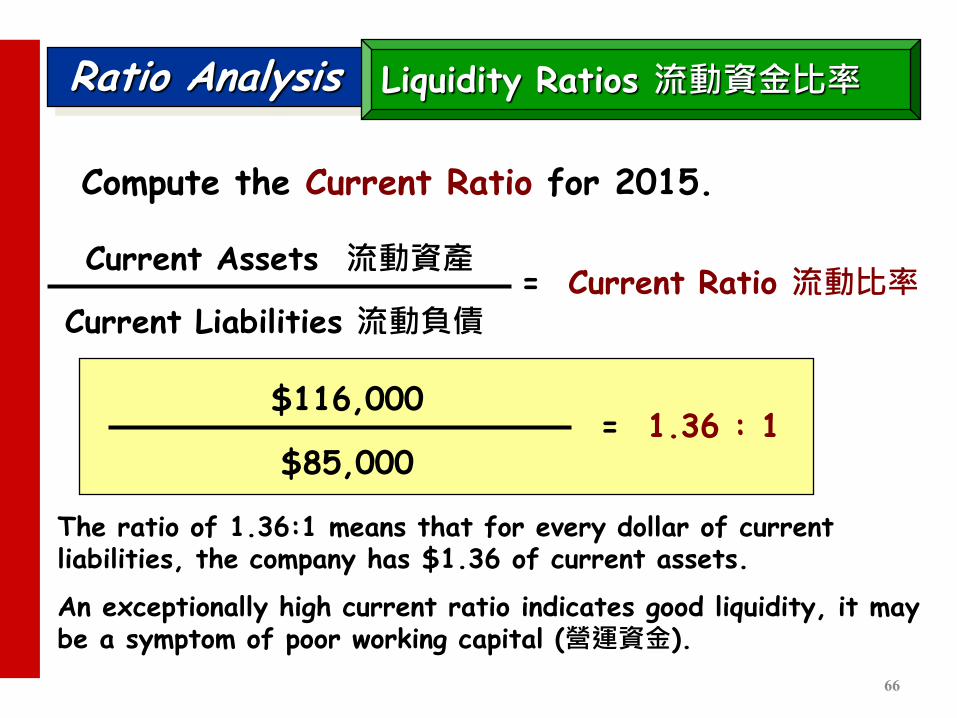
Ratio Analysis
Compute the Current Ratio for 2015.
The ratio of 1.36:1 means that for every dollar of current liabilities, the company has $1.36 of current assets.
An exceptionally high current ratio indicates good liquidity, it may be a symptom of poor working capital (營運資金).
Current Assets 流動資產
Current Liabilities 流動負債 = Current Ratio 流動比率
$116,000
$85,000 = 1.36 : 1
Liquidity Ratios 流動資金比率
66
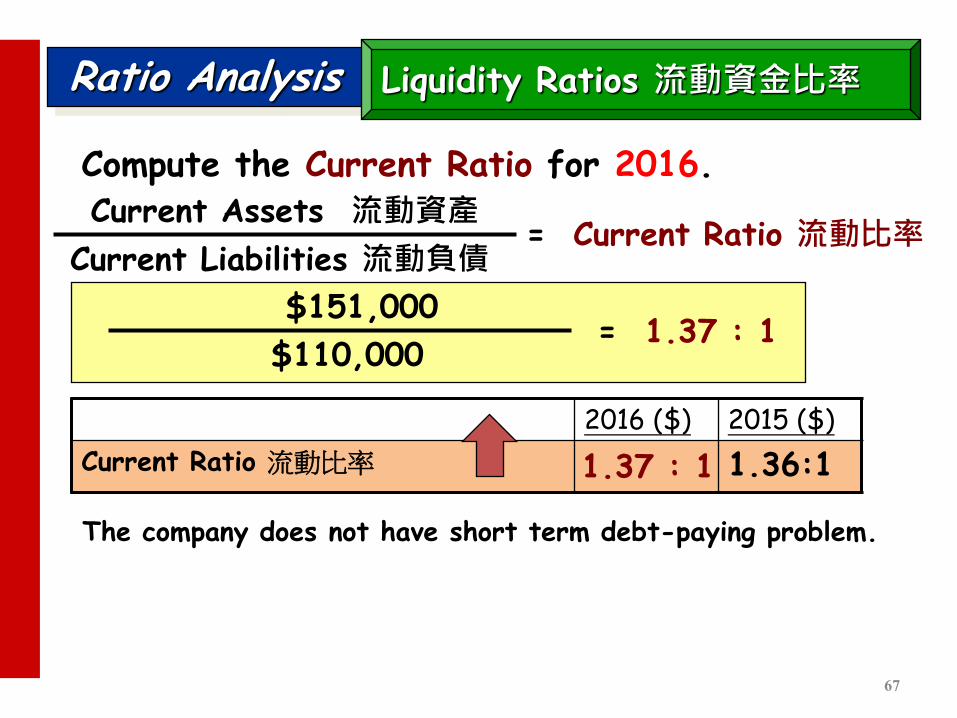
Ratio Analysis
Compute the Current Ratio for 2016. Current Assets 流動資產
Current Liabilities 流動負債 = Current Ratio 流動比率
$151,000
$110,000 = 1.37 : 1
2016 ($) 2015 ($)
Current Ratio 流動比率 1.36:1 1.37 : 1
Liquidity Ratios 流動資金比率
The company does not have short term debt-paying problem.
67
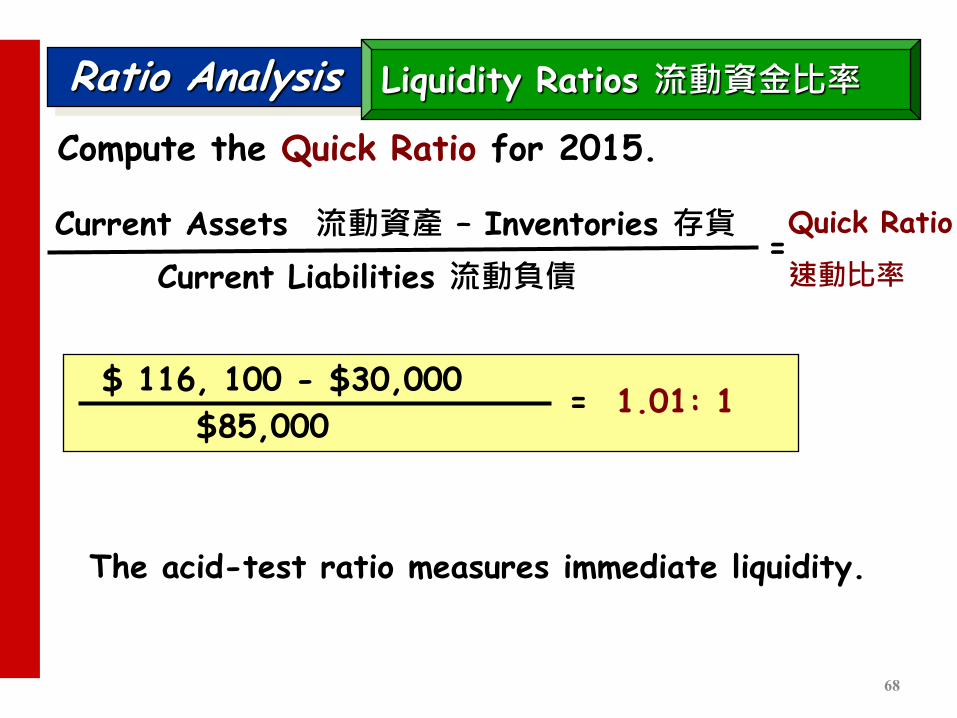
Ratio Analysis
Compute the Quick Ratio for 2015.
The acid-test ratio measures immediate liquidity.
Current Liabilities 流動負債
Quick Ratio
速動比率
$ 116, 100 - $30,000
$85,000 = 1.01: 1
= Current Assets 流動資產 – Inventories 存貨
Liquidity Ratios 流動資金比率
68
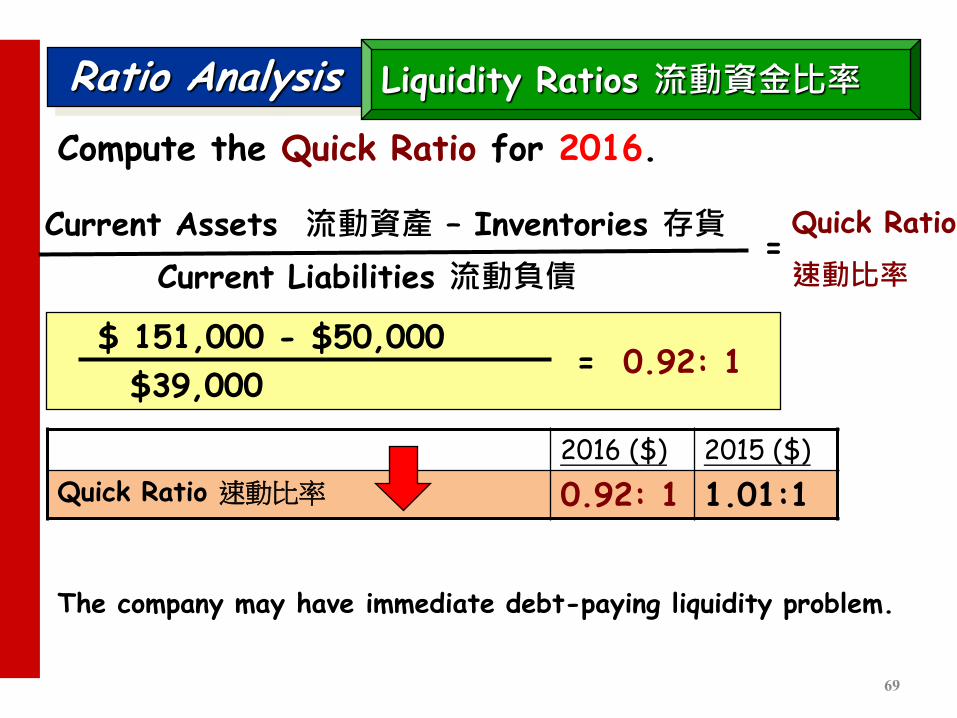
Ratio Analysis
Compute the Quick Ratio for 2016.
Current Liabilities 流動負債
Quick Ratio
速動比率
$ 151,000 - $50,000
$39,000 = 0.92: 1
= Current Assets 流動資產 – Inventories 存貨
2016 ($) 2015 ($)
Quick Ratio 速動比率 1.01:1 0.92: 1
Liquidity Ratios 流動資金比率
The company may have immediate debt-paying liquidity problem.
69
Ratio Analysis
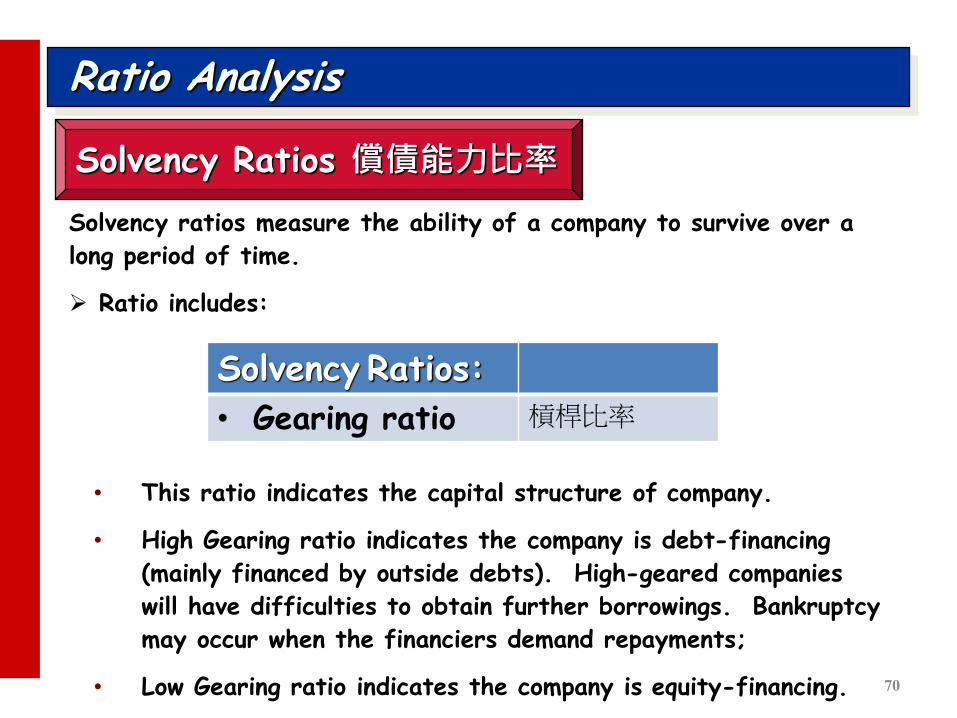
Solvency Ratios 償債能力比率
Solvency ratios measure the ability of a company to survive over a
long period of time.
Ratio includes:
• This ratio indicates the capital structure of company.
• High Gearing ratio indicates the company is debt-financing
(mainly financed by outside debts). High-geared companies
will have difficulties to obtain further borrowings. Bankruptcy
may occur when the financiers demand repayments;
• Low Gearing ratio indicates the company is equity-financing.
Solvency Ratios:
• Gearing ratio 槓桿比率
70
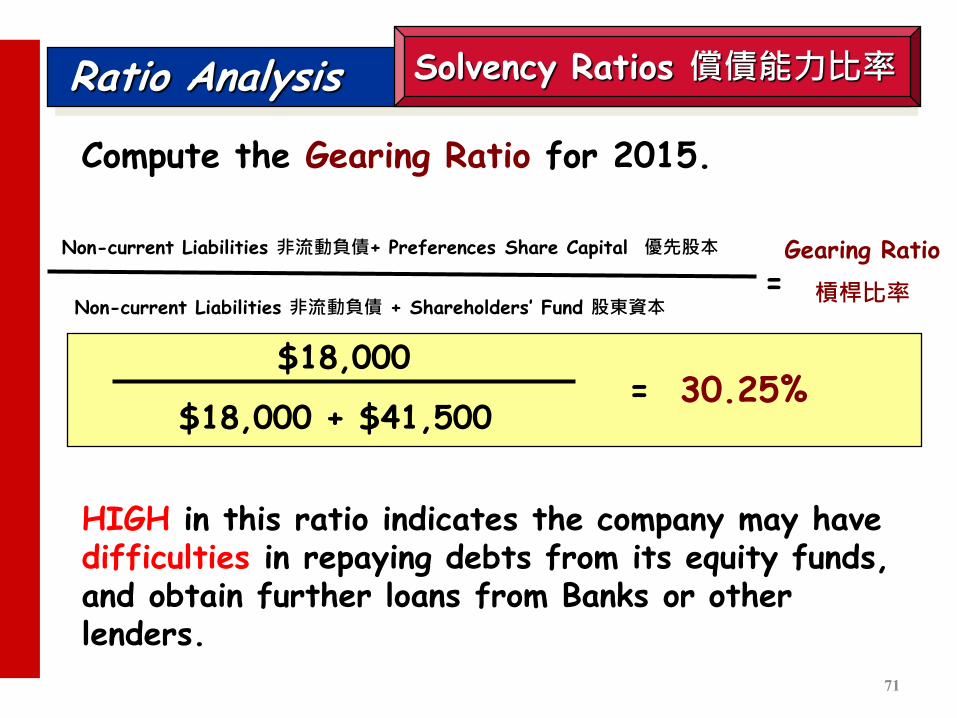
Ratio Analysis
Compute the Gearing Ratio for 2015.
HIGH in this ratio indicates the company may have difficulties in repaying debts from its equity funds, and obtain further loans from Banks or other lenders.
$18,000
$18,000 + $41,500 = 30.25%
Non-current Liabilities 非流動負債+ Preferences Share Capital 優先股本 Gearing Ratio
槓桿比率 = Non-current Liabilities 非流動負債 + Shareholders’ Fund 股東資本
Solvency Ratios 償債能力比率
71
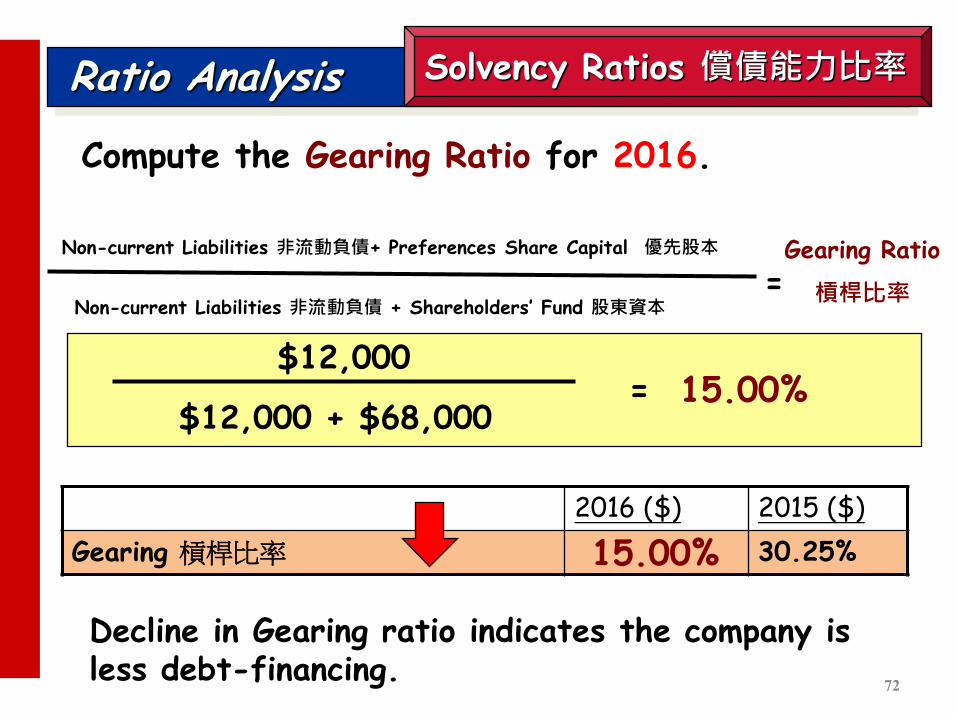
Ratio Analysis
Compute the Gearing Ratio for 2016.
$12,000
$12,000 + $68,000 = 15.00%
Non-current Liabilities 非流動負債+ Preferences Share Capital 優先股本 Gearing Ratio
槓桿比率 = Non-current Liabilities 非流動負債 + Shareholders’ Fund 股東資本
2016 ($) 2015 ($)
Gearing 槓桿比率 30.25%
72
15.00%
Solvency Ratios 償債能力比率
Decline in Gearing ratio indicates the company is less debt-financing.
Ratio Analysis
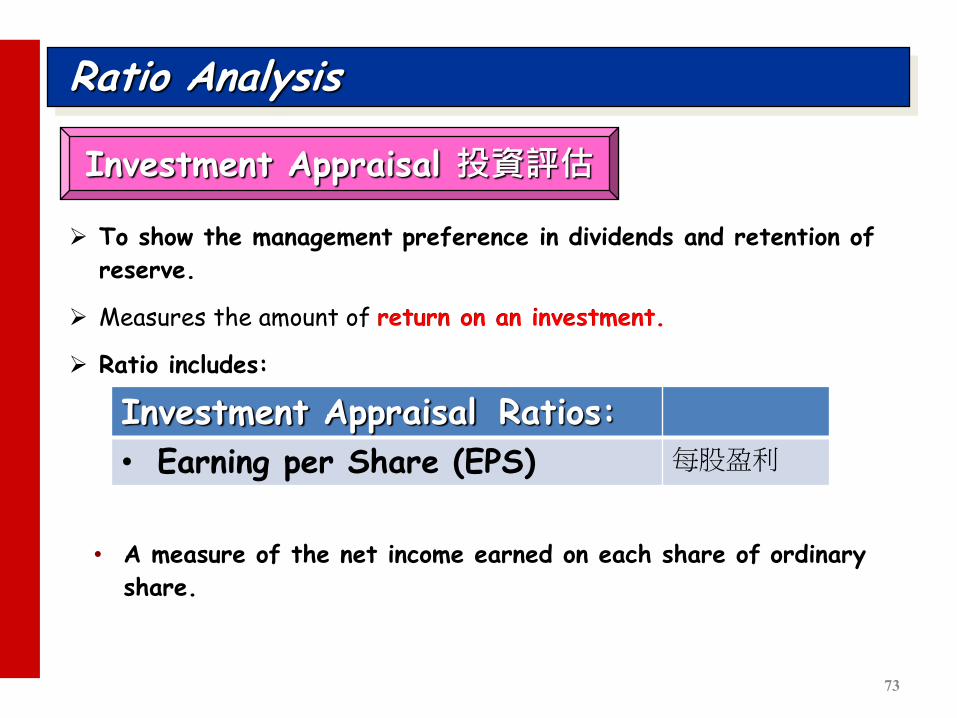
To show the management preference in dividends and retention of
reserve.
Measures the amount of return on an investment.
Ratio includes:
• A measure of the net income earned on each share of ordinary
share.
Investment Appraisal Ratios:
• Earning per Share (EPS) 每股盈利
Investment Appraisal 投資評估
73
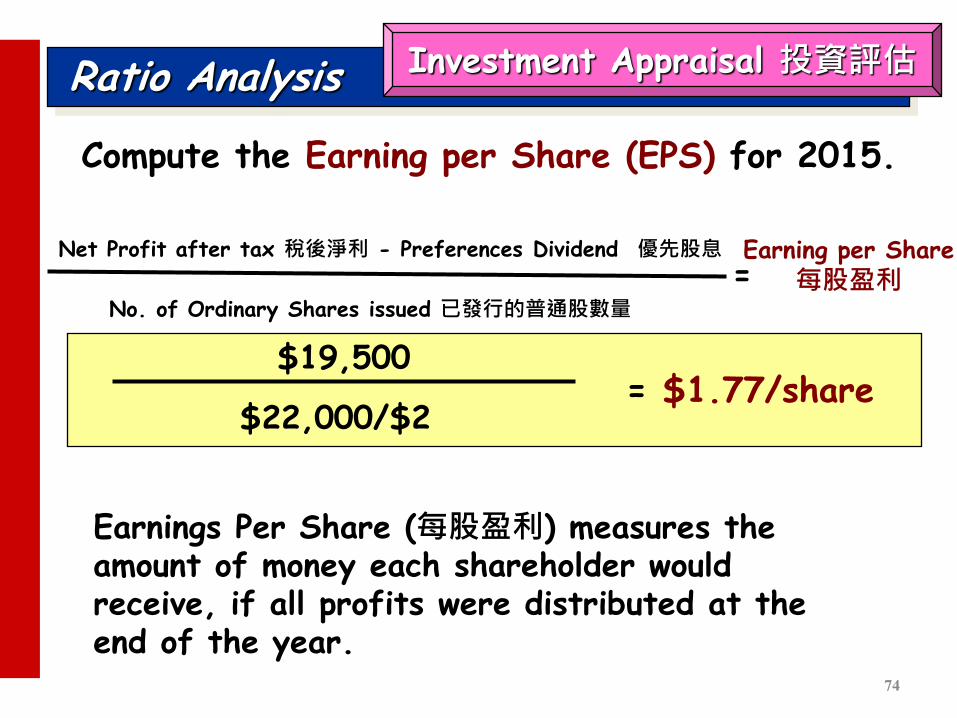
Ratio Analysis
Compute the Earning per Share (EPS) for 2015.
$19,500
$22,000/$2 = $1.77/share
Net Profit after tax 稅後淨利 - Preferences Dividend 優先股息 Earning per Share每股盈利 =
No. of Ordinary Shares issued 已發行的普通股數量
Earnings Per Share (每股盈利) measures the amount of money each shareholder would receive, if all profits were distributed at the end of the year.
Investment Appraisal 投資評估
74

Ratio Analysis
Compute the Earning per Share (EPS) for 2016.
$26,500
$22,000/$2 = $2.41/share
Net Profit after tax 稅後淨利 - Preferences Dividend 優先股息 Earning per Share每股盈利 =
No. of Ordinary Shares issued 已發行的普通股數量
2016 ($) 2015 ($)
Earnings Per Share 每股盈利 $1.77/share
75
$2.41/share
Investment Appraisal 投資評估
Much more net income is generated from each issued ordinary share in 2016 than last year.
76
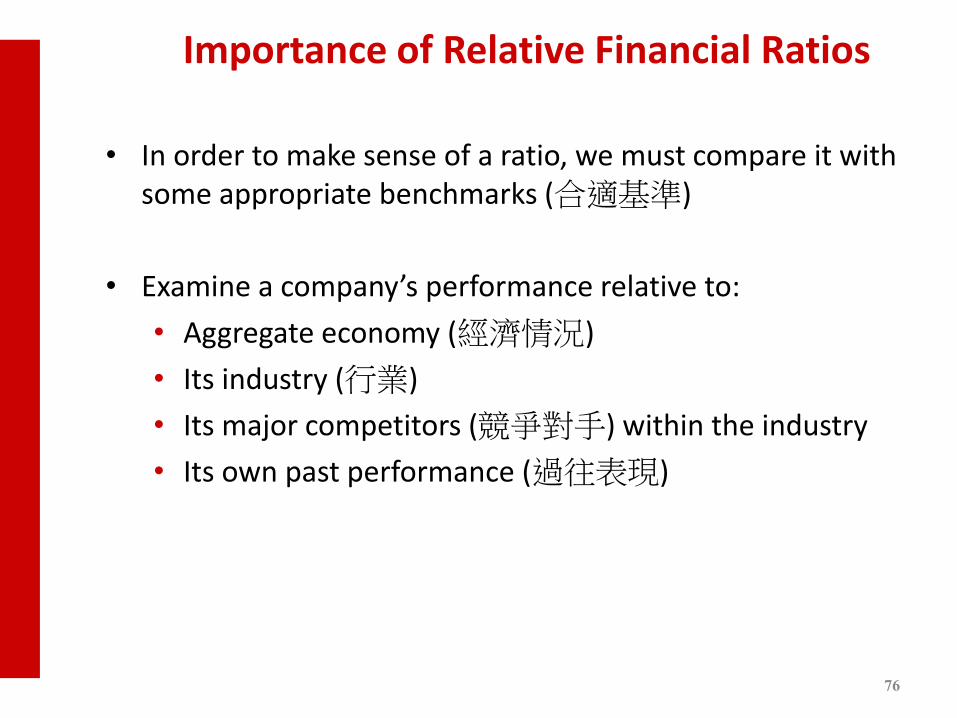
Importance of Relative Financial Ratios
• In order to make sense of a ratio, we must compare it with some appropriate benchmarks (合適基準)
• Examine a company’s performance relative to:
• Aggregate economy (經濟情況)
• Its industry (行業)
• Its major competitors (競爭對手) within the industry
• Its own past performance (過往表現)
77
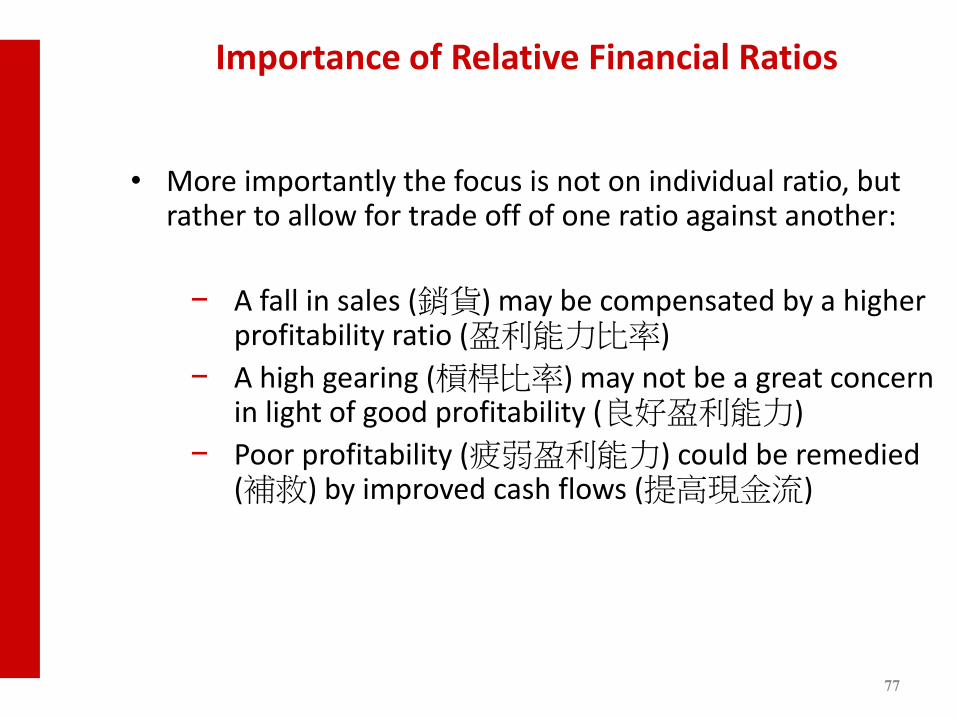
Importance of Relative Financial Ratios
• More importantly the focus is not on individual ratio, but rather to allow for trade off of one ratio against another:
− A fall in sales (銷貨) may be compensated by a higher profitability ratio (盈利能力比率)
− A high gearing (槓桿比率) may not be a great concern in light of good profitability (良好盈利能力)
− Poor profitability (疲弱盈利能力) could be remedied (補救) by improved cash flows (提高現金流)

78
ABM Limited ABM Q1Consolidated Income StatementFor the Year Ended 31 December
2016 2015HKD HKD
Turnover 450,000$ 300,000$Cost of sales 380,000 250,000Gross profit 70,000 50,000Selling and distribution 7,000 6,000Administrative expenses 30,000 20,000Operating Profit 33,000 24,000Other expenses and losses:
Finance costs 1,500 1,500Profit before tax 31,500 22,500Income tax expense 5,000 3,000Profit for the year 26,500$ 19,500$
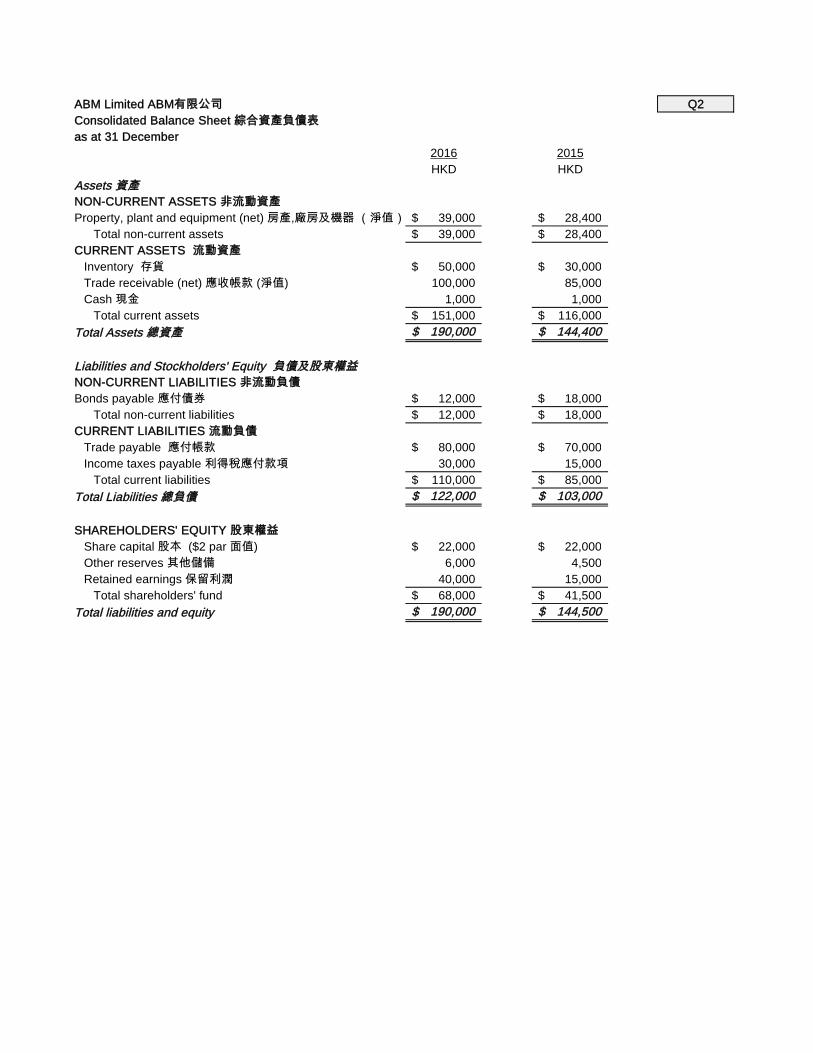
ABM Limited ABM Q2Consolidated Balance Sheetas at 31 December
2016 2015 2014HKD HKD HKD
AssetsNON-CURRENT ASSETSProperty, plant and equipment (net) 39,000$ 28,400$ 20,000
Total non-current assets 39,000$ 28,400$ 20,000$CURRENT ASSETS
Inventory 50,000$ 30,000$ 20,000Trade receivable (net) ( ) 100,000 85,000 81,000Cash 1,000 1,000 4,000
Total current assets 151,000$ 116,000$ 105,000$Total Assets 190,000$ 144,400$ 125,000$
Liabilities and Stockholders' EquityNON-CURRENT LIABILITIESBonds payable 12,000$ 18,000$ 10,000
Total non-current liabilities 12,000$ 18,000$ 10,000$CURRENT LIABILITIES
Trade payable 80,000$ 70,000$ 60,000Income taxes payable 30,000 15,000 12,000
Total current liabilities 110,000$ 85,000$ 72,000$Total Liabilities 122,000$ 103,000$ 82,000$
SHAREHOLDERS' EQUITYShare capital ($2 par ) 22,000$ 22,000$ 20,000$Other reserves 6,000 4,500 3,000Retained earnings 40,000 15,000 20,000$
Total shareholders' fund 68,000$ 41,500$ 43,000$Total liabilities and equity 190,000$ 144,500$ 125,000$
Capital Emplyed 80,000$ 59,500$ 53,000$Avverage Capital Employed 69,750$ 56,250$
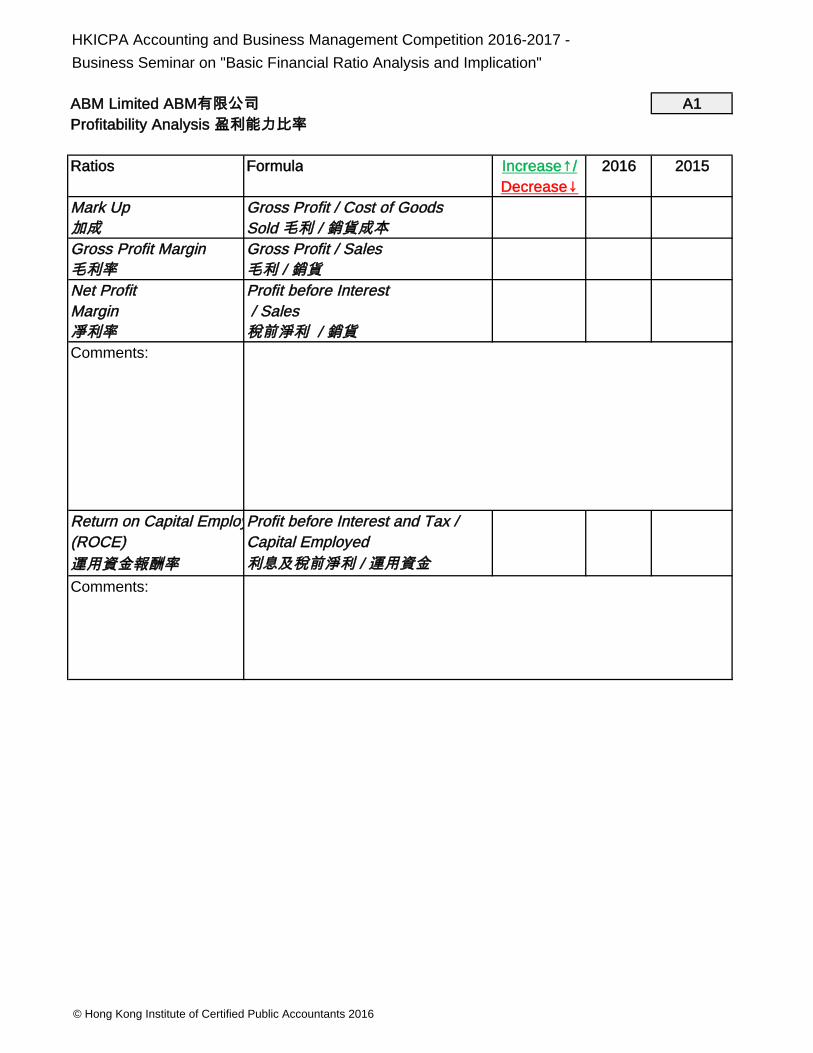
HKICPA Accounting and Business Management Competition 2016-2017 -Business Seminar on "Basic Financial Ratio Analysis and Implication"
ABM Limited ABM A1Profitability Analysis
Ratios Formula Increase / 2016 2015Decrease
Mark Up Gross Profit / Cost of GoodsSold /
Gross Profit Margin Gross Profit / Sales /
Net Profit Profit before InterestMargin / Sales
/ Comments:
Return on Capital EmployedProfit before Interest and Tax /(ROCE) Capital Employed
Comments: /
© Hong Kong Institute of Certified Public Accountants 2016
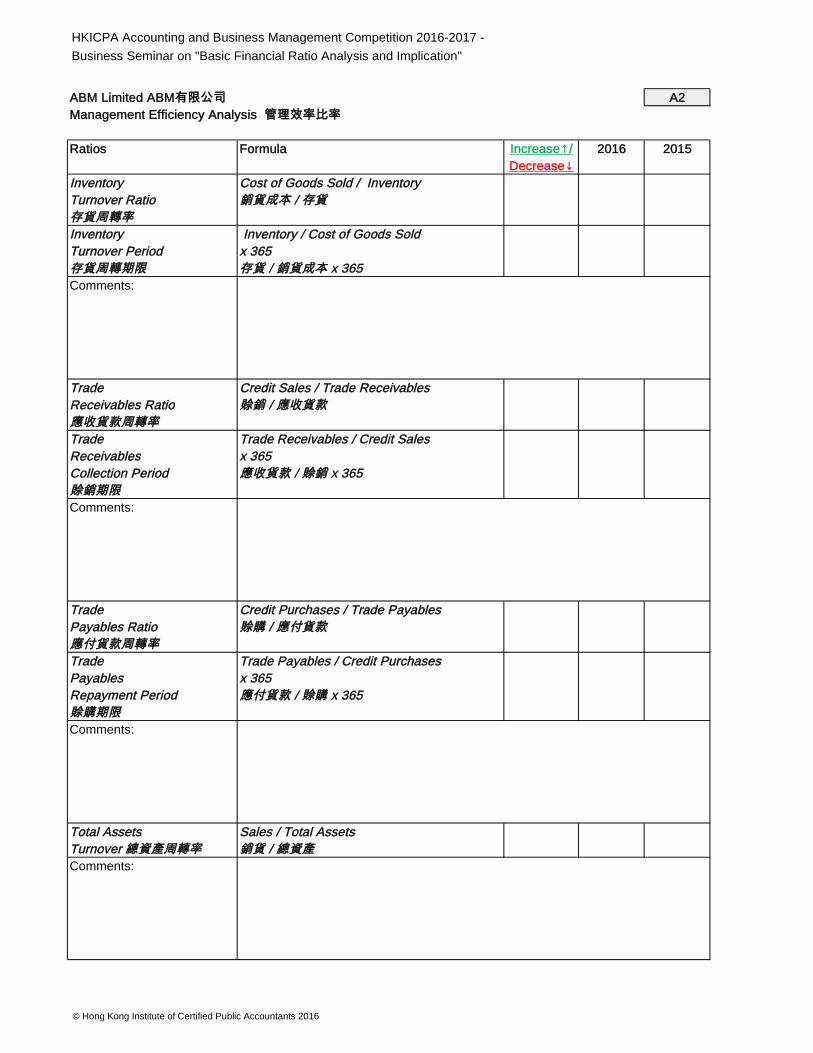
HKICPA Accounting and Business Management Competition 2016-2017 -Business Seminar on "Basic Financial Ratio Analysis and Implication"
ABM Limited ABM A2Management Efficiency Analysis
Ratios Formula Increase / 2016 2015Decrease
Inventory Cost of Goods Sold / InventoryTurnover Ratio /
Inventory Inventory / Cost of Goods SoldTurnover Period x 365
/ x 365Comments:
Trade Credit Sales / Trade ReceivablesReceivables Ratio /
Trade Trade Receivables / Credit SalesReceivables x 365Collection Period / x 365
Comments:
Trade Credit Purchases / Trade PayablesPayables Ratio /
Trade Trade Payables / Credit PurchasesPayables x 365Repayment Period / x 365
Comments:
Total Assets Sales / Total AssetsTurnover / Comments:
© Hong Kong Institute of Certified Public Accountants 2016
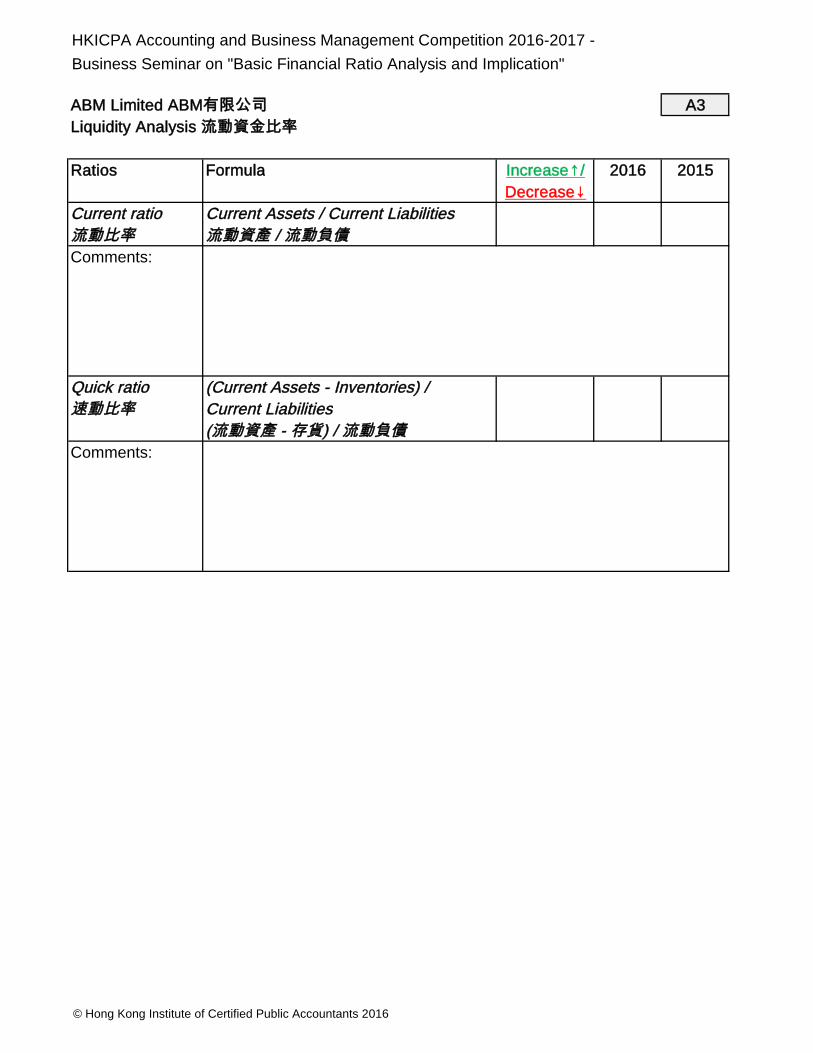
HKICPA Accounting and Business Management Competition 2016-2017 -Business Seminar on "Basic Financial Ratio Analysis and Implication"
ABM Limited ABM A3Liquidity Analysis
Ratios Formula Increase / 2016 2015Decrease
Current ratio Current Assets / Current Liabilities /
Comments:
Quick ratio (Current Assets - Inventories) / 0.92 1.01Current Liabilities
- ) / Comments:
© Hong Kong Institute of Certified Public Accountants 2016
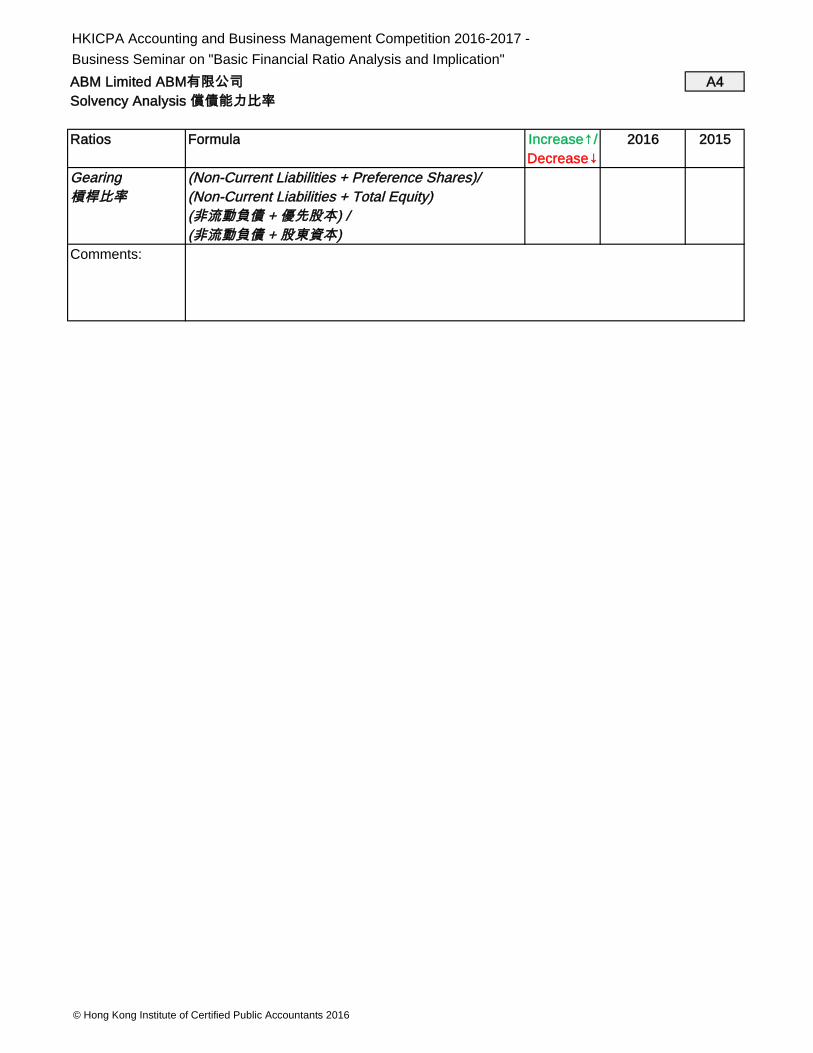
HKICPA Accounting and Business Management Competition 2016-2017 -Business Seminar on "Basic Financial Ratio Analysis and Implication"ABM Limited ABM A4Solvency Analysis
Ratios Formula Increase / 2016 2015Decrease
Gearing (Non-Current Liabilities + Preference Shares)/ 15.00% 30.25%(Non-Current Liabilities + Total Equity)
+ ) / + )
Comments:The Gearing Ratio ( ) also reflected the companyhas decreased its reliance on debt in the current year.
© Hong Kong Institute of Certified Public Accountants 2016
HKICPA Accounting and Business Management Competition 2016-2017 -Business Seminar on "Basic Financial Ratio Analysis and Implication"
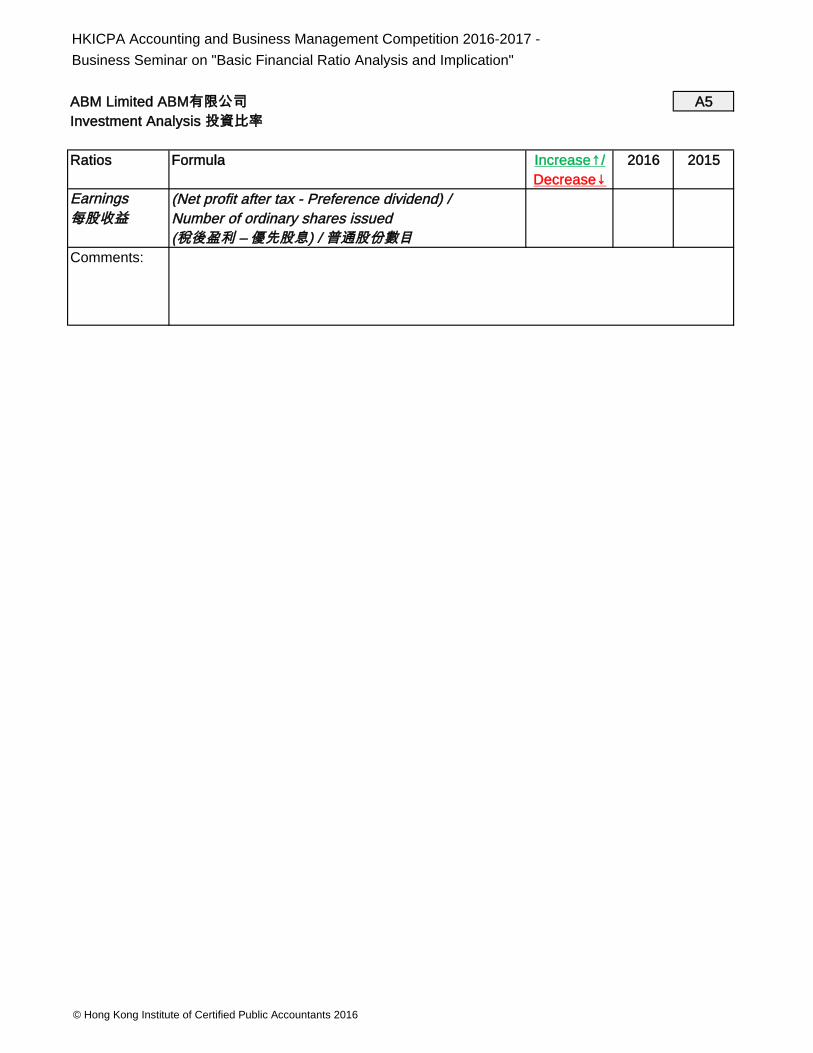
ABM Limited ABM A5Investment Analysis
Ratios Formula Increase / 2016 2015Decrease
(Net profit after tax - Preference dividend) /Number of ordinary shares issued
– ) / Comments:
Earnings
© Hong Kong Institute of Certified Public Accountants 2016


![Basel 3 & Implication[1]](https://static.fdocuments.in/doc/165x107/577d1e721a28ab4e1e8e9042/basel-3-implication1.jpg)