Basic Demographic and Socio-Economic Profile Report ... · Basic Demographic and Socio-Economic...
237
The United Republic of Tanzania Basic Demographic and Socio-Economic Profile Report Tanzania Mainland and April, 2014 Office of Chief Government Statistician Ministry of State, President Office, State House and Good Governance National Bureau of Statistics Ministry of Finance Dar es Salaam
Transcript of Basic Demographic and Socio-Economic Profile Report ... · Basic Demographic and Socio-Economic...
The United Republic of Tanzania
Basic Demographic and Socio-Economic Profile Report
Tanzania Mainland
and
April, 2014
Office of Chief Government Statistician
Ministry of State, President Office, State
House and Good Governance
National Bureau of Statistics
Ministry of Finance
Dar es Salaam
Basic Demographic and Socio-Economic Profile; Tanzania Mainland
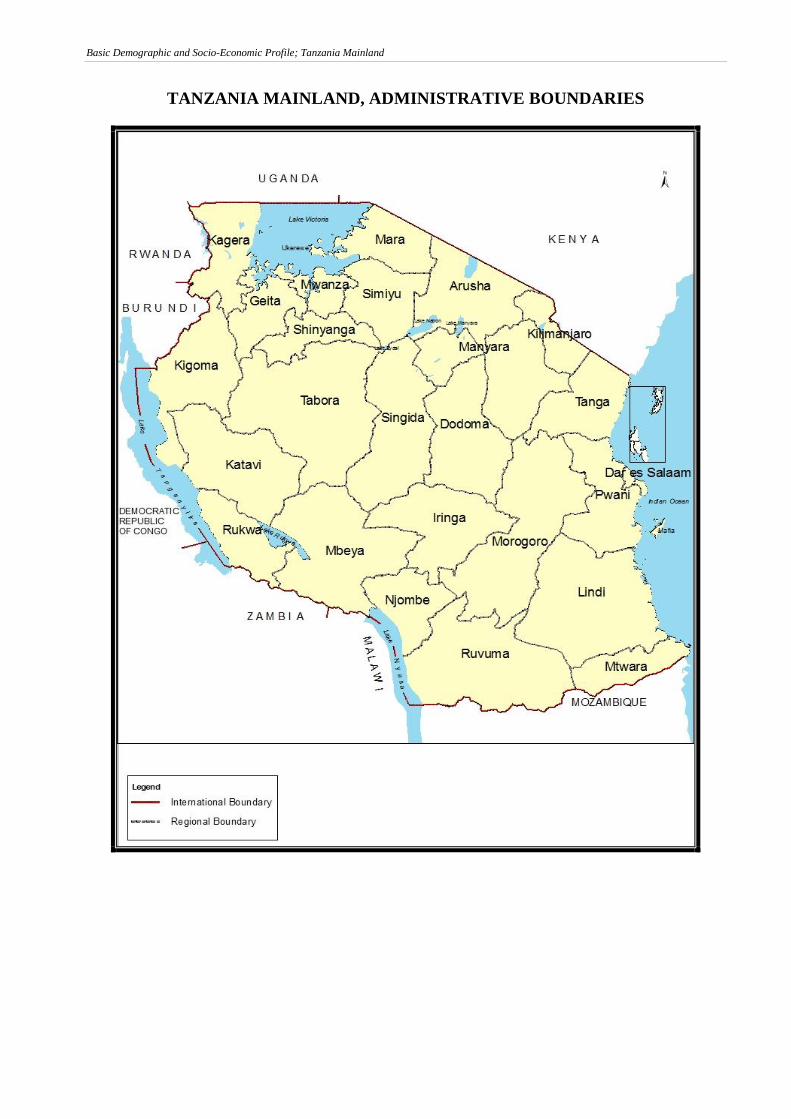
TANZANIA MAINLAND, ADMINISTRATIVE BOUNDARIES
Basic Demographic and Socio-Economic Profile; Tanzania Mainland
i
Foreword
The 2012 Population and Housing Census (PHC) for the United Republic of Tanzania was carried
out on the 26th
August, 2012. This was the fifth Census after the Union of Tanganyika and Zanzibar
in 1964. Other censuses were carried out in 1967, 1978, 1988 and 2002. The 2012 PHC, like
previous censuses, will contribute to the improvement of quality of life of Tanzanians through the
provision of current and reliable data for policy formulation, development planning and service
delivery as well as for monitoring and evaluating national and international development
frameworks.
The 2012 PHC is unique as the collected information will be used in monitoring and evaluating the
Development Vision 2025 for Tanzania Mainland and Zanzibar Development Vision 2020, Five
Year Development Plan 2011/12–2015/16, National Strategy for Growth and Reduction of Poverty
(NSGRP) commonly known as MKUKUTA and Zanzibar Strategy for Growth and Reduction of
Poverty (ZSGRP) commonly known as MKUZA. The Census will also provide information for the
evaluation of the Millennium Development Goals (MDGs) in 2015. The Poverty Monitoring
Master Plan, which is the monitoring tool for NSGRP and ZSGRP, mapped out core indicators for
poverty monitoring against the sequence of surveys, with the 2012 PHC being one of them. Several
of these core indicators for poverty monitoring are measured directly from the 2012 PHC. The
Census provides a denominator for the determination of other indicators such as enrolment and
literacy rates, infant and maternal mortality rates, unemployment rate and others.
The success of the census depended upon the cooperation and contributions from the Government,
development partners, various institutions and the public at large. A special word of thanks should
go to Government leaders at all levels particularly, Minister for Finance; Minister of State,
President‟s Office, Finance, Economy and Development Planning, Zanzibar; Members of
Parliament; Members of House of Representatives; Councilors; Regional and District Census
Committees chaired by Regional and District Commissioners; Supervisors; Field Assistants;
Enumerators; Local Leaders and Heads of households.
Our special gratitude should go to the following; DfID, Government of Japan, JICA, UNDP,
UNFPA, UNICEF, USAID, World Bank and other development partners for providing assistance
in terms of equipment, long and short term consultancies, training and funding. We would like to
thank religious and political party leaders, as well as Non-Governmental Organisations (NGOs),
Basic Demographic and Socio-Economic Profile; Tanzania Mainland
ii
mass media and the general public for their contribution towards successful implementation of the
Census.
Last but not least, we would wish to acknowledge the vital contributions to the Census project by
Hajjat Amina Mrisho Said, the 2012 Commissioner for Population and Housing Census and Mr.
Mwalim Haji Ameir, the Census Commissar for Zanzibar. Special thanks should also go to the
Management and staff of the National Bureau of Statistics (NBS) and Office of Chief Government
Statistician, Zanzibar (OCGS). Their commitment and dedication made significant contribution to
the overall efficiency of the Census operations. We would also like to convey our appreciation to
all other Government Officials who worked tirelessly to ensure successful implementation of the
2012 Population and Housing Census.
April, 2014
Hon. Mizengo Peter Pinda (MP),
Prime Minister, United Republic of Tanzania
Hon. Ambassador Seif Ali Iddi (MP and MHR),
Second Vice President, Zanzibar
Basic Demographic and Socio-Economic Profile; Tanzania Mainland
iii
Executive Summary
The 2012 Tanzania Mainland Basic Demographic and Socio-Economic Profile provides a short
descriptive analysis and related tables on main thematic areas covered in the 2012 Population and
Housing Census. Areas covered are population size; growth and distribution; age and sex profile;
household composition; marital status; citizenship; birth registration and disability. Other topics are
survival of parents; education and literacy; economic activity; housing conditions; household assets
and amenities; agriculture and livestock; fertility and mortality. In many cases, characteristics have
been disaggregated by location (rural and urban) and where possible comparisons have been made
with past Census(es) to observe the trend over time. Related tables are presented in a separate
publication (Detailed Statistical Tables for Tanzania Mainland Basic Demographic and Socio-
Economic Profile - Volume IIIE).
The new topics that were covered in 2012 PHC for the first time since 1967 which was the first
Census after the Union of Tanganyika and Zanzibar were; Birth Registration, Agriculture and
Livestock, Day Population, Diaspora, Social Security Schemes, Refuse Disposal, Cause of Death
and Maternal Health.
Chapter One presents an overview of the 2012 Population and Housing Census. The Chapter
highlights the brief history of census undertaking in the country, main objective of undertaking the
2012 PHC, preparation and execution of Census activities and highlights challenges associated with
age data in most developing countries including Tanzania. Subsequently, it is observed that the
2012 PHC data is affected by misreporting of age and sex data. Evidence shows strong preference
for ages ending in digits “0” and “5”, and avoidance of ages ending in digits “1”, “3” and “9”. Age
misreporting is generally higher among females compared to males. Nonetheless, this may not
affect the quality of indicators derived from the census data as there are internationally
recommended procedures for correcting the anomalies.
Chapter Two gives a user of this publication an understanding of the size, growth and distribution
of Tanzania Mainland population from the 2012 PHC and previous censuses. The chapter reveals
that Tanzania Mainland had a population of 43.6 million in 2012 with a sex ratio of 95. Population
of Tanzania Mainland is growing at a rate of 2.7 percent annually, representing an increase of 30
percent over a 10 year period since 2002. This rate of increase is higher even by African standards.
With this growth, the population of Tanzania Mainland will double in the next 26 years.
Basic Demographic and Socio-Economic Profile; Tanzania Mainland
iv
Furthermore the results show that Tanzania Mainland population is predominantly rural with 71
percent of total population living in Rural Areas.
Chapter Three is about age and sex profile of the Tanzania Mainland population. The chapter gives
population by major age groups and sex. The data depicts a young population age structure with a
median age of 18 years. Forty four (44) percent of the population is aged below 15 years, and only
four (4) percent is aged 65 years and above. The results also depict a higher percentage of females
compared to males in almost all age groups, except below 10 years, 50 – 54 and 55 – 59 years.
Household composition is explained in Chapter Four. Tanzania Mainland had a total of 9,026,785
private households, out of which 6,054,641 (67 percent) were in Rural Areas and 2,972,144 (33
percent) were in Urban Areas. Two thirds of households in both Rural and Urban Areas were
headed by males. Percentage of households in Urban Areas had increased from 26 percent in 2002
Census to 33 percent in 2012 Census indicating an increasing level of urbanization in the country.
Average household size was 4.7 persons per household. Rural households were found to have an
average household size of 5.0 persons per household which is relatively larger than urban
households (4.2 persons per household). On the other hand, female headed households were twice
as big as those headed by males. Average number of persons per household in female headed
households was 7.3 compared to 3.5 for male headed households.
Chapter Five reveals that marriage is almost universal in the country. Over fifty percent of persons
in age groups 25–74 are either married or living together. The trend being that as age increases the
proportion of the never married category decreases. Comparison between 2002 and 2012 censuses
show that there were changes in the proportion of marital status categories between the two
censuses. The results also show that, females get married at a younger age than males. The Mean
Age at First Marriage in 2012 was 25.7 years for males and 22.3 years females. The Mean Age at
First Marriage for females increased slightly from 21.1 years in 2002 to 22.3 in 2012. Likewise the
Mean Age at First Marriage for males slightly decreased from 25.8 to 25.7 years over the same
period.
Citizenship and Birth Registration is found in Chapter Six. Results revealed that 99 percent of the
enumerated populations were Tanzanians. Majority of foreigners were from neighbouring countries
of Burundi, Democratic Republic of Congo, Kenya, Uganda and Rwanda. A large number of
Burundians may be explained by refugees who were in Tanzania at the time of 2012 PHC. On the
Basic Demographic and Socio-Economic Profile; Tanzania Mainland
v
other hand, India and China represented a relatively large number of Asians in the country. Other
countries with significant number of foreigners in the country were Great Britain and United States
of America.
Furthermore, it was noted that despite, an intensified campaign to issue birth certificates, only
thirteen (13) percent of Tanzania Mainland population had birth certificates. The number of persons
with birth certificates was higher among younger persons than older population indicating an
improvement in registration activities in recent years.
Chapter Seven provides information regarding survival of parents. Results revealed that 70 percent
of all persons in Tanzania Mainland and 92 percent of all children below 18 years had both parents
alive. The results further showed that one (1) percent of population below 18 years had both
parents‟ dead. However, in international and Tanzania context, “orphan” is a person who has lost
one or both parents. By that broad definition, eight (8) percent of the population were orphans.
Incidences of orphanhood were highest in Iringa Region (14.4 percent) followed by Njombe
Region (13.8 percent) and lowest was in Kigoma Region (5.8 percent).
The 2012 PHC collected data on diaspora. Households were asked to state if there was any
member(s) of the household who was living outside the country at the time of the census and
whether households received any remittance. Chapter Eight reveals that one (1) percent of total
private households in Tanzania Mainland reported to have at least one former member of the
household who was living abroad. Results reveal that 405,417 persons were living abroad at the
time of the Census. Most of the diasporas were living in Kenya, Mozambique, USA, Zambia,
Uganda and Great Britain. On remittances, results show that 16 percent of diasporas sent
remittances to Tanzania Mainland 12 months prior the 2012 Census.
Chapter Nine gives Census results on literacy and education. The general literacy rate (i.e. literacy
among population aged 5 years and above) was 72 percent. Literacy rate was highest for five year
age groups between 10 and 44 years and was also higher among the urban population (89 percent)
than the rural population (64 percent). Adult literacy rate (i.e. literacy rate for population aged 15
years and above) was 78 percent and higher in Urban Areas (92 percent) than in Rural Areas (71
percent). Adult literacy for males (83 percent) was significantly higher than that of females (73
percent). Adult literacy rates vary among regions, ranging from 96 percent in Dar es Salaam to 59
percent in Tabora. Comparison between 2002 and 2012 revealed an increase in level of literacy in
Basic Demographic and Socio-Economic Profile; Tanzania Mainland
vi
Tanzania. Literacy rate for persons aged five (5) years and above increased from 63 percent in 2002
to 72 percent in 2012 while adult literacy increased from 69 percent in 2002 to 78 percent in 2012.
Census results show an improvement in primary school enrolment. Net Enrolment Ratio (NER)
increased from 69 percent in 2002 to 77 in 2012. In 2012, NER was higher in urban areas (91
percent) than in Rural Areas (72 percent). Female net enrolment ratio at 78 percent was relatively
higher than that of males at 75 percent. At least nine (9) in every ten (94 percent) of the school age
children were enrolled in schools (irrespective of the ages of the enrolled children). Gross
enrolment ratio was higher in urban areas (109 percent) compared to rural areas (90 percent). There
were differences in gross enrolment among sexes in both rural and urban areas.
The 2012 PHC collected data on usual and current economic activities among population aged 10
years and above. Chapter Ten shows that 64 percent of the total population aged 10 years and
above was employed in the 12 months prior to Census night. Results also indicate that three (3)
percent of the population was unemployed. A slight difference is observed with regard to current
activity where results show that 61 percent were employed. Results further show that 63 percent of
the employed persons were engaged in agriculture. Main occupation among majority of working
population in Tanzania Mainland was farming (63 percent) followed by elementary occupation (6
percent).
Chapter Eleven deals with disability. Disability statistics were collected based on activity limitation
rather than physical condition. Persons with disabilities in this publication are those persons with
long-term physical, mental, intellectual or sensory impairment which, in interaction with various
barriers, may hinder their full and effective participation in society on an equal footing with others.
Difficulty in seeing was the most common type of disability reported. About two (2) percent of the
population reported having this type of disability. Other disabilities reported were difficult in
walking (1.2 percent), hearing (1.0 percent), remembering (0.9), self-care (0.7) and albinism (0.04
percent).
Information on housing conditions, assets and amenities is given in Chapter Twelve. The results
show that, three quarters of the households were living in their own houses. However percentage of
households in Urban Areas living in their own houses was 47 percent. Thirty one (31) percent of
house owners had no legal right over the land where the house was built. Majority of land
ownership was customary (51 percent). The 2012 PHC also collected information on the building
Basic Demographic and Socio-Economic Profile; Tanzania Mainland
vii
material of the main house. Results showed that 66 percent of all private households had used
modern materials (65 percent iron sheets, 0.4 percent tiles, 0.2 percent concrete and 0.3 percent
asbestos) as main roofing material. Usage of modern roofing materials was higher in Urban Areas
(93 percent) compared with 53 percent in Rural Areas. Data on type of flooring materials revealed
that 61 percent of total private households had used earth or sand as main flooring materials and
only 36 percent used cement. Fifty four (54) percent of all private households in Tanzania
Mainland had their houses‟ walls built of sundried or baked bricks (27 percent each). Other
commonly used wall materials were poles and mud (24 percent) and cement bricks (19 percent). On
room occupancy, results show that 62 percent of the households in Tanzania Mainland had one or
two rooms used for sleeping.
As for the main source of drinking water, overall 36 of all households used piped water as their
main source of drinking water (11 percent had water piped into their houses, eight (8) percent piped
into yard and 17 percent used public taps). In urban areas percentage of households using piped
water was 58 percent compared to 25 percent in rural area where the main source was unprotected
dug well (25 percent).
Use of modern sources of energy (electricity or gas) for cooking in Tanzania Mainland was low
even in urban areas. Only three (3) percent of households reported using modern source of energy
for cooking. Majority of households (94 percent) used wood-fuel (68.6 percent firewood and 25.6
percent charcoal) as the main source of energy for cooking. As for source of energy for lighting, 58
percent of all households used kerosene (in wick lamps, lantern or chimney) for lighting. Main
source of energy in urban areas was electricity (48 percent) compared to kerosene in wick lamps
(51 percent) for rural areas. Percentage of households using electricity as the main source of
energy for lighting has more than doubled since 2002. Twenty one percent of households reported
using electricity for lighting in 2012 compared to 10 percent in 2002.
With regard to toilet facilities, most of the private households used pit latrine without washable
slab/soil slab (31 percent) and pit latrine without slab/open pit (28 percent) on the other hand eight
(8) percent of the households had no toilet facilities.
Basic Demographic and Socio-Economic Profile; Tanzania Mainland
viii
Thirty seven percent of households reported to bury or use of pit as the most common type of
refuse disposal and only 5 percent of households reported that household refuse was regularly
collected.
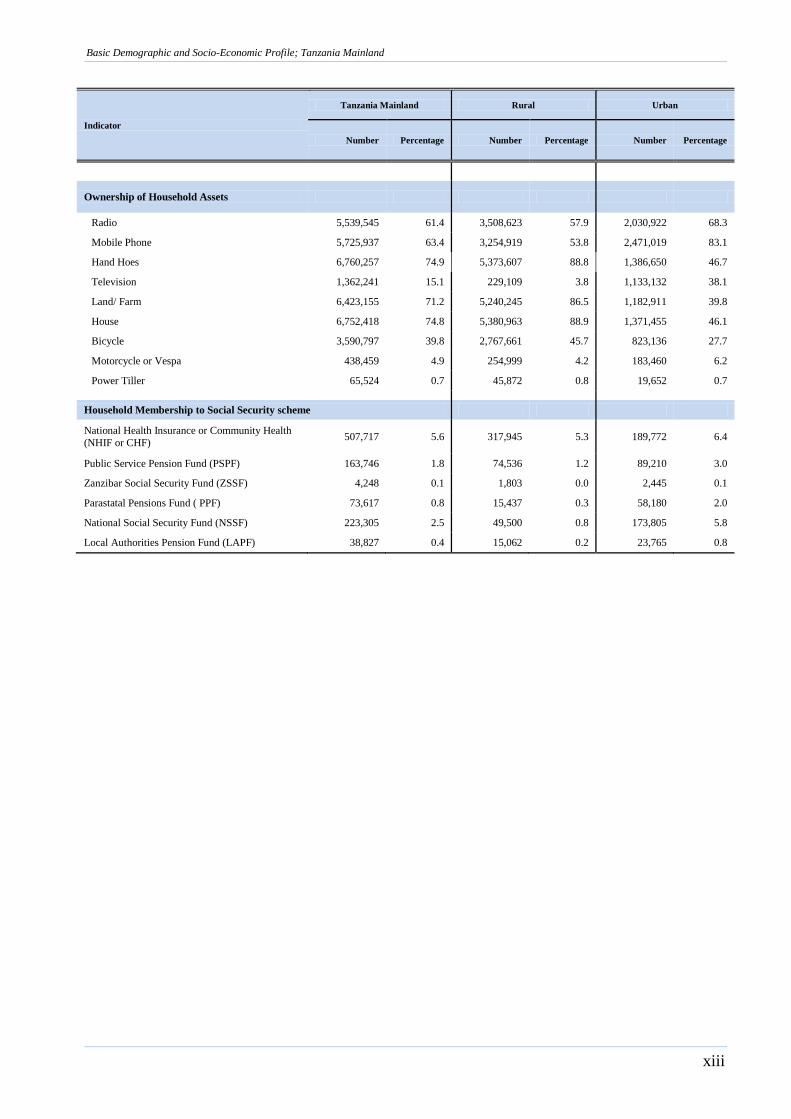
Concerning ownership of assets, results show that a hand hoe and house was the most owned asset
by household (75 percent each) followed by land or farm (71 percent), mobile phones (63 percent)
and radio(61 percent) . Ownership of assets was higher among male-headed than female-headed
households.
The 2012 Population and Housing Census collected data on agriculture for the purpose of obtaining
a frame that can be used in conducting future agriculture sample censuses and surveys. Agriculture
continues to be main activity for the majority of Tanzania Mainland private households. Results
revealed that 66 percent of all private households in the country were engaged in agricultural
activities during the 2011/12 agricultural season. Agriculture is also an economic activity even in
Urban Areas where 15 percent of urban households reported to be engaged in agriculture in
2011/12 season. Forty two percent of all private households reported keeping at least one livestock
on a Census night. However, fish farming was not common in Tanzania Mainland as only less than
one (1) percent of households reported the activity.
To avoid production of voluminous reports, the NBS has decided to produce three different
publications on Basic Demographic and Socio-Economic Profiles for United Republic of Tanzania
(Vol. IIIA), Tanzania Mainland (Vol. IIIB) and Tanzania Zanzibar (Vol. IIIC). Separate
publications titled Detailed Statistical Tables for Basic Demographic and Socio-Economic Profiles
were also produced (Vol. IIID - National, Vol. IIIE – Tanzania Mainland and Vol. IIIF – Tanzania
Zanzibar). These publications are available on the NBS and OCGS websites via web database for
easy access.
Basic Demographic and Socio-Economic Profile; Tanzania Mainland
ix
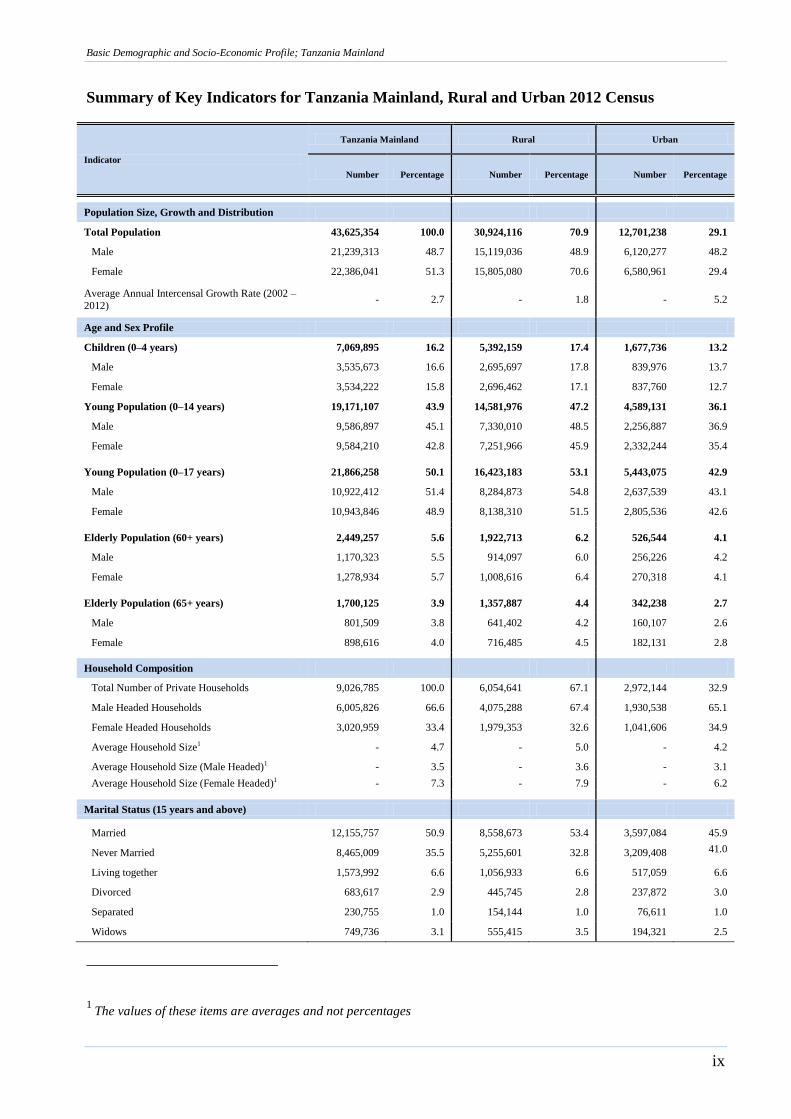
Summary of Key Indicators for Tanzania Mainland, Rural and Urban 2012 Census
Indicator
Tanzania Mainland Rural Urban
Number Percentage Number Percentage Number Percentage
Population Size, Growth and Distribution
Total Population 43,625,354 100.0 30,924,116 70.9 12,701,238 29.1
Male 21,239,313 48.7 15,119,036 48.9 6,120,277 48.2
Female 22,386,041 51.3 15,805,080 70.6 6,580,961 29.4
Average Annual Intercensal Growth Rate (2002 –
2012) - 2.7 - 1.8 - 5.2
Age and Sex Profile
Children (0–4 years) 7,069,895 16.2 5,392,159 17.4 1,677,736 13.2
Male 3,535,673 16.6 2,695,697 17.8 839,976 13.7
Female 3,534,222 15.8 2,696,462 17.1 837,760 12.7
Young Population (0–14 years) 19,171,107 43.9 14,581,976 47.2 4,589,131 36.1
Male 9,586,897 45.1 7,330,010 48.5 2,256,887 36.9
Female 9,584,210 42.8 7,251,966 45.9 2,332,244 35.4
Young Population (0–17 years) 21,866,258 50.1 16,423,183 53.1 5,443,075 42.9
Male 10,922,412 51.4 8,284,873 54.8 2,637,539 43.1
Female 10,943,846 48.9 8,138,310 51.5 2,805,536 42.6
Elderly Population (60+ years) 2,449,257 5.6 1,922,713 6.2 526,544 4.1
Male 1,170,323 5.5 914,097 6.0 256,226 4.2
Female 1,278,934 5.7 1,008,616 6.4 270,318 4.1
Elderly Population (65+ years) 1,700,125 3.9 1,357,887 4.4 342,238 2.7
Male 801,509 3.8 641,402 4.2 160,107 2.6
Female 898,616 4.0 716,485 4.5 182,131 2.8
Household Composition
Total Number of Private Households 9,026,785 100.0 6,054,641 67.1 2,972,144 32.9
Male Headed Households 6,005,826 66.6 4,075,288 67.4 1,930,538 65.1
Female Headed Households 3,020,959 33.4 1,979,353 32.6 1,041,606 34.9
Average Household Size1 - 4.7 - 5.0 - 4.2
Average Household Size (Male Headed)1 - 3.5 - 3.6 - 3.1
Average Household Size (Female Headed)1 - 7.3 - 7.9 - 6.2
Marital Status (15 years and above)
Married 12,155,757 50.9 8,558,673 53.4 3,597,084 45.9
Never Married 8,465,009 35.5 5,255,601 32.8 3,209,408 41.0
Living together 1,573,992 6.6 1,056,933 6.6 517,059 6.6
Divorced 683,617 2.9 445,745 2.8 237,872 3.0
Separated 230,755 1.0 154,144 1.0 76,611 1.0
Widows 749,736 3.1 555,415 3.5 194,321 2.5
1 The values of these items are averages and not percentages
Basic Demographic and Socio-Economic Profile; Tanzania Mainland
x
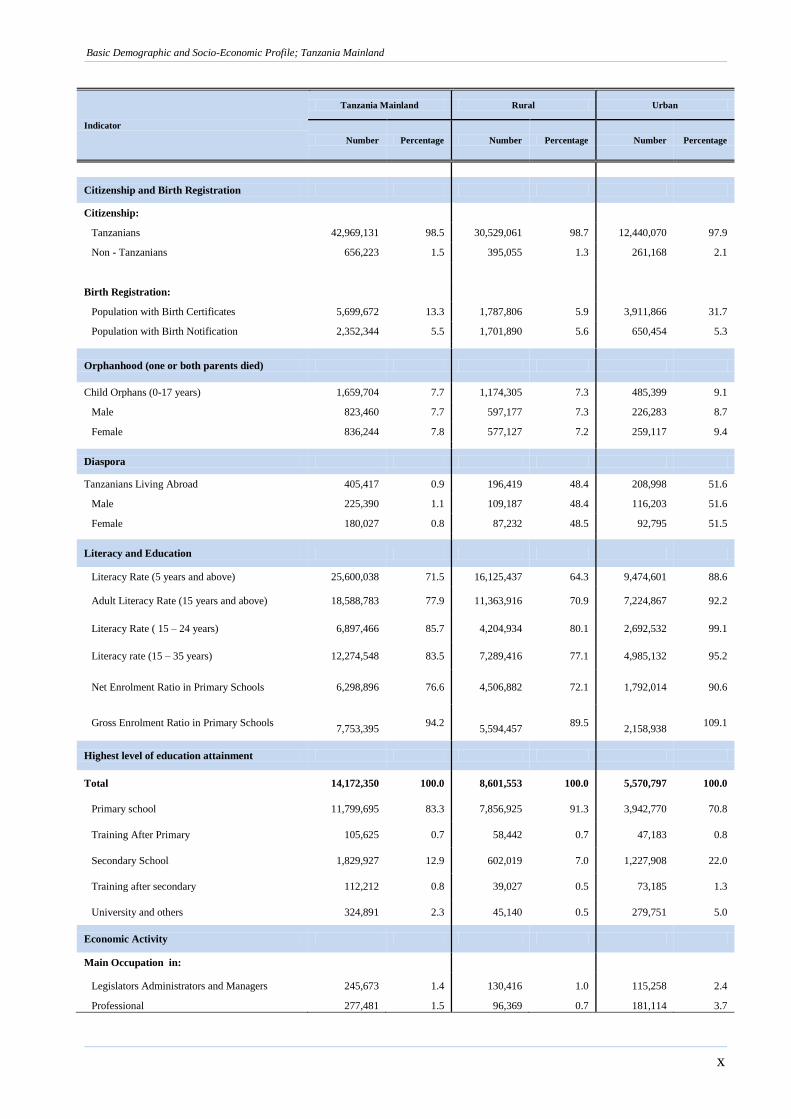
Indicator
Tanzania Mainland Rural Urban
Number Percentage Number Percentage Number Percentage
Citizenship and Birth Registration
Citizenship:
Tanzanians 42,969,131 98.5 30,529,061 98.7 12,440,070 97.9
Non - Tanzanians 656,223 1.5 395,055 1.3 261,168 2.1
Birth Registration:
Population with Birth Certificates 5,699,672 13.3 1,787,806 5.9 3,911,866 31.7
Population with Birth Notification 2,352,344 5.5 1,701,890 5.6 650,454 5.3
Orphanhood (one or both parents died)
Child Orphans (0-17 years) 1,659,704 7.7 1,174,305 7.3 485,399 9.1
Male 823,460 7.7 597,177 7.3 226,283 8.7
Female 836,244 7.8 577,127 7.2 259,117 9.4
Diaspora
Tanzanians Living Abroad 405,417 0.9 196,419 48.4 208,998 51.6
Male 225,390 1.1 109,187 48.4 116,203 51.6
Female 180,027 0.8 87,232 48.5 92,795 51.5
Literacy and Education
Literacy Rate (5 years and above) 25,600,038 71.5 16,125,437 64.3 9,474,601 88.6
Adult Literacy Rate (15 years and above) 18,588,783 77.9 11,363,916 70.9 7,224,867 92.2
Literacy Rate ( 15 – 24 years) 6,897,466 85.7 4,204,934 80.1 2,692,532 99.1
Literacy rate (15 – 35 years) 12,274,548 83.5 7,289,416 77.1 4,985,132 95.2
Net Enrolment Ratio in Primary Schools 6,298,896 76.6 4,506,882 72.1 1,792,014 90.6
Gross Enrolment Ratio in Primary Schools
7,753,395 94.2
5,594,457 89.5
2,158,938 109.1
Highest level of education attainment
Total 14,172,350 100.0 8,601,553 100.0 5,570,797 100.0
Primary school 11,799,695 83.3 7,856,925 91.3 3,942,770 70.8
Training After Primary 105,625 0.7 58,442 0.7 47,183 0.8
Secondary School 1,829,927 12.9 602,019 7.0 1,227,908 22.0
Training after secondary 112,212 0.8 39,027 0.5 73,185 1.3
University and others 324,891 2.3 45,140 0.5 279,751 5.0
Economic Activity
Main Occupation in:
Legislators Administrators and Managers 245,673 1.4 130,416 1.0 115,258 2.4
Professional 277,481 1.5 96,369 0.7 181,114 3.7
Basic Demographic and Socio-Economic Profile; Tanzania Mainland
xi
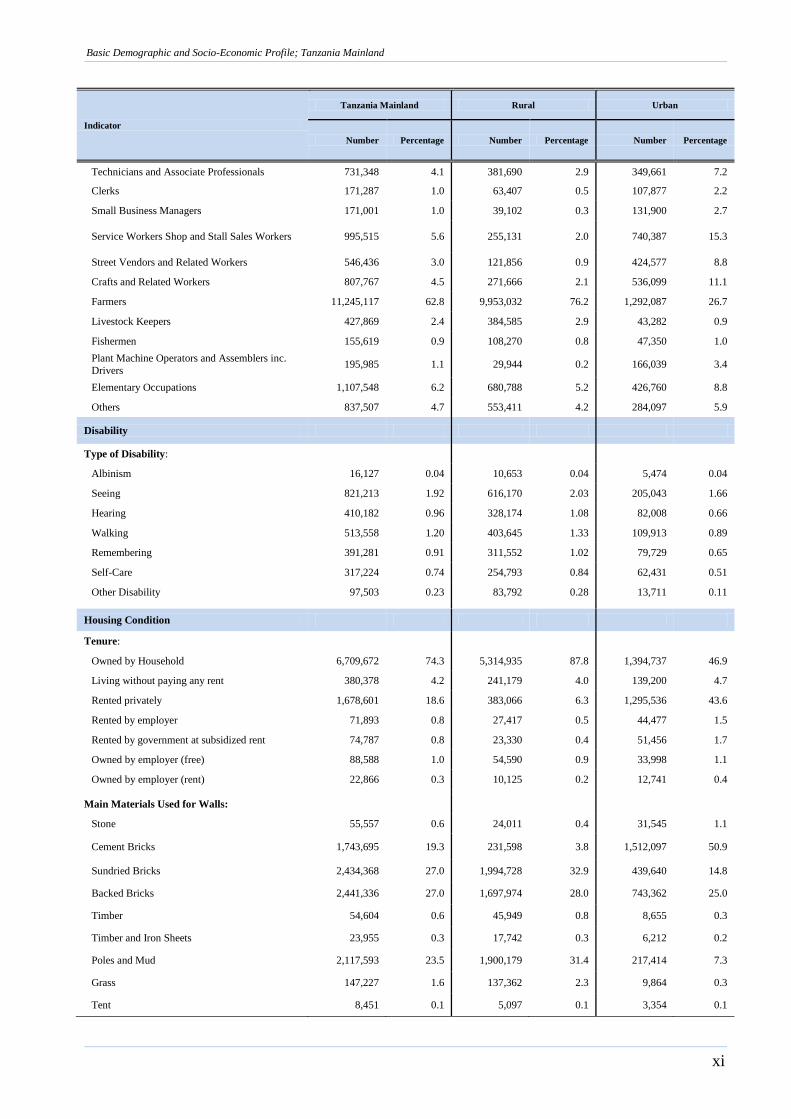
Indicator
Tanzania Mainland Rural Urban
Number Percentage Number Percentage Number Percentage
Technicians and Associate Professionals 731,348 4.1 381,690 2.9 349,661 7.2
Clerks 171,287 1.0 63,407 0.5 107,877 2.2
Small Business Managers 171,001 1.0 39,102 0.3 131,900 2.7
Service Workers Shop and Stall Sales Workers 995,515 5.6 255,131 2.0 740,387 15.3
Street Vendors and Related Workers 546,436 3.0 121,856 0.9 424,577 8.8
Crafts and Related Workers 807,767 4.5 271,666 2.1 536,099 11.1
Farmers 11,245,117 62.8 9,953,032 76.2 1,292,087 26.7
Livestock Keepers 427,869 2.4 384,585 2.9 43,282 0.9
Fishermen 155,619 0.9 108,270 0.8 47,350 1.0
Plant Machine Operators and Assemblers inc.
Drivers 195,985 1.1 29,944 0.2 166,039 3.4
Elementary Occupations 1,107,548 6.2 680,788 5.2 426,760 8.8
Others 837,507 4.7 553,411 4.2 284,097 5.9
Disability
Type of Disability:
Albinism 16,127 0.04 10,653 0.04 5,474 0.04
Seeing 821,213 1.92 616,170 2.03 205,043 1.66
Hearing 410,182 0.96 328,174 1.08 82,008 0.66
Walking 513,558 1.20 403,645 1.33 109,913 0.89
Remembering 391,281 0.91 311,552 1.02 79,729 0.65
Self-Care 317,224 0.74 254,793 0.84 62,431 0.51
Other Disability 97,503 0.23 83,792 0.28 13,711 0.11
Housing Condition
Tenure:
Owned by Household 6,709,672 74.3 5,314,935 87.8 1,394,737 46.9
Living without paying any rent 380,378 4.2 241,179 4.0 139,200 4.7
Rented privately 1,678,601 18.6 383,066 6.3 1,295,536 43.6
Rented by employer 71,893 0.8 27,417 0.5 44,477 1.5
Rented by government at subsidized rent 74,787 0.8 23,330 0.4 51,456 1.7
Owned by employer (free) 88,588 1.0 54,590 0.9 33,998 1.1
Owned by employer (rent) 22,866 0.3 10,125 0.2 12,741 0.4
Main Materials Used for Walls:
Stone 55,557 0.6 24,011 0.4 31,545 1.1
Cement Bricks 1,743,695 19.3 231,598 3.8 1,512,097 50.9
Sundried Bricks 2,434,368 27.0 1,994,728 32.9 439,640 14.8
Backed Bricks 2,441,336 27.0 1,697,974 28.0 743,362 25.0
Timber 54,604 0.6 45,949 0.8 8,655 0.3
Timber and Iron Sheets 23,955 0.3 17,742 0.3 6,212 0.2
Poles and Mud 2,117,593 23.5 1,900,179 31.4 217,414 7.3
Grass 147,227 1.6 137,362 2.3 9,864 0.3
Tent 8,451 0.1 5,097 0.1 3,354 0.1
Basic Demographic and Socio-Economic Profile; Tanzania Mainland
xii
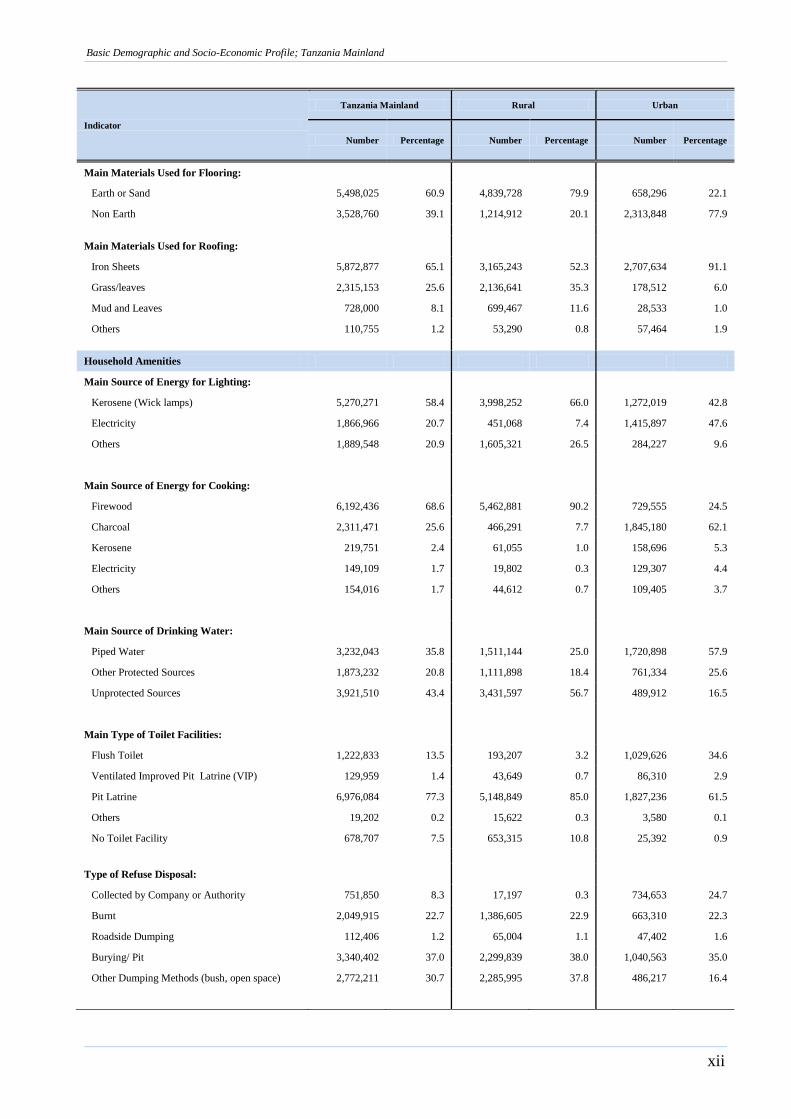
Indicator
Tanzania Mainland Rural Urban
Number Percentage Number Percentage Number Percentage
Main Materials Used for Flooring:
Earth or Sand 5,498,025 60.9 4,839,728 79.9 658,296 22.1
Non Earth 3,528,760 39.1 1,214,912 20.1 2,313,848 77.9
Main Materials Used for Roofing:
Iron Sheets 5,872,877 65.1 3,165,243 52.3 2,707,634 91.1
Grass/leaves 2,315,153 25.6 2,136,641 35.3 178,512 6.0
Mud and Leaves 728,000 8.1 699,467 11.6 28,533 1.0
Others 110,755 1.2 53,290 0.8 57,464 1.9
Household Amenities
Main Source of Energy for Lighting:
Kerosene (Wick lamps) 5,270,271 58.4 3,998,252 66.0 1,272,019 42.8
Electricity 1,866,966 20.7 451,068 7.4 1,415,897 47.6
Others 1,889,548 20.9 1,605,321 26.5 284,227 9.6
Main Source of Energy for Cooking:
Firewood 6,192,436 68.6 5,462,881 90.2 729,555 24.5
Charcoal 2,311,471 25.6 466,291 7.7 1,845,180 62.1
Kerosene 219,751 2.4 61,055 1.0 158,696 5.3
Electricity 149,109 1.7 19,802 0.3 129,307 4.4
Others 154,016 1.7 44,612 0.7 109,405 3.7
Main Source of Drinking Water:
Piped Water 3,232,043 35.8 1,511,144 25.0 1,720,898 57.9
Other Protected Sources 1,873,232 20.8 1,111,898 18.4 761,334 25.6
Unprotected Sources 3,921,510 43.4 3,431,597 56.7 489,912 16.5
Main Type of Toilet Facilities:
Flush Toilet 1,222,833 13.5 193,207 3.2 1,029,626 34.6
Ventilated Improved Pit Latrine (VIP) 129,959 1.4 43,649 0.7 86,310 2.9
Pit Latrine 6,976,084 77.3 5,148,849 85.0 1,827,236 61.5
Others 19,202 0.2 15,622 0.3 3,580 0.1
No Toilet Facility 678,707 7.5 653,315 10.8 25,392 0.9
Type of Refuse Disposal:
Collected by Company or Authority 751,850 8.3 17,197 0.3 734,653 24.7
Burnt 2,049,915 22.7 1,386,605 22.9 663,310 22.3
Roadside Dumping 112,406 1.2 65,004 1.1 47,402 1.6
Burying/ Pit 3,340,402 37.0 2,299,839 38.0 1,040,563 35.0
Other Dumping Methods (bush, open space) 2,772,211 30.7 2,285,995 37.8 486,217 16.4
Basic Demographic and Socio-Economic Profile; Tanzania Mainland
xiii
Indicator
Tanzania Mainland Rural Urban
Number Percentage Number Percentage Number Percentage
Ownership of Household Assets
Radio 5,539,545 61.4 3,508,623 57.9 2,030,922 68.3
Mobile Phone 5,725,937 63.4 3,254,919 53.8 2,471,019 83.1
Hand Hoes 6,760,257 74.9 5,373,607 88.8 1,386,650 46.7
Television 1,362,241 15.1 229,109 3.8 1,133,132 38.1
Land/ Farm 6,423,155 71.2 5,240,245 86.5 1,182,911 39.8
House 6,752,418 74.8 5,380,963 88.9 1,371,455 46.1
Bicycle 3,590,797 39.8 2,767,661 45.7 823,136 27.7
Motorcycle or Vespa 438,459 4.9 254,999 4.2 183,460 6.2
Power Tiller 65,524 0.7 45,872 0.8 19,652 0.7
Household Membership to Social Security scheme
National Health Insurance or Community Health
(NHIF or CHF) 507,717 5.6 317,945 5.3 189,772 6.4
Public Service Pension Fund (PSPF) 163,746 1.8 74,536 1.2 89,210 3.0
Zanzibar Social Security Fund (ZSSF) 4,248 0.1 1,803 0.0 2,445 0.1
Parastatal Pensions Fund ( PPF) 73,617 0.8 15,437 0.3 58,180 2.0
National Social Security Fund (NSSF) 223,305 2.5 49,500 0.8 173,805 5.8
Local Authorities Pension Fund (LAPF) 38,827 0.4 15,062 0.2 23,765 0.8
Basic Demographic and Socio-Economic Profile; Tanzania Mainland
xiv
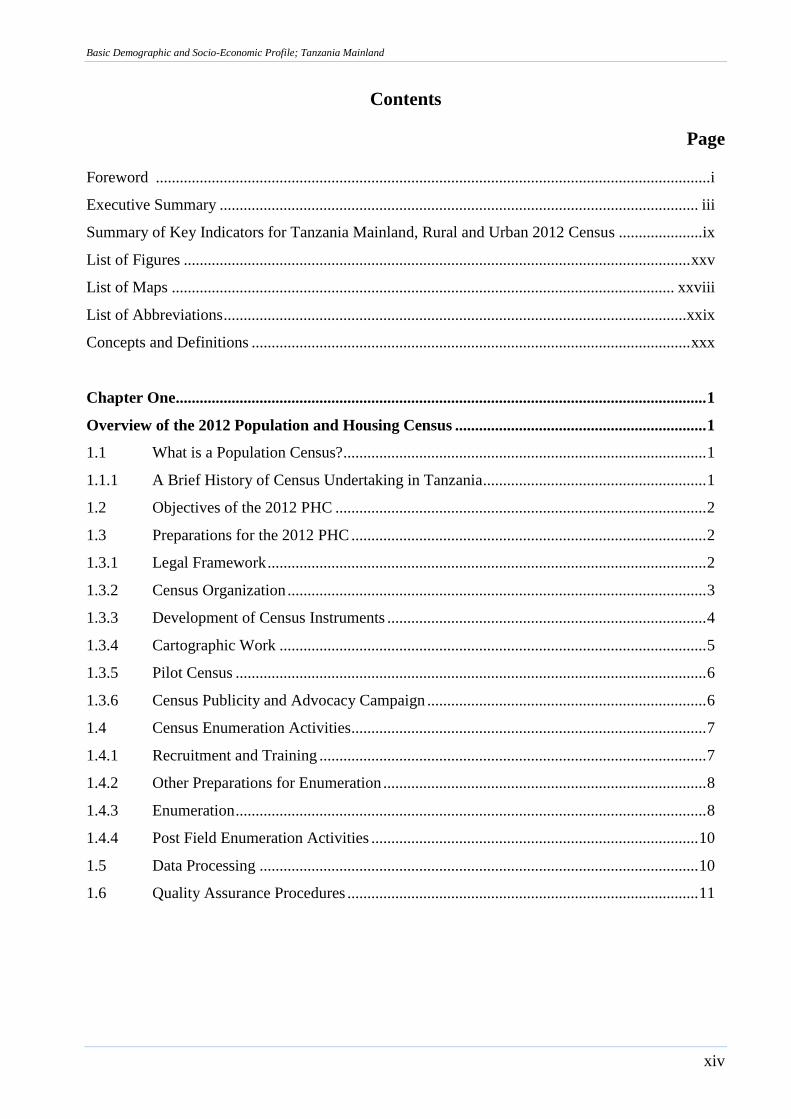
Contents
Page
Foreword ........................................................................................................................................... i
Executive Summary ........................................................................................................................ iii
Summary of Key Indicators for Tanzania Mainland, Rural and Urban 2012 Census ..................... ix
List of Figures ............................................................................................................................... xxv
List of Maps .............................................................................................................................. xxviii
List of Abbreviations .................................................................................................................... xxix
Concepts and Definitions .............................................................................................................. xxx
Chapter One ..................................................................................................................................... 1
Overview of the 2012 Population and Housing Census ............................................................... 1
1.1 What is a Population Census? ........................................................................................... 1
1.1.1 A Brief History of Census Undertaking in Tanzania ........................................................ 1
1.2 Objectives of the 2012 PHC ............................................................................................. 2
1.3 Preparations for the 2012 PHC ......................................................................................... 2
1.3.1 Legal Framework .............................................................................................................. 2
1.3.2 Census Organization ......................................................................................................... 3
1.3.3 Development of Census Instruments ................................................................................ 4
1.3.4 Cartographic Work ........................................................................................................... 5
1.3.5 Pilot Census ...................................................................................................................... 6
1.3.6 Census Publicity and Advocacy Campaign ...................................................................... 6
1.4 Census Enumeration Activities ......................................................................................... 7
1.4.1 Recruitment and Training ................................................................................................. 7
1.4.2 Other Preparations for Enumeration ................................................................................. 8
1.4.3 Enumeration ...................................................................................................................... 8
1.4.4 Post Field Enumeration Activities .................................................................................. 10
1.5 Data Processing .............................................................................................................. 10
1.6 Quality Assurance Procedures ........................................................................................ 11
Basic Demographic and Socio-Economic Profile; Tanzania Mainland
xv
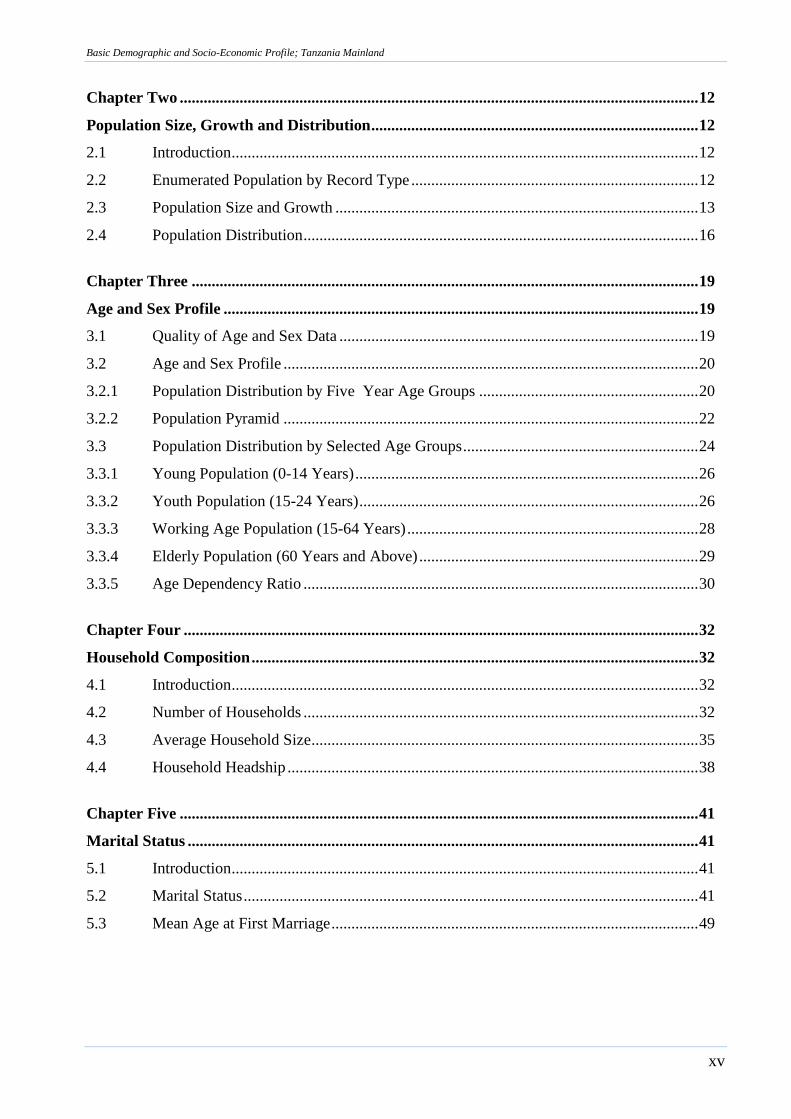
Chapter Two .................................................................................................................................. 12
Population Size, Growth and Distribution .................................................................................. 12
2.1 Introduction ..................................................................................................................... 12
2.2 Enumerated Population by Record Type ........................................................................ 12
2.3 Population Size and Growth ........................................................................................... 13
2.4 Population Distribution ................................................................................................... 16
Chapter Three ............................................................................................................................... 19
Age and Sex Profile ....................................................................................................................... 19
3.1 Quality of Age and Sex Data .......................................................................................... 19
3.2 Age and Sex Profile ........................................................................................................ 20
3.2.1 Population Distribution by Five Year Age Groups ....................................................... 20
3.2.2 Population Pyramid ........................................................................................................ 22
3.3 Population Distribution by Selected Age Groups ........................................................... 24
3.3.1 Young Population (0-14 Years) ...................................................................................... 26
3.3.2 Youth Population (15-24 Years) ..................................................................................... 26
3.3.3 Working Age Population (15-64 Years) ......................................................................... 28
3.3.4 Elderly Population (60 Years and Above) ...................................................................... 29
3.3.5 Age Dependency Ratio ................................................................................................... 30
Chapter Four ................................................................................................................................. 32
Household Composition ................................................................................................................ 32
4.1 Introduction ..................................................................................................................... 32
4.2 Number of Households ................................................................................................... 32
4.3 Average Household Size ................................................................................................. 35
4.4 Household Headship ....................................................................................................... 38
Chapter Five .................................................................................................................................. 41
Marital Status ................................................................................................................................ 41
5.1 Introduction ..................................................................................................................... 41
5.2 Marital Status .................................................................................................................. 41
5.3 Mean Age at First Marriage ............................................................................................ 49
Basic Demographic and Socio-Economic Profile; Tanzania Mainland
xvi
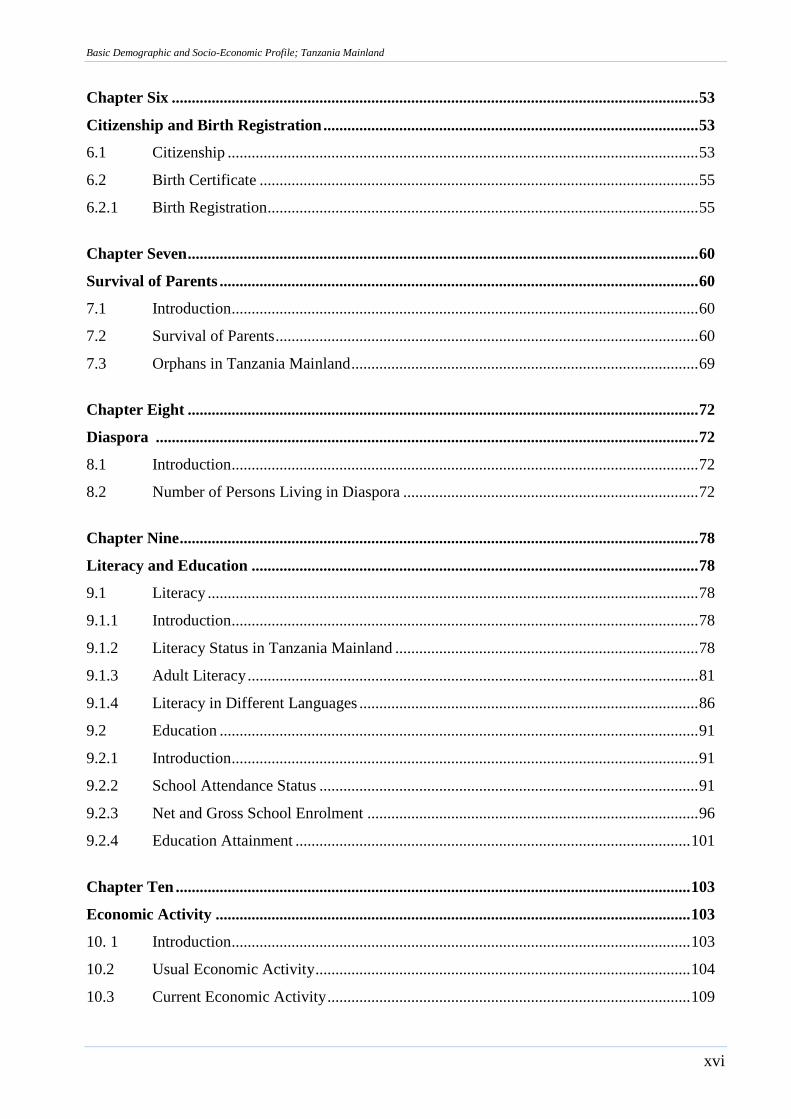
Chapter Six .................................................................................................................................... 53
Citizenship and Birth Registration .............................................................................................. 53
6.1 Citizenship ...................................................................................................................... 53
6.2 Birth Certificate .............................................................................................................. 55
6.2.1 Birth Registration ............................................................................................................ 55
Chapter Seven ................................................................................................................................ 60
Survival of Parents ........................................................................................................................ 60
7.1 Introduction ..................................................................................................................... 60
7.2 Survival of Parents .......................................................................................................... 60
7.3 Orphans in Tanzania Mainland ....................................................................................... 69
Chapter Eight ................................................................................................................................ 72
Diaspora ........................................................................................................................................ 72
8.1 Introduction ..................................................................................................................... 72
8.2 Number of Persons Living in Diaspora .......................................................................... 72
Chapter Nine .................................................................................................................................. 78
Literacy and Education ................................................................................................................ 78
9.1 Literacy ........................................................................................................................... 78
9.1.1 Introduction ..................................................................................................................... 78
9.1.2 Literacy Status in Tanzania Mainland ............................................................................ 78
9.1.3 Adult Literacy ................................................................................................................. 81
9.1.4 Literacy in Different Languages ..................................................................................... 86
9.2 Education ........................................................................................................................ 91
9.2.1 Introduction ..................................................................................................................... 91
9.2.2 School Attendance Status ............................................................................................... 91
9.2.3 Net and Gross School Enrolment ................................................................................... 96
9.2.4 Education Attainment ................................................................................................... 101
Chapter Ten ................................................................................................................................. 103
Economic Activity ....................................................................................................................... 103
10. 1 Introduction ................................................................................................................... 103
10.2 Usual Economic Activity .............................................................................................. 104
10.3 Current Economic Activity ........................................................................................... 109
Basic Demographic and Socio-Economic Profile; Tanzania Mainland
xvii
10.4 Employment Status ....................................................................................................... 114
10.5 Main Occupation .......................................................................................................... 118
10.6. Main Industry ................................................................................................................ 122
Chapter Eleven ............................................................................................................................ 126
Disability ...................................................................................................................................... 126
11.1 Introduction ................................................................................................................... 126
11.2 Persons with Disabilities Five Year Age Groups ......................................................... 126
11.3. Population with Albinism ............................................................................................. 128
Chapter Twelve ........................................................................................................................... 134
Housing Conditions, Household Assets and Amenities ............................................................ 134
12.1 Introduction ................................................................................................................... 134
12.2 Ownership Status of the Main Dwelling Used by the Household ................................ 134
12.3 Legal Right over the Ownership of Land Where the Main House is Built .................. 135
12.4 Building Materials for Roofing .................................................................................... 136
12.5 Building Materials for Flooring .................................................................................... 138
12.6 Building Materials for Walls ........................................................................................ 140
12.7 Rooms for Sleeping ...................................................................................................... 142
12.8 Source of Drinking Water ............................................................................................. 144
12.9 Source of Energy .......................................................................................................... 147
12.9.1 Source of Energy for Cooking ...................................................................................... 147
12.9.2 Source of Energy for Lighting ...................................................................................... 149
12.10 Type of Toilet Facility .................................................................................................. 153
12.11 Refuse Disposal ............................................................................................................ 156
12.12 Ownership of Assets ..................................................................................................... 158
12.13 Social Security Schemes ............................................................................................... 162
Chapter Thirteen ......................................................................................................................... 164
Agriculture and Livestock .......................................................................................................... 164
13.0 Introduction ................................................................................................................... 164
13.1 Agricultural Households ............................................................................................... 164
13.2 Livestock and Poultry ................................................................................................... 167
13.3 Fish Farming ................................................................................................................. 174
References ..................................................................................................................................... 175
Annexes: Questionnaires ............................................................................................................... 176
Basic Demographic and Socio-Economic Profile; Tanzania Mainland
xviii
List of Tables
Table 2. 1: Enumerated Population by Record Type, Rural and Urban Areas, Tanzania
Mainland, 2012 Census ............................................................................................. 13
Table 2. 2: Enumerated Population by Record Type and Sex, Tanzania Mainland, 2012
Census ........................................................................................................................ 13
Table 2. 3: Population Size and Growth Rate by Region, Tanzania Mainland, 1988 to 2012
Censuses .................................................................................................................... 14
Table 2. 4: Population Distribution by Rural and Urban Areas, Tanzania Mainland, 2012
Census ........................................................................................................................ 17
Table 2. 5: Population Size and Growth by Region, Rural and Urban Areas, Tanzania
Mainland, ................................................................................................................... 18
Table 3. 1: Population Distribution by Five Year Age Groups and Sex, Tanzania Mainland,
2012 Census ............................................................................................................... 20
Table 3. 2: Population Distribution by Five Year Age Groups and Sex, Tanzania Mainland
Rural, ......................................................................................................................... 21
Table 3. 3: Population Distribution by Five Year Age Groups and Sex, Tanzania Mainland
Urban, ........................................................................................................................ 21
Table 3. 4: Population Distribution by Key Age Groups, Tanzania Mainland, 2012 Census ..... 25
Table 4. 1: Total Number of Private Households by Age and Sex of Head of Household,
Tanzania Mainland, 2012 Census .............................................................................. 33
Table 4. 2: Number and Percentage of Private Households by Region, Rural and Urban
Residence, .................................................................................................................. 34
Table 4. 3: Population Size, Number of Households and Average Household Size by
Region, Tanzania Mainland, 2002 to 2012 Censuses ................................................ 37
Table 4. 4: Average Household Size by Region and Sex of Household Head, Tanzania
Mainland, 2012 Census ............................................................................................. 40
Table 5. 1: Percentage of Population Aged 15 Years and Above by Five Year Age Groups
and Marital Status, Tanzania Mainland, 2012 Census .............................................. 42
Table 5. 2: Percentage of Male Population Aged 15 Years and Above by Five Year Age
Groups and Marital Status, Tanzania Mainland, 2012 Census .................................. 44
Table 5. 3: Percentage of Female Population Aged 15 Years and Above by Five Year Age
Groups and Marital Status, Tanzania Mainland, 2012 Census .................................. 44
Table 5. 4: Percentage of Population Aged 15 Years and Above by Five Year Age Groups
and Marital Status, Tanzania Mainland Rural, 2012 Census .................................... 45
Basic Demographic and Socio-Economic Profile; Tanzania Mainland
xix
Table 5. 5: Percentage of Male Population Aged 15 Years and Above by Five Year Age
Groups and Marital Status, Tanzania Mainland Rural, 2012 Census ........................ 45
Table 5. 6: Percentage of Female Population Aged 15 Years and Above by Five Year Age
Groups and Marital Status, Tanzania Mainland Rural, 2012 Census ........................ 46
Table 5. 7: Percentage of Population Aged 15 Years and Above by Five Year Age Groups
and Marital Status, Tanzania Mainland Urban, 2012 Census ................................... 46
Table 5. 8: Percentage of Male Population Aged 15 Years and Above by Five Year Age
Groups and Marital Status, Tanzania Mainland Urban, 2012 Census ....................... 47
Table 5. 9: Percentage of Female Population Aged 15 Years and Above by Five Year Age
Groups and Marital Status, Tanzania Mainland Urban, 2012 Census ....................... 47
Table 5. 10: Percentage of Population Aged 15 Years and Above by Region and Marital
Status, ........................................................................................................................ 48
Table 5. 11: Mean Age at First Marriage by Region, Tanzania Mainland, 2002 and 2012
Censuses .................................................................................................................... 51
Table 6. 1: Number and Percentage of Enumerated Population by Citizenship and Sex, ........... 54
Table 6. 2: Percentage Population by Status of Birth Certificate by Five Year Age Group
and Sex, ..................................................................................................................... 56
Table 6. 3: Percentage Population by Status of Birth Certificate by Five Year Age Group
and Sex, ..................................................................................................................... 57
Table 6. 4: Percentage Population by Status of Birth Certificate by Five Year Age Group
and Sex, ..................................................................................................................... 57
Table 6. 5: Percentage Population by Status of Birth Certificate, Region and Sex, Tanzania
Mainland, 2012 Census ............................................................................................. 59
Table 7. 1: Population Distribution by Age Groups and Survival of Parents, Tanzania
Mainland, 2012 Census ............................................................................................. 61
Table 7. 2: Male Population Distribution by Age Groups and Survival of Parents, ................... 61
Table 7. 3: Female Population Distribution by Age Groups and Survival of Parents, ................ 62
Table 7. 4: Regional Distribution of Persons by Survival Status of Parents, Tanzania
Mainland, 2012 Census ............................................................................................. 63
Table 7. 5: Regional Distribution of Male Population by Survival Status of Parents, ................ 64
Table 7. 6: Regional Distribution of Female Population by Survival Status of Parents, ............. 65
Table 7. 7: Regional Distribution of Persons by Survival Status of Parents, .............................. 66
Table 7. 8: Regional Distribution of Persons by Survival Status of Parents, Tanzania
Mainland Urban, ........................................................................................................ 67
Basic Demographic and Socio-Economic Profile; Tanzania Mainland
xx
Table 7. 9: Percentage of Persons by Selected Age Groups and Survival of Parents,
Tanzania Mainland, ................................................................................................... 68
Table 7. 10: Percentage of Male Population by Selected Age Groups and Survival of Parents,
Tanzania Mainland, 2012 Census .............................................................................. 68
Table 7. 11: Percentage of Female Population by Selected Age Groups and Survival of
Parents, Tanzania Mainland,2012 Census ................................................................. 68
Table 7. 12: Percentage of Persons by Selected Age Groups and Survival of Parents,
Tanzania Mainland Rural, ......................................................................................... 69
Table 7. 13: Percentage of Persons by Selected Age Groups and Survival of Parents,
Tanzania Mainland Urban, 2012 Census ................................................................. 69
Table 7. 14: Regional Percentage of Children below Age 18 Years by Survival of Parents,
Tanzania Mainland, 2012 Census .............................................................................. 71
Table 8. 1: Number and Percentage of Households with Diaspora by Region, Rural and
Urban Areas, Tanzania Mainland, 2012 Census ....................................................... 73
Table 8. 2: Number and Percentage of Households with Diaspora by Number of Persons
Living Abroad, Tanzania Mainland, 2012 Census .................................................... 74
Table 8. 3: Number and Percentage of Tanzanians as Reported at Household Level Living
Outside Tanzania by Country of Residence, Place of Origin (Rural or Urban)
Areas, Tanzania Mainland, 2012 Census .................................................................. 75
Table 8. 4: Number and Percentage of Tanzanians as Reported at Household Level living
abroad by Country of Residence and Sex, Tanzania Mainland, 2012 Census .......... 76
Table 8. 5: Number and Percentage of Diaspora Sending Remittance from Abroad,
Tanzania Mainland, ................................................................................................... 77
Table 9. 1: Population of Age Five Years and Above by Sex, Five Year Age Groups and
Literacy, Tanzania Mainland, 2012 Census .............................................................. 79
Table 9. 2: Population of Age Five Years and Above by Sex, Five Year Age Groups and
Literacy, Tanzania Mainland Rural, 2012 Census .................................................... 79
Table 9. 3: Population of Age Five Years and Above by Sex, Five Year Age Groups and
Literacy, Tanzania Mainland Urban, 2012 Census ................................................... 80
Table 9. 4: Literacy Rates of Population Aged 15 Years and Above by Five Year Age
Groups, Sex, Rural and Urban Areas, Tanzania Mainland, 2012 Census ................. 81
Table 9. 5: Comparison of Literacy Rates for Persons Aged 15 Years and Above by Sex and
Region, Tanzania Mainland, 2002 and 2012 Censuses ............................................. 85
Table 9. 6: Percentage of Population Aged FiveYears and Above by Five Year Age Groups
and Literacy Status, Tanzania Mainland, 2012 Census ............................................. 87
Basic Demographic and Socio-Economic Profile; Tanzania Mainland
xxi
Table 9. 7: Percentage of Population Aged Five Years and Above by Sex and Region,
Literacy Status, Rural and Urban Areas, Tanzania Mainland, 2012 Census ............. 89
Table 9. 8: Percentage of Population Aged Five Years and Above by Sex and School
Attendance Status, Tanzania Mainland, 2012 Census ............................................... 92
Table 9. 9: Percentage of Population Aged Five Years and Above by Sex and School
Attendance Status, Tanzania Mainland Rural, 2012 Census ..................................... 94
Table 9. 10: Percentage of Population Aged Five Years and Above by Sex and School
Attendance Status, Tanzania Mainland Urban, 2012 Census .................................... 95
Table 9. 11: Net Enrolment Ratios in Primary Schools by Region, Sex, Rural and Urban
Areas, Tanzania Mainland, 2012 Census .................................................................. 99
Table 9. 12: Distribution of Population Aged Five Years and Above by Sex and Level of
Educational Attainment, Tanzania Mainland, 2012 Census .................................... 101
Table 10. 1: Percentage of Population Aged 10 Years and Above by Five Year Age Groups
and Type of Usual Activity, Tanzania Mainland, 2012 Census .............................. 104
Table 10. 2: Percentage of Population Aged 10 Years and Above by Five Year Age Groups
and Type of Usual Activity, Tanzania Mainland Rural, 2012 Census .................... 105
Table 10. 3: Percentage of Population Aged 10 Years and Above by Five Year Age Groups
and Type of Usual Activity, Tanzania Mainland Urban, 2012 Census ................... 106
Table 10. 4: Percentage of Population Aged 10 Years and Above by Five Year Age Groups
and Type of Usual Activity, Tanzania Mainland Males, 2012 Census ................... 106
Table 10. 5: Percentage of Population Aged 10 Years and Above by Five Year Age Groups
and Type of Usual Activity, Tanzania Mainland Females, 2012 Census ................ 107
Table 10. 6: Percentage of Population Aged 10 Years and Above by Type of Usual Economic
Activity (Last 12 Months) by Region, Tanzania Mainland, 2012 Census .............. 108
Table 10. 7: Percentage of Population Aged 10 Years and Above by Five Year Age Groups
and Type of Current Activity, Tanzania Mainland, 2012 Census ........................... 109
Table 10. 8: Percentage of Population Aged 10 Years and Above by Five Year Age Groups
and Type of Current Activity, Tanzania Mainland Rural, 2012 Census ................. 110
Table 10. 9: Percentage of Population Aged 10 Years and Above by Five Year Age Groups
and Type of Current Activity, Tanzania Mainland Urban, 2012 Census ................ 111
Table 10. 10: Percentage of Population Aged 10 Years and Above by Five Year Age Groups
and Type of Current Activity, Tanzania Mainland, Males, 2012 Census ............... 112
Table 10. 11: Percentage of Population Aged 10 Years and Above by Five Year Age Groups
and Type of Current Activity, Tanzania Mainland, Females, 2012 Census ............ 112
Table 10.12: Percentage of Population Aged 10 Years and Above by Type of Current
Economic Activity (Last 7 Days) by Region, Tanzania Mainland, 2012 Census ... 113
Basic Demographic and Socio-Economic Profile; Tanzania Mainland
xxii
Table 10. 13: Distribution of Employed Population Aged 10 Years and Above by Five Year
Age Groups and Employment Status, Tanzania Mainland, 2012 Census ............... 114
Table 10. 14: Distribution of Employed Population Aged 10Years and Above by Five Year
Age Groups and Employment Status, Tanzania Mainland Rural, 2012 Census ..... 115
Table 10. 15: Distribution of Employed Population Aged 10 Years and Above by Five Year
Age Groups and Employment Status, Tanzania Mainland Urban, 2012 Census .... 115
Table 10. 16: Distribution of Employed Population Aged 10 Years and Above by Five Year
Age Groups and Employment Status, Tanzania Mainland, Male, 2012 Census ..... 116
Table 10. 17: Distribution of Employed Population Aged 10 Years and Above by Five Year
Age Groups and Employment Status, Tanzania Mainland, Female, 2012 Census . 116
Table 10. 18: Distribution of Employed Population Aged 10 Years and Above by Employment
Status and Region, Tanzania Mainland, 2012 Census ............................................. 117
Table 10. 19: Distribution of Employed Population of Age 10 Years and Above by 10 Year
Age Groups and Main Occupation, Tanzania Mainland, 2012 Census ................... 119
Table 10. 20: Distribution of Employed Population of Age 10 Years and Above by Main
Occupation and Region, Tanzania Mainland, 2012 Census .................................... 120
Table 10. 21: Percentage of Employed Population of Ten Years and Above by Five Year Age
Groups and Main Industry, Tanzania Mainland, 2012 Census ............................... 123
Table 10. 22: Percentage of Employed Population of Age 10 Years and Above by Main
Industry and Region, Tanzania Mainland, 2012 Census ......................................... 124
Table 11. 1: Number of Persons with Disability by Type of Disability and Region, Tanzania
Mainland, 2012 Census ........................................................................................... 127
Table 11. 2: Number and Percentage of Persons with Albinism by Five Year Age Groups and
Sex, Tanzania Mainland, 2012 Census .................................................................... 128
Table 11. 3: Number and Percentage of Persons with Albinism by Five Year Age Group and
Sex, Tanzania Mainland Rural, 2012 Census .......................................................... 129
Table 11. 4: Number and Percentage of Persons with Albinism by Five Year Age Group and
Sex, Tanzania Mainland Urban, 2012 Census ......................................................... 129
Table 11. 5: Percentage of Persons with Disabilities by 10 Year Age Groups, Type of
Disability and Sex, Tanzania Mainland, 2012 Census ............................................ 131
Table 11. 6: Percentage of Persons with Disabilities by 10 Year Age Groups, Type of
Disability and Sex, Tanzania Mainland Rural, 2012 Census .................................. 133
Table 11. 7: Percentage of Persons with Disabilities by 10 Year Age Groups, Type of
Disability and Sex, Tanzania Mainland Urban, 2012 Census ................................. 133
Table 12. 1: Percentage of Households by Ownership Status of the Main House, Tanzania
Mainland, 2012 Census ........................................................................................... 134
Basic Demographic and Socio-Economic Profile; Tanzania Mainland
xxiii
Table 12. 2: Percentage of Households by Tenure Status and Age of the Household Head,
Tanzania Mainland, ................................................................................................. 135
Table 12. 3: Percentage of Households by Type of Legal Rights over the Ownership of the
Land where the Main Dwelling is built, Tanzania Mainland, 2012 Census............ 136
Table 12. 4: Percentage of Households by Region and Type of Materials Used for Roofing,
Tanzania Mainland, ................................................................................................. 137
Table 12. 5: Percentage of Households by Region and Main Materials Used for Flooring,
Tanzania Mainland, ................................................................................................. 139
Table 12. 6: Percentage of Households by Region and Type of Wall Materials Used,
Tanzania Mainland, ................................................................................................. 141
Table 12. 7: Percentage of Households by Region and Number of Rooms for Sleeping,
Tanzania Mainland, ................................................................................................. 143
Table 12. 8: Percentage of Households by Location and Main Source of Drinking Water,
Tanzania Mainland, 2012 Census ............................................................................ 145
Table 12. 9: Percentage of Households by Region and Main Source of Energy for Cooking,
Tanzania Mainland, 2012 Census ............................................................................ 148
Table 12. 10: Percentage of Households by Region and Main Source of Energy for Lighting,
Tanzania Mainland, 2012 Census ............................................................................ 150
Table 12. 11: Percentage of Households by Region and Type of Toilet Facility, Tanzania
Mainland, 2012 Census ........................................................................................... 154
Table 12. 12: Percentage of Households by Region and Type of Refuse Disposal, Tanzania
Mainland, ................................................................................................................. 157
Table 12. 13: Percentage of Households by Ownership of Assets Sex of the Household Head
and Region, Tanzania Mainland, 2012 Census ....................................................... 159
Table 12. 14: Percentage Distribution by Region and Membership of Social Security Scheme,
Tanzania Mainland, 2012 Census ............................................................................ 163
Table 13. 1: Total Number of Households Operating any Land for Agriculture by Region,
Rural and Urban Areas During 2011/12 Agriculture Year, Tanzania Mainland,
2012 Census ............................................................................................................. 165
Table 13. 2: Total Number of Households Engaged in Agricultural Activities by Rural and
Urban Areas during 2011/12 Agricultural Year, Tanzania Mainland, 2012
Census ...................................................................................................................... 166
Table 13. 3: Distribution of Households Rearing Cattle, Goats, Sheep, and Poultry by
Region, Rural and Urban Areas during 2011/12 Agriculture Year, Tanzania
Mainland, 2012 Census ........................................................................................... 168
Table 13. 4: Total Number of Households Keeping Livestock by Rural and Urban Areas
during 2011/12 Agricultural Year, Tanzania Mainland, 2012 Census .................... 169
Basic Demographic and Socio-Economic Profile; Tanzania Mainland
xxiv
Table 13.5: Total Number of Cattle, Goats, Sheep and Poultry Owned by Region and Sex of
the Household Head as of 26th
August 2012, Tanzania Mainland, 2012 Census .... 171
Table 13.6: Total Number of Cattle, Sheep, Goats and Chicken Owned by Region, Rural and
Urban Areas as of 26th
August 2012, Tanzania Mainland, 2012 Census ................ 173
Table 13. 7: Distribution of Households Involved in Fish Farming by Region, Rural and
Urban Areas, Tanzania Mainland, 2012 Census ..................................................... 174
Basic Demographic and Socio-Economic Profile; Tanzania Mainland
xxv
List of Figures
Figure 2. 1: Average Annual Inter-censal Population Growth Rates, Tanzania
Mainland, 1967 to 2012 Census ...................................................................... 15
Figure 2. 2: Average Annual Inter-Censal Population Growth Rates by Region,
Tanzania Mainland,.......................................................................................... 16
Figure 3. 1: Population Pyramid by Five Year Age Groups, Tanzania Mainland, 2012
Census .............................................................................................................. 22
Figure 3. 2: Population Pyramid by Five Year Age Groups, Tanzania Mainland Rural,
2012 Census ..................................................................................................... 23
Figure 3. 3: Population Pyramid by Five Year Age Groups, Tanzania Mainland Urban,
2012 Census ..................................................................................................... 23
Figure 3. 4: Population Pyramid by Five Year Age Groups, Dar es Salaam Region
Tanzania Mainland,.......................................................................................... 24
Figure 3. 5: Percentage of Young Population, Tanzania Mainland, 1988, 2002 and
2012 Censuses .................................................................................................. 26
Figure 3. 6: Percentage of Youth Population (15-24 Years), Tanzania Mainland .............. 27
Figure 3. 7: Percentage of the Youth Population (15-35 Years), Tanzania Mainland, ....... 28
Figure 3. 8: Percentage of the Working Age Population (15-64 Years), Tanzania
Mainland, ......................................................................................................... 29
Figure 3. 9: Percentage of the Population Age 60 Years and Above, Tanzania
Mainland, ......................................................................................................... 30
Figure 3. 10: Age Dependency Ratio, Tanzania Mainland, 1988 to 2012 Census ............... 31
Figure 4. 1: Percentage of Private Households by Rural and Urban Residence,
Tanzania Mainland,.......................................................................................... 35
Figure 4. 2: Average Household Size by Region, Tanzania Mainland, 2012 Census ........ 36
Figure 4. 3: Percentage of Heads of Households by Sex, Rural and Urban Areas,
Tanzania Mainland,.......................................................................................... 38
Figure 4. 4: Percentage of Male and Female Headed Households, Tanzania Mainland, ... 39
Figure 5. 1: Percentage of Population Aged 15 Years and Above by Marital Status and
Sex, ................................................................................................................... 43
Figure 5. 2: Mean Age at First Marriage by Sex, Tanzania Mainland, 2002 and 2012
Censuses ........................................................................................................... 49
Basic Demographic and Socio-Economic Profile; Tanzania Mainland
xxvi
Figure 5. 3: Mean Age at First Marriage by Rural, Urban Areas and Sex, Tanzania
Mainland, 2002 and 2012 Censuses ................................................................ 50
Figure 5. 4: Mean Age at First Marriage by Region, Tanzania Mainland, 2012 Census ... 52
Figure 7. 1: Percentage of Children below Age 18 Years by Survival of Parents,
Tanzania Mainland, 2012 Census .................................................................... 70
Figure 9. 1: Literacy Rates for Persons Aged Five Years and Above by Sex, Rural and
Urban Areas, .................................................................................................... 80
Figure 9. 2: Adult Literacy Rates by Sex, Rural and Urban Areas, Tanzania Mainland,
2012 Census ..................................................................................................... 82
Figure 9. 3: Literacy Rates by Sex, Tanzania Mainland, 2002 and 2012 Censuses ........... 86
Figure 9. 4: Percentage of Population Aged Five Years and Above by Literacy Status,
Tanzania Mainland, 2012 Census .................................................................... 87
Figure 9. 5: Percentage of Population Aged Five Years and Above by Literacy Status,
Tanzania Mainland Rural, 2012 Census .......................................................... 90
Figure 9. 6: Percentage of Population Aged Five Years and Above by Literacy Status,
Tanzania Mainland Urban, 2012 Census ......................................................... 90
Figure 9. 7: Percentage of Population Aged Five Years and Above by School
Attendance Status and Sex, Tanzania Mainland, 2012 Census ....................... 93
Figure 9. 8: Percentage of Population Aged Five Years and Above by School
Attendance Status , Rural and Urban Area, Tanzania Mainland, 2012
Census .............................................................................................................. 96
Figure 9. 9: Primary Schools Net Enrolment Ratio by Sex, Tanzania Mainland, .............. 97
Figure 9. 10: Primary Schools Net Enrolment Ratio by Rural and Urban Areas,
Tanzania Mainland, 2002 and 2012 Censuses ................................................. 97
Figure 9. 11: Primary Schools Gross Enrolment Ratio by Sex, Rural and Urban Areas,
Tanzania Mainland, 2012 Census .................................................................... 98
Figure 9. 12: Population Aged Five Years and Above by Level of Educational
Attainment, Tanzania Mainland, 2002 and 2012 ........................................... 102
Figure 11. 1: Percentage of Persons Disabilities by Type and Sex, Tanzania Mainland,
2012 Census ................................................................................................... 132
Figure 12. 1: Percentage of Households by Number of Rooms for Sleeping, Rural and
Urban Areas, Tanzania Mainland, 2012 Census ........................................... 142
Basic Demographic and Socio-Economic Profile; Tanzania Mainland
xxvii
Figure 12. 2: Percentage of Households Using Piped Water as Main Source of Drinking
Water by Rural and Urban, Tanzania Mainland, 2002 and 2012 Censuses .. 147
Figure 12. 3: Percentage of Households Using Electricity as Main Source of Energy for
Lighting by Rural and Urban Areas, Tanzania Mainland, 2002 and 2012
Census ............................................................................................................ 153
Figure 12. 4: Percentage of Households by Type of Toilet Facility, Tanzania Mainland,
2002 and 2012 Censuses ................................................................................ 156
Figure 13. 1: Percentage of Households Engaged in Agriculture by Rural and Urban
Areas, Tanzania Mainland, 2012 Census....................................................... 166
Figure 13. 2: Percentage of Households Engaged in Rearing Livestock by Rural and
Urban Areas, Tanzania Mainland, 2012 Census ........................................... 169
Basic Demographic and Socio-Economic Profile; Tanzania Mainland
xxviii
List of Maps
Map 9. 1: Literacy Rates for Persons Aged 15 Years and Above by Region, Tanzania
Mainland, 2012 Census ............................................................................................. 83
Map 9. 2: Net Enrolment Ratio of Primary School Age Population (7-13) Years by
Region, Tanzania Mainland, 2012 Census .............................................................. 100
Map 12. 1: Percentage of Households that Used Piped Water as the Main Source of
Drinking Water by Region, Tanzania Mainland, 2012Census ................................ 146
Map 12. 2: Percentage of Households Using Electricity as their Main Source of Energy
for Lighting by Region, Tanzania Mainland, 2012 Census ..................................... 152

Basic Demographic and Socio-Economic Profile; Tanzania Mainland
xxix
List of Abbreviations
CHF - Community Health Fund
DCC - District Census Coordinator
DfID - Department for International Development
DRC - Democratic Republic of Congo
EA - Enumeration Area
EAC - East African Community
GER - Gross Enrolment Rate
GIS - Geographical Information System
GPS - Global Positioning System
JICA - Japanese International Co-operation Agency
MDAs - Ministries, Departments and Agencies
MHR - Member of House of Representatives
MP - Member of Parliament
NA - Not Applicable
NBS - National Bureau of Statistics
NER - Net Enrolment Rate
NGO - Non-Governmental Organization
NHIF - National Health Insurance Fund
OCGS - Office of Chief Government Statistician
OMR - Optical Mark Reader
PES - Post Enumeration Survey
PHC - Population and Housing Census
SADC - Southern Africa Development Community
SMAM - Singulate Mean Age at First Marriage
SWMT - Sensa ya Watu na Makazi Tanzania
UNDP - United Nations Development Programme
UNFPA - United Nations Population Fund
UNICEF - United Nations Children‟s Fund
USAID - United States Agency for International Development
UN - United Nations
USA - United States of America
VIP - Ventilated Improved Pit Latrines
Basic Demographic and Socio-Economic Profile; Tanzania Mainland
xxx
Concepts and Definitions
Population and Housing Census
Census Night is a reference night of the Census. According to the Tanzania 2012 Population
and Housing Census, the Census night was the night of 25th
/26th
August, 2012.
De facto Methodology means persons were enumerated where they slept on the Census night.
Enumeration Area (EA) is a designated area with an average of 60 to 100 households.
Geographical Information System (GIS) is a system designed to capture, store, manipulate,
analyse, manage and present all types of geographical data.
Optical Mark Reader (OMR) is the process of capturing data by optical scanner by
measuring the reflectivity of light at pre-determined positions on a surface.
Population and Housing Census (PHC) is defined as the total process of collecting,
compiling, evaluating, analyzing and publishing or otherwise disseminating demographic,
economic and social data pertaining, at a specified time, to all persons in a country or in a well
delineated part of a country (United Nations definition).
Post Enumeration Survey (PES) is the sample survey conducted immediately after the census
for the primary purpose of evaluating the census. It helps in identifying areas of deficiencies
that need improvement in subsequent censuses.
Quality Assurance are planned and systematic activities implemented in a quality system so
that, quality requirements for the product are fulfilled.
Quality Control refers to observations, techniques and activities used to fulfill requirements
for quality.
Urban Area for the purpose of the 2012 PHC, urban population consist of people living in
areas legally recognized (gazetted) as urban and all areas recognized by Local Government
Authorities as urban (Countries differ in their definitions of urban, although it is fairly common
for the urban population to consist of those living in towns and cities of a few thousand persons
or more especially if the population of such areas is largely non-agricultural).
Population Size, Growth and Distribution
Population Growth refers to the change in population over time, and can be quantified as the
change in the number of individuals in a population using "per unit time" for measurement.
Basic Demographic and Socio-Economic Profile; Tanzania Mainland
xxxi
Population Growth Rate is the fractional rate at which the number of individuals in a
population increases. It specifically refers to the change in population over a unit time period,
often expressed as a percentage of the number of individuals in the population at the beginning
of that period.
Age and Sex Profile
Age is the number of years one had lived as at last birthday i.e. in reference to the census night.
Age-Dependency Ratio is the ratio of people in the “dependent” ages (those under age 15 and
age 65 and older) to those in the “working age population” (15-64 years).
Elderly Population refers to persons aged 65 years and above (according to international
definition). However, according to Tanzania National Ageing Policy, an elderly is an
individual who is 60 years and above.
Median Age is the age at which exactly half the population is older and half is younger.
Population Pyramid is a graphical presentation of population‟s age and sex composition.
Horizontal bars present the numbers or proportions of males and females in each age group.
Sex Ratio is the ratio of males to females in a given population usually expressed as the
number of males for every 100 females.
Working Age Population is the population age 15 to 64 years (international definition).
Young People are the population age 0 to 14 years.
Youth Population is the population aged 15-24 years (international definition). However,
according to Tanzania‟s Youth Policy, Youth Population is the population aged 15 to 35 years.
Household Composition
Average Household Size is the average number of persons per private household. Average
household size is obtained by dividing the total number of persons living in private households
to the total number of private households.
Collective Households is a group of persons residing in one dwelling or compound having no
head of household. Boarding schools, hospitals and camps are examples of collective
households.
Head of Household is a person who is acknowledged as such by other household members.
Basic Demographic and Socio-Economic Profile; Tanzania Mainland
xxxii
Household refers to a person or group of persons who reside in the same homestead or
compound but not necessarily in the same dwelling unit, have same cooking arrangements, and
are answerable to the same household head except for collective household.
Private Household is defined as a person or group of persons who reside in the same
homestead or compound but not necessarily in the same dwelling unit, having the same
cooking arrangements, and are answerable to the same household head.
Marital Status
Divorced Persons are those persons who were once married but their marriages were
permanently terminated and have not remarried since then. Note that in polygamous marriages
the divorce of one or more wives does not categorize the husband as divorced if he still lives
with the other wife (wives).
Living Together is an act of persons who are not formally married but are in a consensual
unions or are living in a socially recognized stable unions.
Marriage is an act of persons who are living together or separately but are formally married
irrespective of the type of marriage, which may be customary, civil or religious marriage.
Mean Age at First Marriage is defined as the average length of single life expressed in years
among those who marry before age 50.
Never Married means persons who have remained single all their lives excluding persons who
have lived with another person and are now living alone.
Separated is the act of persons who were once married but now are living apart. Those who
live apart because their spouses are employed far away from home or for similar reasons are
considered to be married.
Widowed is the act of persons whose marriages were terminated by death and have not
remarried since. Note that in polygamous marriages the death of one or more wives does not
make the husband a widower if he still has other wife (wives).
Citizenship and Birth Registration
Birth Certificate is a vital record that documents the birth of a child. The term "birth
certificate" can refer to either the original document certifying the circumstances of the birth or
to a certified copy of or representation of the ensuing registration of that birth.
Birth Registration is the process by which a child‟s birth is recorded in the civil register by
the Government authority.
Basic Demographic and Socio-Economic Profile; Tanzania Mainland
xxxiii
Diaspora
Diaspora are citizens living outside the country.
Literacy and Education
Educational Attainment is the highest grade completed according to the country‟s
educational system. A grade is a stage of instruction usually covered in the course of a school
year.
Gross Enrolment Rate (GER) is defined as the number of children attending primary school
regardless of age divided by the total number of children age 7-13 years.
Literacy is the ability to read and write with an understanding a short simple sentence in
everyday life.
Literacy Rate is the percentage of a population that can read and write in Kiswahili, English,
both Kiswahili and English or in any other language(s) (2012 PHC).
Net Enrolment Rate (NER) is defined as the number of children age 7-13 years who are
attending school divided by the total number of children in that age group.
School Attendance refers to attendance at any regular authorized or licensed educational
institution or programme for organized learning at any level of education at the time of the
Census.
Economic Activity
Agriculture Worker is a person working either in agriculture, hunting, forestry, livestock or
fishing as either a self-employed person or unpaid family helper, where production is primarily
for own consumption rather than for the market.
Apprentice is a person working with or without payment as a part of training.
Employee is a person who performs work for a wage or salary in cash or in kind. Employee
categories included are; permanent, temporary and casual paid employees.
Employer is a person who engages other people to work for him/her for profit or family gain.
Family Worker is a person working without payment in cash or kind in a family enterprise.
Full Time Student is a person who is not performing any economic activity during the
reference period due to schooling.
Basic Demographic and Socio-Economic Profile; Tanzania Mainland
xxxiv
Home Maintenance Worker is a person, who during the reference period, performed
household chores without pay. These include cooking, cleanliness, caring for elderly, children
and the sick.
Non-Agriculture Worker is a person who performs work other than agriculture activities for
profit or family gain.
Not Looking but Available for Work is a person who, during the reference period, did not
perform any economic activity nor take any efforts to seek employment although he/she was
available for work.
Not Working but Looking for Work is a person who, during the reference period, did not
perform any economic activity but were available for work and actively seeking employment.
Unable to Work is a person who was not performing any economic activity during the
reference period due to either sickness, old age, young age, disability and the like.
Working Person is a person who, during a reference period, was performing economic
activities for pay, exchange or family gain.
Disability
Persons with Disabilities are those persons with long-term physical, mental, intellectual or
sensory impairment which in interaction with various barriers may hinder their full and
effective participation in society on an equal footing with others.
Household Conditions and Amenities
Room for Sleeping is defined as any space within a dwelling which is currently used for
sleeping by the household members. Any space within a dwelling can be termed as a room for
sleeping if currently used by the household members for sleeping purposes and can be a sitting
room, a dining room or even a store.
Social Security Fund is a fund that provides its members with long and short term financial
security which can be used as “social safety nets” especially at older ages.
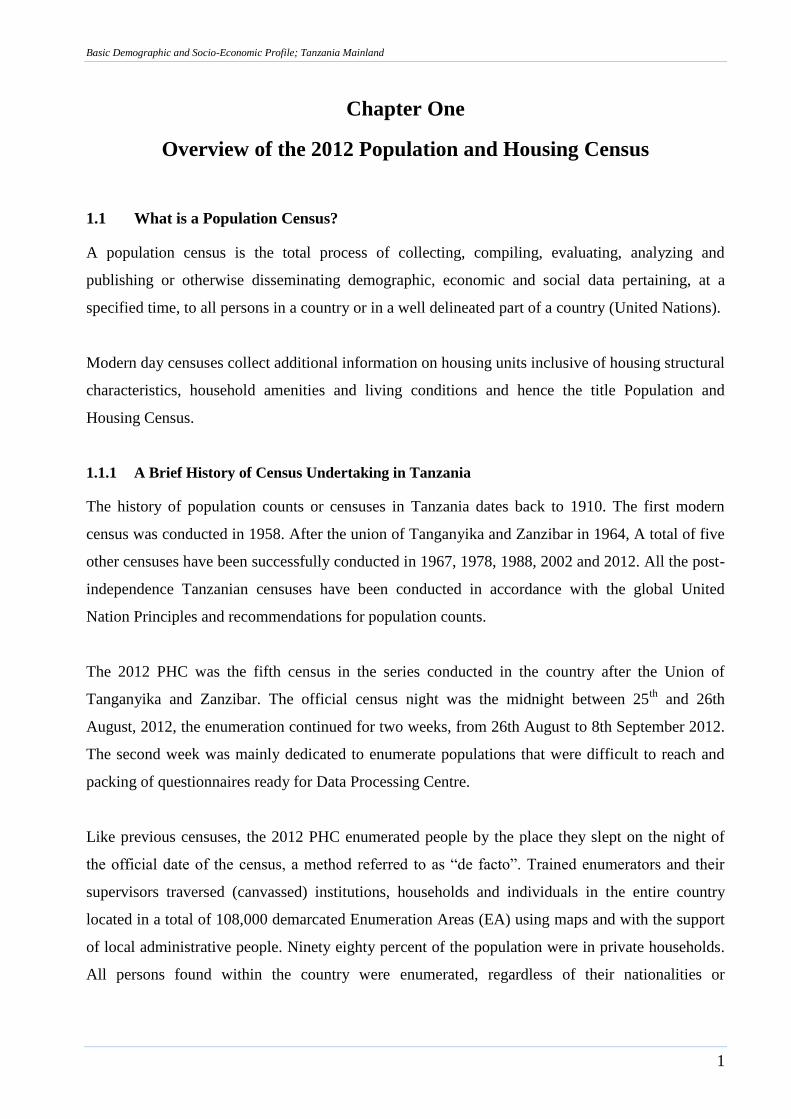
Basic Demographic and Socio-Economic Profile; Tanzania Mainland
1
Chapter One
Overview of the 2012 Population and Housing Census
1.1 What is a Population Census?
A population census is the total process of collecting, compiling, evaluating, analyzing and
publishing or otherwise disseminating demographic, economic and social data pertaining, at a
specified time, to all persons in a country or in a well delineated part of a country (United Nations).
Modern day censuses collect additional information on housing units inclusive of housing structural
characteristics, household amenities and living conditions and hence the title Population and
Housing Census.
1.1.1 A Brief History of Census Undertaking in Tanzania
The history of population counts or censuses in Tanzania dates back to 1910. The first modern
census was conducted in 1958. After the union of Tanganyika and Zanzibar in 1964, A total of five
other censuses have been successfully conducted in 1967, 1978, 1988, 2002 and 2012. All the post-
independence Tanzanian censuses have been conducted in accordance with the global United
Nation Principles and recommendations for population counts.
The 2012 PHC was the fifth census in the series conducted in the country after the Union of
Tanganyika and Zanzibar. The official census night was the midnight between 25th
and 26th
August, 2012, the enumeration continued for two weeks, from 26th August to 8th September 2012.
The second week was mainly dedicated to enumerate populations that were difficult to reach and
packing of questionnaires ready for Data Processing Centre.
Like previous censuses, the 2012 PHC enumerated people by the place they slept on the night of
the official date of the census, a method referred to as “de facto”. Trained enumerators and their
supervisors traversed (canvassed) institutions, households and individuals in the entire country
located in a total of 108,000 demarcated Enumeration Areas (EA) using maps and with the support
of local administrative people. Ninety eighty percent of the population were in private households.
All persons found within the country were enumerated, regardless of their nationalities or
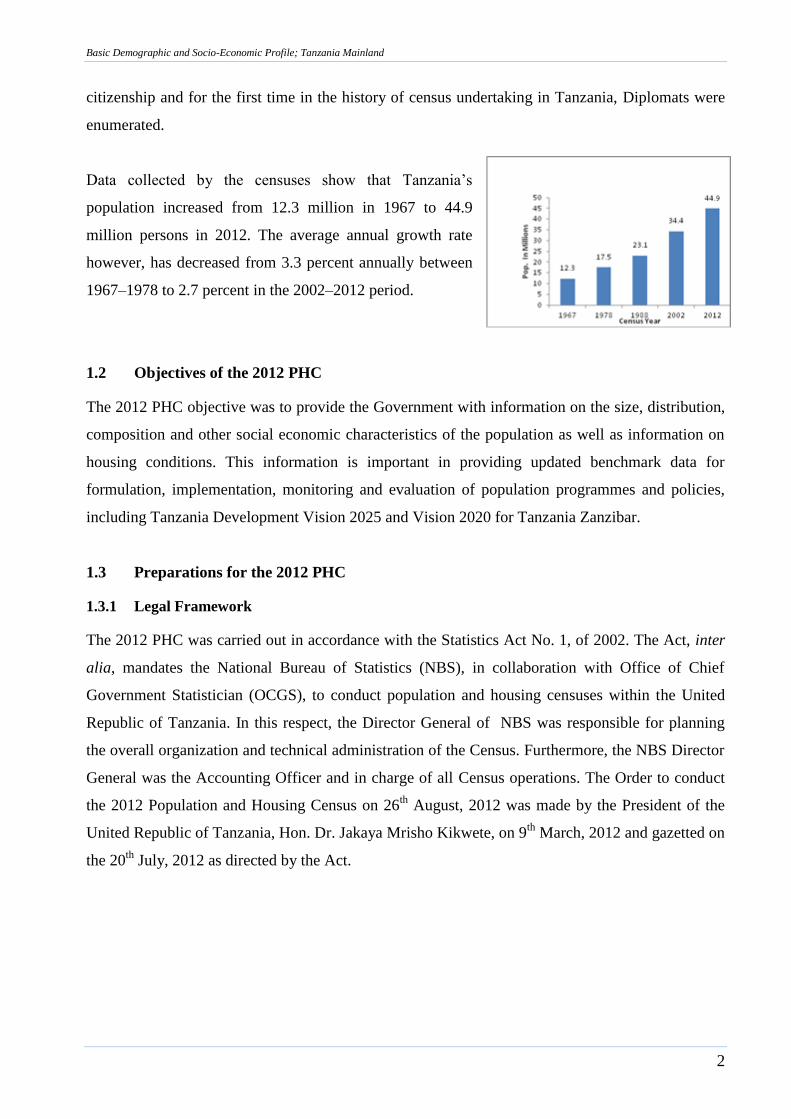
Basic Demographic and Socio-Economic Profile; Tanzania Mainland
2
citizenship and for the first time in the history of census undertaking in Tanzania, Diplomats were
enumerated.
Data collected by the censuses show that Tanzania‟s
population increased from 12.3 million in 1967 to 44.9
million persons in 2012. The average annual growth rate
however, has decreased from 3.3 percent annually between
1967–1978 to 2.7 percent in the 2002–2012 period.
1.2 Objectives of the 2012 PHC
The 2012 PHC objective was to provide the Government with information on the size, distribution,
composition and other social economic characteristics of the population as well as information on
housing conditions. This information is important in providing updated benchmark data for
formulation, implementation, monitoring and evaluation of population programmes and policies,
including Tanzania Development Vision 2025 and Vision 2020 for Tanzania Zanzibar.
1.3 Preparations for the 2012 PHC
1.3.1 Legal Framework
The 2012 PHC was carried out in accordance with the Statistics Act No. 1, of 2002. The Act, inter
alia, mandates the National Bureau of Statistics (NBS), in collaboration with Office of Chief
Government Statistician (OCGS), to conduct population and housing censuses within the United
Republic of Tanzania. In this respect, the Director General of NBS was responsible for planning
the overall organization and technical administration of the Census. Furthermore, the NBS Director
General was the Accounting Officer and in charge of all Census operations. The Order to conduct
the 2012 Population and Housing Census on 26th
August, 2012 was made by the President of the
United Republic of Tanzania, Hon. Dr. Jakaya Mrisho Kikwete, on 9th
March, 2012 and gazetted on
the 20th
July, 2012 as directed by the Act.
Basic Demographic and Socio-Economic Profile; Tanzania Mainland
3
The President of the United Republic of Tanzania, H.E. Dr. Jakaya Mrisho Kikwete, his wife and family being
enumerated at the State House on 26th
August, 2012.
1.3.2 Census Organization
A population census is an enormous and challenging national exercise with many and varied
stakeholders and requires the participation of Government or public administration. To ensure a
successful census, careful planning, monitoring and evaluation of census activities is fundamental.
A proper census organization is vital to this end.
Preparations for the 2012 PHC were facilitated by various committees established at national,
regional and district levels to guide and monitor the Census processes. The committees drew
members from Ministries, Departments and Agencies (MDAs); higher learning institutions and
Non-Governmental Organizations (NGOs). The main committees were: the Central Census
Committee, National Advisory Committee, Technical Advisory Committee and Regional and
Districts Census Committees.
Basic Demographic and Socio-Economic Profile; Tanzania Mainland
4
The Ministry of Finance was in charge of overseeing the operations of the census project. In
Zanzibar, responsibility was vested in the Ministry of Finance, Economy and Development
Planning. These were also the respective parent ministries of NBS and OCGS. The Regional and
District Census Committees chaired by Regional and District Commissioners were formed in each
region and district. They were in charge with the responsibility of ensuring that all Census activities
were successfully undertaken in their respective regions or districts. Members of these committees
also included representatives of main religious institutions in their respective regions and districts.
The Commissioner of Population Census and the Census Commissar (Zanzibar) were responsible
for educating, sensitizing and mobilizing people for the census exercise, resource mobilization and
acted as a link between the Government and National Bureau of Statistics and Office of the Chief
Government Statistician in Tanzania Mainland and Tanzania Zanzibar respectively. The Census
Commissioner was also in-charge of massive data processing exercise.
1.3.3 Development of Census Instruments
The Census instruments (questionnaires, manuals and other census documents) were developed in
collaboration with national experts from higher learning institutions and national MDAs. The 2012
PHC questionnaires incorporated topics of previous censuses for comparison purposes, added new
topic to current country needs, needs of other data users as well as other data producers in
accordance to the United Nations Principles and Recommendations for 2010 Round of Population
Censuses and recommendations of regional bodies of which Tanzania is a member (e.g. EAC and
SADC). The draft questionnaires were shared widely with various stakeholders both in Tanzania
Mainland and Tanzania Zanzibar through stakeholder workshops and the established Census
Committees. The draft questionnaires were discussed and cleared by the Census Technical
Committee, National Advisory Committee and the Central Census Committee for final approval.
Two main types of questionnaires were developed, namely, the Long and Short Questionnaires.
The Short questionnaire with seven main sections and 37 questions was administered to 70 percent
of the population. Main topics covered were Identification, Demographic Characteristics,
Disability, Migration and Birth certificate. Others were Education, General and Maternal Death,
Agriculture and Livestock, and Social Security Fund. The Long Questionnaire that was
administered to 30 percent of the population had extra sections on Survival of Parents, Economic
Activity Fertility, Housing Condition and Ownership of Assets. The long Questionnaire had a total
of 62 questions (Short and Long questionnaires attached as Annex 1 and 2). Other questionnaires
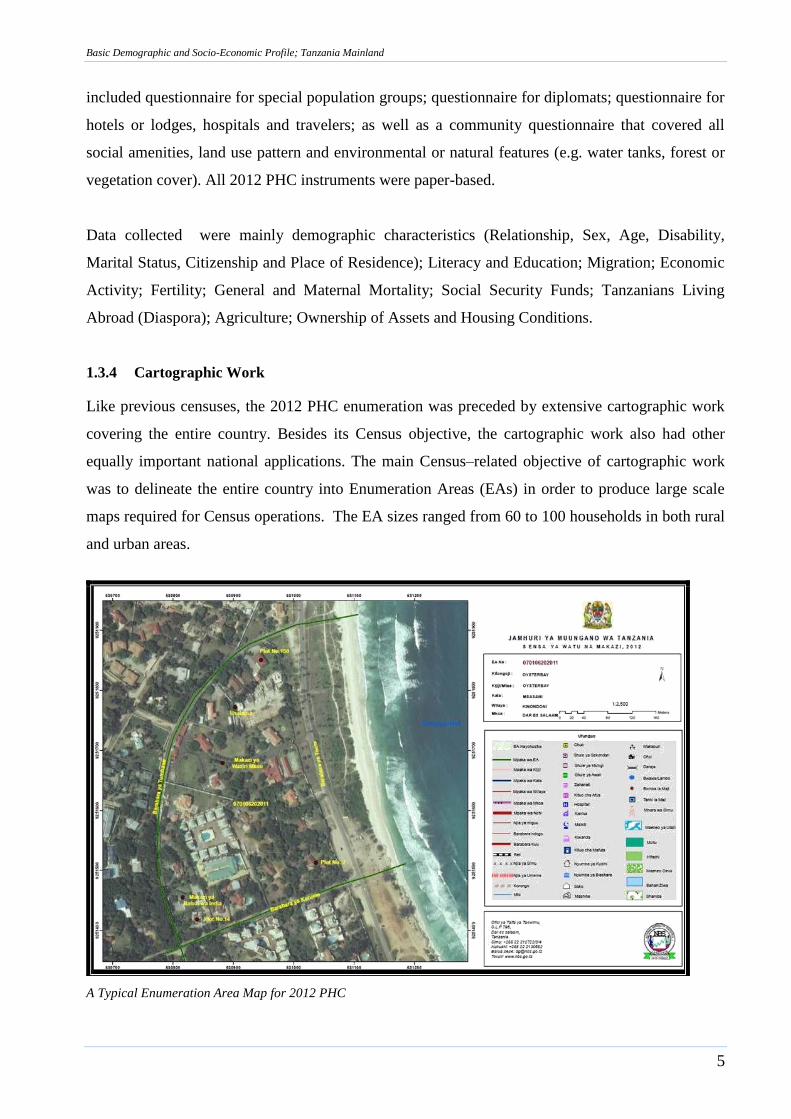
Basic Demographic and Socio-Economic Profile; Tanzania Mainland
5
included questionnaire for special population groups; questionnaire for diplomats; questionnaire for
hotels or lodges, hospitals and travelers; as well as a community questionnaire that covered all
social amenities, land use pattern and environmental or natural features (e.g. water tanks, forest or
vegetation cover). All 2012 PHC instruments were paper-based.
Data collected were mainly demographic characteristics (Relationship, Sex, Age, Disability,
Marital Status, Citizenship and Place of Residence); Literacy and Education; Migration; Economic
Activity; Fertility; General and Maternal Mortality; Social Security Funds; Tanzanians Living
Abroad (Diaspora); Agriculture; Ownership of Assets and Housing Conditions.
1.3.4 Cartographic Work
Like previous censuses, the 2012 PHC enumeration was preceded by extensive cartographic work
covering the entire country. Besides its Census objective, the cartographic work also had other
equally important national applications. The main Census–related objective of cartographic work
was to delineate the entire country into Enumeration Areas (EAs) in order to produce large scale
maps required for Census operations. The EA sizes ranged from 60 to 100 households in both rural
and urban areas.
A Typical Enumeration Area Map for 2012 PHC
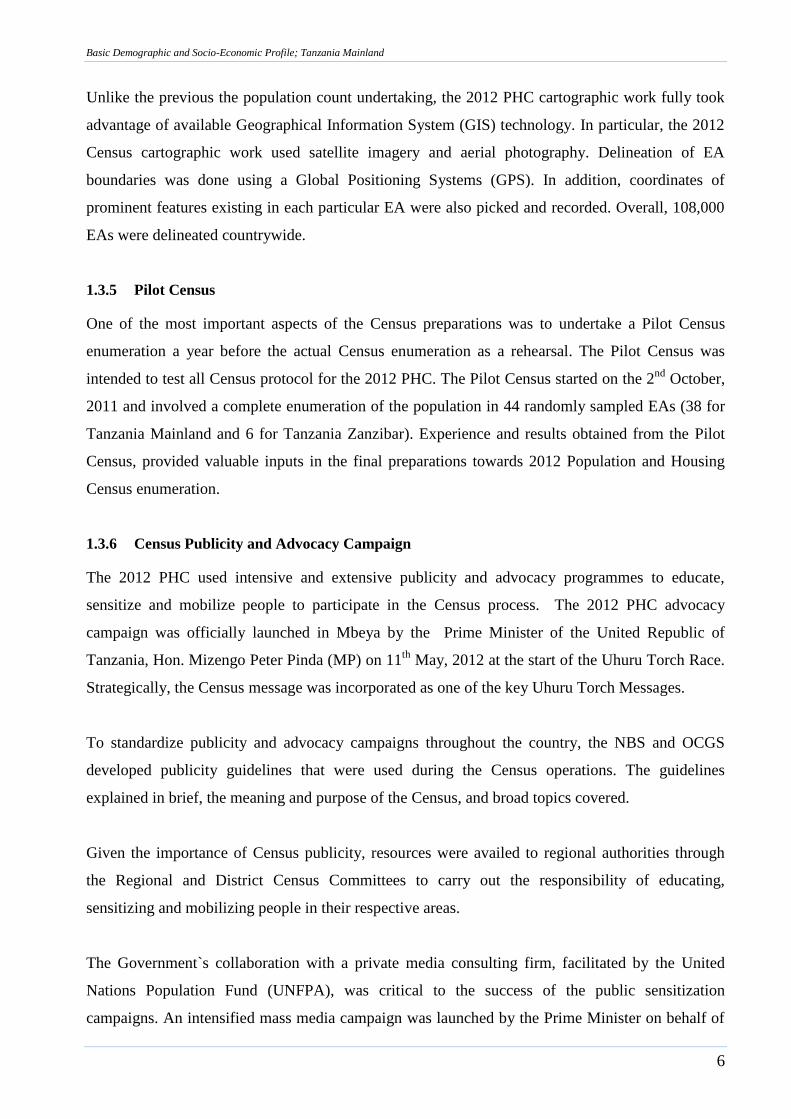
Basic Demographic and Socio-Economic Profile; Tanzania Mainland
6
Unlike the previous the population count undertaking, the 2012 PHC cartographic work fully took
advantage of available Geographical Information System (GIS) technology. In particular, the 2012
Census cartographic work used satellite imagery and aerial photography. Delineation of EA
boundaries was done using a Global Positioning Systems (GPS). In addition, coordinates of
prominent features existing in each particular EA were also picked and recorded. Overall, 108,000
EAs were delineated countrywide.
1.3.5 Pilot Census
One of the most important aspects of the Census preparations was to undertake a Pilot Census
enumeration a year before the actual Census enumeration as a rehearsal. The Pilot Census was
intended to test all Census protocol for the 2012 PHC. The Pilot Census started on the 2nd
October,
2011 and involved a complete enumeration of the population in 44 randomly sampled EAs (38 for
Tanzania Mainland and 6 for Tanzania Zanzibar). Experience and results obtained from the Pilot
Census, provided valuable inputs in the final preparations towards 2012 Population and Housing
Census enumeration.
1.3.6 Census Publicity and Advocacy Campaign
The 2012 PHC used intensive and extensive publicity and advocacy programmes to educate,
sensitize and mobilize people to participate in the Census process. The 2012 PHC advocacy
campaign was officially launched in Mbeya by the Prime Minister of the United Republic of
Tanzania, Hon. Mizengo Peter Pinda (MP) on 11th
May, 2012 at the start of the Uhuru Torch Race.
Strategically, the Census message was incorporated as one of the key Uhuru Torch Messages.
To standardize publicity and advocacy campaigns throughout the country, the NBS and OCGS
developed publicity guidelines that were used during the Census operations. The guidelines
explained in brief, the meaning and purpose of the Census, and broad topics covered.
Given the importance of Census publicity, resources were availed to regional authorities through
the Regional and District Census Committees to carry out the responsibility of educating,
sensitizing and mobilizing people in their respective areas.
The Government`s collaboration with a private media consulting firm, facilitated by the United
Nations Population Fund (UNFPA), was critical to the success of the public sensitization
campaigns. An intensified mass media campaign was launched by the Prime Minister on behalf of
Basic Demographic and Socio-Economic Profile; Tanzania Mainland
7
His Excellency, the President of the United Republic of Tanzania on 17th
August, 2012 as the
Enumeration day was approaching. The live and extensive media coverage of the event provided,
the not only much needed momentum but also a timely reminder of the 2012 PHC which lasted
throughout the enumeration period. The campaign hooked the entire country to the 2012 PHC.
Prime Minister Hon. Mizengo Pinda and Zanzibar Second Vice President Ambassador Seif Ali Iddi in a group
photograph with government leaders and representatives of development partners during the Official Launching of the
Publicity and Advocacy Campaign for the 2012 PHC on 17th August, 2012.
1.4 Census Enumeration Activities
Several activities were undertaken in preparation for the main enumeration exercise, including
recruitment and training of field personnel and distribution of enumeration materials to all parts of
the country.
1.4.1 Recruitment and Training
Recruitment of census enumerators and supervisors was performed by the Regional and District
Census Committees in their respective geographical areas. Guidelines were provided the total
number of enumerators and supervisors needed for each ward or shehia and their qualifications. A
total of 200,000 enumerators and supervisors were recruited to undertake the enumeration.
Basic Demographic and Socio-Economic Profile; Tanzania Mainland
8
1.4.2 Other Preparations for Enumeration
A range of other preparatory activities were carried out in the second and third weeks of August
2012. The activities included distribution of enumeration materials to supervisors and enumerators,
physical identification of EA boundaries and meeting the local authorities in their respective areas.
Zonal Supervisors and Regional Trainers moved around the country to make sure that all
supervisors and enumerators were well equipped for the enumeration roles or duties.
The Regional Census Coordinators were assisted by Assistants Census Coordinators. This team,
together with the Regional and District Census Committees coordinated and monitored preparatory
enumeration activities in their respective areas of jurisdiction.
1.4.3 Enumeration
The target population for the 2012 PHC was all persons who spent the night of 25th
/26th
August,
2012 within the borders of Tanzania. The actual enumeration was conducted by enumerators and
supervisors in their respective assigned areas. Two types of enumerators were used; junior
enumerators who administered the short questionnaire and senior enumerators who administered
the long questionnaire. For the short questionnaire, one enumerator worked in one EA whereas two
senior enumerators administered the long questionnaire in one EA. The short questionnaire with 37
questions was administered to 70 percent of all EAs while the long questionnaire with 62 questions
was administered to the remaining 30 percent. Other enumerators were stationed at mass transit
points to enumerate passengers on buses, trains, airplanes and ships. Special enumeration labels or
tags were issued to each traveller after enumeration to avoid double-counting. Special arrangements
were also made to enumerate the homeless.
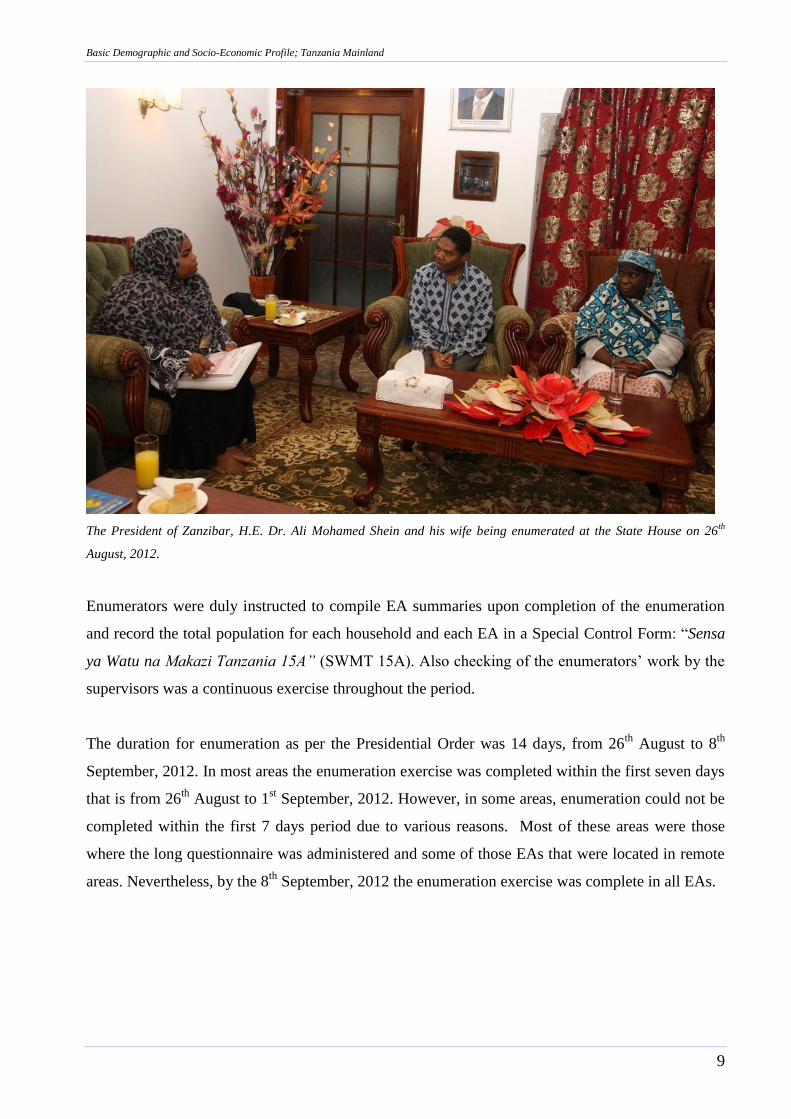
Basic Demographic and Socio-Economic Profile; Tanzania Mainland
9
The President of Zanzibar, H.E. Dr. Ali Mohamed Shein and his wife being enumerated at the State House on 26th
August, 2012.
Enumerators were duly instructed to compile EA summaries upon completion of the enumeration
and record the total population for each household and each EA in a Special Control Form: “Sensa
ya Watu na Makazi Tanzania 15A” (SWMT 15A). Also checking of the enumerators‟ work by the
supervisors was a continuous exercise throughout the period.
The duration for enumeration as per the Presidential Order was 14 days, from 26th
August to 8th
September, 2012. In most areas the enumeration exercise was completed within the first seven days
that is from 26th
August to 1st September, 2012. However, in some areas, enumeration could not be
completed within the first 7 days period due to various reasons. Most of these areas were those
where the long questionnaire was administered and some of those EAs that were located in remote
areas. Nevertheless, by the 8th
September, 2012 the enumeration exercise was complete in all EAs.
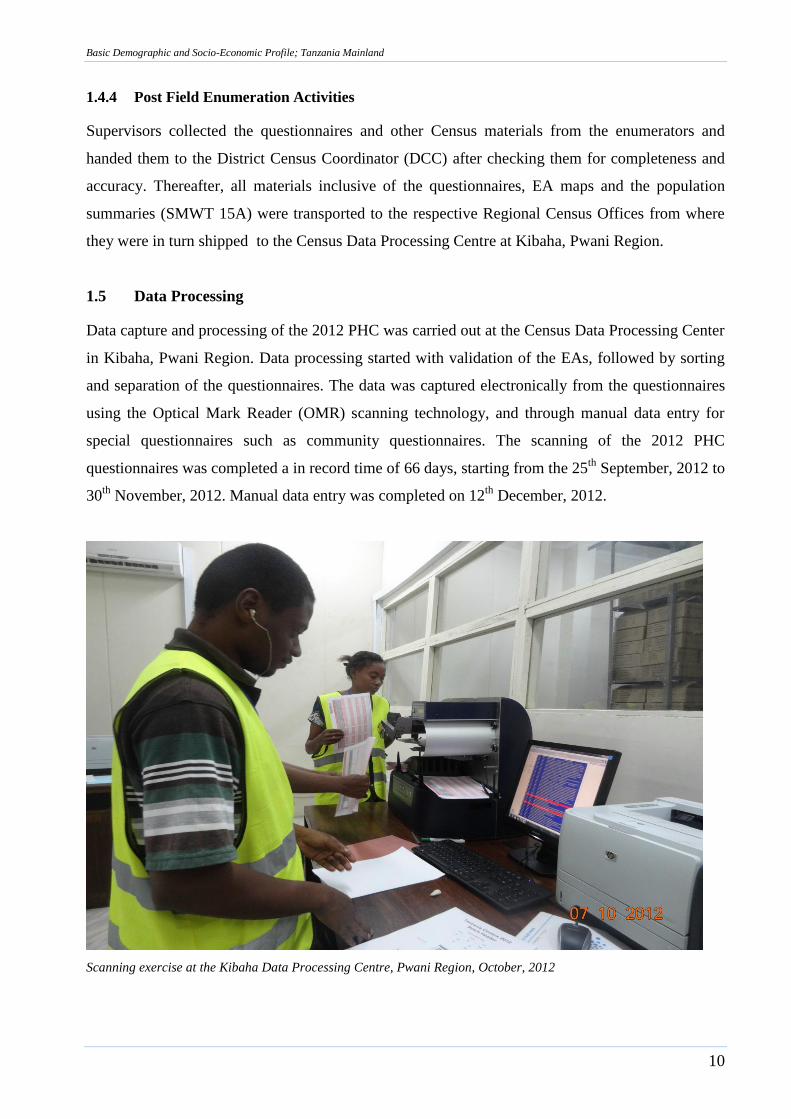
Basic Demographic and Socio-Economic Profile; Tanzania Mainland
10
1.4.4 Post Field Enumeration Activities
Supervisors collected the questionnaires and other Census materials from the enumerators and
handed them to the District Census Coordinator (DCC) after checking them for completeness and
accuracy. Thereafter, all materials inclusive of the questionnaires, EA maps and the population
summaries (SMWT 15A) were transported to the respective Regional Census Offices from where
they were in turn shipped to the Census Data Processing Centre at Kibaha, Pwani Region.
1.5 Data Processing
Data capture and processing of the 2012 PHC was carried out at the Census Data Processing Center
in Kibaha, Pwani Region. Data processing started with validation of the EAs, followed by sorting
and separation of the questionnaires. The data was captured electronically from the questionnaires
using the Optical Mark Reader (OMR) scanning technology, and through manual data entry for
special questionnaires such as community questionnaires. The scanning of the 2012 PHC
questionnaires was completed a in record time of 66 days, starting from the 25th
September, 2012 to
30th
November, 2012. Manual data entry was completed on 12th
December, 2012.
Scanning exercise at the Kibaha Data Processing Centre, Pwani Region, October, 2012
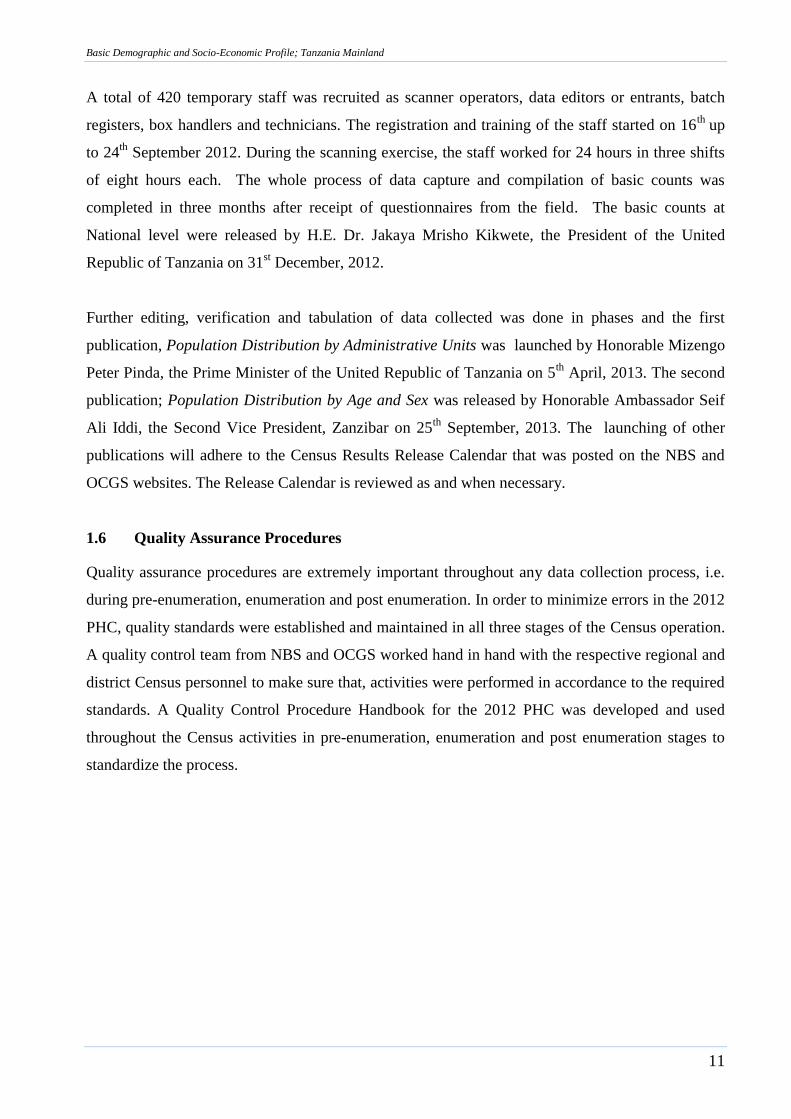
Basic Demographic and Socio-Economic Profile; Tanzania Mainland
11
A total of 420 temporary staff was recruited as scanner operators, data editors or entrants, batch
registers, box handlers and technicians. The registration and training of the staff started on 16th
up
to 24th
September 2012. During the scanning exercise, the staff worked for 24 hours in three shifts
of eight hours each. The whole process of data capture and compilation of basic counts was
completed in three months after receipt of questionnaires from the field. The basic counts at
National level were released by H.E. Dr. Jakaya Mrisho Kikwete, the President of the United
Republic of Tanzania on 31st December, 2012.
Further editing, verification and tabulation of data collected was done in phases and the first
publication, Population Distribution by Administrative Units was launched by Honorable Mizengo
Peter Pinda, the Prime Minister of the United Republic of Tanzania on 5th
April, 2013. The second
publication; Population Distribution by Age and Sex was released by Honorable Ambassador Seif
Ali Iddi, the Second Vice President, Zanzibar on 25th
September, 2013. The launching of other
publications will adhere to the Census Results Release Calendar that was posted on the NBS and
OCGS websites. The Release Calendar is reviewed as and when necessary.
1.6 Quality Assurance Procedures
Quality assurance procedures are extremely important throughout any data collection process, i.e.
during pre-enumeration, enumeration and post enumeration. In order to minimize errors in the 2012
PHC, quality standards were established and maintained in all three stages of the Census operation.
A quality control team from NBS and OCGS worked hand in hand with the respective regional and
district Census personnel to make sure that, activities were performed in accordance to the required
standards. A Quality Control Procedure Handbook for the 2012 PHC was developed and used
throughout the Census activities in pre-enumeration, enumeration and post enumeration stages to
standardize the process.

Basic Demographic and Socio-Economic Profile; Tanzania Mainland
12
Chapter Two
Population Size, Growth and Distribution
2.1 Introduction
A population is a resource for labour supply for production of goods and services as well as
consumption of various products. The size, structure, distribution and quality of a population are
among the important parameters for economic development. Likewise, population growth increases
the demand for food, water, energy and other natural resources for its survival and development.
The growth and distribution of population also determines the demand for and location of essential
social services such as education, health, water, transport and housing. To maintain a sustainable
socio-economic development simply means improving the well-being of most people. However
reducing poverty levels in a society without environmental degradation. Such development is more
difficult to achieve with a rapidly growing population. As such, the population growth should be
kept at a sustainable level.
2.2 Enumerated Population by Record Type
The 2012 PHC was conducted on the basis of the place a person slept on the Census night (de
facto). Table 2.1 shows Enumerated Population by Record Type in Rural and Urban Areas. In
Rural Areas of Tanzania Mainland, the smallest number of people was found in orphanage centres
(3,701 population) while in the Urban Areas it was found in refugee camps (865 population).
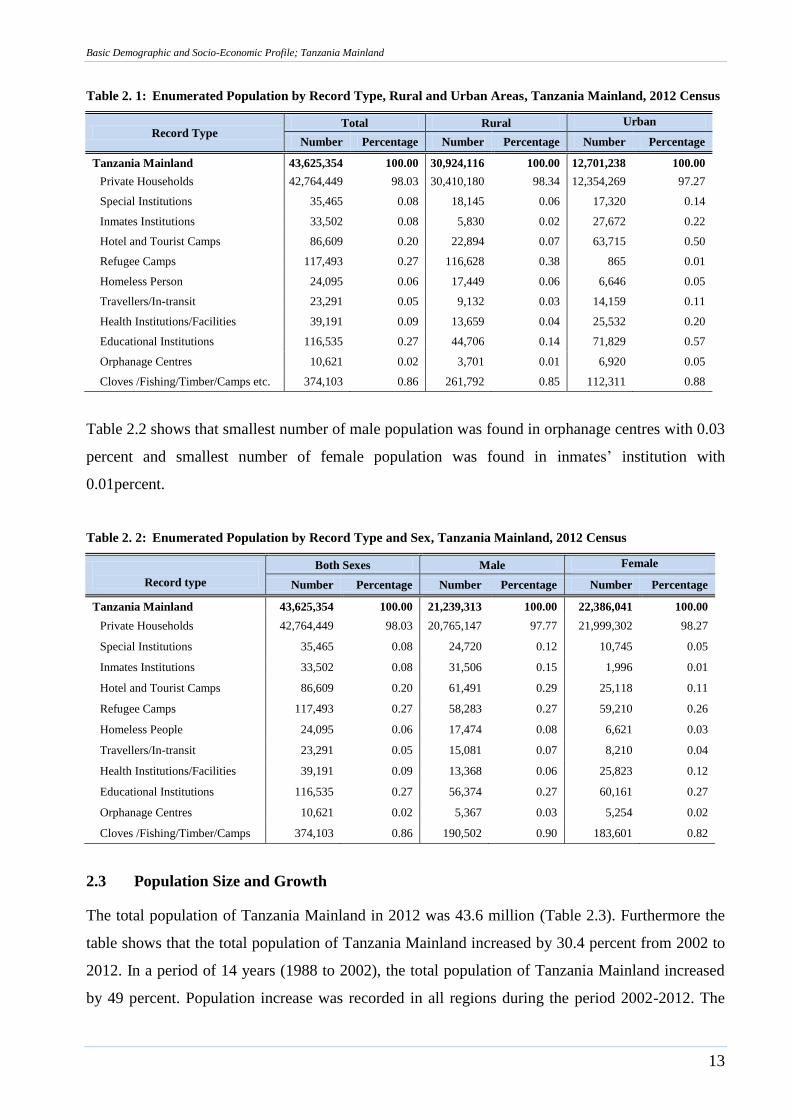
Basic Demographic and Socio-Economic Profile; Tanzania Mainland
13
Table 2. 1: Enumerated Population by Record Type, Rural and Urban Areas, Tanzania Mainland, 2012 Census
Record Type Total Rural Urban
Number Percentage Number Percentage Number Percentage
Tanzania Mainland 43,625,354 100.00 30,924,116 100.00 12,701,238 100.00
Private Households 42,764,449 98.03 30,410,180 98.34 12,354,269 97.27
Special Institutions 35,465 0.08 18,145 0.06 17,320 0.14
Inmates Institutions 33,502 0.08 5,830 0.02 27,672 0.22
Hotel and Tourist Camps 86,609 0.20 22,894 0.07 63,715 0.50
Refugee Camps 117,493 0.27 116,628 0.38 865 0.01
Homeless Person 24,095 0.06 17,449 0.06 6,646 0.05
Travellers/In-transit 23,291 0.05 9,132 0.03 14,159 0.11
Health Institutions/Facilities 39,191 0.09 13,659 0.04 25,532 0.20
Educational Institutions 116,535 0.27 44,706 0.14 71,829 0.57
Orphanage Centres 10,621 0.02 3,701 0.01 6,920 0.05
Cloves /Fishing/Timber/Camps etc. 374,103 0.86 261,792 0.85 112,311 0.88
Table 2.2 shows that smallest number of male population was found in orphanage centres with 0.03
percent and smallest number of female population was found in inmates‟ institution with
0.01percent.
Table 2. 2: Enumerated Population by Record Type and Sex, Tanzania Mainland, 2012 Census
Record type
Both Sexes Male Female
Number Percentage Number Percentage Number Percentage
Tanzania Mainland 43,625,354 100.00 21,239,313 100.00 22,386,041 100.00
Private Households 42,764,449 98.03 20,765,147 97.77 21,999,302 98.27
Special Institutions 35,465 0.08 24,720 0.12 10,745 0.05
Inmates Institutions 33,502 0.08 31,506 0.15 1,996 0.01
Hotel and Tourist Camps 86,609 0.20 61,491 0.29 25,118 0.11
Refugee Camps 117,493 0.27 58,283 0.27 59,210 0.26
Homeless People 24,095 0.06 17,474 0.08 6,621 0.03
Travellers/In-transit 23,291 0.05 15,081 0.07 8,210 0.04
Health Institutions/Facilities 39,191 0.09 13,368 0.06 25,823 0.12
Educational Institutions 116,535 0.27 56,374 0.27 60,161 0.27
Orphanage Centres 10,621 0.02 5,367 0.03 5,254 0.02
Cloves /Fishing/Timber/Camps 374,103 0.86 190,502 0.90 183,601 0.82
2.3 Population Size and Growth
The total population of Tanzania Mainland in 2012 was 43.6 million (Table 2.3). Furthermore the
table shows that the total population of Tanzania Mainland increased by 30.4 percent from 2002 to
2012. In a period of 14 years (1988 to 2002), the total population of Tanzania Mainland increased
by 49 percent. Population increase was recorded in all regions during the period 2002-2012. The
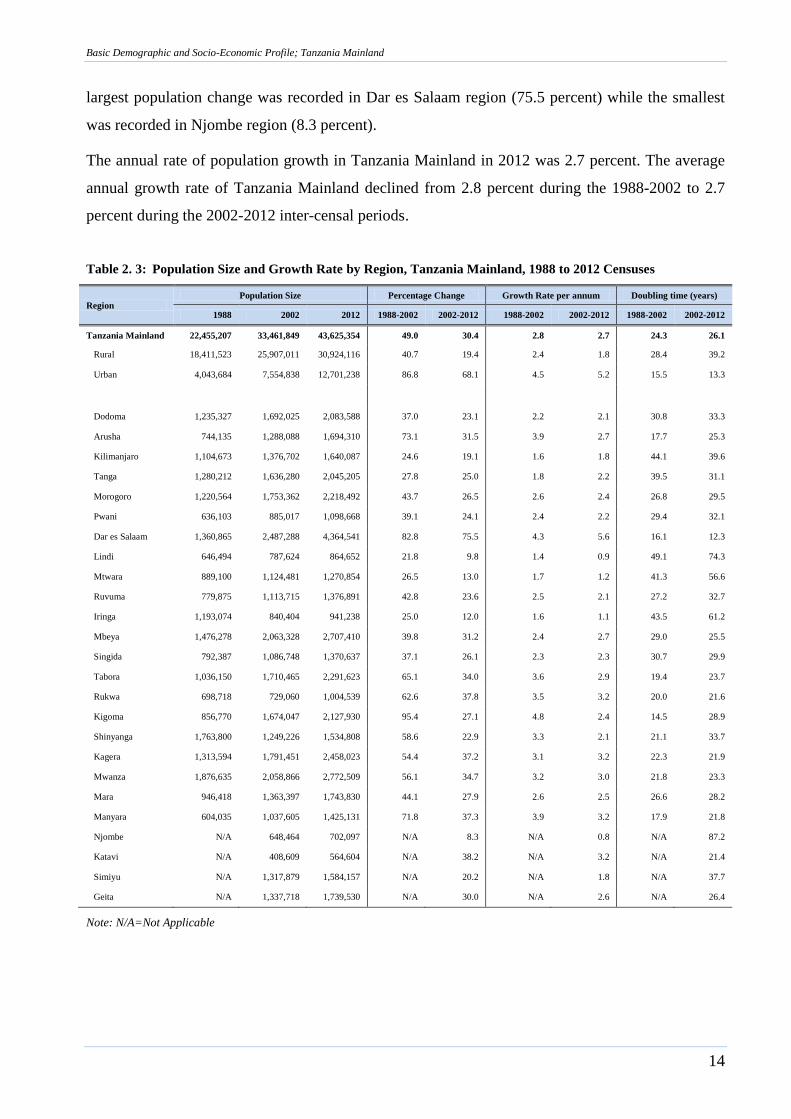
Basic Demographic and Socio-Economic Profile; Tanzania Mainland
14
largest population change was recorded in Dar es Salaam region (75.5 percent) while the smallest
was recorded in Njombe region (8.3 percent).
The annual rate of population growth in Tanzania Mainland in 2012 was 2.7 percent. The average
annual growth rate of Tanzania Mainland declined from 2.8 percent during the 1988-2002 to 2.7
percent during the 2002-2012 inter-censal periods.
Table 2. 3: Population Size and Growth Rate by Region, Tanzania Mainland, 1988 to 2012 Censuses
Region Population Size Percentage Change Growth Rate per annum Doubling time (years)
1988 2002 2012 1988-2002 2002-2012 1988-2002 2002-2012 1988-2002 2002-2012
Tanzania Mainland 22,455,207 33,461,849 43,625,354 49.0 30.4 2.8 2.7 24.3 26.1
Rural 18,411,523 25,907,011 30,924,116 40.7 19.4 2.4 1.8 28.4 39.2
Urban 4,043,684 7,554,838 12,701,238 86.8 68.1 4.5 5.2 15.5 13.3
Dodoma 1,235,327 1,692,025 2,083,588 37.0 23.1 2.2 2.1 30.8 33.3
Arusha 744,135 1,288,088 1,694,310 73.1 31.5 3.9 2.7 17.7 25.3
Kilimanjaro 1,104,673 1,376,702 1,640,087 24.6 19.1 1.6 1.8 44.1 39.6
Tanga 1,280,212 1,636,280 2,045,205 27.8 25.0 1.8 2.2 39.5 31.1
Morogoro 1,220,564 1,753,362 2,218,492 43.7 26.5 2.6 2.4 26.8 29.5
Pwani 636,103 885,017 1,098,668 39.1 24.1 2.4 2.2 29.4 32.1
Dar es Salaam 1,360,865 2,487,288 4,364,541 82.8 75.5 4.3 5.6 16.1 12.3
Lindi 646,494 787,624 864,652 21.8 9.8 1.4 0.9 49.1 74.3
Mtwara 889,100 1,124,481 1,270,854 26.5 13.0 1.7 1.2 41.3 56.6
Ruvuma 779,875 1,113,715 1,376,891 42.8 23.6 2.5 2.1 27.2 32.7
Iringa 1,193,074 840,404 941,238 25.0 12.0 1.6 1.1 43.5 61.2
Mbeya 1,476,278 2,063,328 2,707,410 39.8 31.2 2.4 2.7 29.0 25.5
Singida 792,387 1,086,748 1,370,637 37.1 26.1 2.3 2.3 30.7 29.9
Tabora 1,036,150 1,710,465 2,291,623 65.1 34.0 3.6 2.9 19.4 23.7
Rukwa 698,718 729,060 1,004,539 62.6 37.8 3.5 3.2 20.0 21.6
Kigoma 856,770 1,674,047 2,127,930 95.4 27.1 4.8 2.4 14.5 28.9
Shinyanga 1,763,800 1,249,226 1,534,808 58.6 22.9 3.3 2.1 21.1 33.7
Kagera 1,313,594 1,791,451 2,458,023 54.4 37.2 3.1 3.2 22.3 21.9
Mwanza 1,876,635 2,058,866 2,772,509 56.1 34.7 3.2 3.0 21.8 23.3
Mara 946,418 1,363,397 1,743,830 44.1 27.9 2.6 2.5 26.6 28.2
Manyara 604,035 1,037,605 1,425,131 71.8 37.3 3.9 3.2 17.9 21.8
Njombe N/A 648,464 702,097 N/A 8.3 N/A 0.8 N/A 87.2
Katavi N/A 408,609 564,604 N/A 38.2 N/A 3.2 N/A 21.4
Simiyu N/A 1,317,879 1,584,157 N/A 20.2 N/A 1.8 N/A 37.7
Geita N/A 1,337,718 1,739,530 N/A 30.0 N/A 2.6 N/A 26.4
Note: N/A=Not Applicable
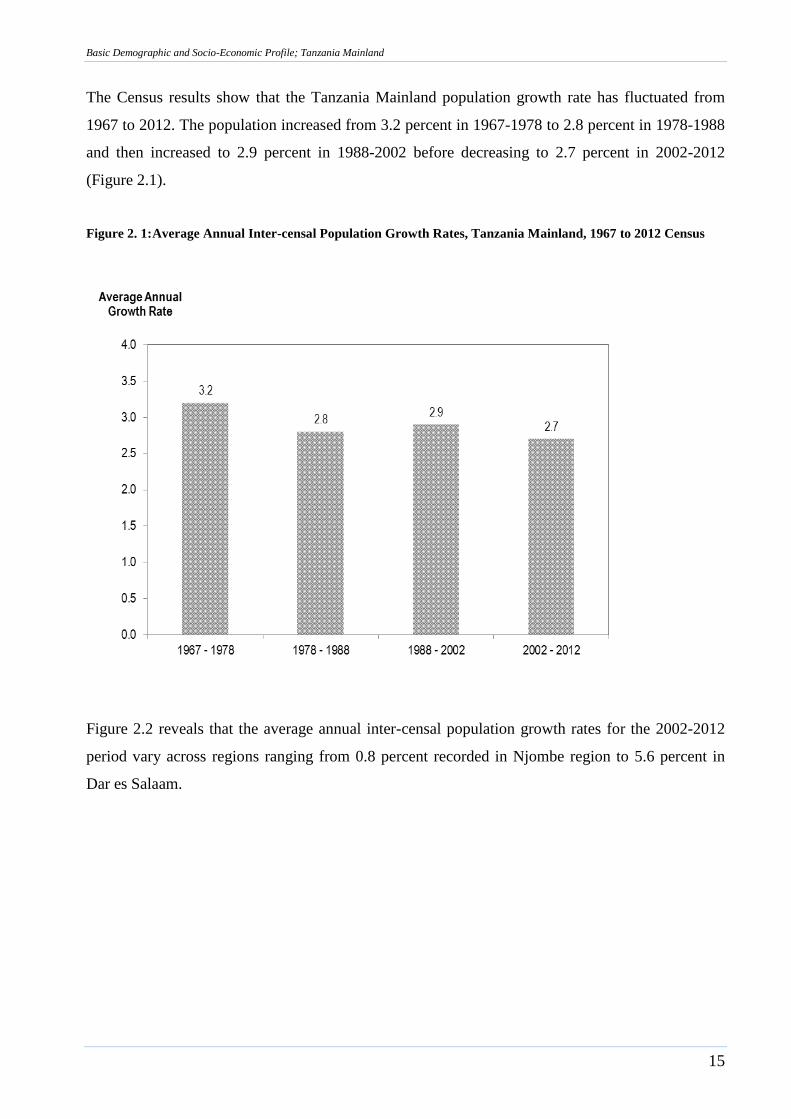
Basic Demographic and Socio-Economic Profile; Tanzania Mainland
15
The Census results show that the Tanzania Mainland population growth rate has fluctuated from
1967 to 2012. The population increased from 3.2 percent in 1967-1978 to 2.8 percent in 1978-1988
and then increased to 2.9 percent in 1988-2002 before decreasing to 2.7 percent in 2002-2012
(Figure 2.1).
Figure 2. 1: Average Annual Inter-censal Population Growth Rates, Tanzania Mainland, 1967 to 2012 Census
Figure 2.2 reveals that the average annual inter-censal population growth rates for the 2002-2012
period vary across regions ranging from 0.8 percent recorded in Njombe region to 5.6 percent in
Dar es Salaam.
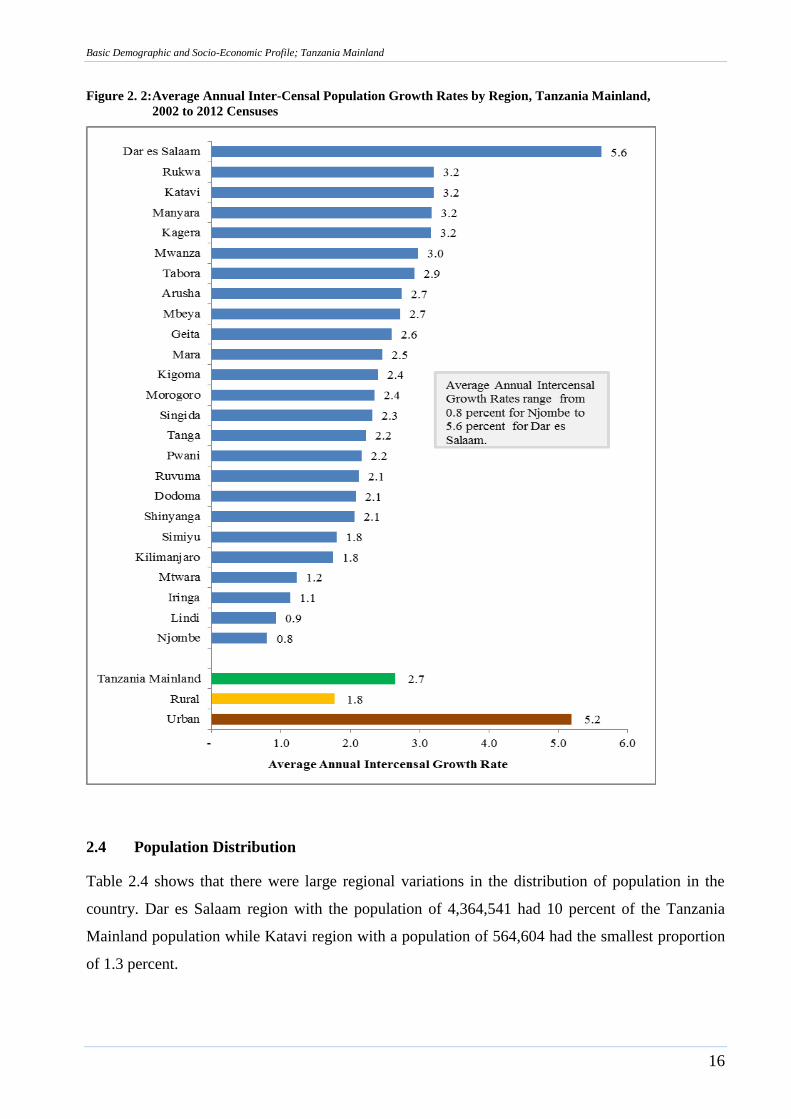
Basic Demographic and Socio-Economic Profile; Tanzania Mainland
16
Figure 2. 2: Average Annual Inter-Censal Population Growth Rates by Region, Tanzania Mainland,
2002 to 2012 Censuses
2.4 Population Distribution
Table 2.4 shows that there were large regional variations in the distribution of population in the
country. Dar es Salaam region with the population of 4,364,541 had 10 percent of the Tanzania
Mainland population while Katavi region with a population of 564,604 had the smallest proportion
of 1.3 percent.
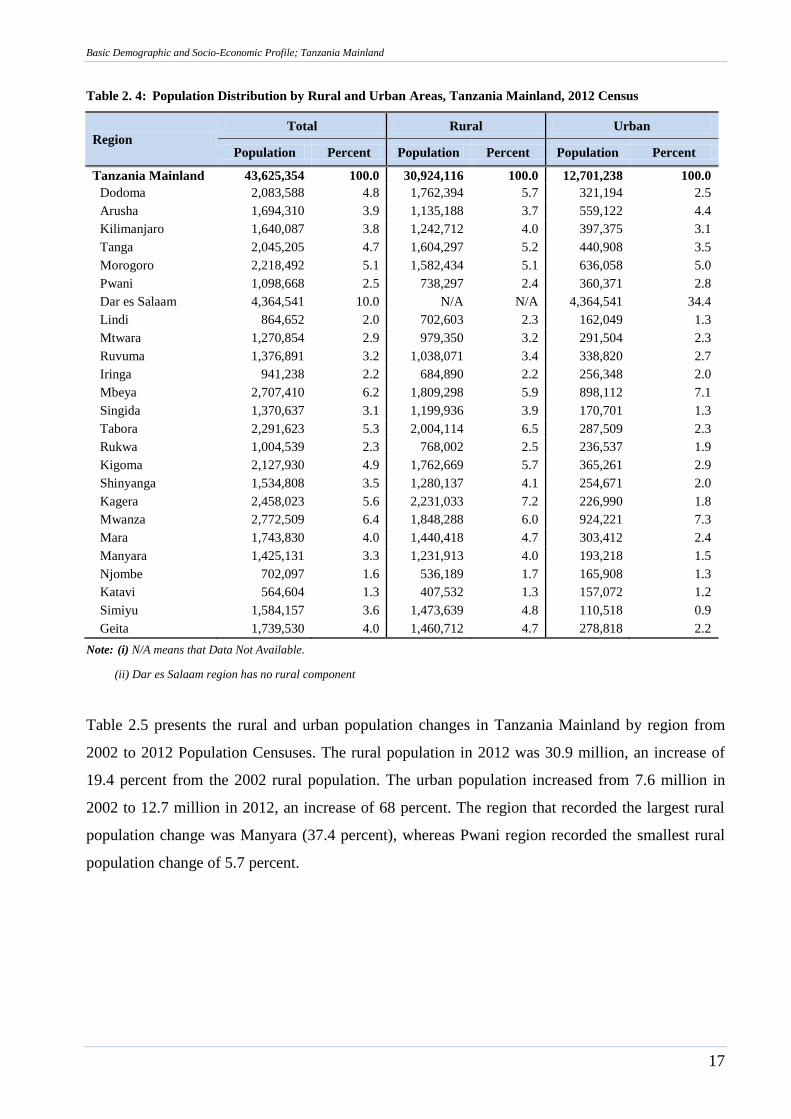
Basic Demographic and Socio-Economic Profile; Tanzania Mainland
17
Table 2. 4: Population Distribution by Rural and Urban Areas, Tanzania Mainland, 2012 Census
Region Total Rural Urban
Population Percent Population Percent Population Percent
Tanzania Mainland 43,625,354 100.0 30,924,116 100.0 12,701,238 100.0
Dodoma 2,083,588 4.8 1,762,394 5.7 321,194 2.5
Arusha 1,694,310 3.9 1,135,188 3.7 559,122 4.4
Kilimanjaro 1,640,087 3.8 1,242,712 4.0 397,375 3.1
Tanga 2,045,205 4.7 1,604,297 5.2 440,908 3.5
Morogoro 2,218,492 5.1 1,582,434 5.1 636,058 5.0
Pwani 1,098,668 2.5 738,297 2.4 360,371 2.8
Dar es Salaam 4,364,541 10.0 N/A N/A 4,364,541 34.4
Lindi 864,652 2.0 702,603 2.3 162,049 1.3
Mtwara 1,270,854 2.9 979,350 3.2 291,504 2.3
Ruvuma 1,376,891 3.2 1,038,071 3.4 338,820 2.7
Iringa 941,238 2.2 684,890 2.2 256,348 2.0
Mbeya 2,707,410 6.2 1,809,298 5.9 898,112 7.1
Singida 1,370,637 3.1 1,199,936 3.9 170,701 1.3
Tabora 2,291,623 5.3 2,004,114 6.5 287,509 2.3
Rukwa 1,004,539 2.3 768,002 2.5 236,537 1.9
Kigoma 2,127,930 4.9 1,762,669 5.7 365,261 2.9
Shinyanga 1,534,808 3.5 1,280,137 4.1 254,671 2.0
Kagera 2,458,023 5.6 2,231,033 7.2 226,990 1.8
Mwanza 2,772,509 6.4 1,848,288 6.0 924,221 7.3
Mara 1,743,830 4.0 1,440,418 4.7 303,412 2.4
Manyara 1,425,131 3.3 1,231,913 4.0 193,218 1.5
Njombe 702,097 1.6 536,189 1.7 165,908 1.3
Katavi 564,604 1.3 407,532 1.3 157,072 1.2
Simiyu 1,584,157 3.6 1,473,639 4.8 110,518 0.9
Geita 1,739,530 4.0 1,460,712 4.7 278,818 2.2
Note: (i) N/A means that Data Not Available.
(ii) Dar es Salaam region has no rural component
Table 2.5 presents the rural and urban population changes in Tanzania Mainland by region from
2002 to 2012 Population Censuses. The rural population in 2012 was 30.9 million, an increase of
19.4 percent from the 2002 rural population. The urban population increased from 7.6 million in
2002 to 12.7 million in 2012, an increase of 68 percent. The region that recorded the largest rural
population change was Manyara (37.4 percent), whereas Pwani region recorded the smallest rural
population change of 5.7 percent.
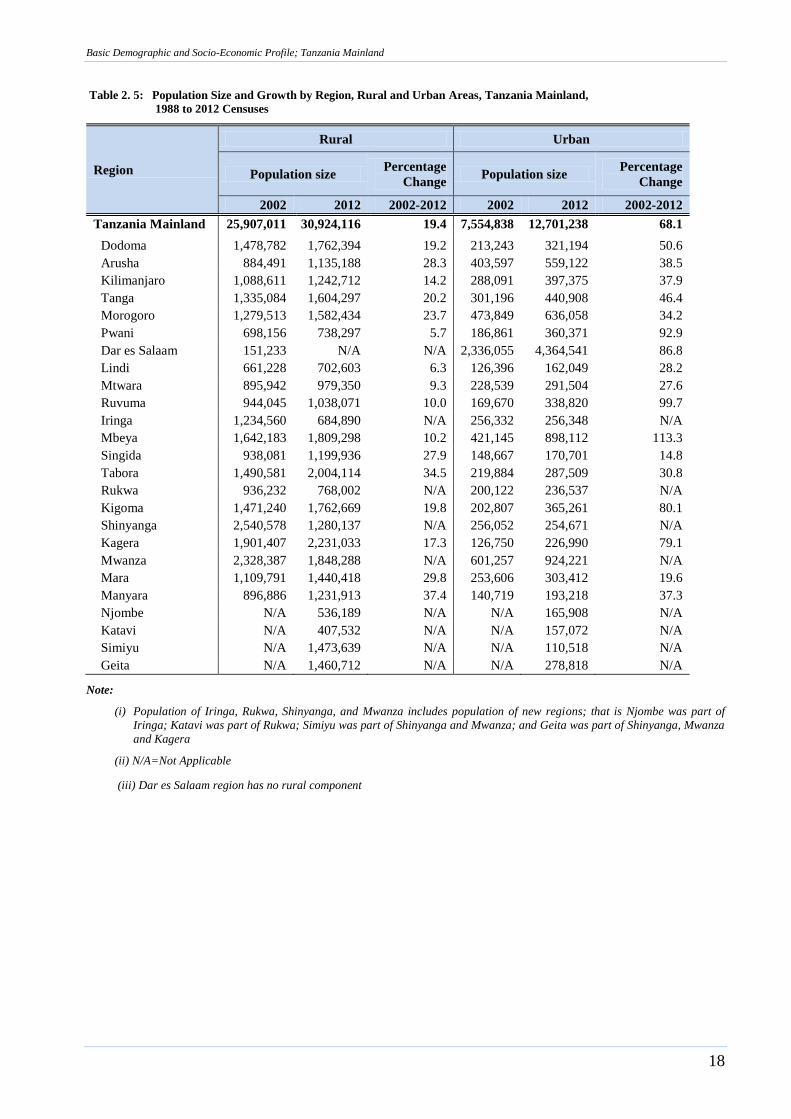
Basic Demographic and Socio-Economic Profile; Tanzania Mainland
18
Table 2. 5: Population Size and Growth by Region, Rural and Urban Areas, Tanzania Mainland,
1988 to 2012 Censuses
Region
Rural Urban
Population size Percentage
Change Population size
Percentage
Change
2002 2012 2002-2012 2002 2012 2002-2012
Tanzania Mainland 25,907,011 30,924,116 19.4 7,554,838 12,701,238 68.1
Dodoma 1,478,782 1,762,394 19.2 213,243 321,194 50.6
Arusha 884,491 1,135,188 28.3 403,597 559,122 38.5
Kilimanjaro 1,088,611 1,242,712 14.2 288,091 397,375 37.9
Tanga 1,335,084 1,604,297 20.2 301,196 440,908 46.4
Morogoro 1,279,513 1,582,434 23.7 473,849 636,058 34.2
Pwani 698,156 738,297 5.7 186,861 360,371 92.9
Dar es Salaam 151,233 N/A N/A 2,336,055 4,364,541 86.8
Lindi 661,228 702,603 6.3 126,396 162,049 28.2
Mtwara 895,942 979,350 9.3 228,539 291,504 27.6
Ruvuma 944,045 1,038,071 10.0 169,670 338,820 99.7
Iringa 1,234,560 684,890 N/A 256,332 256,348 N/A
Mbeya 1,642,183 1,809,298 10.2 421,145 898,112 113.3
Singida 938,081 1,199,936 27.9 148,667 170,701 14.8
Tabora 1,490,581 2,004,114 34.5 219,884 287,509 30.8
Rukwa 936,232 768,002 N/A 200,122 236,537 N/A
Kigoma 1,471,240 1,762,669 19.8 202,807 365,261 80.1
Shinyanga 2,540,578 1,280,137 N/A 256,052 254,671 N/A
Kagera 1,901,407 2,231,033 17.3 126,750 226,990 79.1
Mwanza 2,328,387 1,848,288 N/A 601,257 924,221 N/A
Mara 1,109,791 1,440,418 29.8 253,606 303,412 19.6
Manyara 896,886 1,231,913 37.4 140,719 193,218 37.3
Njombe N/A 536,189 N/A N/A 165,908 N/A
Katavi N/A 407,532 N/A N/A 157,072 N/A
Simiyu N/A 1,473,639 N/A N/A 110,518 N/A
Geita N/A 1,460,712 N/A N/A 278,818 N/A
Note:
(i) Population of Iringa, Rukwa, Shinyanga, and Mwanza includes population of new regions; that is Njombe was part of
Iringa; Katavi was part of Rukwa; Simiyu was part of Shinyanga and Mwanza; and Geita was part of Shinyanga, Mwanza
and Kagera
(ii) N/A=Not Applicable
(iii) Dar es Salaam region has no rural component

Basic Demographic and Socio-Economic Profile; Tanzania Mainland
19
Chapter Three
Age and Sex Profile
3.1 Quality of Age and Sex Data
Age and sex data are important and critical for understanding and using demographic and socio-
economic data to support development processes. They are vital for making key decisions in public
administration such as determining the segments of the population qualified for school enrolment,
voting, labour force participation, pensions, provision of health services, food and shelter, and for
population forecasting. The age and sex data is also used to calculate levels of fertility and
mortality which are vital components of population dynamics and subsequently for population
growth forecasting.
In many developing countries, the quality of data on age is affected by age misreporting mainly due
to ignorance of correct age, carelessness in reporting and recording, and age preference. As was the
case with preceding censuses in Tanzania, the 2012 Census information on age and sex was
collected using both short and long questionnaires. All persons who spent the census night in the
country were asked to state their sex and ages in completed years.
The quality of age and sex data in the 2012 PHC was examined using an array of conventional
methods and indices, and was observed to have suffered significant errors associated with
misreporting. In particular, strong preference for ages ending in digits “0” and “5”, and avoidance
of ages ending in digits “1”, “3” and “9” was noted. Age misreporting was generally higher among
females compared with males. Nonetheless, this may not necessarily affect the quality of indicators
derived from the census data as there are recommended conventional procedures for correcting the
deficiencies. Age misreporting is a regular feature of sub-Saharan African census data.
This Chapter provides highlights of the Census data on age and sex distribution. The detailed
findings are presented in 2012 PHC publication: Volume II: Population Distribution by Age and
Sex.
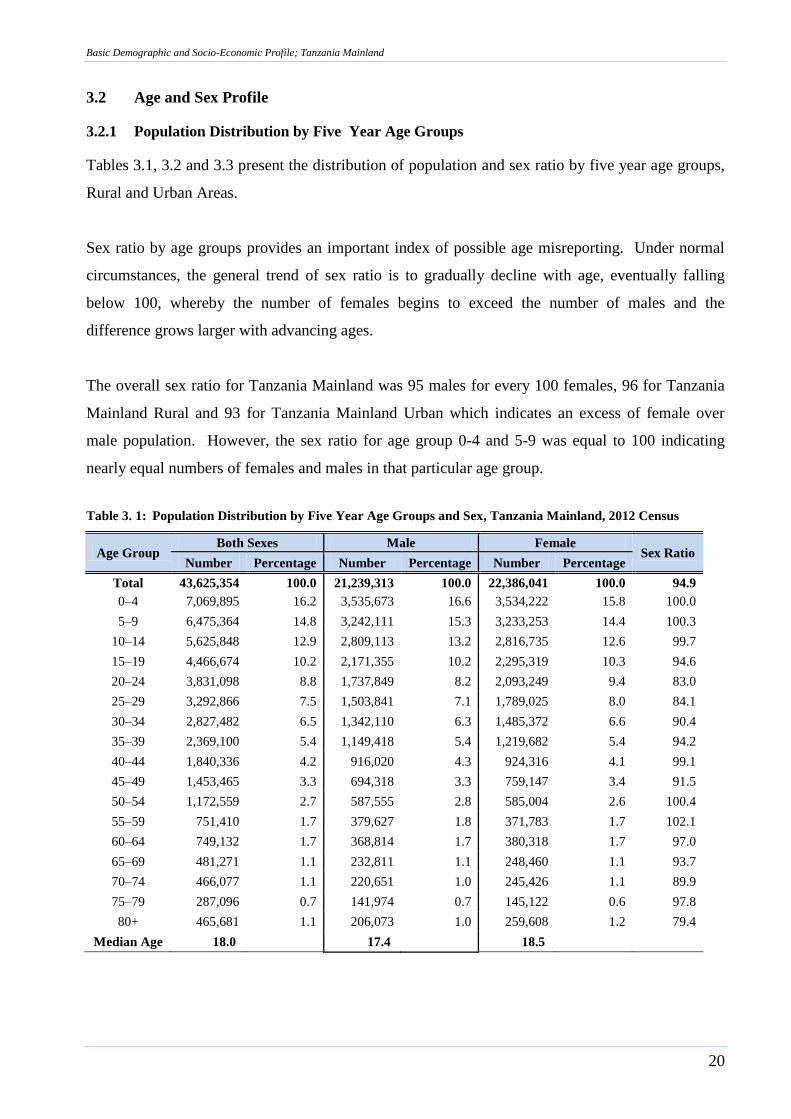
Basic Demographic and Socio-Economic Profile; Tanzania Mainland
20
3.2 Age and Sex Profile
3.2.1 Population Distribution by Five Year Age Groups
Tables 3.1, 3.2 and 3.3 present the distribution of population and sex ratio by five year age groups,
Rural and Urban Areas.
Sex ratio by age groups provides an important index of possible age misreporting. Under normal
circumstances, the general trend of sex ratio is to gradually decline with age, eventually falling
below 100, whereby the number of females begins to exceed the number of males and the
difference grows larger with advancing ages.
The overall sex ratio for Tanzania Mainland was 95 males for every 100 females, 96 for Tanzania
Mainland Rural and 93 for Tanzania Mainland Urban which indicates an excess of female over
male population. However, the sex ratio for age group 0-4 and 5-9 was equal to 100 indicating
nearly equal numbers of females and males in that particular age group.
Table 3. 1: Population Distribution by Five Year Age Groups and Sex, Tanzania Mainland, 2012 Census
Age Group Both Sexes Male Female
Sex Ratio Number Percentage Number Percentage Number Percentage
Total 43,625,354 100.0 21,239,313 100.0 22,386,041 100.0 94.9
0–4 7,069,895 16.2 3,535,673 16.6 3,534,222 15.8 100.0
5–9 6,475,364 14.8 3,242,111 15.3 3,233,253 14.4 100.3
10–14 5,625,848 12.9 2,809,113 13.2 2,816,735 12.6 99.7
15–19 4,466,674 10.2 2,171,355 10.2 2,295,319 10.3 94.6
20–24 3,831,098 8.8 1,737,849 8.2 2,093,249 9.4 83.0
25–29 3,292,866 7.5 1,503,841 7.1 1,789,025 8.0 84.1
30–34 2,827,482 6.5 1,342,110 6.3 1,485,372 6.6 90.4
35–39 2,369,100 5.4 1,149,418 5.4 1,219,682 5.4 94.2
40–44 1,840,336 4.2 916,020 4.3 924,316 4.1 99.1
45–49 1,453,465 3.3 694,318 3.3 759,147 3.4 91.5
50–54 1,172,559 2.7 587,555 2.8 585,004 2.6 100.4
55–59 751,410 1.7 379,627 1.8 371,783 1.7 102.1
60–64 749,132 1.7 368,814 1.7 380,318 1.7 97.0
65–69 481,271 1.1 232,811 1.1 248,460 1.1 93.7
70–74 466,077 1.1 220,651 1.0 245,426 1.1 89.9
75–79 287,096 0.7 141,974 0.7 145,122 0.6 97.8
80+ 465,681 1.1 206,073 1.0 259,608 1.2 79.4
Median Age 18.0
17.4
18.5
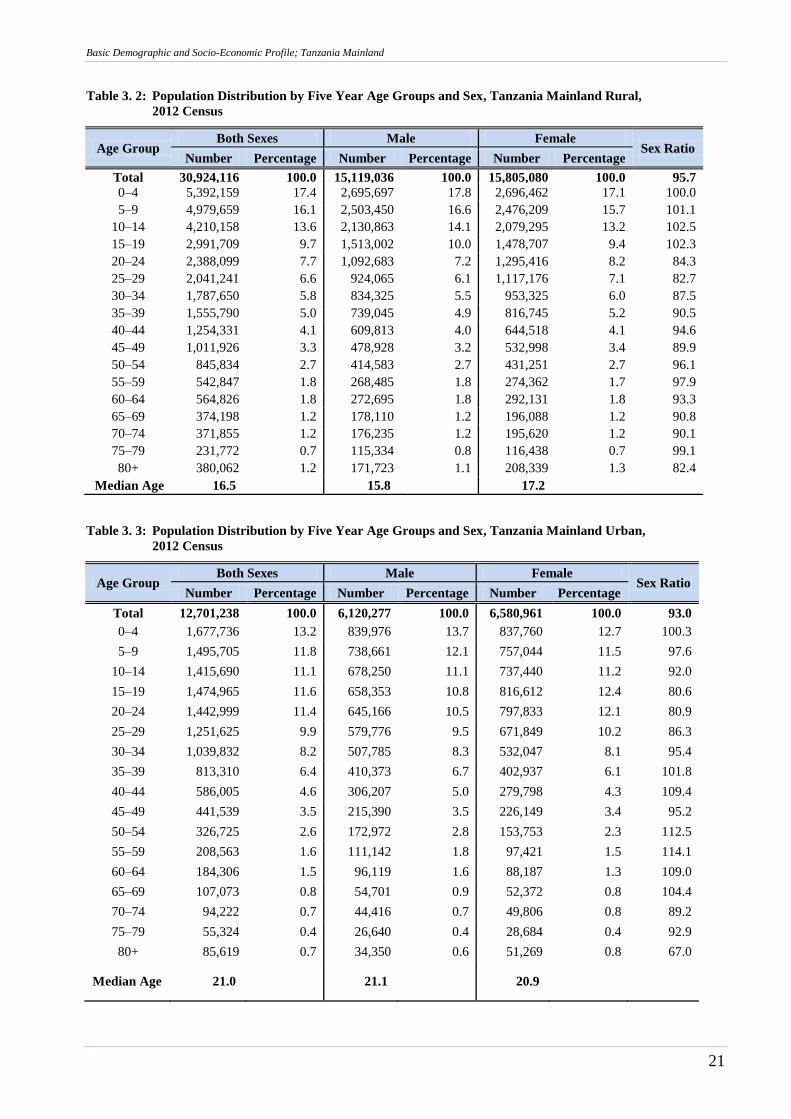
Basic Demographic and Socio-Economic Profile; Tanzania Mainland
21
Table 3. 2: Population Distribution by Five Year Age Groups and Sex, Tanzania Mainland Rural,
2012 Census
Age Group Both Sexes Male Female
Sex Ratio Number Percentage Number Percentage Number Percentage
Total 30,924,116 100.0 15,119,036 100.0 15,805,080 100.0 95.7
0–4 5,392,159 17.4 2,695,697 17.8 2,696,462 17.1 100.0
5–9 4,979,659 16.1 2,503,450 16.6 2,476,209 15.7 101.1
10–14 4,210,158 13.6 2,130,863 14.1 2,079,295 13.2 102.5
15–19 2,991,709 9.7 1,513,002 10.0 1,478,707 9.4 102.3
20–24 2,388,099 7.7 1,092,683 7.2 1,295,416 8.2 84.3
25–29 2,041,241 6.6 924,065 6.1 1,117,176 7.1 82.7
30–34 1,787,650 5.8 834,325 5.5 953,325 6.0 87.5
35–39 1,555,790 5.0 739,045 4.9 816,745 5.2 90.5
40–44 1,254,331 4.1 609,813 4.0 644,518 4.1 94.6
45–49 1,011,926 3.3 478,928 3.2 532,998 3.4 89.9
50–54 845,834 2.7 414,583 2.7 431,251 2.7 96.1
55–59 542,847 1.8 268,485 1.8 274,362 1.7 97.9
60–64 564,826 1.8 272,695 1.8 292,131 1.8 93.3
65–69 374,198 1.2 178,110 1.2 196,088 1.2 90.8
70–74 371,855 1.2 176,235 1.2 195,620 1.2 90.1
75–79 231,772 0.7 115,334 0.8 116,438 0.7 99.1
80+ 380,062 1.2 171,723 1.1 208,339 1.3 82.4
Median Age 16.5
15.8
17.2
Table 3. 3: Population Distribution by Five Year Age Groups and Sex, Tanzania Mainland Urban,
2012 Census
Age Group Both Sexes Male Female
Sex Ratio Number Percentage Number Percentage Number Percentage
Total 12,701,238 100.0 6,120,277 100.0 6,580,961 100.0 93.0
0–4 1,677,736 13.2 839,976 13.7 837,760 12.7 100.3
5–9 1,495,705 11.8 738,661 12.1 757,044 11.5 97.6
10–14 1,415,690 11.1 678,250 11.1 737,440 11.2 92.0
15–19 1,474,965 11.6 658,353 10.8 816,612 12.4 80.6
20–24 1,442,999 11.4 645,166 10.5 797,833 12.1 80.9
25–29 1,251,625 9.9 579,776 9.5 671,849 10.2 86.3
30–34 1,039,832 8.2 507,785 8.3 532,047 8.1 95.4
35–39 813,310 6.4 410,373 6.7 402,937 6.1 101.8
40–44 586,005 4.6 306,207 5.0 279,798 4.3 109.4
45–49 441,539 3.5 215,390 3.5 226,149 3.4 95.2
50–54 326,725 2.6 172,972 2.8 153,753 2.3 112.5
55–59 208,563 1.6 111,142 1.8 97,421 1.5 114.1
60–64 184,306 1.5 96,119 1.6 88,187 1.3 109.0
65–69 107,073 0.8 54,701 0.9 52,372 0.8 104.4
70–74 94,222 0.7 44,416 0.7 49,806 0.8 89.2
75–79 55,324 0.4 26,640 0.4 28,684 0.4 92.9
80+ 85,619 0.7 34,350 0.6 51,269 0.8 67.0
Median Age 21.0
21.1
20.9
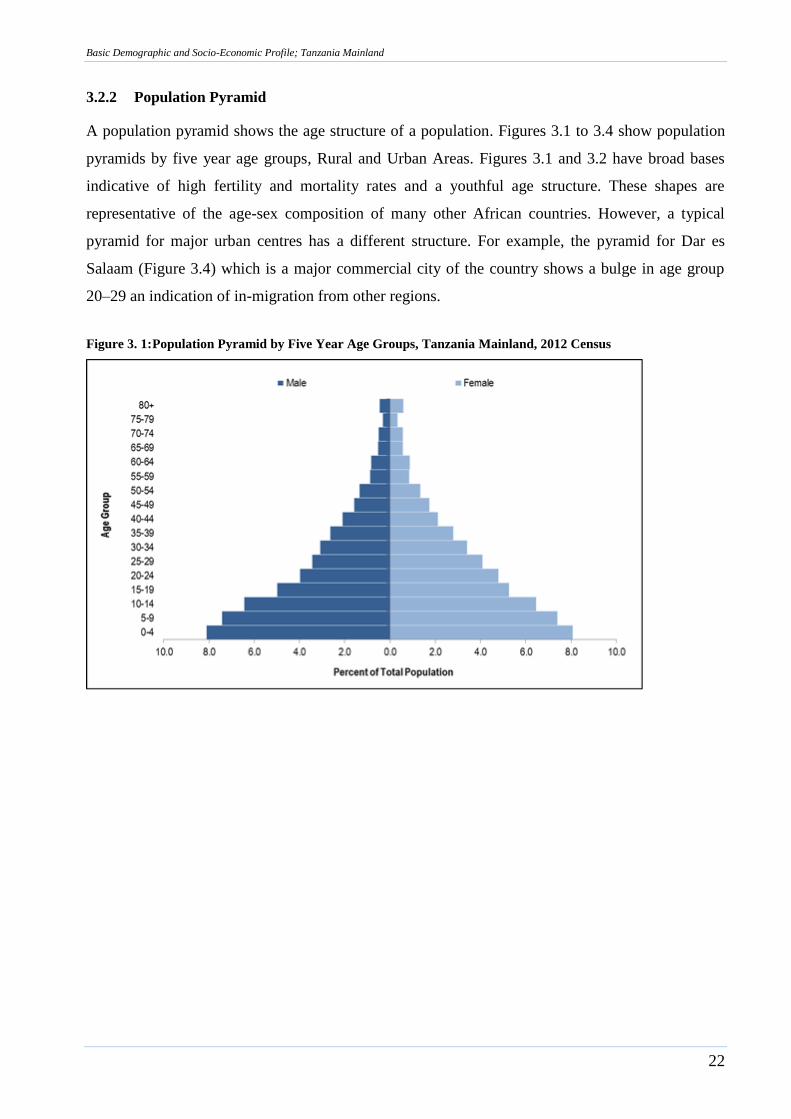
Basic Demographic and Socio-Economic Profile; Tanzania Mainland
22
3.2.2 Population Pyramid
A population pyramid shows the age structure of a population. Figures 3.1 to 3.4 show population
pyramids by five year age groups, Rural and Urban Areas. Figures 3.1 and 3.2 have broad bases
indicative of high fertility and mortality rates and a youthful age structure. These shapes are
representative of the age-sex composition of many other African countries. However, a typical
pyramid for major urban centres has a different structure. For example, the pyramid for Dar es
Salaam (Figure 3.4) which is a major commercial city of the country shows a bulge in age group
20–29 an indication of in-migration from other regions.
Figure 3. 1: Population Pyramid by Five Year Age Groups, Tanzania Mainland, 2012 Census
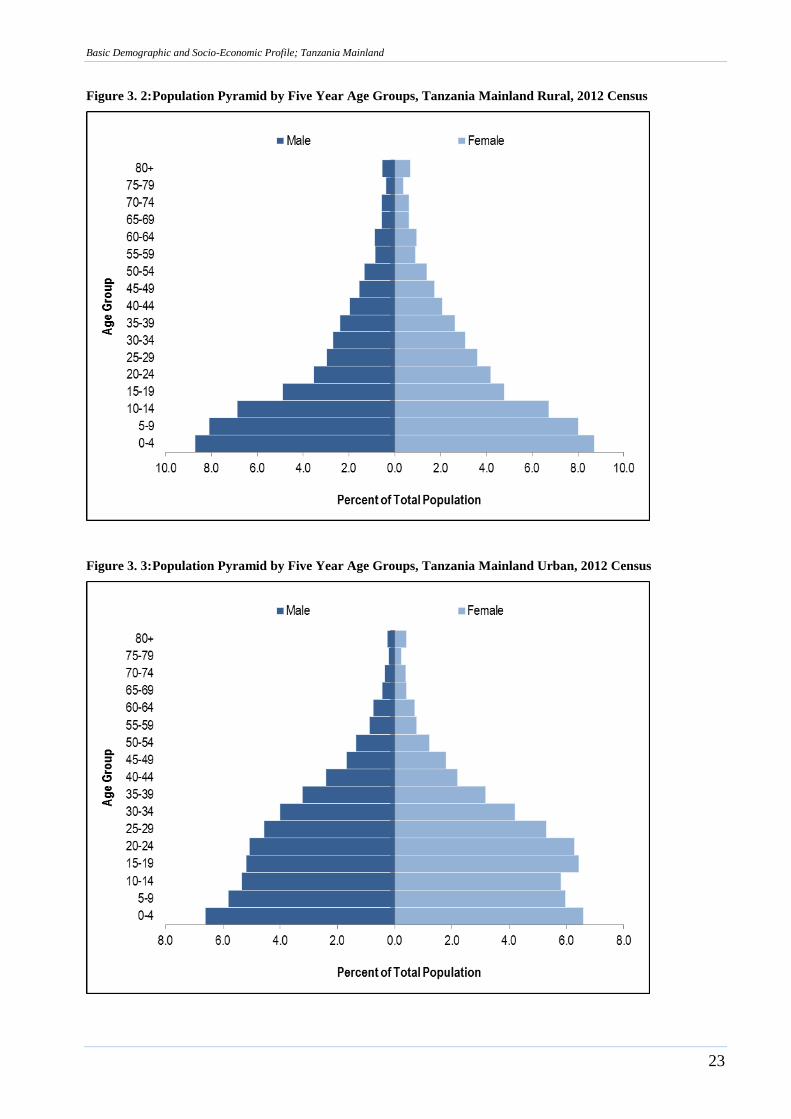
Basic Demographic and Socio-Economic Profile; Tanzania Mainland
23
Figure 3. 2: Population Pyramid by Five Year Age Groups, Tanzania Mainland Rural, 2012 Census
Figure 3. 3: Population Pyramid by Five Year Age Groups, Tanzania Mainland Urban, 2012 Census
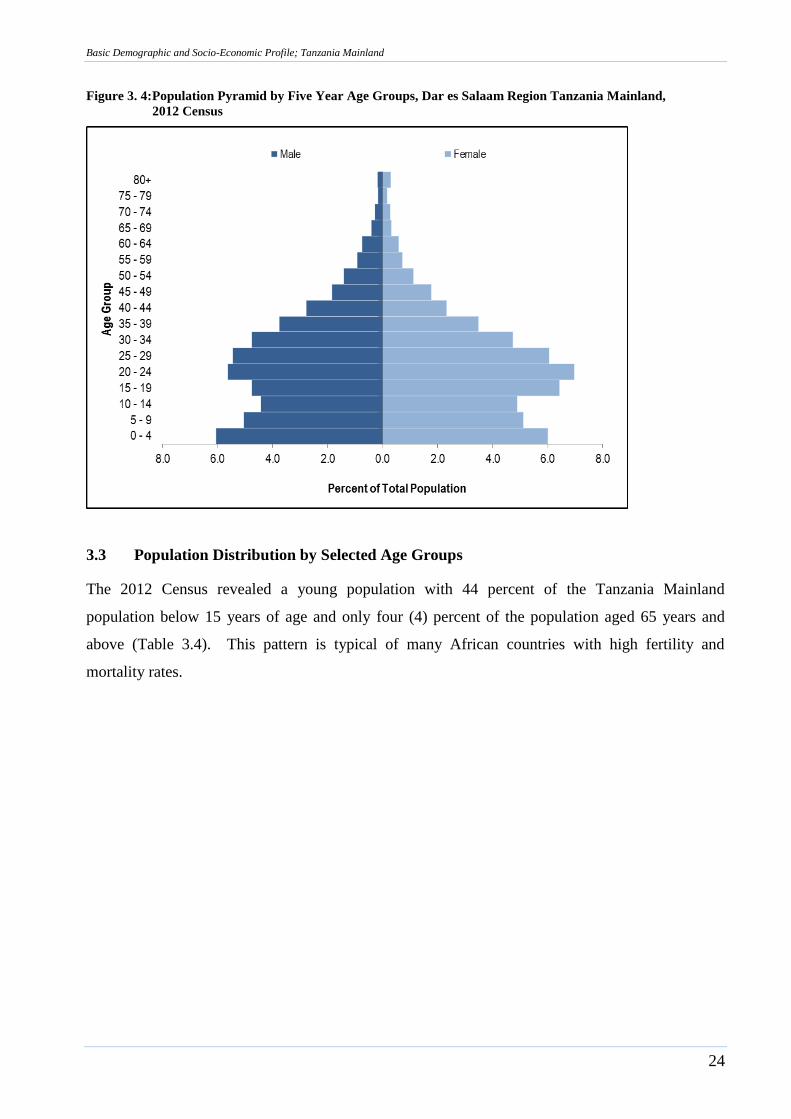
Basic Demographic and Socio-Economic Profile; Tanzania Mainland
24
Figure 3. 4: Population Pyramid by Five Year Age Groups, Dar es Salaam Region Tanzania Mainland,
2012 Census
3.3 Population Distribution by Selected Age Groups
The 2012 Census revealed a young population with 44 percent of the Tanzania Mainland
population below 15 years of age and only four (4) percent of the population aged 65 years and
above (Table 3.4). This pattern is typical of many African countries with high fertility and
mortality rates.
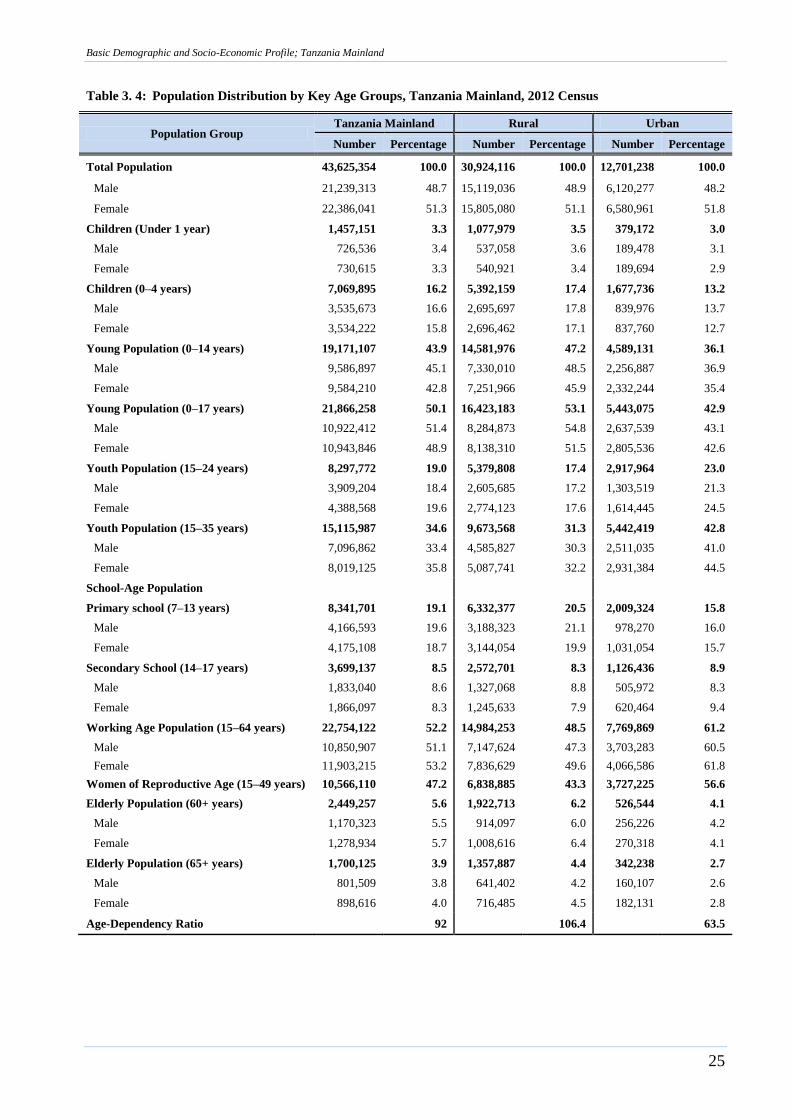
Basic Demographic and Socio-Economic Profile; Tanzania Mainland
25
Table 3. 4: Population Distribution by Key Age Groups, Tanzania Mainland, 2012 Census
Population Group Tanzania Mainland Rural Urban
Number Percentage Number Percentage Number Percentage
Total Population 43,625,354 100.0 30,924,116 100.0 12,701,238 100.0
Male 21,239,313 48.7 15,119,036 48.9 6,120,277 48.2
Female 22,386,041 51.3 15,805,080 51.1 6,580,961 51.8
Children (Under 1 year) 1,457,151 3.3 1,077,979 3.5 379,172 3.0
Male 726,536 3.4 537,058 3.6 189,478 3.1
Female 730,615 3.3 540,921 3.4 189,694 2.9
Children (0–4 years) 7,069,895 16.2 5,392,159 17.4 1,677,736 13.2
Male 3,535,673 16.6 2,695,697 17.8 839,976 13.7
Female 3,534,222 15.8 2,696,462 17.1 837,760 12.7
Young Population (0–14 years) 19,171,107 43.9 14,581,976 47.2 4,589,131 36.1
Male 9,586,897 45.1 7,330,010 48.5 2,256,887 36.9
Female 9,584,210 42.8 7,251,966 45.9 2,332,244 35.4
Young Population (0–17 years) 21,866,258 50.1 16,423,183 53.1 5,443,075 42.9
Male 10,922,412 51.4 8,284,873 54.8 2,637,539 43.1
Female 10,943,846 48.9 8,138,310 51.5 2,805,536 42.6
Youth Population (15–24 years) 8,297,772 19.0 5,379,808 17.4 2,917,964 23.0
Male 3,909,204 18.4 2,605,685 17.2 1,303,519 21.3
Female 4,388,568 19.6 2,774,123 17.6 1,614,445 24.5
Youth Population (15–35 years) 15,115,987 34.6 9,673,568 31.3 5,442,419 42.8
Male 7,096,862 33.4 4,585,827 30.3 2,511,035 41.0
Female 8,019,125 35.8 5,087,741 32.2 2,931,384 44.5
School-Age Population
Primary school (7–13 years) 8,341,701 19.1 6,332,377 20.5 2,009,324 15.8
Male 4,166,593 19.6 3,188,323 21.1 978,270 16.0
Female 4,175,108 18.7 3,144,054 19.9 1,031,054 15.7
Secondary School (14–17 years) 3,699,137 8.5 2,572,701 8.3 1,126,436 8.9
Male 1,833,040 8.6 1,327,068 8.8 505,972 8.3
Female 1,866,097 8.3 1,245,633 7.9 620,464 9.4
Working Age Population (15–64 years) 22,754,122 52.2 14,984,253 48.5 7,769,869 61.2
Male 10,850,907 51.1 7,147,624 47.3 3,703,283 60.5
Female 11,903,215 53.2 7,836,629 49.6 4,066,586 61.8
Women of Reproductive Age (15–49 years) 10,566,110 47.2 6,838,885 43.3 3,727,225 56.6
Elderly Population (60+ years) 2,449,257 5.6 1,922,713 6.2 526,544 4.1
Male 1,170,323 5.5 914,097 6.0 256,226 4.2
Female 1,278,934 5.7 1,008,616 6.4 270,318 4.1
Elderly Population (65+ years) 1,700,125 3.9 1,357,887 4.4 342,238 2.7
Male 801,509 3.8 641,402 4.2 160,107 2.6
Female 898,616 4.0 716,485 4.5 182,131 2.8
Age-Dependency Ratio 92 106.4 63.5
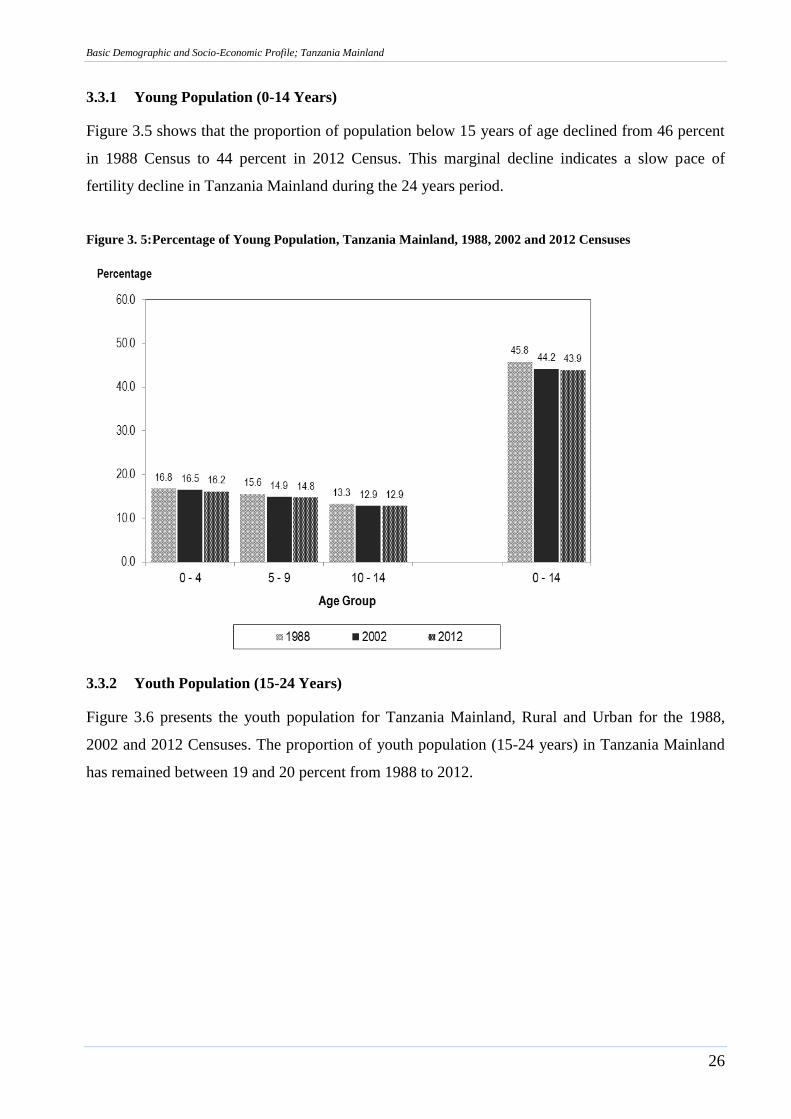
Basic Demographic and Socio-Economic Profile; Tanzania Mainland
26
3.3.1 Young Population (0-14 Years)
Figure 3.5 shows that the proportion of population below 15 years of age declined from 46 percent
in 1988 Census to 44 percent in 2012 Census. This marginal decline indicates a slow pace of
fertility decline in Tanzania Mainland during the 24 years period.
Figure 3. 5: Percentage of Young Population, Tanzania Mainland, 1988, 2002 and 2012 Censuses
3.3.2 Youth Population (15-24 Years)
Figure 3.6 presents the youth population for Tanzania Mainland, Rural and Urban for the 1988,
2002 and 2012 Censuses. The proportion of youth population (15-24 years) in Tanzania Mainland
has remained between 19 and 20 percent from 1988 to 2012.
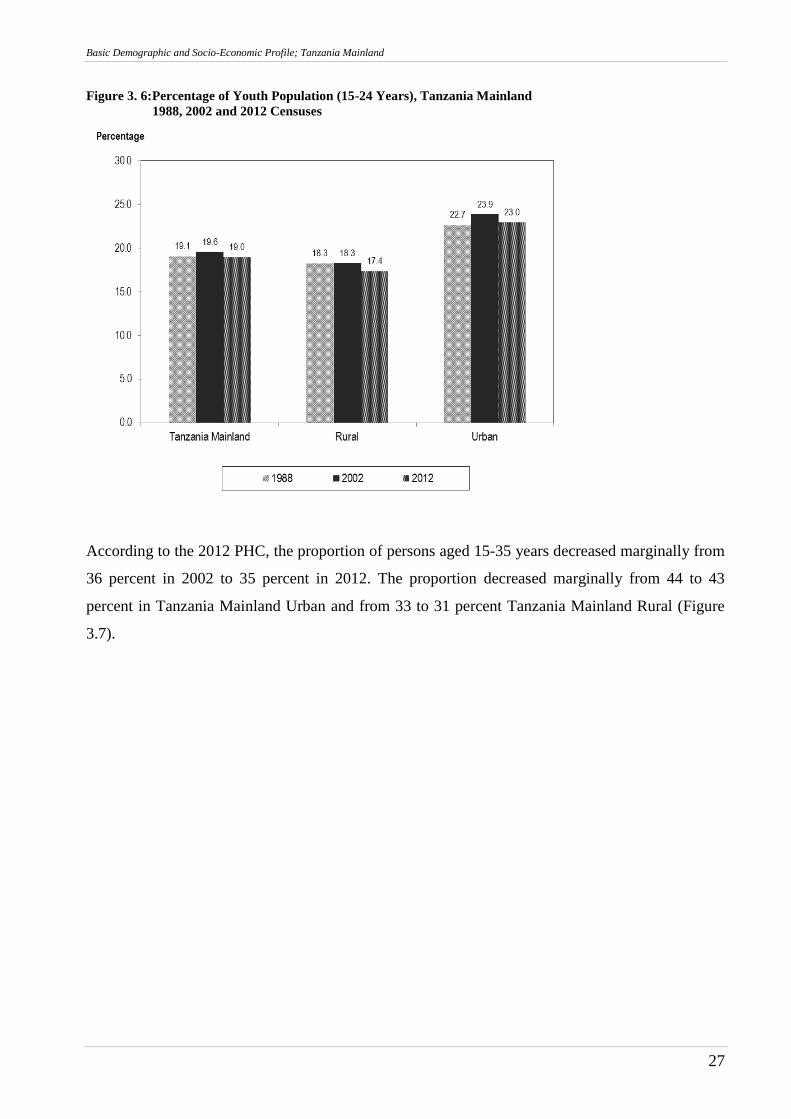
Basic Demographic and Socio-Economic Profile; Tanzania Mainland
27
Figure 3. 6: Percentage of Youth Population (15-24 Years), Tanzania Mainland
1988, 2002 and 2012 Censuses
According to the 2012 PHC, the proportion of persons aged 15-35 years decreased marginally from
36 percent in 2002 to 35 percent in 2012. The proportion decreased marginally from 44 to 43
percent in Tanzania Mainland Urban and from 33 to 31 percent Tanzania Mainland Rural (Figure
3.7).
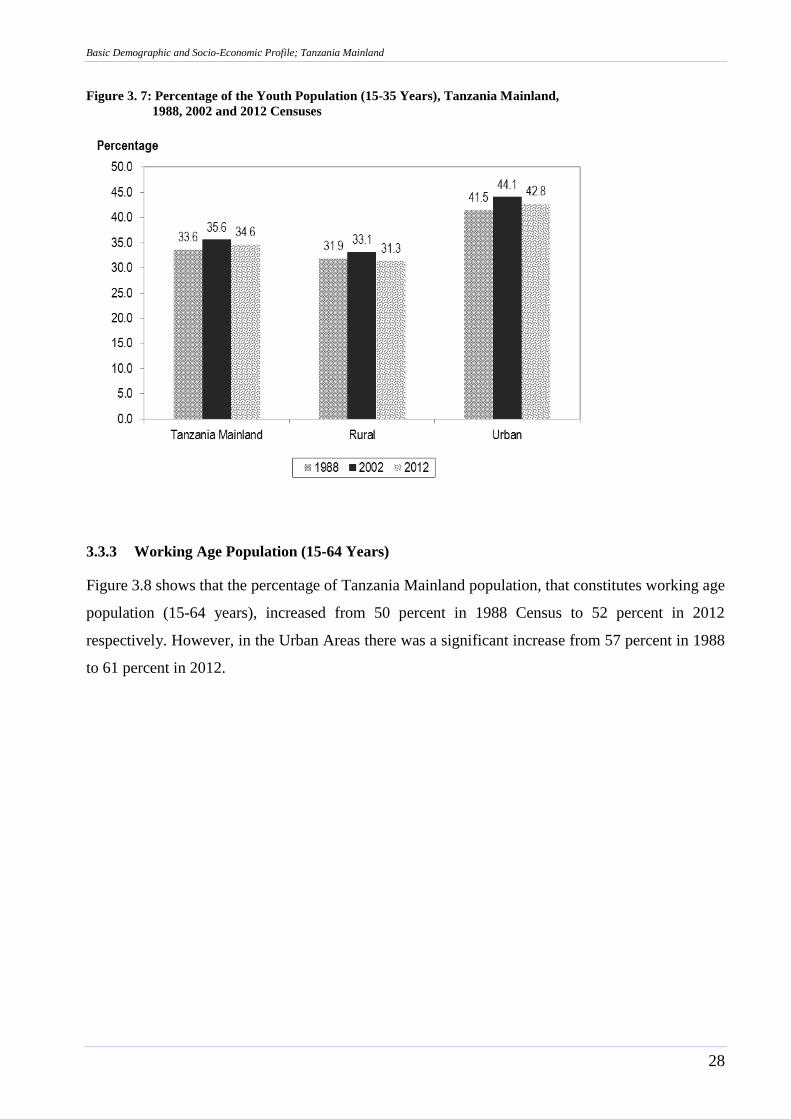
Basic Demographic and Socio-Economic Profile; Tanzania Mainland
28
Figure 3. 7: Percentage of the Youth Population (15-35 Years), Tanzania Mainland,
1988, 2002 and 2012 Censuses
3.3.3 Working Age Population (15-64 Years)
Figure 3.8 shows that the percentage of Tanzania Mainland population, that constitutes working age
population (15-64 years), increased from 50 percent in 1988 Census to 52 percent in 2012
respectively. However, in the Urban Areas there was a significant increase from 57 percent in 1988
to 61 percent in 2012.
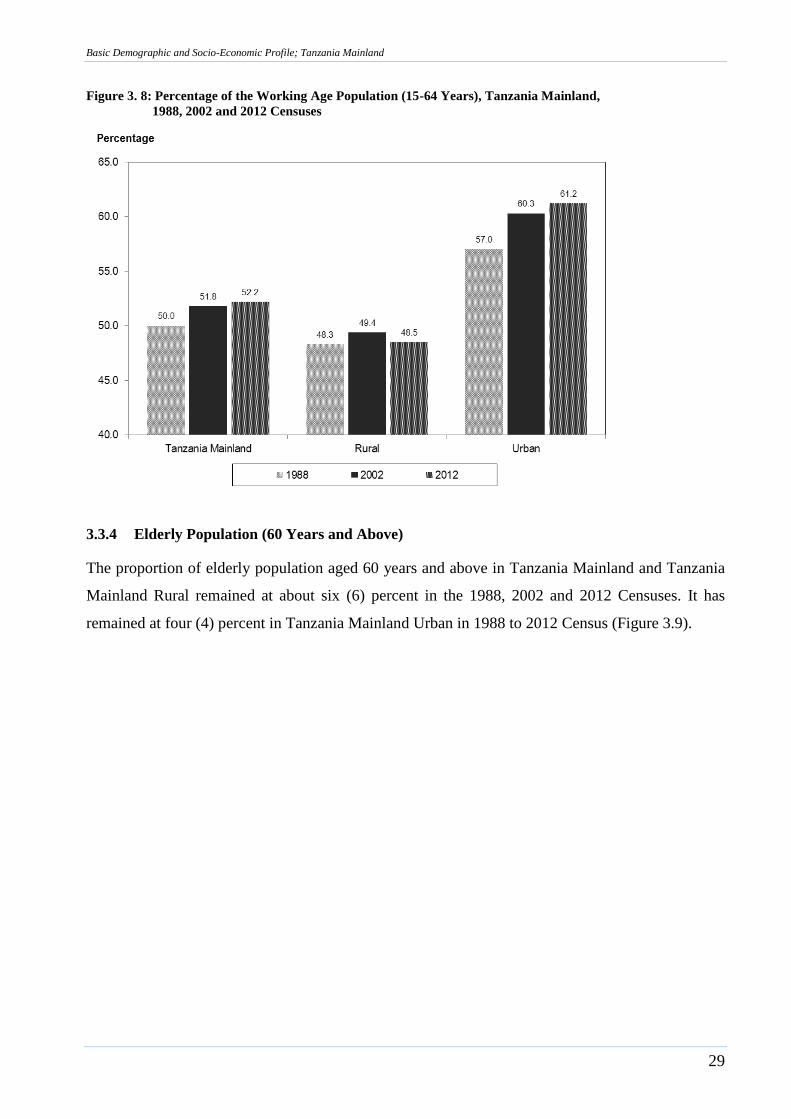
Basic Demographic and Socio-Economic Profile; Tanzania Mainland
29
Figure 3. 8: Percentage of the Working Age Population (15-64 Years), Tanzania Mainland,
1988, 2002 and 2012 Censuses
3.3.4 Elderly Population (60 Years and Above)
The proportion of elderly population aged 60 years and above in Tanzania Mainland and Tanzania
Mainland Rural remained at about six (6) percent in the 1988, 2002 and 2012 Censuses. It has
remained at four (4) percent in Tanzania Mainland Urban in 1988 to 2012 Census (Figure 3.9).
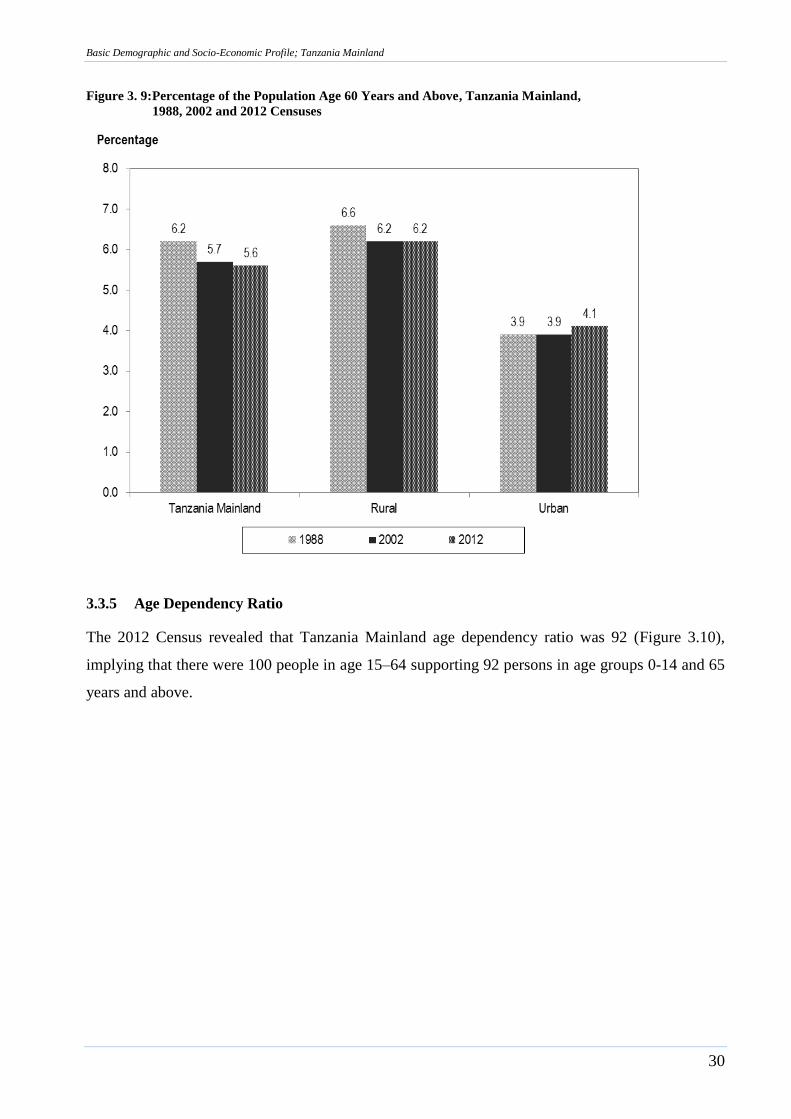
Basic Demographic and Socio-Economic Profile; Tanzania Mainland
30
Figure 3. 9: Percentage of the Population Age 60 Years and Above, Tanzania Mainland,
1988, 2002 and 2012 Censuses
3.3.5 Age Dependency Ratio
The 2012 Census revealed that Tanzania Mainland age dependency ratio was 92 (Figure 3.10),
implying that there were 100 people in age 15–64 supporting 92 persons in age groups 0-14 and 65
years and above.
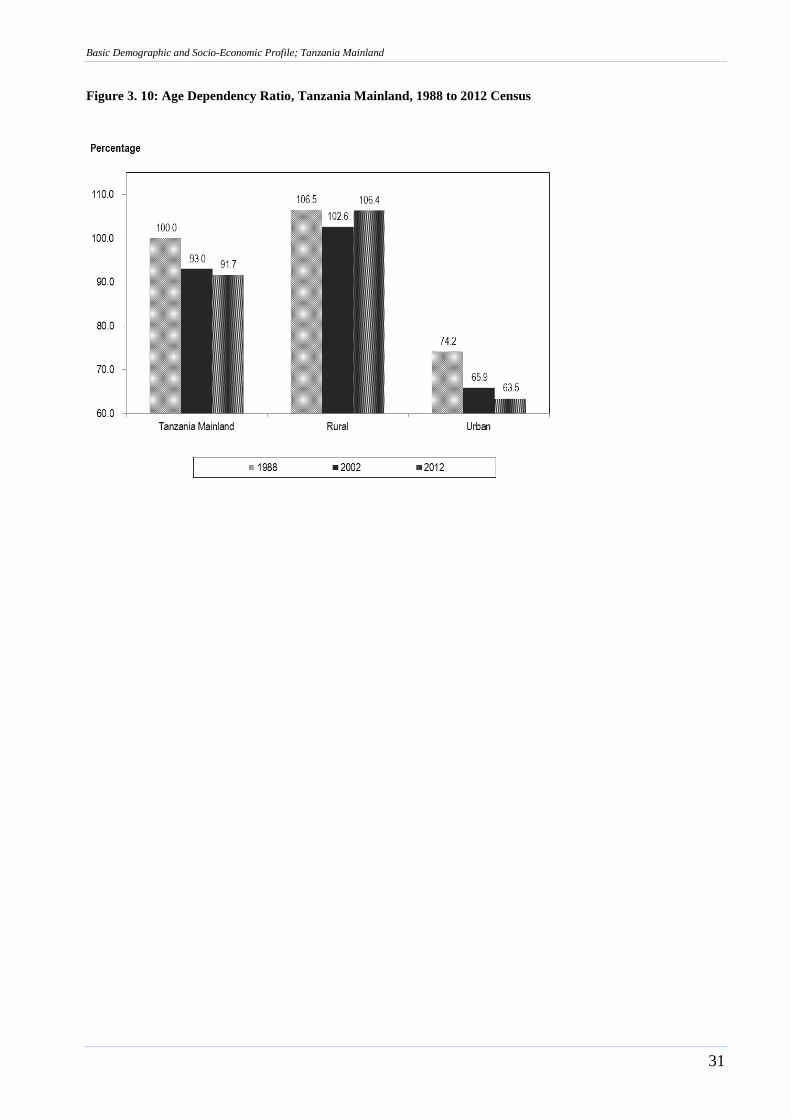
Basic Demographic and Socio-Economic Profile; Tanzania Mainland
31
Figure 3. 10: Age Dependency Ratio, Tanzania Mainland, 1988 to 2012 Census

Basic Demographic and Socio-Economic Profile; Tanzania Mainland
32
Chapter Four
Household Composition
4.1 Introduction
The 2012 PHC collected information from private and collective households. The information,
which was based on household characteristics and composition, included the number of persons in
households, their sex and relationship to the household head.
A private household was defined as a person or group of persons who reside in the same homestead
or compound but not necessarily in the same dwelling unit, having the same cooking arrangements,
and are answerable to the same household head. However, in consideration of the fact that the 2012
PHC enumeration was de facto, some modifications were made to the above definition. For
instance, visitors were also included as members of the household if they were present in the
household on the census night. On the other hand, usual members of the household were excluded
if they had spent the census night outside the household, unless they were away on night duty or
were on fishing or hunting trip and the like.
Collective households are those with no household head and consist of persons not necessarily
related to each other, such as students‟ hostels, orphanages, prisons and wards in hospitals.
Analysis in this chapter is based on private households only.
4.2 Number of Households
According to the 2012 Population and Housing Census, Tanzania Mainland had a total of
9,026,785 private households. Sixty seven (67) percent of the private households (6,054,641
households) were in Rural Areas and 33 percent (2,972,144 households) were in Urban Areas
(Table 4.1).
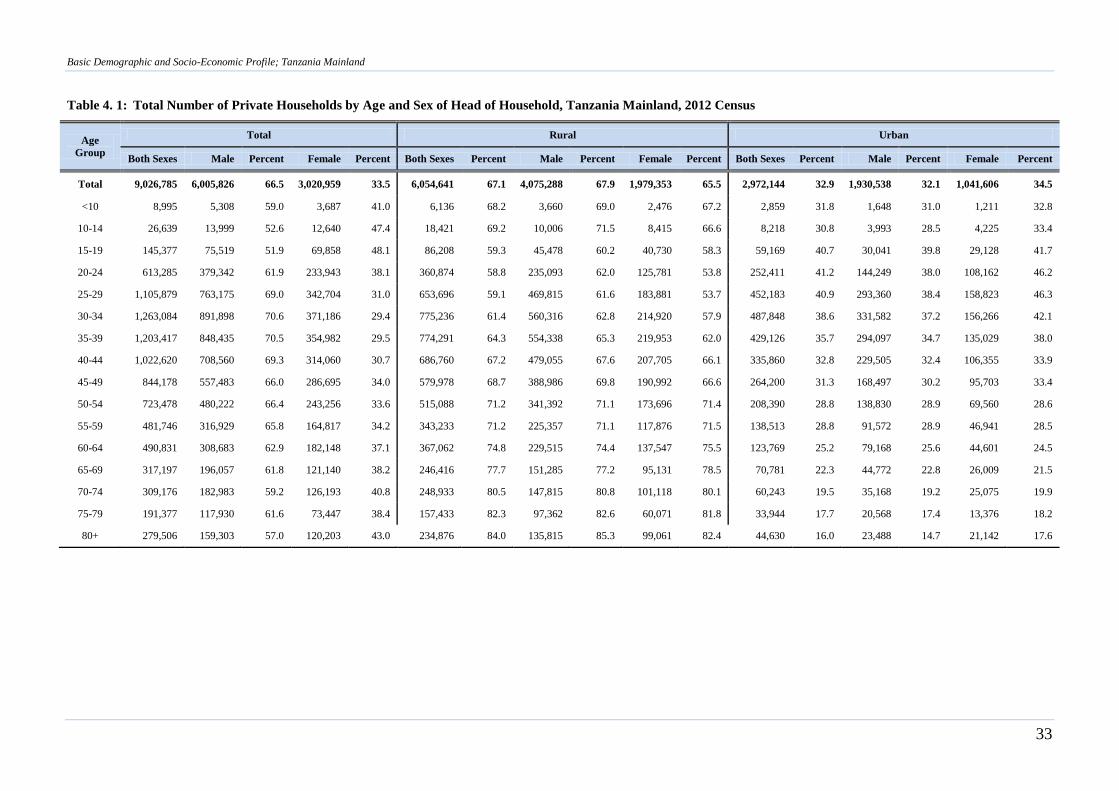
Basic Demographic and Socio-Economic Profile; Tanzania Mainland
33
Table 4. 1: Total Number of Private Households by Age and Sex of Head of Household, Tanzania Mainland, 2012 Census
Age
Group
Total Rural Urban
Both Sexes Male Percent Female Percent Both Sexes Percent Male Percent Female Percent Both Sexes Percent Male Percent Female Percent
Total 9,026,785 6,005,826 66.5 3,020,959 33.5 6,054,641 67.1 4,075,288 67.9 1,979,353 65.5 2,972,144 32.9 1,930,538 32.1 1,041,606 34.5
<10 8,995 5,308 59.0 3,687 41.0 6,136 68.2 3,660 69.0 2,476 67.2 2,859 31.8 1,648 31.0 1,211 32.8
10-14 26,639 13,999 52.6 12,640 47.4 18,421 69.2 10,006 71.5 8,415 66.6 8,218 30.8 3,993 28.5 4,225 33.4
15-19 145,377 75,519 51.9 69,858 48.1 86,208 59.3 45,478 60.2 40,730 58.3 59,169 40.7 30,041 39.8 29,128 41.7
20-24 613,285 379,342 61.9 233,943 38.1 360,874 58.8 235,093 62.0 125,781 53.8 252,411 41.2 144,249 38.0 108,162 46.2
25-29 1,105,879 763,175 69.0 342,704 31.0 653,696 59.1 469,815 61.6 183,881 53.7 452,183 40.9 293,360 38.4 158,823 46.3
30-34 1,263,084 891,898 70.6 371,186 29.4 775,236 61.4 560,316 62.8 214,920 57.9 487,848 38.6 331,582 37.2 156,266 42.1
35-39 1,203,417 848,435 70.5 354,982 29.5 774,291 64.3 554,338 65.3 219,953 62.0 429,126 35.7 294,097 34.7 135,029 38.0
40-44 1,022,620 708,560 69.3 314,060 30.7 686,760 67.2 479,055 67.6 207,705 66.1 335,860 32.8 229,505 32.4 106,355 33.9
45-49 844,178 557,483 66.0 286,695 34.0 579,978 68.7 388,986 69.8 190,992 66.6 264,200 31.3 168,497 30.2 95,703 33.4
50-54 723,478 480,222 66.4 243,256 33.6 515,088 71.2 341,392 71.1 173,696 71.4 208,390 28.8 138,830 28.9 69,560 28.6
55-59 481,746 316,929 65.8 164,817 34.2 343,233 71.2 225,357 71.1 117,876 71.5 138,513 28.8 91,572 28.9 46,941 28.5
60-64 490,831 308,683 62.9 182,148 37.1 367,062 74.8 229,515 74.4 137,547 75.5 123,769 25.2 79,168 25.6 44,601 24.5
65-69 317,197 196,057 61.8 121,140 38.2 246,416 77.7 151,285 77.2 95,131 78.5 70,781 22.3 44,772 22.8 26,009 21.5
70-74 309,176 182,983 59.2 126,193 40.8 248,933 80.5 147,815 80.8 101,118 80.1 60,243 19.5 35,168 19.2 25,075 19.9
75-79 191,377 117,930 61.6 73,447 38.4 157,433 82.3 97,362 82.6 60,071 81.8 33,944 17.7 20,568 17.4 13,376 18.2
80+ 279,506 159,303 57.0 120,203 43.0 234,876 84.0 135,815 85.3 99,061 82.4 44,630 16.0 23,488 14.7 21,142 17.6
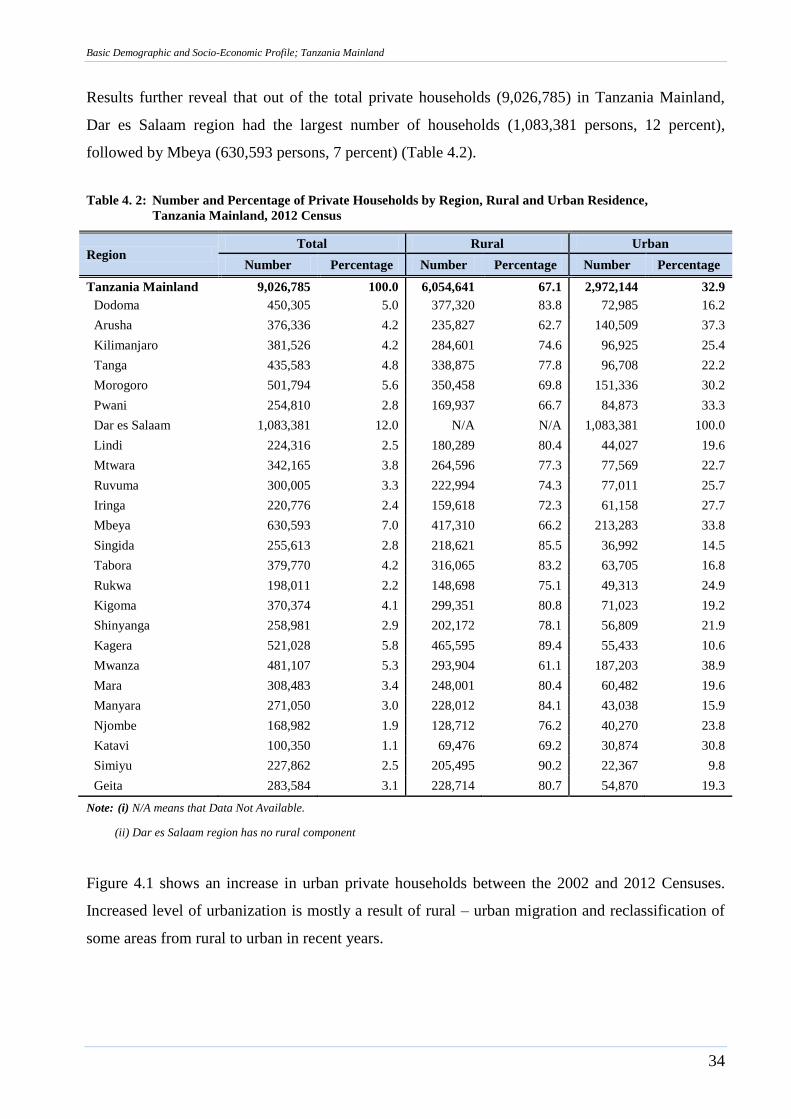
Basic Demographic and Socio-Economic Profile; Tanzania Mainland
34
Results further reveal that out of the total private households (9,026,785) in Tanzania Mainland,
Dar es Salaam region had the largest number of households (1,083,381 persons, 12 percent),
followed by Mbeya (630,593 persons, 7 percent) (Table 4.2).
Table 4. 2: Number and Percentage of Private Households by Region, Rural and Urban Residence,
Tanzania Mainland, 2012 Census
Region Total Rural Urban
Number Percentage Number Percentage Number Percentage
Tanzania Mainland 9,026,785 100.0 6,054,641 67.1 2,972,144 32.9
Dodoma 450,305 5.0 377,320 83.8 72,985 16.2
Arusha 376,336 4.2 235,827 62.7 140,509 37.3
Kilimanjaro 381,526 4.2 284,601 74.6 96,925 25.4
Tanga 435,583 4.8 338,875 77.8 96,708 22.2
Morogoro 501,794 5.6 350,458 69.8 151,336 30.2
Pwani 254,810 2.8 169,937 66.7 84,873 33.3
Dar es Salaam 1,083,381 12.0 N/A N/A 1,083,381 100.0
Lindi 224,316 2.5 180,289 80.4 44,027 19.6
Mtwara 342,165 3.8 264,596 77.3 77,569 22.7
Ruvuma 300,005 3.3 222,994 74.3 77,011 25.7
Iringa 220,776 2.4 159,618 72.3 61,158 27.7
Mbeya 630,593 7.0 417,310 66.2 213,283 33.8
Singida 255,613 2.8 218,621 85.5 36,992 14.5
Tabora 379,770 4.2 316,065 83.2 63,705 16.8
Rukwa 198,011 2.2 148,698 75.1 49,313 24.9
Kigoma 370,374 4.1 299,351 80.8 71,023 19.2
Shinyanga 258,981 2.9 202,172 78.1 56,809 21.9
Kagera 521,028 5.8 465,595 89.4 55,433 10.6
Mwanza 481,107 5.3 293,904 61.1 187,203 38.9
Mara 308,483 3.4 248,001 80.4 60,482 19.6
Manyara 271,050 3.0 228,012 84.1 43,038 15.9
Njombe 168,982 1.9 128,712 76.2 40,270 23.8
Katavi 100,350 1.1 69,476 69.2 30,874 30.8
Simiyu 227,862 2.5 205,495 90.2 22,367 9.8
Geita 283,584 3.1 228,714 80.7 54,870 19.3
Note: (i) N/A means that Data Not Available.
(ii) Dar es Salaam region has no rural component
Figure 4.1 shows an increase in urban private households between the 2002 and 2012 Censuses.
Increased level of urbanization is mostly a result of rural – urban migration and reclassification of
some areas from rural to urban in recent years.
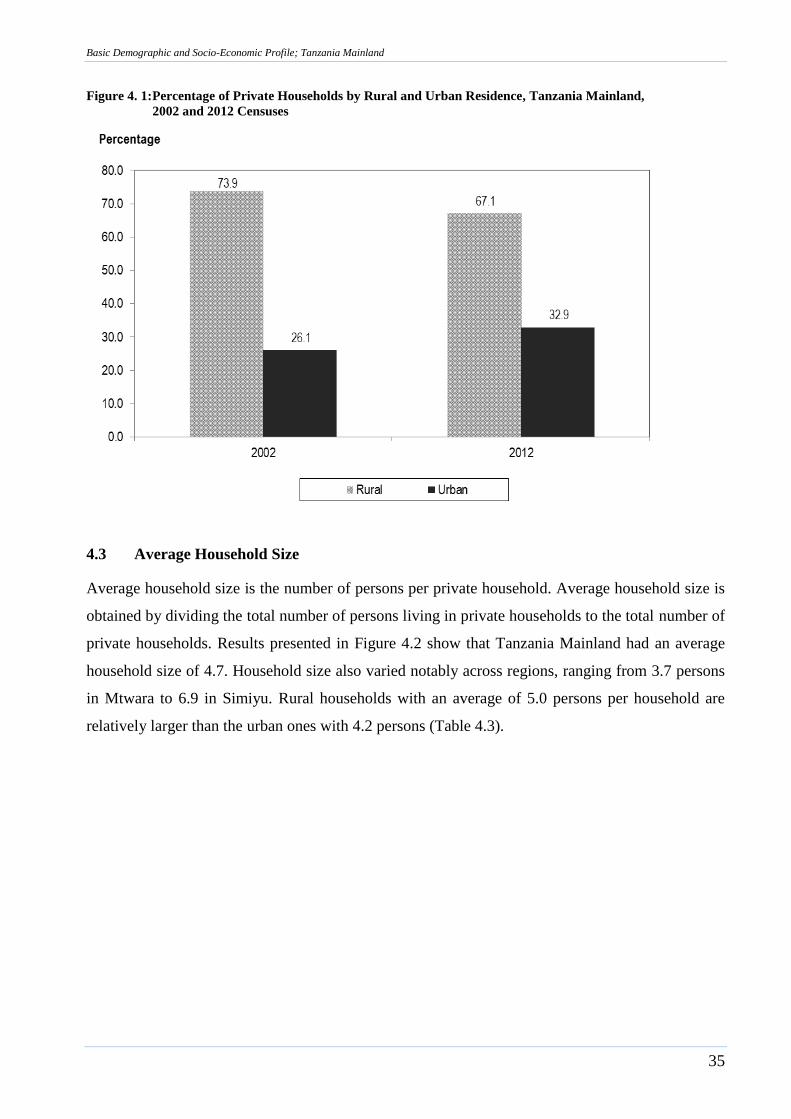
Basic Demographic and Socio-Economic Profile; Tanzania Mainland
35
Figure 4. 1: Percentage of Private Households by Rural and Urban Residence, Tanzania Mainland,
2002 and 2012 Censuses
4.3 Average Household Size
Average household size is the number of persons per private household. Average household size is
obtained by dividing the total number of persons living in private households to the total number of
private households. Results presented in Figure 4.2 show that Tanzania Mainland had an average
household size of 4.7. Household size also varied notably across regions, ranging from 3.7 persons
in Mtwara to 6.9 in Simiyu. Rural households with an average of 5.0 persons per household are
relatively larger than the urban ones with 4.2 persons (Table 4.3).
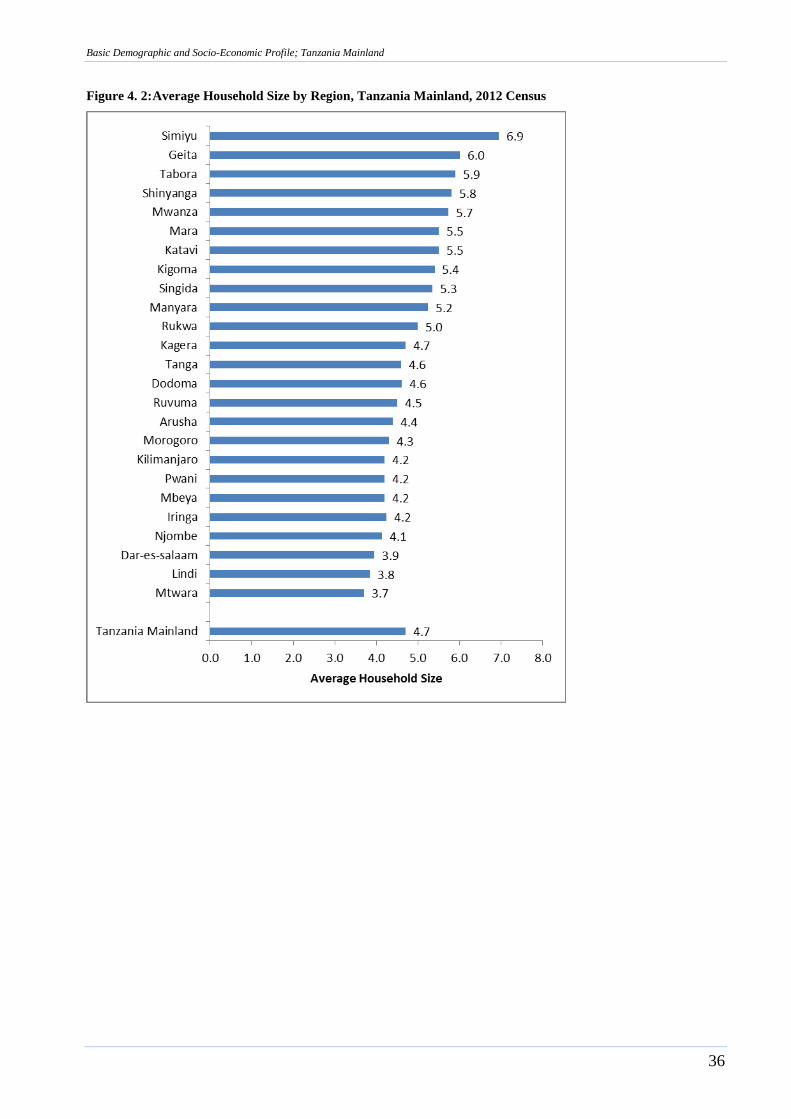
Basic Demographic and Socio-Economic Profile; Tanzania Mainland
36
Figure 4. 2: Average Household Size by Region, Tanzania Mainland, 2012 Census
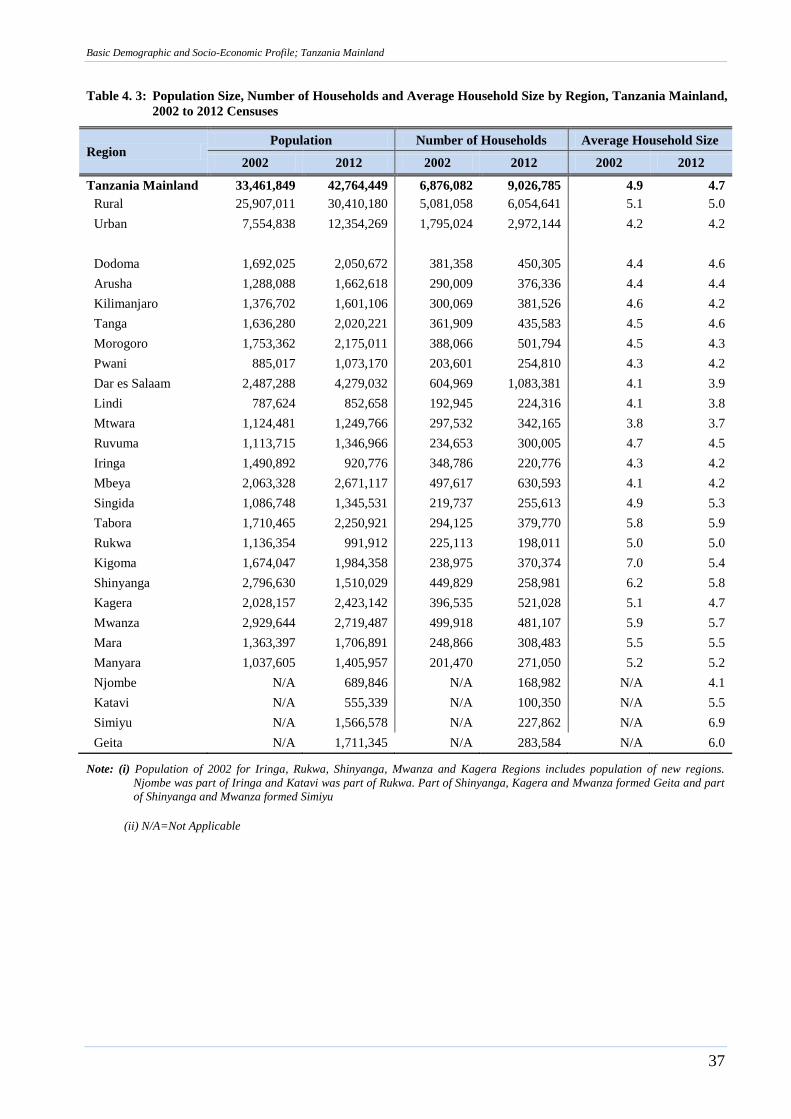
Basic Demographic and Socio-Economic Profile; Tanzania Mainland
37
Table 4. 3: Population Size, Number of Households and Average Household Size by Region, Tanzania Mainland,
2002 to 2012 Censuses
Region Population Number of Households Average Household Size
2002 2012 2002 2012 2002 2012
Tanzania Mainland 33,461,849 42,764,449 6,876,082 9,026,785 4.9 4.7
Rural 25,907,011 30,410,180 5,081,058 6,054,641 5.1 5.0
Urban 7,554,838 12,354,269 1,795,024 2,972,144 4.2 4.2
Dodoma 1,692,025 2,050,672 381,358 450,305 4.4 4.6
Arusha 1,288,088 1,662,618 290,009 376,336 4.4 4.4
Kilimanjaro 1,376,702 1,601,106 300,069 381,526 4.6 4.2
Tanga 1,636,280 2,020,221 361,909 435,583 4.5 4.6
Morogoro 1,753,362 2,175,011 388,066 501,794 4.5 4.3
Pwani 885,017 1,073,170 203,601 254,810 4.3 4.2
Dar es Salaam 2,487,288 4,279,032 604,969 1,083,381 4.1 3.9
Lindi 787,624 852,658 192,945 224,316 4.1 3.8
Mtwara 1,124,481 1,249,766 297,532 342,165 3.8 3.7
Ruvuma 1,113,715 1,346,966 234,653 300,005 4.7 4.5
Iringa 1,490,892 920,776 348,786 220,776 4.3 4.2
Mbeya 2,063,328 2,671,117 497,617 630,593 4.1 4.2
Singida 1,086,748 1,345,531 219,737 255,613 4.9 5.3
Tabora 1,710,465 2,250,921 294,125 379,770 5.8 5.9
Rukwa 1,136,354 991,912 225,113 198,011 5.0 5.0
Kigoma 1,674,047 1,984,358 238,975 370,374 7.0 5.4
Shinyanga 2,796,630 1,510,029 449,829 258,981 6.2 5.8
Kagera 2,028,157 2,423,142 396,535 521,028 5.1 4.7
Mwanza 2,929,644 2,719,487 499,918 481,107 5.9 5.7
Mara 1,363,397 1,706,891 248,866 308,483 5.5 5.5
Manyara 1,037,605 1,405,957 201,470 271,050 5.2 5.2
Njombe N/A 689,846 N/A 168,982 N/A 4.1
Katavi N/A 555,339 N/A 100,350 N/A 5.5
Simiyu N/A 1,566,578 N/A 227,862 N/A 6.9
Geita N/A 1,711,345 N/A 283,584 N/A 6.0
Note: (i) Population of 2002 for Iringa, Rukwa, Shinyanga, Mwanza and Kagera Regions includes population of new regions.
Njombe was part of Iringa and Katavi was part of Rukwa. Part of Shinyanga, Kagera and Mwanza formed Geita and part
of Shinyanga and Mwanza formed Simiyu
(ii) N/A=Not Applicable
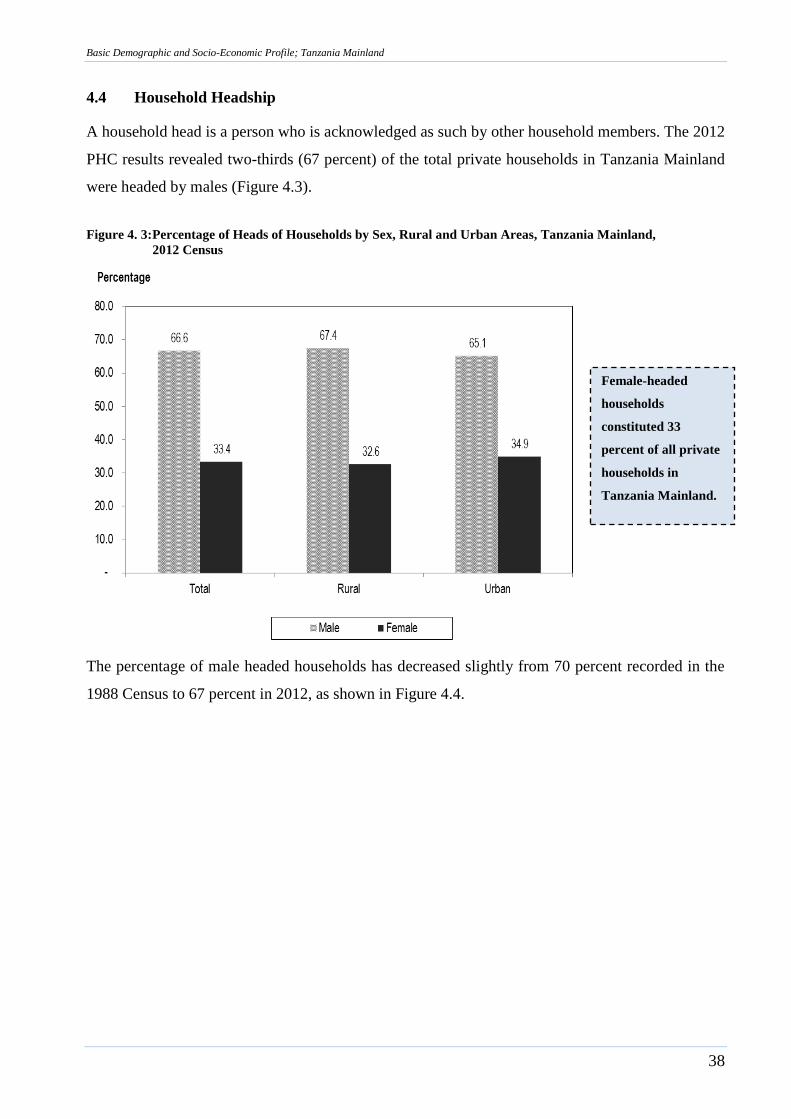
Basic Demographic and Socio-Economic Profile; Tanzania Mainland
38
4.4 Household Headship
A household head is a person who is acknowledged as such by other household members. The 2012
PHC results revealed two-thirds (67 percent) of the total private households in Tanzania Mainland
were headed by males (Figure 4.3).
Figure 4. 3: Percentage of Heads of Households by Sex, Rural and Urban Areas, Tanzania Mainland,
2012 Census
The percentage of male headed households has decreased slightly from 70 percent recorded in the
1988 Census to 67 percent in 2012, as shown in Figure 4.4.
Female-headed
households
constituted 33
percent of all private
households in
Tanzania Mainland.
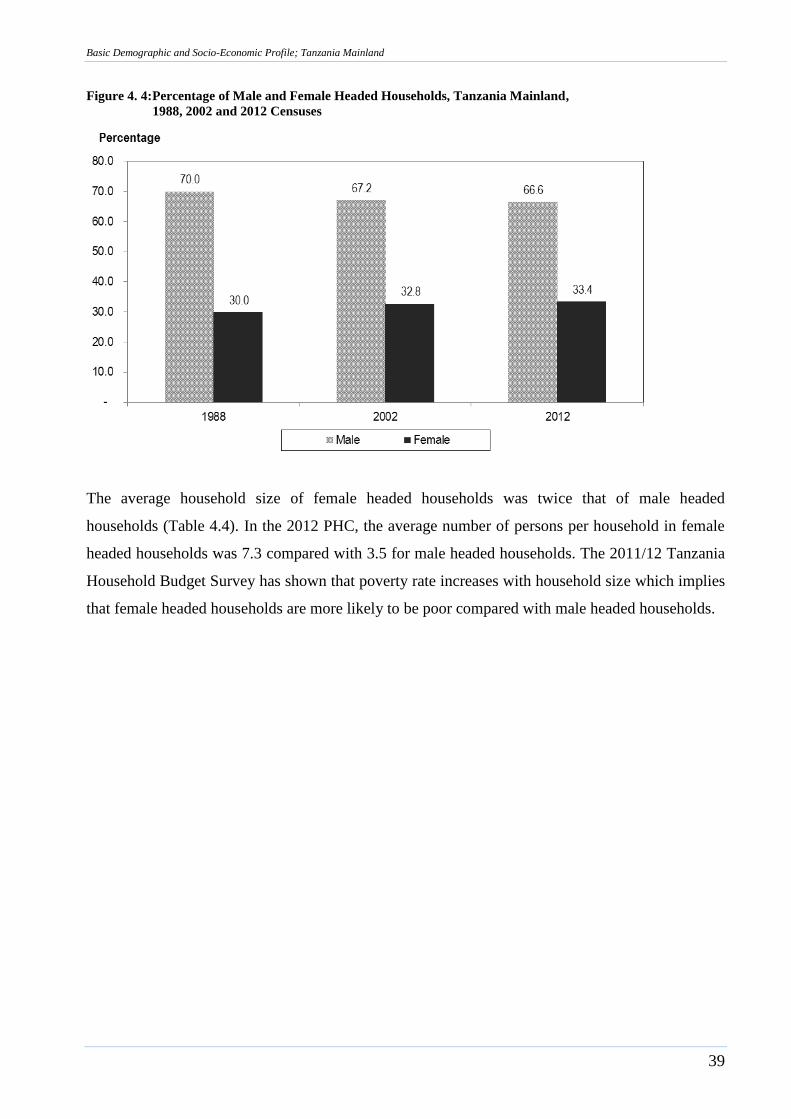
Basic Demographic and Socio-Economic Profile; Tanzania Mainland
39
Figure 4. 4: Percentage of Male and Female Headed Households, Tanzania Mainland,
1988, 2002 and 2012 Censuses
The average household size of female headed households was twice that of male headed
households (Table 4.4). In the 2012 PHC, the average number of persons per household in female
headed households was 7.3 compared with 3.5 for male headed households. The 2011/12 Tanzania
Household Budget Survey has shown that poverty rate increases with household size which implies
that female headed households are more likely to be poor compared with male headed households.
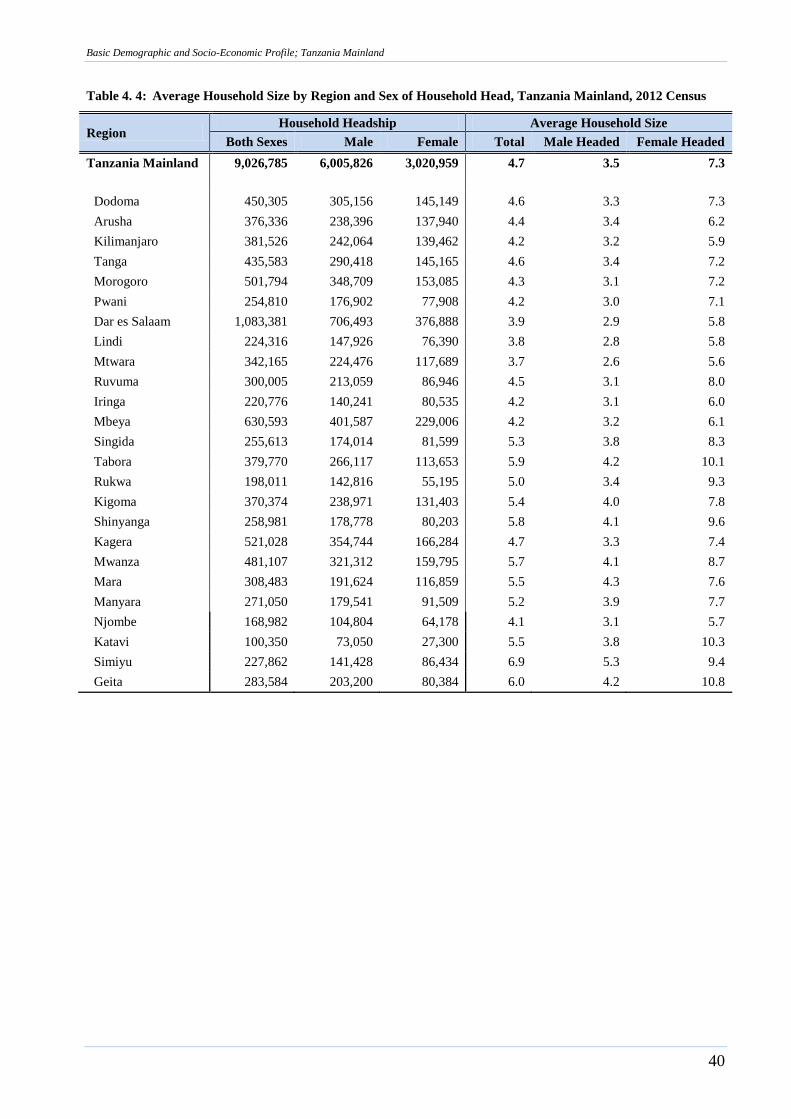
Basic Demographic and Socio-Economic Profile; Tanzania Mainland
40
Table 4. 4: Average Household Size by Region and Sex of Household Head, Tanzania Mainland, 2012 Census
Region Household Headship Average Household Size
Both Sexes Male Female Total Male Headed Female Headed
Tanzania Mainland 9,026,785 6,005,826 3,020,959 4.7 3.5 7.3
Dodoma 450,305 305,156 145,149 4.6 3.3 7.3
Arusha 376,336 238,396 137,940 4.4 3.4 6.2
Kilimanjaro 381,526 242,064 139,462 4.2 3.2 5.9
Tanga 435,583 290,418 145,165 4.6 3.4 7.2
Morogoro 501,794 348,709 153,085 4.3 3.1 7.2
Pwani 254,810 176,902 77,908 4.2 3.0 7.1
Dar es Salaam 1,083,381 706,493 376,888 3.9 2.9 5.8
Lindi 224,316 147,926 76,390 3.8 2.8 5.8
Mtwara 342,165 224,476 117,689 3.7 2.6 5.6
Ruvuma 300,005 213,059 86,946 4.5 3.1 8.0
Iringa 220,776 140,241 80,535 4.2 3.1 6.0
Mbeya 630,593 401,587 229,006 4.2 3.2 6.1
Singida 255,613 174,014 81,599 5.3 3.8 8.3
Tabora 379,770 266,117 113,653 5.9 4.2 10.1
Rukwa 198,011 142,816 55,195 5.0 3.4 9.3
Kigoma 370,374 238,971 131,403 5.4 4.0 7.8
Shinyanga 258,981 178,778 80,203 5.8 4.1 9.6
Kagera 521,028 354,744 166,284 4.7 3.3 7.4
Mwanza 481,107 321,312 159,795 5.7 4.1 8.7
Mara 308,483 191,624 116,859 5.5 4.3 7.6
Manyara 271,050 179,541 91,509 5.2 3.9 7.7
Njombe 168,982 104,804 64,178 4.1 3.1 5.7
Katavi 100,350 73,050 27,300 5.5 3.8 10.3
Simiyu 227,862 141,428 86,434 6.9 5.3 9.4
Geita 283,584 203,200 80,384 6.0 4.2 10.8

Basic Demographic and Socio-Economic Profile; Tanzania Mainland
41
Chapter Five
Marital Status
5.1 Introduction
The system of classifying population by marital status varies from country to country and from
society to society within a country in accordance with prevailing laws and customs. The
information on marital status is in most cases collected from persons above a certain minimum age,
which is the lower limit of age at first marriage in that particular country.
During the 2012 PHC a question on marital status was asked to all respondents. However, the
analysis in this chapter is only for persons aged 15 years and above. Six categories were adopted to
describe marital status of persons were; Never Married, Married, Living Together, Separated,
Divorced and Widowed.
5.2 Marital Status
The data on marital status for the 2012 PHC is disaggregated by age, sex, region, rural and urban
areas. It indicates the extent to which people of given ages were married, never married, living
together, separated, divorced or widowed.
Tables 5.1 to 5.10 present the marital status of population that was 15 years and above by age, sex,
residence and region in Tanzania Mainland. Table 5.1 and Figure 5.1 show that, 36 percent of
persons aged 15 years and above had never married. It was further revealed that 51 percent of
persons were married and three (3) percent were widowed. In general, as the age increases, the
proportion in the never married category decreases.
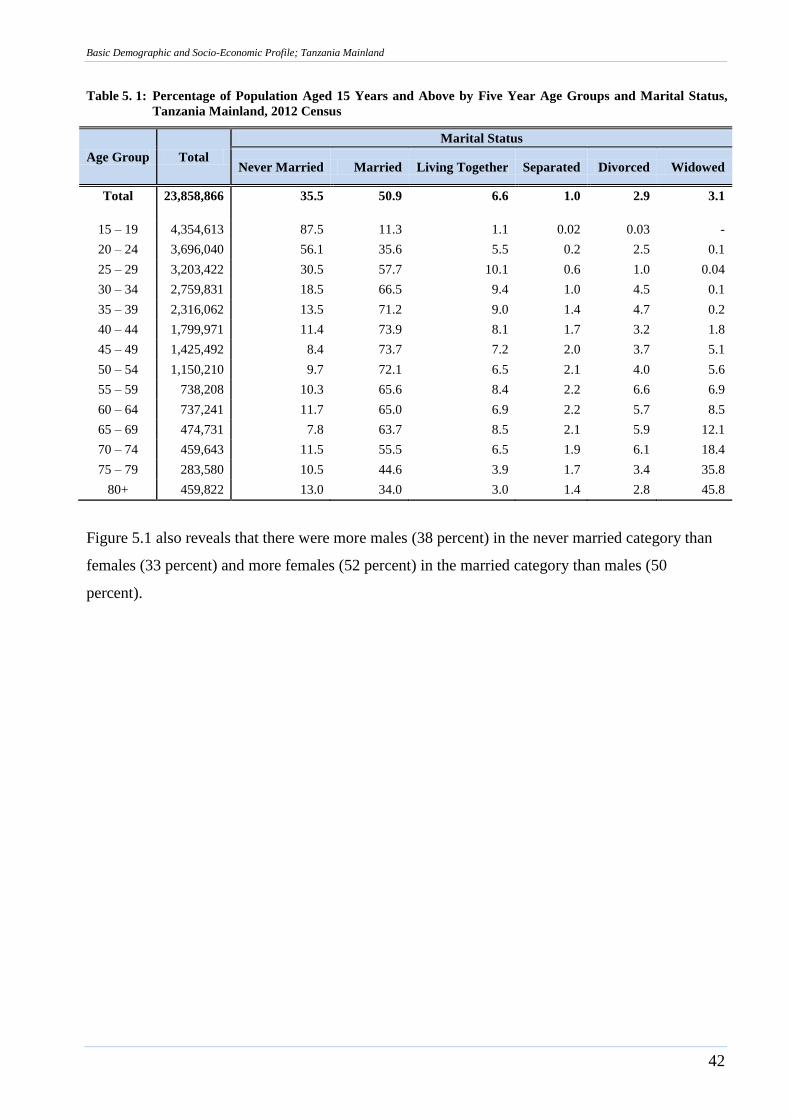
Basic Demographic and Socio-Economic Profile; Tanzania Mainland
42
Table 5. 1: Percentage of Population Aged 15 Years and Above by Five Year Age Groups and Marital Status,
Tanzania Mainland, 2012 Census
Age Group Total
Marital Status
Never Married Married Living Together Separated Divorced Widowed
Total 23,858,866 35.5 50.9 6.6 1.0 2.9 3.1
15 – 19 4,354,613 87.5 11.3 1.1 0.02 0.03 -
20 – 24 3,696,040 56.1 35.6 5.5 0.2 2.5 0.1
25 – 29 3,203,422 30.5 57.7 10.1 0.6 1.0 0.04
30 – 34 2,759,831 18.5 66.5 9.4 1.0 4.5 0.1
35 – 39 2,316,062 13.5 71.2 9.0 1.4 4.7 0.2
40 – 44 1,799,971 11.4 73.9 8.1 1.7 3.2 1.8
45 – 49 1,425,492 8.4 73.7 7.2 2.0 3.7 5.1
50 – 54 1,150,210 9.7 72.1 6.5 2.1 4.0 5.6
55 – 59 738,208 10.3 65.6 8.4 2.2 6.6 6.9
60 – 64 737,241 11.7 65.0 6.9 2.2 5.7 8.5
65 – 69 474,731 7.8 63.7 8.5 2.1 5.9 12.1
70 – 74 459,643 11.5 55.5 6.5 1.9 6.1 18.4
75 – 79 283,580 10.5 44.6 3.9 1.7 3.4 35.8
80+ 459,822 13.0 34.0 3.0 1.4 2.8 45.8
Figure 5.1 also reveals that there were more males (38 percent) in the never married category than
females (33 percent) and more females (52 percent) in the married category than males (50
percent).
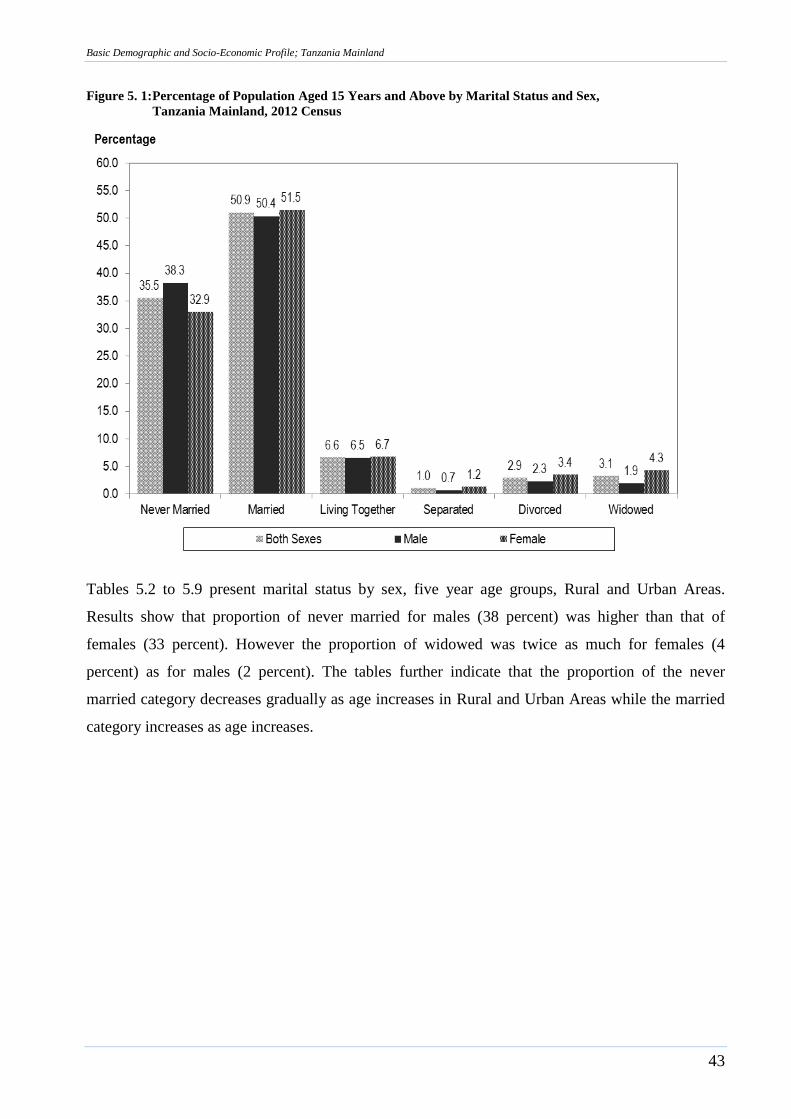
Basic Demographic and Socio-Economic Profile; Tanzania Mainland
43
Figure 5. 1: Percentage of Population Aged 15 Years and Above by Marital Status and Sex,
Tanzania Mainland, 2012 Census
Tables 5.2 to 5.9 present marital status by sex, five year age groups, Rural and Urban Areas.
Results show that proportion of never married for males (38 percent) was higher than that of
females (33 percent). However the proportion of widowed was twice as much for females (4
percent) as for males (2 percent). The tables further indicate that the proportion of the never
married category decreases gradually as age increases in Rural and Urban Areas while the married
category increases as age increases.
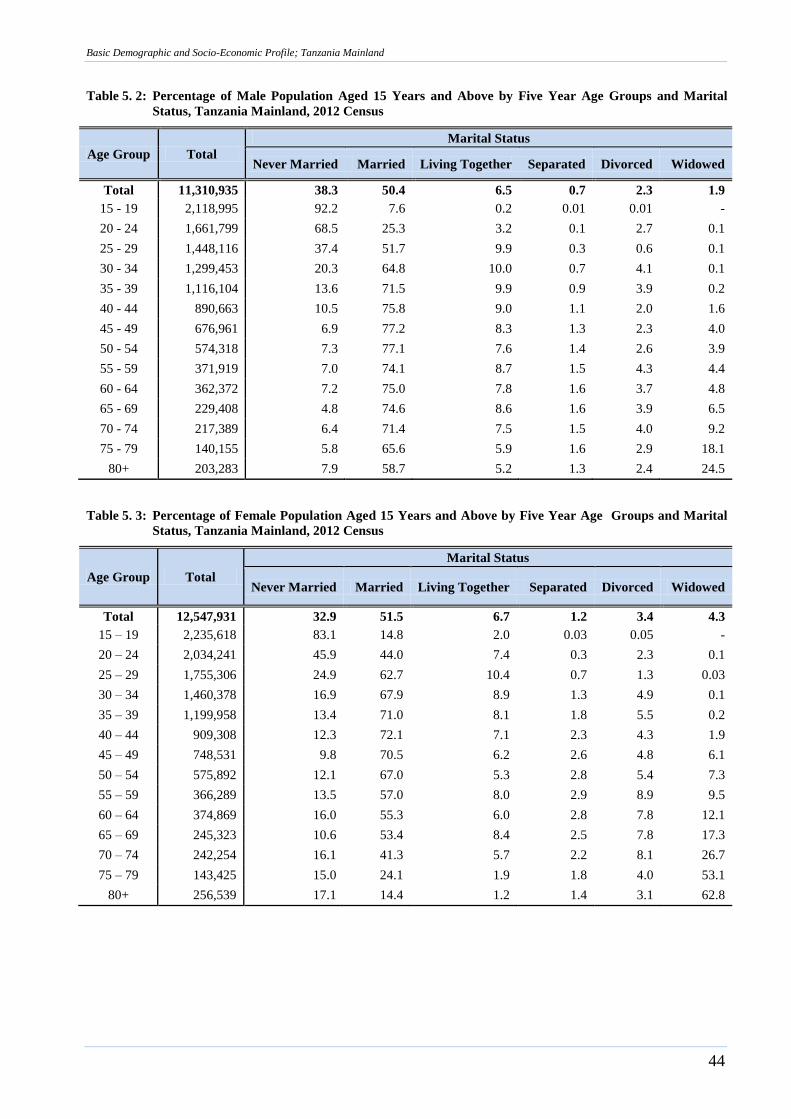
Basic Demographic and Socio-Economic Profile; Tanzania Mainland
44
Table 5. 2: Percentage of Male Population Aged 15 Years and Above by Five Year Age Groups and Marital
Status, Tanzania Mainland, 2012 Census
Age Group Total
Marital Status
Never Married Married Living Together Separated Divorced Widowed
Total 11,310,935 38.3 50.4 6.5 0.7 2.3 1.9
15 - 19 2,118,995 92.2 7.6 0.2 0.01 0.01 -
20 - 24 1,661,799 68.5 25.3 3.2 0.1 2.7 0.1
25 - 29 1,448,116 37.4 51.7 9.9 0.3 0.6 0.1
30 - 34 1,299,453 20.3 64.8 10.0 0.7 4.1 0.1
35 - 39 1,116,104 13.6 71.5 9.9 0.9 3.9 0.2
40 - 44 890,663 10.5 75.8 9.0 1.1 2.0 1.6
45 - 49 676,961 6.9 77.2 8.3 1.3 2.3 4.0
50 - 54 574,318 7.3 77.1 7.6 1.4 2.6 3.9
55 - 59 371,919 7.0 74.1 8.7 1.5 4.3 4.4
60 - 64 362,372 7.2 75.0 7.8 1.6 3.7 4.8
65 - 69 229,408 4.8 74.6 8.6 1.6 3.9 6.5
70 - 74 217,389 6.4 71.4 7.5 1.5 4.0 9.2
75 - 79 140,155 5.8 65.6 5.9 1.6 2.9 18.1
80+ 203,283 7.9 58.7 5.2 1.3 2.4 24.5
Table 5. 3: Percentage of Female Population Aged 15 Years and Above by Five Year Age Groups and Marital
Status, Tanzania Mainland, 2012 Census
Age Group Total
Marital Status
Never Married Married Living Together Separated Divorced Widowed
Total 12,547,931 32.9 51.5 6.7 1.2 3.4 4.3
15 – 19 2,235,618 83.1 14.8 2.0 0.03 0.05 -
20 – 24 2,034,241 45.9 44.0 7.4 0.3 2.3 0.1
25 – 29 1,755,306 24.9 62.7 10.4 0.7 1.3 0.03
30 – 34 1,460,378 16.9 67.9 8.9 1.3 4.9 0.1
35 – 39 1,199,958 13.4 71.0 8.1 1.8 5.5 0.2
40 – 44 909,308 12.3 72.1 7.1 2.3 4.3 1.9
45 – 49 748,531 9.8 70.5 6.2 2.6 4.8 6.1
50 – 54 575,892 12.1 67.0 5.3 2.8 5.4 7.3
55 – 59 366,289 13.5 57.0 8.0 2.9 8.9 9.5
60 – 64 374,869 16.0 55.3 6.0 2.8 7.8 12.1
65 – 69 245,323 10.6 53.4 8.4 2.5 7.8 17.3
70 – 74 242,254 16.1 41.3 5.7 2.2 8.1 26.7
75 – 79 143,425 15.0 24.1 1.9 1.8 4.0 53.1
80+ 256,539 17.1 14.4 1.2 1.4 3.1 62.8
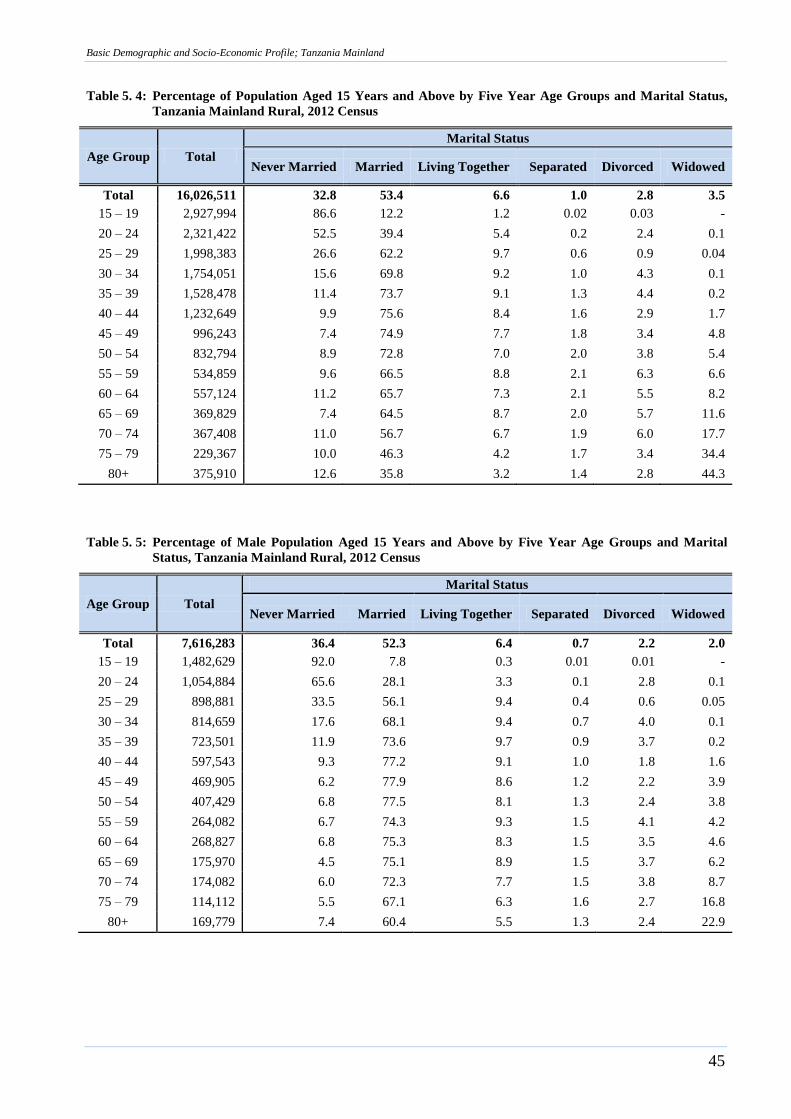
Basic Demographic and Socio-Economic Profile; Tanzania Mainland
45
Table 5. 4: Percentage of Population Aged 15 Years and Above by Five Year Age Groups and Marital Status,
Tanzania Mainland Rural, 2012 Census
Age Group Total
Marital Status
Never Married Married Living Together Separated Divorced Widowed
Total 16,026,511 32.8 53.4 6.6 1.0 2.8 3.5
15 – 19 2,927,994 86.6 12.2 1.2 0.02 0.03 -
20 – 24 2,321,422 52.5 39.4 5.4 0.2 2.4 0.1
25 – 29 1,998,383 26.6 62.2 9.7 0.6 0.9 0.04
30 – 34 1,754,051 15.6 69.8 9.2 1.0 4.3 0.1
35 – 39 1,528,478 11.4 73.7 9.1 1.3 4.4 0.2
40 – 44 1,232,649 9.9 75.6 8.4 1.6 2.9 1.7
45 – 49 996,243 7.4 74.9 7.7 1.8 3.4 4.8
50 – 54 832,794 8.9 72.8 7.0 2.0 3.8 5.4
55 – 59 534,859 9.6 66.5 8.8 2.1 6.3 6.6
60 – 64 557,124 11.2 65.7 7.3 2.1 5.5 8.2
65 – 69 369,829 7.4 64.5 8.7 2.0 5.7 11.6
70 – 74 367,408 11.0 56.7 6.7 1.9 6.0 17.7
75 – 79 229,367 10.0 46.3 4.2 1.7 3.4 34.4
80+ 375,910 12.6 35.8 3.2 1.4 2.8 44.3
Table 5. 5: Percentage of Male Population Aged 15 Years and Above by Five Year Age Groups and Marital
Status, Tanzania Mainland Rural, 2012 Census
Age Group Total
Marital Status
Never Married Married Living Together Separated Divorced Widowed
Total 7,616,283 36.4 52.3 6.4 0.7 2.2 2.0
15 – 19 1,482,629 92.0 7.8 0.3 0.01 0.01 -
20 – 24 1,054,884 65.6 28.1 3.3 0.1 2.8 0.1
25 – 29 898,881 33.5 56.1 9.4 0.4 0.6 0.05
30 – 34 814,659 17.6 68.1 9.4 0.7 4.0 0.1
35 – 39 723,501 11.9 73.6 9.7 0.9 3.7 0.2
40 – 44 597,543 9.3 77.2 9.1 1.0 1.8 1.6
45 – 49 469,905 6.2 77.9 8.6 1.2 2.2 3.9
50 – 54 407,429 6.8 77.5 8.1 1.3 2.4 3.8
55 – 59 264,082 6.7 74.3 9.3 1.5 4.1 4.2
60 – 64 268,827 6.8 75.3 8.3 1.5 3.5 4.6
65 – 69 175,970 4.5 75.1 8.9 1.5 3.7 6.2
70 – 74 174,082 6.0 72.3 7.7 1.5 3.8 8.7
75 – 79 114,112 5.5 67.1 6.3 1.6 2.7 16.8
80+ 169,779 7.4 60.4 5.5 1.3 2.4 22.9
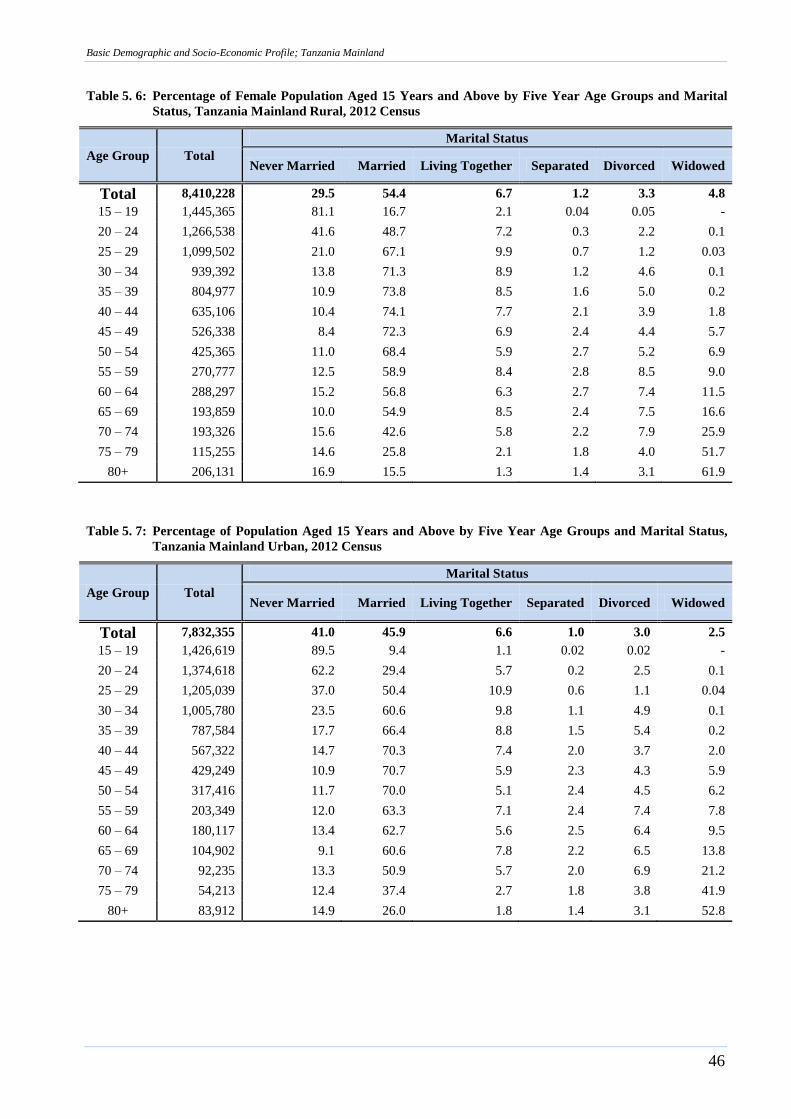
Basic Demographic and Socio-Economic Profile; Tanzania Mainland
46
Table 5. 6: Percentage of Female Population Aged 15 Years and Above by Five Year Age Groups and Marital
Status, Tanzania Mainland Rural, 2012 Census
Age Group Total
Marital Status
Never Married Married Living Together Separated Divorced Widowed
Total 8,410,228 29.5 54.4 6.7 1.2 3.3 4.8
15 – 19 1,445,365 81.1 16.7 2.1 0.04 0.05 -
20 – 24 1,266,538 41.6 48.7 7.2 0.3 2.2 0.1
25 – 29 1,099,502 21.0 67.1 9.9 0.7 1.2 0.03
30 – 34 939,392 13.8 71.3 8.9 1.2 4.6 0.1
35 – 39 804,977 10.9 73.8 8.5 1.6 5.0 0.2
40 – 44 635,106 10.4 74.1 7.7 2.1 3.9 1.8
45 – 49 526,338 8.4 72.3 6.9 2.4 4.4 5.7
50 – 54 425,365 11.0 68.4 5.9 2.7 5.2 6.9
55 – 59 270,777 12.5 58.9 8.4 2.8 8.5 9.0
60 – 64 288,297 15.2 56.8 6.3 2.7 7.4 11.5
65 – 69 193,859 10.0 54.9 8.5 2.4 7.5 16.6
70 – 74 193,326 15.6 42.6 5.8 2.2 7.9 25.9
75 – 79 115,255 14.6 25.8 2.1 1.8 4.0 51.7
80+ 206,131 16.9 15.5 1.3 1.4 3.1 61.9
Table 5. 7: Percentage of Population Aged 15 Years and Above by Five Year Age Groups and Marital Status,
Tanzania Mainland Urban, 2012 Census
Age Group Total
Marital Status
Never Married Married Living Together Separated Divorced Widowed
Total 7,832,355 41.0 45.9 6.6 1.0 3.0 2.5
15 – 19 1,426,619 89.5 9.4 1.1 0.02 0.02 -
20 – 24 1,374,618 62.2 29.4 5.7 0.2 2.5 0.1
25 – 29 1,205,039 37.0 50.4 10.9 0.6 1.1 0.04
30 – 34 1,005,780 23.5 60.6 9.8 1.1 4.9 0.1
35 – 39 787,584 17.7 66.4 8.8 1.5 5.4 0.2
40 – 44 567,322 14.7 70.3 7.4 2.0 3.7 2.0
45 – 49 429,249 10.9 70.7 5.9 2.3 4.3 5.9
50 – 54 317,416 11.7 70.0 5.1 2.4 4.5 6.2
55 – 59 203,349 12.0 63.3 7.1 2.4 7.4 7.8
60 – 64 180,117 13.4 62.7 5.6 2.5 6.4 9.5
65 – 69 104,902 9.1 60.6 7.8 2.2 6.5 13.8
70 – 74 92,235 13.3 50.9 5.7 2.0 6.9 21.2
75 – 79 54,213 12.4 37.4 2.7 1.8 3.8 41.9
80+ 83,912 14.9 26.0 1.8 1.4 3.1 52.8
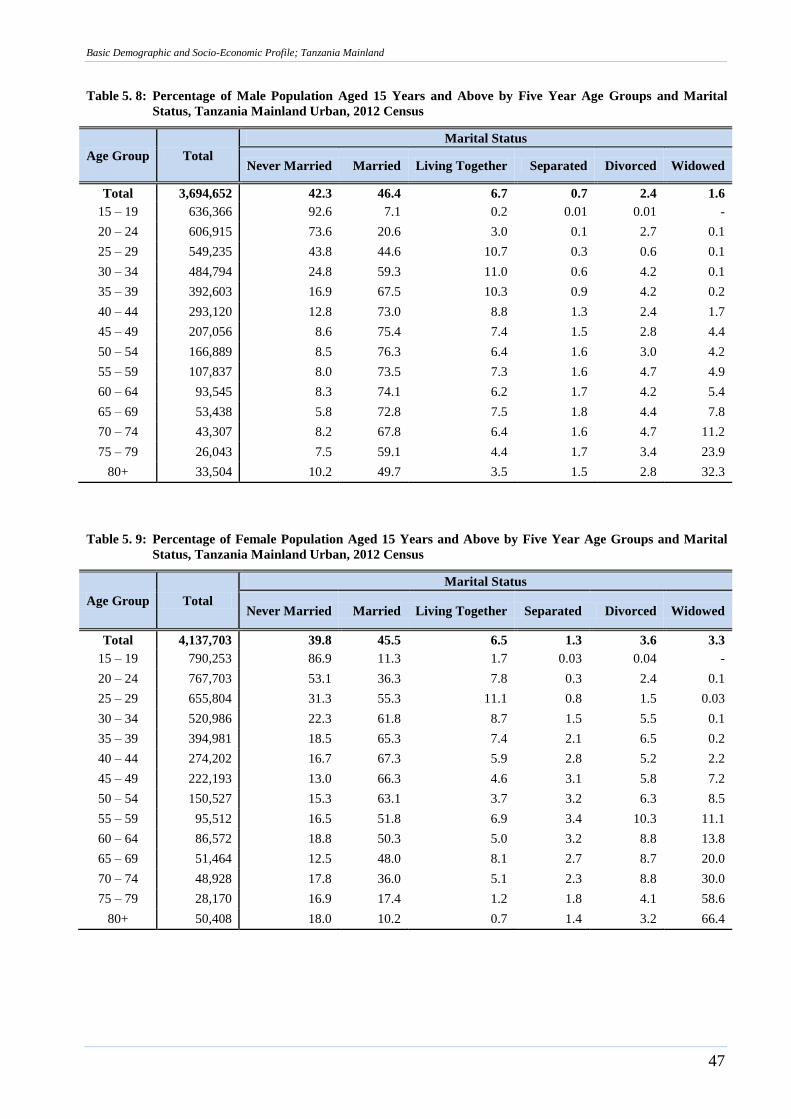
Basic Demographic and Socio-Economic Profile; Tanzania Mainland
47
Table 5. 8: Percentage of Male Population Aged 15 Years and Above by Five Year Age Groups and Marital
Status, Tanzania Mainland Urban, 2012 Census
Age Group Total
Marital Status
Never Married Married Living Together Separated Divorced Widowed
Total 3,694,652 42.3 46.4 6.7 0.7 2.4 1.6
15 – 19 636,366 92.6 7.1 0.2 0.01 0.01 -
20 – 24 606,915 73.6 20.6 3.0 0.1 2.7 0.1
25 – 29 549,235 43.8 44.6 10.7 0.3 0.6 0.1
30 – 34 484,794 24.8 59.3 11.0 0.6 4.2 0.1
35 – 39 392,603 16.9 67.5 10.3 0.9 4.2 0.2
40 – 44 293,120 12.8 73.0 8.8 1.3 2.4 1.7
45 – 49 207,056 8.6 75.4 7.4 1.5 2.8 4.4
50 – 54 166,889 8.5 76.3 6.4 1.6 3.0 4.2
55 – 59 107,837 8.0 73.5 7.3 1.6 4.7 4.9
60 – 64 93,545 8.3 74.1 6.2 1.7 4.2 5.4
65 – 69 53,438 5.8 72.8 7.5 1.8 4.4 7.8
70 – 74 43,307 8.2 67.8 6.4 1.6 4.7 11.2
75 – 79 26,043 7.5 59.1 4.4 1.7 3.4 23.9
80+ 33,504 10.2 49.7 3.5 1.5 2.8 32.3
Table 5. 9: Percentage of Female Population Aged 15 Years and Above by Five Year Age Groups and Marital
Status, Tanzania Mainland Urban, 2012 Census
Age Group Total
Marital Status
Never Married Married Living Together Separated Divorced Widowed
Total 4,137,703 39.8 45.5 6.5 1.3 3.6 3.3
15 – 19 790,253 86.9 11.3 1.7 0.03 0.04 -
20 – 24 767,703 53.1 36.3 7.8 0.3 2.4 0.1
25 – 29 655,804 31.3 55.3 11.1 0.8 1.5 0.03
30 – 34 520,986 22.3 61.8 8.7 1.5 5.5 0.1
35 – 39 394,981 18.5 65.3 7.4 2.1 6.5 0.2
40 – 44 274,202 16.7 67.3 5.9 2.8 5.2 2.2
45 – 49 222,193 13.0 66.3 4.6 3.1 5.8 7.2
50 – 54 150,527 15.3 63.1 3.7 3.2 6.3 8.5
55 – 59 95,512 16.5 51.8 6.9 3.4 10.3 11.1
60 – 64 86,572 18.8 50.3 5.0 3.2 8.8 13.8
65 – 69 51,464 12.5 48.0 8.1 2.7 8.7 20.0
70 – 74 48,928 17.8 36.0 5.1 2.3 8.8 30.0
75 – 79 28,170 16.9 17.4 1.2 1.8 4.1 58.6
80+ 50,408 18.0 10.2 0.7 1.4 3.2 66.4
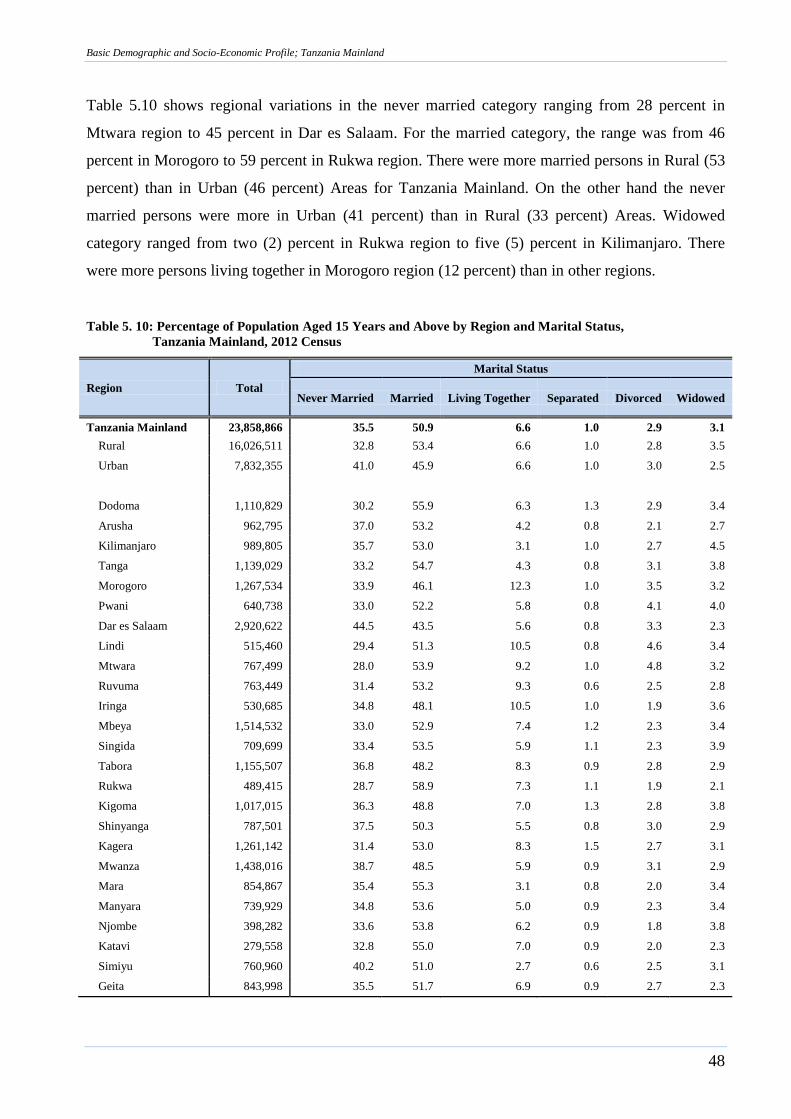
Basic Demographic and Socio-Economic Profile; Tanzania Mainland
48
Table 5.10 shows regional variations in the never married category ranging from 28 percent in
Mtwara region to 45 percent in Dar es Salaam. For the married category, the range was from 46
percent in Morogoro to 59 percent in Rukwa region. There were more married persons in Rural (53
percent) than in Urban (46 percent) Areas for Tanzania Mainland. On the other hand the never
married persons were more in Urban (41 percent) than in Rural (33 percent) Areas. Widowed
category ranged from two (2) percent in Rukwa region to five (5) percent in Kilimanjaro. There
were more persons living together in Morogoro region (12 percent) than in other regions.
Table 5. 10: Percentage of Population Aged 15 Years and Above by Region and Marital Status,
Tanzania Mainland, 2012 Census
Region Total
Marital Status
Never Married Married Living Together Separated Divorced Widowed
Tanzania Mainland 23,858,866 35.5 50.9 6.6 1.0 2.9 3.1
Rural 16,026,511 32.8 53.4 6.6 1.0 2.8 3.5
Urban 7,832,355 41.0 45.9 6.6 1.0 3.0 2.5
Dodoma 1,110,829 30.2 55.9 6.3 1.3 2.9 3.4
Arusha 962,795 37.0 53.2 4.2 0.8 2.1 2.7
Kilimanjaro 989,805 35.7 53.0 3.1 1.0 2.7 4.5
Tanga 1,139,029 33.2 54.7 4.3 0.8 3.1 3.8
Morogoro 1,267,534 33.9 46.1 12.3 1.0 3.5 3.2
Pwani 640,738 33.0 52.2 5.8 0.8 4.1 4.0
Dar es Salaam 2,920,622 44.5 43.5 5.6 0.8 3.3 2.3
Lindi 515,460 29.4 51.3 10.5 0.8 4.6 3.4
Mtwara 767,499 28.0 53.9 9.2 1.0 4.8 3.2
Ruvuma 763,449 31.4 53.2 9.3 0.6 2.5 2.8
Iringa 530,685 34.8 48.1 10.5 1.0 1.9 3.6
Mbeya 1,514,532 33.0 52.9 7.4 1.2 2.3 3.4
Singida 709,699 33.4 53.5 5.9 1.1 2.3 3.9
Tabora 1,155,507 36.8 48.2 8.3 0.9 2.8 2.9
Rukwa 489,415 28.7 58.9 7.3 1.1 1.9 2.1
Kigoma 1,017,015 36.3 48.8 7.0 1.3 2.8 3.8
Shinyanga 787,501 37.5 50.3 5.5 0.8 3.0 2.9
Kagera 1,261,142 31.4 53.0 8.3 1.5 2.7 3.1
Mwanza 1,438,016 38.7 48.5 5.9 0.9 3.1 2.9
Mara 854,867 35.4 55.3 3.1 0.8 2.0 3.4
Manyara 739,929 34.8 53.6 5.0 0.9 2.3 3.4
Njombe 398,282 33.6 53.8 6.2 0.9 1.8 3.8
Katavi 279,558 32.8 55.0 7.0 0.9 2.0 2.3
Simiyu 760,960 40.2 51.0 2.7 0.6 2.5 3.1
Geita 843,998 35.5 51.7 6.9 0.9 2.7 2.3
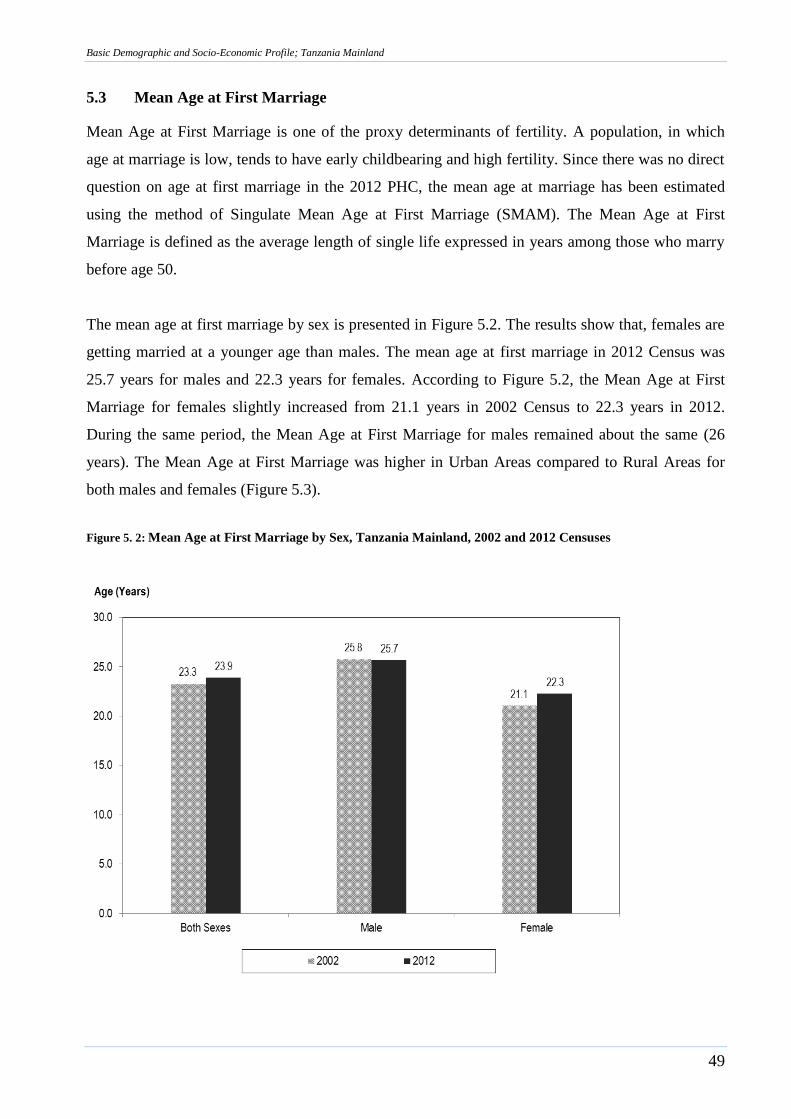
Basic Demographic and Socio-Economic Profile; Tanzania Mainland
49
5.3 Mean Age at First Marriage
Mean Age at First Marriage is one of the proxy determinants of fertility. A population, in which
age at marriage is low, tends to have early childbearing and high fertility. Since there was no direct
question on age at first marriage in the 2012 PHC, the mean age at marriage has been estimated
using the method of Singulate Mean Age at First Marriage (SMAM). The Mean Age at First
Marriage is defined as the average length of single life expressed in years among those who marry
before age 50.
The mean age at first marriage by sex is presented in Figure 5.2. The results show that, females are
getting married at a younger age than males. The mean age at first marriage in 2012 Census was
25.7 years for males and 22.3 years for females. According to Figure 5.2, the Mean Age at First
Marriage for females slightly increased from 21.1 years in 2002 Census to 22.3 years in 2012.
During the same period, the Mean Age at First Marriage for males remained about the same (26
years). The Mean Age at First Marriage was higher in Urban Areas compared to Rural Areas for
both males and females (Figure 5.3).
Figure 5. 2: Mean Age at First Marriage by Sex, Tanzania Mainland, 2002 and 2012 Censuses
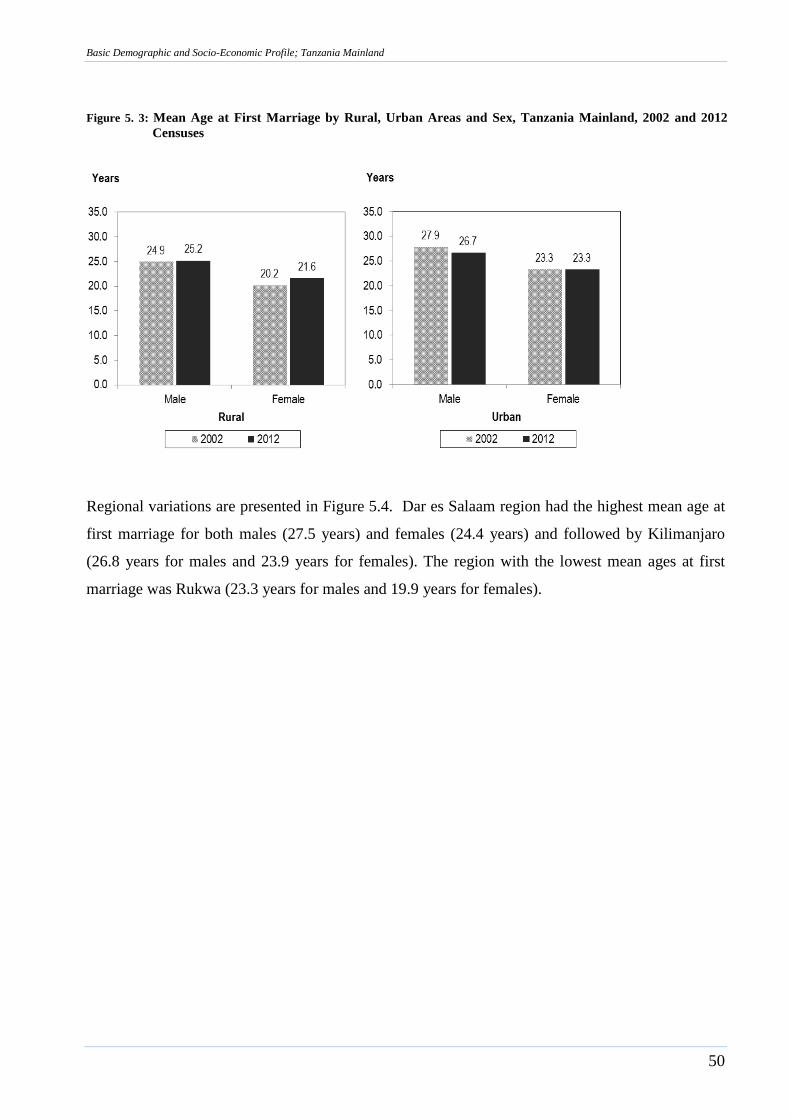
Basic Demographic and Socio-Economic Profile; Tanzania Mainland
50
Figure 5. 3: Mean Age at First Marriage by Rural, Urban Areas and Sex, Tanzania Mainland, 2002 and 2012
Censuses
Regional variations are presented in Figure 5.4. Dar es Salaam region had the highest mean age at
first marriage for both males (27.5 years) and females (24.4 years) and followed by Kilimanjaro
(26.8 years for males and 23.9 years for females). The region with the lowest mean ages at first
marriage was Rukwa (23.3 years for males and 19.9 years for females).
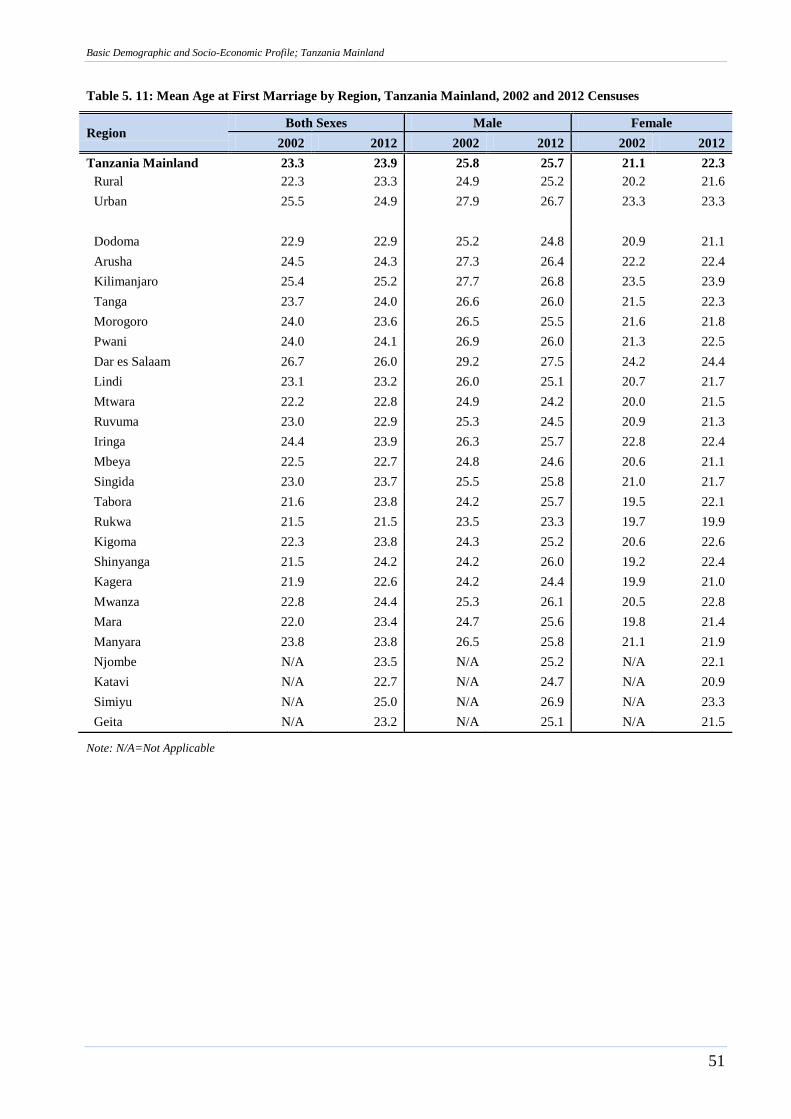
Basic Demographic and Socio-Economic Profile; Tanzania Mainland
51
Table 5. 11: Mean Age at First Marriage by Region, Tanzania Mainland, 2002 and 2012 Censuses
Region Both Sexes Male Female
2002 2012 2002 2012 2002 2012
Tanzania Mainland 23.3 23.9 25.8 25.7 21.1 22.3
Rural 22.3 23.3 24.9 25.2 20.2 21.6
Urban 25.5 24.9 27.9 26.7 23.3 23.3
Dodoma 22.9 22.9 25.2 24.8 20.9 21.1
Arusha 24.5 24.3 27.3 26.4 22.2 22.4
Kilimanjaro 25.4 25.2 27.7 26.8 23.5 23.9
Tanga 23.7 24.0 26.6 26.0 21.5 22.3
Morogoro 24.0 23.6 26.5 25.5 21.6 21.8
Pwani 24.0 24.1 26.9 26.0 21.3 22.5
Dar es Salaam 26.7 26.0 29.2 27.5 24.2 24.4
Lindi 23.1 23.2 26.0 25.1 20.7 21.7
Mtwara 22.2 22.8 24.9 24.2 20.0 21.5
Ruvuma 23.0 22.9 25.3 24.5 20.9 21.3
Iringa 24.4 23.9 26.3 25.7 22.8 22.4
Mbeya 22.5 22.7 24.8 24.6 20.6 21.1
Singida 23.0 23.7 25.5 25.8 21.0 21.7
Tabora 21.6 23.8 24.2 25.7 19.5 22.1
Rukwa 21.5 21.5 23.5 23.3 19.7 19.9
Kigoma 22.3 23.8 24.3 25.2 20.6 22.6
Shinyanga 21.5 24.2 24.2 26.0 19.2 22.4
Kagera 21.9 22.6 24.2 24.4 19.9 21.0
Mwanza 22.8 24.4 25.3 26.1 20.5 22.8
Mara 22.0 23.4 24.7 25.6 19.8 21.4
Manyara 23.8 23.8 26.5 25.8 21.1 21.9
Njombe N/A 23.5 N/A 25.2 N/A 22.1
Katavi N/A 22.7 N/A 24.7 N/A 20.9
Simiyu N/A 25.0 N/A 26.9 N/A 23.3
Geita N/A 23.2 N/A 25.1 N/A 21.5
Note: N/A=Not Applicable
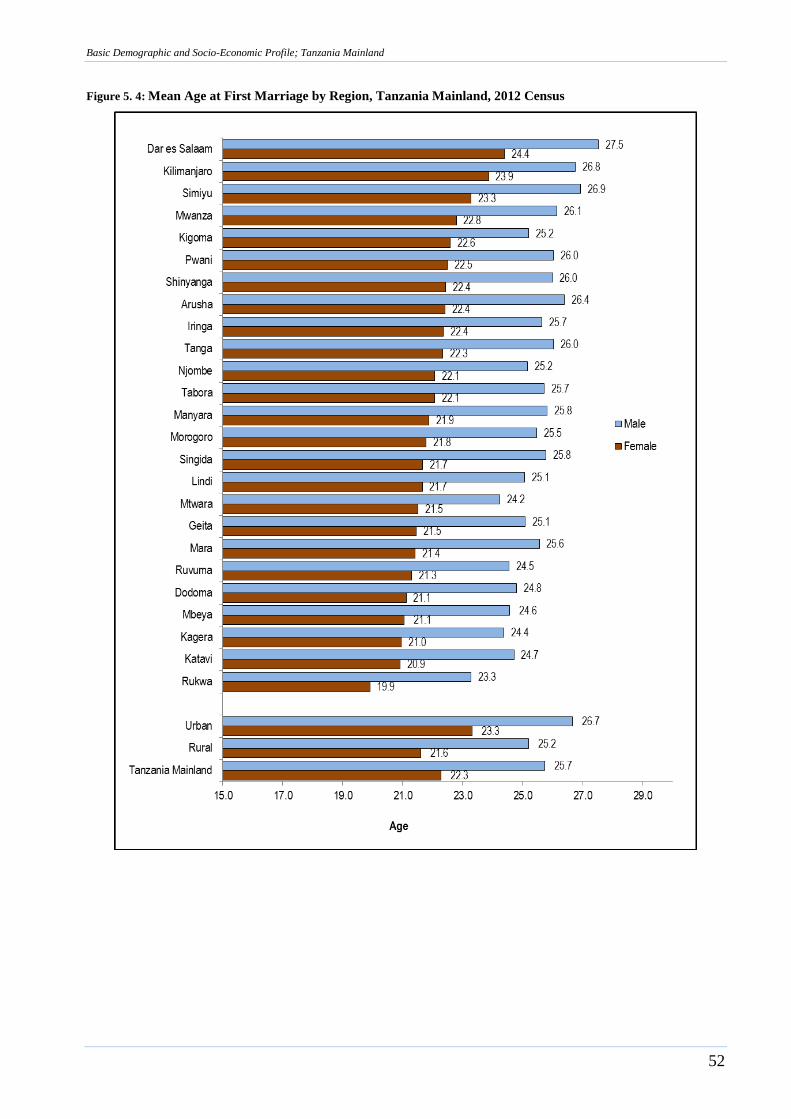
Basic Demographic and Socio-Economic Profile; Tanzania Mainland
52
Figure 5. 4: Mean Age at First Marriage by Region, Tanzania Mainland, 2012 Census
Basic Demographic and Socio-Economic Profile; Tanzania Mainland
53
Chapter Six
Citizenship and Birth Registration
6.1 Citizenship
The 2012 PHC collected information on citizenship of respondents. It was revealed that 99 percent
of the enumerated population consisted of Tanzanians (Table 6.1). Majority of foreigners were
from neighboring countries of Burundi, Democratic Republic of Congo (DRC), and Kenya. The
table shows that there was a relatively big number of Burundians which may be due to the presence
of refugees. India and China accounted for a relatively big number of Asians in the country. Other
countries with significant numbers of foreigners in the country were Rwanda, Uganda, Great
Britain, Mozambique and United States of America.
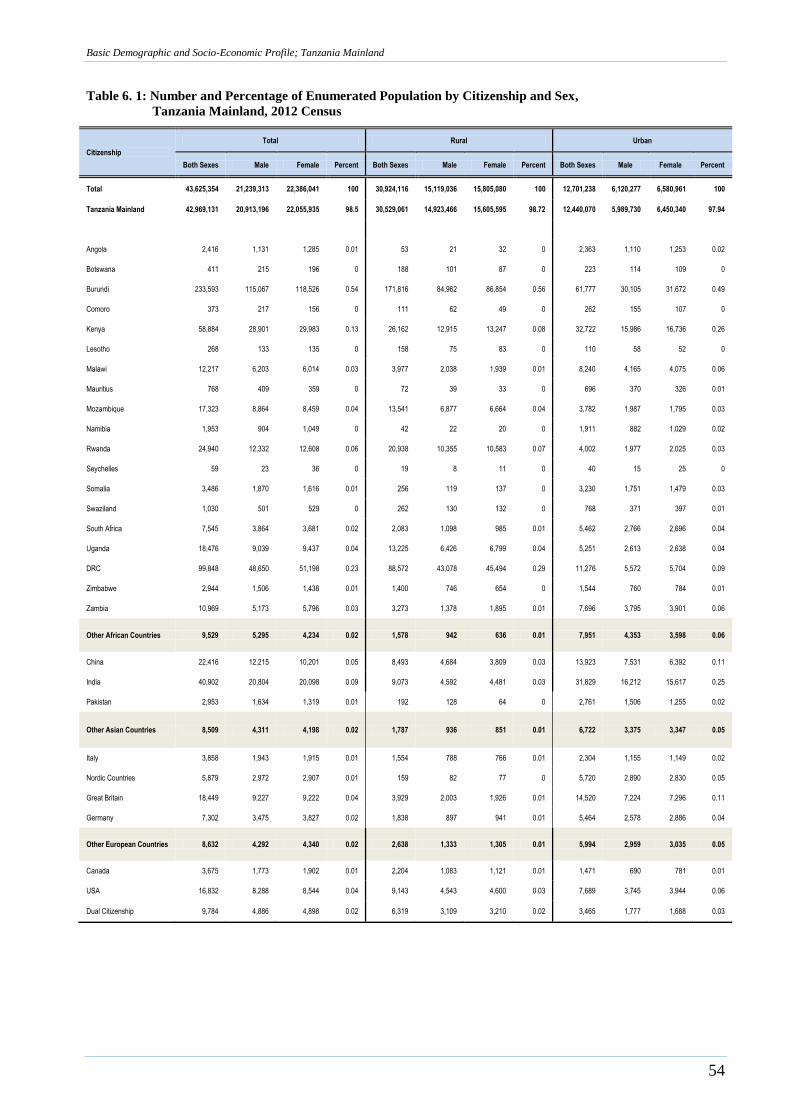
Basic Demographic and Socio-Economic Profile; Tanzania Mainland
54
Table 6. 1: Number and Percentage of Enumerated Population by Citizenship and Sex,
Tanzania Mainland, 2012 Census
Citizenship
Total Rural Urban
Both Sexes Male Female Percent Both Sexes Male Female Percent Both Sexes Male Female Percent
Total 43,625,354 21,239,313 22,386,041 100 30,924,116 15,119,036 15,805,080 100 12,701,238 6,120,277 6,580,961 100
Tanzania Mainland 42,969,131 20,913,196 22,055,935 98.5 30,529,061 14,923,466 15,605,595 98.72 12,440,070 5,989,730 6,450,340 97.94
Angola 2,416 1,131 1,285 0.01 53 21 32 0 2,363 1,110 1,253 0.02
Botswana 411 215 196 0 188 101 87 0 223 114 109 0
Burundi 233,593 115,067 118,526 0.54 171,816 84,962 86,854 0.56 61,777 30,105 31,672 0.49
Comoro 373 217 156 0 111 62 49 0 262 155 107 0
Kenya 58,884 28,901 29,983 0.13 26,162 12,915 13,247 0.08 32,722 15,986 16,736 0.26
Lesotho 268 133 135 0 158 75 83 0 110 58 52 0
Malawi 12,217 6,203 6,014 0.03 3,977 2,038 1,939 0.01 8,240 4,165 4,075 0.06
Mauritius 768 409 359 0 72 39 33 0 696 370 326 0.01
Mozambique 17,323 8,864 8,459 0.04 13,541 6,877 6,664 0.04 3,782 1,987 1,795 0.03
Namibia 1,953 904 1,049 0 42 22 20 0 1,911 882 1,029 0.02
Rwanda 24,940 12,332 12,608 0.06 20,938 10,355 10,583 0.07 4,002 1,977 2,025 0.03
Seychelles 59 23 36 0 19 8 11 0 40 15 25 0
Somalia 3,486 1,870 1,616 0.01 256 119 137 0 3,230 1,751 1,479 0.03
Swaziland 1,030 501 529 0 262 130 132 0 768 371 397 0.01
South Africa 7,545 3,864 3,681 0.02 2,083 1,098 985 0.01 5,462 2,766 2,696 0.04
Uganda 18,476 9,039 9,437 0.04 13,225 6,426 6,799 0.04 5,251 2,613 2,638 0.04
DRC 99,848 48,650 51,198 0.23 88,572 43,078 45,494 0.29 11,276 5,572 5,704 0.09
Zimbabwe 2,944 1,506 1,438 0.01 1,400 746 654 0 1,544 760 784 0.01
Zambia 10,969 5,173 5,796 0.03 3,273 1,378 1,895 0.01 7,696 3,795 3,901 0.06
Other African Countries 9,529 5,295 4,234 0.02 1,578 942 636 0.01 7,951 4,353 3,598 0.06
China 22,416 12,215 10,201 0.05 8,493 4,684 3,809 0.03 13,923 7,531 6,392 0.11
India 40,902 20,804 20,098 0.09 9,073 4,592 4,481 0.03 31,829 16,212 15,617 0.25
Pakistan 2,953 1,634 1,319 0.01 192 128 64 0 2,761 1,506 1,255 0.02
Other Asian Countries 8,509 4,311 4,198 0.02 1,787 936 851 0.01 6,722 3,375 3,347 0.05
Italy 3,858 1,943 1,915 0.01 1,554 788 766 0.01 2,304 1,155 1,149 0.02
Nordic Countries 5,879 2,972 2,907 0.01 159 82 77 0 5,720 2,890 2,830 0.05
Great Britain 18,449 9,227 9,222 0.04 3,929 2,003 1,926 0.01 14,520 7,224 7,296 0.11
Germany 7,302 3,475 3,827 0.02 1,838 897 941 0.01 5,464 2,578 2,886 0.04
Other European Countries 8,632 4,292 4,340 0.02 2,638 1,333 1,305 0.01 5,994 2,959 3,035 0.05
Canada 3,675 1,773 1,902 0.01 2,204 1,083 1,121 0.01 1,471 690 781 0.01
USA 16,832 8,288 8,544 0.04 9,143 4,543 4,600 0.03 7,689 3,745 3,944 0.06
Dual Citizenship 9,784 4,886 4,898 0.02 6,319 3,109 3,210 0.02 3,465 1,777 1,688 0.03
Basic Demographic and Socio-Economic Profile; Tanzania Mainland
55
6.2 Birth Certificate
A birth certificate is a vital record that documents the birth of a child. The term "birth certificate"
can refer to either the original document certifying the circumstances of the birth or to a certified
copy of or a representation of the ensuing registration of that birth. Depending on the jurisdiction, a
record of birth might or might not contain verification of the event by a midwife or doctor. In the
2012 PHC respondents were asked to state if they had birth certificates or notifications.
6.2.1 Birth Registration
Birth registration is the process by which a child‟s birth is recorded in the civil register by a
Government authority. It provides the first legal recognition of the child and is generally required
for the child to obtain a birth certificate and as a result any other legal documents and rights.
During the 2012 PHC, data on birth certificates were collected from all respondents regardless of
their age. Table 6.2 reveals that 13 percent of Tanzania Mainland population had birth certificates
while six (6) percent had not completed the registration process as they had birth notifications only.
Percentage of population with birth certificates was higher among younger population as compared
with that of older population, indicating an improvement in the registration activities in recent
years.
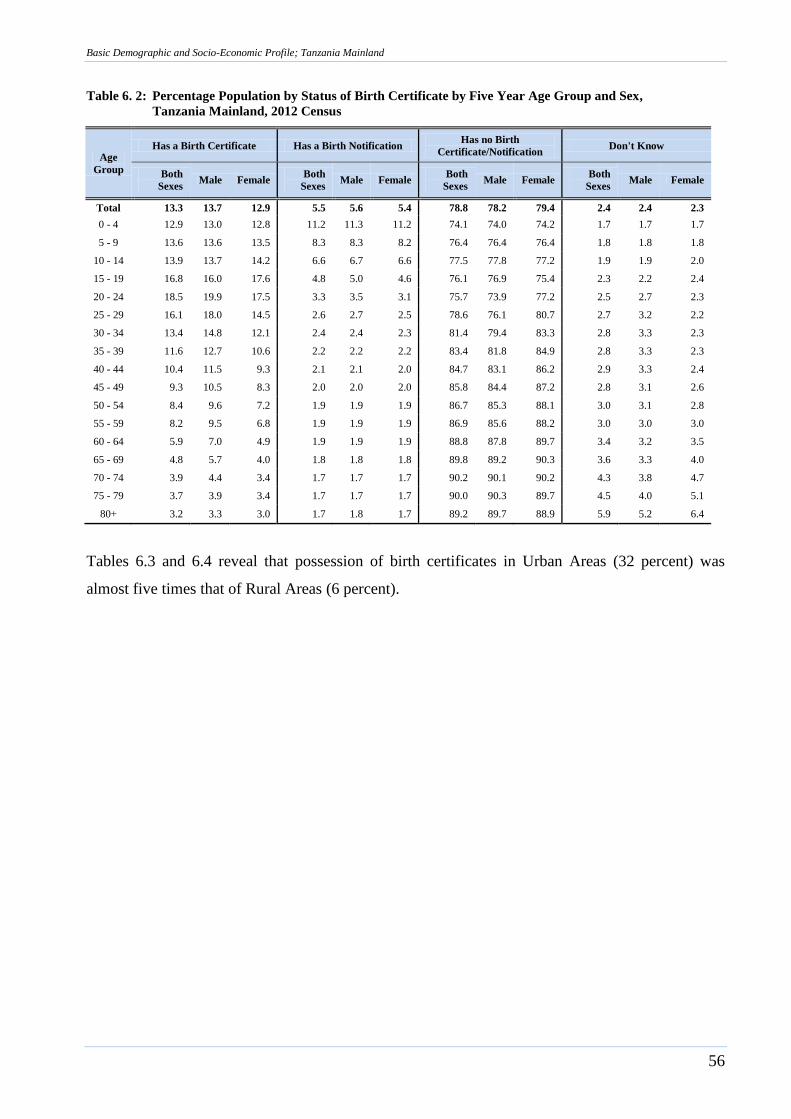
Basic Demographic and Socio-Economic Profile; Tanzania Mainland
56
Table 6. 2: Percentage Population by Status of Birth Certificate by Five Year Age Group and Sex,
Tanzania Mainland, 2012 Census
Age
Group
Has a Birth Certificate Has a Birth Notification Has no Birth
Certificate/Notification Don't Know
Both
Sexes Male Female
Both
Sexes Male Female
Both
Sexes Male Female
Both
Sexes Male Female
Total 13.3 13.7 12.9 5.5 5.6 5.4 78.8 78.2 79.4 2.4 2.4 2.3
0 - 4 12.9 13.0 12.8 11.2 11.3 11.2 74.1 74.0 74.2 1.7 1.7 1.7
5 - 9 13.6 13.6 13.5 8.3 8.3 8.2 76.4 76.4 76.4 1.8 1.8 1.8
10 - 14 13.9 13.7 14.2 6.6 6.7 6.6 77.5 77.8 77.2 1.9 1.9 2.0
15 - 19 16.8 16.0 17.6 4.8 5.0 4.6 76.1 76.9 75.4 2.3 2.2 2.4
20 - 24 18.5 19.9 17.5 3.3 3.5 3.1 75.7 73.9 77.2 2.5 2.7 2.3
25 - 29 16.1 18.0 14.5 2.6 2.7 2.5 78.6 76.1 80.7 2.7 3.2 2.2
30 - 34 13.4 14.8 12.1 2.4 2.4 2.3 81.4 79.4 83.3 2.8 3.3 2.3
35 - 39 11.6 12.7 10.6 2.2 2.2 2.2 83.4 81.8 84.9 2.8 3.3 2.3
40 - 44 10.4 11.5 9.3 2.1 2.1 2.0 84.7 83.1 86.2 2.9 3.3 2.4
45 - 49 9.3 10.5 8.3 2.0 2.0 2.0 85.8 84.4 87.2 2.8 3.1 2.6
50 - 54 8.4 9.6 7.2 1.9 1.9 1.9 86.7 85.3 88.1 3.0 3.1 2.8
55 - 59 8.2 9.5 6.8 1.9 1.9 1.9 86.9 85.6 88.2 3.0 3.0 3.0
60 - 64 5.9 7.0 4.9 1.9 1.9 1.9 88.8 87.8 89.7 3.4 3.2 3.5
65 - 69 4.8 5.7 4.0 1.8 1.8 1.8 89.8 89.2 90.3 3.6 3.3 4.0
70 - 74 3.9 4.4 3.4 1.7 1.7 1.7 90.2 90.1 90.2 4.3 3.8 4.7
75 - 79 3.7 3.9 3.4 1.7 1.7 1.7 90.0 90.3 89.7 4.5 4.0 5.1
80+ 3.2 3.3 3.0 1.7 1.8 1.7 89.2 89.7 88.9 5.9 5.2 6.4
Tables 6.3 and 6.4 reveal that possession of birth certificates in Urban Areas (32 percent) was
almost five times that of Rural Areas (6 percent).
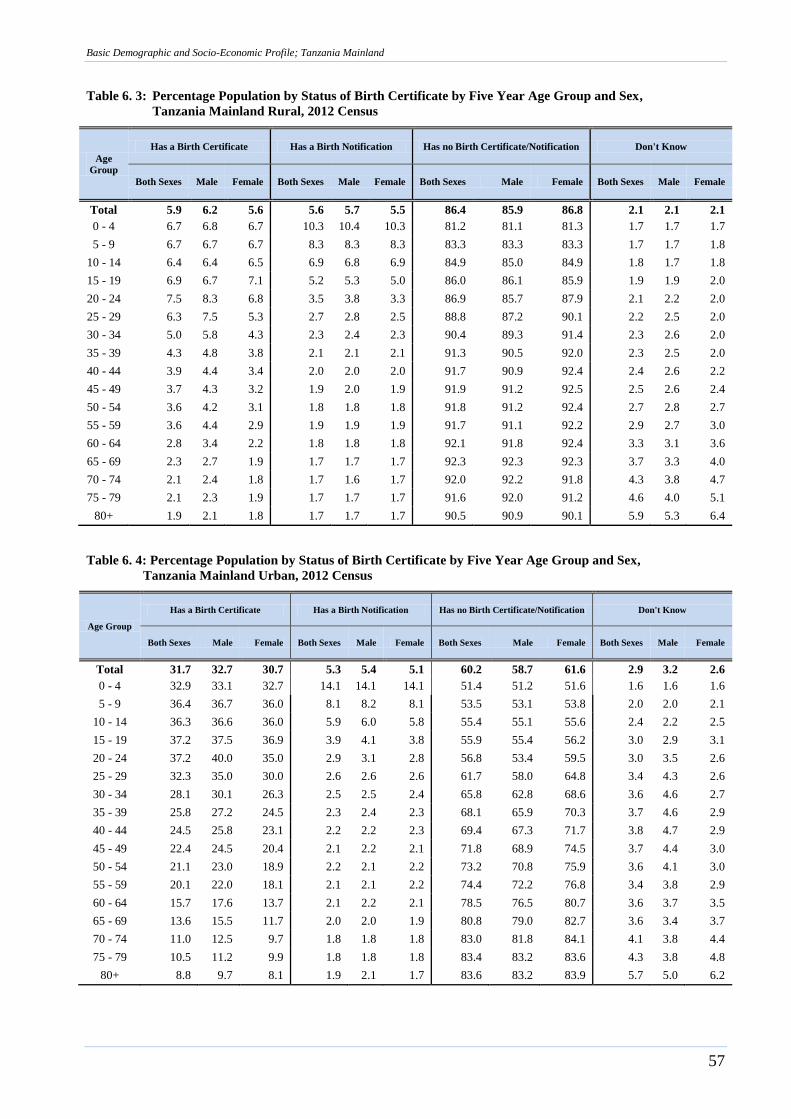
Basic Demographic and Socio-Economic Profile; Tanzania Mainland
57
Table 6. 3: Percentage Population by Status of Birth Certificate by Five Year Age Group and Sex,
Tanzania Mainland Rural, 2012 Census
Age
Group
Has a Birth Certificate Has a Birth Notification Has no Birth Certificate/Notification Don't Know
Both Sexes Male Female Both Sexes Male Female Both Sexes Male Female Both Sexes Male Female
Total 5.9 6.2 5.6 5.6 5.7 5.5 86.4 85.9 86.8 2.1 2.1 2.1
0 - 4 6.7 6.8 6.7 10.3 10.4 10.3 81.2 81.1 81.3 1.7 1.7 1.7
5 - 9 6.7 6.7 6.7 8.3 8.3 8.3 83.3 83.3 83.3 1.7 1.7 1.8
10 - 14 6.4 6.4 6.5 6.9 6.8 6.9 84.9 85.0 84.9 1.8 1.7 1.8
15 - 19 6.9 6.7 7.1 5.2 5.3 5.0 86.0 86.1 85.9 1.9 1.9 2.0
20 - 24 7.5 8.3 6.8 3.5 3.8 3.3 86.9 85.7 87.9 2.1 2.2 2.0
25 - 29 6.3 7.5 5.3 2.7 2.8 2.5 88.8 87.2 90.1 2.2 2.5 2.0
30 - 34 5.0 5.8 4.3 2.3 2.4 2.3 90.4 89.3 91.4 2.3 2.6 2.0
35 - 39 4.3 4.8 3.8 2.1 2.1 2.1 91.3 90.5 92.0 2.3 2.5 2.0
40 - 44 3.9 4.4 3.4 2.0 2.0 2.0 91.7 90.9 92.4 2.4 2.6 2.2
45 - 49 3.7 4.3 3.2 1.9 2.0 1.9 91.9 91.2 92.5 2.5 2.6 2.4
50 - 54 3.6 4.2 3.1 1.8 1.8 1.8 91.8 91.2 92.4 2.7 2.8 2.7
55 - 59 3.6 4.4 2.9 1.9 1.9 1.9 91.7 91.1 92.2 2.9 2.7 3.0
60 - 64 2.8 3.4 2.2 1.8 1.8 1.8 92.1 91.8 92.4 3.3 3.1 3.6
65 - 69 2.3 2.7 1.9 1.7 1.7 1.7 92.3 92.3 92.3 3.7 3.3 4.0
70 - 74 2.1 2.4 1.8 1.7 1.6 1.7 92.0 92.2 91.8 4.3 3.8 4.7
75 - 79 2.1 2.3 1.9 1.7 1.7 1.7 91.6 92.0 91.2 4.6 4.0 5.1
80+ 1.9 2.1 1.8 1.7 1.7 1.7 90.5 90.9 90.1 5.9 5.3 6.4
Table 6. 4: Percentage Population by Status of Birth Certificate by Five Year Age Group and Sex,
Tanzania Mainland Urban, 2012 Census
Age Group
Has a Birth Certificate Has a Birth Notification Has no Birth Certificate/Notification Don't Know
Both Sexes Male Female Both Sexes Male Female Both Sexes Male Female Both Sexes Male Female
Total 31.7 32.7 30.7 5.3 5.4 5.1 60.2 58.7 61.6 2.9 3.2 2.6
0 - 4 32.9 33.1 32.7 14.1 14.1 14.1 51.4 51.2 51.6 1.6 1.6 1.6
5 - 9 36.4 36.7 36.0 8.1 8.2 8.1 53.5 53.1 53.8 2.0 2.0 2.1
10 - 14 36.3 36.6 36.0 5.9 6.0 5.8 55.4 55.1 55.6 2.4 2.2 2.5
15 - 19 37.2 37.5 36.9 3.9 4.1 3.8 55.9 55.4 56.2 3.0 2.9 3.1
20 - 24 37.2 40.0 35.0 2.9 3.1 2.8 56.8 53.4 59.5 3.0 3.5 2.6
25 - 29 32.3 35.0 30.0 2.6 2.6 2.6 61.7 58.0 64.8 3.4 4.3 2.6
30 - 34 28.1 30.1 26.3 2.5 2.5 2.4 65.8 62.8 68.6 3.6 4.6 2.7
35 - 39 25.8 27.2 24.5 2.3 2.4 2.3 68.1 65.9 70.3 3.7 4.6 2.9
40 - 44 24.5 25.8 23.1 2.2 2.2 2.3 69.4 67.3 71.7 3.8 4.7 2.9
45 - 49 22.4 24.5 20.4 2.1 2.2 2.1 71.8 68.9 74.5 3.7 4.4 3.0
50 - 54 21.1 23.0 18.9 2.2 2.1 2.2 73.2 70.8 75.9 3.6 4.1 3.0
55 - 59 20.1 22.0 18.1 2.1 2.1 2.2 74.4 72.2 76.8 3.4 3.8 2.9
60 - 64 15.7 17.6 13.7 2.1 2.2 2.1 78.5 76.5 80.7 3.6 3.7 3.5
65 - 69 13.6 15.5 11.7 2.0 2.0 1.9 80.8 79.0 82.7 3.6 3.4 3.7
70 - 74 11.0 12.5 9.7 1.8 1.8 1.8 83.0 81.8 84.1 4.1 3.8 4.4
75 - 79 10.5 11.2 9.9 1.8 1.8 1.8 83.4 83.2 83.6 4.3 3.8 4.8
80+ 8.8 9.7 8.1 1.9 2.1 1.7 83.6 83.2 83.9 5.7 5.0 6.2
Basic Demographic and Socio-Economic Profile; Tanzania Mainland
58
In Tanzania Mainland, the region with the highest percentage of birth registration was Dar es
Salaam (40 percent) and the lowest was Simiyu with five (5) percent (Table 6.5). Other regions
with relatively high percentages of birth certificates were; Arusha (22 percent), Kilimanjaro (21
percent), Mwanza (13 percent) and Kagera and Iringa (12 percent each).
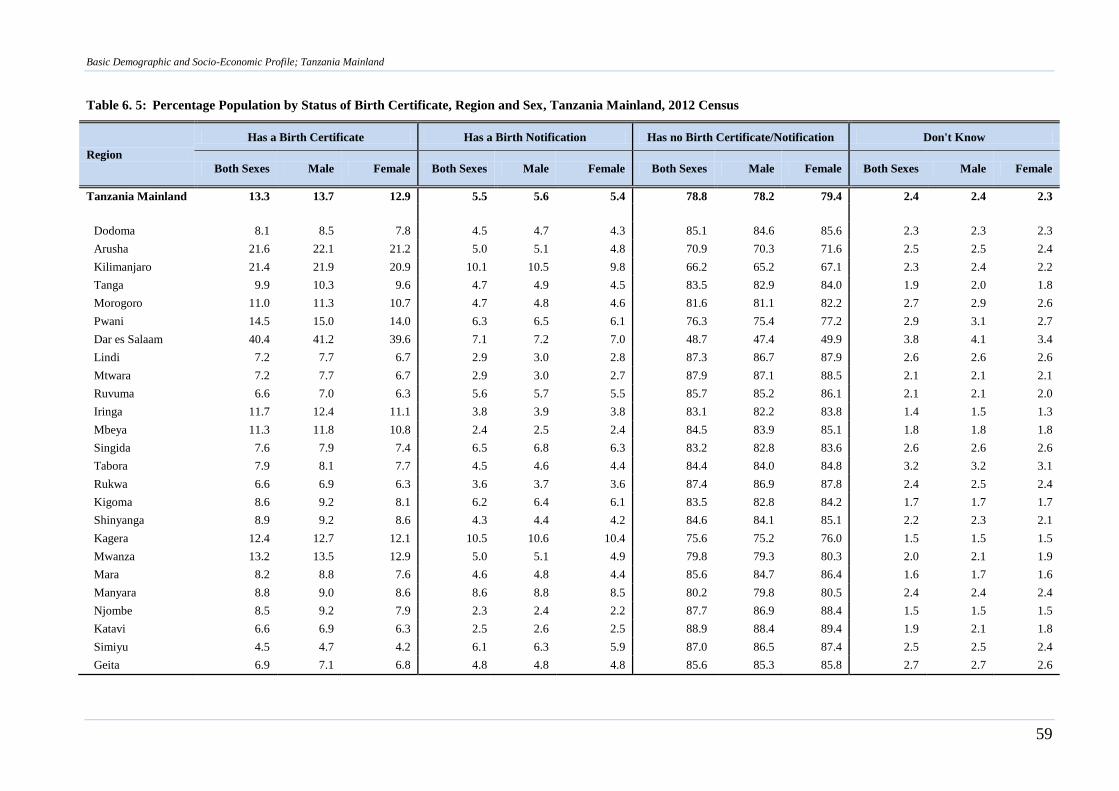
Basic Demographic and Socio-Economic Profile; Tanzania Mainland
59
Table 6. 5: Percentage Population by Status of Birth Certificate, Region and Sex, Tanzania Mainland, 2012 Census
Region
Has a Birth Certificate Has a Birth Notification Has no Birth Certificate/Notification Don't Know
Both Sexes Male Female Both Sexes Male Female Both Sexes Male Female Both Sexes Male Female
Tanzania Mainland 13.3 13.7 12.9 5.5 5.6 5.4 78.8 78.2 79.4 2.4 2.4 2.3
Dodoma 8.1 8.5 7.8 4.5 4.7 4.3 85.1 84.6 85.6 2.3 2.3 2.3
Arusha 21.6 22.1 21.2 5.0 5.1 4.8 70.9 70.3 71.6 2.5 2.5 2.4
Kilimanjaro 21.4 21.9 20.9 10.1 10.5 9.8 66.2 65.2 67.1 2.3 2.4 2.2
Tanga 9.9 10.3 9.6 4.7 4.9 4.5 83.5 82.9 84.0 1.9 2.0 1.8
Morogoro 11.0 11.3 10.7 4.7 4.8 4.6 81.6 81.1 82.2 2.7 2.9 2.6
Pwani 14.5 15.0 14.0 6.3 6.5 6.1 76.3 75.4 77.2 2.9 3.1 2.7
Dar es Salaam 40.4 41.2 39.6 7.1 7.2 7.0 48.7 47.4 49.9 3.8 4.1 3.4
Lindi 7.2 7.7 6.7 2.9 3.0 2.8 87.3 86.7 87.9 2.6 2.6 2.6
Mtwara 7.2 7.7 6.7 2.9 3.0 2.7 87.9 87.1 88.5 2.1 2.1 2.1
Ruvuma 6.6 7.0 6.3 5.6 5.7 5.5 85.7 85.2 86.1 2.1 2.1 2.0
Iringa 11.7 12.4 11.1 3.8 3.9 3.8 83.1 82.2 83.8 1.4 1.5 1.3
Mbeya 11.3 11.8 10.8 2.4 2.5 2.4 84.5 83.9 85.1 1.8 1.8 1.8
Singida 7.6 7.9 7.4 6.5 6.8 6.3 83.2 82.8 83.6 2.6 2.6 2.6
Tabora 7.9 8.1 7.7 4.5 4.6 4.4 84.4 84.0 84.8 3.2 3.2 3.1
Rukwa 6.6 6.9 6.3 3.6 3.7 3.6 87.4 86.9 87.8 2.4 2.5 2.4
Kigoma 8.6 9.2 8.1 6.2 6.4 6.1 83.5 82.8 84.2 1.7 1.7 1.7
Shinyanga 8.9 9.2 8.6 4.3 4.4 4.2 84.6 84.1 85.1 2.2 2.3 2.1
Kagera 12.4 12.7 12.1 10.5 10.6 10.4 75.6 75.2 76.0 1.5 1.5 1.5
Mwanza 13.2 13.5 12.9 5.0 5.1 4.9 79.8 79.3 80.3 2.0 2.1 1.9
Mara 8.2 8.8 7.6 4.6 4.8 4.4 85.6 84.7 86.4 1.6 1.7 1.6
Manyara 8.8 9.0 8.6 8.6 8.8 8.5 80.2 79.8 80.5 2.4 2.4 2.4
Njombe 8.5 9.2 7.9 2.3 2.4 2.2 87.7 86.9 88.4 1.5 1.5 1.5
Katavi 6.6 6.9 6.3 2.5 2.6 2.5 88.9 88.4 89.4 1.9 2.1 1.8
Simiyu 4.5 4.7 4.2 6.1 6.3 5.9 87.0 86.5 87.4 2.5 2.5 2.4
Geita 6.9 7.1 6.8 4.8 4.8 4.8 85.6 85.3 85.8 2.7 2.7 2.6

Basic Demographic and Socio-Economic Profile; Tanzania Mainland
60
Chapter Seven
Survival of Parents
7.1 Introduction
Data on survival of parents is usually collected in order to determine the extent of orphanhood in a
society. However, these data may have a problem of over-representation of parents with several
surviving children and the adoption effect, which arises when a child is orphaned at a very young
age and adopted by relatives. Relatives tend to regard these children as their true biological
children.
Generally, the term „orphan‟ is understood to mean a person whose mother and father are both
dead. However, United Nations definition that was adopted by Tanzanian Government identifies
an orphan as a person or child who has lost one or both of his parents. Depending on the society in
question, the age limit for somebody to be called a child is predetermined. In Tanzania, a child is
defined as a person who is under 18 years of age thus an orphan is a child aged between 0 to 17
years who has lost one or both of his parents.
7.2 Survival of Parents
In the 2012 PHC, data on the survival of parents was collected from a sample of 30 percent of
private households. Each person was asked to state if his/her mother and father were alive, dead or
if their survival status was unknown. Data collected was with respect to a person‟s biological
parents and not his/her adopting or fostering parents.
Tables 7.1 to 7.3 present percentage distributions of population by survival of parents by age
groups for total, male and female population. The tables indicate that 70 percent of all persons in
Tanzania Mainland and 92 percent of all children below the age of 18 years reported to have both
parents alive. However, the percentage of persons with both parents alive decreased as the age
increased. The same pattern was observed for both males and females.
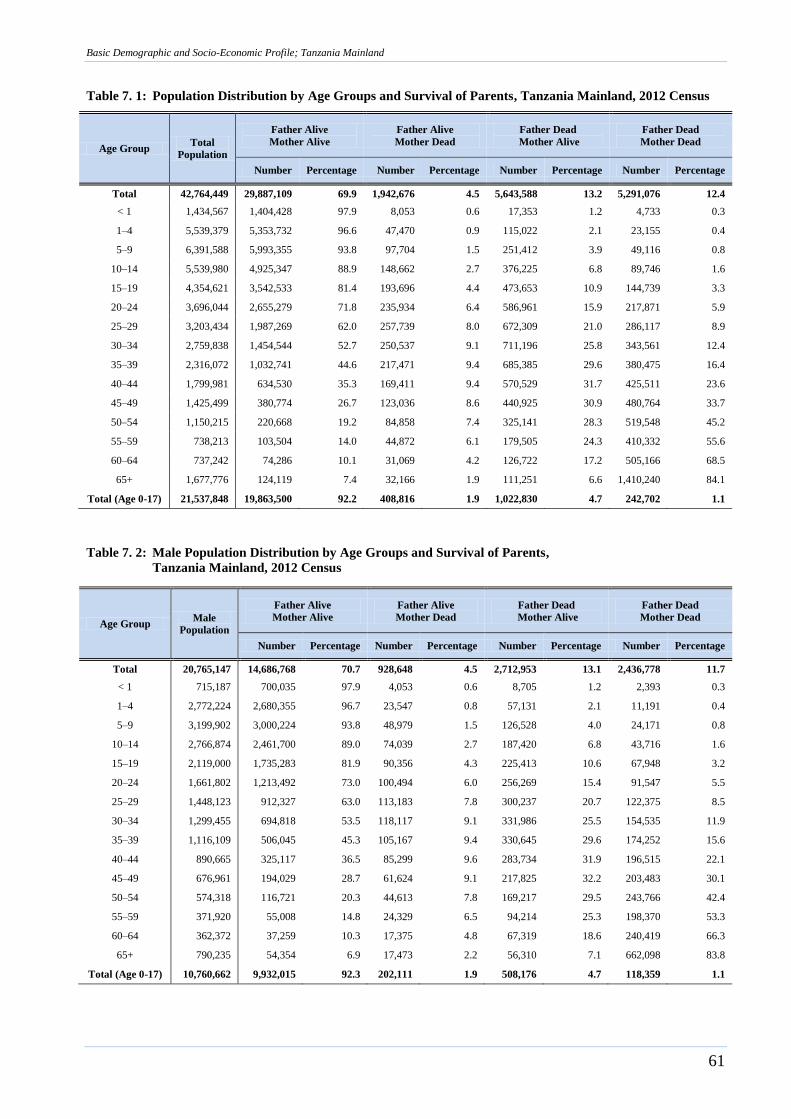
Basic Demographic and Socio-Economic Profile; Tanzania Mainland
61
Table 7. 1: Population Distribution by Age Groups and Survival of Parents, Tanzania Mainland, 2012 Census
Age Group Total
Population
Father Alive
Mother Alive
Father Alive
Mother Dead
Father Dead
Mother Alive
Father Dead
Mother Dead
Number Percentage Number Percentage Number Percentage Number Percentage
Total 42,764,449 29,887,109 69.9 1,942,676 4.5 5,643,588 13.2 5,291,076 12.4
< 1 1,434,567 1,404,428 97.9 8,053 0.6 17,353 1.2 4,733 0.3
1–4 5,539,379 5,353,732 96.6 47,470 0.9 115,022 2.1 23,155 0.4
5–9 6,391,588 5,993,355 93.8 97,704 1.5 251,412 3.9 49,116 0.8
10–14 5,539,980 4,925,347 88.9 148,662 2.7 376,225 6.8 89,746 1.6
15–19 4,354,621 3,542,533 81.4 193,696 4.4 473,653 10.9 144,739 3.3
20–24 3,696,044 2,655,279 71.8 235,934 6.4 586,961 15.9 217,871 5.9
25–29 3,203,434 1,987,269 62.0 257,739 8.0 672,309 21.0 286,117 8.9
30–34 2,759,838 1,454,544 52.7 250,537 9.1 711,196 25.8 343,561 12.4
35–39 2,316,072 1,032,741 44.6 217,471 9.4 685,385 29.6 380,475 16.4
40–44 1,799,981 634,530 35.3 169,411 9.4 570,529 31.7 425,511 23.6
45–49 1,425,499 380,774 26.7 123,036 8.6 440,925 30.9 480,764 33.7
50–54 1,150,215 220,668 19.2 84,858 7.4 325,141 28.3 519,548 45.2
55–59 738,213 103,504 14.0 44,872 6.1 179,505 24.3 410,332 55.6
60–64 737,242 74,286 10.1 31,069 4.2 126,722 17.2 505,166 68.5
65+ 1,677,776 124,119 7.4 32,166 1.9 111,251 6.6 1,410,240 84.1
Total (Age 0-17) 21,537,848 19,863,500 92.2 408,816 1.9 1,022,830 4.7 242,702 1.1
Table 7. 2: Male Population Distribution by Age Groups and Survival of Parents,
Tanzania Mainland, 2012 Census
Age Group Male
Population
Father Alive
Mother Alive
Father Alive
Mother Dead
Father Dead
Mother Alive
Father Dead
Mother Dead
Number Percentage Number Percentage Number Percentage Number Percentage
Total 20,765,147 14,686,768 70.7 928,648 4.5 2,712,953 13.1 2,436,778 11.7
< 1 715,187 700,035 97.9 4,053 0.6 8,705 1.2 2,393 0.3
1–4 2,772,224 2,680,355 96.7 23,547 0.8 57,131 2.1 11,191 0.4
5–9 3,199,902 3,000,224 93.8 48,979 1.5 126,528 4.0 24,171 0.8
10–14 2,766,874 2,461,700 89.0 74,039 2.7 187,420 6.8 43,716 1.6
15–19 2,119,000 1,735,283 81.9 90,356 4.3 225,413 10.6 67,948 3.2
20–24 1,661,802 1,213,492 73.0 100,494 6.0 256,269 15.4 91,547 5.5
25–29 1,448,123 912,327 63.0 113,183 7.8 300,237 20.7 122,375 8.5
30–34 1,299,455 694,818 53.5 118,117 9.1 331,986 25.5 154,535 11.9
35–39 1,116,109 506,045 45.3 105,167 9.4 330,645 29.6 174,252 15.6
40–44 890,665 325,117 36.5 85,299 9.6 283,734 31.9 196,515 22.1
45–49 676,961 194,029 28.7 61,624 9.1 217,825 32.2 203,483 30.1
50–54 574,318 116,721 20.3 44,613 7.8 169,217 29.5 243,766 42.4
55–59 371,920 55,008 14.8 24,329 6.5 94,214 25.3 198,370 53.3
60–64 362,372 37,259 10.3 17,375 4.8 67,319 18.6 240,419 66.3
65+ 790,235 54,354 6.9 17,473 2.2 56,310 7.1 662,098 83.8
Total (Age 0-17) 10,760,662 9,932,015 92.3 202,111 1.9 508,176 4.7 118,359 1.1
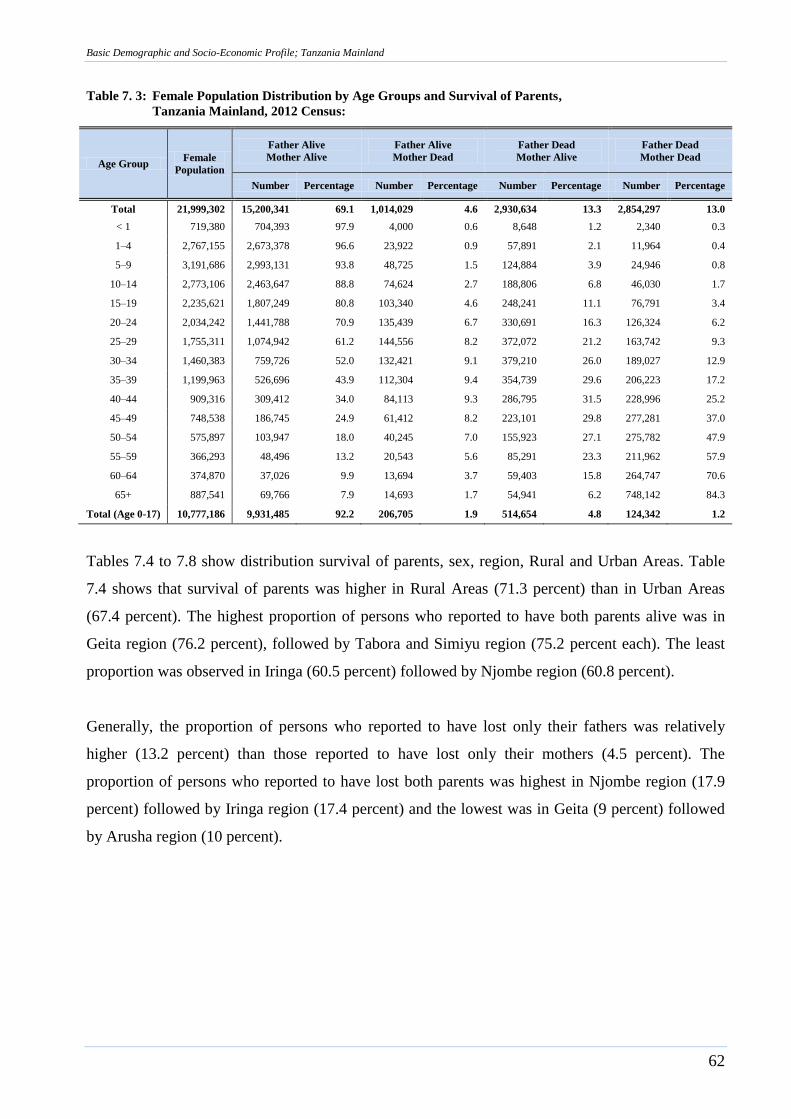
Basic Demographic and Socio-Economic Profile; Tanzania Mainland
62
Table 7. 3: Female Population Distribution by Age Groups and Survival of Parents,
Tanzania Mainland, 2012 Census:
Age Group Female
Population
Father Alive
Mother Alive
Father Alive
Mother Dead
Father Dead
Mother Alive
Father Dead
Mother Dead
Number Percentage Number Percentage Number Percentage Number Percentage
Total 21,999,302 15,200,341 69.1 1,014,029 4.6 2,930,634 13.3 2,854,297 13.0
< 1 719,380 704,393 97.9 4,000 0.6 8,648 1.2 2,340 0.3
1–4 2,767,155 2,673,378 96.6 23,922 0.9 57,891 2.1 11,964 0.4
5–9 3,191,686 2,993,131 93.8 48,725 1.5 124,884 3.9 24,946 0.8
10–14 2,773,106 2,463,647 88.8 74,624 2.7 188,806 6.8 46,030 1.7
15–19 2,235,621 1,807,249 80.8 103,340 4.6 248,241 11.1 76,791 3.4
20–24 2,034,242 1,441,788 70.9 135,439 6.7 330,691 16.3 126,324 6.2
25–29 1,755,311 1,074,942 61.2 144,556 8.2 372,072 21.2 163,742 9.3
30–34 1,460,383 759,726 52.0 132,421 9.1 379,210 26.0 189,027 12.9
35–39 1,199,963 526,696 43.9 112,304 9.4 354,739 29.6 206,223 17.2
40–44 909,316 309,412 34.0 84,113 9.3 286,795 31.5 228,996 25.2
45–49 748,538 186,745 24.9 61,412 8.2 223,101 29.8 277,281 37.0
50–54 575,897 103,947 18.0 40,245 7.0 155,923 27.1 275,782 47.9
55–59 366,293 48,496 13.2 20,543 5.6 85,291 23.3 211,962 57.9
60–64 374,870 37,026 9.9 13,694 3.7 59,403 15.8 264,747 70.6
65+ 887,541 69,766 7.9 14,693 1.7 54,941 6.2 748,142 84.3
Total (Age 0-17) 10,777,186 9,931,485 92.2 206,705 1.9 514,654 4.8 124,342 1.2
Tables 7.4 to 7.8 show distribution survival of parents, sex, region, Rural and Urban Areas. Table
7.4 shows that survival of parents was higher in Rural Areas (71.3 percent) than in Urban Areas
(67.4 percent). The highest proportion of persons who reported to have both parents alive was in
Geita region (76.2 percent), followed by Tabora and Simiyu region (75.2 percent each). The least
proportion was observed in Iringa (60.5 percent) followed by Njombe region (60.8 percent).
Generally, the proportion of persons who reported to have lost only their fathers was relatively
higher (13.2 percent) than those reported to have lost only their mothers (4.5 percent). The
proportion of persons who reported to have lost both parents was highest in Njombe region (17.9
percent) followed by Iringa region (17.4 percent) and the lowest was in Geita (9 percent) followed
by Arusha region (10 percent).
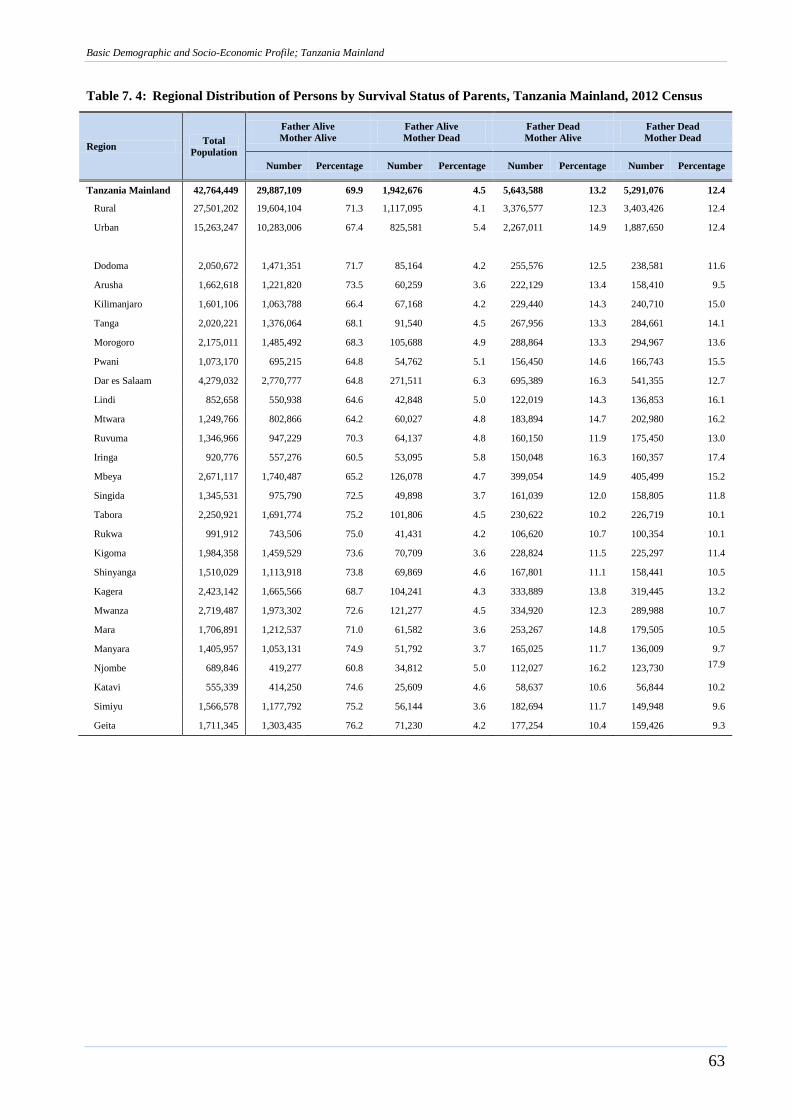
Basic Demographic and Socio-Economic Profile; Tanzania Mainland
63
Table 7. 4: Regional Distribution of Persons by Survival Status of Parents, Tanzania Mainland, 2012 Census
Region Total
Population
Father Alive
Mother Alive
Father Alive
Mother Dead
Father Dead
Mother Alive
Father Dead
Mother Dead
Number Percentage Number Percentage Number Percentage Number Percentage
Tanzania Mainland 42,764,449 29,887,109 69.9 1,942,676 4.5 5,643,588 13.2 5,291,076 12.4
Rural 27,501,202 19,604,104 71.3 1,117,095 4.1 3,376,577 12.3 3,403,426 12.4
Urban 15,263,247 10,283,006 67.4 825,581 5.4 2,267,011 14.9 1,887,650 12.4
Dodoma 2,050,672 1,471,351 71.7 85,164 4.2 255,576 12.5 238,581 11.6
Arusha 1,662,618 1,221,820 73.5 60,259 3.6 222,129 13.4 158,410 9.5
Kilimanjaro 1,601,106 1,063,788 66.4 67,168 4.2 229,440 14.3 240,710 15.0
Tanga 2,020,221 1,376,064 68.1 91,540 4.5 267,956 13.3 284,661 14.1
Morogoro 2,175,011 1,485,492 68.3 105,688 4.9 288,864 13.3 294,967 13.6
Pwani 1,073,170 695,215 64.8 54,762 5.1 156,450 14.6 166,743 15.5
Dar es Salaam 4,279,032 2,770,777 64.8 271,511 6.3 695,389 16.3 541,355 12.7
Lindi 852,658 550,938 64.6 42,848 5.0 122,019 14.3 136,853 16.1
Mtwara 1,249,766 802,866 64.2 60,027 4.8 183,894 14.7 202,980 16.2
Ruvuma 1,346,966 947,229 70.3 64,137 4.8 160,150 11.9 175,450 13.0
Iringa 920,776 557,276 60.5 53,095 5.8 150,048 16.3 160,357 17.4
Mbeya 2,671,117 1,740,487 65.2 126,078 4.7 399,054 14.9 405,499 15.2
Singida 1,345,531 975,790 72.5 49,898 3.7 161,039 12.0 158,805 11.8
Tabora 2,250,921 1,691,774 75.2 101,806 4.5 230,622 10.2 226,719 10.1
Rukwa 991,912 743,506 75.0 41,431 4.2 106,620 10.7 100,354 10.1
Kigoma 1,984,358 1,459,529 73.6 70,709 3.6 228,824 11.5 225,297 11.4
Shinyanga 1,510,029 1,113,918 73.8 69,869 4.6 167,801 11.1 158,441 10.5
Kagera 2,423,142 1,665,566 68.7 104,241 4.3 333,889 13.8 319,445 13.2
Mwanza 2,719,487 1,973,302 72.6 121,277 4.5 334,920 12.3 289,988 10.7
Mara 1,706,891 1,212,537 71.0 61,582 3.6 253,267 14.8 179,505 10.5
Manyara 1,405,957 1,053,131 74.9 51,792 3.7 165,025 11.7 136,009 9.7
Njombe 689,846 419,277 60.8 34,812 5.0 112,027 16.2 123,730 17.9
Katavi 555,339 414,250 74.6 25,609 4.6 58,637 10.6 56,844 10.2
Simiyu 1,566,578 1,177,792 75.2 56,144 3.6 182,694 11.7 149,948 9.6
Geita 1,711,345 1,303,435 76.2 71,230 4.2 177,254 10.4 159,426 9.3
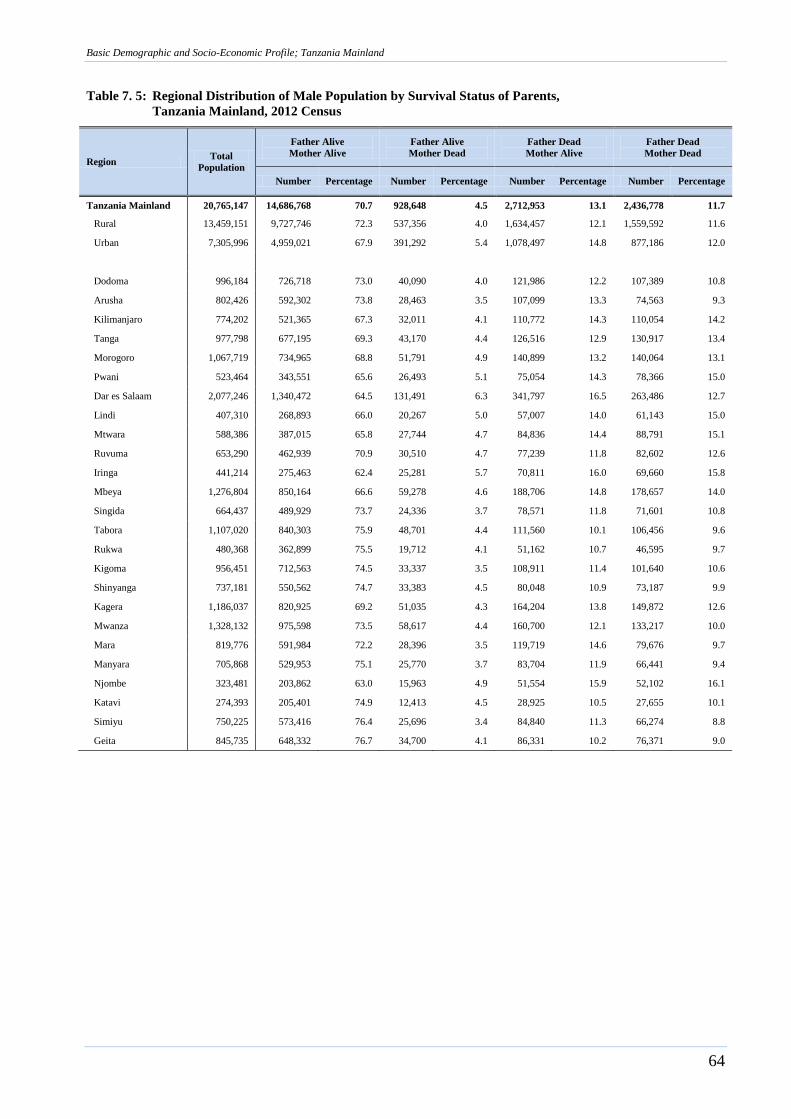
Basic Demographic and Socio-Economic Profile; Tanzania Mainland
64
Table 7. 5: Regional Distribution of Male Population by Survival Status of Parents,
Tanzania Mainland, 2012 Census
Region Total
Population
Father Alive
Mother Alive
Father Alive
Mother Dead
Father Dead
Mother Alive
Father Dead
Mother Dead
Number Percentage Number Percentage Number Percentage Number Percentage
Tanzania Mainland 20,765,147 14,686,768 70.7 928,648 4.5 2,712,953 13.1 2,436,778 11.7
Rural 13,459,151 9,727,746 72.3 537,356 4.0 1,634,457 12.1 1,559,592 11.6
Urban 7,305,996 4,959,021 67.9 391,292 5.4 1,078,497 14.8 877,186 12.0
Dodoma 996,184 726,718 73.0 40,090 4.0 121,986 12.2 107,389 10.8
Arusha 802,426 592,302 73.8 28,463 3.5 107,099 13.3 74,563 9.3
Kilimanjaro 774,202 521,365 67.3 32,011 4.1 110,772 14.3 110,054 14.2
Tanga 977,798 677,195 69.3 43,170 4.4 126,516 12.9 130,917 13.4
Morogoro 1,067,719 734,965 68.8 51,791 4.9 140,899 13.2 140,064 13.1
Pwani 523,464 343,551 65.6 26,493 5.1 75,054 14.3 78,366 15.0
Dar es Salaam 2,077,246 1,340,472 64.5 131,491 6.3 341,797 16.5 263,486 12.7
Lindi 407,310 268,893 66.0 20,267 5.0 57,007 14.0 61,143 15.0
Mtwara 588,386 387,015 65.8 27,744 4.7 84,836 14.4 88,791 15.1
Ruvuma 653,290 462,939 70.9 30,510 4.7 77,239 11.8 82,602 12.6
Iringa 441,214 275,463 62.4 25,281 5.7 70,811 16.0 69,660 15.8
Mbeya 1,276,804 850,164 66.6 59,278 4.6 188,706 14.8 178,657 14.0
Singida 664,437 489,929 73.7 24,336 3.7 78,571 11.8 71,601 10.8
Tabora 1,107,020 840,303 75.9 48,701 4.4 111,560 10.1 106,456 9.6
Rukwa 480,368 362,899 75.5 19,712 4.1 51,162 10.7 46,595 9.7
Kigoma 956,451 712,563 74.5 33,337 3.5 108,911 11.4 101,640 10.6
Shinyanga 737,181 550,562 74.7 33,383 4.5 80,048 10.9 73,187 9.9
Kagera 1,186,037 820,925 69.2 51,035 4.3 164,204 13.8 149,872 12.6
Mwanza 1,328,132 975,598 73.5 58,617 4.4 160,700 12.1 133,217 10.0
Mara 819,776 591,984 72.2 28,396 3.5 119,719 14.6 79,676 9.7
Manyara 705,868 529,953 75.1 25,770 3.7 83,704 11.9 66,441 9.4
Njombe 323,481 203,862 63.0 15,963 4.9 51,554 15.9 52,102 16.1
Katavi 274,393 205,401 74.9 12,413 4.5 28,925 10.5 27,655 10.1
Simiyu 750,225 573,416 76.4 25,696 3.4 84,840 11.3 66,274 8.8
Geita 845,735 648,332 76.7 34,700 4.1 86,331 10.2 76,371 9.0
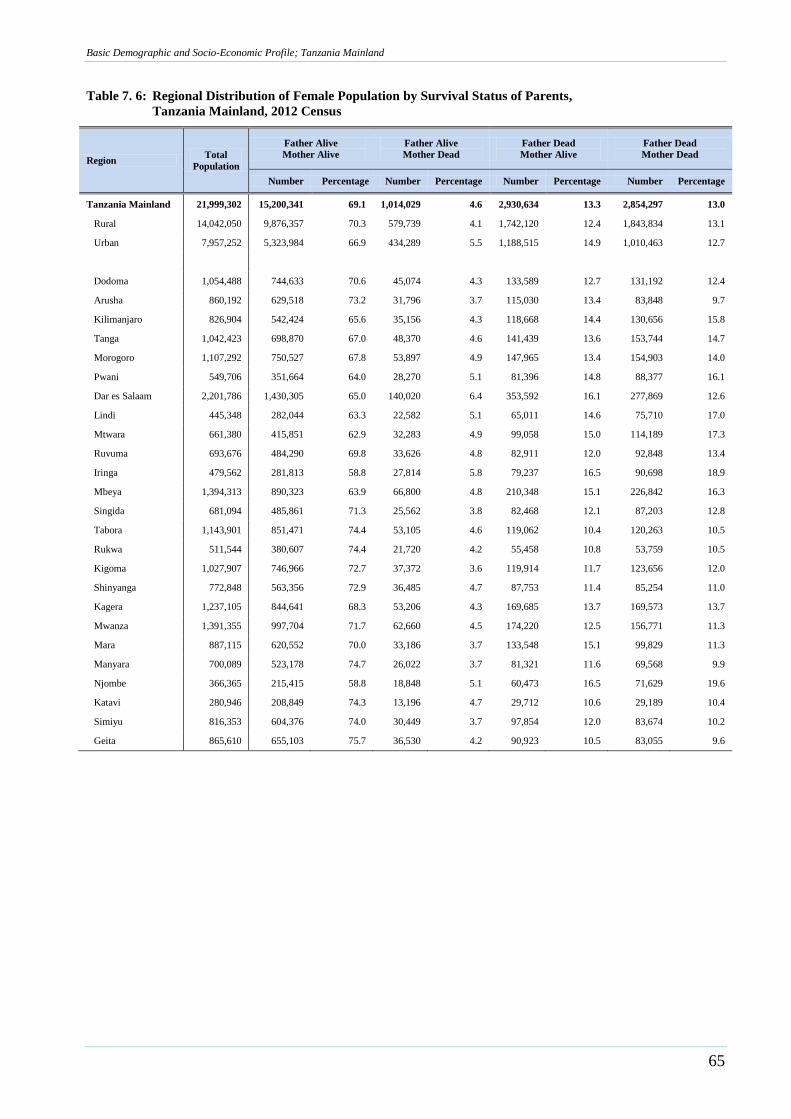
Basic Demographic and Socio-Economic Profile; Tanzania Mainland
65
Table 7. 6: Regional Distribution of Female Population by Survival Status of Parents,
Tanzania Mainland, 2012 Census
Region Total
Population
Father Alive
Mother Alive
Father Alive
Mother Dead
Father Dead
Mother Alive
Father Dead
Mother Dead
Number Percentage Number Percentage Number Percentage Number Percentage
Tanzania Mainland 21,999,302 15,200,341 69.1 1,014,029 4.6 2,930,634 13.3 2,854,297 13.0
Rural 14,042,050 9,876,357 70.3 579,739 4.1 1,742,120 12.4 1,843,834 13.1
Urban 7,957,252 5,323,984 66.9 434,289 5.5 1,188,515 14.9 1,010,463 12.7
Dodoma 1,054,488 744,633 70.6 45,074 4.3 133,589 12.7 131,192 12.4
Arusha 860,192 629,518 73.2 31,796 3.7 115,030 13.4 83,848 9.7
Kilimanjaro 826,904 542,424 65.6 35,156 4.3 118,668 14.4 130,656 15.8
Tanga 1,042,423 698,870 67.0 48,370 4.6 141,439 13.6 153,744 14.7
Morogoro 1,107,292 750,527 67.8 53,897 4.9 147,965 13.4 154,903 14.0
Pwani 549,706 351,664 64.0 28,270 5.1 81,396 14.8 88,377 16.1
Dar es Salaam 2,201,786 1,430,305 65.0 140,020 6.4 353,592 16.1 277,869 12.6
Lindi 445,348 282,044 63.3 22,582 5.1 65,011 14.6 75,710 17.0
Mtwara 661,380 415,851 62.9 32,283 4.9 99,058 15.0 114,189 17.3
Ruvuma 693,676 484,290 69.8 33,626 4.8 82,911 12.0 92,848 13.4
Iringa 479,562 281,813 58.8 27,814 5.8 79,237 16.5 90,698 18.9
Mbeya 1,394,313 890,323 63.9 66,800 4.8 210,348 15.1 226,842 16.3
Singida 681,094 485,861 71.3 25,562 3.8 82,468 12.1 87,203 12.8
Tabora 1,143,901 851,471 74.4 53,105 4.6 119,062 10.4 120,263 10.5
Rukwa 511,544 380,607 74.4 21,720 4.2 55,458 10.8 53,759 10.5
Kigoma 1,027,907 746,966 72.7 37,372 3.6 119,914 11.7 123,656 12.0
Shinyanga 772,848 563,356 72.9 36,485 4.7 87,753 11.4 85,254 11.0
Kagera 1,237,105 844,641 68.3 53,206 4.3 169,685 13.7 169,573 13.7
Mwanza 1,391,355 997,704 71.7 62,660 4.5 174,220 12.5 156,771 11.3
Mara 887,115 620,552 70.0 33,186 3.7 133,548 15.1 99,829 11.3
Manyara 700,089 523,178 74.7 26,022 3.7 81,321 11.6 69,568 9.9
Njombe 366,365 215,415 58.8 18,848 5.1 60,473 16.5 71,629 19.6
Katavi 280,946 208,849 74.3 13,196 4.7 29,712 10.6 29,189 10.4
Simiyu 816,353 604,376 74.0 30,449 3.7 97,854 12.0 83,674 10.2
Geita 865,610 655,103 75.7 36,530 4.2 90,923 10.5 83,055 9.6
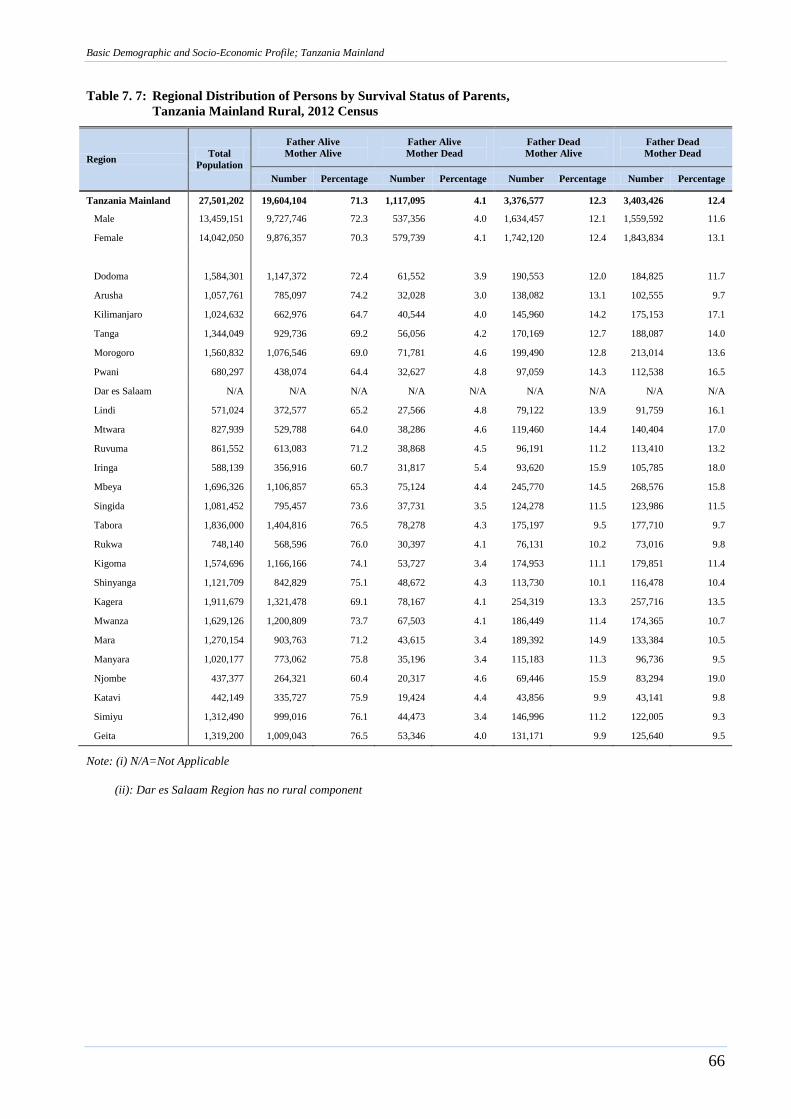
Basic Demographic and Socio-Economic Profile; Tanzania Mainland
66
Table 7. 7: Regional Distribution of Persons by Survival Status of Parents,
Tanzania Mainland Rural, 2012 Census
Region Total
Population
Father Alive
Mother Alive
Father Alive
Mother Dead
Father Dead
Mother Alive
Father Dead
Mother Dead
Number Percentage Number Percentage Number Percentage Number Percentage
Tanzania Mainland 27,501,202 19,604,104 71.3 1,117,095 4.1 3,376,577 12.3 3,403,426 12.4
Male 13,459,151 9,727,746 72.3 537,356 4.0 1,634,457 12.1 1,559,592 11.6
Female 14,042,050 9,876,357 70.3 579,739 4.1 1,742,120 12.4 1,843,834 13.1
Dodoma 1,584,301 1,147,372 72.4 61,552 3.9 190,553 12.0 184,825 11.7
Arusha 1,057,761 785,097 74.2 32,028 3.0 138,082 13.1 102,555 9.7
Kilimanjaro 1,024,632 662,976 64.7 40,544 4.0 145,960 14.2 175,153 17.1
Tanga 1,344,049 929,736 69.2 56,056 4.2 170,169 12.7 188,087 14.0
Morogoro 1,560,832 1,076,546 69.0 71,781 4.6 199,490 12.8 213,014 13.6
Pwani 680,297 438,074 64.4 32,627 4.8 97,059 14.3 112,538 16.5
Dar es Salaam N/A N/A N/A N/A N/A N/A N/A N/A N/A
Lindi 571,024 372,577 65.2 27,566 4.8 79,122 13.9 91,759 16.1
Mtwara 827,939 529,788 64.0 38,286 4.6 119,460 14.4 140,404 17.0
Ruvuma 861,552 613,083 71.2 38,868 4.5 96,191 11.2 113,410 13.2
Iringa 588,139 356,916 60.7 31,817 5.4 93,620 15.9 105,785 18.0
Mbeya 1,696,326 1,106,857 65.3 75,124 4.4 245,770 14.5 268,576 15.8
Singida 1,081,452 795,457 73.6 37,731 3.5 124,278 11.5 123,986 11.5
Tabora 1,836,000 1,404,816 76.5 78,278 4.3 175,197 9.5 177,710 9.7
Rukwa 748,140 568,596 76.0 30,397 4.1 76,131 10.2 73,016 9.8
Kigoma 1,574,696 1,166,166 74.1 53,727 3.4 174,953 11.1 179,851 11.4
Shinyanga 1,121,709 842,829 75.1 48,672 4.3 113,730 10.1 116,478 10.4
Kagera 1,911,679 1,321,478 69.1 78,167 4.1 254,319 13.3 257,716 13.5
Mwanza 1,629,126 1,200,809 73.7 67,503 4.1 186,449 11.4 174,365 10.7
Mara 1,270,154 903,763 71.2 43,615 3.4 189,392 14.9 133,384 10.5
Manyara 1,020,177 773,062 75.8 35,196 3.4 115,183 11.3 96,736 9.5
Njombe 437,377 264,321 60.4 20,317 4.6 69,446 15.9 83,294 19.0
Katavi 442,149 335,727 75.9 19,424 4.4 43,856 9.9 43,141 9.8
Simiyu 1,312,490 999,016 76.1 44,473 3.4 146,996 11.2 122,005 9.3
Geita 1,319,200 1,009,043 76.5 53,346 4.0 131,171 9.9 125,640 9.5
Note: (i) N/A=Not Applicable
(ii): Dar es Salaam Region has no rural component
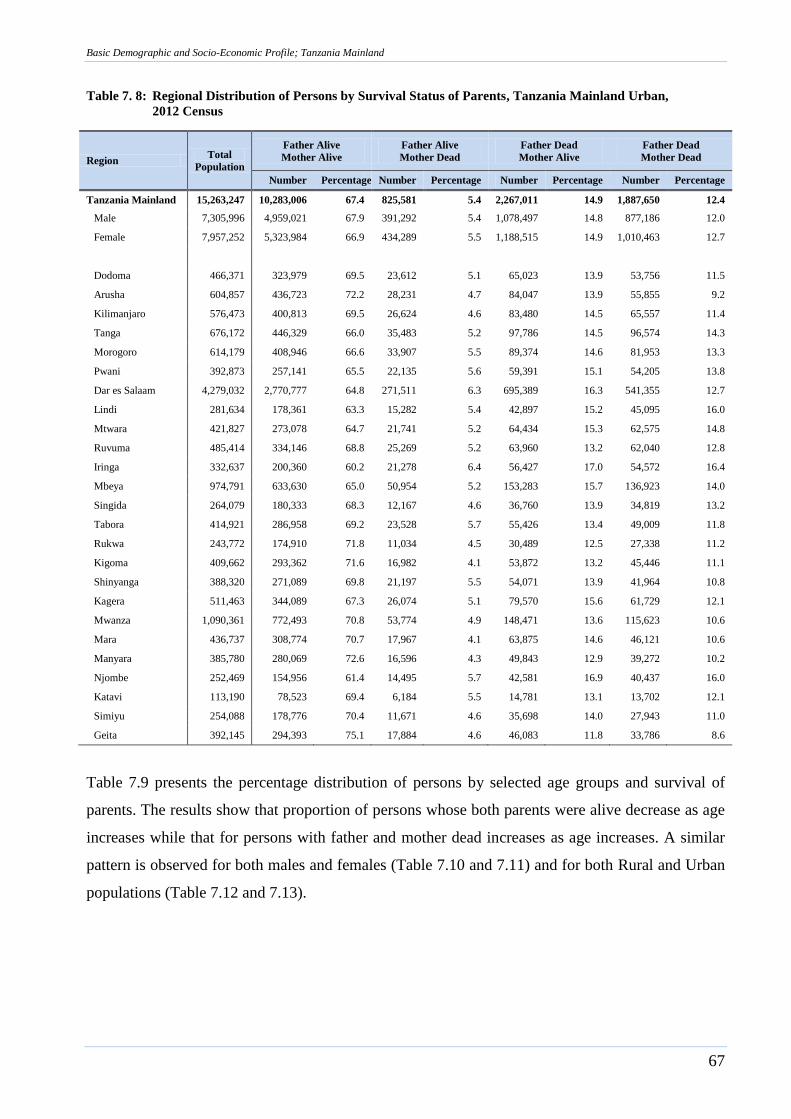
Basic Demographic and Socio-Economic Profile; Tanzania Mainland
67
Table 7. 8: Regional Distribution of Persons by Survival Status of Parents, Tanzania Mainland Urban,
2012 Census
Region Total
Population
Father Alive
Mother Alive
Father Alive
Mother Dead
Father Dead
Mother Alive
Father Dead
Mother Dead
Number Percentage Number Percentage Number Percentage Number Percentage
Tanzania Mainland 15,263,247 10,283,006 67.4 825,581 5.4 2,267,011 14.9 1,887,650 12.4
Male 7,305,996 4,959,021 67.9 391,292 5.4 1,078,497 14.8 877,186 12.0
Female 7,957,252 5,323,984 66.9 434,289 5.5 1,188,515 14.9 1,010,463 12.7
Dodoma 466,371 323,979 69.5 23,612 5.1 65,023 13.9 53,756 11.5
Arusha 604,857 436,723 72.2 28,231 4.7 84,047 13.9 55,855 9.2
Kilimanjaro 576,473 400,813 69.5 26,624 4.6 83,480 14.5 65,557 11.4
Tanga 676,172 446,329 66.0 35,483 5.2 97,786 14.5 96,574 14.3
Morogoro 614,179 408,946 66.6 33,907 5.5 89,374 14.6 81,953 13.3
Pwani 392,873 257,141 65.5 22,135 5.6 59,391 15.1 54,205 13.8
Dar es Salaam 4,279,032 2,770,777 64.8 271,511 6.3 695,389 16.3 541,355 12.7
Lindi 281,634 178,361 63.3 15,282 5.4 42,897 15.2 45,095 16.0
Mtwara 421,827 273,078 64.7 21,741 5.2 64,434 15.3 62,575 14.8
Ruvuma 485,414 334,146 68.8 25,269 5.2 63,960 13.2 62,040 12.8
Iringa 332,637 200,360 60.2 21,278 6.4 56,427 17.0 54,572 16.4
Mbeya 974,791 633,630 65.0 50,954 5.2 153,283 15.7 136,923 14.0
Singida 264,079 180,333 68.3 12,167 4.6 36,760 13.9 34,819 13.2
Tabora 414,921 286,958 69.2 23,528 5.7 55,426 13.4 49,009 11.8
Rukwa 243,772 174,910 71.8 11,034 4.5 30,489 12.5 27,338 11.2
Kigoma 409,662 293,362 71.6 16,982 4.1 53,872 13.2 45,446 11.1
Shinyanga 388,320 271,089 69.8 21,197 5.5 54,071 13.9 41,964 10.8
Kagera 511,463 344,089 67.3 26,074 5.1 79,570 15.6 61,729 12.1
Mwanza 1,090,361 772,493 70.8 53,774 4.9 148,471 13.6 115,623 10.6
Mara 436,737 308,774 70.7 17,967 4.1 63,875 14.6 46,121 10.6
Manyara 385,780 280,069 72.6 16,596 4.3 49,843 12.9 39,272 10.2
Njombe 252,469 154,956 61.4 14,495 5.7 42,581 16.9 40,437 16.0
Katavi 113,190 78,523 69.4 6,184 5.5 14,781 13.1 13,702 12.1
Simiyu 254,088 178,776 70.4 11,671 4.6 35,698 14.0 27,943 11.0
Geita 392,145 294,393 75.1 17,884 4.6 46,083 11.8 33,786 8.6
Table 7.9 presents the percentage distribution of persons by selected age groups and survival of
parents. The results show that proportion of persons whose both parents were alive decrease as age
increases while that for persons with father and mother dead increases as age increases. A similar
pattern is observed for both males and females (Table 7.10 and 7.11) and for both Rural and Urban
populations (Table 7.12 and 7.13).
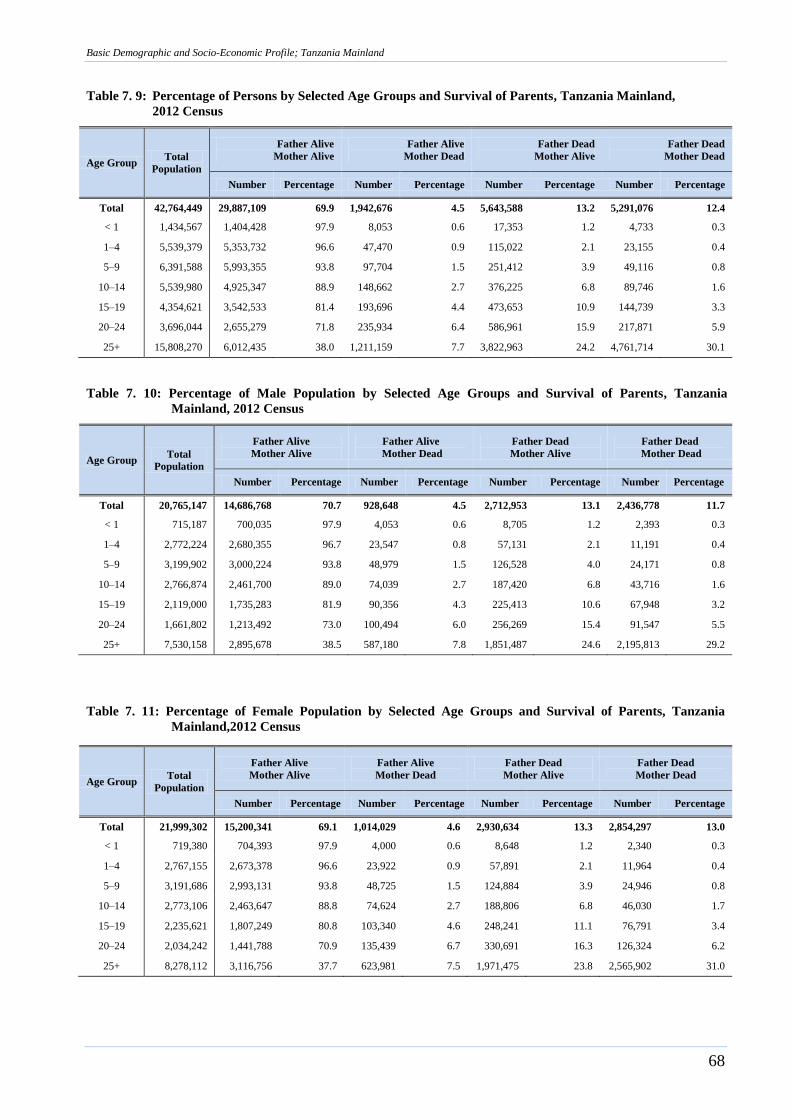
Basic Demographic and Socio-Economic Profile; Tanzania Mainland
68
Table 7. 9: Percentage of Persons by Selected Age Groups and Survival of Parents, Tanzania Mainland,
2012 Census
Age Group Total
Population
Father Alive
Mother Alive
Father Alive
Mother Dead
Father Dead
Mother Alive
Father Dead
Mother Dead
Number Percentage Number Percentage Number Percentage Number Percentage
Total 42,764,449 29,887,109 69.9 1,942,676 4.5 5,643,588 13.2 5,291,076 12.4
< 1 1,434,567 1,404,428 97.9 8,053 0.6 17,353 1.2 4,733 0.3
1–4 5,539,379 5,353,732 96.6 47,470 0.9 115,022 2.1 23,155 0.4
5–9 6,391,588 5,993,355 93.8 97,704 1.5 251,412 3.9 49,116 0.8
10–14 5,539,980 4,925,347 88.9 148,662 2.7 376,225 6.8 89,746 1.6
15–19 4,354,621 3,542,533 81.4 193,696 4.4 473,653 10.9 144,739 3.3
20–24 3,696,044 2,655,279 71.8 235,934 6.4 586,961 15.9 217,871 5.9
25+ 15,808,270 6,012,435 38.0 1,211,159 7.7 3,822,963 24.2 4,761,714 30.1
Table 7. 10: Percentage of Male Population by Selected Age Groups and Survival of Parents, Tanzania
Mainland, 2012 Census
Age Group Total
Population
Father Alive
Mother Alive
Father Alive
Mother Dead
Father Dead
Mother Alive
Father Dead
Mother Dead
Number Percentage Number Percentage Number Percentage Number Percentage
Total 20,765,147 14,686,768 70.7 928,648 4.5 2,712,953 13.1 2,436,778 11.7
< 1 715,187 700,035 97.9 4,053 0.6 8,705 1.2 2,393 0.3
1–4 2,772,224 2,680,355 96.7 23,547 0.8 57,131 2.1 11,191 0.4
5–9 3,199,902 3,000,224 93.8 48,979 1.5 126,528 4.0 24,171 0.8
10–14 2,766,874 2,461,700 89.0 74,039 2.7 187,420 6.8 43,716 1.6
15–19 2,119,000 1,735,283 81.9 90,356 4.3 225,413 10.6 67,948 3.2
20–24 1,661,802 1,213,492 73.0 100,494 6.0 256,269 15.4 91,547 5.5
25+ 7,530,158 2,895,678 38.5 587,180 7.8 1,851,487 24.6 2,195,813 29.2
Table 7. 11: Percentage of Female Population by Selected Age Groups and Survival of Parents, Tanzania
Mainland,2012 Census
Age Group Total
Population
Father Alive
Mother Alive
Father Alive
Mother Dead
Father Dead
Mother Alive
Father Dead
Mother Dead
Number Percentage Number Percentage Number Percentage Number Percentage
Total 21,999,302 15,200,341 69.1 1,014,029 4.6 2,930,634 13.3 2,854,297 13.0
< 1 719,380 704,393 97.9 4,000 0.6 8,648 1.2 2,340 0.3
1–4 2,767,155 2,673,378 96.6 23,922 0.9 57,891 2.1 11,964 0.4
5–9 3,191,686 2,993,131 93.8 48,725 1.5 124,884 3.9 24,946 0.8
10–14 2,773,106 2,463,647 88.8 74,624 2.7 188,806 6.8 46,030 1.7
15–19 2,235,621 1,807,249 80.8 103,340 4.6 248,241 11.1 76,791 3.4
20–24 2,034,242 1,441,788 70.9 135,439 6.7 330,691 16.3 126,324 6.2
25+ 8,278,112 3,116,756 37.7 623,981 7.5 1,971,475 23.8 2,565,902 31.0
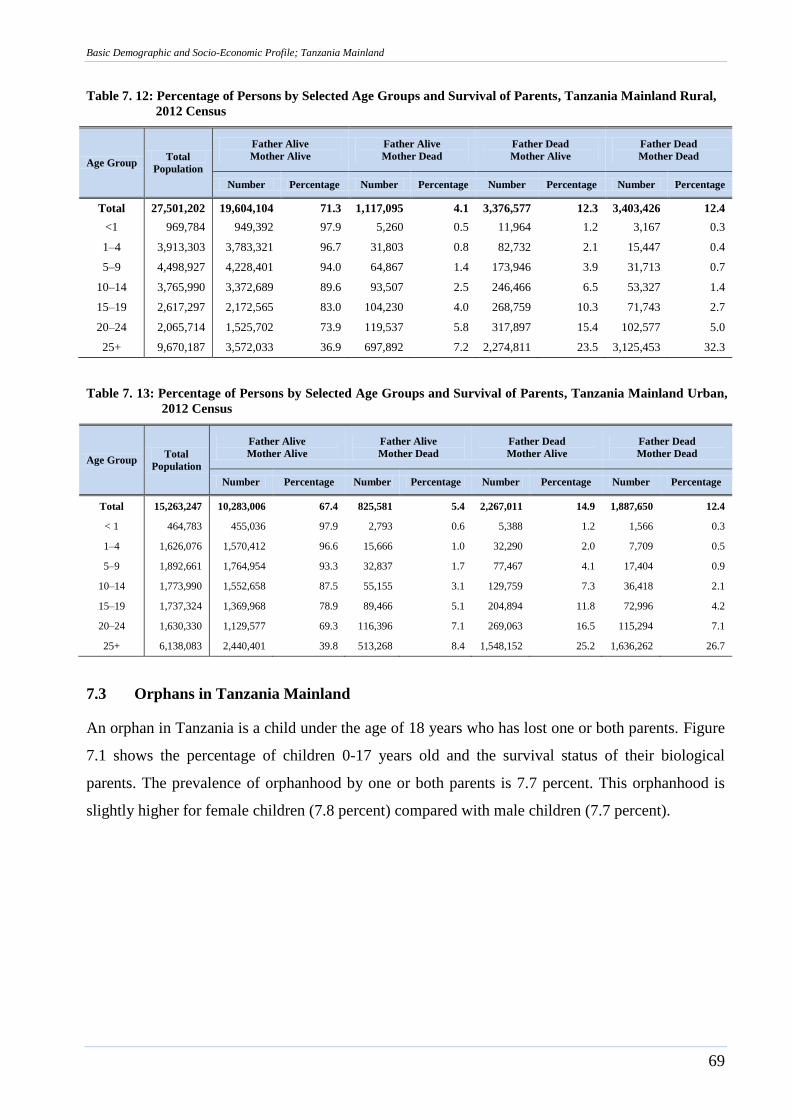
Basic Demographic and Socio-Economic Profile; Tanzania Mainland
69
Table 7. 12: Percentage of Persons by Selected Age Groups and Survival of Parents, Tanzania Mainland Rural,
2012 Census
Age Group Total
Population
Father Alive
Mother Alive
Father Alive
Mother Dead
Father Dead
Mother Alive
Father Dead
Mother Dead
Number Percentage Number Percentage Number Percentage Number Percentage
Total 27,501,202 19,604,104 71.3 1,117,095 4.1 3,376,577 12.3 3,403,426 12.4
<1 969,784 949,392 97.9 5,260 0.5 11,964 1.2 3,167 0.3
1–4 3,913,303 3,783,321 96.7 31,803 0.8 82,732 2.1 15,447 0.4
5–9 4,498,927 4,228,401 94.0 64,867 1.4 173,946 3.9 31,713 0.7
10–14 3,765,990 3,372,689 89.6 93,507 2.5 246,466 6.5 53,327 1.4
15–19 2,617,297 2,172,565 83.0 104,230 4.0 268,759 10.3 71,743 2.7
20–24 2,065,714 1,525,702 73.9 119,537 5.8 317,897 15.4 102,577 5.0
25+ 9,670,187 3,572,033 36.9 697,892 7.2 2,274,811 23.5 3,125,453 32.3
Table 7. 13: Percentage of Persons by Selected Age Groups and Survival of Parents, Tanzania Mainland Urban,
2012 Census
Age Group Total
Population
Father Alive
Mother Alive
Father Alive
Mother Dead
Father Dead
Mother Alive
Father Dead
Mother Dead
Number Percentage Number Percentage Number Percentage Number Percentage
Total 15,263,247 10,283,006 67.4 825,581 5.4 2,267,011 14.9 1,887,650 12.4
< 1 464,783 455,036 97.9 2,793 0.6 5,388 1.2 1,566 0.3
1–4 1,626,076 1,570,412 96.6 15,666 1.0 32,290 2.0 7,709 0.5
5–9 1,892,661 1,764,954 93.3 32,837 1.7 77,467 4.1 17,404 0.9
10–14 1,773,990 1,552,658 87.5 55,155 3.1 129,759 7.3 36,418 2.1
15–19 1,737,324 1,369,968 78.9 89,466 5.1 204,894 11.8 72,996 4.2
20–24 1,630,330 1,129,577 69.3 116,396 7.1 269,063 16.5 115,294 7.1
25+ 6,138,083 2,440,401 39.8 513,268 8.4 1,548,152 25.2 1,636,262 26.7
7.3 Orphans in Tanzania Mainland
An orphan in Tanzania is a child under the age of 18 years who has lost one or both parents. Figure
7.1 shows the percentage of children 0-17 years old and the survival status of their biological
parents. The prevalence of orphanhood by one or both parents is 7.7 percent. This orphanhood is
slightly higher for female children (7.8 percent) compared with male children (7.7 percent).
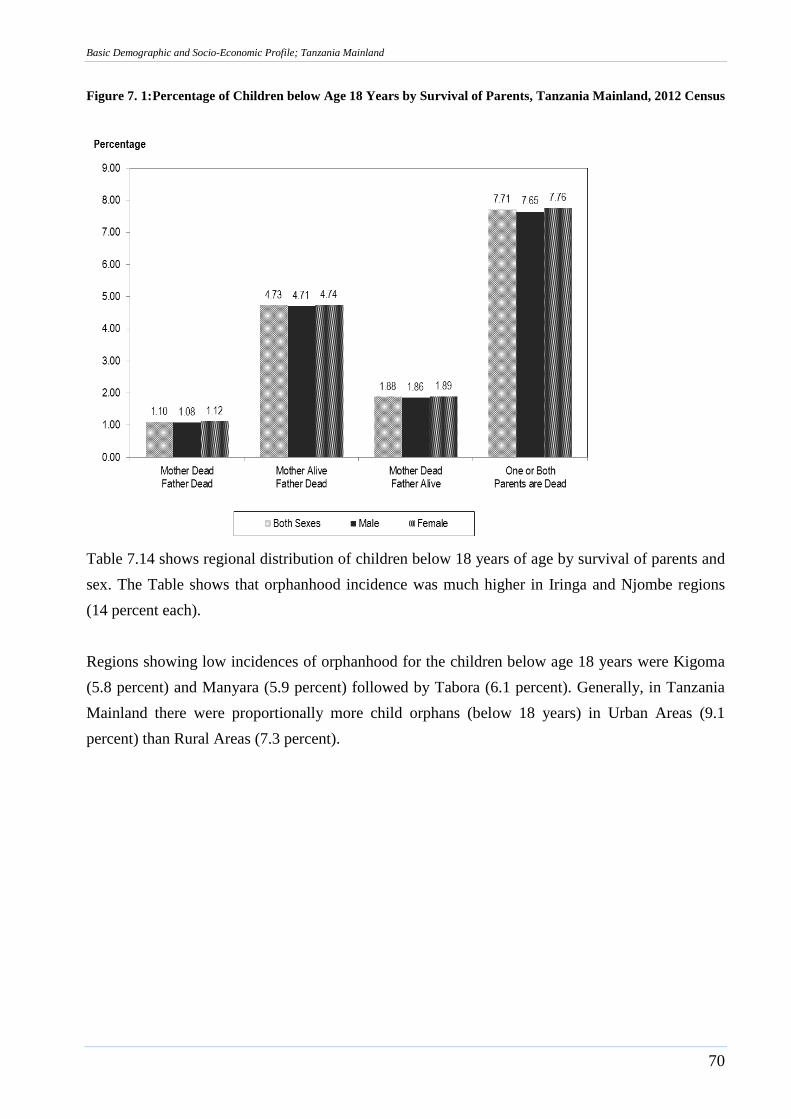
Basic Demographic and Socio-Economic Profile; Tanzania Mainland
70
Figure 7. 1: Percentage of Children below Age 18 Years by Survival of Parents, Tanzania Mainland, 2012 Census
Table 7.14 shows regional distribution of children below 18 years of age by survival of parents and
sex. The Table shows that orphanhood incidence was much higher in Iringa and Njombe regions
(14 percent each).
Regions showing low incidences of orphanhood for the children below age 18 years were Kigoma
(5.8 percent) and Manyara (5.9 percent) followed by Tabora (6.1 percent). Generally, in Tanzania
Mainland there were proportionally more child orphans (below 18 years) in Urban Areas (9.1
percent) than Rural Areas (7.3 percent).
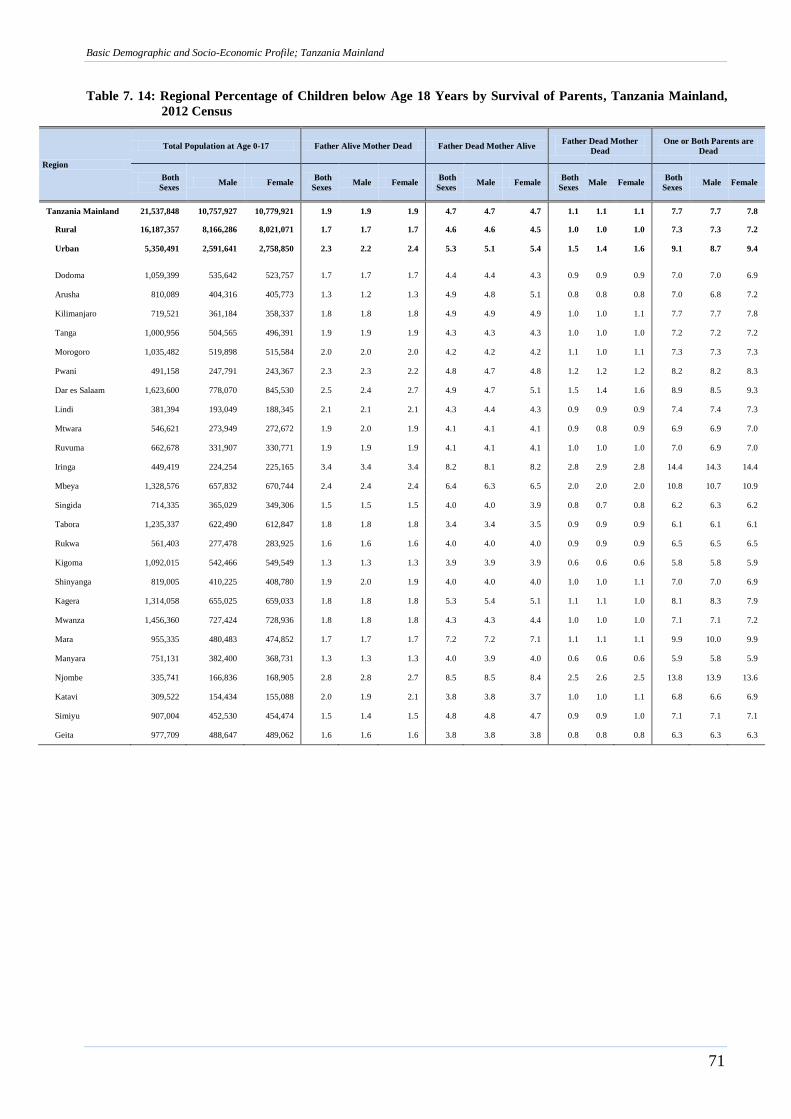
Basic Demographic and Socio-Economic Profile; Tanzania Mainland
71
Table 7. 14: Regional Percentage of Children below Age 18 Years by Survival of Parents, Tanzania Mainland,
2012 Census
Region
Total Population at Age 0-17 Father Alive Mother Dead Father Dead Mother Alive Father Dead Mother
Dead
One or Both Parents are
Dead
Both
Sexes Male Female
Both
Sexes Male Female
Both
Sexes Male Female
Both
Sexes Male Female
Both
Sexes Male Female
Tanzania Mainland 21,537,848 10,757,927 10,779,921 1.9 1.9 1.9 4.7 4.7 4.7 1.1 1.1 1.1 7.7 7.7 7.8
Rural 16,187,357 8,166,286 8,021,071 1.7 1.7 1.7 4.6 4.6 4.5 1.0 1.0 1.0 7.3 7.3 7.2
Urban 5,350,491 2,591,641 2,758,850 2.3 2.2 2.4 5.3 5.1 5.4 1.5 1.4 1.6 9.1 8.7 9.4
Dodoma 1,059,399 535,642 523,757 1.7 1.7 1.7 4.4 4.4 4.3 0.9 0.9 0.9 7.0 7.0 6.9
Arusha 810,089 404,316 405,773 1.3 1.2 1.3 4.9 4.8 5.1 0.8 0.8 0.8 7.0 6.8 7.2
Kilimanjaro 719,521 361,184 358,337 1.8 1.8 1.8 4.9 4.9 4.9 1.0 1.0 1.1 7.7 7.7 7.8
Tanga 1,000,956 504,565 496,391 1.9 1.9 1.9 4.3 4.3 4.3 1.0 1.0 1.0 7.2 7.2 7.2
Morogoro 1,035,482 519,898 515,584 2.0 2.0 2.0 4.2 4.2 4.2 1.1 1.0 1.1 7.3 7.3 7.3
Pwani 491,158 247,791 243,367 2.3 2.3 2.2 4.8 4.7 4.8 1.2 1.2 1.2 8.2 8.2 8.3
Dar es Salaam 1,623,600 778,070 845,530 2.5 2.4 2.7 4.9 4.7 5.1 1.5 1.4 1.6 8.9 8.5 9.3
Lindi 381,394 193,049 188,345 2.1 2.1 2.1 4.3 4.4 4.3 0.9 0.9 0.9 7.4 7.4 7.3
Mtwara 546,621 273,949 272,672 1.9 2.0 1.9 4.1 4.1 4.1 0.9 0.8 0.9 6.9 6.9 7.0
Ruvuma 662,678 331,907 330,771 1.9 1.9 1.9 4.1 4.1 4.1 1.0 1.0 1.0 7.0 6.9 7.0
Iringa 449,419 224,254 225,165 3.4 3.4 3.4 8.2 8.1 8.2 2.8 2.9 2.8 14.4 14.3 14.4
Mbeya 1,328,576 657,832 670,744 2.4 2.4 2.4 6.4 6.3 6.5 2.0 2.0 2.0 10.8 10.7 10.9
Singida 714,335 365,029 349,306 1.5 1.5 1.5 4.0 4.0 3.9 0.8 0.7 0.8 6.2 6.3 6.2
Tabora 1,235,337 622,490 612,847 1.8 1.8 1.8 3.4 3.4 3.5 0.9 0.9 0.9 6.1 6.1 6.1
Rukwa 561,403 277,478 283,925 1.6 1.6 1.6 4.0 4.0 4.0 0.9 0.9 0.9 6.5 6.5 6.5
Kigoma 1,092,015 542,466 549,549 1.3 1.3 1.3 3.9 3.9 3.9 0.6 0.6 0.6 5.8 5.8 5.9
Shinyanga 819,005 410,225 408,780 1.9 2.0 1.9 4.0 4.0 4.0 1.0 1.0 1.1 7.0 7.0 6.9
Kagera 1,314,058 655,025 659,033 1.8 1.8 1.8 5.3 5.4 5.1 1.1 1.1 1.0 8.1 8.3 7.9
Mwanza 1,456,360 727,424 728,936 1.8 1.8 1.8 4.3 4.3 4.4 1.0 1.0 1.0 7.1 7.1 7.2
Mara 955,335 480,483 474,852 1.7 1.7 1.7 7.2 7.2 7.1 1.1 1.1 1.1 9.9 10.0 9.9
Manyara 751,131 382,400 368,731 1.3 1.3 1.3 4.0 3.9 4.0 0.6 0.6 0.6 5.9 5.8 5.9
Njombe 335,741 166,836 168,905 2.8 2.8 2.7 8.5 8.5 8.4 2.5 2.6 2.5 13.8 13.9 13.6
Katavi 309,522 154,434 155,088 2.0 1.9 2.1 3.8 3.8 3.7 1.0 1.0 1.1 6.8 6.6 6.9
Simiyu 907,004 452,530 454,474 1.5 1.4 1.5 4.8 4.8 4.7 0.9 0.9 1.0 7.1 7.1 7.1
Geita 977,709 488,647 489,062 1.6 1.6 1.6 3.8 3.8 3.8 0.8 0.8 0.8 6.3 6.3 6.3
Basic Demographic and Socio-Economic Profile; Tanzania Mainland
72
Chapter Eight
Diaspora
8.1 Introduction
The 2012 PHC collected information on the number of Tanzanians living outside the country
(Diaspora) and if households received any remittances from them. Information was collected by
asking a direct question if there was any person who was a member of the household but was
living outside the country at the time of the Census, the name of country in which that particular
person lived and if that particular household received any remittance (cash or in kind) from him or
her.
8.2 Number of Persons Living in Diaspora
Table 8.1 presents information on number of households that reported to have at least one former
member of the household living outside the country by region. One (1) percent (107,021) of total
private households in Tanzania Mainland reported to have at least one member of the households
living outside the country. Percentage of households with members living in diaspora was slightly
higher in Dar es Salaam (2.4 percent), followed by Kilimanjaro (2.3 percent). Regions with the
lowest percentage were Geita, Simiyu and Njombe (0.3 percent each).
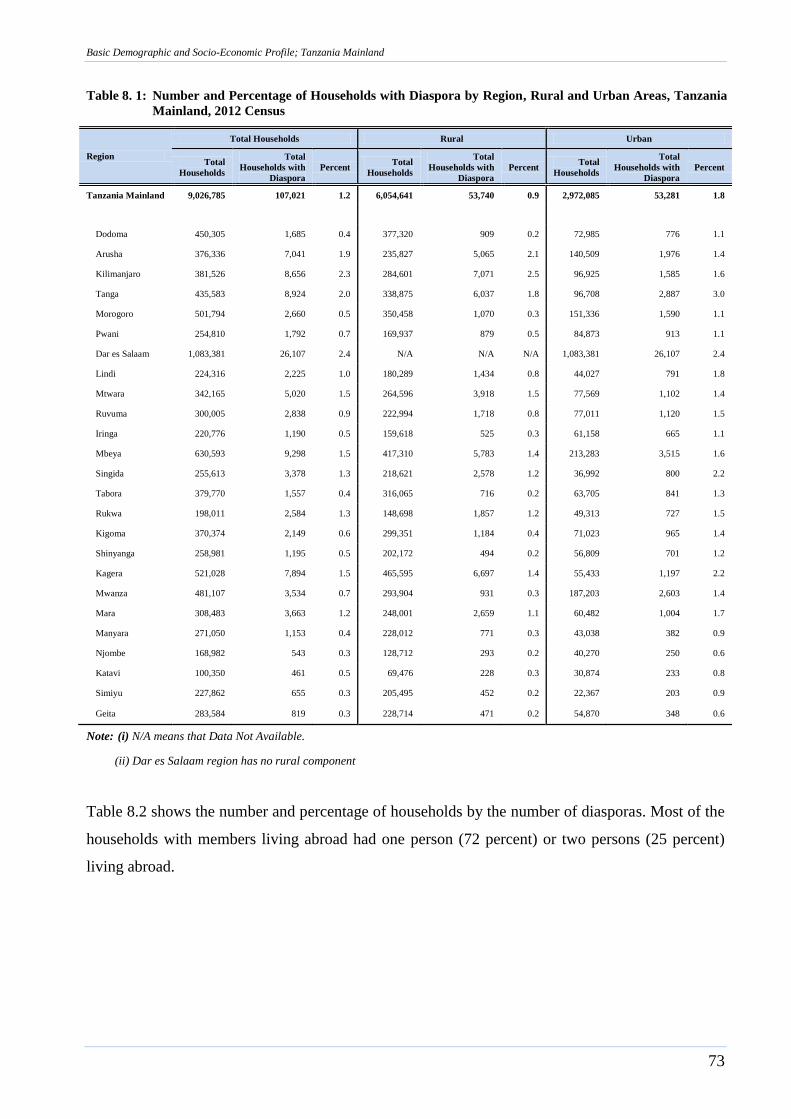
Basic Demographic and Socio-Economic Profile; Tanzania Mainland
73
Table 8. 1: Number and Percentage of Households with Diaspora by Region, Rural and Urban Areas, Tanzania
Mainland, 2012 Census
Region
Total Households Rural Urban
Total
Households
Total
Households with
Diaspora
Percent Total
Households
Total
Households with
Diaspora
Percent Total
Households
Total
Households with
Diaspora
Percent
Tanzania Mainland 9,026,785 107,021 1.2 6,054,641 53,740 0.9 2,972,085 53,281 1.8
Dodoma 450,305 1,685 0.4 377,320 909 0.2 72,985 776 1.1
Arusha 376,336 7,041 1.9 235,827 5,065 2.1 140,509 1,976 1.4
Kilimanjaro 381,526 8,656 2.3 284,601 7,071 2.5 96,925 1,585 1.6
Tanga 435,583 8,924 2.0 338,875 6,037 1.8 96,708 2,887 3.0
Morogoro 501,794 2,660 0.5 350,458 1,070 0.3 151,336 1,590 1.1
Pwani 254,810 1,792 0.7 169,937 879 0.5 84,873 913 1.1
Dar es Salaam 1,083,381 26,107 2.4 N/A N/A N/A 1,083,381 26,107 2.4
Lindi 224,316 2,225 1.0 180,289 1,434 0.8 44,027 791 1.8
Mtwara 342,165 5,020 1.5 264,596 3,918 1.5 77,569 1,102 1.4
Ruvuma 300,005 2,838 0.9 222,994 1,718 0.8 77,011 1,120 1.5
Iringa 220,776 1,190 0.5 159,618 525 0.3 61,158 665 1.1
Mbeya 630,593 9,298 1.5 417,310 5,783 1.4 213,283 3,515 1.6
Singida 255,613 3,378 1.3 218,621 2,578 1.2 36,992 800 2.2
Tabora 379,770 1,557 0.4 316,065 716 0.2 63,705 841 1.3
Rukwa 198,011 2,584 1.3 148,698 1,857 1.2 49,313 727 1.5
Kigoma 370,374 2,149 0.6 299,351 1,184 0.4 71,023 965 1.4
Shinyanga 258,981 1,195 0.5 202,172 494 0.2 56,809 701 1.2
Kagera 521,028 7,894 1.5 465,595 6,697 1.4 55,433 1,197 2.2
Mwanza 481,107 3,534 0.7 293,904 931 0.3 187,203 2,603 1.4
Mara 308,483 3,663 1.2 248,001 2,659 1.1 60,482 1,004 1.7
Manyara 271,050 1,153 0.4 228,012 771 0.3 43,038 382 0.9
Njombe 168,982 543 0.3 128,712 293 0.2 40,270 250 0.6
Katavi 100,350 461 0.5 69,476 228 0.3 30,874 233 0.8
Simiyu 227,862 655 0.3 205,495 452 0.2 22,367 203 0.9
Geita 283,584 819 0.3 228,714 471 0.2 54,870 348 0.6
Note: (i) N/A means that Data Not Available.
(ii) Dar es Salaam region has no rural component
Table 8.2 shows the number and percentage of households by the number of diasporas. Most of the
households with members living abroad had one person (72 percent) or two persons (25 percent)
living abroad.
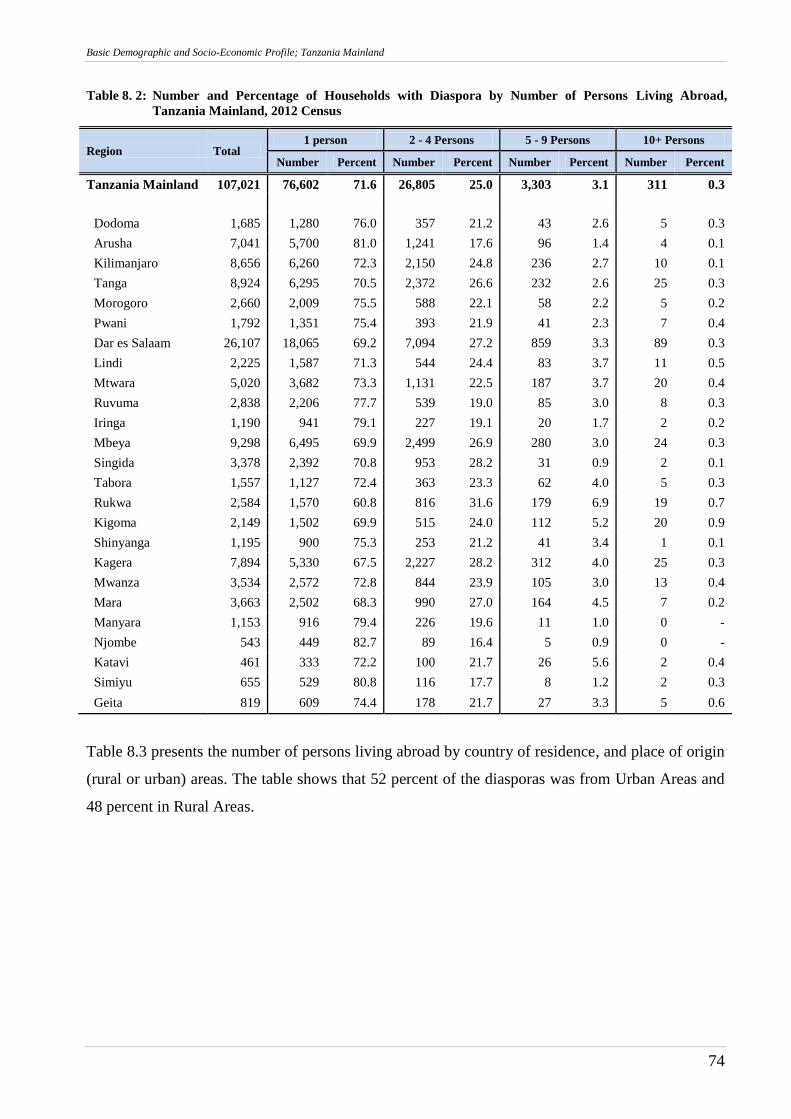
Basic Demographic and Socio-Economic Profile; Tanzania Mainland
74
Table 8. 2: Number and Percentage of Households with Diaspora by Number of Persons Living Abroad,
Tanzania Mainland, 2012 Census
Region Total 1 person 2 - 4 Persons 5 - 9 Persons 10+ Persons
Number Percent Number Percent Number Percent Number Percent
Tanzania Mainland 107,021 76,602 71.6 26,805 25.0 3,303 3.1 311 0.3
Dodoma 1,685 1,280 76.0 357 21.2 43 2.6 5 0.3
Arusha 7,041 5,700 81.0 1,241 17.6 96 1.4 4 0.1
Kilimanjaro 8,656 6,260 72.3 2,150 24.8 236 2.7 10 0.1
Tanga 8,924 6,295 70.5 2,372 26.6 232 2.6 25 0.3
Morogoro 2,660 2,009 75.5 588 22.1 58 2.2 5 0.2
Pwani 1,792 1,351 75.4 393 21.9 41 2.3 7 0.4
Dar es Salaam 26,107 18,065 69.2 7,094 27.2 859 3.3 89 0.3
Lindi 2,225 1,587 71.3 544 24.4 83 3.7 11 0.5
Mtwara 5,020 3,682 73.3 1,131 22.5 187 3.7 20 0.4
Ruvuma 2,838 2,206 77.7 539 19.0 85 3.0 8 0.3
Iringa 1,190 941 79.1 227 19.1 20 1.7 2 0.2
Mbeya 9,298 6,495 69.9 2,499 26.9 280 3.0 24 0.3
Singida 3,378 2,392 70.8 953 28.2 31 0.9 2 0.1
Tabora 1,557 1,127 72.4 363 23.3 62 4.0 5 0.3
Rukwa 2,584 1,570 60.8 816 31.6 179 6.9 19 0.7
Kigoma 2,149 1,502 69.9 515 24.0 112 5.2 20 0.9
Shinyanga 1,195 900 75.3 253 21.2 41 3.4 1 0.1
Kagera 7,894 5,330 67.5 2,227 28.2 312 4.0 25 0.3
Mwanza 3,534 2,572 72.8 844 23.9 105 3.0 13 0.4
Mara 3,663 2,502 68.3 990 27.0 164 4.5 7 0.2
Manyara 1,153 916 79.4 226 19.6 11 1.0 0 -
Njombe 543 449 82.7 89 16.4 5 0.9 0 -
Katavi 461 333 72.2 100 21.7 26 5.6 2 0.4
Simiyu 655 529 80.8 116 17.7 8 1.2 2 0.3
Geita 819 609 74.4 178 21.7 27 3.3 5 0.6
Table 8.3 presents the number of persons living abroad by country of residence, and place of origin
(rural or urban) areas. The table shows that 52 percent of the diasporas was from Urban Areas and
48 percent in Rural Areas.
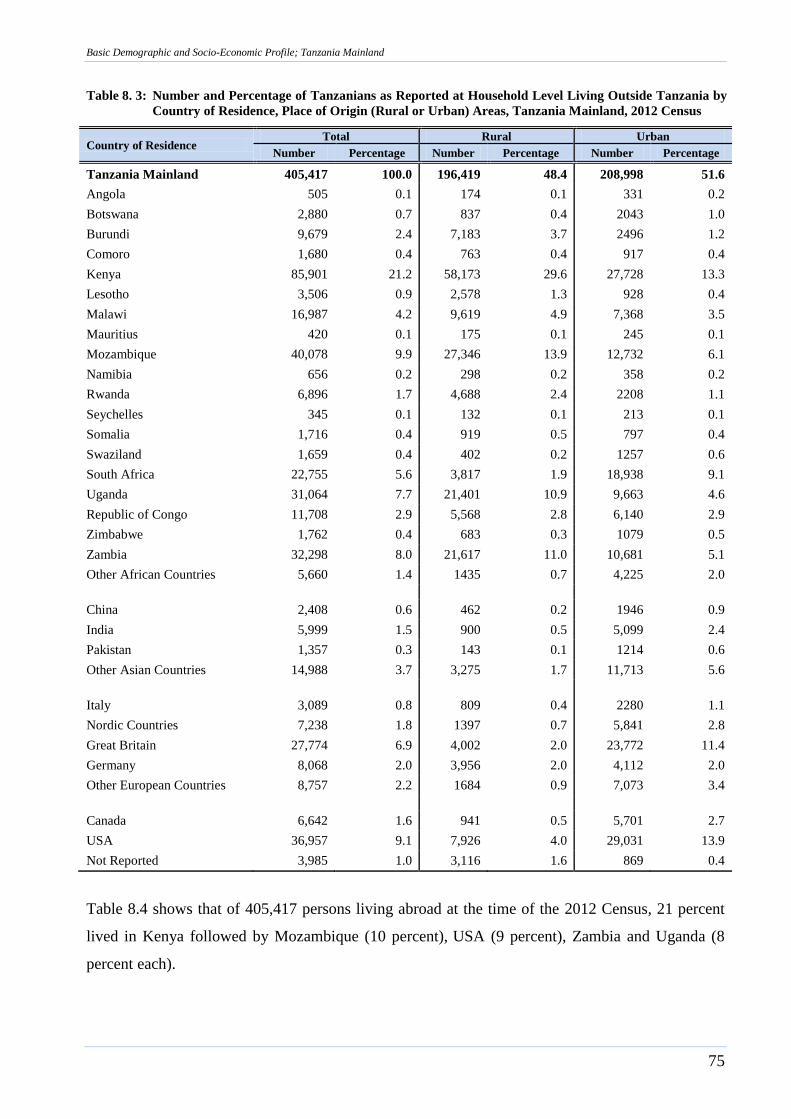
Basic Demographic and Socio-Economic Profile; Tanzania Mainland
75
Table 8. 3: Number and Percentage of Tanzanians as Reported at Household Level Living Outside Tanzania by
Country of Residence, Place of Origin (Rural or Urban) Areas, Tanzania Mainland, 2012 Census
Country of Residence Total Rural Urban
Number Percentage Number Percentage Number Percentage
Tanzania Mainland 405,417 100.0 196,419 48.4 208,998 51.6
Angola 505 0.1 174 0.1 331 0.2
Botswana 2,880 0.7 837 0.4 2043 1.0
Burundi 9,679 2.4 7,183 3.7 2496 1.2
Comoro 1,680 0.4 763 0.4 917 0.4
Kenya 85,901 21.2 58,173 29.6 27,728 13.3
Lesotho 3,506 0.9 2,578 1.3 928 0.4
Malawi 16,987 4.2 9,619 4.9 7,368 3.5
Mauritius 420 0.1 175 0.1 245 0.1
Mozambique 40,078 9.9 27,346 13.9 12,732 6.1
Namibia 656 0.2 298 0.2 358 0.2
Rwanda 6,896 1.7 4,688 2.4 2208 1.1
Seychelles 345 0.1 132 0.1 213 0.1
Somalia 1,716 0.4 919 0.5 797 0.4
Swaziland 1,659 0.4 402 0.2 1257 0.6
South Africa 22,755 5.6 3,817 1.9 18,938 9.1
Uganda 31,064 7.7 21,401 10.9 9,663 4.6
Republic of Congo 11,708 2.9 5,568 2.8 6,140 2.9
Zimbabwe 1,762 0.4 683 0.3 1079 0.5
Zambia 32,298 8.0 21,617 11.0 10,681 5.1
Other African Countries 5,660 1.4 1435 0.7 4,225 2.0
China 2,408 0.6 462 0.2 1946 0.9
India 5,999 1.5 900 0.5 5,099 2.4
Pakistan 1,357 0.3 143 0.1 1214 0.6
Other Asian Countries 14,988 3.7 3,275 1.7 11,713 5.6
Italy 3,089 0.8 809 0.4 2280 1.1
Nordic Countries 7,238 1.8 1397 0.7 5,841 2.8
Great Britain 27,774 6.9 4,002 2.0 23,772 11.4
Germany 8,068 2.0 3,956 2.0 4,112 2.0
Other European Countries 8,757 2.2 1684 0.9 7,073 3.4
Canada 6,642 1.6 941 0.5 5,701 2.7
USA 36,957 9.1 7,926 4.0 29,031 13.9
Not Reported 3,985 1.0 3,116 1.6 869 0.4
Table 8.4 shows that of 405,417 persons living abroad at the time of the 2012 Census, 21 percent
lived in Kenya followed by Mozambique (10 percent), USA (9 percent), Zambia and Uganda (8
percent each).
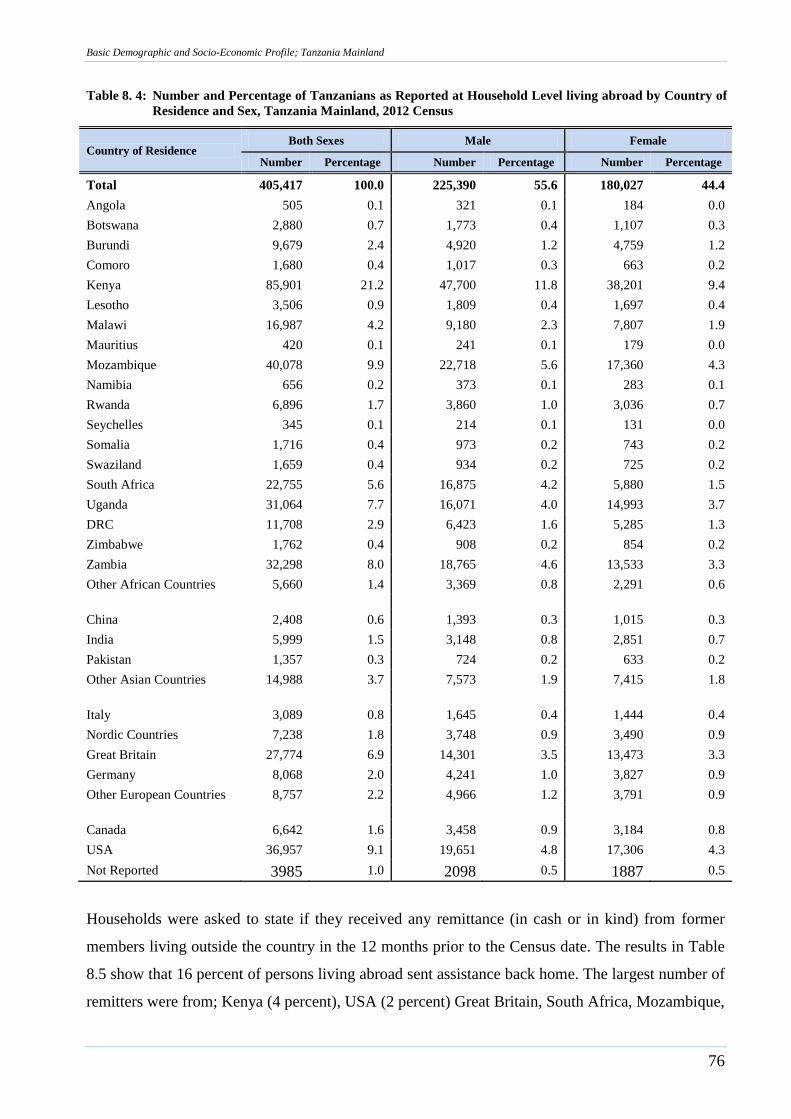
Basic Demographic and Socio-Economic Profile; Tanzania Mainland
76
Table 8. 4: Number and Percentage of Tanzanians as Reported at Household Level living abroad by Country of
Residence and Sex, Tanzania Mainland, 2012 Census
Country of Residence Both Sexes Male Female
Number Percentage Number Percentage Number Percentage
Total 405,417 100.0 225,390 55.6 180,027 44.4
Angola 505 0.1 321 0.1 184 0.0
Botswana 2,880 0.7 1,773 0.4 1,107 0.3
Burundi 9,679 2.4 4,920 1.2 4,759 1.2
Comoro 1,680 0.4 1,017 0.3 663 0.2
Kenya 85,901 21.2 47,700 11.8 38,201 9.4
Lesotho 3,506 0.9 1,809 0.4 1,697 0.4
Malawi 16,987 4.2 9,180 2.3 7,807 1.9
Mauritius 420 0.1 241 0.1 179 0.0
Mozambique 40,078 9.9 22,718 5.6 17,360 4.3
Namibia 656 0.2 373 0.1 283 0.1
Rwanda 6,896 1.7 3,860 1.0 3,036 0.7
Seychelles 345 0.1 214 0.1 131 0.0
Somalia 1,716 0.4 973 0.2 743 0.2
Swaziland 1,659 0.4 934 0.2 725 0.2
South Africa 22,755 5.6 16,875 4.2 5,880 1.5
Uganda 31,064 7.7 16,071 4.0 14,993 3.7
DRC 11,708 2.9 6,423 1.6 5,285 1.3
Zimbabwe 1,762 0.4 908 0.2 854 0.2
Zambia 32,298 8.0 18,765 4.6 13,533 3.3
Other African Countries 5,660 1.4 3,369 0.8 2,291 0.6
China 2,408 0.6 1,393 0.3 1,015 0.3
India 5,999 1.5 3,148 0.8 2,851 0.7
Pakistan 1,357 0.3 724 0.2 633 0.2
Other Asian Countries 14,988 3.7 7,573 1.9 7,415 1.8
Italy 3,089 0.8 1,645 0.4 1,444 0.4
Nordic Countries 7,238 1.8 3,748 0.9 3,490 0.9
Great Britain 27,774 6.9 14,301 3.5 13,473 3.3
Germany 8,068 2.0 4,241 1.0 3,827 0.9
Other European Countries 8,757 2.2 4,966 1.2 3,791 0.9
Canada 6,642 1.6 3,458 0.9 3,184 0.8
USA 36,957 9.1 19,651 4.8 17,306 4.3
Not Reported 3985 1.0 2098 0.5 1887 0.5
Households were asked to state if they received any remittance (in cash or in kind) from former
members living outside the country in the 12 months prior to the Census date. The results in Table
8.5 show that 16 percent of persons living abroad sent assistance back home. The largest number of
remitters were from; Kenya (4 percent), USA (2 percent) Great Britain, South Africa, Mozambique,
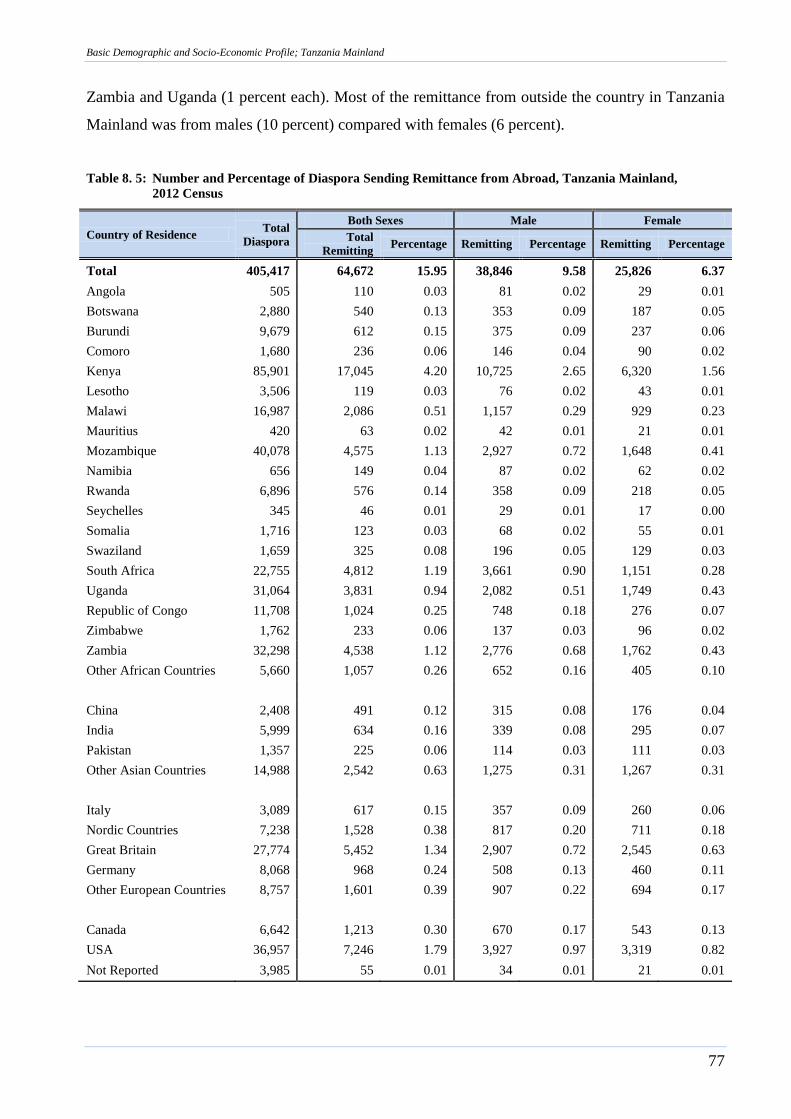
Basic Demographic and Socio-Economic Profile; Tanzania Mainland
77
Zambia and Uganda (1 percent each). Most of the remittance from outside the country in Tanzania
Mainland was from males (10 percent) compared with females (6 percent).
Table 8. 5: Number and Percentage of Diaspora Sending Remittance from Abroad, Tanzania Mainland,
2012 Census
Country of Residence Total
Diaspora
Both Sexes Male Female
Total
Remitting Percentage Remitting Percentage Remitting Percentage
Total 405,417 64,672 15.95 38,846 9.58 25,826 6.37
Angola 505 110 0.03 81 0.02 29 0.01
Botswana 2,880 540 0.13 353 0.09 187 0.05
Burundi 9,679 612 0.15 375 0.09 237 0.06
Comoro 1,680 236 0.06 146 0.04 90 0.02
Kenya 85,901 17,045 4.20 10,725 2.65 6,320 1.56
Lesotho 3,506 119 0.03 76 0.02 43 0.01
Malawi 16,987 2,086 0.51 1,157 0.29 929 0.23
Mauritius 420 63 0.02 42 0.01 21 0.01
Mozambique 40,078 4,575 1.13 2,927 0.72 1,648 0.41
Namibia 656 149 0.04 87 0.02 62 0.02
Rwanda 6,896 576 0.14 358 0.09 218 0.05
Seychelles 345 46 0.01 29 0.01 17 0.00
Somalia 1,716 123 0.03 68 0.02 55 0.01
Swaziland 1,659 325 0.08 196 0.05 129 0.03
South Africa 22,755 4,812 1.19 3,661 0.90 1,151 0.28
Uganda 31,064 3,831 0.94 2,082 0.51 1,749 0.43
Republic of Congo 11,708 1,024 0.25 748 0.18 276 0.07
Zimbabwe 1,762 233 0.06 137 0.03 96 0.02
Zambia 32,298 4,538 1.12 2,776 0.68 1,762 0.43
Other African Countries 5,660 1,057 0.26 652 0.16 405 0.10
China 2,408 491 0.12 315 0.08 176 0.04
India 5,999 634 0.16 339 0.08 295 0.07
Pakistan 1,357 225 0.06 114 0.03 111 0.03
Other Asian Countries 14,988 2,542 0.63 1,275 0.31 1,267 0.31
Italy 3,089 617 0.15 357 0.09 260 0.06
Nordic Countries 7,238 1,528 0.38 817 0.20 711 0.18
Great Britain 27,774 5,452 1.34 2,907 0.72 2,545 0.63
Germany 8,068 968 0.24 508 0.13 460 0.11
Other European Countries 8,757 1,601 0.39 907 0.22 694 0.17
Canada 6,642 1,213 0.30 670 0.17 543 0.13
USA 36,957 7,246 1.79 3,927 0.97 3,319 0.82
Not Reported 3,985 55 0.01 34 0.01 21 0.01
Basic Demographic and Socio-Economic Profile; Tanzania Mainland
78
Chapter Nine
Literacy and Education
9.1 Literacy
9.1.1 Introduction
Literacy is the ability to read and write with an understanding of a short simple sentence on
everyday life. It excludes the ability to only write or sign one‟s own name or write memorized
phrases. The ability to read and write may be in any language.
The 2012 PHC collected information on literacy by asking individuals aged four (4) years and
above if they could read and write in; Kiswahili only, English Only, Both Kiswahili and English or
Any Other Language(s). No test was administered so as to verify those who were really literate.
The measure of literacy is obtained by calculating the literacy rate as the percentage of a specified
population, which is literate in specified language(s). Literacy rate in this publication is defined as
the percentage of a population that can read and write in Kiswahili, English, Both Kiswahili and
English or in Any Other Language(s).
9.1.2 Literacy Status in Tanzania Mainland
Table 9.1 shows the distribution of population aged five years and above by five year age groups,
literacy and sex. The Table reveals that, out of 35,790,336 persons aged five years and above,
25,600,038 persons (72 percent) were literate. The literacy rate was higher among males (74
percent) than females (69 percent). Literacy rates were higher among persons aged 10 to 44 years
ranging from 80 percent to 87 percent, indicating a positive result of primary education campaigns.
Literacy rate in Urban Areas (89 percent) was significantly higher than in Rural Areas (64 percent).
Males were more literate than females in both Rural and Urban Areas as presented in Tables 9.2,
9.3 and Figure 9.1.
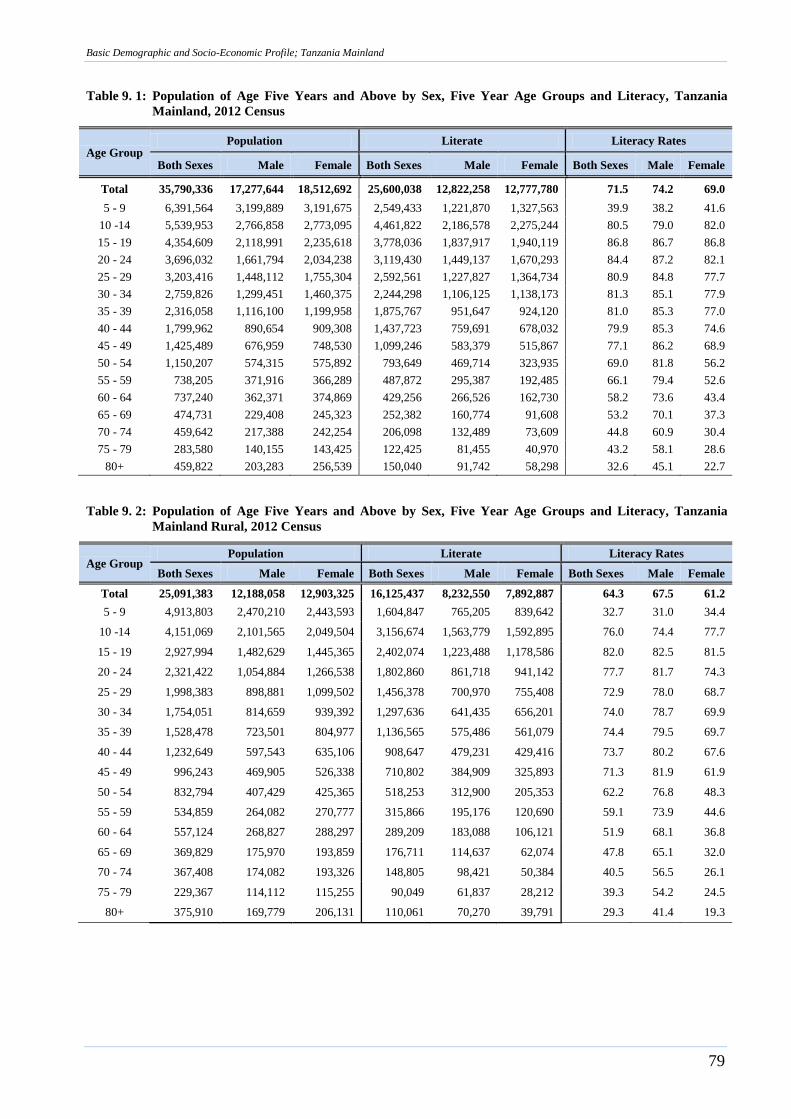
Basic Demographic and Socio-Economic Profile; Tanzania Mainland
79
Table 9. 1: Population of Age Five Years and Above by Sex, Five Year Age Groups and Literacy, Tanzania
Mainland, 2012 Census
Age Group Population Literate Literacy Rates
Both Sexes Male Female Both Sexes Male Female Both Sexes Male Female
Total 35,790,336 17,277,644 18,512,692 25,600,038 12,822,258 12,777,780 71.5 74.2 69.0
5 - 9 6,391,564 3,199,889 3,191,675 2,549,433 1,221,870 1,327,563 39.9 38.2 41.6
10 -14 5,539,953 2,766,858 2,773,095 4,461,822 2,186,578 2,275,244 80.5 79.0 82.0
15 - 19 4,354,609 2,118,991 2,235,618 3,778,036 1,837,917 1,940,119 86.8 86.7 86.8
20 - 24 3,696,032 1,661,794 2,034,238 3,119,430 1,449,137 1,670,293 84.4 87.2 82.1
25 - 29 3,203,416 1,448,112 1,755,304 2,592,561 1,227,827 1,364,734 80.9 84.8 77.7
30 - 34 2,759,826 1,299,451 1,460,375 2,244,298 1,106,125 1,138,173 81.3 85.1 77.9
35 - 39 2,316,058 1,116,100 1,199,958 1,875,767 951,647 924,120 81.0 85.3 77.0
40 - 44 1,799,962 890,654 909,308 1,437,723 759,691 678,032 79.9 85.3 74.6
45 - 49 1,425,489 676,959 748,530 1,099,246 583,379 515,867 77.1 86.2 68.9
50 - 54 1,150,207 574,315 575,892 793,649 469,714 323,935 69.0 81.8 56.2
55 - 59 738,205 371,916 366,289 487,872 295,387 192,485 66.1 79.4 52.6
60 - 64 737,240 362,371 374,869 429,256 266,526 162,730 58.2 73.6 43.4
65 - 69 474,731 229,408 245,323 252,382 160,774 91,608 53.2 70.1 37.3
70 - 74 459,642 217,388 242,254 206,098 132,489 73,609 44.8 60.9 30.4
75 - 79 283,580 140,155 143,425 122,425 81,455 40,970 43.2 58.1 28.6
80+ 459,822 203,283 256,539 150,040 91,742 58,298 32.6 45.1 22.7
Table 9. 2: Population of Age Five Years and Above by Sex, Five Year Age Groups and Literacy, Tanzania
Mainland Rural, 2012 Census
Age Group Population Literate Literacy Rates
Both Sexes Male Female Both Sexes Male Female Both Sexes Male Female
Total 25,091,383 12,188,058 12,903,325 16,125,437 8,232,550 7,892,887 64.3 67.5 61.2
5 - 9 4,913,803 2,470,210 2,443,593 1,604,847 765,205 839,642 32.7 31.0 34.4
10 -14 4,151,069 2,101,565 2,049,504 3,156,674 1,563,779 1,592,895 76.0 74.4 77.7
15 - 19 2,927,994 1,482,629 1,445,365 2,402,074 1,223,488 1,178,586 82.0 82.5 81.5
20 - 24 2,321,422 1,054,884 1,266,538 1,802,860 861,718 941,142 77.7 81.7 74.3
25 - 29 1,998,383 898,881 1,099,502 1,456,378 700,970 755,408 72.9 78.0 68.7
30 - 34 1,754,051 814,659 939,392 1,297,636 641,435 656,201 74.0 78.7 69.9
35 - 39 1,528,478 723,501 804,977 1,136,565 575,486 561,079 74.4 79.5 69.7
40 - 44 1,232,649 597,543 635,106 908,647 479,231 429,416 73.7 80.2 67.6
45 - 49 996,243 469,905 526,338 710,802 384,909 325,893 71.3 81.9 61.9
50 - 54 832,794 407,429 425,365 518,253 312,900 205,353 62.2 76.8 48.3
55 - 59 534,859 264,082 270,777 315,866 195,176 120,690 59.1 73.9 44.6
60 - 64 557,124 268,827 288,297 289,209 183,088 106,121 51.9 68.1 36.8
65 - 69 369,829 175,970 193,859 176,711 114,637 62,074 47.8 65.1 32.0
70 - 74 367,408 174,082 193,326 148,805 98,421 50,384 40.5 56.5 26.1
75 - 79 229,367 114,112 115,255 90,049 61,837 28,212 39.3 54.2 24.5
80+ 375,910 169,779 206,131 110,061 70,270 39,791 29.3 41.4 19.3
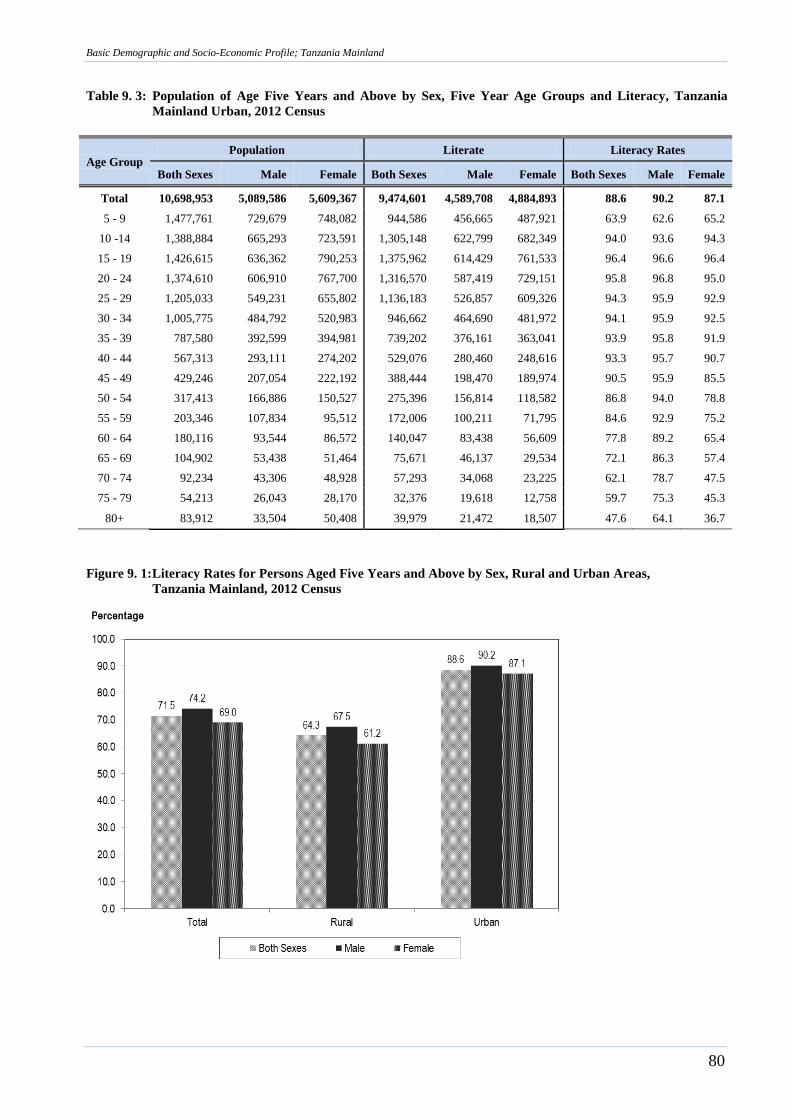
Basic Demographic and Socio-Economic Profile; Tanzania Mainland
80
Table 9. 3: Population of Age Five Years and Above by Sex, Five Year Age Groups and Literacy, Tanzania
Mainland Urban, 2012 Census
Age Group Population Literate Literacy Rates
Both Sexes Male Female Both Sexes Male Female Both Sexes Male Female
Total 10,698,953 5,089,586 5,609,367 9,474,601 4,589,708 4,884,893 88.6 90.2 87.1
5 - 9 1,477,761 729,679 748,082 944,586 456,665 487,921 63.9 62.6 65.2
10 -14 1,388,884 665,293 723,591 1,305,148 622,799 682,349 94.0 93.6 94.3
15 - 19 1,426,615 636,362 790,253 1,375,962 614,429 761,533 96.4 96.6 96.4
20 - 24 1,374,610 606,910 767,700 1,316,570 587,419 729,151 95.8 96.8 95.0
25 - 29 1,205,033 549,231 655,802 1,136,183 526,857 609,326 94.3 95.9 92.9
30 - 34 1,005,775 484,792 520,983 946,662 464,690 481,972 94.1 95.9 92.5
35 - 39 787,580 392,599 394,981 739,202 376,161 363,041 93.9 95.8 91.9
40 - 44 567,313 293,111 274,202 529,076 280,460 248,616 93.3 95.7 90.7
45 - 49 429,246 207,054 222,192 388,444 198,470 189,974 90.5 95.9 85.5
50 - 54 317,413 166,886 150,527 275,396 156,814 118,582 86.8 94.0 78.8
55 - 59 203,346 107,834 95,512 172,006 100,211 71,795 84.6 92.9 75.2
60 - 64 180,116 93,544 86,572 140,047 83,438 56,609 77.8 89.2 65.4
65 - 69 104,902 53,438 51,464 75,671 46,137 29,534 72.1 86.3 57.4
70 - 74 92,234 43,306 48,928 57,293 34,068 23,225 62.1 78.7 47.5
75 - 79 54,213 26,043 28,170 32,376 19,618 12,758 59.7 75.3 45.3
80+ 83,912 33,504 50,408 39,979 21,472 18,507 47.6 64.1 36.7
Figure 9. 1: Literacy Rates for Persons Aged Five Years and Above by Sex, Rural and Urban Areas,
Tanzania Mainland, 2012 Census
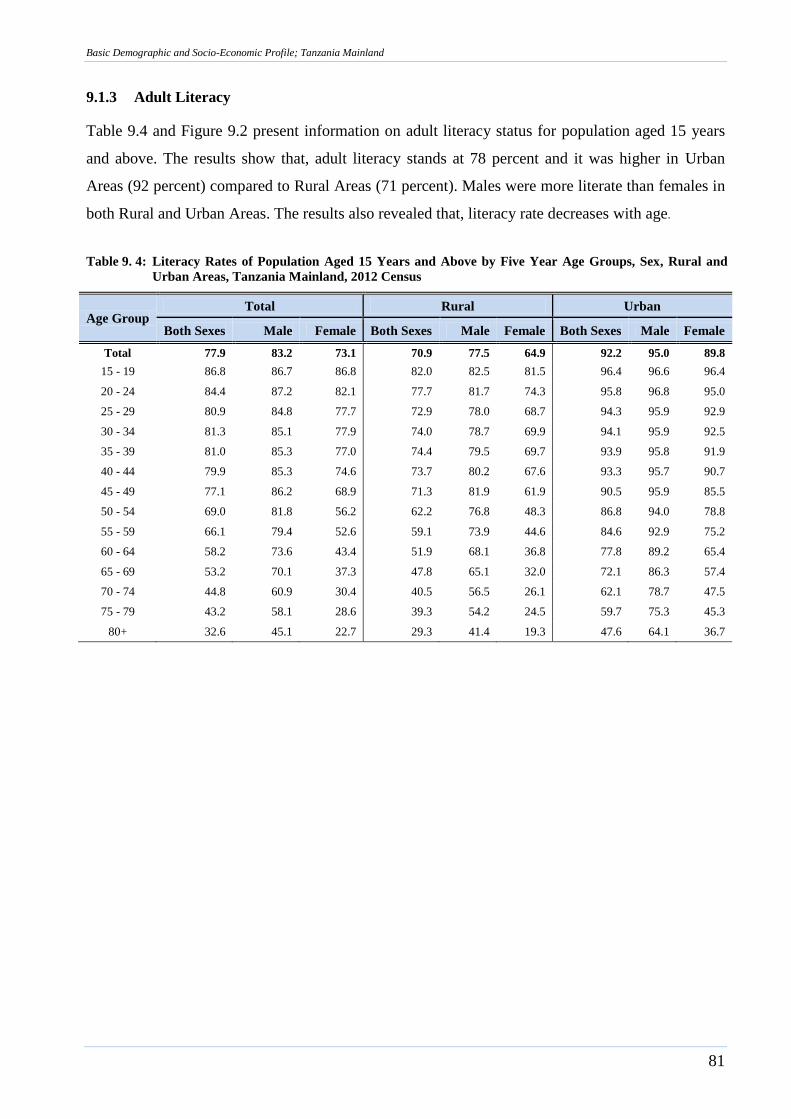
Basic Demographic and Socio-Economic Profile; Tanzania Mainland
81
9.1.3 Adult Literacy
Table 9.4 and Figure 9.2 present information on adult literacy status for population aged 15 years
and above. The results show that, adult literacy stands at 78 percent and it was higher in Urban
Areas (92 percent) compared to Rural Areas (71 percent). Males were more literate than females in
both Rural and Urban Areas. The results also revealed that, literacy rate decreases with age.
Table 9. 4: Literacy Rates of Population Aged 15 Years and Above by Five Year Age Groups, Sex, Rural and
Urban Areas, Tanzania Mainland, 2012 Census
Age Group Total Rural Urban
Both Sexes Male Female Both Sexes Male Female Both Sexes Male Female
Total 77.9 83.2 73.1 70.9 77.5 64.9 92.2 95.0 89.8
15 - 19 86.8 86.7 86.8 82.0 82.5 81.5 96.4 96.6 96.4
20 - 24 84.4 87.2 82.1 77.7 81.7 74.3 95.8 96.8 95.0
25 - 29 80.9 84.8 77.7 72.9 78.0 68.7 94.3 95.9 92.9
30 - 34 81.3 85.1 77.9 74.0 78.7 69.9 94.1 95.9 92.5
35 - 39 81.0 85.3 77.0 74.4 79.5 69.7 93.9 95.8 91.9
40 - 44 79.9 85.3 74.6 73.7 80.2 67.6 93.3 95.7 90.7
45 - 49 77.1 86.2 68.9 71.3 81.9 61.9 90.5 95.9 85.5
50 - 54 69.0 81.8 56.2 62.2 76.8 48.3 86.8 94.0 78.8
55 - 59 66.1 79.4 52.6 59.1 73.9 44.6 84.6 92.9 75.2
60 - 64 58.2 73.6 43.4 51.9 68.1 36.8 77.8 89.2 65.4
65 - 69 53.2 70.1 37.3 47.8 65.1 32.0 72.1 86.3 57.4
70 - 74 44.8 60.9 30.4 40.5 56.5 26.1 62.1 78.7 47.5
75 - 79 43.2 58.1 28.6 39.3 54.2 24.5 59.7 75.3 45.3
80+ 32.6 45.1 22.7 29.3 41.4 19.3 47.6 64.1 36.7
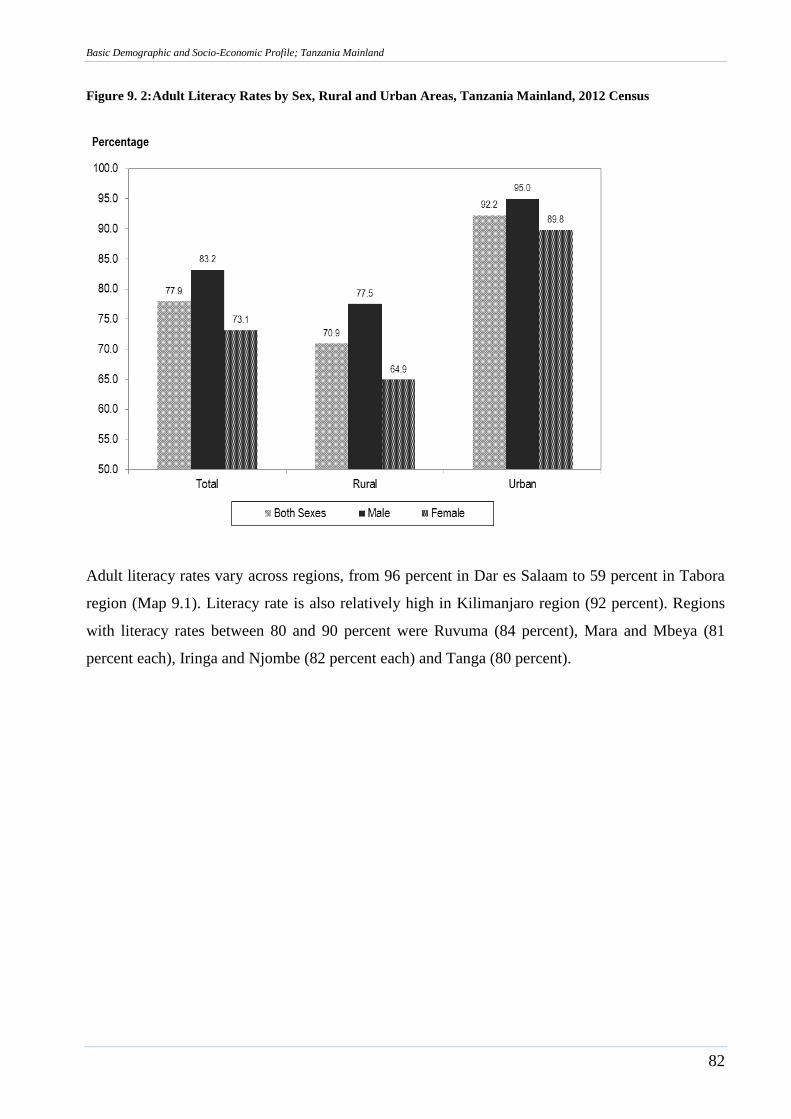
Basic Demographic and Socio-Economic Profile; Tanzania Mainland
82
Figure 9. 2: Adult Literacy Rates by Sex, Rural and Urban Areas, Tanzania Mainland, 2012 Census
Adult literacy rates vary across regions, from 96 percent in Dar es Salaam to 59 percent in Tabora
region (Map 9.1). Literacy rate is also relatively high in Kilimanjaro region (92 percent). Regions
with literacy rates between 80 and 90 percent were Ruvuma (84 percent), Mara and Mbeya (81
percent each), Iringa and Njombe (82 percent each) and Tanga (80 percent).
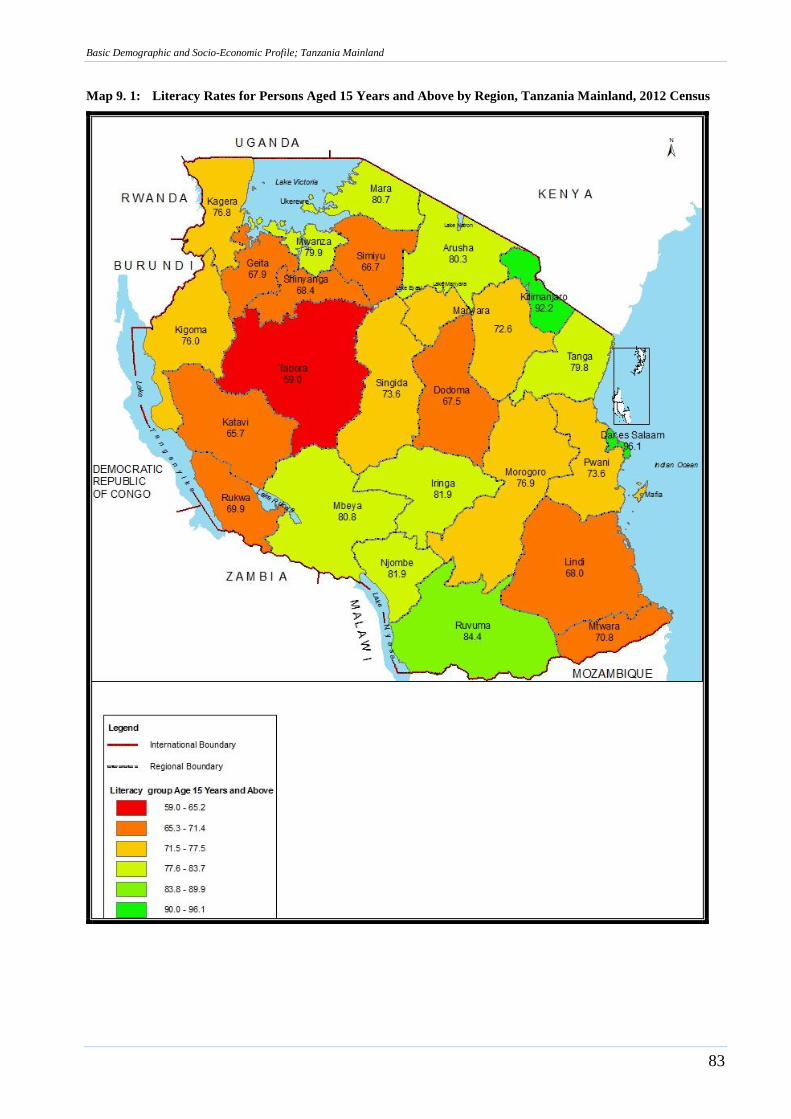
Basic Demographic and Socio-Economic Profile; Tanzania Mainland
83
Map 9. 1: Literacy Rates for Persons Aged 15 Years and Above by Region, Tanzania Mainland, 2012 Census
Basic Demographic and Socio-Economic Profile; Tanzania Mainland
84
Comparison of adult literacy rates across regions between 2002 and 2012 Censuses shows
significant increases (Table 9.5). The highest percentage change was observed in Pwani (25
percent), followed by Shinyanga (21 percent), Kigoma (19 percent), Mwanza and Manyara (17
percent each), Mtwara (16 percent), Mbeya, Lindi and Kagera (15 percent each) and the rest of the
regions lie between five (5) percent and 13 percent.
Between 2002 and 2012 Censuses, literacy rate increased from 63 percent to 72 percent for
population aged five (5) years and above; and from 69 percent to 78 percent for persons aged 15
years and above (Figure 9.3). The same data also revealed that, literacy rates among males and
females aged five years and above have also increased from 68 percent to 74 percent for males and
from 59 percent to 69 percent for females.
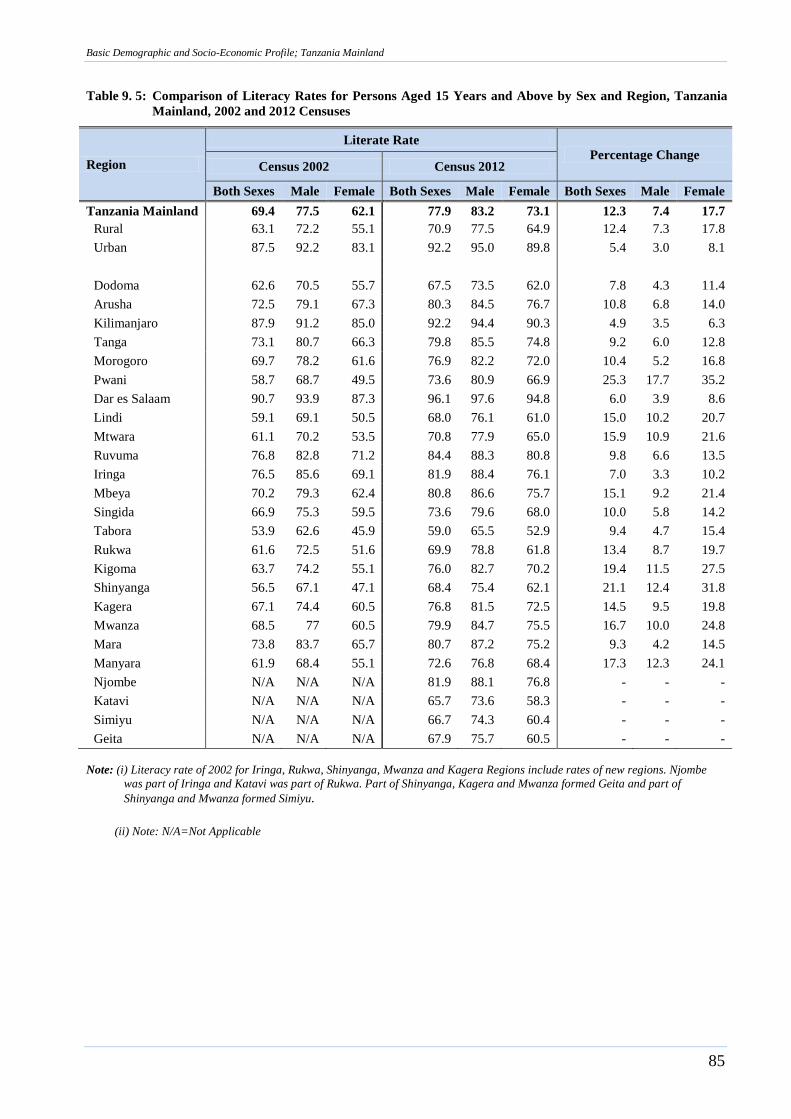
Basic Demographic and Socio-Economic Profile; Tanzania Mainland
85
Table 9. 5: Comparison of Literacy Rates for Persons Aged 15 Years and Above by Sex and Region, Tanzania
Mainland, 2002 and 2012 Censuses
Region
Literate Rate
Percentage Change Census 2002 Census 2012
Both Sexes Male Female Both Sexes Male Female Both Sexes Male Female
Tanzania Mainland 69.4 77.5 62.1 77.9 83.2 73.1 12.3 7.4 17.7
Rural 63.1 72.2 55.1 70.9 77.5 64.9 12.4 7.3 17.8
Urban 87.5 92.2 83.1 92.2 95.0 89.8 5.4 3.0 8.1
Dodoma 62.6 70.5 55.7 67.5 73.5 62.0 7.8 4.3 11.4
Arusha 72.5 79.1 67.3 80.3 84.5 76.7 10.8 6.8 14.0
Kilimanjaro 87.9 91.2 85.0 92.2 94.4 90.3 4.9 3.5 6.3
Tanga 73.1 80.7 66.3 79.8 85.5 74.8 9.2 6.0 12.8
Morogoro 69.7 78.2 61.6 76.9 82.2 72.0 10.4 5.2 16.8
Pwani 58.7 68.7 49.5 73.6 80.9 66.9 25.3 17.7 35.2
Dar es Salaam 90.7 93.9 87.3 96.1 97.6 94.8 6.0 3.9 8.6
Lindi 59.1 69.1 50.5 68.0 76.1 61.0 15.0 10.2 20.7
Mtwara 61.1 70.2 53.5 70.8 77.9 65.0 15.9 10.9 21.6
Ruvuma 76.8 82.8 71.2 84.4 88.3 80.8 9.8 6.6 13.5
Iringa 76.5 85.6 69.1 81.9 88.4 76.1 7.0 3.3 10.2
Mbeya 70.2 79.3 62.4 80.8 86.6 75.7 15.1 9.2 21.4
Singida 66.9 75.3 59.5 73.6 79.6 68.0 10.0 5.8 14.2
Tabora 53.9 62.6 45.9 59.0 65.5 52.9 9.4 4.7 15.4
Rukwa 61.6 72.5 51.6 69.9 78.8 61.8 13.4 8.7 19.7
Kigoma 63.7 74.2 55.1 76.0 82.7 70.2 19.4 11.5 27.5
Shinyanga 56.5 67.1 47.1 68.4 75.4 62.1 21.1 12.4 31.8
Kagera 67.1 74.4 60.5 76.8 81.5 72.5 14.5 9.5 19.8
Mwanza 68.5 77 60.5 79.9 84.7 75.5 16.7 10.0 24.8
Mara 73.8 83.7 65.7 80.7 87.2 75.2 9.3 4.2 14.5
Manyara 61.9 68.4 55.1 72.6 76.8 68.4 17.3 12.3 24.1
Njombe N/A N/A N/A 81.9 88.1 76.8 - - -
Katavi N/A N/A N/A 65.7 73.6 58.3 - - -
Simiyu N/A N/A N/A 66.7 74.3 60.4 - - -
Geita N/A N/A N/A 67.9 75.7 60.5 - - -
Note: (i) Literacy rate of 2002 for Iringa, Rukwa, Shinyanga, Mwanza and Kagera Regions include rates of new regions. Njombe
was part of Iringa and Katavi was part of Rukwa. Part of Shinyanga, Kagera and Mwanza formed Geita and part of
Shinyanga and Mwanza formed Simiyu.
(ii) Note: N/A=Not Applicable
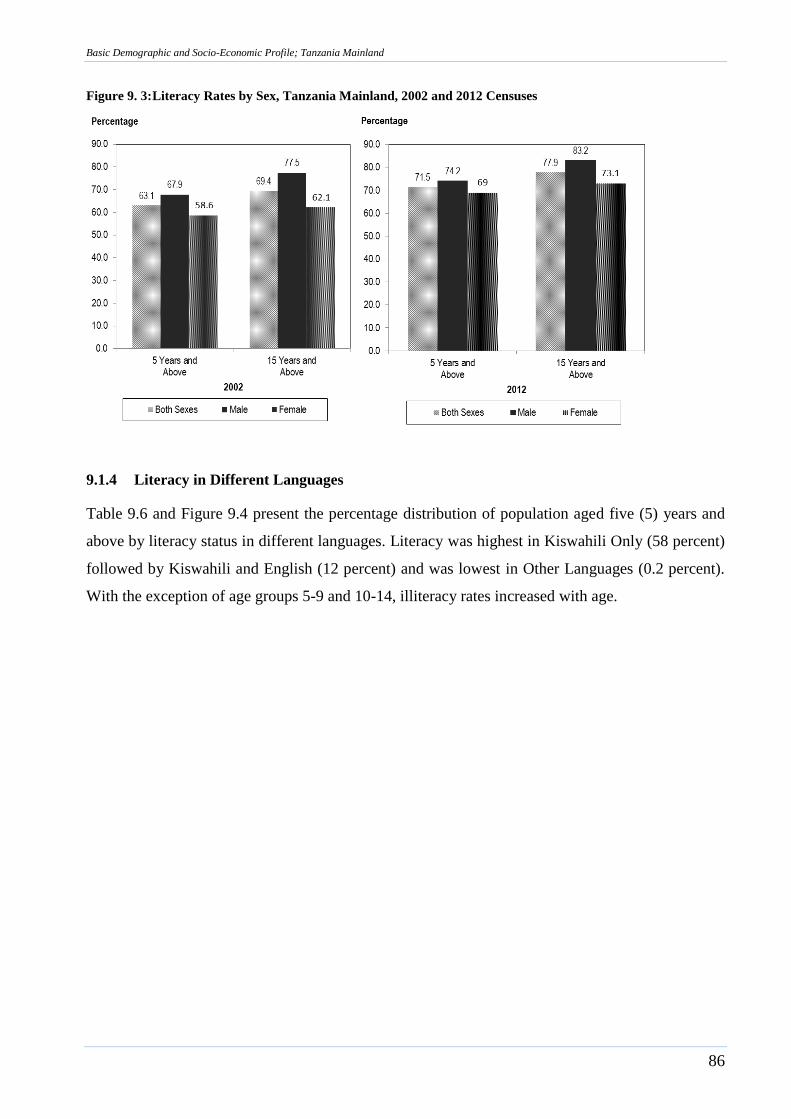
Basic Demographic and Socio-Economic Profile; Tanzania Mainland
86
Figure 9. 3: Literacy Rates by Sex, Tanzania Mainland, 2002 and 2012 Censuses
9.1.4 Literacy in Different Languages
Table 9.6 and Figure 9.4 present the percentage distribution of population aged five (5) years and
above by literacy status in different languages. Literacy was highest in Kiswahili Only (58 percent)
followed by Kiswahili and English (12 percent) and was lowest in Other Languages (0.2 percent).
With the exception of age groups 5-9 and 10-14, illiteracy rates increased with age.
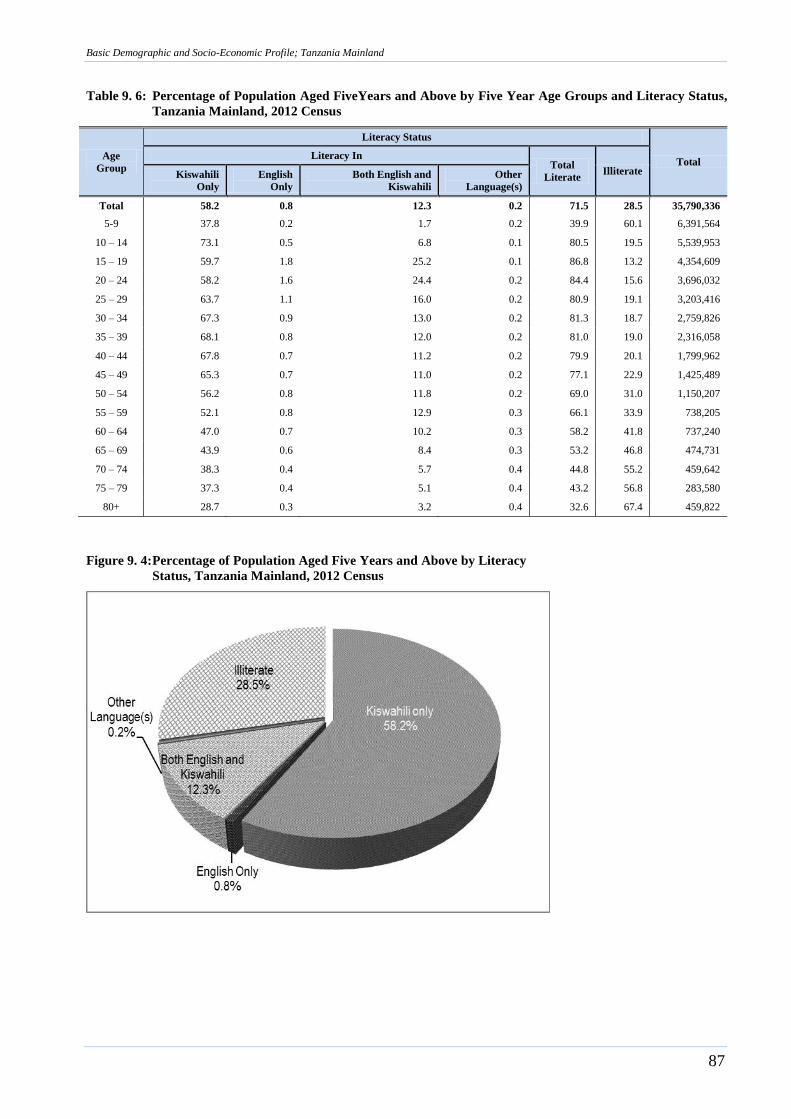
Basic Demographic and Socio-Economic Profile; Tanzania Mainland
87
Table 9. 6: Percentage of Population Aged FiveYears and Above by Five Year Age Groups and Literacy Status,
Tanzania Mainland, 2012 Census
Age
Group
Literacy Status
Total Literacy In
Total
Literate Illiterate Kiswahili
Only
English
Only
Both English and
Kiswahili
Other
Language(s)
Total 58.2 0.8 12.3 0.2 71.5 28.5 35,790,336
5-9 37.8 0.2 1.7 0.2 39.9 60.1 6,391,564
10 – 14 73.1 0.5 6.8 0.1 80.5 19.5 5,539,953
15 – 19 59.7 1.8 25.2 0.1 86.8 13.2 4,354,609
20 – 24 58.2 1.6 24.4 0.2 84.4 15.6 3,696,032
25 – 29 63.7 1.1 16.0 0.2 80.9 19.1 3,203,416
30 – 34 67.3 0.9 13.0 0.2 81.3 18.7 2,759,826
35 – 39 68.1 0.8 12.0 0.2 81.0 19.0 2,316,058
40 – 44 67.8 0.7 11.2 0.2 79.9 20.1 1,799,962
45 – 49 65.3 0.7 11.0 0.2 77.1 22.9 1,425,489
50 – 54 56.2 0.8 11.8 0.2 69.0 31.0 1,150,207
55 – 59 52.1 0.8 12.9 0.3 66.1 33.9 738,205
60 – 64 47.0 0.7 10.2 0.3 58.2 41.8 737,240
65 – 69 43.9 0.6 8.4 0.3 53.2 46.8 474,731
70 – 74 38.3 0.4 5.7 0.4 44.8 55.2 459,642
75 – 79 37.3 0.4 5.1 0.4 43.2 56.8 283,580
80+ 28.7 0.3 3.2 0.4 32.6 67.4 459,822
Figure 9. 4: Percentage of Population Aged Five Years and Above by Literacy
Status, Tanzania Mainland, 2012 Census
Basic Demographic and Socio-Economic Profile; Tanzania Mainland
88
Table 9.7, Figures 9.5 and 9.6 present the information on literacy status by rural-urban and sex for
population aged five years and above.
The illiteracy levels differ across regions. The region with the highest illiteracy rate was Tabora (48
percent), followed by Katavi (44 percent), Simiyu (42 percent), Geita and Rukwa (41 percent each).
Other regions with illiteracy rate of more than 30 percent are; Shinyanga and Dodoma (38 percent
each), Lindi (37 percent), Mtwara (34 percent), Singida and Manyara (33 percent each) and
Kigoma (32 percent). The region with lowest illiteracy rate was Dar es Salaam (6 percent) followed
by Kilimanjaro (10 percent).
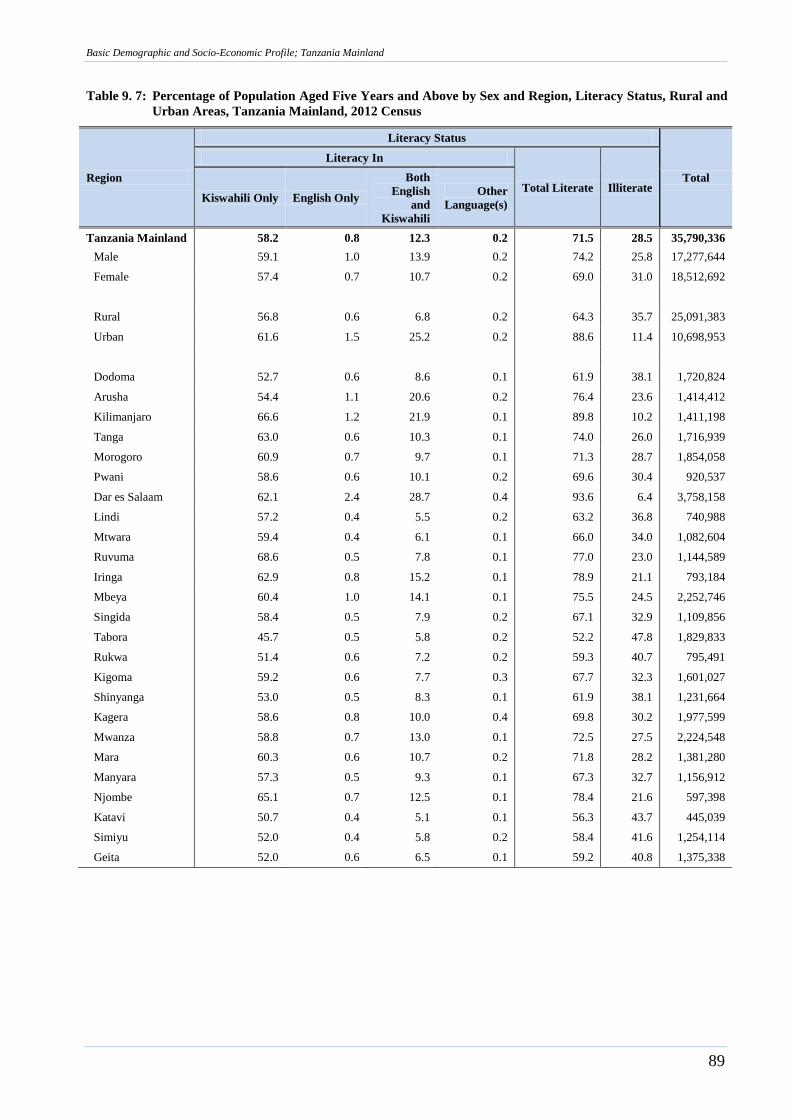
Basic Demographic and Socio-Economic Profile; Tanzania Mainland
89
Table 9. 7: Percentage of Population Aged Five Years and Above by Sex and Region, Literacy Status, Rural and
Urban Areas, Tanzania Mainland, 2012 Census
Region
Literacy Status
Total
Literacy In
Total Literate Illiterate Kiswahili Only English Only
Both
English
and
Kiswahili
Other
Language(s)
Tanzania Mainland 58.2 0.8 12.3 0.2 71.5 28.5 35,790,336
Male 59.1 1.0 13.9 0.2 74.2 25.8 17,277,644
Female 57.4 0.7 10.7 0.2 69.0 31.0 18,512,692
Rural 56.8 0.6 6.8 0.2 64.3 35.7 25,091,383
Urban 61.6 1.5 25.2 0.2 88.6 11.4 10,698,953
Dodoma 52.7 0.6 8.6 0.1 61.9 38.1 1,720,824
Arusha 54.4 1.1 20.6 0.2 76.4 23.6 1,414,412
Kilimanjaro 66.6 1.2 21.9 0.1 89.8 10.2 1,411,198
Tanga 63.0 0.6 10.3 0.1 74.0 26.0 1,716,939
Morogoro 60.9 0.7 9.7 0.1 71.3 28.7 1,854,058
Pwani 58.6 0.6 10.1 0.2 69.6 30.4 920,537
Dar es Salaam 62.1 2.4 28.7 0.4 93.6 6.4 3,758,158
Lindi 57.2 0.4 5.5 0.2 63.2 36.8 740,988
Mtwara 59.4 0.4 6.1 0.1 66.0 34.0 1,082,604
Ruvuma 68.6 0.5 7.8 0.1 77.0 23.0 1,144,589
Iringa 62.9 0.8 15.2 0.1 78.9 21.1 793,184
Mbeya 60.4 1.0 14.1 0.1 75.5 24.5 2,252,746
Singida 58.4 0.5 7.9 0.2 67.1 32.9 1,109,856
Tabora 45.7 0.5 5.8 0.2 52.2 47.8 1,829,833
Rukwa 51.4 0.6 7.2 0.2 59.3 40.7 795,491
Kigoma 59.2 0.6 7.7 0.3 67.7 32.3 1,601,027
Shinyanga 53.0 0.5 8.3 0.1 61.9 38.1 1,231,664
Kagera 58.6 0.8 10.0 0.4 69.8 30.2 1,977,599
Mwanza 58.8 0.7 13.0 0.1 72.5 27.5 2,224,548
Mara 60.3 0.6 10.7 0.2 71.8 28.2 1,381,280
Manyara 57.3 0.5 9.3 0.1 67.3 32.7 1,156,912
Njombe 65.1 0.7 12.5 0.1 78.4 21.6 597,398
Katavi 50.7 0.4 5.1 0.1 56.3 43.7 445,039
Simiyu 52.0 0.4 5.8 0.2 58.4 41.6 1,254,114
Geita 52.0 0.6 6.5 0.1 59.2 40.8 1,375,338
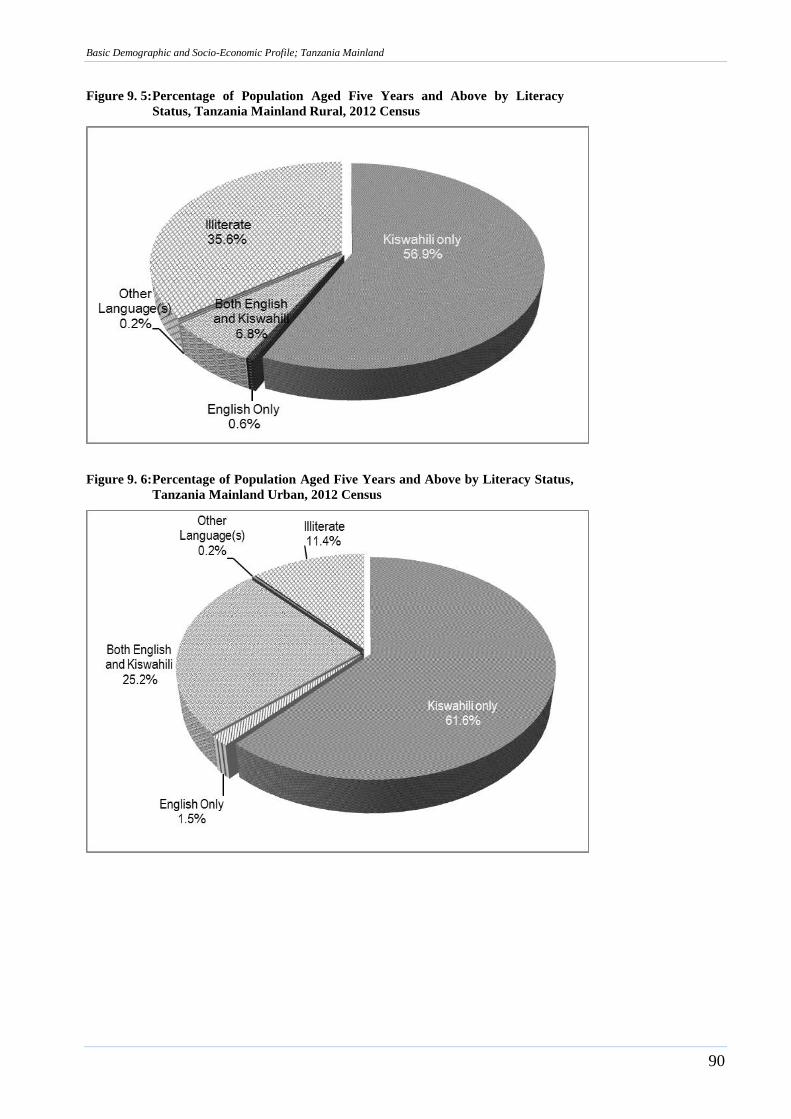
Basic Demographic and Socio-Economic Profile; Tanzania Mainland
90
Figure 9. 5: Percentage of Population Aged Five Years and Above by Literacy
Status, Tanzania Mainland Rural, 2012 Census
Figure 9. 6: Percentage of Population Aged Five Years and Above by Literacy Status,
Tanzania Mainland Urban, 2012 Census
Basic Demographic and Socio-Economic Profile; Tanzania Mainland
91
9.2 Education
9.2.1 Introduction
Education is one of the most important aspects of social and economic development. Education
improves capabilities and is highly associated with various socio-economic variables such as life-
styles, incomes and fertility for both individuals and societies.
During the 2012 PHC, all persons aged five (5) years and above who were in the country during the
Census night were asked questions on education. The respondent was asked to state if he/she was
attending, dropped out, completed, or had never been to school. For those who had dropped out or
completed school a follow up question on the highest level attained was asked.
9.2.2 School Attendance Status
School attendance refers to attendance at any regular authorized or licensed educational institution
or programme for organized learning at any level of education at the time of the Census. Informal
training in particular skills which is not part of the recognized educational structure, for instance,
apprenticeship, was not considered to be school attendance.
Table 9.8 and Figure 9.7 show results on the status of school attendance of the population aged five
(5) years and above. The results show that, 24 percent of 35.8 million people had never been to
school. They also show that there was a significant difference between the sexes with more females
(26 percent) having never been to school compared with males (21 percent). Forty percent
population aged five (5) years and above had completed different levels of the education system, 30
percent were attending and seven (7) percent had dropped out.
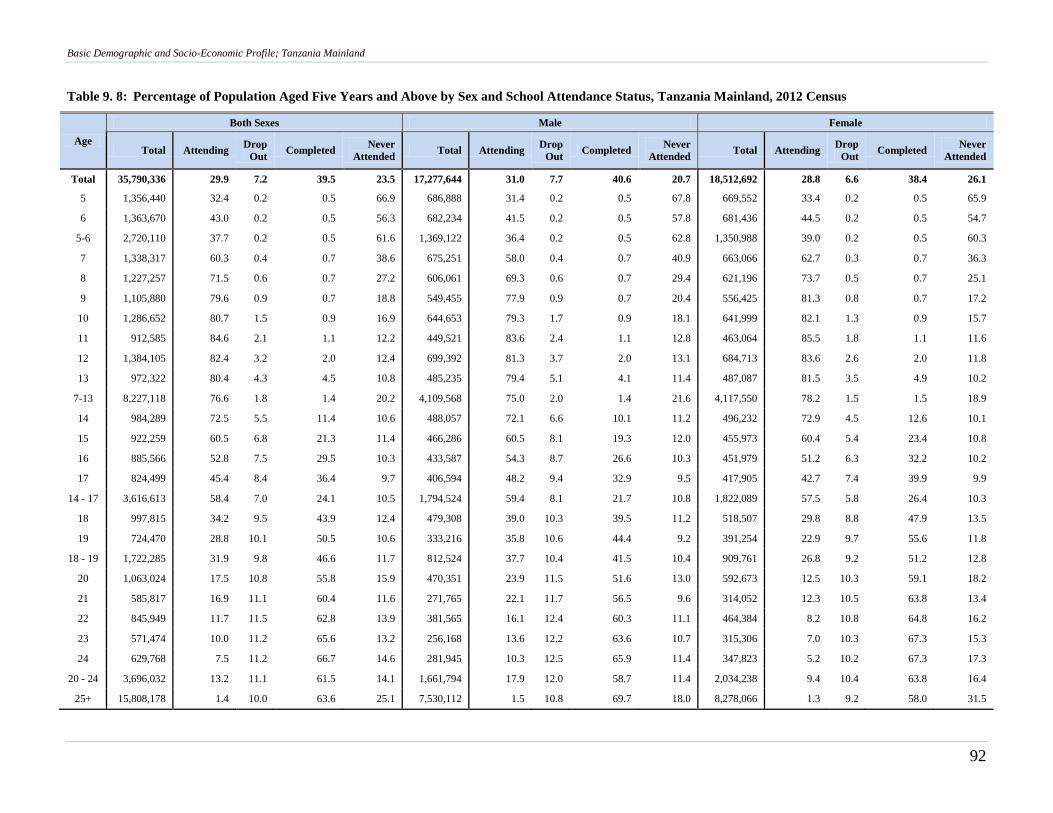
Basic Demographic and Socio-Economic Profile; Tanzania Mainland
92
Table 9. 8: Percentage of Population Aged Five Years and Above by Sex and School Attendance Status, Tanzania Mainland, 2012 Census
Age
Both Sexes Male Female
Total Attending Drop
Out Completed
Never
Attended Total Attending
Drop
Out Completed
Never
Attended Total Attending
Drop
Out Completed
Never
Attended
Total 35,790,336 29.9 7.2 39.5 23.5 17,277,644 31.0 7.7 40.6 20.7 18,512,692 28.8 6.6 38.4 26.1
5 1,356,440 32.4 0.2 0.5 66.9 686,888 31.4 0.2 0.5 67.8 669,552 33.4 0.2 0.5 65.9
6 1,363,670 43.0 0.2 0.5 56.3 682,234 41.5 0.2 0.5 57.8 681,436 44.5 0.2 0.5 54.7
5-6 2,720,110 37.7 0.2 0.5 61.6 1,369,122 36.4 0.2 0.5 62.8 1,350,988 39.0 0.2 0.5 60.3
7 1,338,317 60.3 0.4 0.7 38.6 675,251 58.0 0.4 0.7 40.9 663,066 62.7 0.3 0.7 36.3
8 1,227,257 71.5 0.6 0.7 27.2 606,061 69.3 0.6 0.7 29.4 621,196 73.7 0.5 0.7 25.1
9 1,105,880 79.6 0.9 0.7 18.8 549,455 77.9 0.9 0.7 20.4 556,425 81.3 0.8 0.7 17.2
10 1,286,652 80.7 1.5 0.9 16.9 644,653 79.3 1.7 0.9 18.1 641,999 82.1 1.3 0.9 15.7
11 912,585 84.6 2.1 1.1 12.2 449,521 83.6 2.4 1.1 12.8 463,064 85.5 1.8 1.1 11.6
12 1,384,105 82.4 3.2 2.0 12.4 699,392 81.3 3.7 2.0 13.1 684,713 83.6 2.6 2.0 11.8
13 972,322 80.4 4.3 4.5 10.8 485,235 79.4 5.1 4.1 11.4 487,087 81.5 3.5 4.9 10.2
7-13 8,227,118 76.6 1.8 1.4 20.2 4,109,568 75.0 2.0 1.4 21.6 4,117,550 78.2 1.5 1.5 18.9
14 984,289 72.5 5.5 11.4 10.6 488,057 72.1 6.6 10.1 11.2 496,232 72.9 4.5 12.6 10.1
15 922,259 60.5 6.8 21.3 11.4 466,286 60.5 8.1 19.3 12.0 455,973 60.4 5.4 23.4 10.8
16 885,566 52.8 7.5 29.5 10.3 433,587 54.3 8.7 26.6 10.3 451,979 51.2 6.3 32.2 10.2
17 824,499 45.4 8.4 36.4 9.7 406,594 48.2 9.4 32.9 9.5 417,905 42.7 7.4 39.9 9.9
14 - 17 3,616,613 58.4 7.0 24.1 10.5 1,794,524 59.4 8.1 21.7 10.8 1,822,089 57.5 5.8 26.4 10.3
18 997,815 34.2 9.5 43.9 12.4 479,308 39.0 10.3 39.5 11.2 518,507 29.8 8.8 47.9 13.5
19 724,470 28.8 10.1 50.5 10.6 333,216 35.8 10.6 44.4 9.2 391,254 22.9 9.7 55.6 11.8
18 - 19 1,722,285 31.9 9.8 46.6 11.7 812,524 37.7 10.4 41.5 10.4 909,761 26.8 9.2 51.2 12.8
20 1,063,024 17.5 10.8 55.8 15.9 470,351 23.9 11.5 51.6 13.0 592,673 12.5 10.3 59.1 18.2
21 585,817 16.9 11.1 60.4 11.6 271,765 22.1 11.7 56.5 9.6 314,052 12.3 10.5 63.8 13.4
22 845,949 11.7 11.5 62.8 13.9 381,565 16.1 12.4 60.3 11.1 464,384 8.2 10.8 64.8 16.2
23 571,474 10.0 11.2 65.6 13.2 256,168 13.6 12.2 63.6 10.7 315,306 7.0 10.3 67.3 15.3
24 629,768 7.5 11.2 66.7 14.6 281,945 10.3 12.5 65.9 11.4 347,823 5.2 10.2 67.3 17.3
20 - 24 3,696,032 13.2 11.1 61.5 14.1 1,661,794 17.9 12.0 58.7 11.4 2,034,238 9.4 10.4 63.8 16.4
25+ 15,808,178 1.4 10.0 63.6 25.1 7,530,112 1.5 10.8 69.7 18.0 8,278,066 1.3 9.2 58.0 31.5
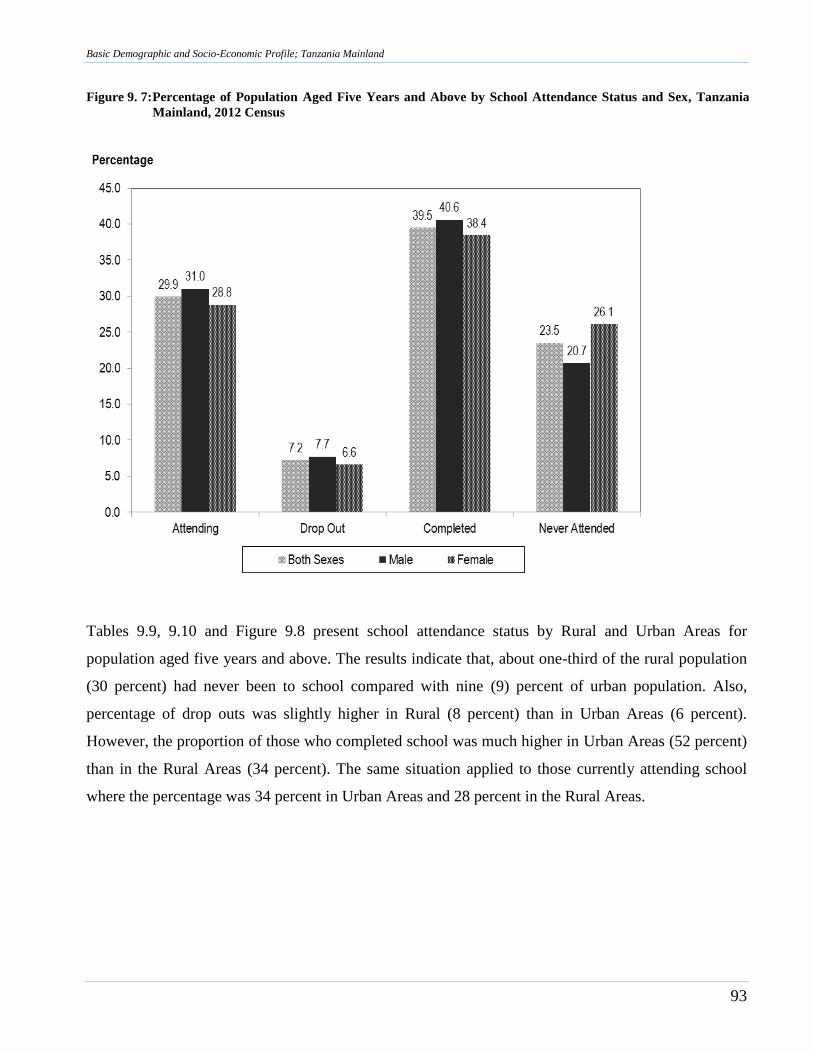
Basic Demographic and Socio-Economic Profile; Tanzania Mainland
93
Figure 9. 7: Percentage of Population Aged Five Years and Above by School Attendance Status and Sex, Tanzania
Mainland, 2012 Census
Tables 9.9, 9.10 and Figure 9.8 present school attendance status by Rural and Urban Areas for
population aged five years and above. The results indicate that, about one-third of the rural population
(30 percent) had never been to school compared with nine (9) percent of urban population. Also,
percentage of drop outs was slightly higher in Rural (8 percent) than in Urban Areas (6 percent).
However, the proportion of those who completed school was much higher in Urban Areas (52 percent)
than in the Rural Areas (34 percent). The same situation applied to those currently attending school
where the percentage was 34 percent in Urban Areas and 28 percent in the Rural Areas.
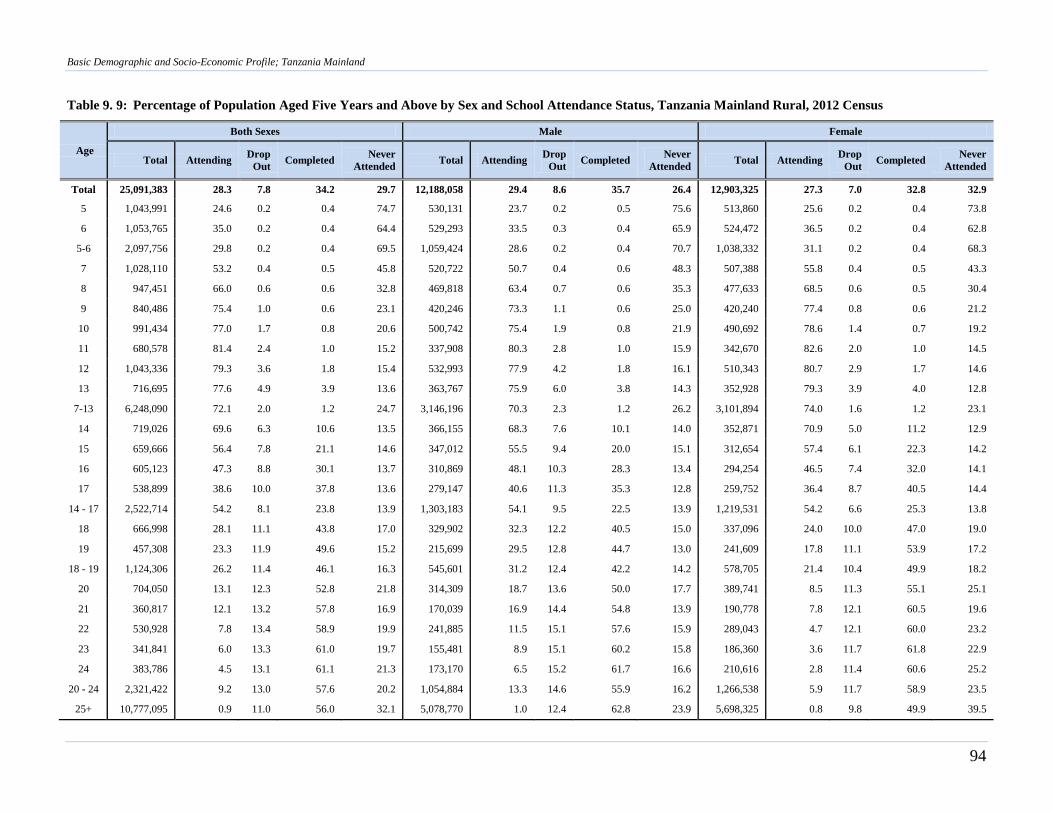
Basic Demographic and Socio-Economic Profile; Tanzania Mainland
94
Table 9. 9: Percentage of Population Aged Five Years and Above by Sex and School Attendance Status, Tanzania Mainland Rural, 2012 Census
Age
Both Sexes Male Female
Total Attending Drop
Out Completed
Never
Attended Total Attending
Drop
Out Completed
Never
Attended Total Attending
Drop
Out Completed
Never
Attended
Total 25,091,383 28.3 7.8 34.2 29.7 12,188,058 29.4 8.6 35.7 26.4 12,903,325 27.3 7.0 32.8 32.9
5 1,043,991 24.6 0.2 0.4 74.7 530,131 23.7 0.2 0.5 75.6 513,860 25.6 0.2 0.4 73.8
6 1,053,765 35.0 0.2 0.4 64.4 529,293 33.5 0.3 0.4 65.9 524,472 36.5 0.2 0.4 62.8
5-6 2,097,756 29.8 0.2 0.4 69.5 1,059,424 28.6 0.2 0.4 70.7 1,038,332 31.1 0.2 0.4 68.3
7 1,028,110 53.2 0.4 0.5 45.8 520,722 50.7 0.4 0.6 48.3 507,388 55.8 0.4 0.5 43.3
8 947,451 66.0 0.6 0.6 32.8 469,818 63.4 0.7 0.6 35.3 477,633 68.5 0.6 0.5 30.4
9 840,486 75.4 1.0 0.6 23.1 420,246 73.3 1.1 0.6 25.0 420,240 77.4 0.8 0.6 21.2
10 991,434 77.0 1.7 0.8 20.6 500,742 75.4 1.9 0.8 21.9 490,692 78.6 1.4 0.7 19.2
11 680,578 81.4 2.4 1.0 15.2 337,908 80.3 2.8 1.0 15.9 342,670 82.6 2.0 1.0 14.5
12 1,043,336 79.3 3.6 1.8 15.4 532,993 77.9 4.2 1.8 16.1 510,343 80.7 2.9 1.7 14.6
13 716,695 77.6 4.9 3.9 13.6 363,767 75.9 6.0 3.8 14.3 352,928 79.3 3.9 4.0 12.8
7-13 6,248,090 72.1 2.0 1.2 24.7 3,146,196 70.3 2.3 1.2 26.2 3,101,894 74.0 1.6 1.2 23.1
14 719,026 69.6 6.3 10.6 13.5 366,155 68.3 7.6 10.1 14.0 352,871 70.9 5.0 11.2 12.9
15 659,666 56.4 7.8 21.1 14.6 347,012 55.5 9.4 20.0 15.1 312,654 57.4 6.1 22.3 14.2
16 605,123 47.3 8.8 30.1 13.7 310,869 48.1 10.3 28.3 13.4 294,254 46.5 7.4 32.0 14.1
17 538,899 38.6 10.0 37.8 13.6 279,147 40.6 11.3 35.3 12.8 259,752 36.4 8.7 40.5 14.4
14 - 17 2,522,714 54.2 8.1 23.8 13.9 1,303,183 54.1 9.5 22.5 13.9 1,219,531 54.2 6.6 25.3 13.8
18 666,998 28.1 11.1 43.8 17.0 329,902 32.3 12.2 40.5 15.0 337,096 24.0 10.0 47.0 19.0
19 457,308 23.3 11.9 49.6 15.2 215,699 29.5 12.8 44.7 13.0 241,609 17.8 11.1 53.9 17.2
18 - 19 1,124,306 26.2 11.4 46.1 16.3 545,601 31.2 12.4 42.2 14.2 578,705 21.4 10.4 49.9 18.2
20 704,050 13.1 12.3 52.8 21.8 314,309 18.7 13.6 50.0 17.7 389,741 8.5 11.3 55.1 25.1
21 360,817 12.1 13.2 57.8 16.9 170,039 16.9 14.4 54.8 13.9 190,778 7.8 12.1 60.5 19.6
22 530,928 7.8 13.4 58.9 19.9 241,885 11.5 15.1 57.6 15.9 289,043 4.7 12.1 60.0 23.2
23 341,841 6.0 13.3 61.0 19.7 155,481 8.9 15.1 60.2 15.8 186,360 3.6 11.7 61.8 22.9
24 383,786 4.5 13.1 61.1 21.3 173,170 6.5 15.2 61.7 16.6 210,616 2.8 11.4 60.6 25.2
20 - 24 2,321,422 9.2 13.0 57.6 20.2 1,054,884 13.3 14.6 55.9 16.2 1,266,538 5.9 11.7 58.9 23.5
25+ 10,777,095 0.9 11.0 56.0 32.1 5,078,770 1.0 12.4 62.8 23.9 5,698,325 0.8 9.8 49.9 39.5
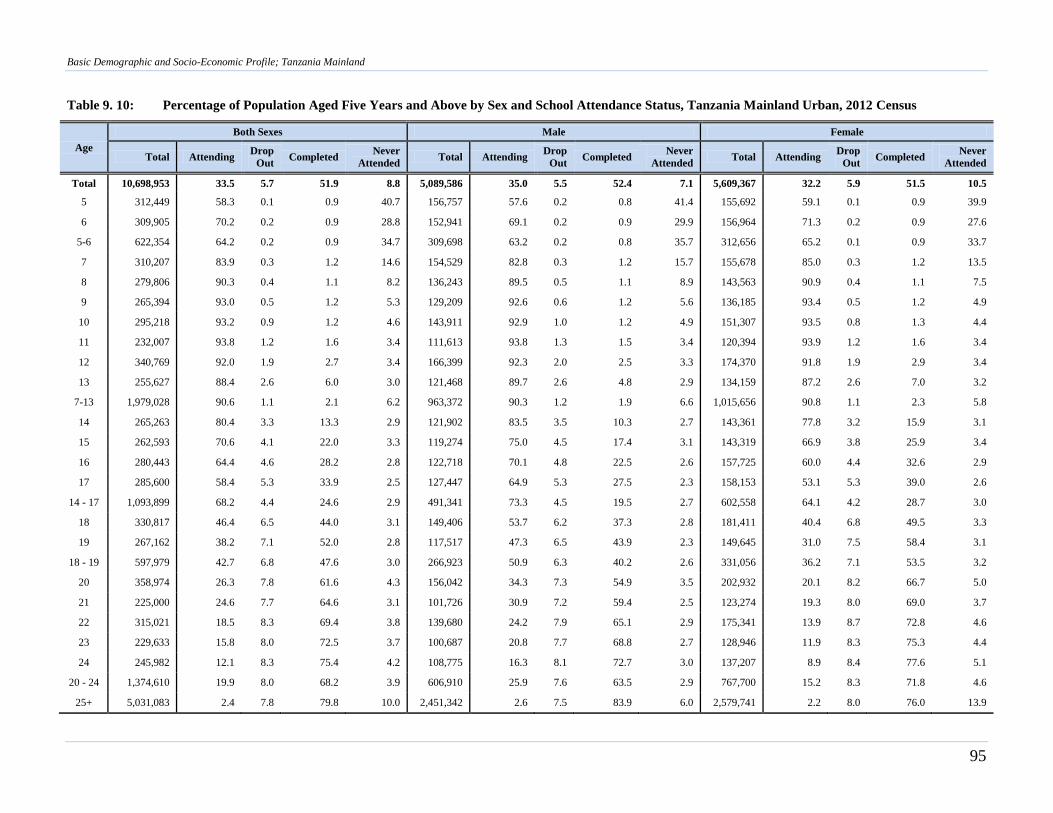
Basic Demographic and Socio-Economic Profile; Tanzania Mainland
95
Table 9. 10: Percentage of Population Aged Five Years and Above by Sex and School Attendance Status, Tanzania Mainland Urban, 2012 Census
Age
Both Sexes Male Female
Total Attending Drop
Out Completed
Never
Attended Total Attending
Drop
Out Completed
Never
Attended Total Attending
Drop
Out Completed
Never
Attended
Total 10,698,953 33.5 5.7 51.9 8.8 5,089,586 35.0 5.5 52.4 7.1 5,609,367 32.2 5.9 51.5 10.5
5 312,449 58.3 0.1 0.9 40.7 156,757 57.6 0.2 0.8 41.4 155,692 59.1 0.1 0.9 39.9
6 309,905 70.2 0.2 0.9 28.8 152,941 69.1 0.2 0.9 29.9 156,964 71.3 0.2 0.9 27.6
5-6 622,354 64.2 0.2 0.9 34.7 309,698 63.2 0.2 0.8 35.7 312,656 65.2 0.1 0.9 33.7
7 310,207 83.9 0.3 1.2 14.6 154,529 82.8 0.3 1.2 15.7 155,678 85.0 0.3 1.2 13.5
8 279,806 90.3 0.4 1.1 8.2 136,243 89.5 0.5 1.1 8.9 143,563 90.9 0.4 1.1 7.5
9 265,394 93.0 0.5 1.2 5.3 129,209 92.6 0.6 1.2 5.6 136,185 93.4 0.5 1.2 4.9
10 295,218 93.2 0.9 1.2 4.6 143,911 92.9 1.0 1.2 4.9 151,307 93.5 0.8 1.3 4.4
11 232,007 93.8 1.2 1.6 3.4 111,613 93.8 1.3 1.5 3.4 120,394 93.9 1.2 1.6 3.4
12 340,769 92.0 1.9 2.7 3.4 166,399 92.3 2.0 2.5 3.3 174,370 91.8 1.9 2.9 3.4
13 255,627 88.4 2.6 6.0 3.0 121,468 89.7 2.6 4.8 2.9 134,159 87.2 2.6 7.0 3.2
7-13 1,979,028 90.6 1.1 2.1 6.2 963,372 90.3 1.2 1.9 6.6 1,015,656 90.8 1.1 2.3 5.8
14 265,263 80.4 3.3 13.3 2.9 121,902 83.5 3.5 10.3 2.7 143,361 77.8 3.2 15.9 3.1
15 262,593 70.6 4.1 22.0 3.3 119,274 75.0 4.5 17.4 3.1 143,319 66.9 3.8 25.9 3.4
16 280,443 64.4 4.6 28.2 2.8 122,718 70.1 4.8 22.5 2.6 157,725 60.0 4.4 32.6 2.9
17 285,600 58.4 5.3 33.9 2.5 127,447 64.9 5.3 27.5 2.3 158,153 53.1 5.3 39.0 2.6
14 - 17 1,093,899 68.2 4.4 24.6 2.9 491,341 73.3 4.5 19.5 2.7 602,558 64.1 4.2 28.7 3.0
18 330,817 46.4 6.5 44.0 3.1 149,406 53.7 6.2 37.3 2.8 181,411 40.4 6.8 49.5 3.3
19 267,162 38.2 7.1 52.0 2.8 117,517 47.3 6.5 43.9 2.3 149,645 31.0 7.5 58.4 3.1
18 - 19 597,979 42.7 6.8 47.6 3.0 266,923 50.9 6.3 40.2 2.6 331,056 36.2 7.1 53.5 3.2
20 358,974 26.3 7.8 61.6 4.3 156,042 34.3 7.3 54.9 3.5 202,932 20.1 8.2 66.7 5.0
21 225,000 24.6 7.7 64.6 3.1 101,726 30.9 7.2 59.4 2.5 123,274 19.3 8.0 69.0 3.7
22 315,021 18.5 8.3 69.4 3.8 139,680 24.2 7.9 65.1 2.9 175,341 13.9 8.7 72.8 4.6
23 229,633 15.8 8.0 72.5 3.7 100,687 20.8 7.7 68.8 2.7 128,946 11.9 8.3 75.3 4.4
24 245,982 12.1 8.3 75.4 4.2 108,775 16.3 8.1 72.7 3.0 137,207 8.9 8.4 77.6 5.1
20 - 24 1,374,610 19.9 8.0 68.2 3.9 606,910 25.9 7.6 63.5 2.9 767,700 15.2 8.3 71.8 4.6
25+ 5,031,083 2.4 7.8 79.8 10.0 2,451,342 2.6 7.5 83.9 6.0 2,579,741 2.2 8.0 76.0 13.9
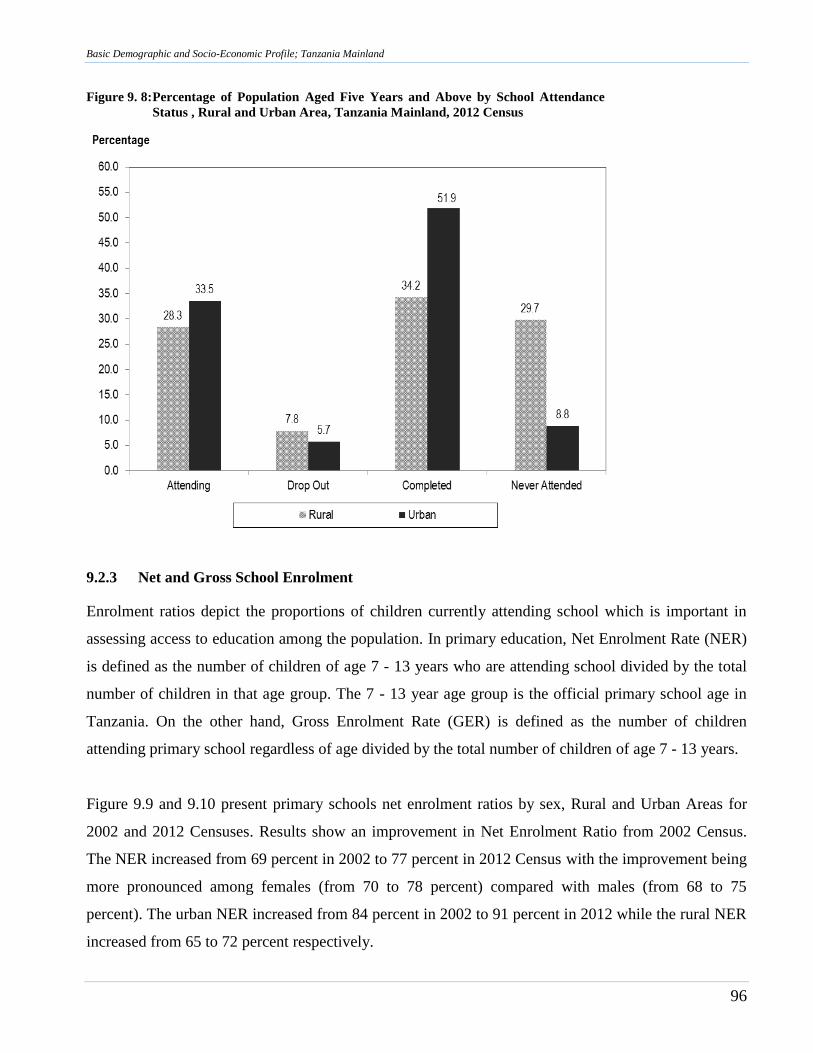
Basic Demographic and Socio-Economic Profile; Tanzania Mainland
96
Figure 9. 8: Percentage of Population Aged Five Years and Above by School Attendance
Status , Rural and Urban Area, Tanzania Mainland, 2012 Census
9.2.3 Net and Gross School Enrolment
Enrolment ratios depict the proportions of children currently attending school which is important in
assessing access to education among the population. In primary education, Net Enrolment Rate (NER)
is defined as the number of children of age 7 - 13 years who are attending school divided by the total
number of children in that age group. The 7 - 13 year age group is the official primary school age in
Tanzania. On the other hand, Gross Enrolment Rate (GER) is defined as the number of children
attending primary school regardless of age divided by the total number of children of age 7 - 13 years.
Figure 9.9 and 9.10 present primary schools net enrolment ratios by sex, Rural and Urban Areas for
2002 and 2012 Censuses. Results show an improvement in Net Enrolment Ratio from 2002 Census.
The NER increased from 69 percent in 2002 to 77 percent in 2012 Census with the improvement being
more pronounced among females (from 70 to 78 percent) compared with males (from 68 to 75
percent). The urban NER increased from 84 percent in 2002 to 91 percent in 2012 while the rural NER
increased from 65 to 72 percent respectively.
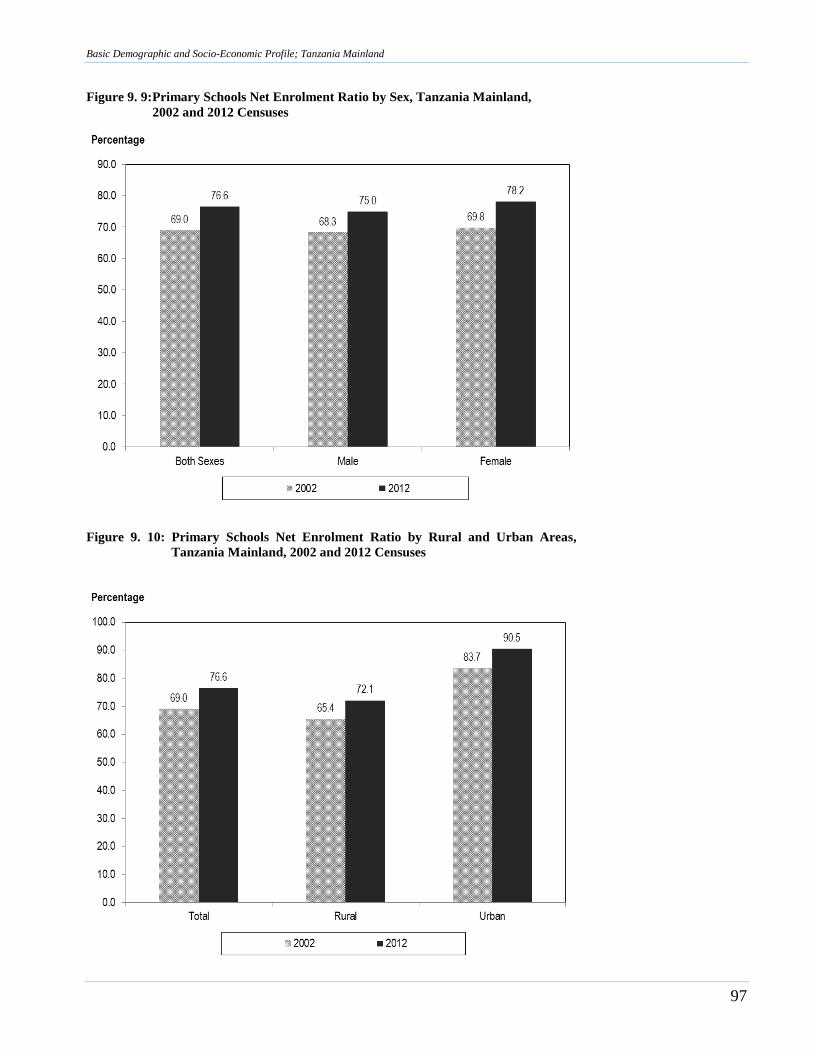
Basic Demographic and Socio-Economic Profile; Tanzania Mainland
97
Figure 9. 9: Primary Schools Net Enrolment Ratio by Sex, Tanzania Mainland,
2002 and 2012 Censuses
Figure 9. 10: Primary Schools Net Enrolment Ratio by Rural and Urban Areas,
Tanzania Mainland, 2002 and 2012 Censuses
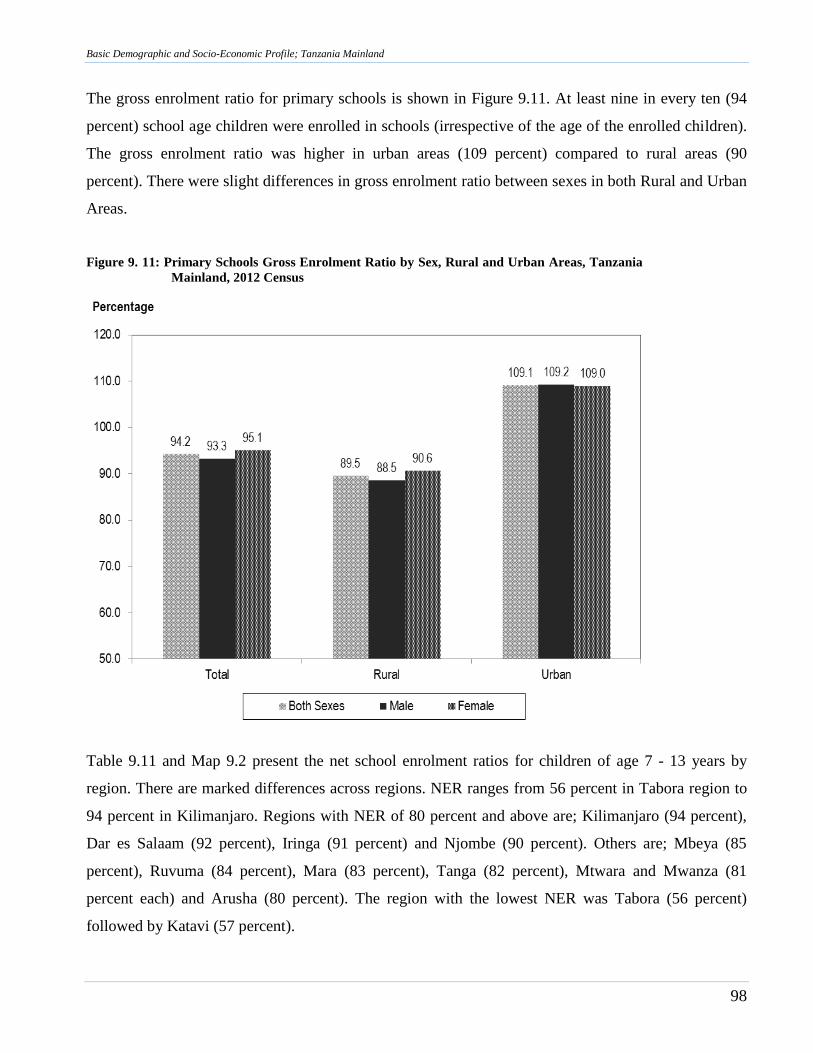
Basic Demographic and Socio-Economic Profile; Tanzania Mainland
98
The gross enrolment ratio for primary schools is shown in Figure 9.11. At least nine in every ten (94
percent) school age children were enrolled in schools (irrespective of the age of the enrolled children).
The gross enrolment ratio was higher in urban areas (109 percent) compared to rural areas (90
percent). There were slight differences in gross enrolment ratio between sexes in both Rural and Urban
Areas.
Figure 9. 11: Primary Schools Gross Enrolment Ratio by Sex, Rural and Urban Areas, Tanzania
Mainland, 2012 Census
Table 9.11 and Map 9.2 present the net school enrolment ratios for children of age 7 - 13 years by
region. There are marked differences across regions. NER ranges from 56 percent in Tabora region to
94 percent in Kilimanjaro. Regions with NER of 80 percent and above are; Kilimanjaro (94 percent),
Dar es Salaam (92 percent), Iringa (91 percent) and Njombe (90 percent). Others are; Mbeya (85
percent), Ruvuma (84 percent), Mara (83 percent), Tanga (82 percent), Mtwara and Mwanza (81
percent each) and Arusha (80 percent). The region with the lowest NER was Tabora (56 percent)
followed by Katavi (57 percent).
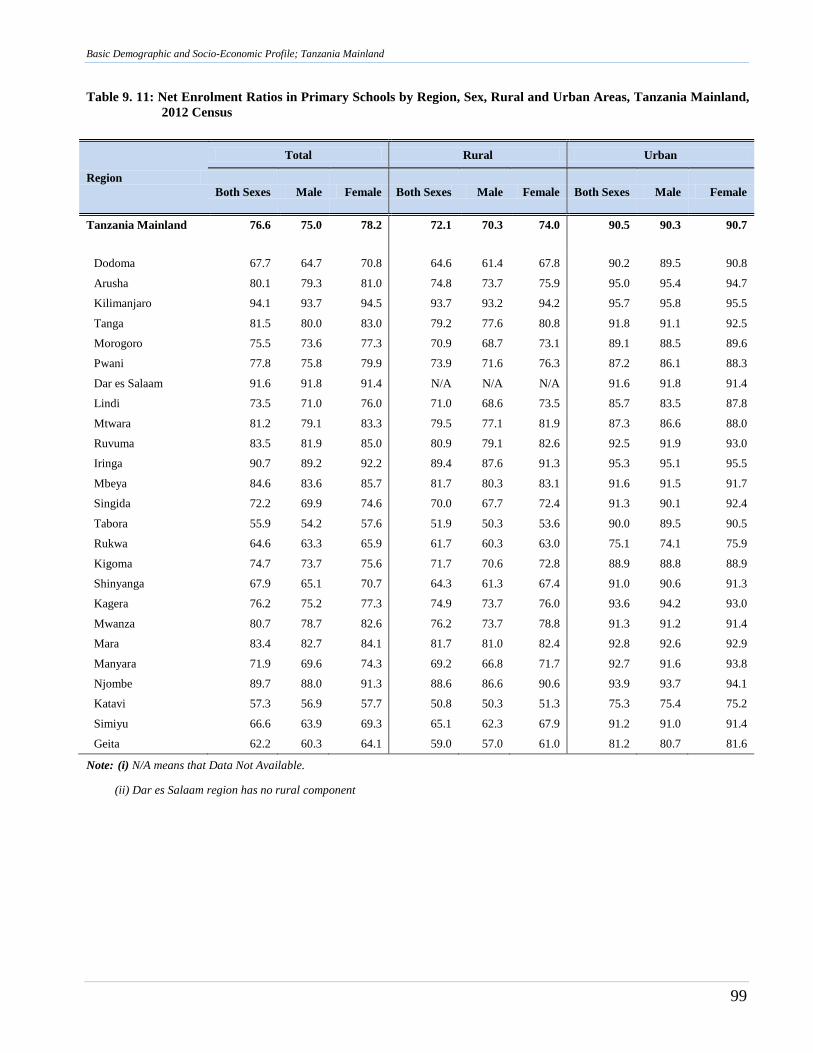
Basic Demographic and Socio-Economic Profile; Tanzania Mainland
99
Table 9. 11: Net Enrolment Ratios in Primary Schools by Region, Sex, Rural and Urban Areas, Tanzania Mainland,
2012 Census
Region
Total Rural Urban
Both Sexes Male Female Both Sexes Male Female Both Sexes Male Female
Tanzania Mainland 76.6 75.0 78.2 72.1 70.3 74.0 90.5 90.3 90.7
Dodoma 67.7 64.7 70.8 64.6 61.4 67.8 90.2 89.5 90.8
Arusha 80.1 79.3 81.0 74.8 73.7 75.9 95.0 95.4 94.7
Kilimanjaro 94.1 93.7 94.5 93.7 93.2 94.2 95.7 95.8 95.5
Tanga 81.5 80.0 83.0 79.2 77.6 80.8 91.8 91.1 92.5
Morogoro 75.5 73.6 77.3 70.9 68.7 73.1 89.1 88.5 89.6
Pwani 77.8 75.8 79.9 73.9 71.6 76.3 87.2 86.1 88.3
Dar es Salaam 91.6 91.8 91.4 N/A N/A N/A 91.6 91.8 91.4
Lindi 73.5 71.0 76.0 71.0 68.6 73.5 85.7 83.5 87.8
Mtwara 81.2 79.1 83.3 79.5 77.1 81.9 87.3 86.6 88.0
Ruvuma 83.5 81.9 85.0 80.9 79.1 82.6 92.5 91.9 93.0
Iringa 90.7 89.2 92.2 89.4 87.6 91.3 95.3 95.1 95.5
Mbeya 84.6 83.6 85.7 81.7 80.3 83.1 91.6 91.5 91.7
Singida 72.2 69.9 74.6 70.0 67.7 72.4 91.3 90.1 92.4
Tabora 55.9 54.2 57.6 51.9 50.3 53.6 90.0 89.5 90.5
Rukwa 64.6 63.3 65.9 61.7 60.3 63.0 75.1 74.1 75.9
Kigoma 74.7 73.7 75.6 71.7 70.6 72.8 88.9 88.8 88.9
Shinyanga 67.9 65.1 70.7 64.3 61.3 67.4 91.0 90.6 91.3
Kagera 76.2 75.2 77.3 74.9 73.7 76.0 93.6 94.2 93.0
Mwanza 80.7 78.7 82.6 76.2 73.7 78.8 91.3 91.2 91.4
Mara 83.4 82.7 84.1 81.7 81.0 82.4 92.8 92.6 92.9
Manyara 71.9 69.6 74.3 69.2 66.8 71.7 92.7 91.6 93.8
Njombe 89.7 88.0 91.3 88.6 86.6 90.6 93.9 93.7 94.1
Katavi 57.3 56.9 57.7 50.8 50.3 51.3 75.3 75.4 75.2
Simiyu 66.6 63.9 69.3 65.1 62.3 67.9 91.2 91.0 91.4
Geita 62.2 60.3 64.1 59.0 57.0 61.0 81.2 80.7 81.6
Note: (i) N/A means that Data Not Available.
(ii) Dar es Salaam region has no rural component
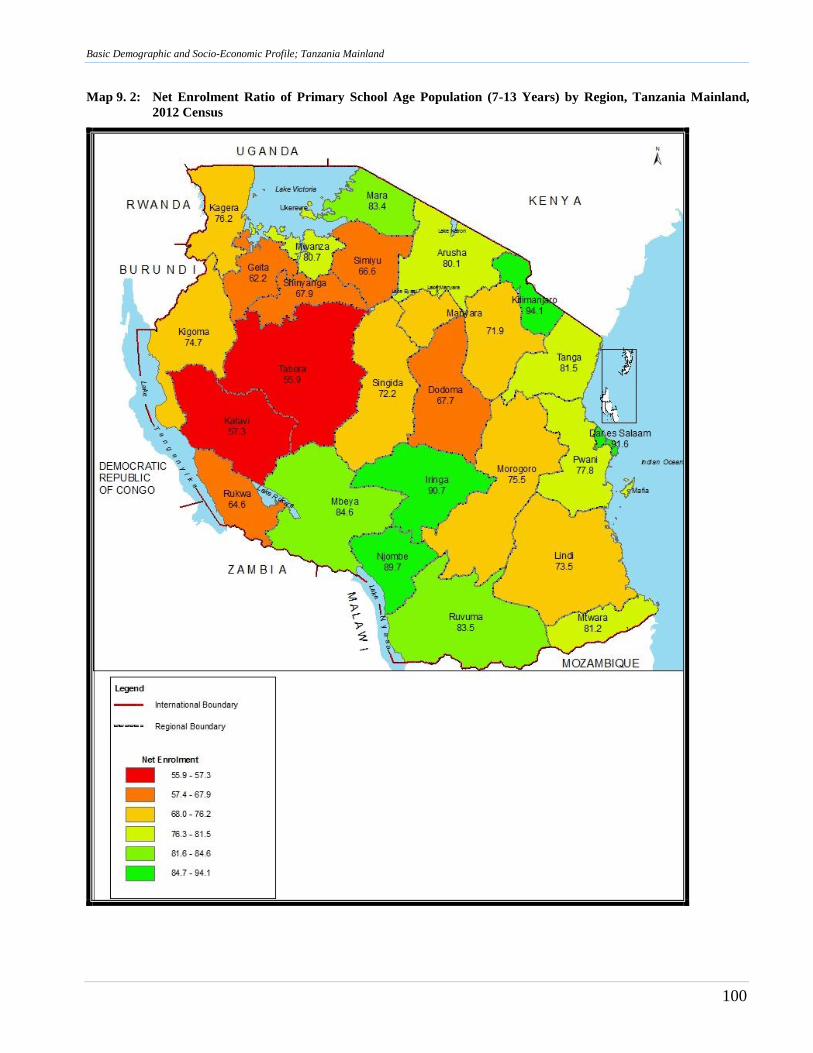
Basic Demographic and Socio-Economic Profile; Tanzania Mainland
100
Map 9. 2: Net Enrolment Ratio of Primary School Age Population (7-13 Years) by Region, Tanzania Mainland,
2012 Census
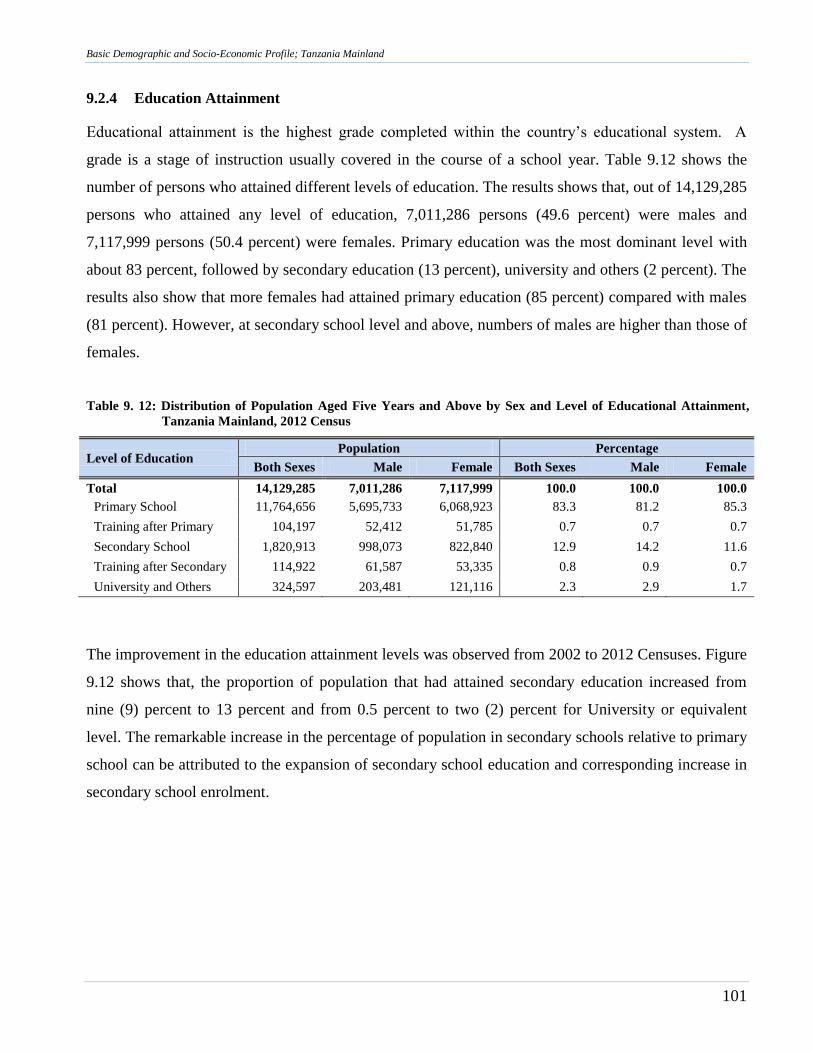
Basic Demographic and Socio-Economic Profile; Tanzania Mainland
101
9.2.4 Education Attainment
Educational attainment is the highest grade completed within the country‟s educational system. A
grade is a stage of instruction usually covered in the course of a school year. Table 9.12 shows the
number of persons who attained different levels of education. The results shows that, out of 14,129,285
persons who attained any level of education, 7,011,286 persons (49.6 percent) were males and
7,117,999 persons (50.4 percent) were females. Primary education was the most dominant level with
about 83 percent, followed by secondary education (13 percent), university and others (2 percent). The
results also show that more females had attained primary education (85 percent) compared with males
(81 percent). However, at secondary school level and above, numbers of males are higher than those of
females.
Table 9. 12: Distribution of Population Aged Five Years and Above by Sex and Level of Educational Attainment,
Tanzania Mainland, 2012 Census
Level of Education Population Percentage
Both Sexes Male Female Both Sexes Male Female
Total 14,129,285 7,011,286 7,117,999 100.0 100.0 100.0
Primary School 11,764,656 5,695,733 6,068,923 83.3 81.2 85.3
Training after Primary 104,197 52,412 51,785 0.7 0.7 0.7
Secondary School 1,820,913 998,073 822,840 12.9 14.2 11.6
Training after Secondary 114,922 61,587 53,335 0.8 0.9 0.7
University and Others 324,597 203,481 121,116 2.3 2.9 1.7
The improvement in the education attainment levels was observed from 2002 to 2012 Censuses. Figure
9.12 shows that, the proportion of population that had attained secondary education increased from
nine (9) percent to 13 percent and from 0.5 percent to two (2) percent for University or equivalent
level. The remarkable increase in the percentage of population in secondary schools relative to primary
school can be attributed to the expansion of secondary school education and corresponding increase in
secondary school enrolment.
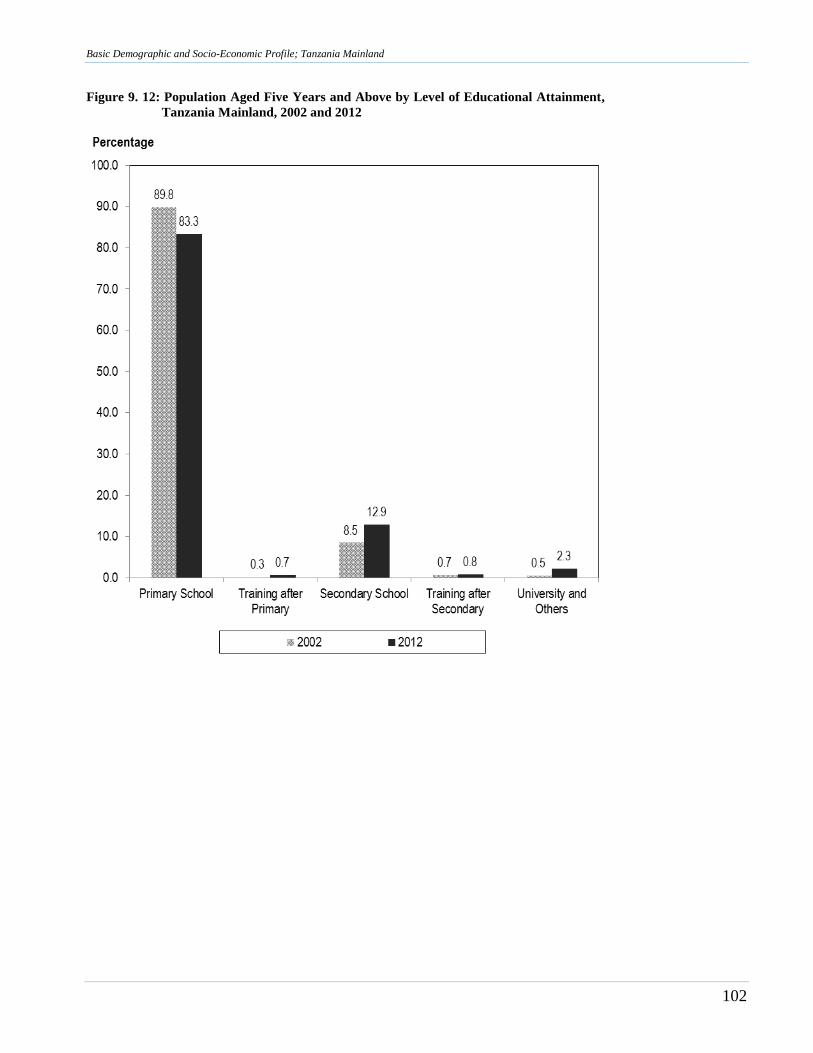
Basic Demographic and Socio-Economic Profile; Tanzania Mainland
102
Figure 9. 12: Population Aged Five Years and Above by Level of Educational Attainment,
Tanzania Mainland, 2002 and 2012

Basic Demographic and Socio-Economic Profile; Tanzania Mainland
103
Chapter Ten
Economic Activity
10. 1 Introduction
The importance of statistical data on economic activities of the population becomes clear when
addressing, among other things, the labour market in the country. For the purposes of economic
planning, it is important to ascertain the size and structure of the labour force and its distribution by
main occupation, industry and employment status. Such information is used by Government and other
stakeholders to plan and implement appropriate programs addressing labour force participation.
The 2012 PHC collected information on both usual and current economic activities. The economic
activity questions were directed to all persons aged 10 years and above from all private households.
In the 2012 PHC, six categories were applied to classify working age groups, five among them
describing the unemployment status and distinguishing unemployment and economically inactive
status. The categories are:-
a) Working
b) Not Working but Looking for Work
c) Not Looking but Available for Work
d) Home Maintenance (cooking or hygiene or caring)
e) Full Time Student
f) Unable to Work (sick or too old or disability)2.
2 Note: Readers should not confuse the unemployed persons stated in this chapter and unemployment rate. For the purpose
of this report, unemployed persons are simply expressed in terms of the total population which is in contrast with
unemployment rate which is normally expressed in terms of the labour force
Unemployed persons
Economically inactive
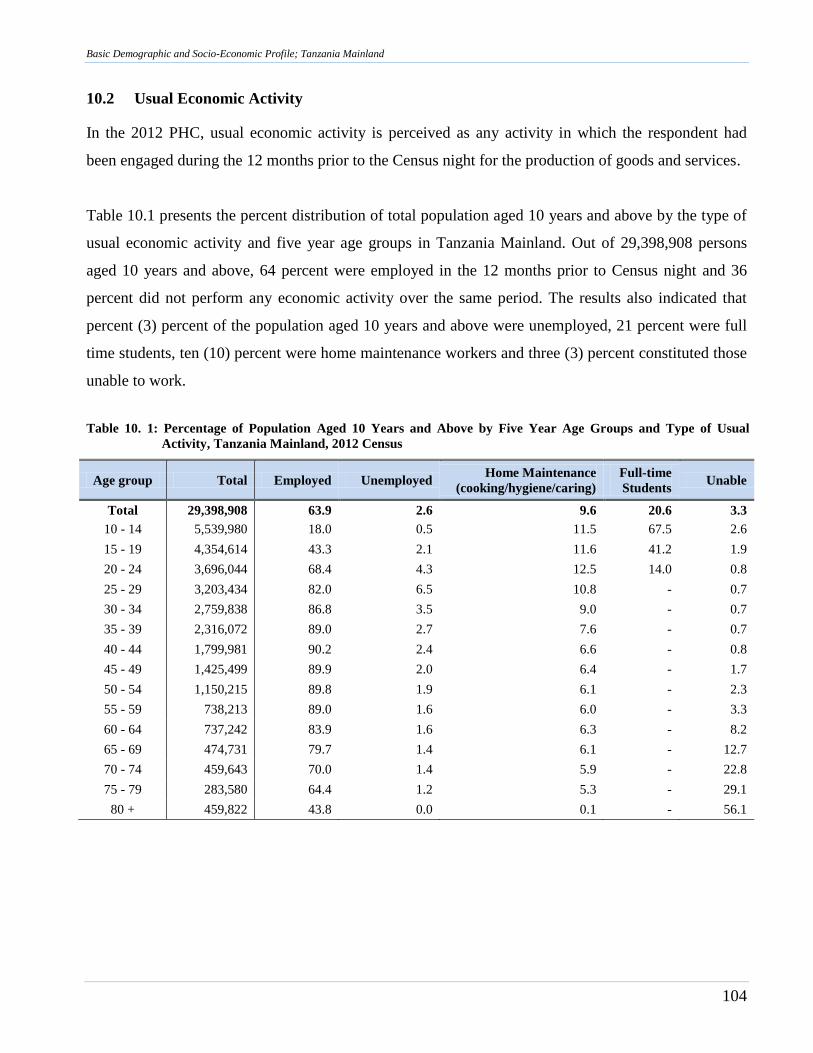
Basic Demographic and Socio-Economic Profile; Tanzania Mainland
104
10.2 Usual Economic Activity
In the 2012 PHC, usual economic activity is perceived as any activity in which the respondent had
been engaged during the 12 months prior to the Census night for the production of goods and services.
Table 10.1 presents the percent distribution of total population aged 10 years and above by the type of
usual economic activity and five year age groups in Tanzania Mainland. Out of 29,398,908 persons
aged 10 years and above, 64 percent were employed in the 12 months prior to Census night and 36
percent did not perform any economic activity over the same period. The results also indicated that
percent (3) percent of the population aged 10 years and above were unemployed, 21 percent were full
time students, ten (10) percent were home maintenance workers and three (3) percent constituted those
unable to work.
Table 10. 1: Percentage of Population Aged 10 Years and Above by Five Year Age Groups and Type of Usual
Activity, Tanzania Mainland, 2012 Census
Age group Total Employed Unemployed Home Maintenance
(cooking/hygiene/caring)
Full-time
Students Unable
Total 29,398,908 63.9 2.6 9.6 20.6 3.3
10 - 14 5,539,980 18.0 0.5 11.5 67.5 2.6
15 - 19 4,354,614 43.3 2.1 11.6 41.2 1.9
20 - 24 3,696,044 68.4 4.3 12.5 14.0 0.8
25 - 29 3,203,434 82.0 6.5 10.8 - 0.7
30 - 34 2,759,838 86.8 3.5 9.0 - 0.7
35 - 39 2,316,072 89.0 2.7 7.6 - 0.7
40 - 44 1,799,981 90.2 2.4 6.6 - 0.8
45 - 49 1,425,499 89.9 2.0 6.4 - 1.7
50 - 54 1,150,215 89.8 1.9 6.1 - 2.3
55 - 59 738,213 89.0 1.6 6.0 - 3.3
60 - 64 737,242 83.9 1.6 6.3 - 8.2
65 - 69 474,731 79.7 1.4 6.1 - 12.7
70 - 74 459,643 70.0 1.4 5.9 - 22.8
75 - 79 283,580 64.4 1.2 5.3 - 29.1
80 + 459,822 43.8 0.0 0.1 - 56.1
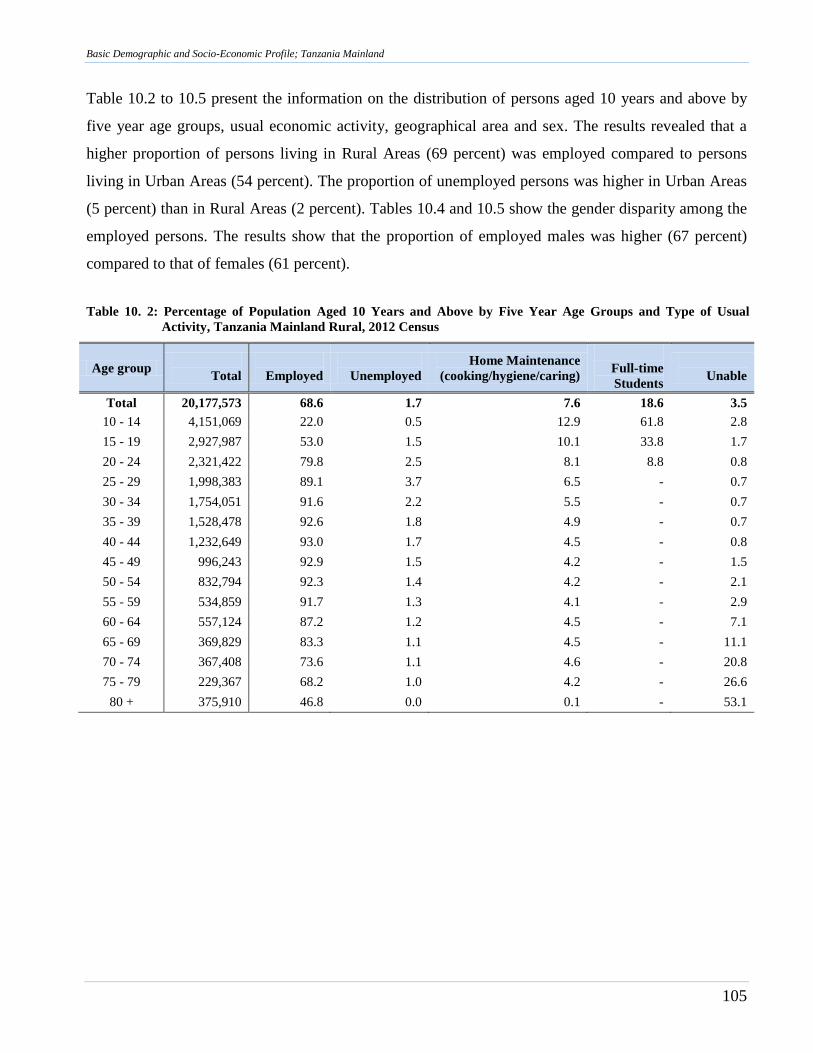
Basic Demographic and Socio-Economic Profile; Tanzania Mainland
105
Table 10.2 to 10.5 present the information on the distribution of persons aged 10 years and above by
five year age groups, usual economic activity, geographical area and sex. The results revealed that a
higher proportion of persons living in Rural Areas (69 percent) was employed compared to persons
living in Urban Areas (54 percent). The proportion of unemployed persons was higher in Urban Areas
(5 percent) than in Rural Areas (2 percent). Tables 10.4 and 10.5 show the gender disparity among the
employed persons. The results show that the proportion of employed males was higher (67 percent)
compared to that of females (61 percent).
Table 10. 2: Percentage of Population Aged 10 Years and Above by Five Year Age Groups and Type of Usual
Activity, Tanzania Mainland Rural, 2012 Census
Age group
Total
Employed
Unemployed
Home Maintenance
(cooking/hygiene/caring)
Full-time
Students
Unable
Total 20,177,573 68.6 1.7 7.6 18.6 3.5
10 - 14 4,151,069 22.0 0.5 12.9 61.8 2.8
15 - 19 2,927,987 53.0 1.5 10.1 33.8 1.7
20 - 24 2,321,422 79.8 2.5 8.1 8.8 0.8
25 - 29 1,998,383 89.1 3.7 6.5 - 0.7
30 - 34 1,754,051 91.6 2.2 5.5 - 0.7
35 - 39 1,528,478 92.6 1.8 4.9 - 0.7
40 - 44 1,232,649 93.0 1.7 4.5 - 0.8
45 - 49 996,243 92.9 1.5 4.2 - 1.5
50 - 54 832,794 92.3 1.4 4.2 - 2.1
55 - 59 534,859 91.7 1.3 4.1 - 2.9
60 - 64 557,124 87.2 1.2 4.5 - 7.1
65 - 69 369,829 83.3 1.1 4.5 - 11.1
70 - 74 367,408 73.6 1.1 4.6 - 20.8
75 - 79 229,367 68.2 1.0 4.2 - 26.6
80 + 375,910 46.8 0.0 0.1 - 53.1
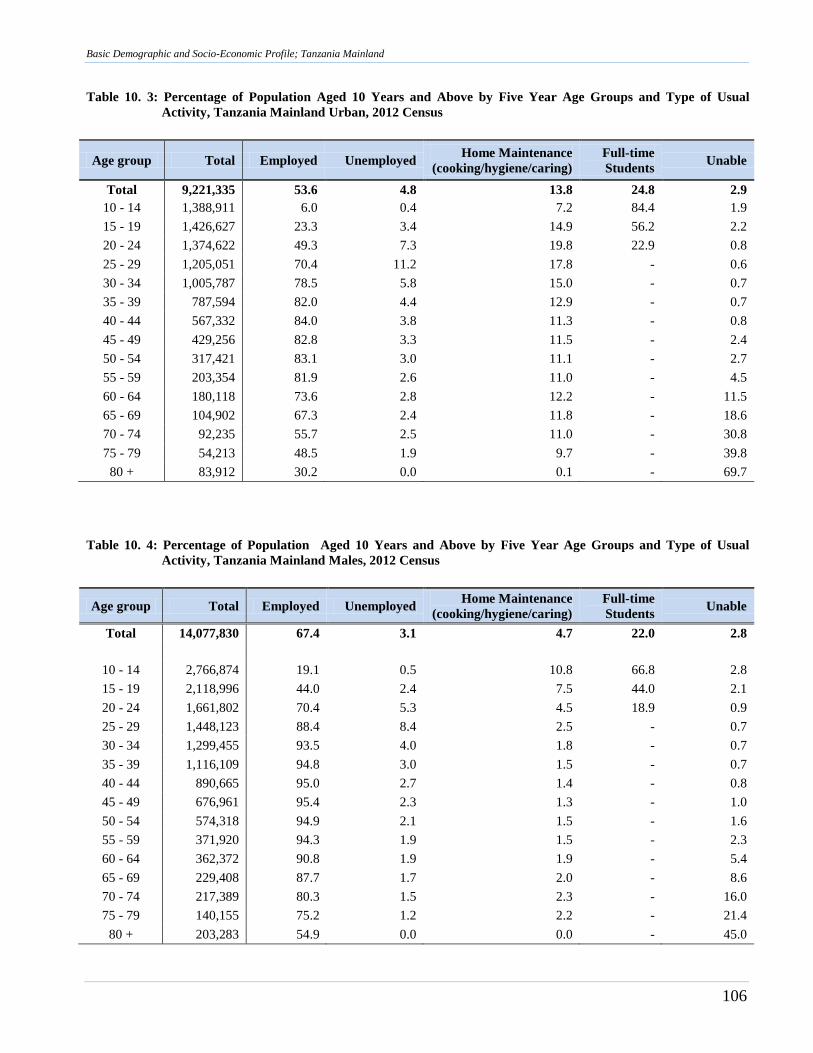
Basic Demographic and Socio-Economic Profile; Tanzania Mainland
106
Table 10. 3: Percentage of Population Aged 10 Years and Above by Five Year Age Groups and Type of Usual
Activity, Tanzania Mainland Urban, 2012 Census
Age group Total Employed Unemployed Home Maintenance
(cooking/hygiene/caring)
Full-time
Students Unable
Total 9,221,335 53.6 4.8 13.8 24.8 2.9
10 - 14 1,388,911 6.0 0.4 7.2 84.4 1.9
15 - 19 1,426,627 23.3 3.4 14.9 56.2 2.2
20 - 24 1,374,622 49.3 7.3 19.8 22.9 0.8
25 - 29 1,205,051 70.4 11.2 17.8 - 0.6
30 - 34 1,005,787 78.5 5.8 15.0 - 0.7
35 - 39 787,594 82.0 4.4 12.9 - 0.7
40 - 44 567,332 84.0 3.8 11.3 - 0.8
45 - 49 429,256 82.8 3.3 11.5 - 2.4
50 - 54 317,421 83.1 3.0 11.1 - 2.7
55 - 59 203,354 81.9 2.6 11.0 - 4.5
60 - 64 180,118 73.6 2.8 12.2 - 11.5
65 - 69 104,902 67.3 2.4 11.8 - 18.6
70 - 74 92,235 55.7 2.5 11.0 - 30.8
75 - 79 54,213 48.5 1.9 9.7 - 39.8
80 + 83,912 30.2 0.0 0.1 - 69.7
Table 10. 4: Percentage of Population Aged 10 Years and Above by Five Year Age Groups and Type of Usual
Activity, Tanzania Mainland Males, 2012 Census
Age group Total Employed Unemployed Home Maintenance
(cooking/hygiene/caring)
Full-time
Students Unable
Total 14,077,830 67.4 3.1 4.7 22.0 2.8
10 - 14 2,766,874 19.1 0.5 10.8 66.8 2.8
15 - 19 2,118,996 44.0 2.4 7.5 44.0 2.1
20 - 24 1,661,802 70.4 5.3 4.5 18.9 0.9
25 - 29 1,448,123 88.4 8.4 2.5 - 0.7
30 - 34 1,299,455 93.5 4.0 1.8 - 0.7
35 - 39 1,116,109 94.8 3.0 1.5 - 0.7
40 - 44 890,665 95.0 2.7 1.4 - 0.8
45 - 49 676,961 95.4 2.3 1.3 - 1.0
50 - 54 574,318 94.9 2.1 1.5 - 1.6
55 - 59 371,920 94.3 1.9 1.5 - 2.3
60 - 64 362,372 90.8 1.9 1.9 - 5.4
65 - 69 229,408 87.7 1.7 2.0 - 8.6
70 - 74 217,389 80.3 1.5 2.3 - 16.0
75 - 79 140,155 75.2 1.2 2.2 - 21.4
80 + 203,283 54.9 0.0 0.0 - 45.0
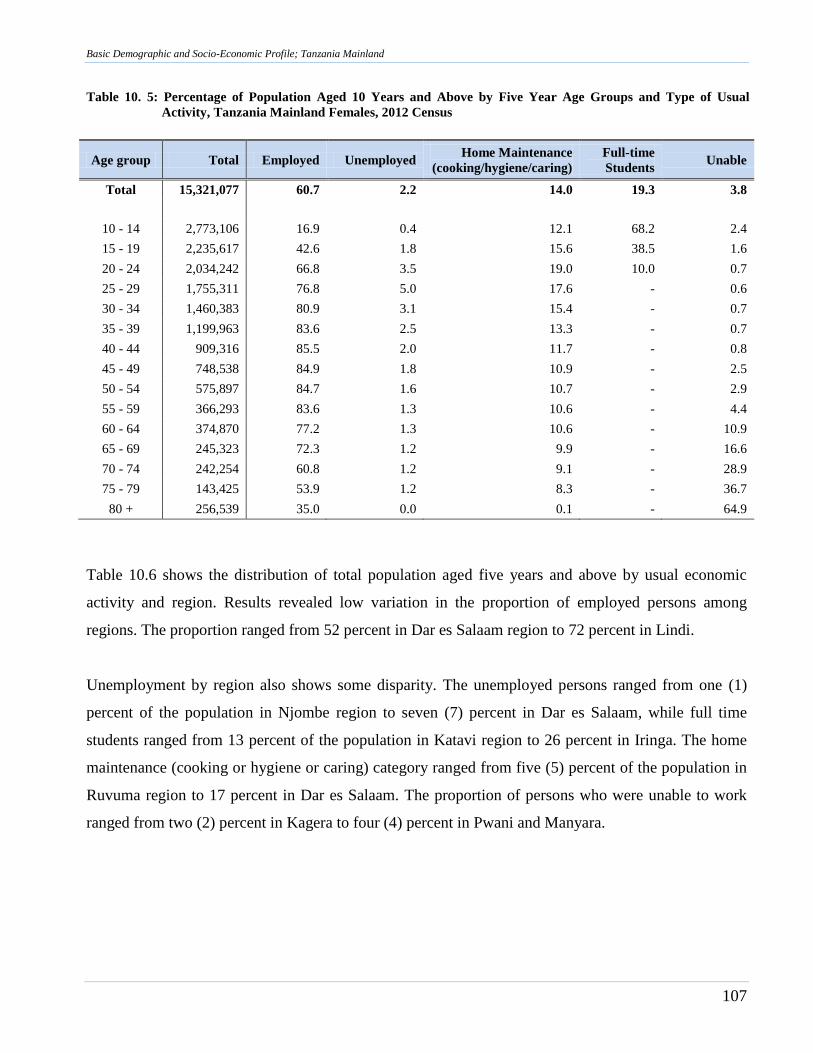
Basic Demographic and Socio-Economic Profile; Tanzania Mainland
107
Table 10. 5: Percentage of Population Aged 10 Years and Above by Five Year Age Groups and Type of Usual
Activity, Tanzania Mainland Females, 2012 Census
Age group Total Employed Unemployed Home Maintenance
(cooking/hygiene/caring)
Full-time
Students Unable
Total 15,321,077 60.7 2.2 14.0 19.3 3.8
10 - 14 2,773,106 16.9 0.4 12.1 68.2 2.4
15 - 19 2,235,617 42.6 1.8 15.6 38.5 1.6
20 - 24 2,034,242 66.8 3.5 19.0 10.0 0.7
25 - 29 1,755,311 76.8 5.0 17.6 - 0.6
30 - 34 1,460,383 80.9 3.1 15.4 - 0.7
35 - 39 1,199,963 83.6 2.5 13.3 - 0.7
40 - 44 909,316 85.5 2.0 11.7 - 0.8
45 - 49 748,538 84.9 1.8 10.9 - 2.5
50 - 54 575,897 84.7 1.6 10.7 - 2.9
55 - 59 366,293 83.6 1.3 10.6 - 4.4
60 - 64 374,870 77.2 1.3 10.6 - 10.9
65 - 69 245,323 72.3 1.2 9.9 - 16.6
70 - 74 242,254 60.8 1.2 9.1 - 28.9
75 - 79 143,425 53.9 1.2 8.3 - 36.7
80 + 256,539 35.0 0.0 0.1 - 64.9
Table 10.6 shows the distribution of total population aged five years and above by usual economic
activity and region. Results revealed low variation in the proportion of employed persons among
regions. The proportion ranged from 52 percent in Dar es Salaam region to 72 percent in Lindi.
Unemployment by region also shows some disparity. The unemployed persons ranged from one (1)
percent of the population in Njombe region to seven (7) percent in Dar es Salaam, while full time
students ranged from 13 percent of the population in Katavi region to 26 percent in Iringa. The home
maintenance (cooking or hygiene or caring) category ranged from five (5) percent of the population in
Ruvuma region to 17 percent in Dar es Salaam. The proportion of persons who were unable to work
ranged from two (2) percent in Kagera to four (4) percent in Pwani and Manyara.
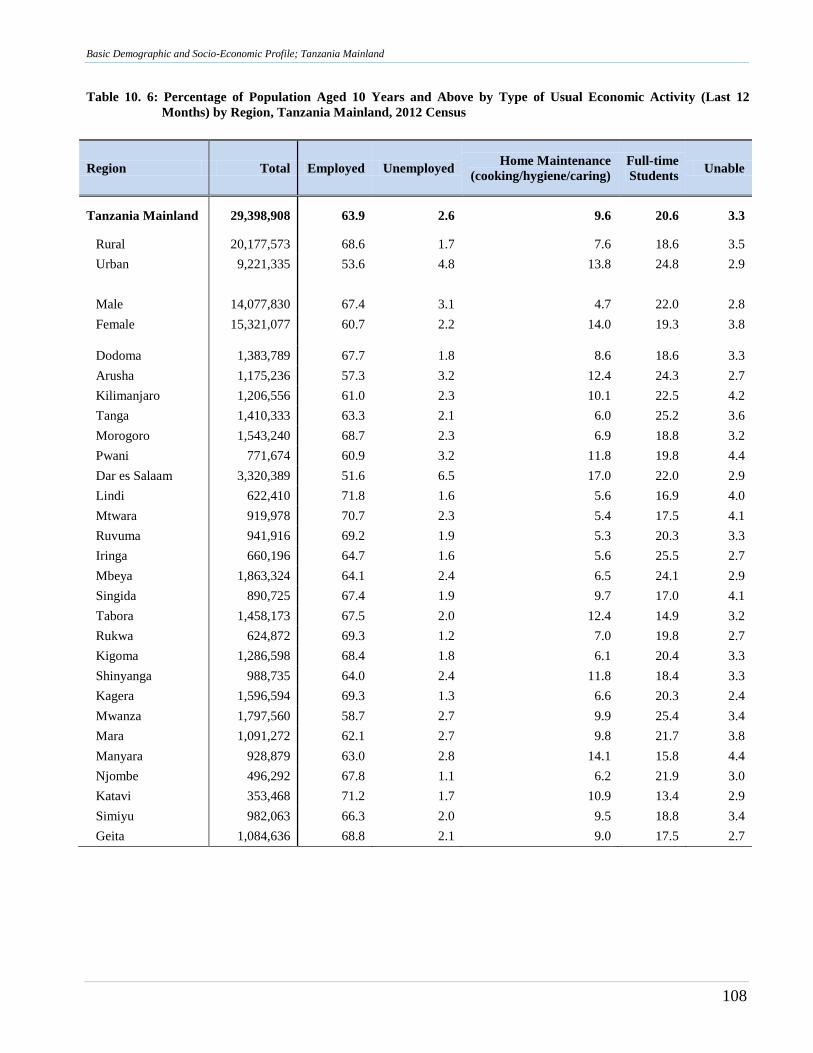
Basic Demographic and Socio-Economic Profile; Tanzania Mainland
108
Table 10. 6: Percentage of Population Aged 10 Years and Above by Type of Usual Economic Activity (Last 12
Months) by Region, Tanzania Mainland, 2012 Census
Region Total Employed Unemployed Home Maintenance
(cooking/hygiene/caring)
Full-time
Students Unable
Tanzania Mainland 29,398,908 63.9 2.6 9.6 20.6 3.3
Rural 20,177,573 68.6 1.7 7.6 18.6 3.5
Urban 9,221,335 53.6 4.8 13.8 24.8 2.9
Male 14,077,830 67.4 3.1 4.7 22.0 2.8
Female 15,321,077 60.7 2.2 14.0 19.3 3.8
Dodoma 1,383,789 67.7 1.8 8.6 18.6 3.3
Arusha 1,175,236 57.3 3.2 12.4 24.3 2.7
Kilimanjaro 1,206,556 61.0 2.3 10.1 22.5 4.2
Tanga 1,410,333 63.3 2.1 6.0 25.2 3.6
Morogoro 1,543,240 68.7 2.3 6.9 18.8 3.2
Pwani 771,674 60.9 3.2 11.8 19.8 4.4
Dar es Salaam 3,320,389 51.6 6.5 17.0 22.0 2.9
Lindi 622,410 71.8 1.6 5.6 16.9 4.0
Mtwara 919,978 70.7 2.3 5.4 17.5 4.1
Ruvuma 941,916 69.2 1.9 5.3 20.3 3.3
Iringa 660,196 64.7 1.6 5.6 25.5 2.7
Mbeya 1,863,324 64.1 2.4 6.5 24.1 2.9
Singida 890,725 67.4 1.9 9.7 17.0 4.1
Tabora 1,458,173 67.5 2.0 12.4 14.9 3.2
Rukwa 624,872 69.3 1.2 7.0 19.8 2.7
Kigoma 1,286,598 68.4 1.8 6.1 20.4 3.3
Shinyanga 988,735 64.0 2.4 11.8 18.4 3.3
Kagera 1,596,594 69.3 1.3 6.6 20.3 2.4
Mwanza 1,797,560 58.7 2.7 9.9 25.4 3.4
Mara 1,091,272 62.1 2.7 9.8 21.7 3.8
Manyara 928,879 63.0 2.8 14.1 15.8 4.4
Njombe 496,292 67.8 1.1 6.2 21.9 3.0
Katavi 353,468 71.2 1.7 10.9 13.4 2.9
Simiyu 982,063 66.3 2.0 9.5 18.8 3.4
Geita 1,084,636 68.8 2.1 9.0 17.5 2.7
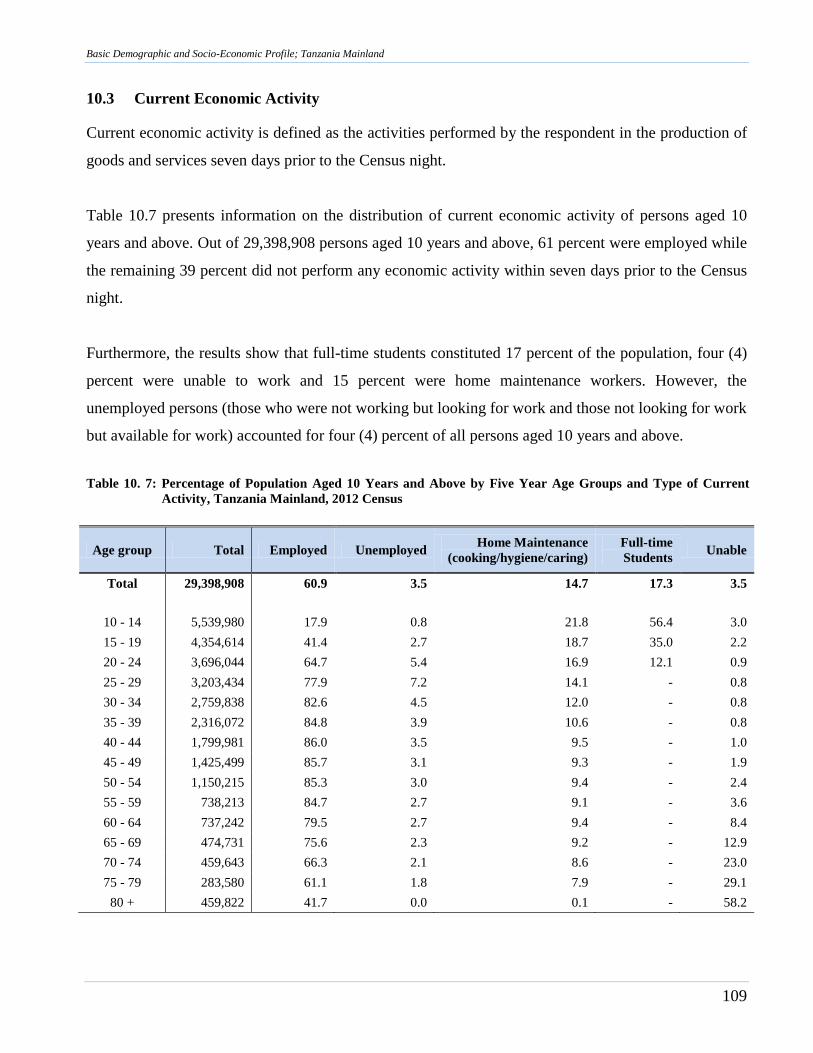
Basic Demographic and Socio-Economic Profile; Tanzania Mainland
109
10.3 Current Economic Activity
Current economic activity is defined as the activities performed by the respondent in the production of
goods and services seven days prior to the Census night.
Table 10.7 presents information on the distribution of current economic activity of persons aged 10
years and above. Out of 29,398,908 persons aged 10 years and above, 61 percent were employed while
the remaining 39 percent did not perform any economic activity within seven days prior to the Census
night.
Furthermore, the results show that full-time students constituted 17 percent of the population, four (4)
percent were unable to work and 15 percent were home maintenance workers. However, the
unemployed persons (those who were not working but looking for work and those not looking for work
but available for work) accounted for four (4) percent of all persons aged 10 years and above.
Table 10. 7: Percentage of Population Aged 10 Years and Above by Five Year Age Groups and Type of Current
Activity, Tanzania Mainland, 2012 Census
Age group Total Employed Unemployed Home Maintenance
(cooking/hygiene/caring)
Full-time
Students Unable
Total 29,398,908 60.9 3.5 14.7 17.3 3.5
10 - 14 5,539,980 17.9 0.8 21.8 56.4 3.0
15 - 19 4,354,614 41.4 2.7 18.7 35.0 2.2
20 - 24 3,696,044 64.7 5.4 16.9 12.1 0.9
25 - 29 3,203,434 77.9 7.2 14.1 - 0.8
30 - 34 2,759,838 82.6 4.5 12.0 - 0.8
35 - 39 2,316,072 84.8 3.9 10.6 - 0.8
40 - 44 1,799,981 86.0 3.5 9.5 - 1.0
45 - 49 1,425,499 85.7 3.1 9.3 - 1.9
50 - 54 1,150,215 85.3 3.0 9.4 - 2.4
55 - 59 738,213 84.7 2.7 9.1 - 3.6
60 - 64 737,242 79.5 2.7 9.4 - 8.4
65 - 69 474,731 75.6 2.3 9.2 - 12.9
70 - 74 459,643 66.3 2.1 8.6 - 23.0
75 - 79 283,580 61.1 1.8 7.9 - 29.1
80 + 459,822 41.7 0.0 0.1 - 58.2
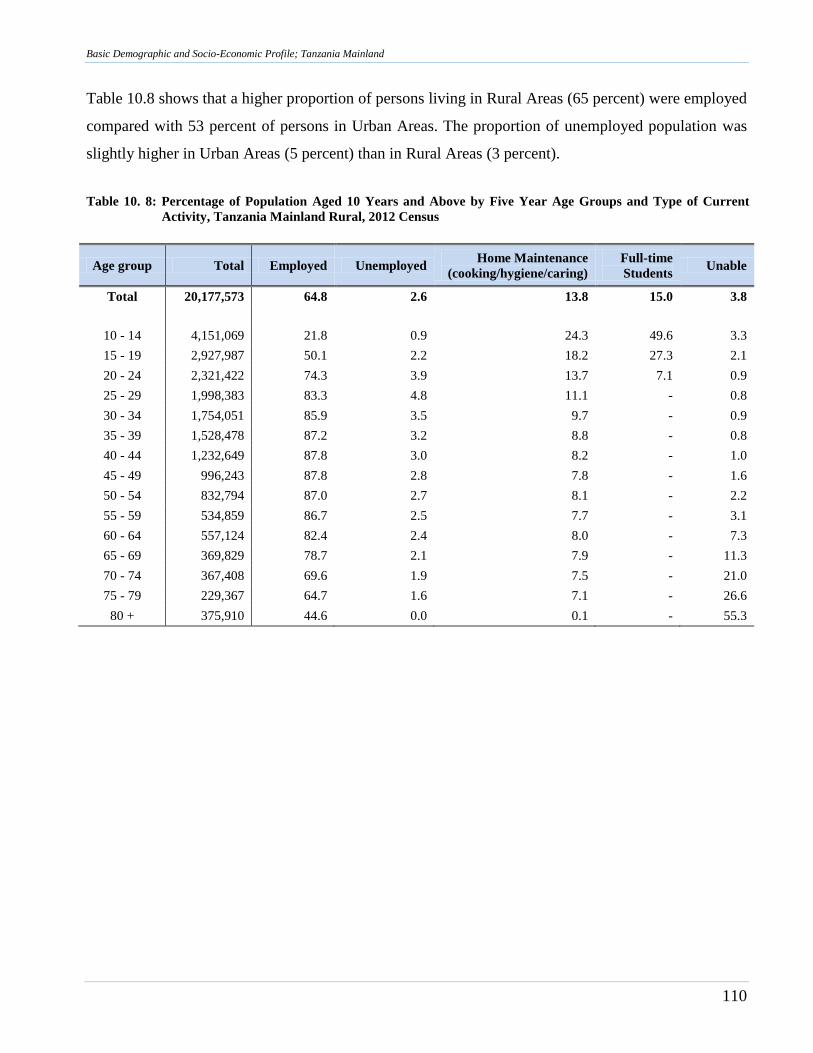
Basic Demographic and Socio-Economic Profile; Tanzania Mainland
110
Table 10.8 shows that a higher proportion of persons living in Rural Areas (65 percent) were employed
compared with 53 percent of persons in Urban Areas. The proportion of unemployed population was
slightly higher in Urban Areas (5 percent) than in Rural Areas (3 percent).
Table 10. 8: Percentage of Population Aged 10 Years and Above by Five Year Age Groups and Type of Current
Activity, Tanzania Mainland Rural, 2012 Census
Age group Total Employed Unemployed Home Maintenance
(cooking/hygiene/caring)
Full-time
Students Unable
Total 20,177,573 64.8 2.6 13.8 15.0 3.8
10 - 14 4,151,069 21.8 0.9 24.3 49.6 3.3
15 - 19 2,927,987 50.1 2.2 18.2 27.3 2.1
20 - 24 2,321,422 74.3 3.9 13.7 7.1 0.9
25 - 29 1,998,383 83.3 4.8 11.1 - 0.8
30 - 34 1,754,051 85.9 3.5 9.7 - 0.9
35 - 39 1,528,478 87.2 3.2 8.8 - 0.8
40 - 44 1,232,649 87.8 3.0 8.2 - 1.0
45 - 49 996,243 87.8 2.8 7.8 - 1.6
50 - 54 832,794 87.0 2.7 8.1 - 2.2
55 - 59 534,859 86.7 2.5 7.7 - 3.1
60 - 64 557,124 82.4 2.4 8.0 - 7.3
65 - 69 369,829 78.7 2.1 7.9 - 11.3
70 - 74 367,408 69.6 1.9 7.5 - 21.0
75 - 79 229,367 64.7 1.6 7.1 - 26.6
80 + 375,910 44.6 0.0 0.1 - 55.3
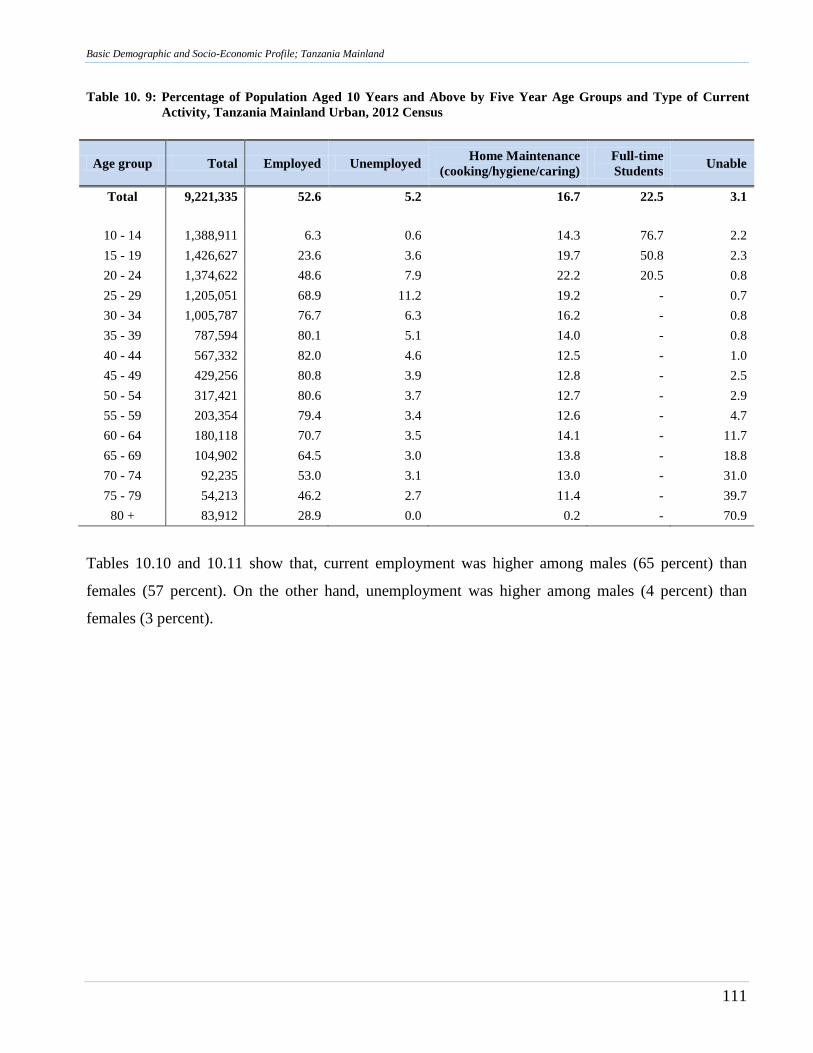
Basic Demographic and Socio-Economic Profile; Tanzania Mainland
111
Table 10. 9: Percentage of Population Aged 10 Years and Above by Five Year Age Groups and Type of Current
Activity, Tanzania Mainland Urban, 2012 Census
Age group Total Employed Unemployed Home Maintenance
(cooking/hygiene/caring)
Full-time
Students Unable
Total 9,221,335 52.6 5.2 16.7 22.5 3.1
10 - 14 1,388,911 6.3 0.6 14.3 76.7 2.2
15 - 19 1,426,627 23.6 3.6 19.7 50.8 2.3
20 - 24 1,374,622 48.6 7.9 22.2 20.5 0.8
25 - 29 1,205,051 68.9 11.2 19.2 - 0.7
30 - 34 1,005,787 76.7 6.3 16.2 - 0.8
35 - 39 787,594 80.1 5.1 14.0 - 0.8
40 - 44 567,332 82.0 4.6 12.5 - 1.0
45 - 49 429,256 80.8 3.9 12.8 - 2.5
50 - 54 317,421 80.6 3.7 12.7 - 2.9
55 - 59 203,354 79.4 3.4 12.6 - 4.7
60 - 64 180,118 70.7 3.5 14.1 - 11.7
65 - 69 104,902 64.5 3.0 13.8 - 18.8
70 - 74 92,235 53.0 3.1 13.0 - 31.0
75 - 79 54,213 46.2 2.7 11.4 - 39.7
80 + 83,912 28.9 0.0 0.2 - 70.9
Tables 10.10 and 10.11 show that, current employment was higher among males (65 percent) than
females (57 percent). On the other hand, unemployment was higher among males (4 percent) than
females (3 percent).
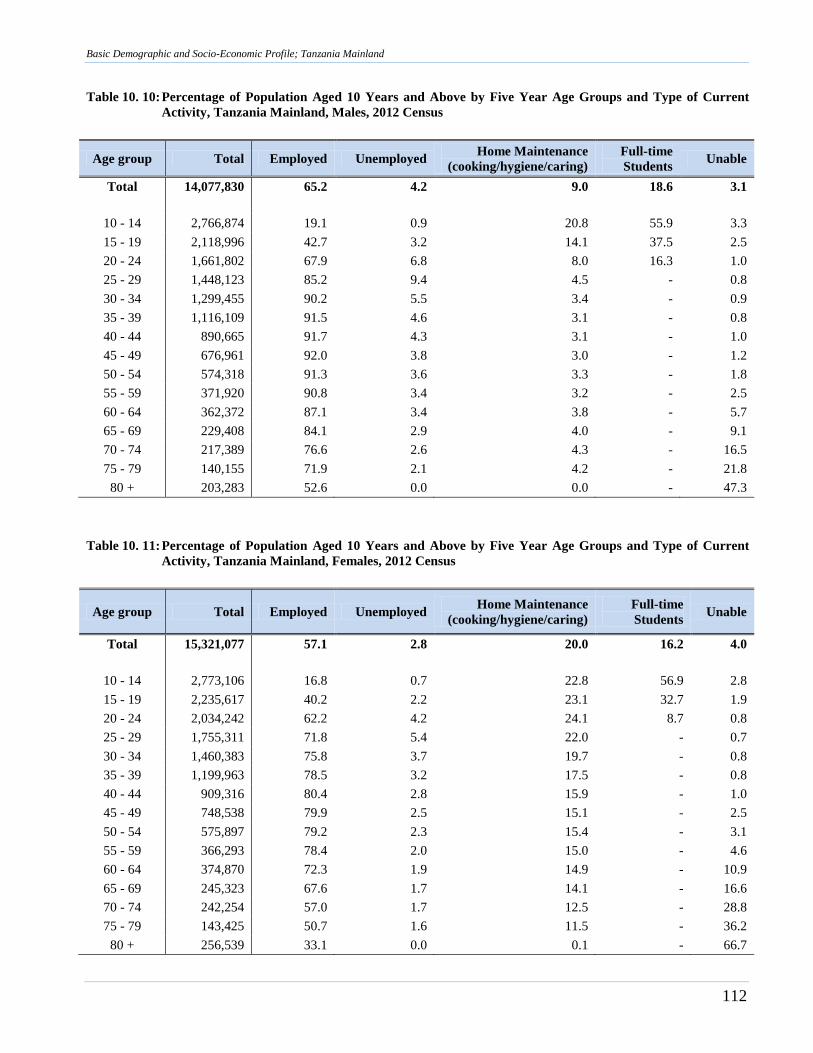
Basic Demographic and Socio-Economic Profile; Tanzania Mainland
112
Table 10. 10: Percentage of Population Aged 10 Years and Above by Five Year Age Groups and Type of Current
Activity, Tanzania Mainland, Males, 2012 Census
Age group Total Employed Unemployed Home Maintenance
(cooking/hygiene/caring)
Full-time
Students Unable
Total 14,077,830 65.2 4.2 9.0 18.6 3.1
10 - 14 2,766,874 19.1 0.9 20.8 55.9 3.3
15 - 19 2,118,996 42.7 3.2 14.1 37.5 2.5
20 - 24 1,661,802 67.9 6.8 8.0 16.3 1.0
25 - 29 1,448,123 85.2 9.4 4.5 - 0.8
30 - 34 1,299,455 90.2 5.5 3.4 - 0.9
35 - 39 1,116,109 91.5 4.6 3.1 - 0.8
40 - 44 890,665 91.7 4.3 3.1 - 1.0
45 - 49 676,961 92.0 3.8 3.0 - 1.2
50 - 54 574,318 91.3 3.6 3.3 - 1.8
55 - 59 371,920 90.8 3.4 3.2 - 2.5
60 - 64 362,372 87.1 3.4 3.8 - 5.7
65 - 69 229,408 84.1 2.9 4.0 - 9.1
70 - 74 217,389 76.6 2.6 4.3 - 16.5
75 - 79 140,155 71.9 2.1 4.2 - 21.8
80 + 203,283 52.6 0.0 0.0 - 47.3
Table 10. 11: Percentage of Population Aged 10 Years and Above by Five Year Age Groups and Type of Current
Activity, Tanzania Mainland, Females, 2012 Census
Age group Total Employed Unemployed Home Maintenance
(cooking/hygiene/caring)
Full-time
Students Unable
Total 15,321,077 57.1 2.8 20.0 16.2 4.0
10 - 14 2,773,106 16.8 0.7 22.8 56.9 2.8
15 - 19 2,235,617 40.2 2.2 23.1 32.7 1.9
20 - 24 2,034,242 62.2 4.2 24.1 8.7 0.8
25 - 29 1,755,311 71.8 5.4 22.0 - 0.7
30 - 34 1,460,383 75.8 3.7 19.7 - 0.8
35 - 39 1,199,963 78.5 3.2 17.5 - 0.8
40 - 44 909,316 80.4 2.8 15.9 - 1.0
45 - 49 748,538 79.9 2.5 15.1 - 2.5
50 - 54 575,897 79.2 2.3 15.4 - 3.1
55 - 59 366,293 78.4 2.0 15.0 - 4.6
60 - 64 374,870 72.3 1.9 14.9 - 10.9
65 - 69 245,323 67.6 1.7 14.1 - 16.6
70 - 74 242,254 57.0 1.7 12.5 - 28.8
75 - 79 143,425 50.7 1.6 11.5 - 36.2
80 + 256,539 33.1 0.0 0.1 - 66.7
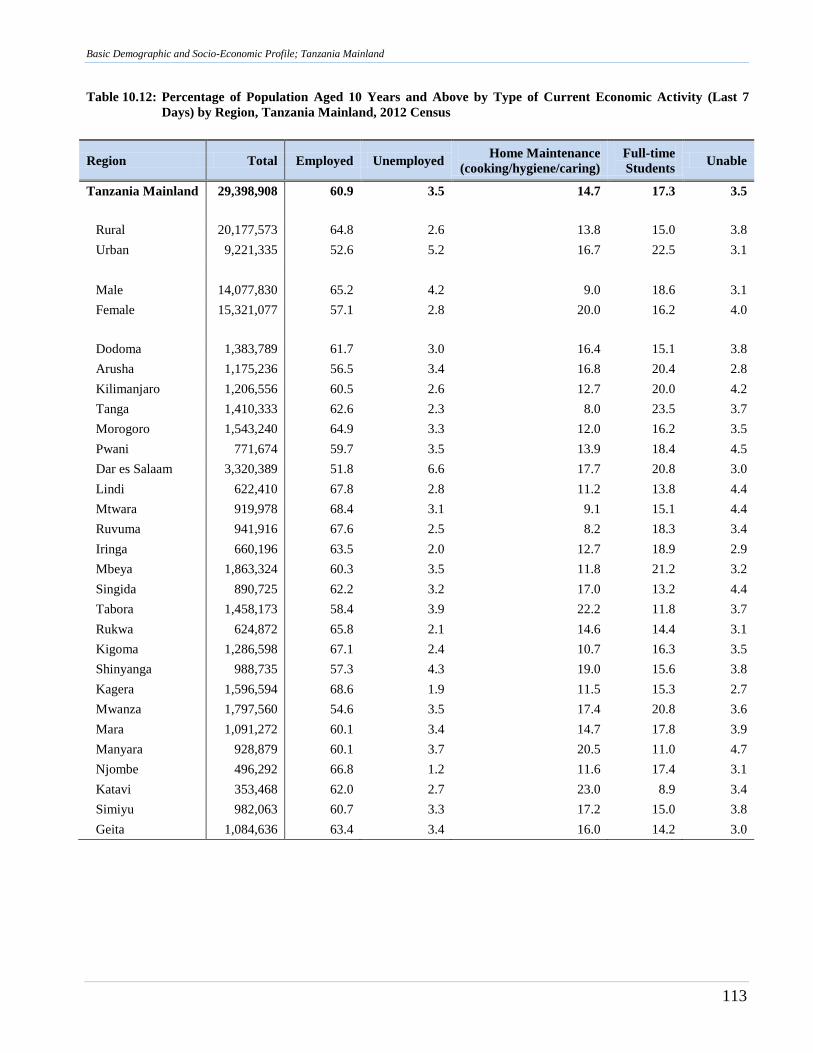
Basic Demographic and Socio-Economic Profile; Tanzania Mainland
113
Table 10.12: Percentage of Population Aged 10 Years and Above by Type of Current Economic Activity (Last 7
Days) by Region, Tanzania Mainland, 2012 Census
Region Total Employed Unemployed Home Maintenance
(cooking/hygiene/caring)
Full-time
Students Unable
Tanzania Mainland 29,398,908 60.9 3.5 14.7 17.3 3.5
Rural 20,177,573 64.8 2.6 13.8 15.0 3.8
Urban 9,221,335 52.6 5.2 16.7 22.5 3.1
Male 14,077,830 65.2 4.2 9.0 18.6 3.1
Female 15,321,077 57.1 2.8 20.0 16.2 4.0
Dodoma 1,383,789 61.7 3.0 16.4 15.1 3.8
Arusha 1,175,236 56.5 3.4 16.8 20.4 2.8
Kilimanjaro 1,206,556 60.5 2.6 12.7 20.0 4.2
Tanga 1,410,333 62.6 2.3 8.0 23.5 3.7
Morogoro 1,543,240 64.9 3.3 12.0 16.2 3.5
Pwani 771,674 59.7 3.5 13.9 18.4 4.5
Dar es Salaam 3,320,389 51.8 6.6 17.7 20.8 3.0
Lindi 622,410 67.8 2.8 11.2 13.8 4.4
Mtwara 919,978 68.4 3.1 9.1 15.1 4.4
Ruvuma 941,916 67.6 2.5 8.2 18.3 3.4
Iringa 660,196 63.5 2.0 12.7 18.9 2.9
Mbeya 1,863,324 60.3 3.5 11.8 21.2 3.2
Singida 890,725 62.2 3.2 17.0 13.2 4.4
Tabora 1,458,173 58.4 3.9 22.2 11.8 3.7
Rukwa 624,872 65.8 2.1 14.6 14.4 3.1
Kigoma 1,286,598 67.1 2.4 10.7 16.3 3.5
Shinyanga 988,735 57.3 4.3 19.0 15.6 3.8
Kagera 1,596,594 68.6 1.9 11.5 15.3 2.7
Mwanza 1,797,560 54.6 3.5 17.4 20.8 3.6
Mara 1,091,272 60.1 3.4 14.7 17.8 3.9
Manyara 928,879 60.1 3.7 20.5 11.0 4.7
Njombe 496,292 66.8 1.2 11.6 17.4 3.1
Katavi 353,468 62.0 2.7 23.0 8.9 3.4
Simiyu 982,063 60.7 3.3 17.2 15.0 3.8
Geita 1,084,636 63.4 3.4 16.0 14.2 3.0
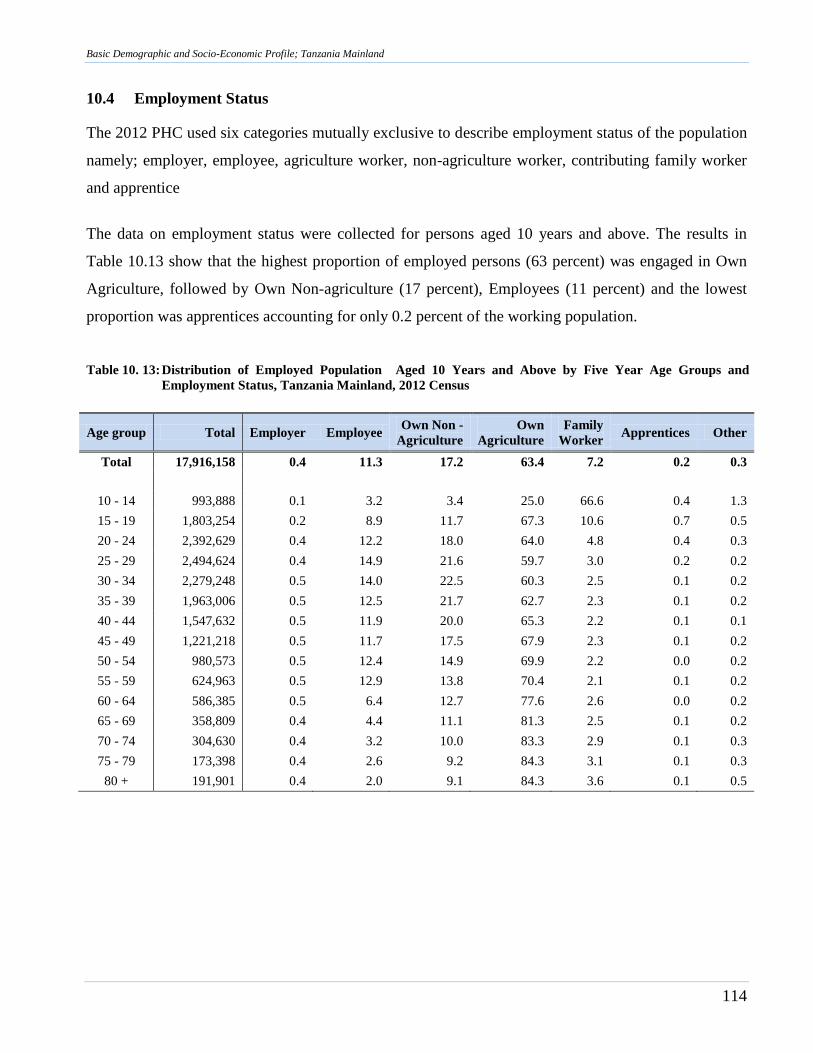
Basic Demographic and Socio-Economic Profile; Tanzania Mainland
114
10.4 Employment Status
The 2012 PHC used six categories mutually exclusive to describe employment status of the population
namely; employer, employee, agriculture worker, non-agriculture worker, contributing family worker
and apprentice
The data on employment status were collected for persons aged 10 years and above. The results in
Table 10.13 show that the highest proportion of employed persons (63 percent) was engaged in Own
Agriculture, followed by Own Non-agriculture (17 percent), Employees (11 percent) and the lowest
proportion was apprentices accounting for only 0.2 percent of the working population.
Table 10. 13: Distribution of Employed Population Aged 10 Years and Above by Five Year Age Groups and
Employment Status, Tanzania Mainland, 2012 Census
Age group Total Employer Employee Own Non -
Agriculture
Own
Agriculture
Family
Worker Apprentices Other
Total 17,916,158 0.4 11.3 17.2 63.4 7.2 0.2 0.3
10 - 14 993,888 0.1 3.2 3.4 25.0 66.6 0.4 1.3
15 - 19 1,803,254 0.2 8.9 11.7 67.3 10.6 0.7 0.5
20 - 24 2,392,629 0.4 12.2 18.0 64.0 4.8 0.4 0.3
25 - 29 2,494,624 0.4 14.9 21.6 59.7 3.0 0.2 0.2
30 - 34 2,279,248 0.5 14.0 22.5 60.3 2.5 0.1 0.2
35 - 39 1,963,006 0.5 12.5 21.7 62.7 2.3 0.1 0.2
40 - 44 1,547,632 0.5 11.9 20.0 65.3 2.2 0.1 0.1
45 - 49 1,221,218 0.5 11.7 17.5 67.9 2.3 0.1 0.2
50 - 54 980,573 0.5 12.4 14.9 69.9 2.2 0.0 0.2
55 - 59 624,963 0.5 12.9 13.8 70.4 2.1 0.1 0.2
60 - 64 586,385 0.5 6.4 12.7 77.6 2.6 0.0 0.2
65 - 69 358,809 0.4 4.4 11.1 81.3 2.5 0.1 0.2
70 - 74 304,630 0.4 3.2 10.0 83.3 2.9 0.1 0.3
75 - 79 173,398 0.4 2.6 9.2 84.3 3.1 0.1 0.3
80 + 191,901 0.4 2.0 9.1 84.3 3.6 0.1 0.5
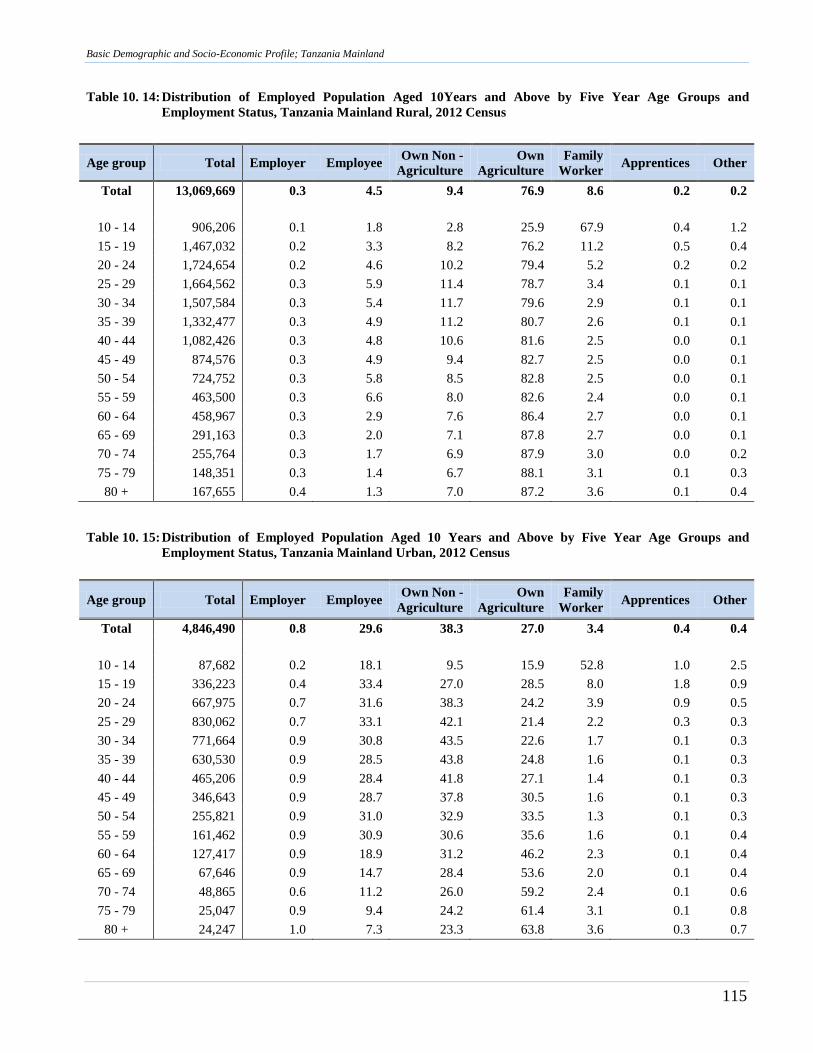
Basic Demographic and Socio-Economic Profile; Tanzania Mainland
115
Table 10. 14: Distribution of Employed Population Aged 10Years and Above by Five Year Age Groups and
Employment Status, Tanzania Mainland Rural, 2012 Census
Age group Total Employer Employee Own Non -
Agriculture
Own
Agriculture
Family
Worker Apprentices Other
Total 13,069,669 0.3 4.5 9.4 76.9 8.6 0.2 0.2
10 - 14 906,206 0.1 1.8 2.8 25.9 67.9 0.4 1.2
15 - 19 1,467,032 0.2 3.3 8.2 76.2 11.2 0.5 0.4
20 - 24 1,724,654 0.2 4.6 10.2 79.4 5.2 0.2 0.2
25 - 29 1,664,562 0.3 5.9 11.4 78.7 3.4 0.1 0.1
30 - 34 1,507,584 0.3 5.4 11.7 79.6 2.9 0.1 0.1
35 - 39 1,332,477 0.3 4.9 11.2 80.7 2.6 0.1 0.1
40 - 44 1,082,426 0.3 4.8 10.6 81.6 2.5 0.0 0.1
45 - 49 874,576 0.3 4.9 9.4 82.7 2.5 0.0 0.1
50 - 54 724,752 0.3 5.8 8.5 82.8 2.5 0.0 0.1
55 - 59 463,500 0.3 6.6 8.0 82.6 2.4 0.0 0.1
60 - 64 458,967 0.3 2.9 7.6 86.4 2.7 0.0 0.1
65 - 69 291,163 0.3 2.0 7.1 87.8 2.7 0.0 0.1
70 - 74 255,764 0.3 1.7 6.9 87.9 3.0 0.0 0.2
75 - 79 148,351 0.3 1.4 6.7 88.1 3.1 0.1 0.3
80 + 167,655 0.4 1.3 7.0 87.2 3.6 0.1 0.4
Table 10. 15: Distribution of Employed Population Aged 10 Years and Above by Five Year Age Groups and
Employment Status, Tanzania Mainland Urban, 2012 Census
Age group Total Employer Employee Own Non -
Agriculture
Own
Agriculture
Family
Worker Apprentices Other
Total 4,846,490 0.8 29.6 38.3 27.0 3.4 0.4 0.4
10 - 14 87,682 0.2 18.1 9.5 15.9 52.8 1.0 2.5
15 - 19 336,223 0.4 33.4 27.0 28.5 8.0 1.8 0.9
20 - 24 667,975 0.7 31.6 38.3 24.2 3.9 0.9 0.5
25 - 29 830,062 0.7 33.1 42.1 21.4 2.2 0.3 0.3
30 - 34 771,664 0.9 30.8 43.5 22.6 1.7 0.1 0.3
35 - 39 630,530 0.9 28.5 43.8 24.8 1.6 0.1 0.3
40 - 44 465,206 0.9 28.4 41.8 27.1 1.4 0.1 0.3
45 - 49 346,643 0.9 28.7 37.8 30.5 1.6 0.1 0.3
50 - 54 255,821 0.9 31.0 32.9 33.5 1.3 0.1 0.3
55 - 59 161,462 0.9 30.9 30.6 35.6 1.6 0.1 0.4
60 - 64 127,417 0.9 18.9 31.2 46.2 2.3 0.1 0.4
65 - 69 67,646 0.9 14.7 28.4 53.6 2.0 0.1 0.4
70 - 74 48,865 0.6 11.2 26.0 59.2 2.4 0.1 0.6
75 - 79 25,047 0.9 9.4 24.2 61.4 3.1 0.1 0.8
80 + 24,247 1.0 7.3 23.3 63.8 3.6 0.3 0.7
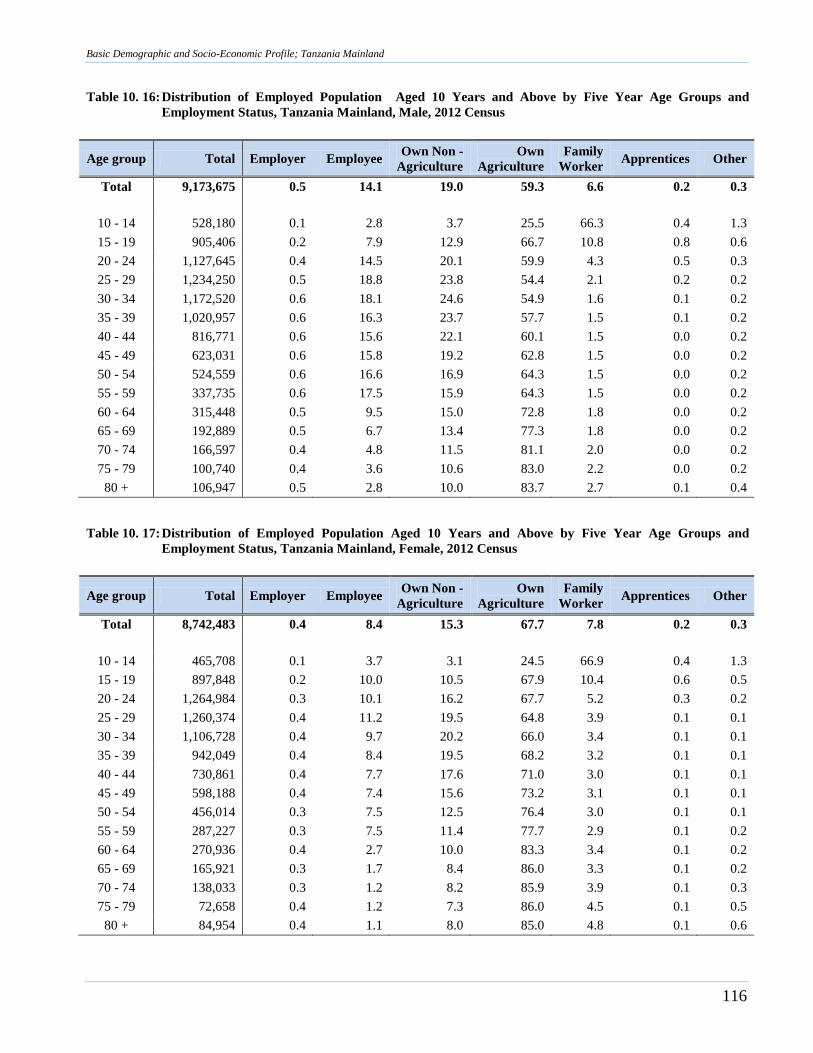
Basic Demographic and Socio-Economic Profile; Tanzania Mainland
116
Table 10. 16: Distribution of Employed Population Aged 10 Years and Above by Five Year Age Groups and
Employment Status, Tanzania Mainland, Male, 2012 Census
Age group Total Employer Employee Own Non -
Agriculture
Own
Agriculture
Family
Worker Apprentices Other
Total 9,173,675 0.5 14.1 19.0 59.3 6.6 0.2 0.3
10 - 14 528,180 0.1 2.8 3.7 25.5 66.3 0.4 1.3
15 - 19 905,406 0.2 7.9 12.9 66.7 10.8 0.8 0.6
20 - 24 1,127,645 0.4 14.5 20.1 59.9 4.3 0.5 0.3
25 - 29 1,234,250 0.5 18.8 23.8 54.4 2.1 0.2 0.2
30 - 34 1,172,520 0.6 18.1 24.6 54.9 1.6 0.1 0.2
35 - 39 1,020,957 0.6 16.3 23.7 57.7 1.5 0.1 0.2
40 - 44 816,771 0.6 15.6 22.1 60.1 1.5 0.0 0.2
45 - 49 623,031 0.6 15.8 19.2 62.8 1.5 0.0 0.2
50 - 54 524,559 0.6 16.6 16.9 64.3 1.5 0.0 0.2
55 - 59 337,735 0.6 17.5 15.9 64.3 1.5 0.0 0.2
60 - 64 315,448 0.5 9.5 15.0 72.8 1.8 0.0 0.2
65 - 69 192,889 0.5 6.7 13.4 77.3 1.8 0.0 0.2
70 - 74 166,597 0.4 4.8 11.5 81.1 2.0 0.0 0.2
75 - 79 100,740 0.4 3.6 10.6 83.0 2.2 0.0 0.2
80 + 106,947 0.5 2.8 10.0 83.7 2.7 0.1 0.4
Table 10. 17: Distribution of Employed Population Aged 10 Years and Above by Five Year Age Groups and
Employment Status, Tanzania Mainland, Female, 2012 Census
Age group Total Employer Employee Own Non -
Agriculture
Own
Agriculture
Family
Worker Apprentices Other
Total 8,742,483 0.4 8.4 15.3 67.7 7.8 0.2 0.3
10 - 14 465,708 0.1 3.7 3.1 24.5 66.9 0.4 1.3
15 - 19 897,848 0.2 10.0 10.5 67.9 10.4 0.6 0.5
20 - 24 1,264,984 0.3 10.1 16.2 67.7 5.2 0.3 0.2
25 - 29 1,260,374 0.4 11.2 19.5 64.8 3.9 0.1 0.1
30 - 34 1,106,728 0.4 9.7 20.2 66.0 3.4 0.1 0.1
35 - 39 942,049 0.4 8.4 19.5 68.2 3.2 0.1 0.1
40 - 44 730,861 0.4 7.7 17.6 71.0 3.0 0.1 0.1
45 - 49 598,188 0.4 7.4 15.6 73.2 3.1 0.1 0.1
50 - 54 456,014 0.3 7.5 12.5 76.4 3.0 0.1 0.1
55 - 59 287,227 0.3 7.5 11.4 77.7 2.9 0.1 0.2
60 - 64 270,936 0.4 2.7 10.0 83.3 3.4 0.1 0.2
65 - 69 165,921 0.3 1.7 8.4 86.0 3.3 0.1 0.2
70 - 74 138,033 0.3 1.2 8.2 85.9 3.9 0.1 0.3
75 - 79 72,658 0.4 1.2 7.3 86.0 4.5 0.1 0.5
80 + 84,954 0.4 1.1 8.0 85.0 4.8 0.1 0.6
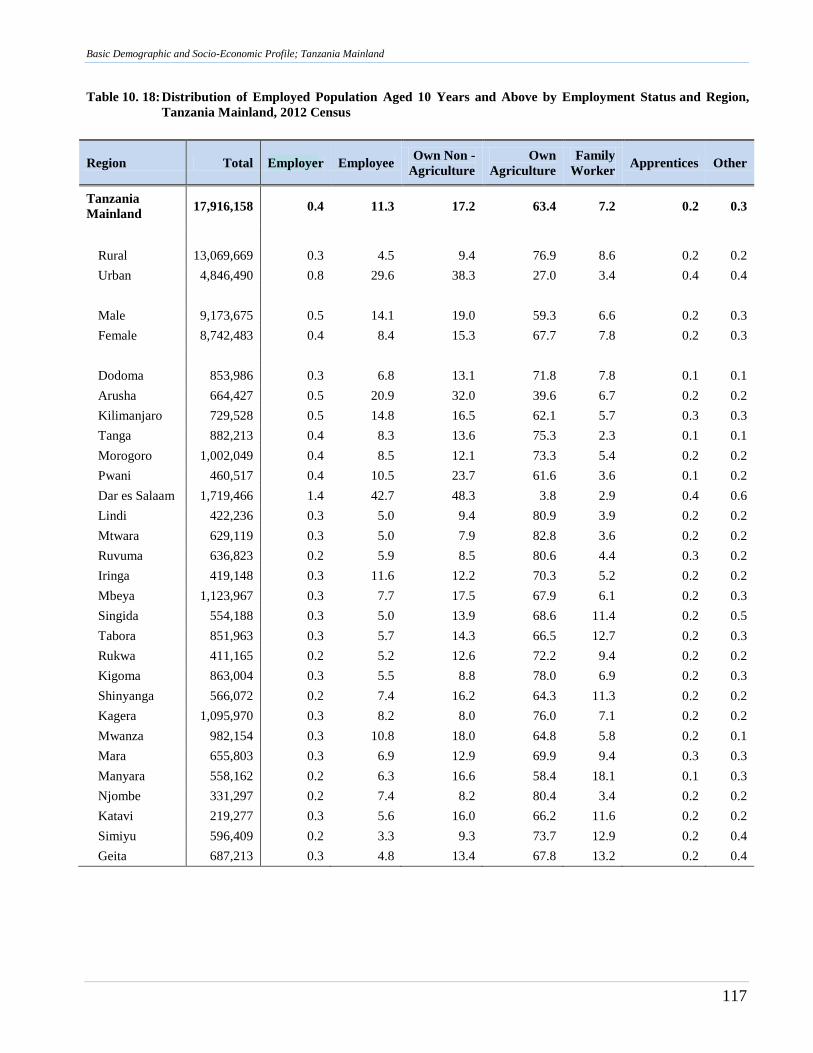
Basic Demographic and Socio-Economic Profile; Tanzania Mainland
117
Table 10. 18: Distribution of Employed Population Aged 10 Years and Above by Employment Status and Region,
Tanzania Mainland, 2012 Census
Region Total Employer Employee Own Non -
Agriculture
Own
Agriculture
Family
Worker Apprentices Other
Tanzania
Mainland 17,916,158 0.4 11.3 17.2 63.4 7.2 0.2 0.3
Rural 13,069,669 0.3 4.5 9.4 76.9 8.6 0.2 0.2
Urban 4,846,490 0.8 29.6 38.3 27.0 3.4 0.4 0.4
Male 9,173,675 0.5 14.1 19.0 59.3 6.6 0.2 0.3
Female 8,742,483 0.4 8.4 15.3 67.7 7.8 0.2 0.3
Dodoma 853,986 0.3 6.8 13.1 71.8 7.8 0.1 0.1
Arusha 664,427 0.5 20.9 32.0 39.6 6.7 0.2 0.2
Kilimanjaro 729,528 0.5 14.8 16.5 62.1 5.7 0.3 0.3
Tanga 882,213 0.4 8.3 13.6 75.3 2.3 0.1 0.1
Morogoro 1,002,049 0.4 8.5 12.1 73.3 5.4 0.2 0.2
Pwani 460,517 0.4 10.5 23.7 61.6 3.6 0.1 0.2
Dar es Salaam 1,719,466 1.4 42.7 48.3 3.8 2.9 0.4 0.6
Lindi 422,236 0.3 5.0 9.4 80.9 3.9 0.2 0.2
Mtwara 629,119 0.3 5.0 7.9 82.8 3.6 0.2 0.2
Ruvuma 636,823 0.2 5.9 8.5 80.6 4.4 0.3 0.2
Iringa 419,148 0.3 11.6 12.2 70.3 5.2 0.2 0.2
Mbeya 1,123,967 0.3 7.7 17.5 67.9 6.1 0.2 0.3
Singida 554,188 0.3 5.0 13.9 68.6 11.4 0.2 0.5
Tabora 851,963 0.3 5.7 14.3 66.5 12.7 0.2 0.3
Rukwa 411,165 0.2 5.2 12.6 72.2 9.4 0.2 0.2
Kigoma 863,004 0.3 5.5 8.8 78.0 6.9 0.2 0.3
Shinyanga 566,072 0.2 7.4 16.2 64.3 11.3 0.2 0.2
Kagera 1,095,970 0.3 8.2 8.0 76.0 7.1 0.2 0.2
Mwanza 982,154 0.3 10.8 18.0 64.8 5.8 0.2 0.1
Mara 655,803 0.3 6.9 12.9 69.9 9.4 0.3 0.3
Manyara 558,162 0.2 6.3 16.6 58.4 18.1 0.1 0.3
Njombe 331,297 0.2 7.4 8.2 80.4 3.4 0.2 0.2
Katavi 219,277 0.3 5.6 16.0 66.2 11.6 0.2 0.2
Simiyu 596,409 0.2 3.3 9.3 73.7 12.9 0.2 0.4
Geita 687,213 0.3 4.8 13.4 67.8 13.2 0.2 0.4
Basic Demographic and Socio-Economic Profile; Tanzania Mainland
118
10.5 Main Occupation
Main occupation provides information on the jobs where persons aged 10 years and above spent most
of their working time. In the process of production of goods and services, the occupations have been
Main occupation provides information on the jobs on which persons aged 10 years and above spent
most of their working time. In the process of production of goods and services, the main occupation
has been broken down into 15 categories considered to cover almost all activities people are engaged
in the production of goods and services in Tanzania. Major ones include administrators, professionals,
technicians, farmers, small businesses, street vendors, shopkeepers, livestock keepers and fishermen as
shown in the Tables 10.19 to 10.22.
The results in Table 10.19 show that farming was the most common occupation among the working
population (63 percent) followed by elementary occupations and; service and shop sales workers (each
employing 6 percent), craftsmen (5 percent), technicians and associate professionals; and other not
specified (4 percent each), street vendors (3 percent), livestock keepers and professionals (2 percent
each). Each of the following occupations accounted for one (1) percent of the working population in
Tanzania Mainland: legislators, administrators and managers; clerks; small business managers;
fishermen; plant machine operators and assemblers including drivers. On the other hand, results show
that the highest proportion of working persons aged 60 years and above were engaged in farming
(more than 70 percent).
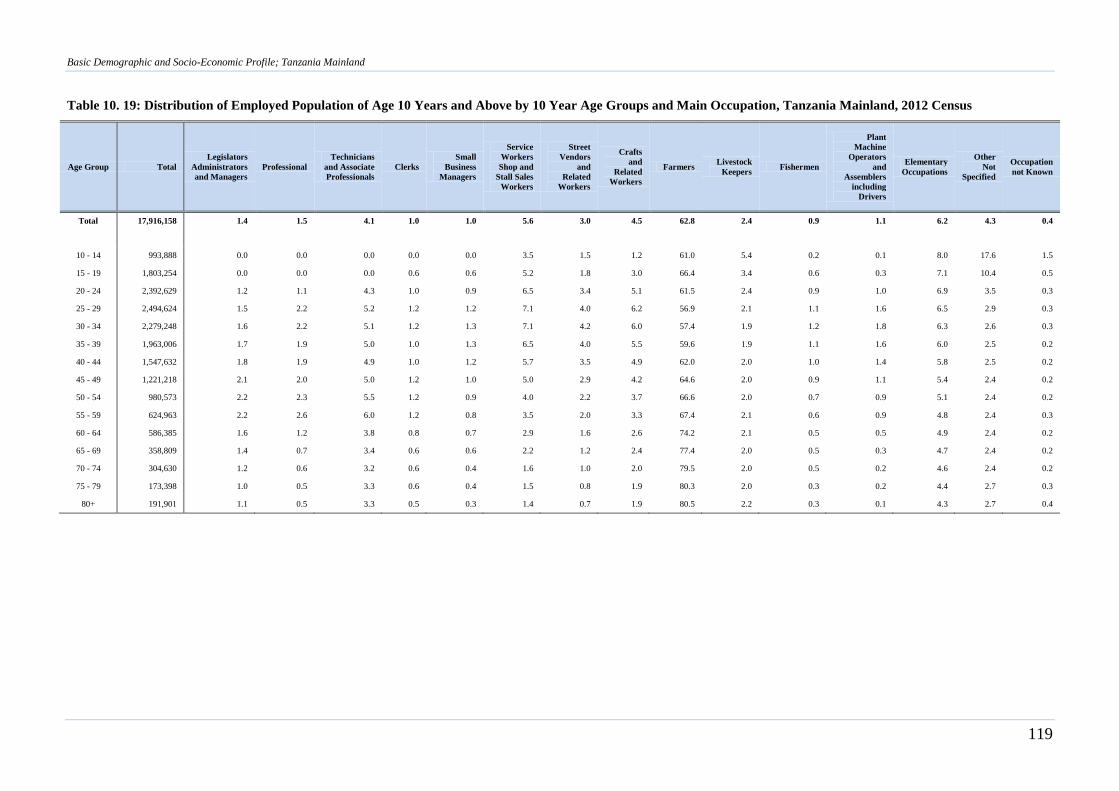
Basic Demographic and Socio-Economic Profile; Tanzania Mainland
119
Table 10. 19: Distribution of Employed Population of Age 10 Years and Above by 10 Year Age Groups and Main Occupation, Tanzania Mainland, 2012 Census
Age Group Total
Legislators
Administrators
and Managers
Professional
Technicians
and Associate
Professionals
Clerks
Small
Business
Managers
Service
Workers
Shop and
Stall Sales
Workers
Street
Vendors
and
Related
Workers
Crafts
and
Related
Workers
Farmers Livestock
Keepers Fishermen
Plant
Machine
Operators
and
Assemblers
including
Drivers
Elementary
Occupations
Other
Not
Specified
Occupation
not Known
Total 17,916,158 1.4 1.5 4.1 1.0 1.0 5.6 3.0 4.5 62.8 2.4 0.9 1.1 6.2 4.3 0.4
10 - 14 993,888 0.0 0.0 0.0 0.0 0.0 3.5 1.5 1.2 61.0 5.4 0.2 0.1 8.0 17.6 1.5
15 - 19 1,803,254 0.0 0.0 0.0 0.6 0.6 5.2 1.8 3.0 66.4 3.4 0.6 0.3 7.1 10.4 0.5
20 - 24 2,392,629 1.2 1.1 4.3 1.0 0.9 6.5 3.4 5.1 61.5 2.4 0.9 1.0 6.9 3.5 0.3
25 - 29 2,494,624 1.5 2.2 5.2 1.2 1.2 7.1 4.0 6.2 56.9 2.1 1.1 1.6 6.5 2.9 0.3
30 - 34 2,279,248 1.6 2.2 5.1 1.2 1.3 7.1 4.2 6.0 57.4 1.9 1.2 1.8 6.3 2.6 0.3
35 - 39 1,963,006 1.7 1.9 5.0 1.0 1.3 6.5 4.0 5.5 59.6 1.9 1.1 1.6 6.0 2.5 0.2
40 - 44 1,547,632 1.8 1.9 4.9 1.0 1.2 5.7 3.5 4.9 62.0 2.0 1.0 1.4 5.8 2.5 0.2
45 - 49 1,221,218 2.1 2.0 5.0 1.2 1.0 5.0 2.9 4.2 64.6 2.0 0.9 1.1 5.4 2.4 0.2
50 - 54 980,573 2.2 2.3 5.5 1.2 0.9 4.0 2.2 3.7 66.6 2.0 0.7 0.9 5.1 2.4 0.2
55 - 59 624,963 2.2 2.6 6.0 1.2 0.8 3.5 2.0 3.3 67.4 2.1 0.6 0.9 4.8 2.4 0.3
60 - 64 586,385 1.6 1.2 3.8 0.8 0.7 2.9 1.6 2.6 74.2 2.1 0.5 0.5 4.9 2.4 0.2
65 - 69 358,809 1.4 0.7 3.4 0.6 0.6 2.2 1.2 2.4 77.4 2.0 0.5 0.3 4.7 2.4 0.2
70 - 74 304,630 1.2 0.6 3.2 0.6 0.4 1.6 1.0 2.0 79.5 2.0 0.5 0.2 4.6 2.4 0.2
75 - 79 173,398 1.0 0.5 3.3 0.6 0.4 1.5 0.8 1.9 80.3 2.0 0.3 0.2 4.4 2.7 0.3
80+ 191,901 1.1 0.5 3.3 0.5 0.3 1.4 0.7 1.9 80.5 2.2 0.3 0.1 4.3 2.7 0.4
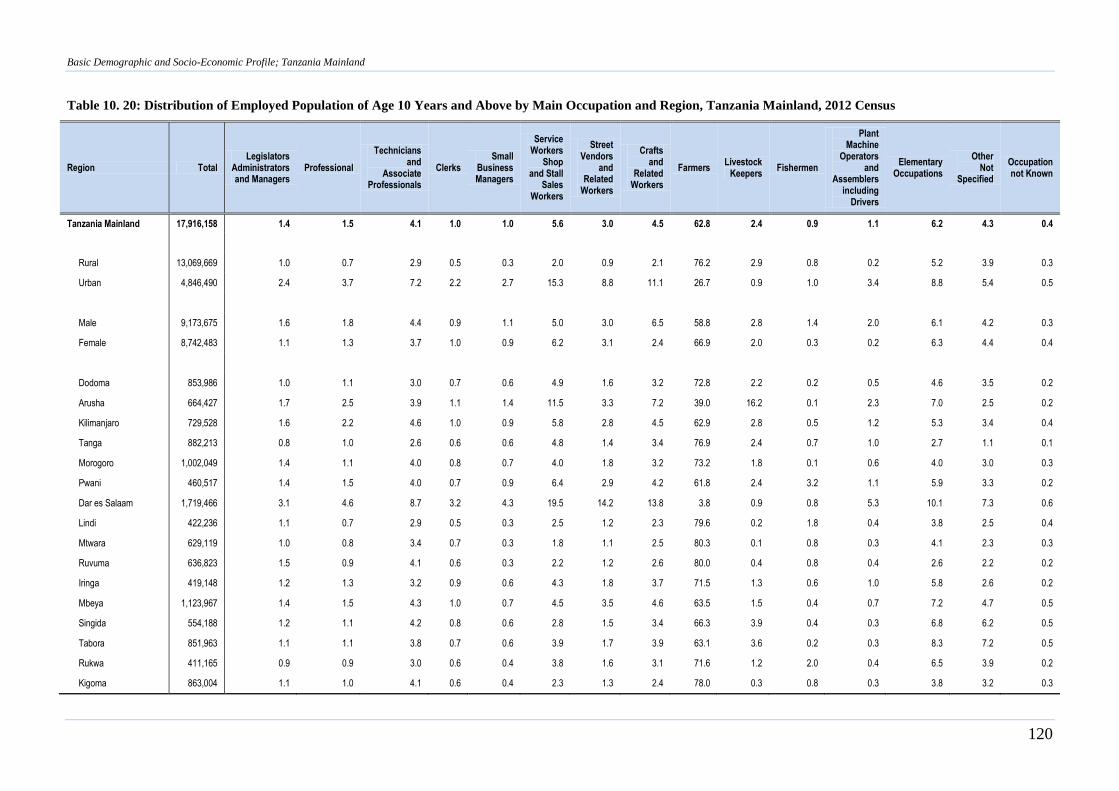
Basic Demographic and Socio-Economic Profile; Tanzania Mainland
120
Table 10. 20: Distribution of Employed Population of Age 10 Years and Above by Main Occupation and Region, Tanzania Mainland, 2012 Census
Region Total Legislators
Administrators and Managers
Professional
Technicians and
Associate Professionals
Clerks Small
Business Managers
Service Workers
Shop and Stall
Sales Workers
Street Vendors
and Related
Workers
Crafts and
Related Workers
Farmers Livestock
Keepers Fishermen
Plant Machine
Operators and
Assemblers including
Drivers
Elementary Occupations
Other Not
Specified
Occupation not Known
Tanzania Mainland 17,916,158 1.4 1.5 4.1 1.0 1.0 5.6 3.0 4.5 62.8 2.4 0.9 1.1 6.2 4.3 0.4
Rural 13,069,669 1.0 0.7 2.9 0.5 0.3 2.0 0.9 2.1 76.2 2.9 0.8 0.2 5.2 3.9 0.3
Urban 4,846,490 2.4 3.7 7.2 2.2 2.7 15.3 8.8 11.1 26.7 0.9 1.0 3.4 8.8 5.4 0.5
Male 9,173,675 1.6 1.8 4.4 0.9 1.1 5.0 3.0 6.5 58.8 2.8 1.4 2.0 6.1 4.2 0.3
Female 8,742,483 1.1 1.3 3.7 1.0 0.9 6.2 3.1 2.4 66.9 2.0 0.3 0.2 6.3 4.4 0.4
Dodoma 853,986 1.0 1.1 3.0 0.7 0.6 4.9 1.6 3.2 72.8 2.2 0.2 0.5 4.6 3.5 0.2
Arusha 664,427 1.7 2.5 3.9 1.1 1.4 11.5 3.3 7.2 39.0 16.2 0.1 2.3 7.0 2.5 0.2
Kilimanjaro 729,528 1.6 2.2 4.6 1.0 0.9 5.8 2.8 4.5 62.9 2.8 0.5 1.2 5.3 3.4 0.4
Tanga 882,213 0.8 1.0 2.6 0.6 0.6 4.8 1.4 3.4 76.9 2.4 0.7 1.0 2.7 1.1 0.1
Morogoro 1,002,049 1.4 1.1 4.0 0.8 0.7 4.0 1.8 3.2 73.2 1.8 0.1 0.6 4.0 3.0 0.3
Pwani 460,517 1.4 1.5 4.0 0.7 0.9 6.4 2.9 4.2 61.8 2.4 3.2 1.1 5.9 3.3 0.2
Dar es Salaam 1,719,466 3.1 4.6 8.7 3.2 4.3 19.5 14.2 13.8 3.8 0.9 0.8 5.3 10.1 7.3 0.6
Lindi 422,236 1.1 0.7 2.9 0.5 0.3 2.5 1.2 2.3 79.6 0.2 1.8 0.4 3.8 2.5 0.4
Mtwara 629,119 1.0 0.8 3.4 0.7 0.3 1.8 1.1 2.5 80.3 0.1 0.8 0.3 4.1 2.3 0.3
Ruvuma 636,823 1.5 0.9 4.1 0.6 0.3 2.2 1.2 2.6 80.0 0.4 0.8 0.4 2.6 2.2 0.2
Iringa 419,148 1.2 1.3 3.2 0.9 0.6 4.3 1.8 3.7 71.5 1.3 0.6 1.0 5.8 2.6 0.2
Mbeya 1,123,967 1.4 1.5 4.3 1.0 0.7 4.5 3.5 4.6 63.5 1.5 0.4 0.7 7.2 4.7 0.5
Singida 554,188 1.2 1.1 4.2 0.8 0.6 2.8 1.5 3.4 66.3 3.9 0.4 0.3 6.8 6.2 0.5
Tabora 851,963 1.1 1.1 3.8 0.7 0.6 3.9 1.7 3.9 63.1 3.6 0.2 0.3 8.3 7.2 0.5
Rukwa 411,165 0.9 0.9 3.0 0.6 0.4 3.8 1.6 3.1 71.6 1.2 2.0 0.4 6.5 3.9 0.2
Kigoma 863,004 1.1 1.0 4.1 0.6 0.4 2.3 1.3 2.4 78.0 0.3 0.8 0.3 3.8 3.2 0.3
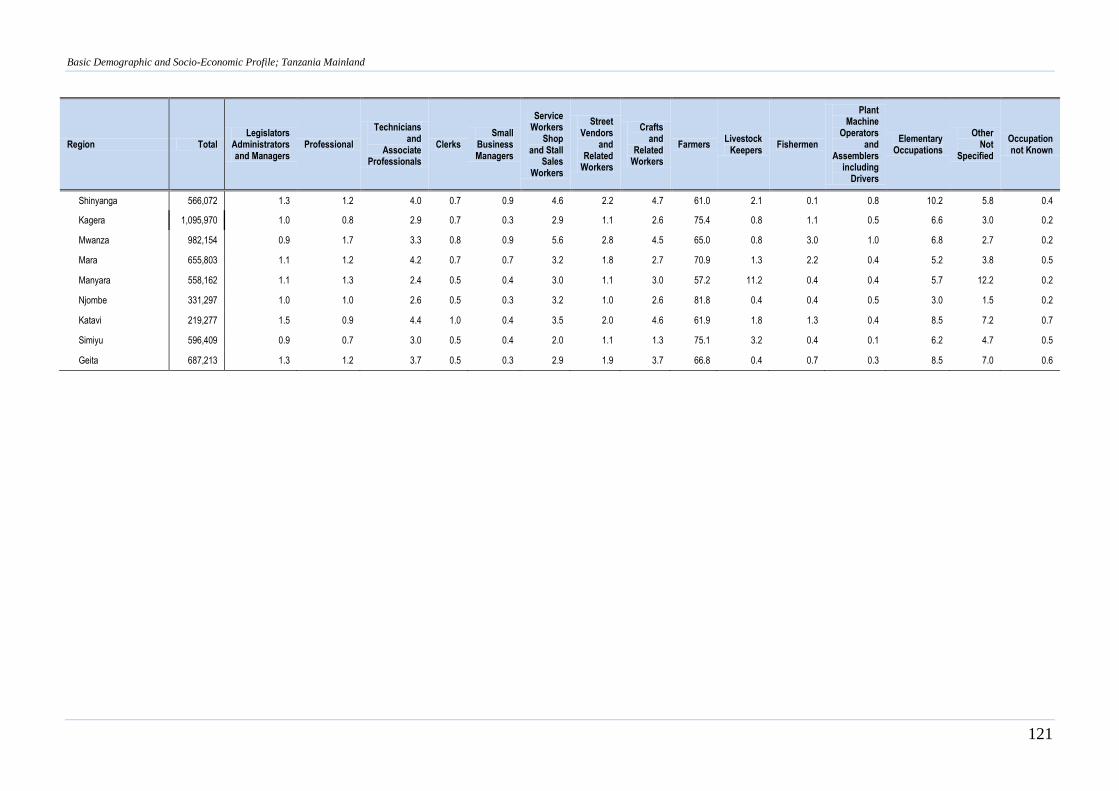
Basic Demographic and Socio-Economic Profile; Tanzania Mainland
121
Region Total Legislators
Administrators and Managers
Professional
Technicians and
Associate Professionals
Clerks Small
Business Managers
Service Workers
Shop and Stall
Sales Workers
Street Vendors
and Related
Workers
Crafts and
Related Workers
Farmers Livestock
Keepers Fishermen
Plant Machine
Operators and
Assemblers including
Drivers
Elementary Occupations
Other Not
Specified
Occupation not Known
Shinyanga 566,072 1.3 1.2 4.0 0.7 0.9 4.6 2.2 4.7 61.0 2.1 0.1 0.8 10.2 5.8 0.4
Kagera 1,095,970 1.0 0.8 2.9 0.7 0.3 2.9 1.1 2.6 75.4 0.8 1.1 0.5 6.6 3.0 0.2
Mwanza 982,154 0.9 1.7 3.3 0.8 0.9 5.6 2.8 4.5 65.0 0.8 3.0 1.0 6.8 2.7 0.2
Mara 655,803 1.1 1.2 4.2 0.7 0.7 3.2 1.8 2.7 70.9 1.3 2.2 0.4 5.2 3.8 0.5
Manyara 558,162 1.1 1.3 2.4 0.5 0.4 3.0 1.1 3.0 57.2 11.2 0.4 0.4 5.7 12.2 0.2
Njombe 331,297 1.0 1.0 2.6 0.5 0.3 3.2 1.0 2.6 81.8 0.4 0.4 0.5 3.0 1.5 0.2
Katavi 219,277 1.5 0.9 4.4 1.0 0.4 3.5 2.0 4.6 61.9 1.8 1.3 0.4 8.5 7.2 0.7
Simiyu 596,409 0.9 0.7 3.0 0.5 0.4 2.0 1.1 1.3 75.1 3.2 0.4 0.1 6.2 4.7 0.5
Geita 687,213 1.3 1.2 3.7 0.5 0.3 2.9 1.9 3.7 66.8 0.4 0.7 0.3 8.5 7.0 0.6
Basic Demographic and Socio-Economic Profile; Tanzania Mainland
122
10.6. Main Industry
Industry provides information on the main economic activities in which the working population
was employed. Main activities include commercial agriculture; fishing; mining and quarrying;
manufacturing; trade and commerce; public administration and education.
Results in Table 10.21 reveal that commercial agriculture, food crops and forestry employed more
persons than any other industry (63 percent), followed by trade and commerce; and domestic
services employing six (6) percent each, and raw food sales persons (3 percent). The least
employing industries included electricity, gas and steam; information and communication each
employ 0.4 percent.
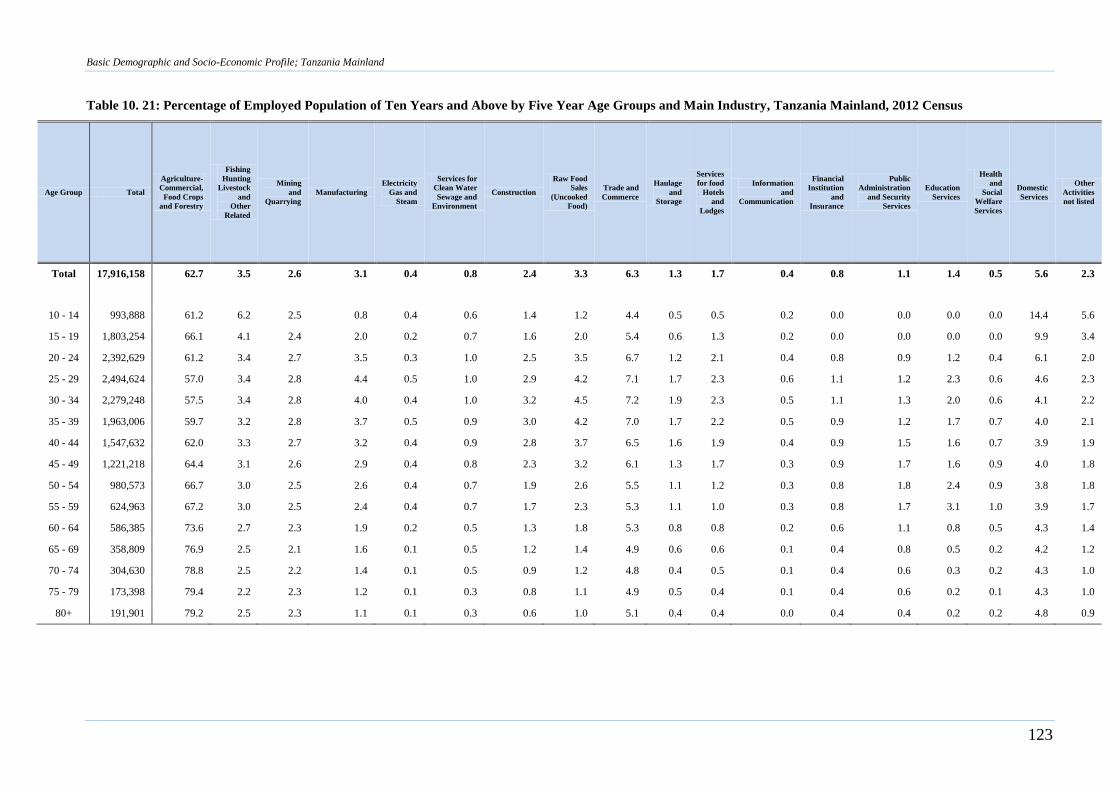
Basic Demographic and Socio-Economic Profile; Tanzania Mainland
123
Table 10. 21: Percentage of Employed Population of Ten Years and Above by Five Year Age Groups and Main Industry, Tanzania Mainland, 2012 Census
Age Group Total
Agriculture-
Commercial,
Food Crops
and Forestry
Fishing
Hunting
Livestock
and
Other
Related
Mining
and
Quarrying
Manufacturing
Electricity
Gas and
Steam
Services for
Clean Water
Sewage and
Environment
Construction
Raw Food
Sales
(Uncooked
Food)
Trade and
Commerce
Haulage
and
Storage
Services
for food
Hotels
and
Lodges
Information
and
Communication
Financial
Institution
and
Insurance
Public
Administration
and Security
Services
Education
Services
Health
and
Social
Welfare
Services
Domestic
Services
Other
Activities
not listed
Total 17,916,158 62.7 3.5 2.6 3.1 0.4 0.8 2.4 3.3 6.3 1.3 1.7 0.4 0.8 1.1 1.4 0.5 5.6 2.3
10 - 14 993,888 61.2 6.2 2.5 0.8 0.4 0.6 1.4 1.2 4.4 0.5 0.5 0.2 0.0 0.0 0.0 0.0 14.4 5.6
15 - 19 1,803,254 66.1 4.1 2.4 2.0 0.2 0.7 1.6 2.0 5.4 0.6 1.3 0.2 0.0 0.0 0.0 0.0 9.9 3.4
20 - 24 2,392,629 61.2 3.4 2.7 3.5 0.3 1.0 2.5 3.5 6.7 1.2 2.1 0.4 0.8 0.9 1.2 0.4 6.1 2.0
25 - 29 2,494,624 57.0 3.4 2.8 4.4 0.5 1.0 2.9 4.2 7.1 1.7 2.3 0.6 1.1 1.2 2.3 0.6 4.6 2.3
30 - 34 2,279,248 57.5 3.4 2.8 4.0 0.4 1.0 3.2 4.5 7.2 1.9 2.3 0.5 1.1 1.3 2.0 0.6 4.1 2.2
35 - 39 1,963,006 59.7 3.2 2.8 3.7 0.5 0.9 3.0 4.2 7.0 1.7 2.2 0.5 0.9 1.2 1.7 0.7 4.0 2.1
40 - 44 1,547,632 62.0 3.3 2.7 3.2 0.4 0.9 2.8 3.7 6.5 1.6 1.9 0.4 0.9 1.5 1.6 0.7 3.9 1.9
45 - 49 1,221,218 64.4 3.1 2.6 2.9 0.4 0.8 2.3 3.2 6.1 1.3 1.7 0.3 0.9 1.7 1.6 0.9 4.0 1.8
50 - 54 980,573 66.7 3.0 2.5 2.6 0.4 0.7 1.9 2.6 5.5 1.1 1.2 0.3 0.8 1.8 2.4 0.9 3.8 1.8
55 - 59 624,963 67.2 3.0 2.5 2.4 0.4 0.7 1.7 2.3 5.3 1.1 1.0 0.3 0.8 1.7 3.1 1.0 3.9 1.7
60 - 64 586,385 73.6 2.7 2.3 1.9 0.2 0.5 1.3 1.8 5.3 0.8 0.8 0.2 0.6 1.1 0.8 0.5 4.3 1.4
65 - 69 358,809 76.9 2.5 2.1 1.6 0.1 0.5 1.2 1.4 4.9 0.6 0.6 0.1 0.4 0.8 0.5 0.2 4.2 1.2
70 - 74 304,630 78.8 2.5 2.2 1.4 0.1 0.5 0.9 1.2 4.8 0.4 0.5 0.1 0.4 0.6 0.3 0.2 4.3 1.0
75 - 79 173,398 79.4 2.2 2.3 1.2 0.1 0.3 0.8 1.1 4.9 0.5 0.4 0.1 0.4 0.6 0.2 0.1 4.3 1.0
80+ 191,901 79.2 2.5 2.3 1.1 0.1 0.3 0.6 1.0 5.1 0.4 0.4 0.0 0.4 0.4 0.2 0.2 4.8 0.9
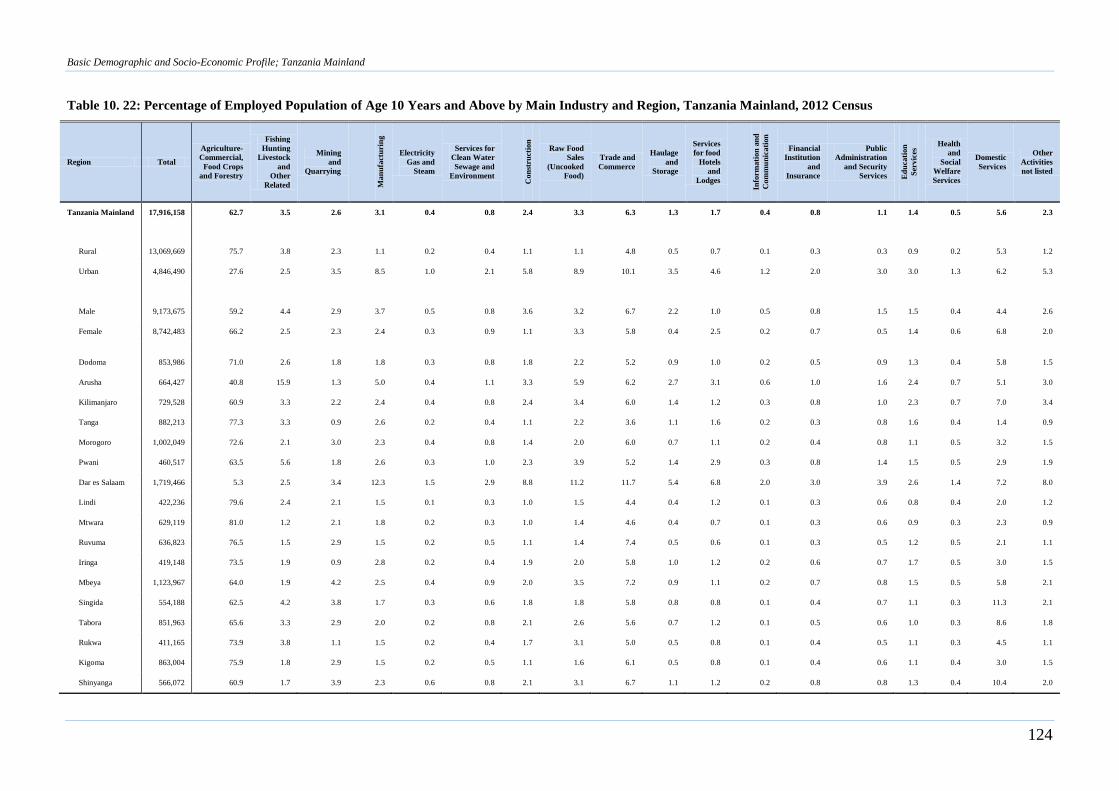
Basic Demographic and Socio-Economic Profile; Tanzania Mainland
124
Table 10. 22: Percentage of Employed Population of Age 10 Years and Above by Main Industry and Region, Tanzania Mainland, 2012 Census
Region Total
Agriculture-
Commercial,
Food Crops
and Forestry
Fishing
Hunting
Livestock
and
Other
Related
Mining
and
Quarrying
Man
ufa
ctu
rin
g
Electricity
Gas and
Steam
Services for
Clean Water
Sewage and
Environment
Con
stru
ctio
n
Raw Food
Sales
(Uncooked
Food)
Trade and
Commerce
Haulage
and
Storage
Services
for food
Hotels
and
Lodges
Info
rmati
on
an
d
Com
mu
nic
ati
on
Financial
Institution
and
Insurance
Public
Administration
and Security
Services Ed
uca
tion
Ser
vic
es Health
and
Social
Welfare
Services
Domestic
Services
Other
Activities
not listed
Tanzania Mainland 17,916,158 62.7 3.5 2.6 3.1 0.4 0.8 2.4 3.3 6.3 1.3 1.7 0.4 0.8 1.1 1.4 0.5 5.6 2.3
Rural 13,069,669 75.7 3.8 2.3 1.1 0.2 0.4 1.1 1.1 4.8 0.5 0.7 0.1 0.3 0.3 0.9 0.2 5.3 1.2
Urban 4,846,490 27.6 2.5 3.5 8.5 1.0 2.1 5.8 8.9 10.1 3.5 4.6 1.2 2.0 3.0 3.0 1.3 6.2 5.3
Male 9,173,675 59.2 4.4 2.9 3.7 0.5 0.8 3.6 3.2 6.7 2.2 1.0 0.5 0.8 1.5 1.5 0.4 4.4 2.6
Female 8,742,483 66.2 2.5 2.3 2.4 0.3 0.9 1.1 3.3 5.8 0.4 2.5 0.2 0.7 0.5 1.4 0.6 6.8 2.0
Dodoma 853,986 71.0 2.6 1.8 1.8 0.3 0.8 1.8 2.2 5.2 0.9 1.0 0.2 0.5 0.9 1.3 0.4 5.8 1.5
Arusha 664,427 40.8 15.9 1.3 5.0 0.4 1.1 3.3 5.9 6.2 2.7 3.1 0.6 1.0 1.6 2.4 0.7 5.1 3.0
Kilimanjaro 729,528 60.9 3.3 2.2 2.4 0.4 0.8 2.4 3.4 6.0 1.4 1.2 0.3 0.8 1.0 2.3 0.7 7.0 3.4
Tanga 882,213 77.3 3.3 0.9 2.6 0.2 0.4 1.1 2.2 3.6 1.1 1.6 0.2 0.3 0.8 1.6 0.4 1.4 0.9
Morogoro 1,002,049 72.6 2.1 3.0 2.3 0.4 0.8 1.4 2.0 6.0 0.7 1.1 0.2 0.4 0.8 1.1 0.5 3.2 1.5
Pwani 460,517 63.5 5.6 1.8 2.6 0.3 1.0 2.3 3.9 5.2 1.4 2.9 0.3 0.8 1.4 1.5 0.5 2.9 1.9
Dar es Salaam 1,719,466 5.3 2.5 3.4 12.3 1.5 2.9 8.8 11.2 11.7 5.4 6.8 2.0 3.0 3.9 2.6 1.4 7.2 8.0
Lindi 422,236 79.6 2.4 2.1 1.5 0.1 0.3 1.0 1.5 4.4 0.4 1.2 0.1 0.3 0.6 0.8 0.4 2.0 1.2
Mtwara 629,119 81.0 1.2 2.1 1.8 0.2 0.3 1.0 1.4 4.6 0.4 0.7 0.1 0.3 0.6 0.9 0.3 2.3 0.9
Ruvuma 636,823 76.5 1.5 2.9 1.5 0.2 0.5 1.1 1.4 7.4 0.5 0.6 0.1 0.3 0.5 1.2 0.5 2.1 1.1
Iringa 419,148 73.5 1.9 0.9 2.8 0.2 0.4 1.9 2.0 5.8 1.0 1.2 0.2 0.6 0.7 1.7 0.5 3.0 1.5
Mbeya 1,123,967 64.0 1.9 4.2 2.5 0.4 0.9 2.0 3.5 7.2 0.9 1.1 0.2 0.7 0.8 1.5 0.5 5.8 2.1
Singida 554,188 62.5 4.2 3.8 1.7 0.3 0.6 1.8 1.8 5.8 0.8 0.8 0.1 0.4 0.7 1.1 0.3 11.3 2.1
Tabora 851,963 65.6 3.3 2.9 2.0 0.2 0.8 2.1 2.6 5.6 0.7 1.2 0.1 0.5 0.6 1.0 0.3 8.6 1.8
Rukwa 411,165 73.9 3.8 1.1 1.5 0.2 0.4 1.7 3.1 5.0 0.5 0.8 0.1 0.4 0.5 1.1 0.3 4.5 1.1
Kigoma 863,004 75.9 1.8 2.9 1.5 0.2 0.5 1.1 1.6 6.1 0.5 0.8 0.1 0.4 0.6 1.1 0.4 3.0 1.5
Shinyanga 566,072 60.9 1.7 3.9 2.3 0.6 0.8 2.1 3.1 6.7 1.1 1.2 0.2 0.8 0.8 1.3 0.4 10.4 2.0
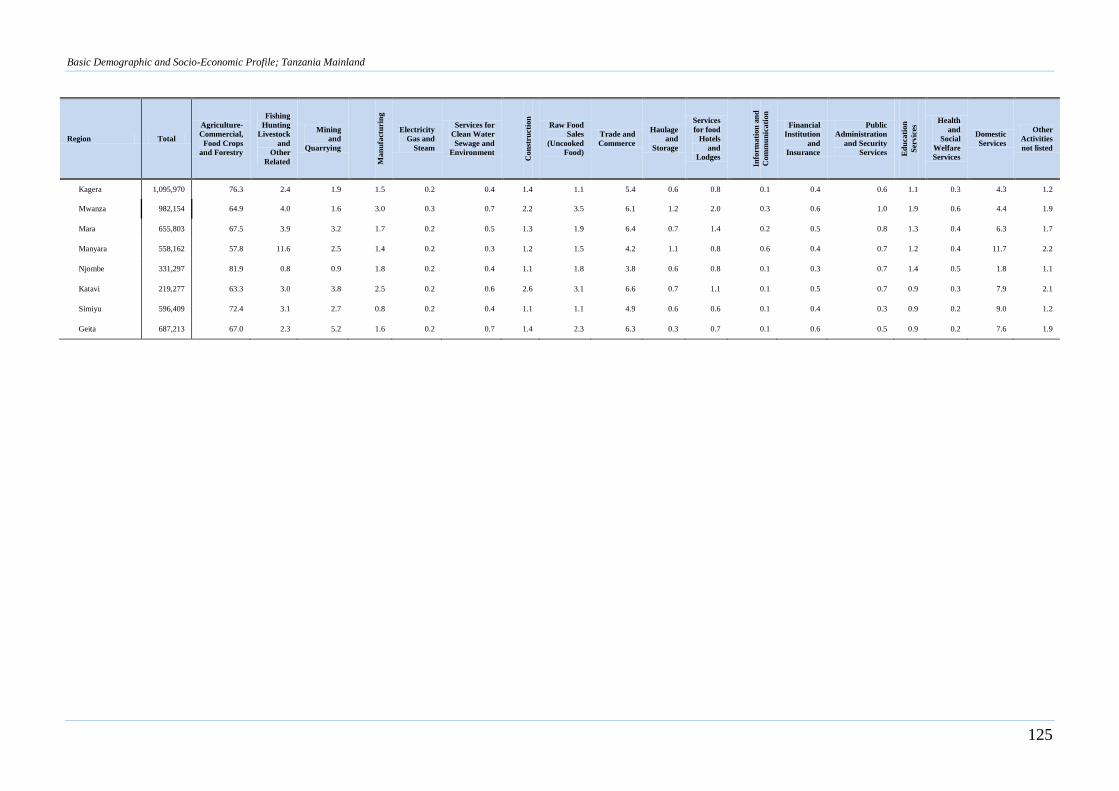
Basic Demographic and Socio-Economic Profile; Tanzania Mainland
125
Region Total
Agriculture-
Commercial,
Food Crops
and Forestry
Fishing
Hunting
Livestock
and
Other
Related
Mining
and
Quarrying
Man
ufa
ctu
rin
g
Electricity
Gas and
Steam
Services for
Clean Water
Sewage and
Environment
Con
stru
ctio
n
Raw Food
Sales
(Uncooked
Food)
Trade and
Commerce
Haulage
and
Storage
Services
for food
Hotels
and
Lodges
Info
rmati
on
an
d
Com
mu
nic
ati
on
Financial
Institution
and
Insurance
Public
Administration
and Security
Services Ed
uca
tion
Ser
vic
es Health
and
Social
Welfare
Services
Domestic
Services
Other
Activities
not listed
Kagera 1,095,970 76.3 2.4 1.9 1.5 0.2 0.4 1.4 1.1 5.4 0.6 0.8 0.1 0.4 0.6 1.1 0.3 4.3 1.2
Mwanza 982,154 64.9 4.0 1.6 3.0 0.3 0.7 2.2 3.5 6.1 1.2 2.0 0.3 0.6 1.0 1.9 0.6 4.4 1.9
Mara 655,803 67.5 3.9 3.2 1.7 0.2 0.5 1.3 1.9 6.4 0.7 1.4 0.2 0.5 0.8 1.3 0.4 6.3 1.7
Manyara 558,162 57.8 11.6 2.5 1.4 0.2 0.3 1.2 1.5 4.2 1.1 0.8 0.6 0.4 0.7 1.2 0.4 11.7 2.2
Njombe 331,297 81.9 0.8 0.9 1.8 0.2 0.4 1.1 1.8 3.8 0.6 0.8 0.1 0.3 0.7 1.4 0.5 1.8 1.1
Katavi 219,277 63.3 3.0 3.8 2.5 0.2 0.6 2.6 3.1 6.6 0.7 1.1 0.1 0.5 0.7 0.9 0.3 7.9 2.1
Simiyu 596,409 72.4 3.1 2.7 0.8 0.2 0.4 1.1 1.1 4.9 0.6 0.6 0.1 0.4 0.3 0.9 0.2 9.0 1.2
Geita 687,213 67.0 2.3 5.2 1.6 0.2 0.7 1.4 2.3 6.3 0.3 0.7 0.1 0.6 0.5 0.9 0.2 7.6 1.9

Basic Demographic and Socio-Economic Profile; Tanzania Mainland
126
Chapter Eleven
Disability
11.1 Introduction
The first attempt to collect disability statistics through Census in Tanzania was in 2002 PHC. The 2002
PHC had only two questions on disability. The first question asked if any member of the household
had any disability. If the answer to that question was “Yes”, the respondent was asked to state the type
of disability. These questions were too general and they captured severe cases of disability only. More
research and information is now available on how to collect more comprehensive disability statistics
through a census or survey.
In the 2012 PHC all respondents were asked questions on disability. Persons with disabilities were
defined as persons with long-term physical, mental, intellectual or sensory impairment which may
hinder or limit their full and effective participation in society on an equal footing with others.
Disabilities included in the 2012 census questionnaire were albinism, difficulty in seeing, hearing and
walking. Other categories were difficulty in remembering, self-care and other types of disability.
11.2 Persons with Disabilities Five Year Age Groups
Table 11.1 presents the number of persons with disability by type of disability and region. Difficult in
seeing was the most common type of disability (2 percent) and albinism (0.04 percent) was the least
type of disability reported.
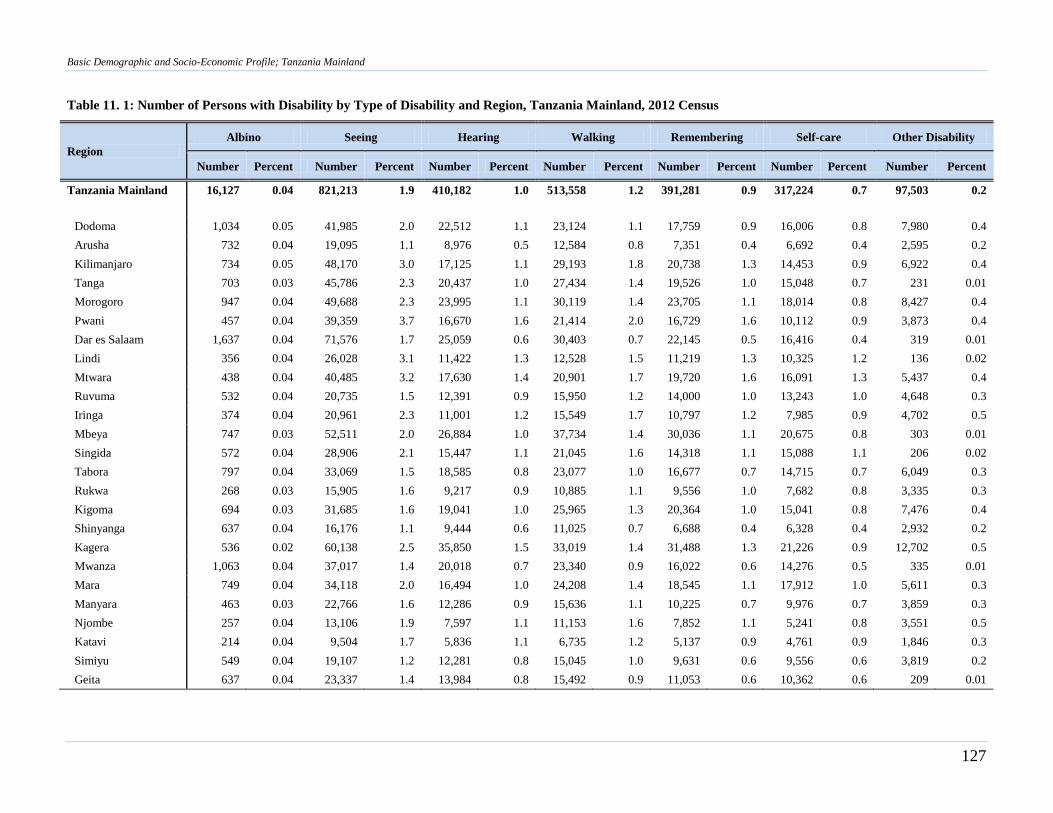
Basic Demographic and Socio-Economic Profile; Tanzania Mainland
127
Table 11. 1: Number of Persons with Disability by Type of Disability and Region, Tanzania Mainland, 2012 Census
Region
Albino Seeing Hearing Walking Remembering Self-care Other Disability
Number Percent Number Percent Number Percent Number Percent Number Percent Number Percent Number Percent
Tanzania Mainland 16,127 0.04 821,213 1.9 410,182 1.0 513,558 1.2 391,281 0.9 317,224 0.7 97,503 0.2
Dodoma 1,034 0.05 41,985 2.0 22,512 1.1 23,124 1.1 17,759 0.9 16,006 0.8 7,980 0.4
Arusha 732 0.04 19,095 1.1 8,976 0.5 12,584 0.8 7,351 0.4 6,692 0.4 2,595 0.2
Kilimanjaro 734 0.05 48,170 3.0 17,125 1.1 29,193 1.8 20,738 1.3 14,453 0.9 6,922 0.4
Tanga 703 0.03 45,786 2.3 20,437 1.0 27,434 1.4 19,526 1.0 15,048 0.7 231 0.01
Morogoro 947 0.04 49,688 2.3 23,995 1.1 30,119 1.4 23,705 1.1 18,014 0.8 8,427 0.4
Pwani 457 0.04 39,359 3.7 16,670 1.6 21,414 2.0 16,729 1.6 10,112 0.9 3,873 0.4
Dar es Salaam 1,637 0.04 71,576 1.7 25,059 0.6 30,403 0.7 22,145 0.5 16,416 0.4 319 0.01
Lindi 356 0.04 26,028 3.1 11,422 1.3 12,528 1.5 11,219 1.3 10,325 1.2 136 0.02
Mtwara 438 0.04 40,485 3.2 17,630 1.4 20,901 1.7 19,720 1.6 16,091 1.3 5,437 0.4
Ruvuma 532 0.04 20,735 1.5 12,391 0.9 15,950 1.2 14,000 1.0 13,243 1.0 4,648 0.3
Iringa 374 0.04 20,961 2.3 11,001 1.2 15,549 1.7 10,797 1.2 7,985 0.9 4,702 0.5
Mbeya 747 0.03 52,511 2.0 26,884 1.0 37,734 1.4 30,036 1.1 20,675 0.8 303 0.01
Singida 572 0.04 28,906 2.1 15,447 1.1 21,045 1.6 14,318 1.1 15,088 1.1 206 0.02
Tabora 797 0.04 33,069 1.5 18,585 0.8 23,077 1.0 16,677 0.7 14,715 0.7 6,049 0.3
Rukwa 268 0.03 15,905 1.6 9,217 0.9 10,885 1.1 9,556 1.0 7,682 0.8 3,335 0.3
Kigoma 694 0.03 31,685 1.6 19,041 1.0 25,965 1.3 20,364 1.0 15,041 0.8 7,476 0.4
Shinyanga 637 0.04 16,176 1.1 9,444 0.6 11,025 0.7 6,688 0.4 6,328 0.4 2,932 0.2
Kagera 536 0.02 60,138 2.5 35,850 1.5 33,019 1.4 31,488 1.3 21,226 0.9 12,702 0.5
Mwanza 1,063 0.04 37,017 1.4 20,018 0.7 23,340 0.9 16,022 0.6 14,276 0.5 335 0.01
Mara 749 0.04 34,118 2.0 16,494 1.0 24,208 1.4 18,545 1.1 17,912 1.0 5,611 0.3
Manyara 463 0.03 22,766 1.6 12,286 0.9 15,636 1.1 10,225 0.7 9,976 0.7 3,859 0.3
Njombe 257 0.04 13,106 1.9 7,597 1.1 11,153 1.6 7,852 1.1 5,241 0.8 3,551 0.5
Katavi 214 0.04 9,504 1.7 5,836 1.1 6,735 1.2 5,137 0.9 4,761 0.9 1,846 0.3
Simiyu 549 0.04 19,107 1.2 12,281 0.8 15,045 1.0 9,631 0.6 9,556 0.6 3,819 0.2
Geita 637 0.04 23,337 1.4 13,984 0.8 15,492 0.9 11,053 0.6 10,362 0.6 209 0.01
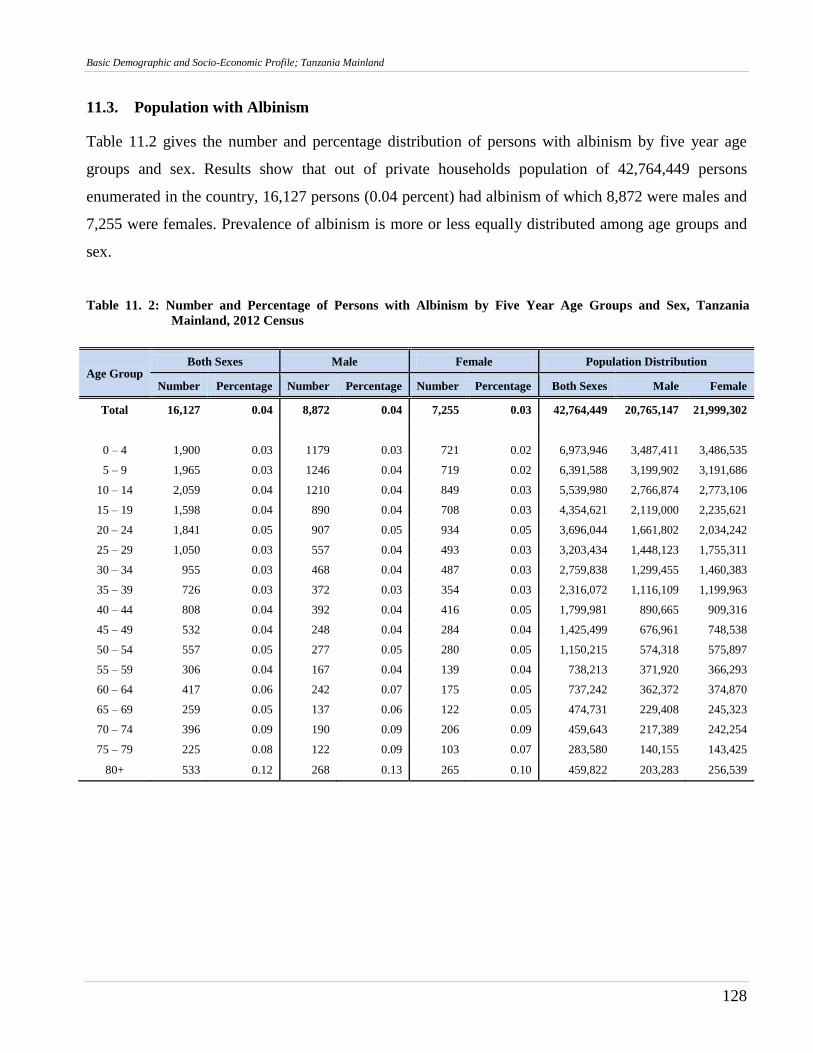
Basic Demographic and Socio-Economic Profile; Tanzania Mainland
128
11.3. Population with Albinism
Table 11.2 gives the number and percentage distribution of persons with albinism by five year age
groups and sex. Results show that out of private households population of 42,764,449 persons
enumerated in the country, 16,127 persons (0.04 percent) had albinism of which 8,872 were males and
7,255 were females. Prevalence of albinism is more or less equally distributed among age groups and
sex.
Table 11. 2: Number and Percentage of Persons with Albinism by Five Year Age Groups and Sex, Tanzania
Mainland, 2012 Census
Age Group Both Sexes Male Female Population Distribution
Number Percentage Number Percentage Number Percentage Both Sexes Male Female
Total 16,127 0.04 8,872 0.04 7,255 0.03 42,764,449 20,765,147 21,999,302
0 – 4 1,900 0.03 1179 0.03 721 0.02 6,973,946 3,487,411 3,486,535
5 – 9 1,965 0.03 1246 0.04 719 0.02 6,391,588 3,199,902 3,191,686
10 – 14 2,059 0.04 1210 0.04 849 0.03 5,539,980 2,766,874 2,773,106
15 – 19 1,598 0.04 890 0.04 708 0.03 4,354,621 2,119,000 2,235,621
20 – 24 1,841 0.05 907 0.05 934 0.05 3,696,044 1,661,802 2,034,242
25 – 29 1,050 0.03 557 0.04 493 0.03 3,203,434 1,448,123 1,755,311
30 – 34 955 0.03 468 0.04 487 0.03 2,759,838 1,299,455 1,460,383
35 – 39 726 0.03 372 0.03 354 0.03 2,316,072 1,116,109 1,199,963
40 – 44 808 0.04 392 0.04 416 0.05 1,799,981 890,665 909,316
45 – 49 532 0.04 248 0.04 284 0.04 1,425,499 676,961 748,538
50 – 54 557 0.05 277 0.05 280 0.05 1,150,215 574,318 575,897
55 – 59 306 0.04 167 0.04 139 0.04 738,213 371,920 366,293
60 – 64 417 0.06 242 0.07 175 0.05 737,242 362,372 374,870
65 – 69 259 0.05 137 0.06 122 0.05 474,731 229,408 245,323
70 – 74 396 0.09 190 0.09 206 0.09 459,643 217,389 242,254
75 – 79 225 0.08 122 0.09 103 0.07 283,580 140,155 143,425
80+ 533 0.12 268 0.13 265 0.10 459,822 203,283 256,539
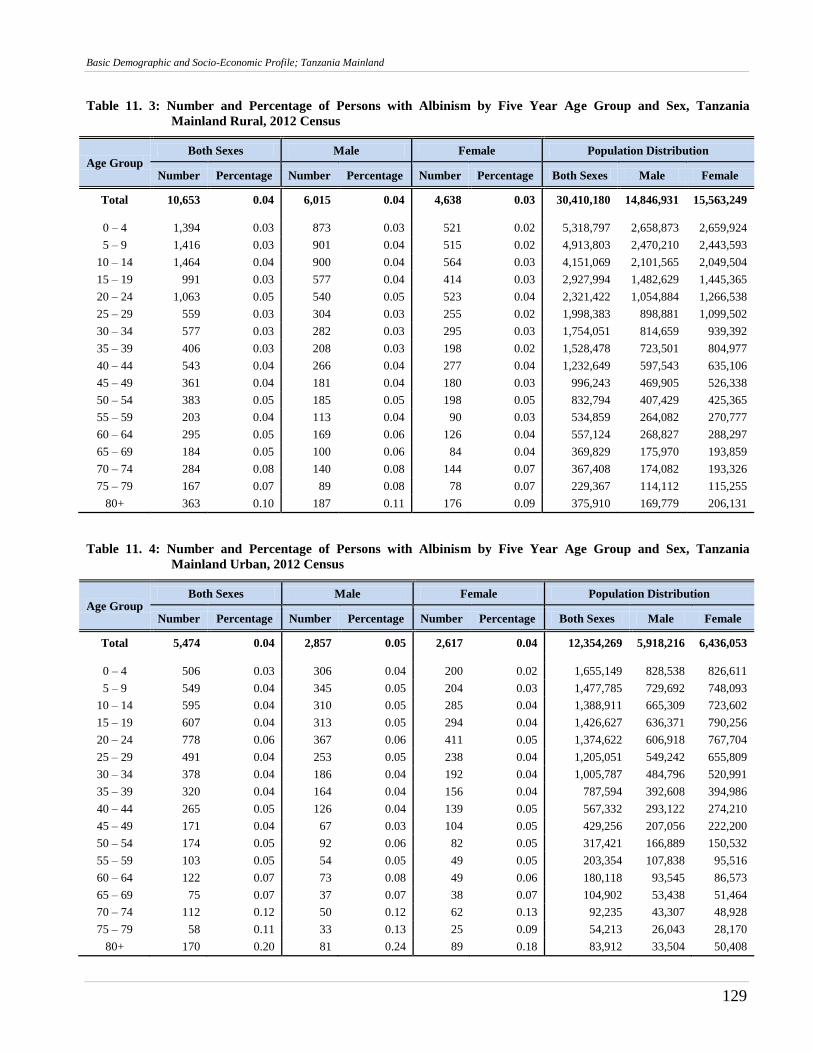
Basic Demographic and Socio-Economic Profile; Tanzania Mainland
129
Table 11. 3: Number and Percentage of Persons with Albinism by Five Year Age Group and Sex, Tanzania
Mainland Rural, 2012 Census
Age Group Both Sexes Male Female Population Distribution
Number Percentage Number Percentage Number Percentage Both Sexes Male Female
Total 10,653 0.04 6,015 0.04 4,638 0.03 30,410,180 14,846,931 15,563,249
0 – 4 1,394 0.03 873 0.03 521 0.02 5,318,797 2,658,873 2,659,924
5 – 9 1,416 0.03 901 0.04 515 0.02 4,913,803 2,470,210 2,443,593
10 – 14 1,464 0.04 900 0.04 564 0.03 4,151,069 2,101,565 2,049,504
15 – 19 991 0.03 577 0.04 414 0.03 2,927,994 1,482,629 1,445,365
20 – 24 1,063 0.05 540 0.05 523 0.04 2,321,422 1,054,884 1,266,538
25 – 29 559 0.03 304 0.03 255 0.02 1,998,383 898,881 1,099,502
30 – 34 577 0.03 282 0.03 295 0.03 1,754,051 814,659 939,392
35 – 39 406 0.03 208 0.03 198 0.02 1,528,478 723,501 804,977
40 – 44 543 0.04 266 0.04 277 0.04 1,232,649 597,543 635,106
45 – 49 361 0.04 181 0.04 180 0.03 996,243 469,905 526,338
50 – 54 383 0.05 185 0.05 198 0.05 832,794 407,429 425,365
55 – 59 203 0.04 113 0.04 90 0.03 534,859 264,082 270,777
60 – 64 295 0.05 169 0.06 126 0.04 557,124 268,827 288,297
65 – 69 184 0.05 100 0.06 84 0.04 369,829 175,970 193,859
70 – 74 284 0.08 140 0.08 144 0.07 367,408 174,082 193,326
75 – 79 167 0.07 89 0.08 78 0.07 229,367 114,112 115,255
80+ 363 0.10 187 0.11 176 0.09 375,910 169,779 206,131
Table 11. 4: Number and Percentage of Persons with Albinism by Five Year Age Group and Sex, Tanzania
Mainland Urban, 2012 Census
Age Group Both Sexes Male Female Population Distribution
Number Percentage Number Percentage Number Percentage Both Sexes Male Female
Total 5,474 0.04 2,857 0.05 2,617 0.04 12,354,269 5,918,216 6,436,053
0 – 4 506 0.03 306 0.04 200 0.02 1,655,149 828,538 826,611
5 – 9 549 0.04 345 0.05 204 0.03 1,477,785 729,692 748,093
10 – 14 595 0.04 310 0.05 285 0.04 1,388,911 665,309 723,602
15 – 19 607 0.04 313 0.05 294 0.04 1,426,627 636,371 790,256
20 – 24 778 0.06 367 0.06 411 0.05 1,374,622 606,918 767,704
25 – 29 491 0.04 253 0.05 238 0.04 1,205,051 549,242 655,809
30 – 34 378 0.04 186 0.04 192 0.04 1,005,787 484,796 520,991
35 – 39 320 0.04 164 0.04 156 0.04 787,594 392,608 394,986
40 – 44 265 0.05 126 0.04 139 0.05 567,332 293,122 274,210
45 – 49 171 0.04 67 0.03 104 0.05 429,256 207,056 222,200
50 – 54 174 0.05 92 0.06 82 0.05 317,421 166,889 150,532
55 – 59 103 0.05 54 0.05 49 0.05 203,354 107,838 95,516
60 – 64 122 0.07 73 0.08 49 0.06 180,118 93,545 86,573
65 – 69 75 0.07 37 0.07 38 0.07 104,902 53,438 51,464
70 – 74 112 0.12 50 0.12 62 0.13 92,235 43,307 48,928
75 – 79 58 0.11 33 0.13 25 0.09 54,213 26,043 28,170
80+ 170 0.20 81 0.24 89 0.18 83,912 33,504 50,408
Basic Demographic and Socio-Economic Profile; Tanzania Mainland
130
Table 11.5 and Figure 11.1 show the percentage of persons with disabilities by type of disability, sex
and ten year age groups. Difficulty in seeing was relatively the most reported disability by respondents
(1.9 percent), followed by walking (1.2 percent) and difficult in hearing (1.0 percent). In general, there
were no marked differences between males and females, although percentages of female population
with disability were slightly higher than that of males. The 2012 PHC results revealed that the
percentage of persons with disability was considerably higher among older persons compared with
younger persons. For instance, the percentage of population with difficult in seeing ranges from 0.3
percent among population below 10 years to over 20 percent for those aged 70 years and above and
similar differences can be observed in all disability categories.
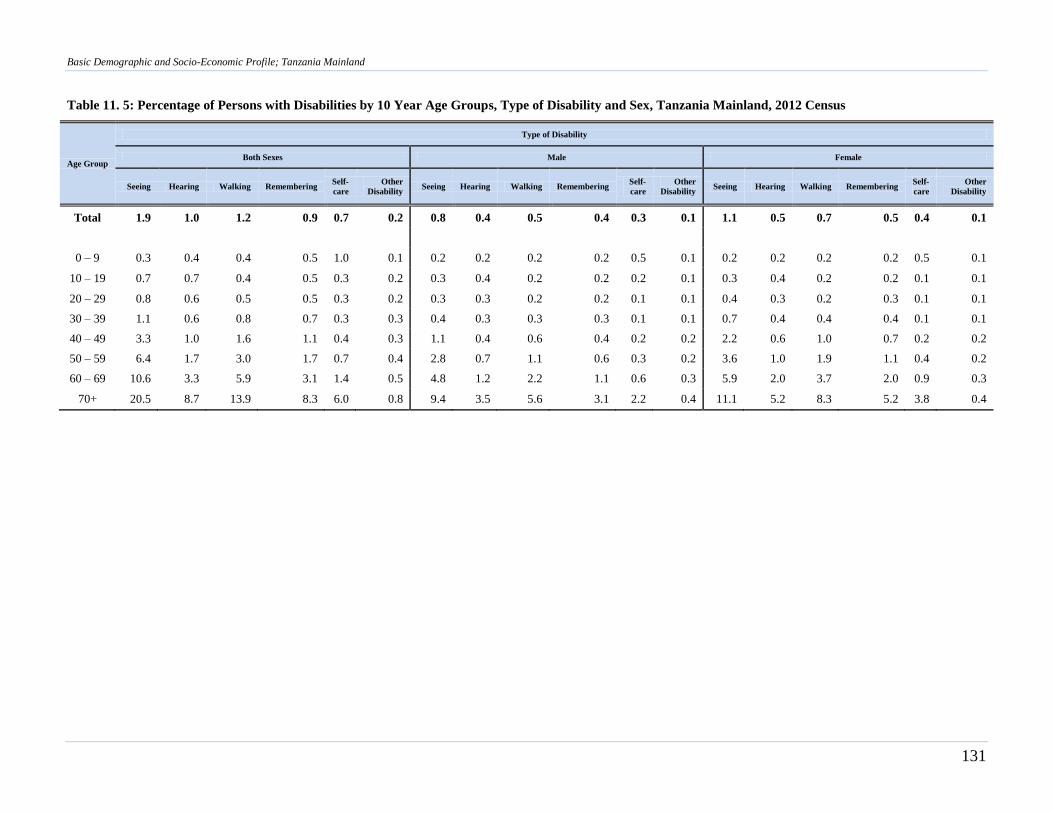
Basic Demographic and Socio-Economic Profile; Tanzania Mainland
131
Table 11. 5: Percentage of Persons with Disabilities by 10 Year Age Groups, Type of Disability and Sex, Tanzania Mainland, 2012 Census
Age Group
Type of Disability
Both Sexes Male Female
Seeing Hearing Walking Remembering Self-
care
Other
Disability Seeing Hearing Walking Remembering
Self-
care
Other
Disability Seeing Hearing Walking Remembering
Self-
care
Other
Disability
Total 1.9 1.0 1.2 0.9 0.7 0.2 0.8 0.4 0.5 0.4 0.3 0.1 1.1 0.5 0.7 0.5 0.4 0.1
0 – 9 0.3 0.4 0.4 0.5 1.0 0.1 0.2 0.2 0.2 0.2 0.5 0.1 0.2 0.2 0.2 0.2 0.5 0.1
10 – 19 0.7 0.7 0.4 0.5 0.3 0.2 0.3 0.4 0.2 0.2 0.2 0.1 0.3 0.4 0.2 0.2 0.1 0.1
20 – 29 0.8 0.6 0.5 0.5 0.3 0.2 0.3 0.3 0.2 0.2 0.1 0.1 0.4 0.3 0.2 0.3 0.1 0.1
30 – 39 1.1 0.6 0.8 0.7 0.3 0.3 0.4 0.3 0.3 0.3 0.1 0.1 0.7 0.4 0.4 0.4 0.1 0.1
40 – 49 3.3 1.0 1.6 1.1 0.4 0.3 1.1 0.4 0.6 0.4 0.2 0.2 2.2 0.6 1.0 0.7 0.2 0.2
50 – 59 6.4 1.7 3.0 1.7 0.7 0.4 2.8 0.7 1.1 0.6 0.3 0.2 3.6 1.0 1.9 1.1 0.4 0.2
60 – 69 10.6 3.3 5.9 3.1 1.4 0.5 4.8 1.2 2.2 1.1 0.6 0.3 5.9 2.0 3.7 2.0 0.9 0.3
70+ 20.5 8.7 13.9 8.3 6.0 0.8 9.4 3.5 5.6 3.1 2.2 0.4 11.1 5.2 8.3 5.2 3.8 0.4
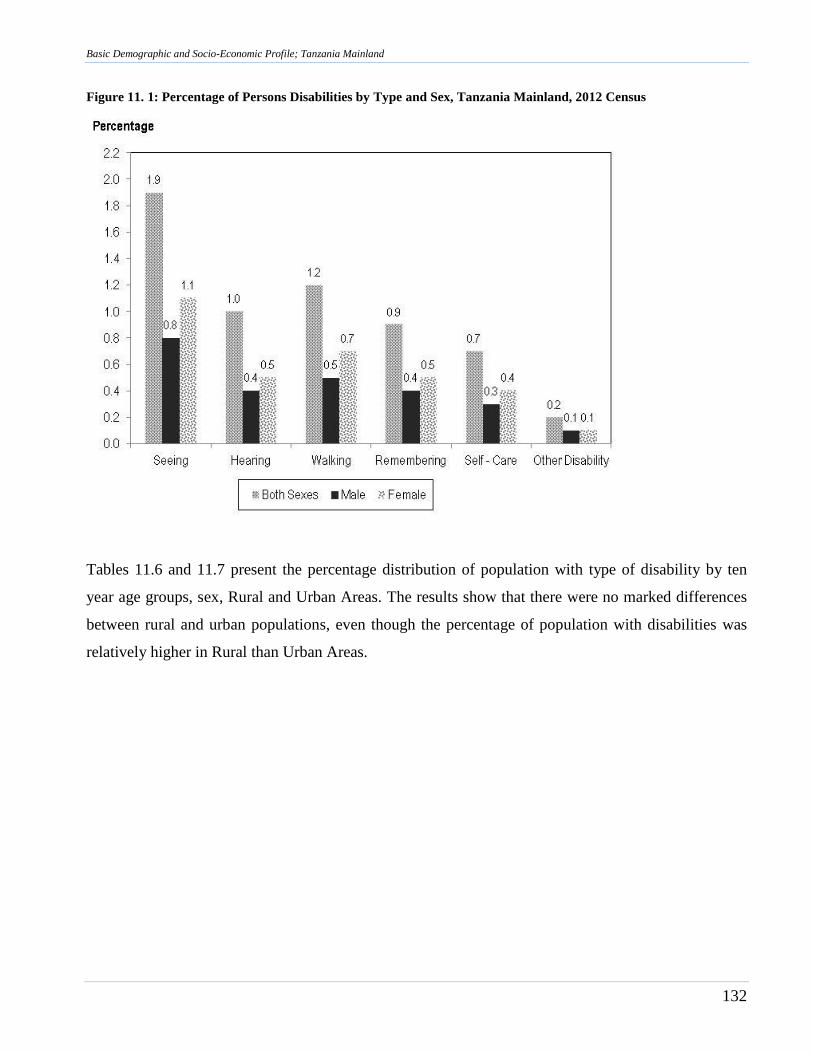
Basic Demographic and Socio-Economic Profile; Tanzania Mainland
132
Figure 11. 1: Percentage of Persons Disabilities by Type and Sex, Tanzania Mainland, 2012 Census
Tables 11.6 and 11.7 present the percentage distribution of population with type of disability by ten
year age groups, sex, Rural and Urban Areas. The results show that there were no marked differences
between rural and urban populations, even though the percentage of population with disabilities was
relatively higher in Rural than Urban Areas.
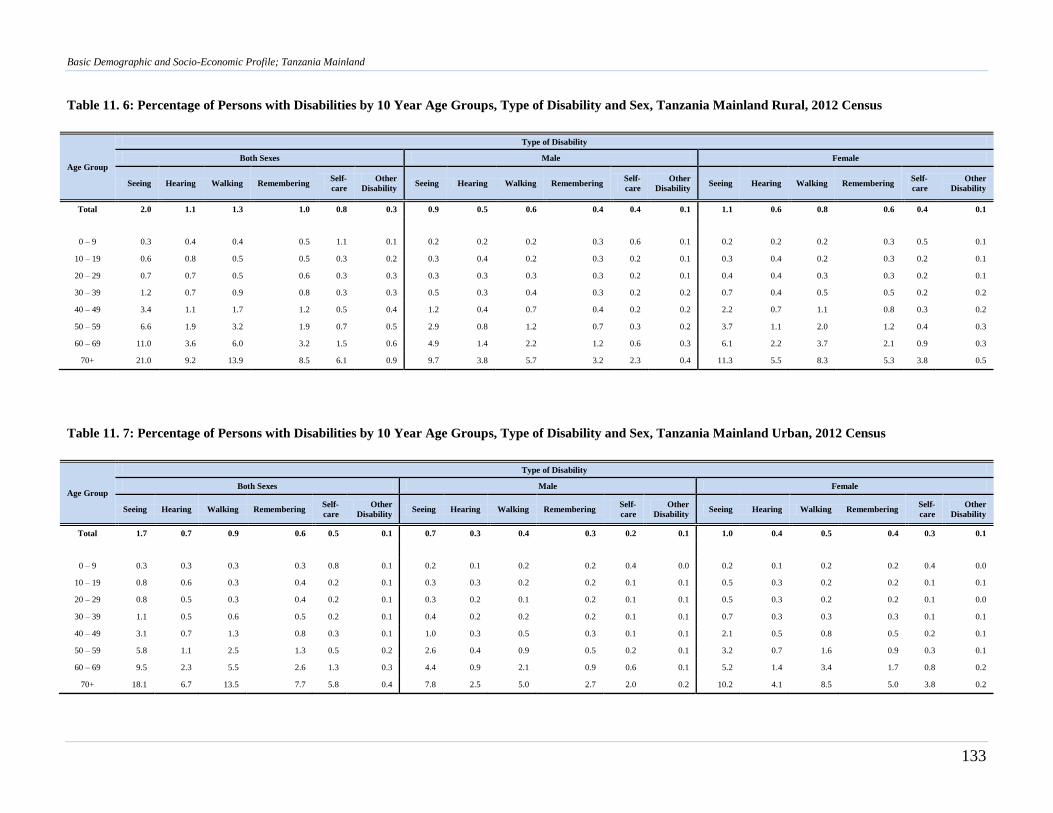
Basic Demographic and Socio-Economic Profile; Tanzania Mainland
133
Table 11. 6: Percentage of Persons with Disabilities by 10 Year Age Groups, Type of Disability and Sex, Tanzania Mainland Rural, 2012 Census
Age Group
Type of Disability
Both Sexes Male Female
Seeing Hearing Walking Remembering Self-
care
Other
Disability Seeing Hearing Walking Remembering
Self-
care
Other
Disability Seeing Hearing Walking Remembering
Self-
care
Other
Disability
Total 2.0 1.1 1.3 1.0 0.8 0.3 0.9 0.5 0.6 0.4 0.4 0.1 1.1 0.6 0.8 0.6 0.4 0.1
0 – 9 0.3 0.4 0.4 0.5 1.1 0.1 0.2 0.2 0.2 0.3 0.6 0.1 0.2 0.2 0.2 0.3 0.5 0.1
10 – 19 0.6 0.8 0.5 0.5 0.3 0.2 0.3 0.4 0.2 0.3 0.2 0.1 0.3 0.4 0.2 0.3 0.2 0.1
20 – 29 0.7 0.7 0.5 0.6 0.3 0.3 0.3 0.3 0.3 0.3 0.2 0.1 0.4 0.4 0.3 0.3 0.2 0.1
30 – 39 1.2 0.7 0.9 0.8 0.3 0.3 0.5 0.3 0.4 0.3 0.2 0.2 0.7 0.4 0.5 0.5 0.2 0.2
40 – 49 3.4 1.1 1.7 1.2 0.5 0.4 1.2 0.4 0.7 0.4 0.2 0.2 2.2 0.7 1.1 0.8 0.3 0.2
50 – 59 6.6 1.9 3.2 1.9 0.7 0.5 2.9 0.8 1.2 0.7 0.3 0.2 3.7 1.1 2.0 1.2 0.4 0.3
60 – 69 11.0 3.6 6.0 3.2 1.5 0.6 4.9 1.4 2.2 1.2 0.6 0.3 6.1 2.2 3.7 2.1 0.9 0.3
70+ 21.0 9.2 13.9 8.5 6.1 0.9 9.7 3.8 5.7 3.2 2.3 0.4 11.3 5.5 8.3 5.3 3.8 0.5
Table 11. 7: Percentage of Persons with Disabilities by 10 Year Age Groups, Type of Disability and Sex, Tanzania Mainland Urban, 2012 Census
Age Group
Type of Disability
Both Sexes Male Female
Seeing Hearing Walking Remembering Self-
care
Other
Disability Seeing Hearing Walking Remembering
Self-
care
Other
Disability Seeing Hearing Walking Remembering
Self-
care
Other
Disability
Total 1.7 0.7 0.9 0.6 0.5 0.1 0.7 0.3 0.4 0.3 0.2 0.1 1.0 0.4 0.5 0.4 0.3 0.1
0 – 9 0.3 0.3 0.3 0.3 0.8 0.1 0.2 0.1 0.2 0.2 0.4 0.0 0.2 0.1 0.2 0.2 0.4 0.0
10 – 19 0.8 0.6 0.3 0.4 0.2 0.1 0.3 0.3 0.2 0.2 0.1 0.1 0.5 0.3 0.2 0.2 0.1 0.1
20 – 29 0.8 0.5 0.3 0.4 0.2 0.1 0.3 0.2 0.1 0.2 0.1 0.1 0.5 0.3 0.2 0.2 0.1 0.0
30 – 39 1.1 0.5 0.6 0.5 0.2 0.1 0.4 0.2 0.2 0.2 0.1 0.1 0.7 0.3 0.3 0.3 0.1 0.1
40 – 49 3.1 0.7 1.3 0.8 0.3 0.1 1.0 0.3 0.5 0.3 0.1 0.1 2.1 0.5 0.8 0.5 0.2 0.1
50 – 59 5.8 1.1 2.5 1.3 0.5 0.2 2.6 0.4 0.9 0.5 0.2 0.1 3.2 0.7 1.6 0.9 0.3 0.1
60 – 69 9.5 2.3 5.5 2.6 1.3 0.3 4.4 0.9 2.1 0.9 0.6 0.1 5.2 1.4 3.4 1.7 0.8 0.2
70+ 18.1 6.7 13.5 7.7 5.8 0.4 7.8 2.5 5.0 2.7 2.0 0.2 10.2 4.1 8.5 5.0 3.8 0.2
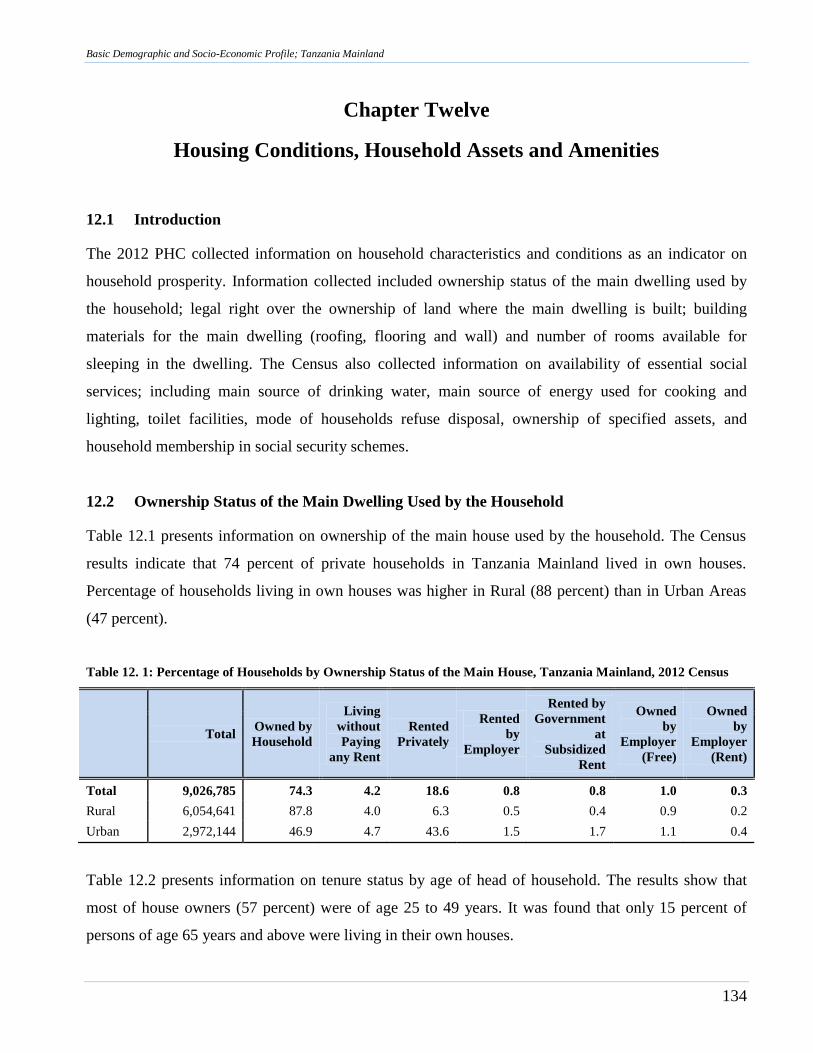
Basic Demographic and Socio-Economic Profile; Tanzania Mainland
134
Chapter Twelve
Housing Conditions, Household Assets and Amenities
12.1 Introduction
The 2012 PHC collected information on household characteristics and conditions as an indicator on
household prosperity. Information collected included ownership status of the main dwelling used by
the household; legal right over the ownership of land where the main dwelling is built; building
materials for the main dwelling (roofing, flooring and wall) and number of rooms available for
sleeping in the dwelling. The Census also collected information on availability of essential social
services; including main source of drinking water, main source of energy used for cooking and
lighting, toilet facilities, mode of households refuse disposal, ownership of specified assets, and
household membership in social security schemes.
12.2 Ownership Status of the Main Dwelling Used by the Household
Table 12.1 presents information on ownership of the main house used by the household. The Census
results indicate that 74 percent of private households in Tanzania Mainland lived in own houses.
Percentage of households living in own houses was higher in Rural (88 percent) than in Urban Areas
(47 percent).
Table 12. 1: Percentage of Households by Ownership Status of the Main House, Tanzania Mainland, 2012 Census
Total
Owned by
Household
Living
without
Paying
any Rent
Rented
Privately
Rented
by
Employer
Rented by
Government
at
Subsidized
Rent
Owned
by
Employer
(Free)
Owned
by
Employer
(Rent)
Total 9,026,785 74.3 4.2 18.6 0.8 0.8 1.0 0.3
Rural 6,054,641 87.8 4.0 6.3 0.5 0.4 0.9 0.2
Urban 2,972,144 46.9 4.7 43.6 1.5 1.7 1.1 0.4
Table 12.2 presents information on tenure status by age of head of household. The results show that
most of house owners (57 percent) were of age 25 to 49 years. It was found that only 15 percent of
persons of age 65 years and above were living in their own houses.
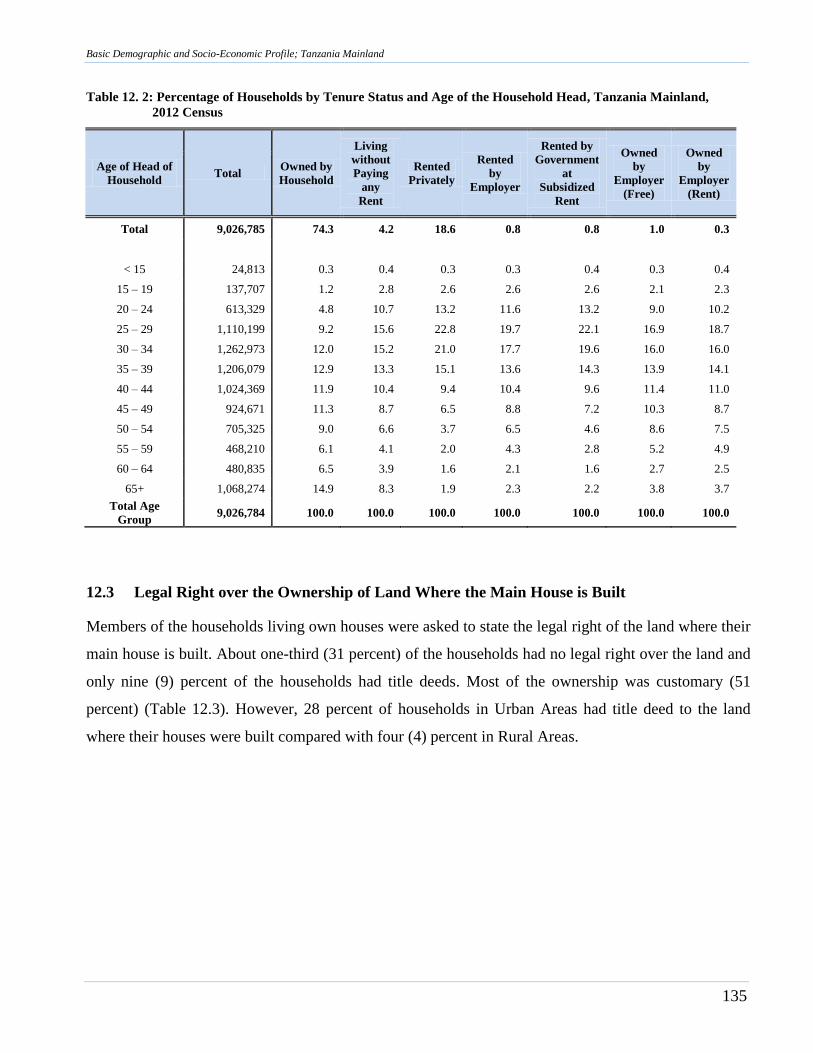
Basic Demographic and Socio-Economic Profile; Tanzania Mainland
135
Table 12. 2: Percentage of Households by Tenure Status and Age of the Household Head, Tanzania Mainland,
2012 Census
Age of Head of
Household Total
Owned by
Household
Living
without
Paying
any
Rent
Rented
Privately
Rented
by
Employer
Rented by
Government
at
Subsidized
Rent
Owned
by
Employer
(Free)
Owned
by
Employer
(Rent)
Total 9,026,785 74.3 4.2 18.6 0.8 0.8 1.0 0.3
< 15 24,813 0.3 0.4 0.3 0.3 0.4 0.3 0.4
15 – 19 137,707 1.2 2.8 2.6 2.6 2.6 2.1 2.3
20 – 24 613,329 4.8 10.7 13.2 11.6 13.2 9.0 10.2
25 – 29 1,110,199 9.2 15.6 22.8 19.7 22.1 16.9 18.7
30 – 34 1,262,973 12.0 15.2 21.0 17.7 19.6 16.0 16.0
35 – 39 1,206,079 12.9 13.3 15.1 13.6 14.3 13.9 14.1
40 – 44 1,024,369 11.9 10.4 9.4 10.4 9.6 11.4 11.0
45 – 49 924,671 11.3 8.7 6.5 8.8 7.2 10.3 8.7
50 – 54 705,325 9.0 6.6 3.7 6.5 4.6 8.6 7.5
55 – 59 468,210 6.1 4.1 2.0 4.3 2.8 5.2 4.9
60 – 64 480,835 6.5 3.9 1.6 2.1 1.6 2.7 2.5
65+ 1,068,274 14.9 8.3 1.9 2.3 2.2 3.8 3.7
Total Age
Group 9,026,784 100.0 100.0 100.0 100.0 100.0 100.0 100.0
12.3 Legal Right over the Ownership of Land Where the Main House is Built
Members of the households living own houses were asked to state the legal right of the land where their
main house is built. About one-third (31 percent) of the households had no legal right over the land and
only nine (9) percent of the households had title deeds. Most of the ownership was customary (51
percent) (Table 12.3). However, 28 percent of households in Urban Areas had title deed to the land
where their houses were built compared with four (4) percent in Rural Areas.
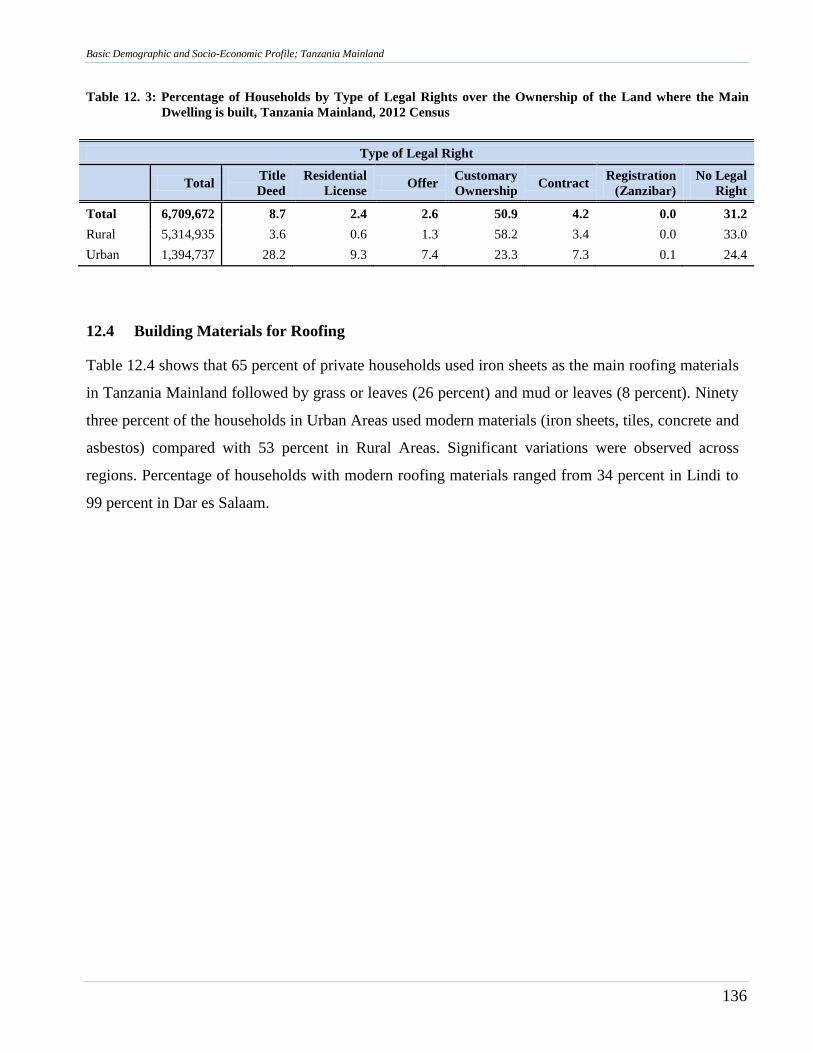
Basic Demographic and Socio-Economic Profile; Tanzania Mainland
136
Table 12. 3: Percentage of Households by Type of Legal Rights over the Ownership of the Land where the Main
Dwelling is built, Tanzania Mainland, 2012 Census
Type of Legal Right
Total
Title
Deed
Residential
License Offer
Customary
Ownership Contract
Registration
(Zanzibar)
No Legal
Right
Total 6,709,672 8.7 2.4 2.6 50.9 4.2 0.0 31.2
Rural 5,314,935 3.6 0.6 1.3 58.2 3.4 0.0 33.0
Urban 1,394,737 28.2 9.3 7.4 23.3 7.3 0.1 24.4
12.4 Building Materials for Roofing
Table 12.4 shows that 65 percent of private households used iron sheets as the main roofing materials
in Tanzania Mainland followed by grass or leaves (26 percent) and mud or leaves (8 percent). Ninety
three percent of the households in Urban Areas used modern materials (iron sheets, tiles, concrete and
asbestos) compared with 53 percent in Rural Areas. Significant variations were observed across
regions. Percentage of households with modern roofing materials ranged from 34 percent in Lindi to
99 percent in Dar es Salaam.
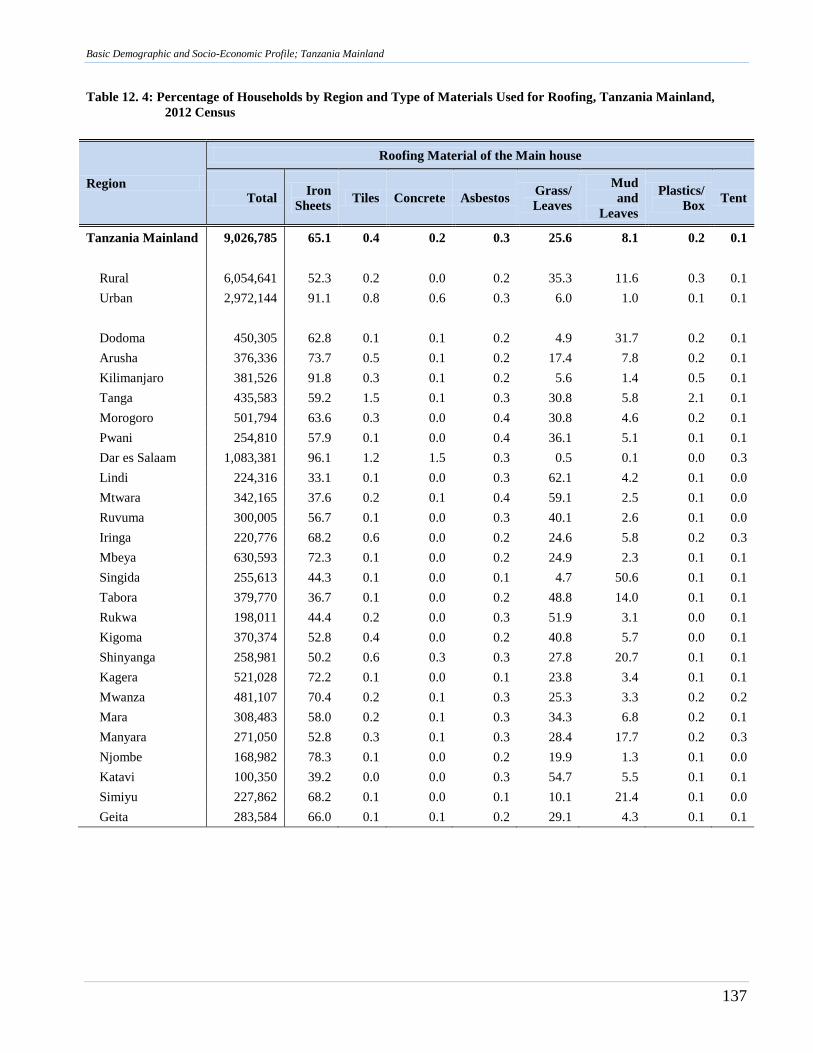
Basic Demographic and Socio-Economic Profile; Tanzania Mainland
137
Table 12. 4: Percentage of Households by Region and Type of Materials Used for Roofing, Tanzania Mainland,
2012 Census
Region
Roofing Material of the Main house
Total Iron
Sheets Tiles Concrete Asbestos
Grass/
Leaves
Mud
and
Leaves
Plastics/
Box Tent
Tanzania Mainland 9,026,785 65.1 0.4 0.2 0.3 25.6 8.1 0.2 0.1
Rural 6,054,641 52.3 0.2 0.0 0.2 35.3 11.6 0.3 0.1
Urban 2,972,144 91.1 0.8 0.6 0.3 6.0 1.0 0.1 0.1
Dodoma 450,305 62.8 0.1 0.1 0.2 4.9 31.7 0.2 0.1
Arusha 376,336 73.7 0.5 0.1 0.2 17.4 7.8 0.2 0.1
Kilimanjaro 381,526 91.8 0.3 0.1 0.2 5.6 1.4 0.5 0.1
Tanga 435,583 59.2 1.5 0.1 0.3 30.8 5.8 2.1 0.1
Morogoro 501,794 63.6 0.3 0.0 0.4 30.8 4.6 0.2 0.1
Pwani 254,810 57.9 0.1 0.0 0.4 36.1 5.1 0.1 0.1
Dar es Salaam 1,083,381 96.1 1.2 1.5 0.3 0.5 0.1 0.0 0.3
Lindi 224,316 33.1 0.1 0.0 0.3 62.1 4.2 0.1 0.0
Mtwara 342,165 37.6 0.2 0.1 0.4 59.1 2.5 0.1 0.0
Ruvuma 300,005 56.7 0.1 0.0 0.3 40.1 2.6 0.1 0.0
Iringa 220,776 68.2 0.6 0.0 0.2 24.6 5.8 0.2 0.3
Mbeya 630,593 72.3 0.1 0.0 0.2 24.9 2.3 0.1 0.1
Singida 255,613 44.3 0.1 0.0 0.1 4.7 50.6 0.1 0.1
Tabora 379,770 36.7 0.1 0.0 0.2 48.8 14.0 0.1 0.1
Rukwa 198,011 44.4 0.2 0.0 0.3 51.9 3.1 0.0 0.1
Kigoma 370,374 52.8 0.4 0.0 0.2 40.8 5.7 0.0 0.1
Shinyanga 258,981 50.2 0.6 0.3 0.3 27.8 20.7 0.1 0.1
Kagera 521,028 72.2 0.1 0.0 0.1 23.8 3.4 0.1 0.1
Mwanza 481,107 70.4 0.2 0.1 0.3 25.3 3.3 0.2 0.2
Mara 308,483 58.0 0.2 0.1 0.3 34.3 6.8 0.2 0.1
Manyara 271,050 52.8 0.3 0.1 0.3 28.4 17.7 0.2 0.3
Njombe 168,982 78.3 0.1 0.0 0.2 19.9 1.3 0.1 0.0
Katavi 100,350 39.2 0.0 0.0 0.3 54.7 5.5 0.1 0.1
Simiyu 227,862 68.2 0.1 0.0 0.1 10.1 21.4 0.1 0.0
Geita 283,584 66.0 0.1 0.1 0.2 29.1 4.3 0.1 0.1
Basic Demographic and Socio-Economic Profile; Tanzania Mainland
138
12.5 Building Materials for Flooring
Table 12.5 presents the percentage of households by type of floor material used for the main dwelling
and region. It was found that 61 percent of the total private households in Tanzania Mainland used
earth or sand as the main floor material, followed by cement (36 percent). In Urban Areas, cement was
the most common floor material used (74 percent), followed by earth or sand (22 percent). On the
other hand 80 percent of the rural households had used earth or sand as the main floor material
followed by cement (18 percent). Only two regions in Tanzania Mainland had more than 50 percent of
households using modern floor materials (cement, ceramic tiles, terrazzo, vinyl or asphalt strips and
parquet or polished wood) and these were Dar es Salaam (over 95 percent) and Kilimanjaro (58
percent).
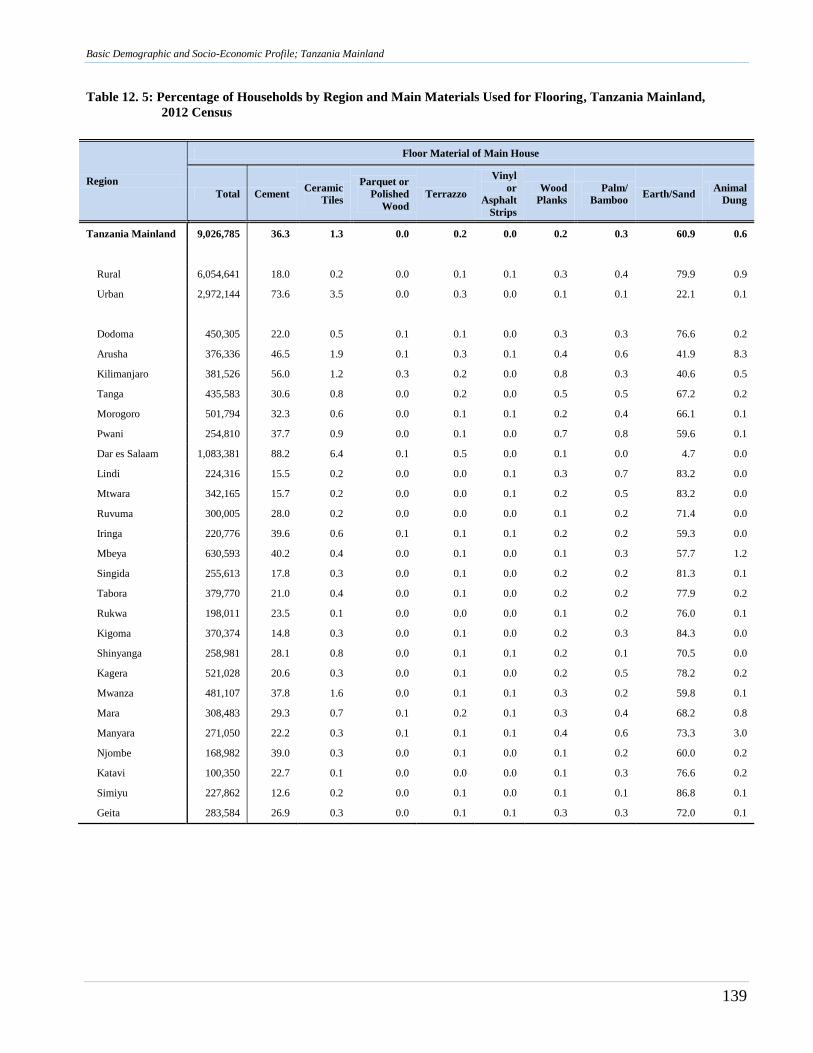
Basic Demographic and Socio-Economic Profile; Tanzania Mainland
139
Table 12. 5: Percentage of Households by Region and Main Materials Used for Flooring, Tanzania Mainland,
2012 Census
Region
Floor Material of Main House
Total Cement Ceramic
Tiles
Parquet or
Polished
Wood
Terrazzo
Vinyl
or
Asphalt
Strips
Wood
Planks
Palm/
Bamboo Earth/Sand
Animal
Dung
Tanzania Mainland 9,026,785 36.3 1.3 0.0 0.2 0.0 0.2 0.3 60.9 0.6
Rural 6,054,641 18.0 0.2 0.0 0.1 0.1 0.3 0.4 79.9 0.9
Urban 2,972,144 73.6 3.5 0.0 0.3 0.0 0.1 0.1 22.1 0.1
Dodoma 450,305 22.0 0.5 0.1 0.1 0.0 0.3 0.3 76.6 0.2
Arusha 376,336 46.5 1.9 0.1 0.3 0.1 0.4 0.6 41.9 8.3
Kilimanjaro 381,526 56.0 1.2 0.3 0.2 0.0 0.8 0.3 40.6 0.5
Tanga 435,583 30.6 0.8 0.0 0.2 0.0 0.5 0.5 67.2 0.2
Morogoro 501,794 32.3 0.6 0.0 0.1 0.1 0.2 0.4 66.1 0.1
Pwani 254,810 37.7 0.9 0.0 0.1 0.0 0.7 0.8 59.6 0.1
Dar es Salaam 1,083,381 88.2 6.4 0.1 0.5 0.0 0.1 0.0 4.7 0.0
Lindi 224,316 15.5 0.2 0.0 0.0 0.1 0.3 0.7 83.2 0.0
Mtwara 342,165 15.7 0.2 0.0 0.0 0.1 0.2 0.5 83.2 0.0
Ruvuma 300,005 28.0 0.2 0.0 0.0 0.0 0.1 0.2 71.4 0.0
Iringa 220,776 39.6 0.6 0.1 0.1 0.1 0.2 0.2 59.3 0.0
Mbeya 630,593 40.2 0.4 0.0 0.1 0.0 0.1 0.3 57.7 1.2
Singida 255,613 17.8 0.3 0.0 0.1 0.0 0.2 0.2 81.3 0.1
Tabora 379,770 21.0 0.4 0.0 0.1 0.0 0.2 0.2 77.9 0.2
Rukwa 198,011 23.5 0.1 0.0 0.0 0.0 0.1 0.2 76.0 0.1
Kigoma 370,374 14.8 0.3 0.0 0.1 0.0 0.2 0.3 84.3 0.0
Shinyanga 258,981 28.1 0.8 0.0 0.1 0.1 0.2 0.1 70.5 0.0
Kagera 521,028 20.6 0.3 0.0 0.1 0.0 0.2 0.5 78.2 0.2
Mwanza 481,107 37.8 1.6 0.0 0.1 0.1 0.3 0.2 59.8 0.1
Mara 308,483 29.3 0.7 0.1 0.2 0.1 0.3 0.4 68.2 0.8
Manyara 271,050 22.2 0.3 0.1 0.1 0.1 0.4 0.6 73.3 3.0
Njombe 168,982 39.0 0.3 0.0 0.1 0.0 0.1 0.2 60.0 0.2
Katavi 100,350 22.7 0.1 0.0 0.0 0.0 0.1 0.3 76.6 0.2
Simiyu 227,862 12.6 0.2 0.0 0.1 0.0 0.1 0.1 86.8 0.1
Geita 283,584 26.9 0.3 0.0 0.1 0.1 0.3 0.3 72.0 0.1
Basic Demographic and Socio-Economic Profile; Tanzania Mainland
140
12.6 Building Materials for Walls
Census results shows that 54 percent of all private households in Tanzania Mainland had walls of the main
dwelling built of sundried bricks and baked bricks with each accounting for 27 percent. Other materials
commonly used for building walls were poles and mud (24 percent), and cement bricks (19 percent). It was
also found that most of the households in the Urban Areas used cement bricks (51 percent) as wall materials
followed by baked bricks (25 percent), while in Rural Areas, the main wall materials used were sundried
bricks (33 percent) followed by poles/mud (31 percent) and baked bricks (28 percent) as presented in Table
12.6.
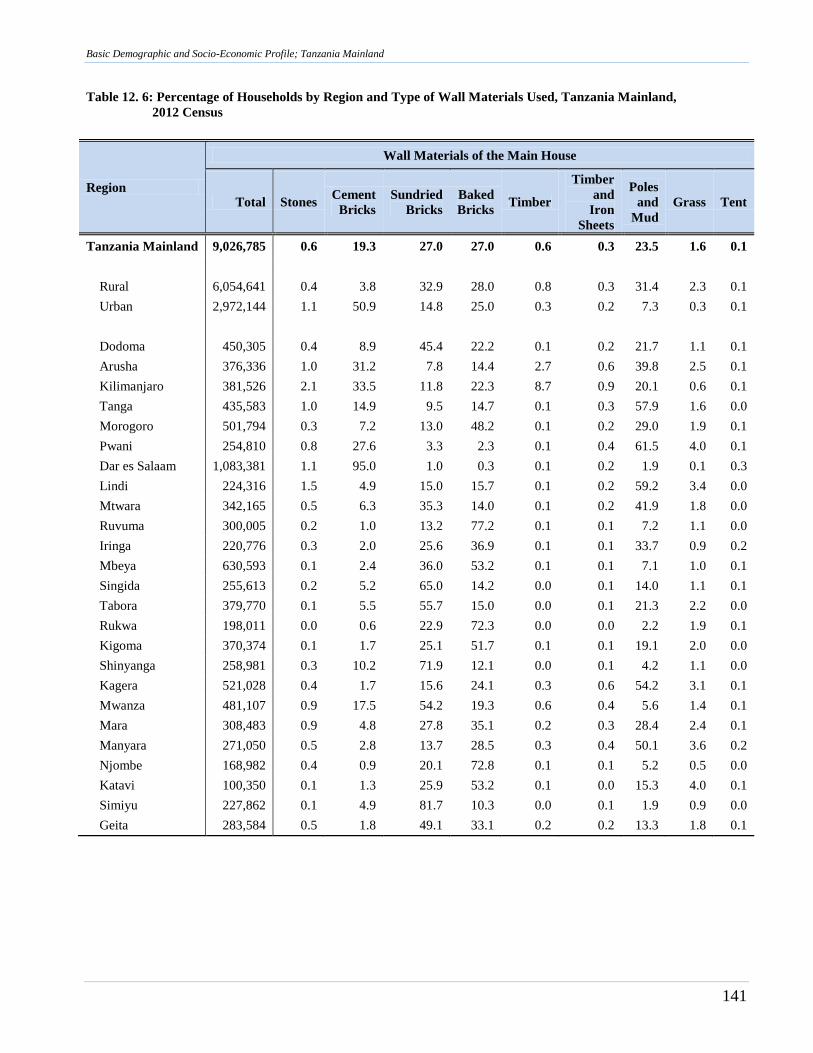
Basic Demographic and Socio-Economic Profile; Tanzania Mainland
141
Table 12. 6: Percentage of Households by Region and Type of Wall Materials Used, Tanzania Mainland,
2012 Census
Region
Wall Materials of the Main House
Total Stones Cement
Bricks
Sundried
Bricks
Baked
Bricks Timber
Timber
and
Iron
Sheets
Poles
and
Mud
Grass Tent
Tanzania Mainland 9,026,785 0.6 19.3 27.0 27.0 0.6 0.3 23.5 1.6 0.1
Rural 6,054,641 0.4 3.8 32.9 28.0 0.8 0.3 31.4 2.3 0.1
Urban 2,972,144 1.1 50.9 14.8 25.0 0.3 0.2 7.3 0.3 0.1
Dodoma 450,305 0.4 8.9 45.4 22.2 0.1 0.2 21.7 1.1 0.1
Arusha 376,336 1.0 31.2 7.8 14.4 2.7 0.6 39.8 2.5 0.1
Kilimanjaro 381,526 2.1 33.5 11.8 22.3 8.7 0.9 20.1 0.6 0.1
Tanga 435,583 1.0 14.9 9.5 14.7 0.1 0.3 57.9 1.6 0.0
Morogoro 501,794 0.3 7.2 13.0 48.2 0.1 0.2 29.0 1.9 0.1
Pwani 254,810 0.8 27.6 3.3 2.3 0.1 0.4 61.5 4.0 0.1
Dar es Salaam 1,083,381 1.1 95.0 1.0 0.3 0.1 0.2 1.9 0.1 0.3
Lindi 224,316 1.5 4.9 15.0 15.7 0.1 0.2 59.2 3.4 0.0
Mtwara 342,165 0.5 6.3 35.3 14.0 0.1 0.2 41.9 1.8 0.0
Ruvuma 300,005 0.2 1.0 13.2 77.2 0.1 0.1 7.2 1.1 0.0
Iringa 220,776 0.3 2.0 25.6 36.9 0.1 0.1 33.7 0.9 0.2
Mbeya 630,593 0.1 2.4 36.0 53.2 0.1 0.1 7.1 1.0 0.1
Singida 255,613 0.2 5.2 65.0 14.2 0.0 0.1 14.0 1.1 0.1
Tabora 379,770 0.1 5.5 55.7 15.0 0.0 0.1 21.3 2.2 0.0
Rukwa 198,011 0.0 0.6 22.9 72.3 0.0 0.0 2.2 1.9 0.1
Kigoma 370,374 0.1 1.7 25.1 51.7 0.1 0.1 19.1 2.0 0.0
Shinyanga 258,981 0.3 10.2 71.9 12.1 0.0 0.1 4.2 1.1 0.0
Kagera 521,028 0.4 1.7 15.6 24.1 0.3 0.6 54.2 3.1 0.1
Mwanza 481,107 0.9 17.5 54.2 19.3 0.6 0.4 5.6 1.4 0.1
Mara 308,483 0.9 4.8 27.8 35.1 0.2 0.3 28.4 2.4 0.1
Manyara 271,050 0.5 2.8 13.7 28.5 0.3 0.4 50.1 3.6 0.2
Njombe 168,982 0.4 0.9 20.1 72.8 0.1 0.1 5.2 0.5 0.0
Katavi 100,350 0.1 1.3 25.9 53.2 0.1 0.0 15.3 4.0 0.1
Simiyu 227,862 0.1 4.9 81.7 10.3 0.0 0.1 1.9 0.9 0.0
Geita 283,584 0.5 1.8 49.1 33.1 0.2 0.2 13.3 1.8 0.1
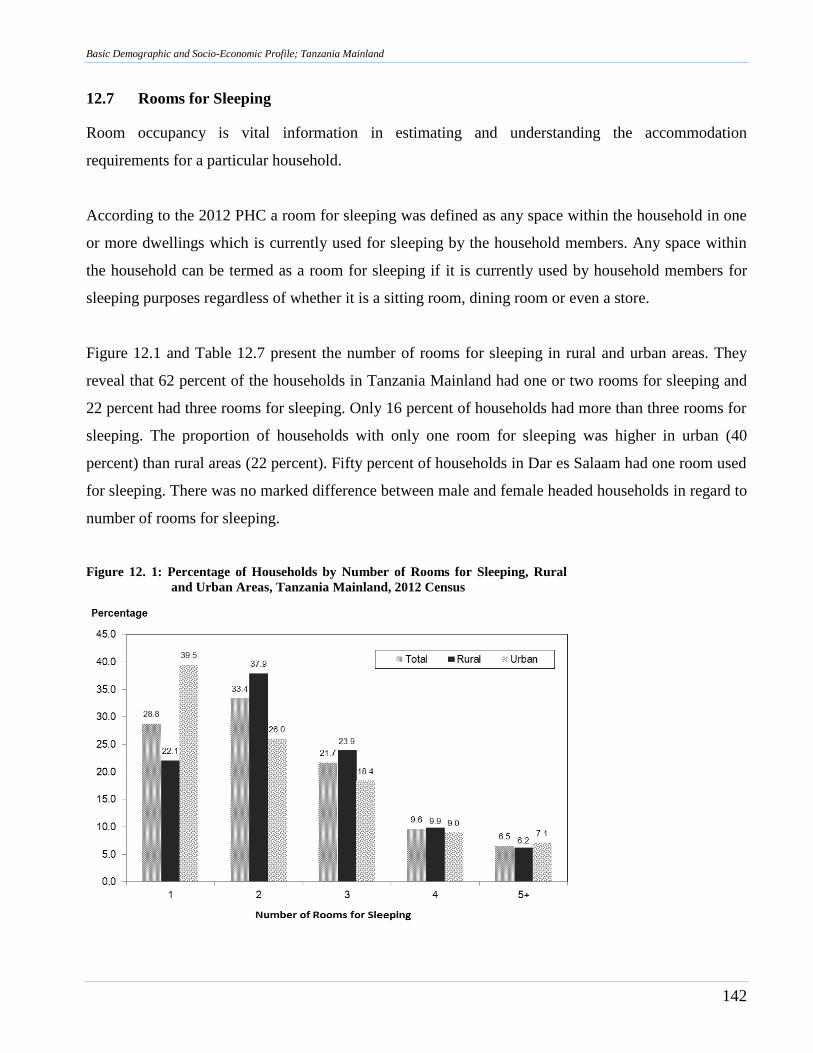
Basic Demographic and Socio-Economic Profile; Tanzania Mainland
142
12.7 Rooms for Sleeping
Room occupancy is vital information in estimating and understanding the accommodation
requirements for a particular household.
According to the 2012 PHC a room for sleeping was defined as any space within the household in one
or more dwellings which is currently used for sleeping by the household members. Any space within
the household can be termed as a room for sleeping if it is currently used by household members for
sleeping purposes regardless of whether it is a sitting room, dining room or even a store.
Figure 12.1 and Table 12.7 present the number of rooms for sleeping in rural and urban areas. They
reveal that 62 percent of the households in Tanzania Mainland had one or two rooms for sleeping and
22 percent had three rooms for sleeping. Only 16 percent of households had more than three rooms for
sleeping. The proportion of households with only one room for sleeping was higher in urban (40
percent) than rural areas (22 percent). Fifty percent of households in Dar es Salaam had one room used
for sleeping. There was no marked difference between male and female headed households in regard to
number of rooms for sleeping.
Figure 12. 1: Percentage of Households by Number of Rooms for Sleeping, Rural
and Urban Areas, Tanzania Mainland, 2012 Census
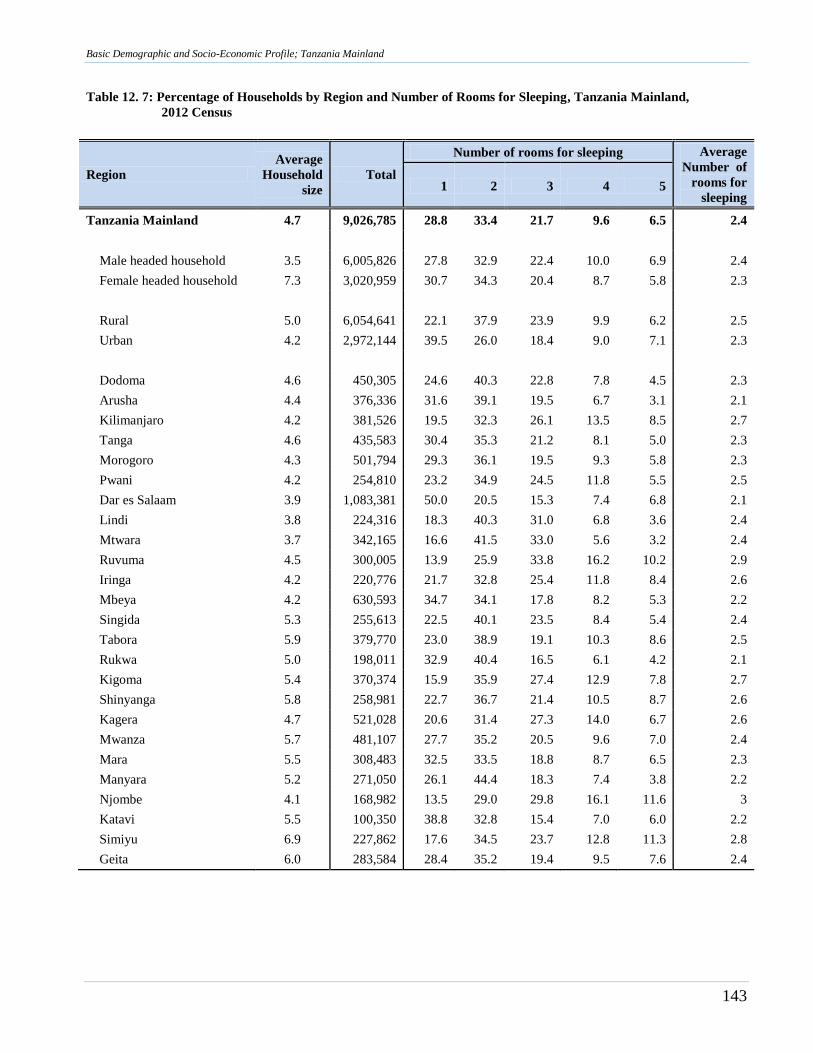
Basic Demographic and Socio-Economic Profile; Tanzania Mainland
143
Table 12. 7: Percentage of Households by Region and Number of Rooms for Sleeping, Tanzania Mainland,
2012 Census
Region
Average
Household
size
Total
Number of rooms for sleeping Average
Number of
rooms for
sleeping 1 2 3 4 5
Tanzania Mainland 4.7 9,026,785 28.8 33.4 21.7 9.6 6.5 2.4
Male headed household 3.5 6,005,826 27.8 32.9 22.4 10.0 6.9 2.4
Female headed household 7.3 3,020,959 30.7 34.3 20.4 8.7 5.8 2.3
Rural 5.0 6,054,641 22.1 37.9 23.9 9.9 6.2 2.5
Urban 4.2 2,972,144 39.5 26.0 18.4 9.0 7.1 2.3
Dodoma 4.6 450,305 24.6 40.3 22.8 7.8 4.5 2.3
Arusha 4.4 376,336 31.6 39.1 19.5 6.7 3.1 2.1
Kilimanjaro 4.2 381,526 19.5 32.3 26.1 13.5 8.5 2.7
Tanga 4.6 435,583 30.4 35.3 21.2 8.1 5.0 2.3
Morogoro 4.3 501,794 29.3 36.1 19.5 9.3 5.8 2.3
Pwani 4.2 254,810 23.2 34.9 24.5 11.8 5.5 2.5
Dar es Salaam 3.9 1,083,381 50.0 20.5 15.3 7.4 6.8 2.1
Lindi 3.8 224,316 18.3 40.3 31.0 6.8 3.6 2.4
Mtwara 3.7 342,165 16.6 41.5 33.0 5.6 3.2 2.4
Ruvuma 4.5 300,005 13.9 25.9 33.8 16.2 10.2 2.9
Iringa 4.2 220,776 21.7 32.8 25.4 11.8 8.4 2.6
Mbeya 4.2 630,593 34.7 34.1 17.8 8.2 5.3 2.2
Singida 5.3 255,613 22.5 40.1 23.5 8.4 5.4 2.4
Tabora 5.9 379,770 23.0 38.9 19.1 10.3 8.6 2.5
Rukwa 5.0 198,011 32.9 40.4 16.5 6.1 4.2 2.1
Kigoma 5.4 370,374 15.9 35.9 27.4 12.9 7.8 2.7
Shinyanga 5.8 258,981 22.7 36.7 21.4 10.5 8.7 2.6
Kagera 4.7 521,028 20.6 31.4 27.3 14.0 6.7 2.6
Mwanza 5.7 481,107 27.7 35.2 20.5 9.6 7.0 2.4
Mara 5.5 308,483 32.5 33.5 18.8 8.7 6.5 2.3
Manyara 5.2 271,050 26.1 44.4 18.3 7.4 3.8 2.2
Njombe 4.1 168,982 13.5 29.0 29.8 16.1 11.6 3
Katavi 5.5 100,350 38.8 32.8 15.4 7.0 6.0 2.2
Simiyu 6.9 227,862 17.6 34.5 23.7 12.8 11.3 2.8
Geita 6.0 283,584 28.4 35.2 19.4 9.5 7.6 2.4
Basic Demographic and Socio-Economic Profile; Tanzania Mainland
144
12.8 Source of Drinking Water
During the 2012 PHC, households were asked to mention their main source of drinking water. Table
12.8 shows that 36 percent of private households in Tanzania Mainland used piped water as the main
source of drinking water (11 percent had water piped into their houses, eight (8) percent had water
piped into the yard and 17 percent used public tap). In urban areas, 58 percent of private households
used piped water as their main source of drinking water compared with 25 percent of households in
rural areas.
Map 12.1 presents percentages of households that used piped water as their main source of drinking
water by region. Percentages of households using piped water ranged from 78 percent in Kilimanjaro
to 8 percent in Geita.
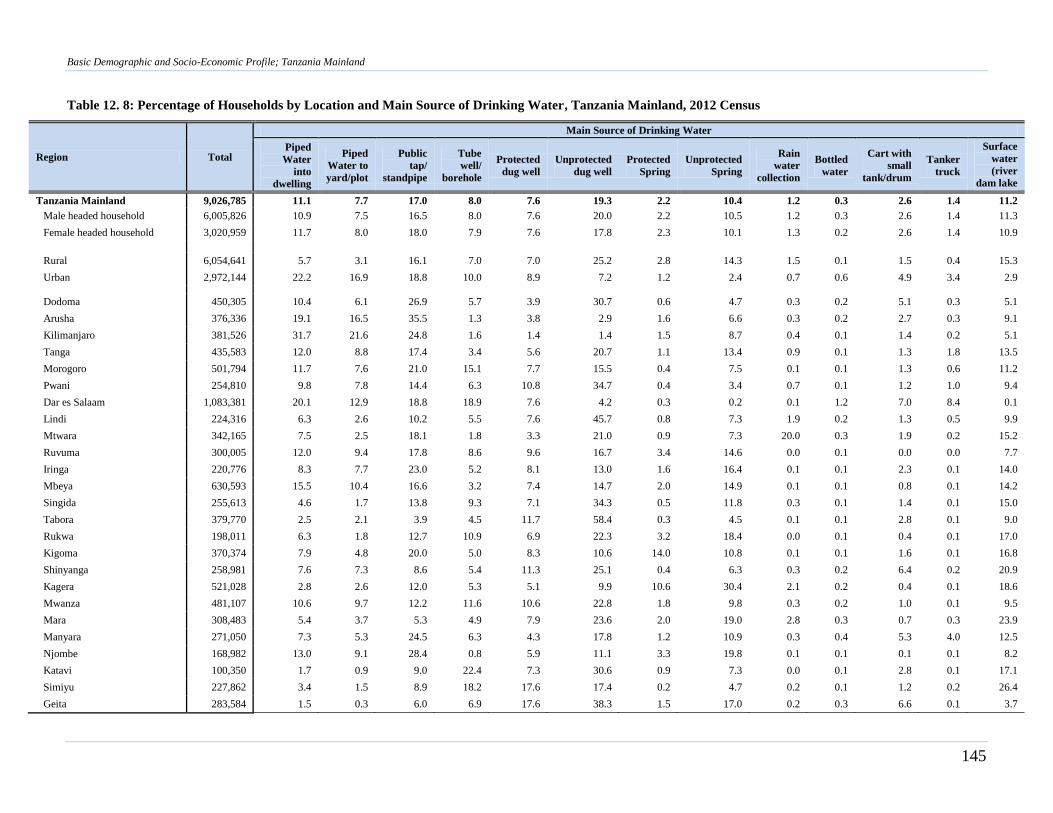
Basic Demographic and Socio-Economic Profile; Tanzania Mainland
145
Table 12. 8: Percentage of Households by Location and Main Source of Drinking Water, Tanzania Mainland, 2012 Census
Region Total
Main Source of Drinking Water
Piped
Water
into
dwelling
Piped
Water to
yard/plot
Public
tap/
standpipe
Tube
well/
borehole
Protected
dug well
Unprotected
dug well
Protected
Spring
Unprotected
Spring
Rain
water
collection
Bottled
water
Cart with
small
tank/drum
Tanker
truck
Surface
water
(river
dam lake
etc.) Tanzania Mainland 9,026,785 11.1 7.7 17.0 8.0 7.6 19.3 2.2 10.4 1.2 0.3 2.6 1.4 11.2
Male headed household 6,005,826 10.9 7.5 16.5 8.0 7.6 20.0 2.2 10.5 1.2 0.3 2.6 1.4 11.3
Female headed household 3,020,959 11.7 8.0 18.0 7.9 7.6 17.8 2.3 10.1 1.3 0.2 2.6 1.4 10.9
Rural 6,054,641 5.7 3.1 16.1 7.0 7.0 25.2 2.8 14.3 1.5 0.1 1.5 0.4 15.3
Urban 2,972,144 22.2 16.9 18.8 10.0 8.9 7.2 1.2 2.4 0.7 0.6 4.9 3.4 2.9
Dodoma 450,305 10.4 6.1 26.9 5.7 3.9 30.7 0.6 4.7 0.3 0.2 5.1 0.3 5.1
Arusha 376,336 19.1 16.5 35.5 1.3 3.8 2.9 1.6 6.6 0.3 0.2 2.7 0.3 9.1
Kilimanjaro 381,526 31.7 21.6 24.8 1.6 1.4 1.4 1.5 8.7 0.4 0.1 1.4 0.2 5.1
Tanga 435,583 12.0 8.8 17.4 3.4 5.6 20.7 1.1 13.4 0.9 0.1 1.3 1.8 13.5
Morogoro 501,794 11.7 7.6 21.0 15.1 7.7 15.5 0.4 7.5 0.1 0.1 1.3 0.6 11.2
Pwani 254,810 9.8 7.8 14.4 6.3 10.8 34.7 0.4 3.4 0.7 0.1 1.2 1.0 9.4
Dar es Salaam 1,083,381 20.1 12.9 18.8 18.9 7.6 4.2 0.3 0.2 0.1 1.2 7.0 8.4 0.1
Lindi 224,316 6.3 2.6 10.2 5.5 7.6 45.7 0.8 7.3 1.9 0.2 1.3 0.5 9.9
Mtwara 342,165 7.5 2.5 18.1 1.8 3.3 21.0 0.9 7.3 20.0 0.3 1.9 0.2 15.2
Ruvuma 300,005 12.0 9.4 17.8 8.6 9.6 16.7 3.4 14.6 0.0 0.1 0.0 0.0 7.7
Iringa 220,776 8.3 7.7 23.0 5.2 8.1 13.0 1.6 16.4 0.1 0.1 2.3 0.1 14.0
Mbeya 630,593 15.5 10.4 16.6 3.2 7.4 14.7 2.0 14.9 0.1 0.1 0.8 0.1 14.2
Singida 255,613 4.6 1.7 13.8 9.3 7.1 34.3 0.5 11.8 0.3 0.1 1.4 0.1 15.0
Tabora 379,770 2.5 2.1 3.9 4.5 11.7 58.4 0.3 4.5 0.1 0.1 2.8 0.1 9.0
Rukwa 198,011 6.3 1.8 12.7 10.9 6.9 22.3 3.2 18.4 0.0 0.1 0.4 0.1 17.0
Kigoma 370,374 7.9 4.8 20.0 5.0 8.3 10.6 14.0 10.8 0.1 0.1 1.6 0.1 16.8
Shinyanga 258,981 7.6 7.3 8.6 5.4 11.3 25.1 0.4 6.3 0.3 0.2 6.4 0.2 20.9
Kagera 521,028 2.8 2.6 12.0 5.3 5.1 9.9 10.6 30.4 2.1 0.2 0.4 0.1 18.6
Mwanza 481,107 10.6 9.7 12.2 11.6 10.6 22.8 1.8 9.8 0.3 0.2 1.0 0.1 9.5
Mara 308,483 5.4 3.7 5.3 4.9 7.9 23.6 2.0 19.0 2.8 0.3 0.7 0.3 23.9
Manyara 271,050 7.3 5.3 24.5 6.3 4.3 17.8 1.2 10.9 0.3 0.4 5.3 4.0 12.5
Njombe 168,982 13.0 9.1 28.4 0.8 5.9 11.1 3.3 19.8 0.1 0.1 0.1 0.1 8.2
Katavi 100,350 1.7 0.9 9.0 22.4 7.3 30.6 0.9 7.3 0.0 0.1 2.8 0.1 17.1
Simiyu 227,862 3.4 1.5 8.9 18.2 17.6 17.4 0.2 4.7 0.2 0.1 1.2 0.2 26.4
Geita 283,584 1.5 0.3 6.0 6.9 17.6 38.3 1.5 17.0 0.2 0.3 6.6 0.1 3.7
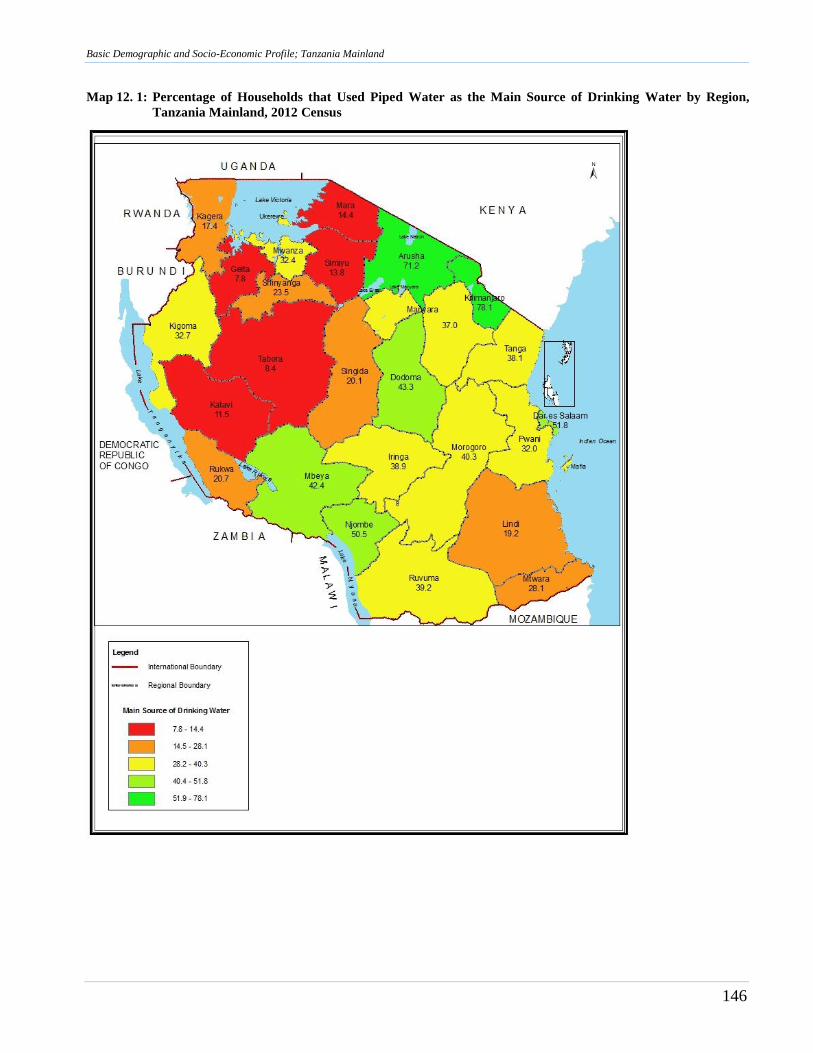
Basic Demographic and Socio-Economic Profile; Tanzania Mainland
146
Map 12. 1: Percentage of Households that Used Piped Water as the Main Source of Drinking Water by Region,
Tanzania Mainland, 2012 Census
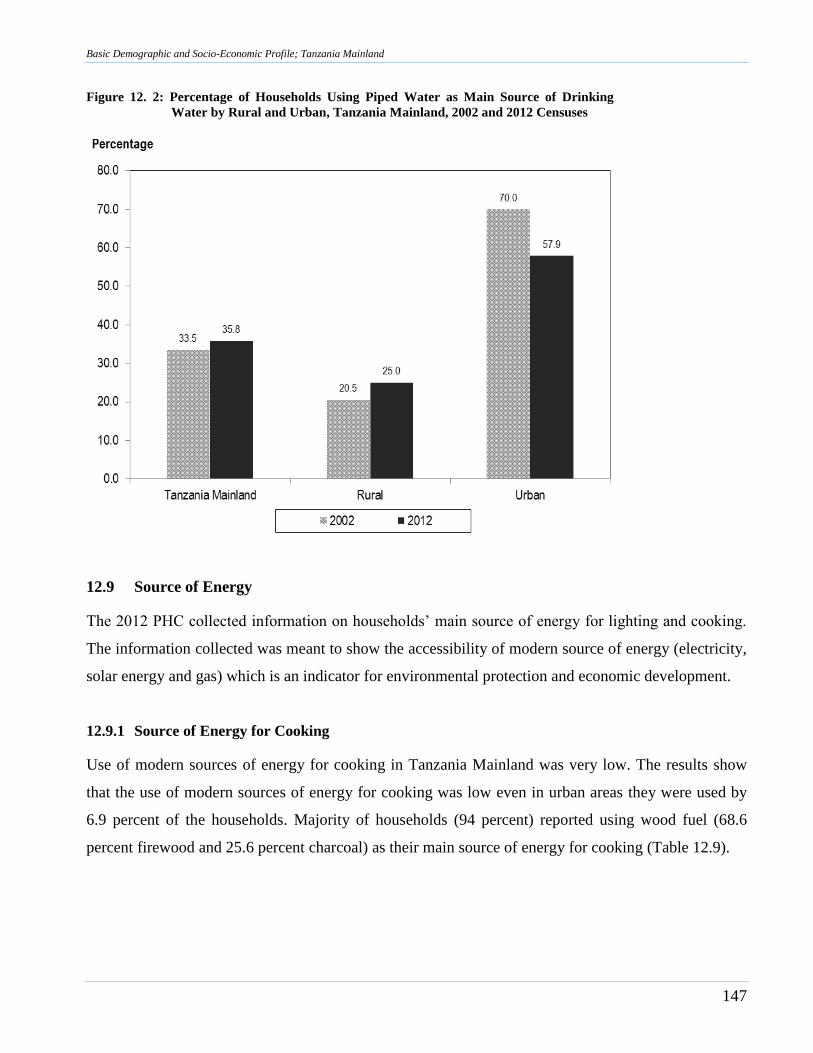
Basic Demographic and Socio-Economic Profile; Tanzania Mainland
147
Figure 12. 2: Percentage of Households Using Piped Water as Main Source of Drinking
Water by Rural and Urban, Tanzania Mainland, 2002 and 2012 Censuses
12.9 Source of Energy
The 2012 PHC collected information on households‟ main source of energy for lighting and cooking.
The information collected was meant to show the accessibility of modern source of energy (electricity,
solar energy and gas) which is an indicator for environmental protection and economic development.
12.9.1 Source of Energy for Cooking
Use of modern sources of energy for cooking in Tanzania Mainland was very low. The results show
that the use of modern sources of energy for cooking was low even in urban areas they were used by
6.9 percent of the households. Majority of households (94 percent) reported using wood fuel (68.6
percent firewood and 25.6 percent charcoal) as their main source of energy for cooking (Table 12.9).
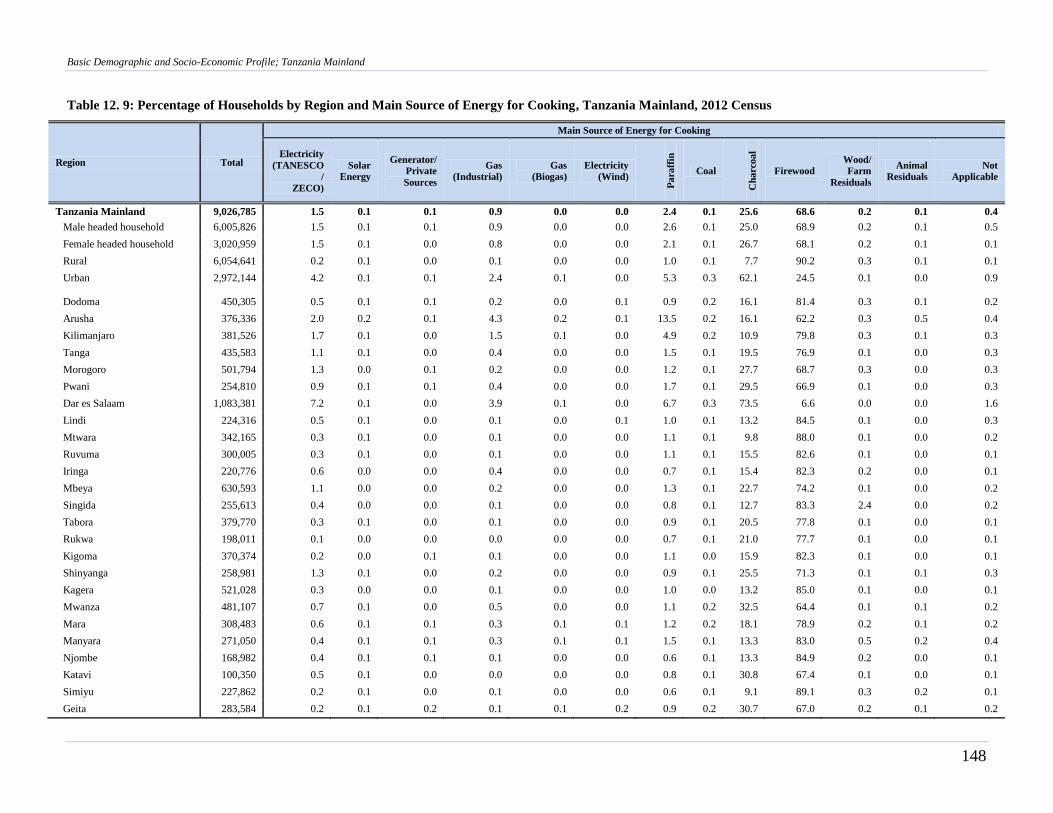
Basic Demographic and Socio-Economic Profile; Tanzania Mainland
148
Table 12. 9: Percentage of Households by Region and Main Source of Energy for Cooking, Tanzania Mainland, 2012 Census
Region Total
Main Source of Energy for Cooking
Electricity
(TANESCO
/
ZECO)
Solar
Energy
Generator/
Private
Sources
Gas
(Industrial)
Gas
(Biogas)
Electricity
(Wind)
Pa
raff
in
Coal
Ch
arc
oa
l
Firewood
Wood/
Farm
Residuals
Animal
Residuals
Not
Applicable
Tanzania Mainland 9,026,785 1.5 0.1 0.1 0.9 0.0 0.0 2.4 0.1 25.6 68.6 0.2 0.1 0.4
Male headed household 6,005,826 1.5 0.1 0.1 0.9 0.0 0.0 2.6 0.1 25.0 68.9 0.2 0.1 0.5
Female headed household 3,020,959 1.5 0.1 0.0 0.8 0.0 0.0 2.1 0.1 26.7 68.1 0.2 0.1 0.1
Rural 6,054,641 0.2 0.1 0.0 0.1 0.0 0.0 1.0 0.1 7.7 90.2 0.3 0.1 0.1
Urban 2,972,144 4.2 0.1 0.1 2.4 0.1 0.0 5.3 0.3 62.1 24.5 0.1 0.0 0.9
Dodoma 450,305 0.5 0.1 0.1 0.2 0.0 0.1 0.9 0.2 16.1 81.4 0.3 0.1 0.2
Arusha 376,336 2.0 0.2 0.1 4.3 0.2 0.1 13.5 0.2 16.1 62.2 0.3 0.5 0.4
Kilimanjaro 381,526 1.7 0.1 0.0 1.5 0.1 0.0 4.9 0.2 10.9 79.8 0.3 0.1 0.3
Tanga 435,583 1.1 0.1 0.0 0.4 0.0 0.0 1.5 0.1 19.5 76.9 0.1 0.0 0.3
Morogoro 501,794 1.3 0.0 0.1 0.2 0.0 0.0 1.2 0.1 27.7 68.7 0.3 0.0 0.3
Pwani 254,810 0.9 0.1 0.1 0.4 0.0 0.0 1.7 0.1 29.5 66.9 0.1 0.0 0.3
Dar es Salaam 1,083,381 7.2 0.1 0.0 3.9 0.1 0.0 6.7 0.3 73.5 6.6 0.0 0.0 1.6
Lindi 224,316 0.5 0.1 0.0 0.1 0.0 0.1 1.0 0.1 13.2 84.5 0.1 0.0 0.3
Mtwara 342,165 0.3 0.1 0.0 0.1 0.0 0.0 1.1 0.1 9.8 88.0 0.1 0.0 0.2
Ruvuma 300,005 0.3 0.1 0.0 0.1 0.0 0.0 1.1 0.1 15.5 82.6 0.1 0.0 0.1
Iringa 220,776 0.6 0.0 0.0 0.4 0.0 0.0 0.7 0.1 15.4 82.3 0.2 0.0 0.1
Mbeya 630,593 1.1 0.0 0.0 0.2 0.0 0.0 1.3 0.1 22.7 74.2 0.1 0.0 0.2
Singida 255,613 0.4 0.0 0.0 0.1 0.0 0.0 0.8 0.1 12.7 83.3 2.4 0.0 0.2
Tabora 379,770 0.3 0.1 0.0 0.1 0.0 0.0 0.9 0.1 20.5 77.8 0.1 0.0 0.1
Rukwa 198,011 0.1 0.0 0.0 0.0 0.0 0.0 0.7 0.1 21.0 77.7 0.1 0.0 0.1
Kigoma 370,374 0.2 0.0 0.1 0.1 0.0 0.0 1.1 0.0 15.9 82.3 0.1 0.0 0.1
Shinyanga 258,981 1.3 0.1 0.0 0.2 0.0 0.0 0.9 0.1 25.5 71.3 0.1 0.1 0.3
Kagera 521,028 0.3 0.0 0.0 0.1 0.0 0.0 1.0 0.0 13.2 85.0 0.1 0.0 0.1
Mwanza 481,107 0.7 0.1 0.0 0.5 0.0 0.0 1.1 0.2 32.5 64.4 0.1 0.1 0.2
Mara 308,483 0.6 0.1 0.1 0.3 0.1 0.1 1.2 0.2 18.1 78.9 0.2 0.1 0.2
Manyara 271,050 0.4 0.1 0.1 0.3 0.1 0.1 1.5 0.1 13.3 83.0 0.5 0.2 0.4
Njombe 168,982 0.4 0.1 0.1 0.1 0.0 0.0 0.6 0.1 13.3 84.9 0.2 0.0 0.1
Katavi 100,350 0.5 0.1 0.0 0.0 0.0 0.0 0.8 0.1 30.8 67.4 0.1 0.0 0.1
Simiyu 227,862 0.2 0.1 0.0 0.1 0.0 0.0 0.6 0.1 9.1 89.1 0.3 0.2 0.1
Geita 283,584 0.2 0.1 0.2 0.1 0.1 0.2 0.9 0.2 30.7 67.0 0.2 0.1 0.2
Basic Demographic and Socio-Economic Profile; Tanzania Mainland
149
12.9.2 Source of Energy for Lighting
Table 12.10 presents the percentage distribution of households by main source of energy for lighting,
rural and urban areas. It indicates that, 58 percent of all households in Tanzania Mainland used
kerosene (wick lamp and lantern or chimney) as their main sources of energy for lighting. Only 21
percent of households in Tanzania Mainland reported using electricity as the main source of energy for
lighting followed by torch or rechargeable lamps (15 percent). In urban areas, the main source was
electricity (48 percent), followed by kerosene (lantern or chimney and wick lamps) (43 percent). In
rural areas, the main source was kerosene (66 percent), followed by torch or rechargeable lamps (20
percent).
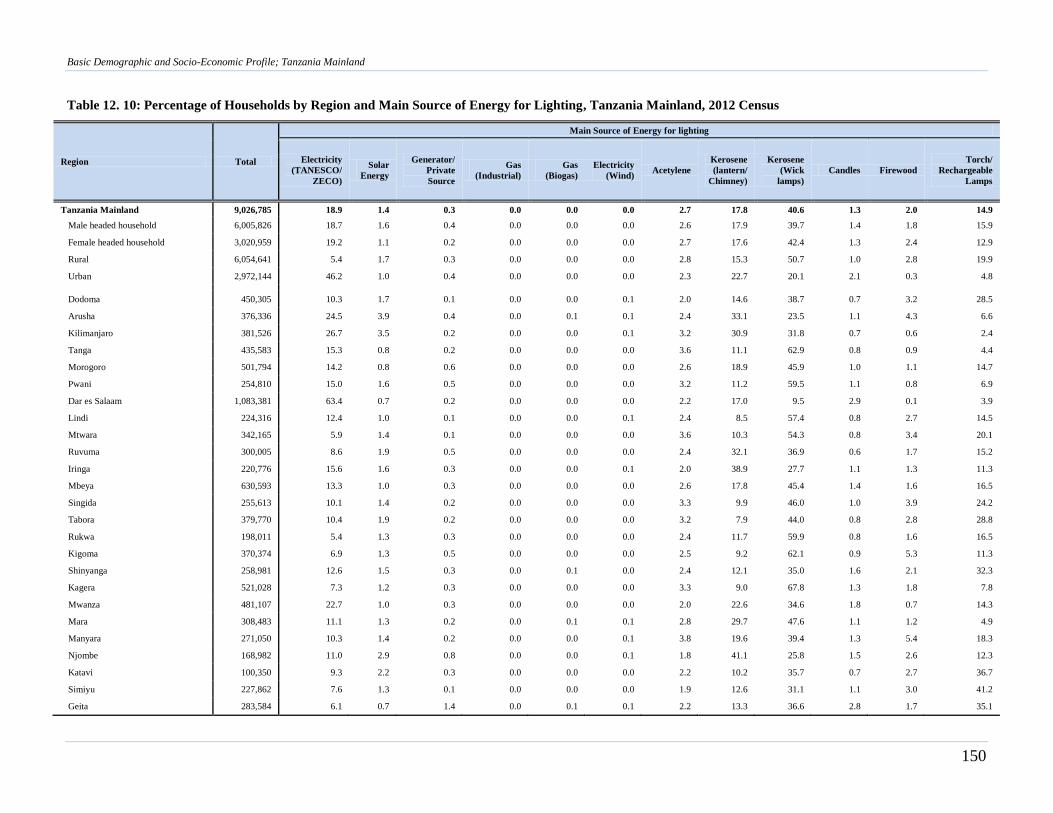
Basic Demographic and Socio-Economic Profile; Tanzania Mainland
150
Table 12. 10: Percentage of Households by Region and Main Source of Energy for Lighting, Tanzania Mainland, 2012 Census
Region Total
Main Source of Energy for lighting
Electricity
(TANESCO/
ZECO)
Solar
Energy
Generator/
Private
Source
Gas
(Industrial)
Gas
(Biogas)
Electricity
(Wind) Acetylene
Kerosene
(lantern/
Chimney)
Kerosene
(Wick
lamps)
Candles Firewood
Torch/
Rechargeable
Lamps
Tanzania Mainland 9,026,785 18.9 1.4 0.3 0.0 0.0 0.0 2.7 17.8 40.6 1.3 2.0 14.9
Male headed household 6,005,826 18.7 1.6 0.4 0.0 0.0 0.0 2.6 17.9 39.7 1.4 1.8 15.9
Female headed household 3,020,959 19.2 1.1 0.2 0.0 0.0 0.0 2.7 17.6 42.4 1.3 2.4 12.9
Rural 6,054,641 5.4 1.7 0.3 0.0 0.0 0.0 2.8 15.3 50.7 1.0 2.8 19.9
Urban 2,972,144 46.2 1.0 0.4 0.0 0.0 0.0 2.3 22.7 20.1 2.1 0.3 4.8
Dodoma 450,305 10.3 1.7 0.1 0.0 0.0 0.1 2.0 14.6 38.7 0.7 3.2 28.5
Arusha 376,336 24.5 3.9 0.4 0.0 0.1 0.1 2.4 33.1 23.5 1.1 4.3 6.6
Kilimanjaro 381,526 26.7 3.5 0.2 0.0 0.0 0.1 3.2 30.9 31.8 0.7 0.6 2.4
Tanga 435,583 15.3 0.8 0.2 0.0 0.0 0.0 3.6 11.1 62.9 0.8 0.9 4.4
Morogoro 501,794 14.2 0.8 0.6 0.0 0.0 0.0 2.6 18.9 45.9 1.0 1.1 14.7
Pwani 254,810 15.0 1.6 0.5 0.0 0.0 0.0 3.2 11.2 59.5 1.1 0.8 6.9
Dar es Salaam 1,083,381 63.4 0.7 0.2 0.0 0.0 0.0 2.2 17.0 9.5 2.9 0.1 3.9
Lindi 224,316 12.4 1.0 0.1 0.0 0.0 0.1 2.4 8.5 57.4 0.8 2.7 14.5
Mtwara 342,165 5.9 1.4 0.1 0.0 0.0 0.0 3.6 10.3 54.3 0.8 3.4 20.1
Ruvuma 300,005 8.6 1.9 0.5 0.0 0.0 0.0 2.4 32.1 36.9 0.6 1.7 15.2
Iringa 220,776 15.6 1.6 0.3 0.0 0.0 0.1 2.0 38.9 27.7 1.1 1.3 11.3
Mbeya 630,593 13.3 1.0 0.3 0.0 0.0 0.0 2.6 17.8 45.4 1.4 1.6 16.5
Singida 255,613 10.1 1.4 0.2 0.0 0.0 0.0 3.3 9.9 46.0 1.0 3.9 24.2
Tabora 379,770 10.4 1.9 0.2 0.0 0.0 0.0 3.2 7.9 44.0 0.8 2.8 28.8
Rukwa 198,011 5.4 1.3 0.3 0.0 0.0 0.0 2.4 11.7 59.9 0.8 1.6 16.5
Kigoma 370,374 6.9 1.3 0.5 0.0 0.0 0.0 2.5 9.2 62.1 0.9 5.3 11.3
Shinyanga 258,981 12.6 1.5 0.3 0.0 0.1 0.0 2.4 12.1 35.0 1.6 2.1 32.3
Kagera 521,028 7.3 1.2 0.3 0.0 0.0 0.0 3.3 9.0 67.8 1.3 1.8 7.8
Mwanza 481,107 22.7 1.0 0.3 0.0 0.0 0.0 2.0 22.6 34.6 1.8 0.7 14.3
Mara 308,483 11.1 1.3 0.2 0.0 0.1 0.1 2.8 29.7 47.6 1.1 1.2 4.9
Manyara 271,050 10.3 1.4 0.2 0.0 0.0 0.1 3.8 19.6 39.4 1.3 5.4 18.3
Njombe 168,982 11.0 2.9 0.8 0.0 0.0 0.1 1.8 41.1 25.8 1.5 2.6 12.3
Katavi 100,350 9.3 2.2 0.3 0.0 0.0 0.0 2.2 10.2 35.7 0.7 2.7 36.7
Simiyu 227,862 7.6 1.3 0.1 0.0 0.0 0.0 1.9 12.6 31.1 1.1 3.0 41.2
Geita 283,584 6.1 0.7 1.4 0.0 0.1 0.1 2.2 13.3 36.6 2.8 1.7 35.1
Basic Demographic and Socio-Economic Profile; Tanzania Mainland
151
Use of electricity as a source of energy for lighting varies considerably across regions (Map 12.2). Dar
es Salaam Region had the highest percentage of households using electricity for lighting (64 percent)
followed by Kilimanjaro (31 percent). Regions with less than 10 percent of the households using
electricity for lighting were Simiyu (9.0 percent), Kagera (9.0 percent), Kigoma (8.6 percent), Geita
(8.4 percent), Mtwara (7.5 percent), and Rukwa (7.0 percent).
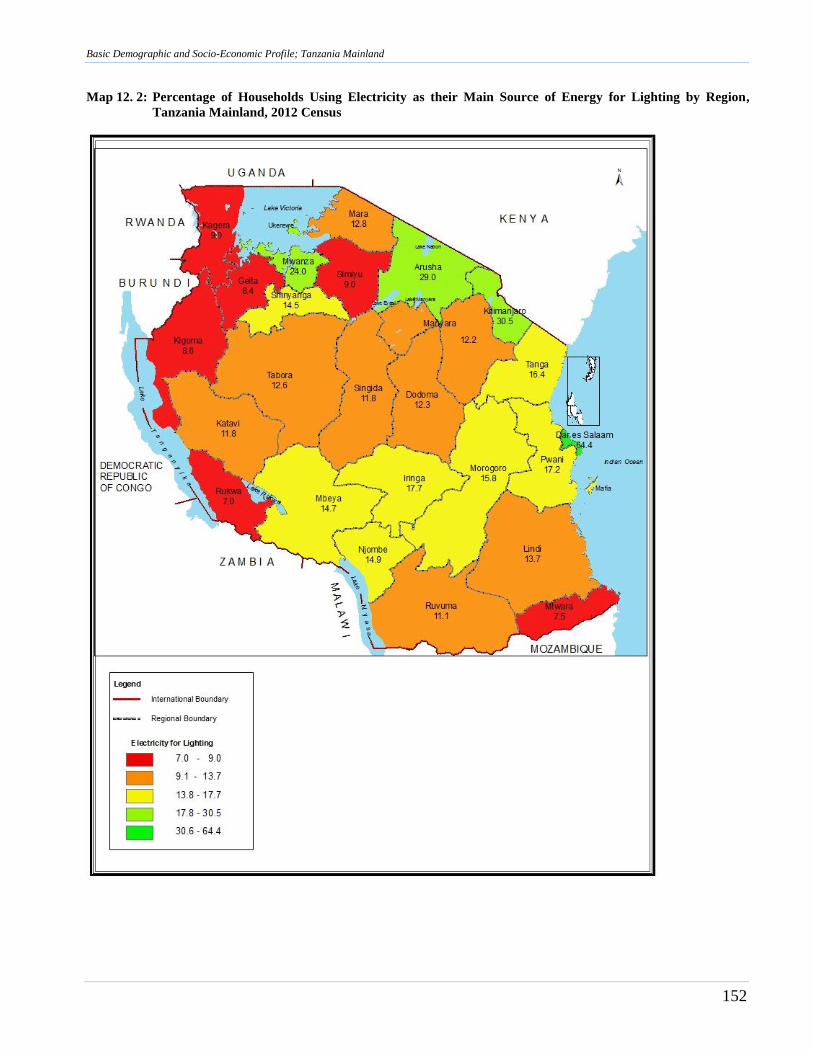
Basic Demographic and Socio-Economic Profile; Tanzania Mainland
152
Map 12. 2: Percentage of Households Using Electricity as their Main Source of Energy for Lighting by Region,
Tanzania Mainland, 2012 Census
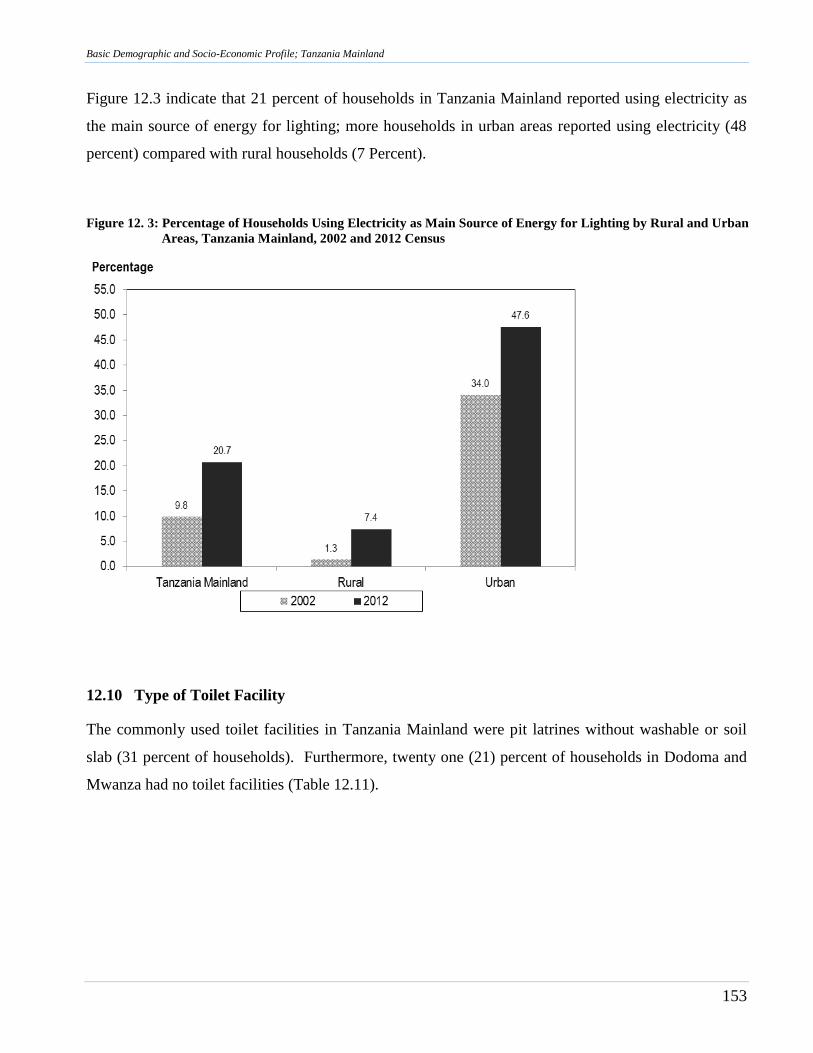
Basic Demographic and Socio-Economic Profile; Tanzania Mainland
153
Figure 12.3 indicate that 21 percent of households in Tanzania Mainland reported using electricity as
the main source of energy for lighting; more households in urban areas reported using electricity (48
percent) compared with rural households (7 Percent).
Figure 12. 3: Percentage of Households Using Electricity as Main Source of Energy for Lighting by Rural and Urban
Areas, Tanzania Mainland, 2002 and 2012 Census
12.10 Type of Toilet Facility
The commonly used toilet facilities in Tanzania Mainland were pit latrines without washable or soil
slab (31 percent of households). Furthermore, twenty one (21) percent of households in Dodoma and
Mwanza had no toilet facilities (Table 12.11).
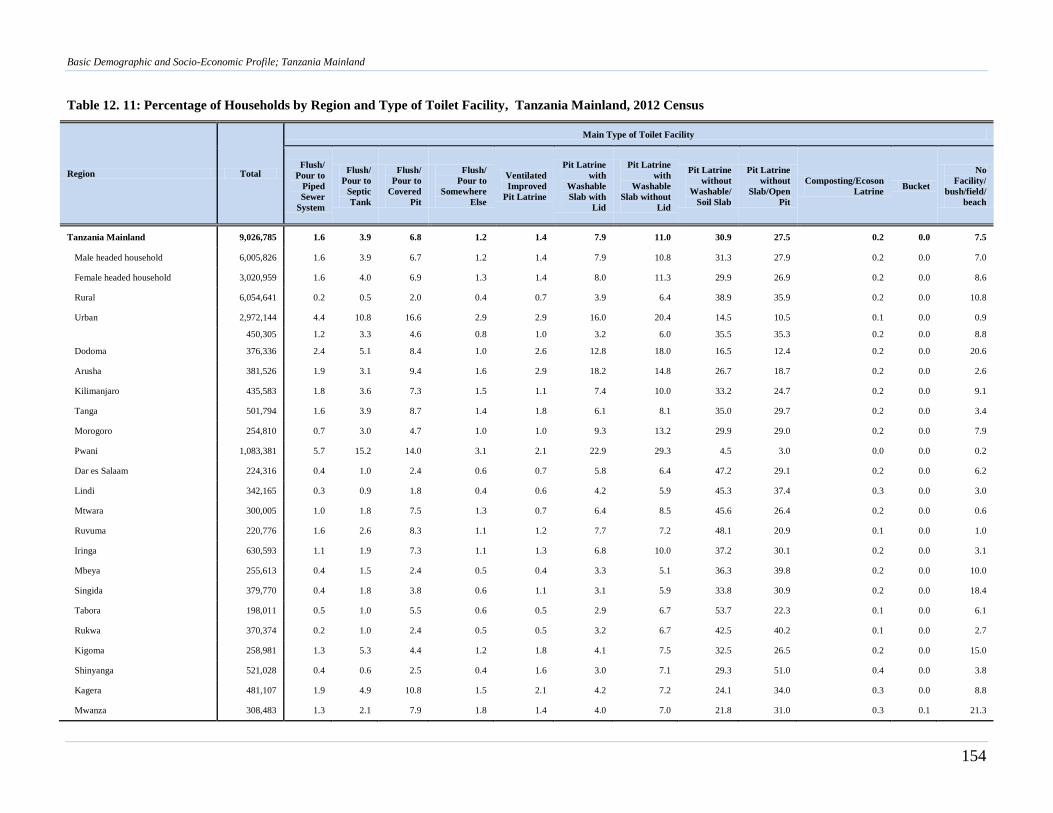
Basic Demographic and Socio-Economic Profile; Tanzania Mainland
154
Table 12. 11: Percentage of Households by Region and Type of Toilet Facility, Tanzania Mainland, 2012 Census
Region Total
Main Type of Toilet Facility
Flush/
Pour to
Piped
Sewer
System
Flush/
Pour to
Septic
Tank
Flush/
Pour to
Covered
Pit
Flush/
Pour to
Somewhere
Else
Ventilated
Improved
Pit Latrine
Pit Latrine
with
Washable
Slab with
Lid
Pit Latrine
with
Washable
Slab without
Lid
Pit Latrine
without
Washable/
Soil Slab
Pit Latrine
without
Slab/Open
Pit
Composting/Ecoson
Latrine Bucket
No
Facility/
bush/field/
beach
Tanzania Mainland 9,026,785 1.6 3.9 6.8 1.2 1.4 7.9 11.0 30.9 27.5 0.2 0.0 7.5
Male headed household 6,005,826 1.6 3.9 6.7 1.2 1.4 7.9 10.8 31.3 27.9 0.2 0.0 7.0
Female headed household 3,020,959 1.6 4.0 6.9 1.3 1.4 8.0 11.3 29.9 26.9 0.2 0.0 8.6
Rural 6,054,641 0.2 0.5 2.0 0.4 0.7 3.9 6.4 38.9 35.9 0.2 0.0 10.8
Urban 2,972,144 4.4 10.8 16.6 2.9 2.9 16.0 20.4 14.5 10.5 0.1 0.0 0.9
450,305 1.2 3.3 4.6 0.8 1.0 3.2 6.0 35.5 35.3 0.2 0.0 8.8
Dodoma 376,336 2.4 5.1 8.4 1.0 2.6 12.8 18.0 16.5 12.4 0.2 0.0 20.6
Arusha 381,526 1.9 3.1 9.4 1.6 2.9 18.2 14.8 26.7 18.7 0.2 0.0 2.6
Kilimanjaro 435,583 1.8 3.6 7.3 1.5 1.1 7.4 10.0 33.2 24.7 0.2 0.0 9.1
Tanga 501,794 1.6 3.9 8.7 1.4 1.8 6.1 8.1 35.0 29.7 0.2 0.0 3.4
Morogoro 254,810 0.7 3.0 4.7 1.0 1.0 9.3 13.2 29.9 29.0 0.2 0.0 7.9
Pwani 1,083,381 5.7 15.2 14.0 3.1 2.1 22.9 29.3 4.5 3.0 0.0 0.0 0.2
Dar es Salaam 224,316 0.4 1.0 2.4 0.6 0.7 5.8 6.4 47.2 29.1 0.2 0.0 6.2
Lindi 342,165 0.3 0.9 1.8 0.4 0.6 4.2 5.9 45.3 37.4 0.3 0.0 3.0
Mtwara 300,005 1.0 1.8 7.5 1.3 0.7 6.4 8.5 45.6 26.4 0.2 0.0 0.6
Ruvuma 220,776 1.6 2.6 8.3 1.1 1.2 7.7 7.2 48.1 20.9 0.1 0.0 1.0
Iringa 630,593 1.1 1.9 7.3 1.1 1.3 6.8 10.0 37.2 30.1 0.2 0.0 3.1
Mbeya 255,613 0.4 1.5 2.4 0.5 0.4 3.3 5.1 36.3 39.8 0.2 0.0 10.0
Singida 379,770 0.4 1.8 3.8 0.6 1.1 3.1 5.9 33.8 30.9 0.2 0.0 18.4
Tabora 198,011 0.5 1.0 5.5 0.6 0.5 2.9 6.7 53.7 22.3 0.1 0.0 6.1
Rukwa 370,374 0.2 1.0 2.4 0.5 0.5 3.2 6.7 42.5 40.2 0.1 0.0 2.7
Kigoma 258,981 1.3 5.3 4.4 1.2 1.8 4.1 7.5 32.5 26.5 0.2 0.0 15.0
Shinyanga 521,028 0.4 0.6 2.5 0.4 1.6 3.0 7.1 29.3 51.0 0.4 0.0 3.8
Kagera 481,107 1.9 4.9 10.8 1.5 2.1 4.2 7.2 24.1 34.0 0.3 0.0 8.8
Mwanza 308,483 1.3 2.1 7.9 1.8 1.4 4.0 7.0 21.8 31.0 0.3 0.1 21.3
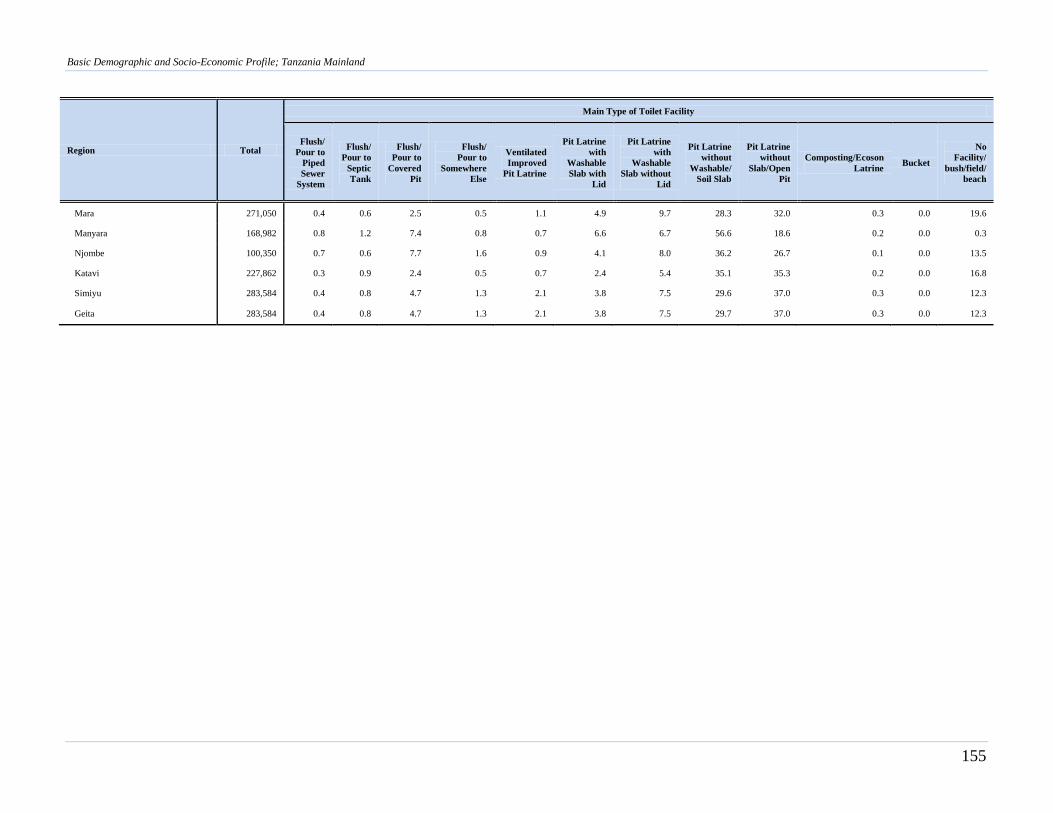
Basic Demographic and Socio-Economic Profile; Tanzania Mainland
155
Region Total
Main Type of Toilet Facility
Flush/
Pour to
Piped
Sewer
System
Flush/
Pour to
Septic
Tank
Flush/
Pour to
Covered
Pit
Flush/
Pour to
Somewhere
Else
Ventilated
Improved
Pit Latrine
Pit Latrine
with
Washable
Slab with
Lid
Pit Latrine
with
Washable
Slab without
Lid
Pit Latrine
without
Washable/
Soil Slab
Pit Latrine
without
Slab/Open
Pit
Composting/Ecoson
Latrine Bucket
No
Facility/
bush/field/
beach
Mara 271,050 0.4 0.6 2.5 0.5 1.1 4.9 9.7 28.3 32.0 0.3 0.0 19.6
Manyara 168,982 0.8 1.2 7.4 0.8 0.7 6.6 6.7 56.6 18.6 0.2 0.0 0.3
Njombe 100,350 0.7 0.6 7.7 1.6 0.9 4.1 8.0 36.2 26.7 0.1 0.0 13.5
Katavi 227,862 0.3 0.9 2.4 0.5 0.7 2.4 5.4 35.1 35.3 0.2 0.0 16.8
Simiyu 283,584 0.4 0.8 4.7 1.3 2.1 3.8 7.5 29.6 37.0 0.3 0.0 12.3
Geita 283,584 0.4 0.8 4.7 1.3 2.1 3.8 7.5 29.7 37.0 0.3 0.0 12.3
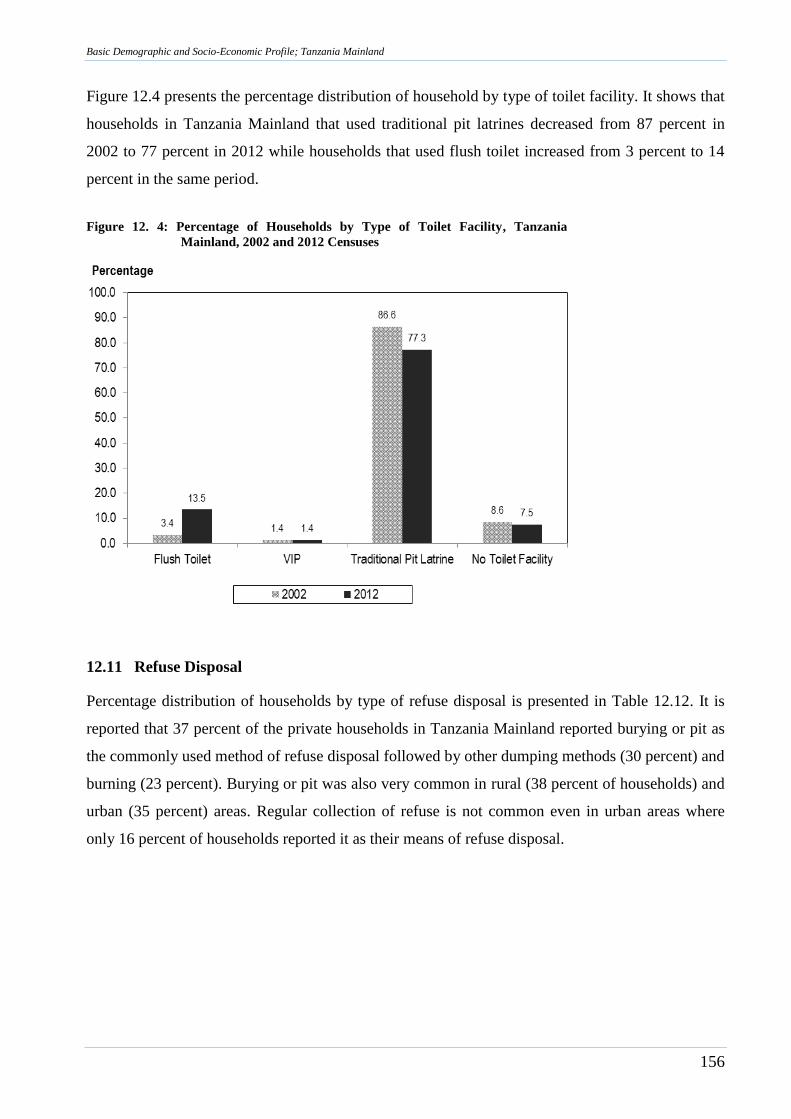
Basic Demographic and Socio-Economic Profile; Tanzania Mainland
156
Figure 12.4 presents the percentage distribution of household by type of toilet facility. It shows that
households in Tanzania Mainland that used traditional pit latrines decreased from 87 percent in
2002 to 77 percent in 2012 while households that used flush toilet increased from 3 percent to 14
percent in the same period.
Figure 12. 4: Percentage of Households by Type of Toilet Facility, Tanzania
Mainland, 2002 and 2012 Censuses
12.11 Refuse Disposal
Percentage distribution of households by type of refuse disposal is presented in Table 12.12. It is
reported that 37 percent of the private households in Tanzania Mainland reported burying or pit as
the commonly used method of refuse disposal followed by other dumping methods (30 percent) and
burning (23 percent). Burying or pit was also very common in rural (38 percent of households) and
urban (35 percent) areas. Regular collection of refuse is not common even in urban areas where
only 16 percent of households reported it as their means of refuse disposal.
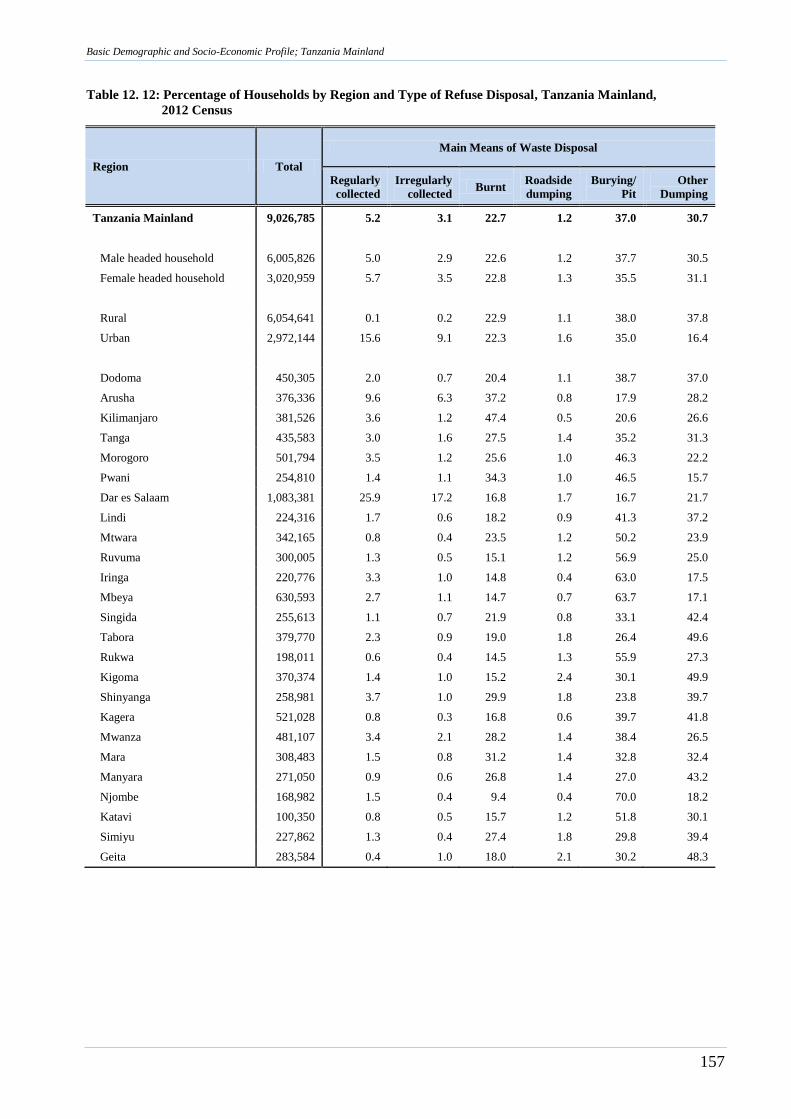
Basic Demographic and Socio-Economic Profile; Tanzania Mainland
157
Table 12. 12: Percentage of Households by Region and Type of Refuse Disposal, Tanzania Mainland,
2012 Census
Region Total
Main Means of Waste Disposal
Regularly
collected
Irregularly
collected Burnt
Roadside
dumping
Burying/
Pit
Other
Dumping
Tanzania Mainland 9,026,785 5.2 3.1 22.7 1.2 37.0 30.7
Male headed household 6,005,826 5.0 2.9 22.6 1.2 37.7 30.5
Female headed household 3,020,959 5.7 3.5 22.8 1.3 35.5 31.1
Rural 6,054,641 0.1 0.2 22.9 1.1 38.0 37.8
Urban 2,972,144 15.6 9.1 22.3 1.6 35.0 16.4
Dodoma 450,305 2.0 0.7 20.4 1.1 38.7 37.0
Arusha 376,336 9.6 6.3 37.2 0.8 17.9 28.2
Kilimanjaro 381,526 3.6 1.2 47.4 0.5 20.6 26.6
Tanga 435,583 3.0 1.6 27.5 1.4 35.2 31.3
Morogoro 501,794 3.5 1.2 25.6 1.0 46.3 22.2
Pwani 254,810 1.4 1.1 34.3 1.0 46.5 15.7
Dar es Salaam 1,083,381 25.9 17.2 16.8 1.7 16.7 21.7
Lindi 224,316 1.7 0.6 18.2 0.9 41.3 37.2
Mtwara 342,165 0.8 0.4 23.5 1.2 50.2 23.9
Ruvuma 300,005 1.3 0.5 15.1 1.2 56.9 25.0
Iringa 220,776 3.3 1.0 14.8 0.4 63.0 17.5
Mbeya 630,593 2.7 1.1 14.7 0.7 63.7 17.1
Singida 255,613 1.1 0.7 21.9 0.8 33.1 42.4
Tabora 379,770 2.3 0.9 19.0 1.8 26.4 49.6
Rukwa 198,011 0.6 0.4 14.5 1.3 55.9 27.3
Kigoma 370,374 1.4 1.0 15.2 2.4 30.1 49.9
Shinyanga 258,981 3.7 1.0 29.9 1.8 23.8 39.7
Kagera 521,028 0.8 0.3 16.8 0.6 39.7 41.8
Mwanza 481,107 3.4 2.1 28.2 1.4 38.4 26.5
Mara 308,483 1.5 0.8 31.2 1.4 32.8 32.4
Manyara 271,050 0.9 0.6 26.8 1.4 27.0 43.2
Njombe 168,982 1.5 0.4 9.4 0.4 70.0 18.2
Katavi 100,350 0.8 0.5 15.7 1.2 51.8 30.1
Simiyu 227,862 1.3 0.4 27.4 1.8 29.8 39.4
Geita 283,584 0.4 1.0 18.0 2.1 30.2 48.3
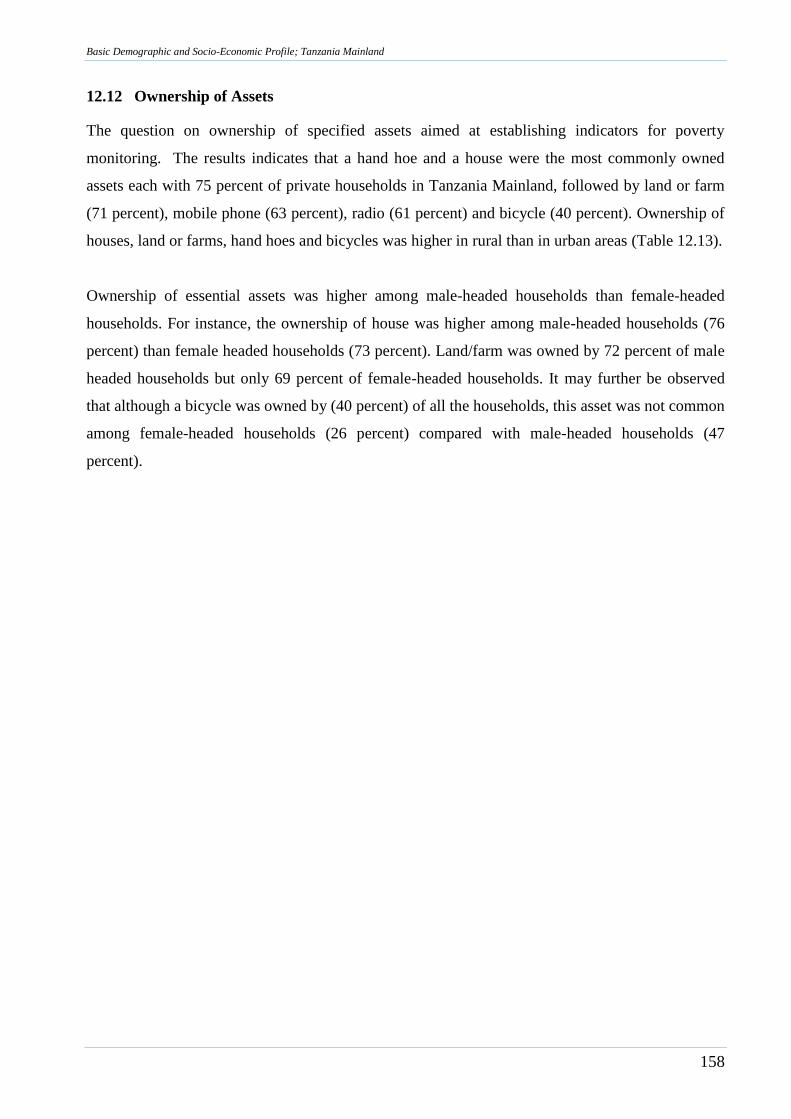
Basic Demographic and Socio-Economic Profile; Tanzania Mainland
158
12.12 Ownership of Assets
The question on ownership of specified assets aimed at establishing indicators for poverty
monitoring. The results indicates that a hand hoe and a house were the most commonly owned
assets each with 75 percent of private households in Tanzania Mainland, followed by land or farm
(71 percent), mobile phone (63 percent), radio (61 percent) and bicycle (40 percent). Ownership of
houses, land or farms, hand hoes and bicycles was higher in rural than in urban areas (Table 12.13).
Ownership of essential assets was higher among male-headed households than female-headed
households. For instance, the ownership of house was higher among male-headed households (76
percent) than female headed households (73 percent). Land/farm was owned by 72 percent of male
headed households but only 69 percent of female-headed households. It may further be observed
that although a bicycle was owned by (40 percent) of all the households, this asset was not common
among female-headed households (26 percent) compared with male-headed households (47
percent).
Basic Demographic and Socio-Economic Profile; Tanzania Mainland
159
Table 12. 13: Percentage of Households by Ownership of Assets Sex of the Household Head and Region,
Tanzania Mainland, 2012 Census
Region Total Radio
Telephone
(Land
Line)
Mobile
Phone Bicycle
Motor
vehicle
Motorcycle/
Vespa
Tricycle
(Guta)
Tanzania Mainland 9,026,785 61.4 1.1 63.4 39.8 2.5 4.9 0.2
Male headed household 6,005,826 67.7 1.1 67.2 46.6 2.8 5.9 0.2
Female headed household 3,020,959 48.7 1.0 56.0 26.2 1.9 2.8 0.1
Rural 6,054,641 57.9 0.6 53.8 45.7 0.9 4.2 0.1
Urban 2,972,144 68.3 2.0 83.1 27.7 5.9 6.2 0.3
Dodoma 450,305 51.7 0.7 49.5 40.4 1.5 4.2 0.1
Arusha 376,336 64.3 1.5 75.2 18.7 5.1 5.3 0.2
Kilimanjaro 381,526 75.3 1.3 79.0 25.6 3.9 7.4 0.3
Tanga 435,583 63.5 1.1 64.7 36.7 1.9 6.4 0.2
Morogoro 501,794 63.6 0.9 61.1 45.5 1.6 5.1 0.2
Pwani 254,810 64.8 0.9 68.5 36.2 1.9 5.3 0.2
Dar es Salaam 1,083,381 67.9 2.6 89.5 12.6 8.1 4.5 0.4
Lindi 224,316 52.9 0.8 43.3 46.0 0.7 3.1 0.1
Mtwara 342,165 53.7 0.6 41.6 49.3 0.8 3.6 0.1
Ruvuma 300,005 59.0 0.7 50.6 32.5 1.4 6.0 0.1
Iringa 220,776 65.4 0.7 59.2 38.1 2.3 5.3 0.1
Mbeya 630,593 62.1 0.7 58.1 39.7 1.8 4.3 0.1
Singida 255,613 58.3 0.7 54.7 45.8 1.0 3.5 0.2
Tabora 379,770 64.1 0.7 63.3 70.3 1.2 5.2 0.1
Rukwa 198,011 51.2 0.5 40.7 35.2 0.7 3.0 0.1
Kigoma 370,374 59.4 0.6 47.9 43.5 1.0 2.7 0.1
Shinyanga 258,981 61.5 0.9 66.8 67.8 1.7 4.6 0.2
Kagera 521,028 63.1 0.5 57.3 37.5 1.5 7.0 0.1
Mwanza 481,107 61.4 1.0 69.7 49.1 2.2 3.7 0.2
Mara 308,483 58.6 1.1 64.0 42.4 1.6 5.6 0.3
Manyara 271,050 51.6 0.8 63.9 41.8 1.6 5.6 0.2
Njombe 168,982 63.5 0.6 57.2 41.0 1.7 4.9 0.2
Katavi 100,350 63.8 0.7 61.4 59.1 0.9 4.6 0.1
Simiyu 227,862 46.6 0.7 60.6 64.1 0.8 4.8 0.2
Geita 283,584 59.8 0.9 65.4 63.4 1.0 4.2 0.2
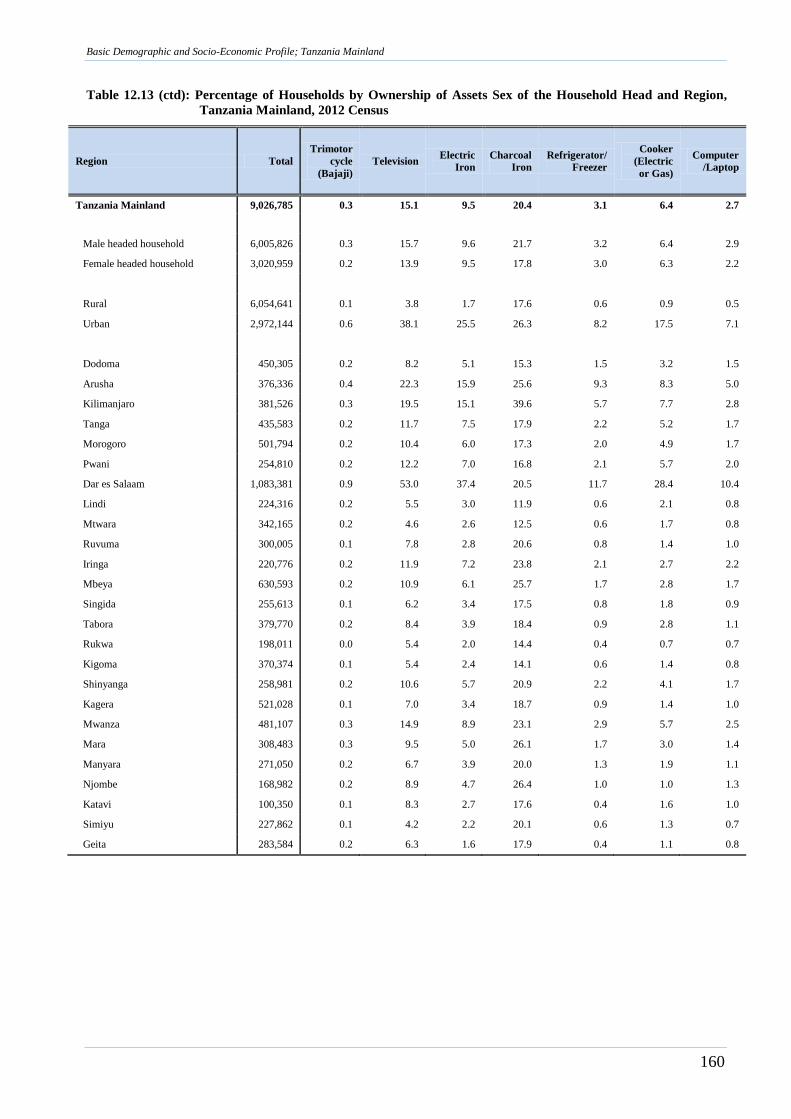
Basic Demographic and Socio-Economic Profile; Tanzania Mainland
160
Table 12.13 (ctd): Percentage of Households by Ownership of Assets Sex of the Household Head and Region,
Tanzania Mainland, 2012 Census
Region Total
Trimotor
cycle
(Bajaji)
Television Electric
Iron
Charcoal
Iron
Refrigerator/
Freezer
Cooker
(Electric
or Gas)
Computer
/Laptop
Tanzania Mainland 9,026,785 0.3 15.1 9.5 20.4 3.1 6.4 2.7
Male headed household 6,005,826 0.3 15.7 9.6 21.7 3.2 6.4 2.9
Female headed household 3,020,959 0.2 13.9 9.5 17.8 3.0 6.3 2.2
Rural 6,054,641 0.1 3.8 1.7 17.6 0.6 0.9 0.5
Urban 2,972,144 0.6 38.1 25.5 26.3 8.2 17.5 7.1
Dodoma 450,305 0.2 8.2 5.1 15.3 1.5 3.2 1.5
Arusha 376,336 0.4 22.3 15.9 25.6 9.3 8.3 5.0
Kilimanjaro 381,526 0.3 19.5 15.1 39.6 5.7 7.7 2.8
Tanga 435,583 0.2 11.7 7.5 17.9 2.2 5.2 1.7
Morogoro 501,794 0.2 10.4 6.0 17.3 2.0 4.9 1.7
Pwani 254,810 0.2 12.2 7.0 16.8 2.1 5.7 2.0
Dar es Salaam 1,083,381 0.9 53.0 37.4 20.5 11.7 28.4 10.4
Lindi 224,316 0.2 5.5 3.0 11.9 0.6 2.1 0.8
Mtwara 342,165 0.2 4.6 2.6 12.5 0.6 1.7 0.8
Ruvuma 300,005 0.1 7.8 2.8 20.6 0.8 1.4 1.0
Iringa 220,776 0.2 11.9 7.2 23.8 2.1 2.7 2.2
Mbeya 630,593 0.2 10.9 6.1 25.7 1.7 2.8 1.7
Singida 255,613 0.1 6.2 3.4 17.5 0.8 1.8 0.9
Tabora 379,770 0.2 8.4 3.9 18.4 0.9 2.8 1.1
Rukwa 198,011 0.0 5.4 2.0 14.4 0.4 0.7 0.7
Kigoma 370,374 0.1 5.4 2.4 14.1 0.6 1.4 0.8
Shinyanga 258,981 0.2 10.6 5.7 20.9 2.2 4.1 1.7
Kagera 521,028 0.1 7.0 3.4 18.7 0.9 1.4 1.0
Mwanza 481,107 0.3 14.9 8.9 23.1 2.9 5.7 2.5
Mara 308,483 0.3 9.5 5.0 26.1 1.7 3.0 1.4
Manyara 271,050 0.2 6.7 3.9 20.0 1.3 1.9 1.1
Njombe 168,982 0.2 8.9 4.7 26.4 1.0 1.0 1.3
Katavi 100,350 0.1 8.3 2.7 17.6 0.4 1.6 1.0
Simiyu 227,862 0.1 4.2 2.2 20.1 0.6 1.3 0.7
Geita 283,584 0.2 6.3 1.6 17.9 0.4 1.1 0.8
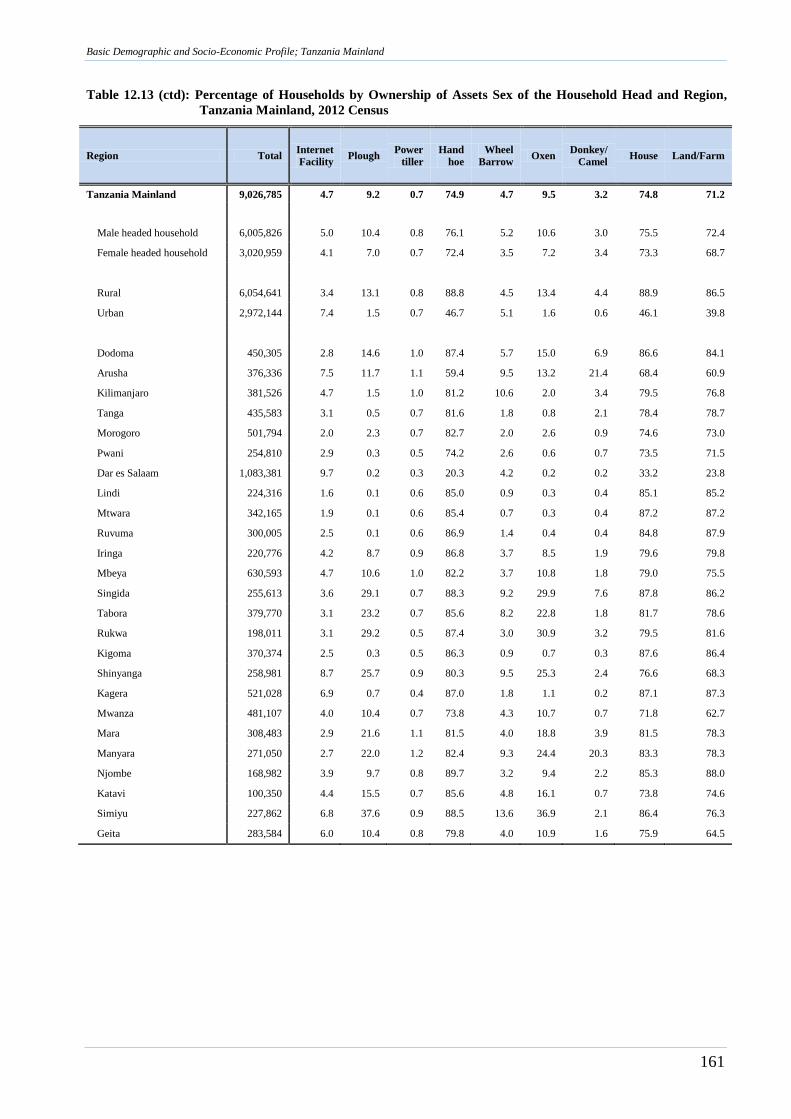
Basic Demographic and Socio-Economic Profile; Tanzania Mainland
161
Table 12.13 (ctd): Percentage of Households by Ownership of Assets Sex of the Household Head and Region,
Tanzania Mainland, 2012 Census
Region Total Internet
Facility Plough
Power
tiller
Hand
hoe
Wheel
Barrow Oxen
Donkey/
Camel House Land/Farm
Tanzania Mainland 9,026,785 4.7 9.2 0.7 74.9 4.7 9.5 3.2 74.8 71.2
Male headed household 6,005,826 5.0 10.4 0.8 76.1 5.2 10.6 3.0 75.5 72.4
Female headed household 3,020,959 4.1 7.0 0.7 72.4 3.5 7.2 3.4 73.3 68.7
Rural 6,054,641 3.4 13.1 0.8 88.8 4.5 13.4 4.4 88.9 86.5
Urban 2,972,144 7.4 1.5 0.7 46.7 5.1 1.6 0.6 46.1 39.8
Dodoma 450,305 2.8 14.6 1.0 87.4 5.7 15.0 6.9 86.6 84.1
Arusha 376,336 7.5 11.7 1.1 59.4 9.5 13.2 21.4 68.4 60.9
Kilimanjaro 381,526 4.7 1.5 1.0 81.2 10.6 2.0 3.4 79.5 76.8
Tanga 435,583 3.1 0.5 0.7 81.6 1.8 0.8 2.1 78.4 78.7
Morogoro 501,794 2.0 2.3 0.7 82.7 2.0 2.6 0.9 74.6 73.0
Pwani 254,810 2.9 0.3 0.5 74.2 2.6 0.6 0.7 73.5 71.5
Dar es Salaam 1,083,381 9.7 0.2 0.3 20.3 4.2 0.2 0.2 33.2 23.8
Lindi 224,316 1.6 0.1 0.6 85.0 0.9 0.3 0.4 85.1 85.2
Mtwara 342,165 1.9 0.1 0.6 85.4 0.7 0.3 0.4 87.2 87.2
Ruvuma 300,005 2.5 0.1 0.6 86.9 1.4 0.4 0.4 84.8 87.9
Iringa 220,776 4.2 8.7 0.9 86.8 3.7 8.5 1.9 79.6 79.8
Mbeya 630,593 4.7 10.6 1.0 82.2 3.7 10.8 1.8 79.0 75.5
Singida 255,613 3.6 29.1 0.7 88.3 9.2 29.9 7.6 87.8 86.2
Tabora 379,770 3.1 23.2 0.7 85.6 8.2 22.8 1.8 81.7 78.6
Rukwa 198,011 3.1 29.2 0.5 87.4 3.0 30.9 3.2 79.5 81.6
Kigoma 370,374 2.5 0.3 0.5 86.3 0.9 0.7 0.3 87.6 86.4
Shinyanga 258,981 8.7 25.7 0.9 80.3 9.5 25.3 2.4 76.6 68.3
Kagera 521,028 6.9 0.7 0.4 87.0 1.8 1.1 0.2 87.1 87.3
Mwanza 481,107 4.0 10.4 0.7 73.8 4.3 10.7 0.7 71.8 62.7
Mara 308,483 2.9 21.6 1.1 81.5 4.0 18.8 3.9 81.5 78.3
Manyara 271,050 2.7 22.0 1.2 82.4 9.3 24.4 20.3 83.3 78.3
Njombe 168,982 3.9 9.7 0.8 89.7 3.2 9.4 2.2 85.3 88.0
Katavi 100,350 4.4 15.5 0.7 85.6 4.8 16.1 0.7 73.8 74.6
Simiyu 227,862 6.8 37.6 0.9 88.5 13.6 36.9 2.1 86.4 76.3
Geita 283,584 6.0 10.4 0.8 79.8 4.0 10.9 1.6 75.9 64.5
Basic Demographic and Socio-Economic Profile; Tanzania Mainland
162
12.13 Social Security Schemes
A social security fund provides members with long and short terms financial security which can be
used as “social safety nets” especially at older ages. Households with members in any of security
funds are likely to be more socially secure than those without.
According to the 2012 PHC, 13 percent of all households in Tanzania Mainland had at least one
member in a social security scheme. National Health Insurance Fund (NHIF) and Community
Health Fund (CHF) are the most popular social security schemes with six percent of households
that reporting to have at least one member of its household registered in those two schemes.
Regions with the highest proportion of its households registered in social security schemes are;
Kilimanjaro (22 percent) and Singida (20 percent) while Geita (1.8 percent) and Kagera region (2.9
percent) had the lowest proportion of its household members registered in the NHIF and CHF.
National Social Security Fund (NSSF), Zanzibar National Social Security Fund (ZSSF), Parastatal
Provident Fund (PPF), Public Service Pension Fund (PSPF), Government Employee Pension Fund
(GEPF) and Local Authority Pension Fund (LAPF) are not common Social Security Schemes in
Tanzania Mainland households.
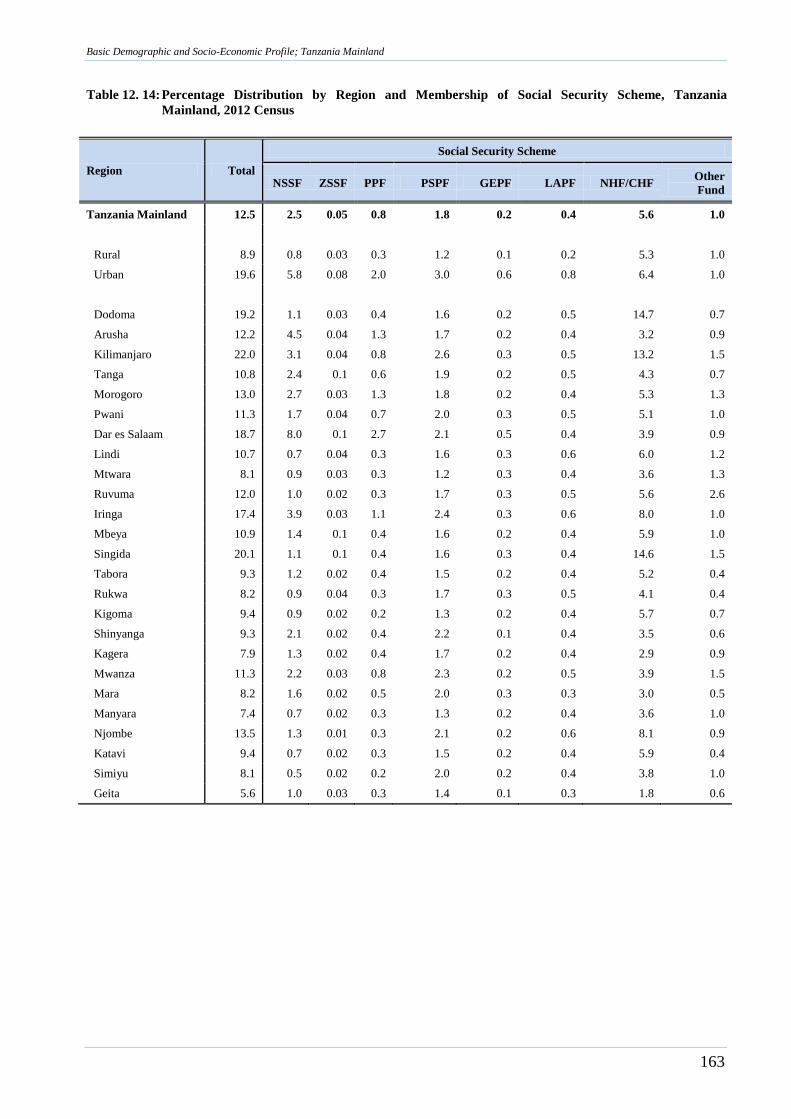
Basic Demographic and Socio-Economic Profile; Tanzania Mainland
163
Table 12. 14: Percentage Distribution by Region and Membership of Social Security Scheme, Tanzania
Mainland, 2012 Census
Region Total
Social Security Scheme
NSSF ZSSF PPF PSPF GEPF LAPF NHF/CHF Other
Fund
Tanzania Mainland 12.5 2.5 0.05 0.8 1.8 0.2 0.4 5.6 1.0
Rural 8.9 0.8 0.03 0.3 1.2 0.1 0.2 5.3 1.0
Urban 19.6 5.8 0.08 2.0 3.0 0.6 0.8 6.4 1.0
Dodoma 19.2 1.1 0.03 0.4 1.6 0.2 0.5 14.7 0.7
Arusha 12.2 4.5 0.04 1.3 1.7 0.2 0.4 3.2 0.9
Kilimanjaro 22.0 3.1 0.04 0.8 2.6 0.3 0.5 13.2 1.5
Tanga 10.8 2.4 0.1 0.6 1.9 0.2 0.5 4.3 0.7
Morogoro 13.0 2.7 0.03 1.3 1.8 0.2 0.4 5.3 1.3
Pwani 11.3 1.7 0.04 0.7 2.0 0.3 0.5 5.1 1.0
Dar es Salaam 18.7 8.0 0.1 2.7 2.1 0.5 0.4 3.9 0.9
Lindi 10.7 0.7 0.04 0.3 1.6 0.3 0.6 6.0 1.2
Mtwara 8.1 0.9 0.03 0.3 1.2 0.3 0.4 3.6 1.3
Ruvuma 12.0 1.0 0.02 0.3 1.7 0.3 0.5 5.6 2.6
Iringa 17.4 3.9 0.03 1.1 2.4 0.3 0.6 8.0 1.0
Mbeya 10.9 1.4 0.1 0.4 1.6 0.2 0.4 5.9 1.0
Singida 20.1 1.1 0.1 0.4 1.6 0.3 0.4 14.6 1.5
Tabora 9.3 1.2 0.02 0.4 1.5 0.2 0.4 5.2 0.4
Rukwa 8.2 0.9 0.04 0.3 1.7 0.3 0.5 4.1 0.4
Kigoma 9.4 0.9 0.02 0.2 1.3 0.2 0.4 5.7 0.7
Shinyanga 9.3 2.1 0.02 0.4 2.2 0.1 0.4 3.5 0.6
Kagera 7.9 1.3 0.02 0.4 1.7 0.2 0.4 2.9 0.9
Mwanza 11.3 2.2 0.03 0.8 2.3 0.2 0.5 3.9 1.5
Mara 8.2 1.6 0.02 0.5 2.0 0.3 0.3 3.0 0.5
Manyara 7.4 0.7 0.02 0.3 1.3 0.2 0.4 3.6 1.0
Njombe 13.5 1.3 0.01 0.3 2.1 0.2 0.6 8.1 0.9
Katavi 9.4 0.7 0.02 0.3 1.5 0.2 0.4 5.9 0.4
Simiyu 8.1 0.5 0.02 0.2 2.0 0.2 0.4 3.8 1.0
Geita 5.6 1.0 0.03 0.3 1.4 0.1 0.3 1.8 0.6
Basic Demographic and Socio-Economic Profile; Tanzania Mainland
164
Chapter Thirteen
Agriculture and Livestock
13.0 Introduction
The 2012 PHC collected data on agriculture for the purpose of obtaining a frame that can be used in
conducting future agriculture sample censuses and surveys. Information collected was primarily
aimed at determining the number of households involved in farming of major crops (such as maize,
paddy, cassava and bananas), livestock keeping (including cattle, goats, sheep), poultry and fish
farming. Planners, policy makers, researchers and others involved in the agricultural sector are
expected to use the information obtained from the Census to plan and conduct surveys aimed at
improving the prevailing conditions in agricultural households in the country.
13.1 Agricultural Households
Table 13.1 presents the number of households engaged in crop production and the types of crops
grown by rural and urban residence during the 2011/12 agriculture year. A total of 5,962,091 out of
9,026,785 households equivalent to 66 percent were engaged in agricultural farming. Agriculture is
also an economic activity in urban areas whereby 15 percent of households (889,603) were
involved in agricultural activities in 2011/12 agricultural year.
The results further reveal that with the exception of Dar es Salaam, which had only seven (7)
percent of its households involved in agriculture, other regions in Tanzania Mainland, the
proportion ranged from 46 percent in Arusha to 88 percent in Simiyu.
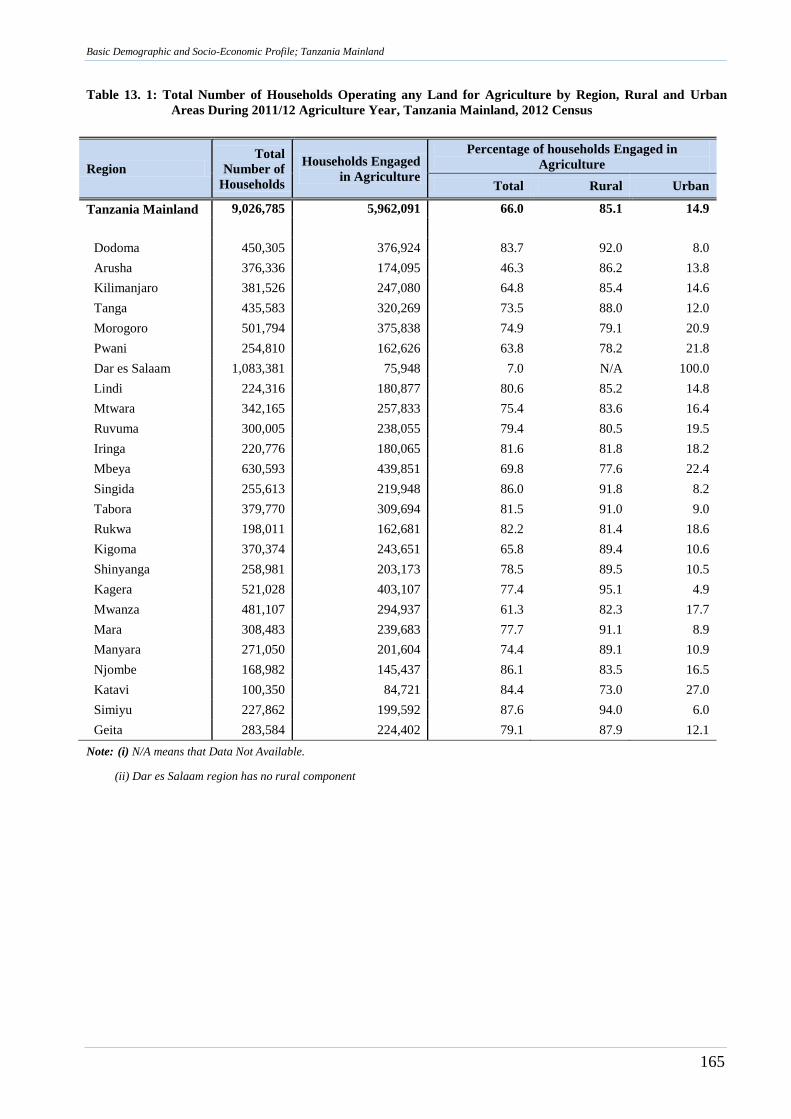
Basic Demographic and Socio-Economic Profile; Tanzania Mainland
165
Table 13. 1: Total Number of Households Operating any Land for Agriculture by Region, Rural and Urban
Areas During 2011/12 Agriculture Year, Tanzania Mainland, 2012 Census
Region
Total
Number of
Households
Households Engaged
in Agriculture
Percentage of households Engaged in
Agriculture
Total Rural Urban
Tanzania Mainland 9,026,785 5,962,091 66.0 85.1 14.9
Dodoma 450,305 376,924 83.7 92.0 8.0
Arusha 376,336 174,095 46.3 86.2 13.8
Kilimanjaro 381,526 247,080 64.8 85.4 14.6
Tanga 435,583 320,269 73.5 88.0 12.0
Morogoro 501,794 375,838 74.9 79.1 20.9
Pwani 254,810 162,626 63.8 78.2 21.8
Dar es Salaam 1,083,381 75,948 7.0 N/A 100.0
Lindi 224,316 180,877 80.6 85.2 14.8
Mtwara 342,165 257,833 75.4 83.6 16.4
Ruvuma 300,005 238,055 79.4 80.5 19.5
Iringa 220,776 180,065 81.6 81.8 18.2
Mbeya 630,593 439,851 69.8 77.6 22.4
Singida 255,613 219,948 86.0 91.8 8.2
Tabora 379,770 309,694 81.5 91.0 9.0
Rukwa 198,011 162,681 82.2 81.4 18.6
Kigoma 370,374 243,651 65.8 89.4 10.6
Shinyanga 258,981 203,173 78.5 89.5 10.5
Kagera 521,028 403,107 77.4 95.1 4.9
Mwanza 481,107 294,937 61.3 82.3 17.7
Mara 308,483 239,683 77.7 91.1 8.9
Manyara 271,050 201,604 74.4 89.1 10.9
Njombe 168,982 145,437 86.1 83.5 16.5
Katavi 100,350 84,721 84.4 73.0 27.0
Simiyu 227,862 199,592 87.6 94.0 6.0
Geita 283,584 224,402 79.1 87.9 12.1
Note: (i) N/A means that Data Not Available.
(ii) Dar es Salaam region has no rural component
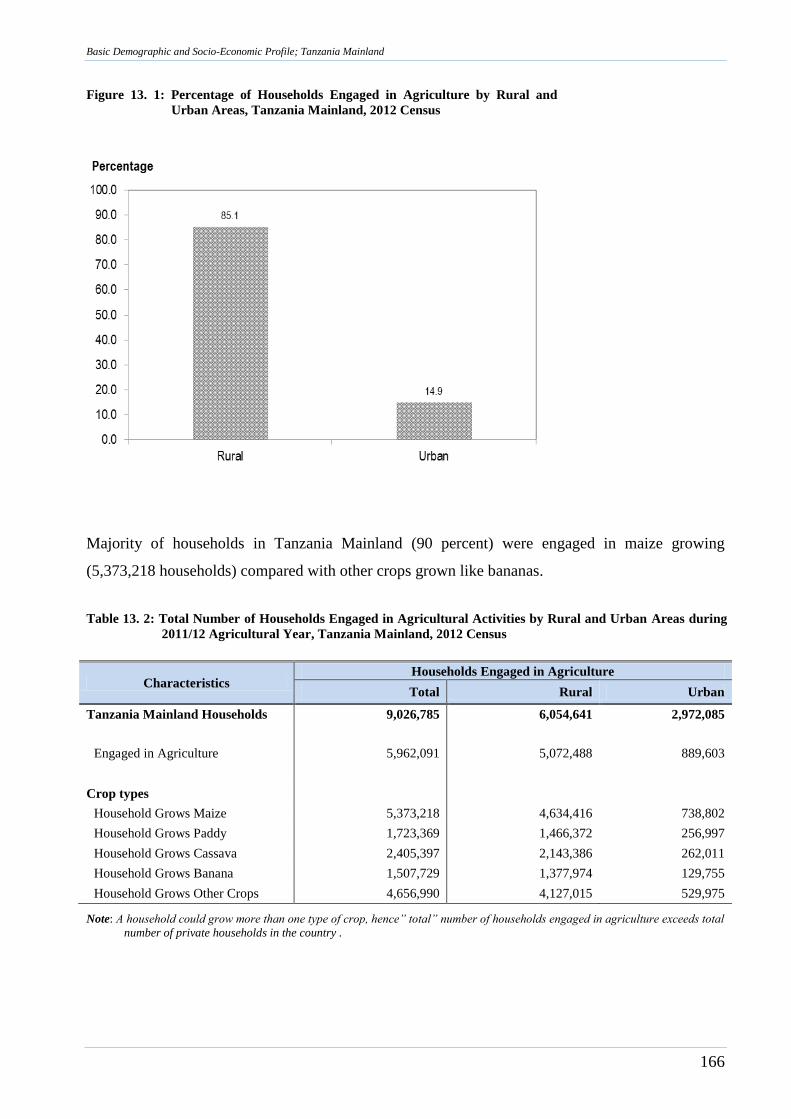
Basic Demographic and Socio-Economic Profile; Tanzania Mainland
166
Figure 13. 1: Percentage of Households Engaged in Agriculture by Rural and
Urban Areas, Tanzania Mainland, 2012 Census
Majority of households in Tanzania Mainland (90 percent) were engaged in maize growing
(5,373,218 households) compared with other crops grown like bananas.
Table 13. 2: Total Number of Households Engaged in Agricultural Activities by Rural and Urban Areas during
2011/12 Agricultural Year, Tanzania Mainland, 2012 Census
Characteristics Households Engaged in Agriculture
Total Rural Urban
Tanzania Mainland Households 9,026,785 6,054,641 2,972,085
Engaged in Agriculture 5,962,091 5,072,488 889,603
Crop types
Household Grows Maize 5,373,218 4,634,416 738,802
Household Grows Paddy 1,723,369 1,466,372 256,997
Household Grows Cassava 2,405,397 2,143,386 262,011
Household Grows Banana 1,507,729 1,377,974 129,755
Household Grows Other Crops 4,656,990 4,127,015 529,975
Note: A household could grow more than one type of crop, hence” total” number of households engaged in agriculture exceeds total
number of private households in the country .
Basic Demographic and Socio-Economic Profile; Tanzania Mainland
167
13.2 Livestock and Poultry
The livestock sector including poultry plays a significant role in the economy of agricultural
households in Tanzania Mainland. Livestock generate considerable amount of income and
determine the household economic and social status in many communities. The 2012 PHC
collected information on number of households involved in livestock keeping.
Table 13.3 presents the number of households that kept livestock and poultry in Rural and Urban
Areas as of the Census night. It was revealed that out of 9,026,785 households in Tanzania
Mainland, 42 percent of households (3,813,833 households) were keeping at least one type of
livestock.
Livestock keeping is basically a rural activity and the results revealed that more than 80 percent of
households kept livestock in Tanzania Mainland are in Rural Areas. Furthermore, the table shows
that the regions with the high proportion of households keeping livestock were Simiyu (63 percent)
and Singida (61 percent).
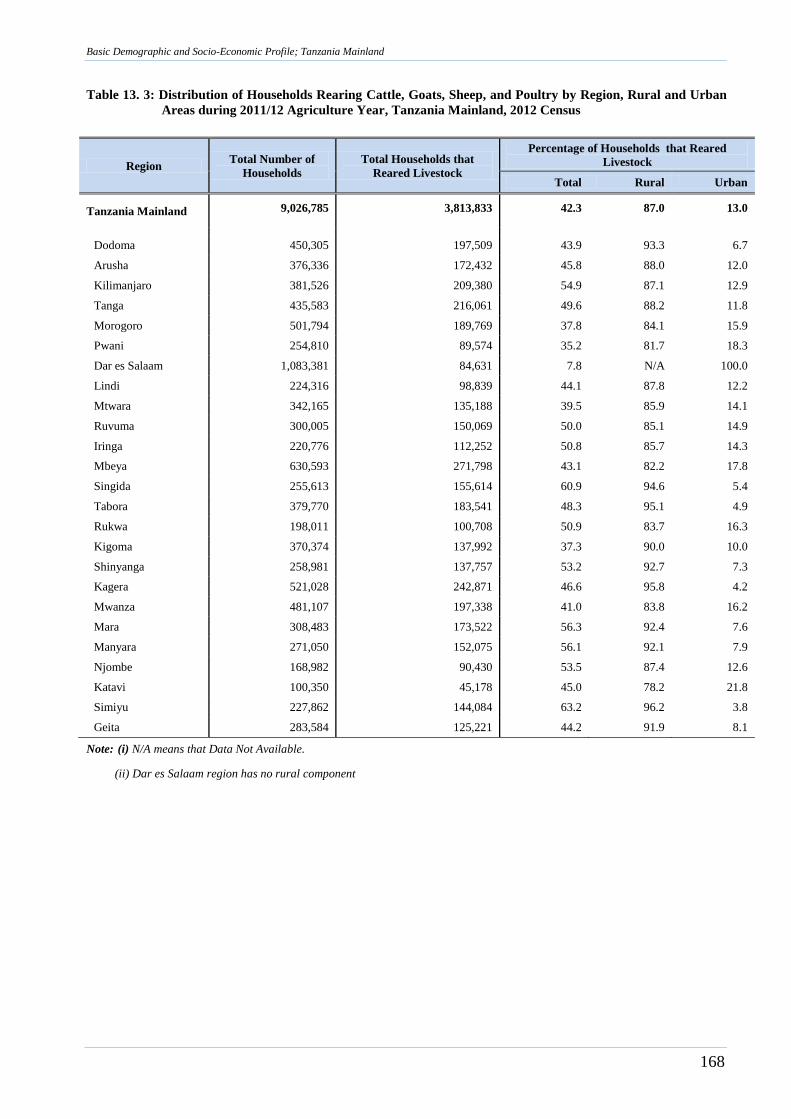
Basic Demographic and Socio-Economic Profile; Tanzania Mainland
168
Table 13. 3: Distribution of Households Rearing Cattle, Goats, Sheep, and Poultry by Region, Rural and Urban
Areas during 2011/12 Agriculture Year, Tanzania Mainland, 2012 Census
Region Total Number of
Households
Total Households that
Reared Livestock
Percentage of Households that Reared
Livestock
Total Rural Urban
Tanzania Mainland 9,026,785 3,813,833 42.3 87.0 13.0
Dodoma 450,305 197,509 43.9 93.3 6.7
Arusha 376,336 172,432 45.8 88.0 12.0
Kilimanjaro 381,526 209,380 54.9 87.1 12.9
Tanga 435,583 216,061 49.6 88.2 11.8
Morogoro 501,794 189,769 37.8 84.1 15.9
Pwani 254,810 89,574 35.2 81.7 18.3
Dar es Salaam 1,083,381 84,631 7.8 N/A 100.0
Lindi 224,316 98,839 44.1 87.8 12.2
Mtwara 342,165 135,188 39.5 85.9 14.1
Ruvuma 300,005 150,069 50.0 85.1 14.9
Iringa 220,776 112,252 50.8 85.7 14.3
Mbeya 630,593 271,798 43.1 82.2 17.8
Singida 255,613 155,614 60.9 94.6 5.4
Tabora 379,770 183,541 48.3 95.1 4.9
Rukwa 198,011 100,708 50.9 83.7 16.3
Kigoma 370,374 137,992 37.3 90.0 10.0
Shinyanga 258,981 137,757 53.2 92.7 7.3
Kagera 521,028 242,871 46.6 95.8 4.2
Mwanza 481,107 197,338 41.0 83.8 16.2
Mara 308,483 173,522 56.3 92.4 7.6
Manyara 271,050 152,075 56.1 92.1 7.9
Njombe 168,982 90,430 53.5 87.4 12.6
Katavi 100,350 45,178 45.0 78.2 21.8
Simiyu 227,862 144,084 63.2 96.2 3.8
Geita 283,584 125,221 44.2 91.9 8.1
Note: (i) N/A means that Data Not Available.
(ii) Dar es Salaam region has no rural component
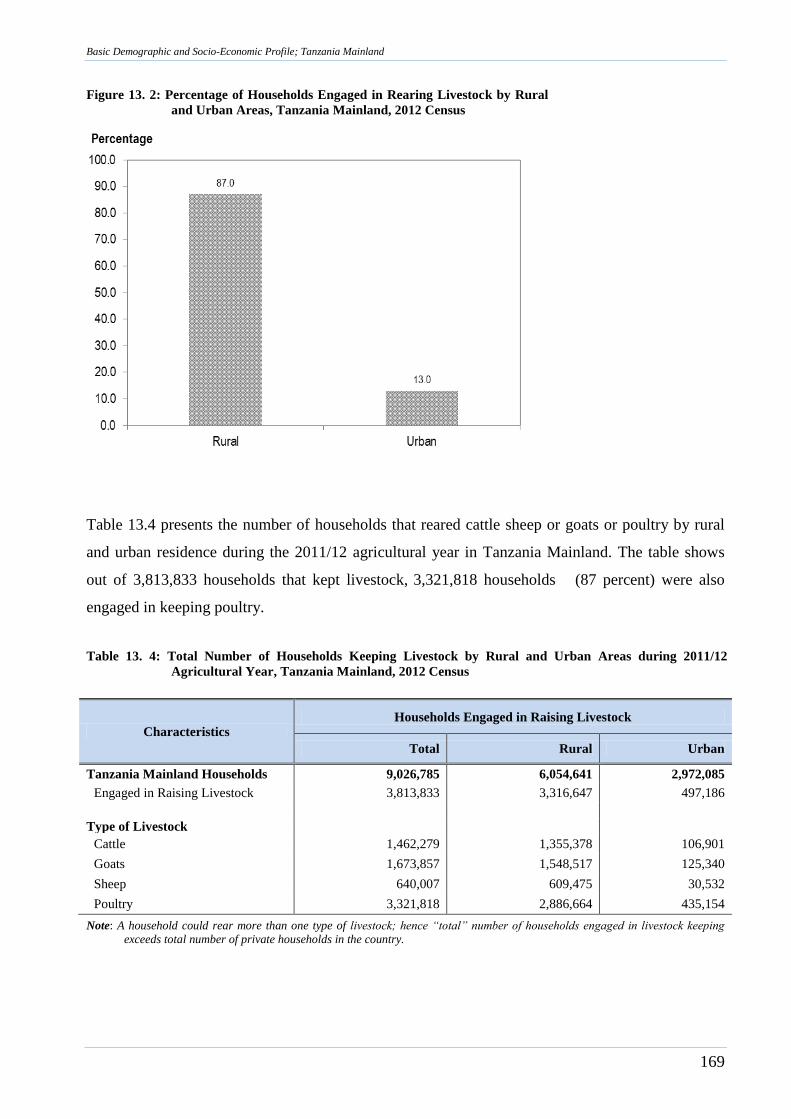
Basic Demographic and Socio-Economic Profile; Tanzania Mainland
169
Figure 13. 2: Percentage of Households Engaged in Rearing Livestock by Rural
and Urban Areas, Tanzania Mainland, 2012 Census
Table 13.4 presents the number of households that reared cattle sheep or goats or poultry by rural
and urban residence during the 2011/12 agricultural year in Tanzania Mainland. The table shows
out of 3,813,833 households that kept livestock, 3,321,818 households (87 percent) were also
engaged in keeping poultry.
Table 13. 4: Total Number of Households Keeping Livestock by Rural and Urban Areas during 2011/12
Agricultural Year, Tanzania Mainland, 2012 Census
Characteristics Households Engaged in Raising Livestock
Total Rural Urban
Tanzania Mainland Households 9,026,785 6,054,641 2,972,085
Engaged in Raising Livestock 3,813,833 3,316,647 497,186
Type of Livestock
Cattle 1,462,279 1,355,378 106,901
Goats 1,673,857 1,548,517 125,340
Sheep 640,007 609,475 30,532
Poultry 3,321,818 2,886,664 435,154
Note: A household could rear more than one type of livestock; hence “total” number of households engaged in livestock keeping
exceeds total number of private households in the country.
Basic Demographic and Socio-Economic Profile; Tanzania Mainland
170
Table 13.5 presents the total number of cattle, goats, sheep and poultry owned by livestock rearing
households by region and Male or Female headed households as of 26th August 2012. Tanzania
Mainland had a total of 23,967,902 cattle, out of which 18,010,922 cattle (75 percent) were reared
in male headed household and 5,956,980 (25 percent) were reared in female headed household.
Moreover, the total number of sheep in Tanzania Mainland as of the census day was 4,388,877, of
which 71 percent (3,096,641 sheep) were reared in male headed household and 29 percent
(1,292,236 sheep) were reared in female headed household.
The table further reveals that, 73 percent of goats (10,954,283 goats) in Tanzania Mainland were
reared in male headed household, while 27 percent of goats were reared in female headed
household. Out of the 35,675,796 poultry owned by households, 75 percent (26,597,550 poultry)
were kept in male headed household and remaining 25 percent (9,078,246 poultry) were kept in
female headed household. In general male headed household kept more livestock than female
headed household.
As of the census night, Tabora had the highest number of both Cattle and Poultry (2,227,637 cattle
and 2,477,071 poultry) and Arusha had highest number of both Goats and Sheep (1,884,783 goat
and 842,453 sheep). Likewise, Mtwara had the lowest number of cattle (167,200 cattle), Lindi had
the lowest number of both goat and sheep (98,328 goat and 6,968 sheep respectively) and Katavi
had the lowest number of Poultry (550,571).
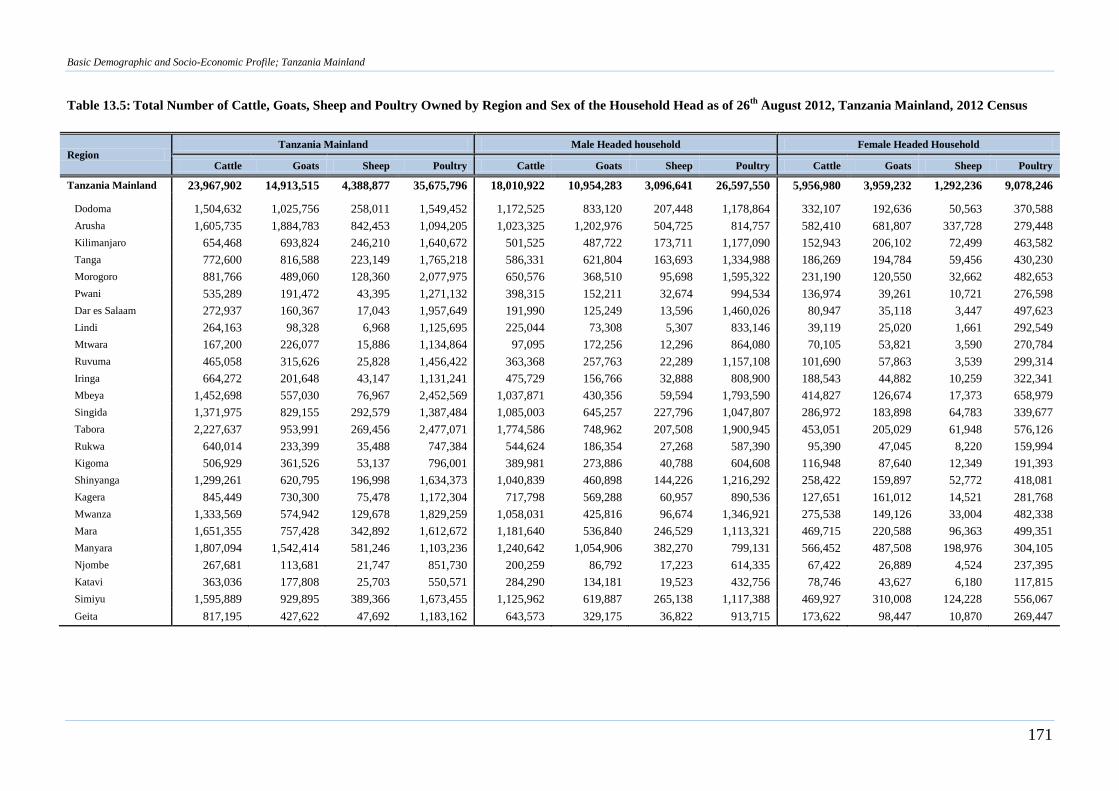
Basic Demographic and Socio-Economic Profile; Tanzania Mainland
171
Table 13.5: Total Number of Cattle, Goats, Sheep and Poultry Owned by Region and Sex of the Household Head as of 26th
August 2012, Tanzania Mainland, 2012 Census
Region Tanzania Mainland Male Headed household Female Headed Household
Cattle Goats Sheep Poultry Cattle Goats Sheep Poultry Cattle Goats Sheep Poultry
Tanzania Mainland 23,967,902 14,913,515 4,388,877 35,675,796 18,010,922 10,954,283 3,096,641 26,597,550 5,956,980 3,959,232 1,292,236 9,078,246
Dodoma 1,504,632 1,025,756 258,011 1,549,452 1,172,525 833,120 207,448 1,178,864 332,107 192,636 50,563 370,588
Arusha 1,605,735 1,884,783 842,453 1,094,205 1,023,325 1,202,976 504,725 814,757 582,410 681,807 337,728 279,448
Kilimanjaro 654,468 693,824 246,210 1,640,672 501,525 487,722 173,711 1,177,090 152,943 206,102 72,499 463,582
Tanga 772,600 816,588 223,149 1,765,218 586,331 621,804 163,693 1,334,988 186,269 194,784 59,456 430,230
Morogoro 881,766 489,060 128,360 2,077,975 650,576 368,510 95,698 1,595,322 231,190 120,550 32,662 482,653
Pwani 535,289 191,472 43,395 1,271,132 398,315 152,211 32,674 994,534 136,974 39,261 10,721 276,598
Dar es Salaam 272,937 160,367 17,043 1,957,649 191,990 125,249 13,596 1,460,026 80,947 35,118 3,447 497,623
Lindi 264,163 98,328 6,968 1,125,695 225,044 73,308 5,307 833,146 39,119 25,020 1,661 292,549
Mtwara 167,200 226,077 15,886 1,134,864 97,095 172,256 12,296 864,080 70,105 53,821 3,590 270,784
Ruvuma 465,058 315,626 25,828 1,456,422 363,368 257,763 22,289 1,157,108 101,690 57,863 3,539 299,314
Iringa 664,272 201,648 43,147 1,131,241 475,729 156,766 32,888 808,900 188,543 44,882 10,259 322,341
Mbeya 1,452,698 557,030 76,967 2,452,569 1,037,871 430,356 59,594 1,793,590 414,827 126,674 17,373 658,979
Singida 1,371,975 829,155 292,579 1,387,484 1,085,003 645,257 227,796 1,047,807 286,972 183,898 64,783 339,677
Tabora 2,227,637 953,991 269,456 2,477,071 1,774,586 748,962 207,508 1,900,945 453,051 205,029 61,948 576,126
Rukwa 640,014 233,399 35,488 747,384 544,624 186,354 27,268 587,390 95,390 47,045 8,220 159,994
Kigoma 506,929 361,526 53,137 796,001 389,981 273,886 40,788 604,608 116,948 87,640 12,349 191,393
Shinyanga 1,299,261 620,795 196,998 1,634,373 1,040,839 460,898 144,226 1,216,292 258,422 159,897 52,772 418,081
Kagera 845,449 730,300 75,478 1,172,304 717,798 569,288 60,957 890,536 127,651 161,012 14,521 281,768
Mwanza 1,333,569 574,942 129,678 1,829,259 1,058,031 425,816 96,674 1,346,921 275,538 149,126 33,004 482,338
Mara 1,651,355 757,428 342,892 1,612,672 1,181,640 536,840 246,529 1,113,321 469,715 220,588 96,363 499,351
Manyara 1,807,094 1,542,414 581,246 1,103,236 1,240,642 1,054,906 382,270 799,131 566,452 487,508 198,976 304,105
Njombe 267,681 113,681 21,747 851,730 200,259 86,792 17,223 614,335 67,422 26,889 4,524 237,395
Katavi 363,036 177,808 25,703 550,571 284,290 134,181 19,523 432,756 78,746 43,627 6,180 117,815
Simiyu 1,595,889 929,895 389,366 1,673,455 1,125,962 619,887 265,138 1,117,388 469,927 310,008 124,228 556,067
Geita 817,195 427,622 47,692 1,183,162 643,573 329,175 36,822 913,715 173,622 98,447 10,870 269,447
Basic Demographic and Socio-Economic Profile; Tanzania Mainland
172
Table 13.6 shows the distribution number of livestock and poultry in Rural and Urban Areas as of
the Census night. Result reveals that more than 90 percent of the cattle reared in Tanzania
Mainland (21,961,988 cattle) are found in Rural Areas. A similar pattern is observed in goats and
sheep while for poultry the percentage is slightly lower (81 percent).
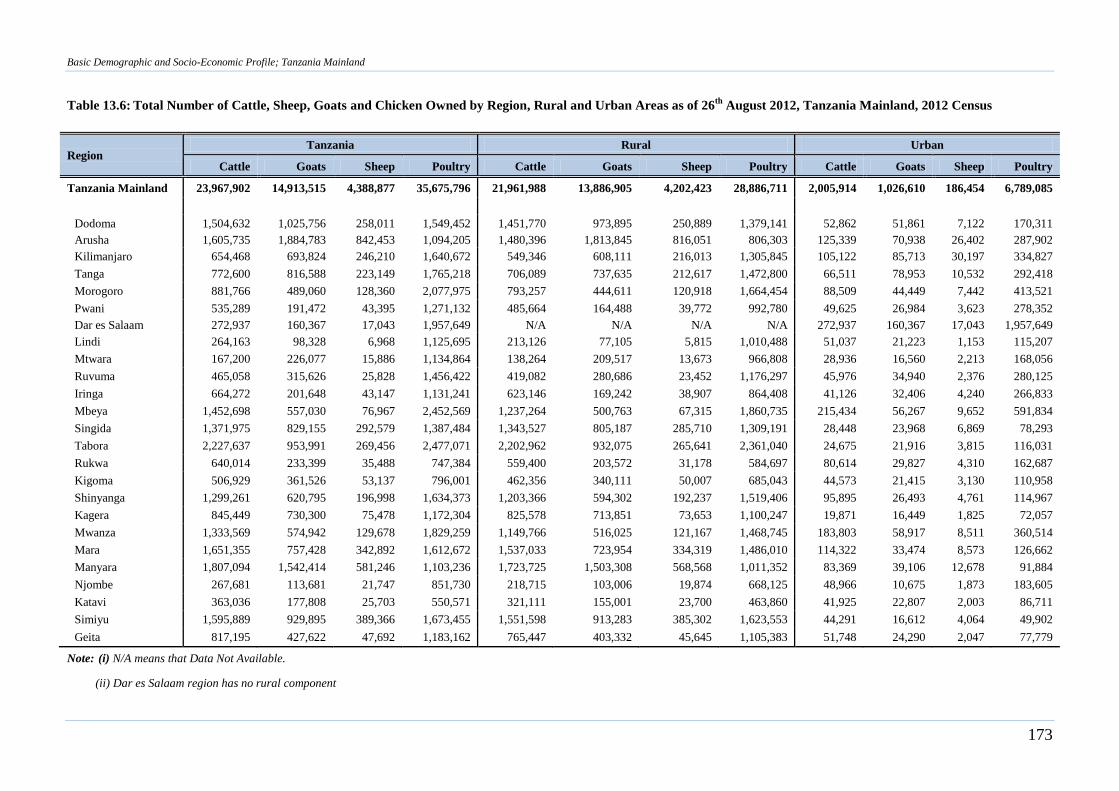
Basic Demographic and Socio-Economic Profile; Tanzania Mainland
173
Table 13.6: Total Number of Cattle, Sheep, Goats and Chicken Owned by Region, Rural and Urban Areas as of 26th
August 2012, Tanzania Mainland, 2012 Census
Region Tanzania Rural Urban
Cattle Goats Sheep Poultry Cattle Goats Sheep Poultry Cattle Goats Sheep Poultry
Tanzania Mainland 23,967,902 14,913,515 4,388,877 35,675,796 21,961,988 13,886,905 4,202,423 28,886,711 2,005,914 1,026,610 186,454 6,789,085
Dodoma 1,504,632 1,025,756 258,011 1,549,452 1,451,770 973,895 250,889 1,379,141 52,862 51,861 7,122 170,311
Arusha 1,605,735 1,884,783 842,453 1,094,205 1,480,396 1,813,845 816,051 806,303 125,339 70,938 26,402 287,902
Kilimanjaro 654,468 693,824 246,210 1,640,672 549,346 608,111 216,013 1,305,845 105,122 85,713 30,197 334,827
Tanga 772,600 816,588 223,149 1,765,218 706,089 737,635 212,617 1,472,800 66,511 78,953 10,532 292,418
Morogoro 881,766 489,060 128,360 2,077,975 793,257 444,611 120,918 1,664,454 88,509 44,449 7,442 413,521
Pwani 535,289 191,472 43,395 1,271,132 485,664 164,488 39,772 992,780 49,625 26,984 3,623 278,352
Dar es Salaam 272,937 160,367 17,043 1,957,649 N/A N/A N/A N/A 272,937 160,367 17,043 1,957,649
Lindi 264,163 98,328 6,968 1,125,695 213,126 77,105 5,815 1,010,488 51,037 21,223 1,153 115,207
Mtwara 167,200 226,077 15,886 1,134,864 138,264 209,517 13,673 966,808 28,936 16,560 2,213 168,056
Ruvuma 465,058 315,626 25,828 1,456,422 419,082 280,686 23,452 1,176,297 45,976 34,940 2,376 280,125
Iringa 664,272 201,648 43,147 1,131,241 623,146 169,242 38,907 864,408 41,126 32,406 4,240 266,833
Mbeya 1,452,698 557,030 76,967 2,452,569 1,237,264 500,763 67,315 1,860,735 215,434 56,267 9,652 591,834
Singida 1,371,975 829,155 292,579 1,387,484 1,343,527 805,187 285,710 1,309,191 28,448 23,968 6,869 78,293
Tabora 2,227,637 953,991 269,456 2,477,071 2,202,962 932,075 265,641 2,361,040 24,675 21,916 3,815 116,031
Rukwa 640,014 233,399 35,488 747,384 559,400 203,572 31,178 584,697 80,614 29,827 4,310 162,687
Kigoma 506,929 361,526 53,137 796,001 462,356 340,111 50,007 685,043 44,573 21,415 3,130 110,958
Shinyanga 1,299,261 620,795 196,998 1,634,373 1,203,366 594,302 192,237 1,519,406 95,895 26,493 4,761 114,967
Kagera 845,449 730,300 75,478 1,172,304 825,578 713,851 73,653 1,100,247 19,871 16,449 1,825 72,057
Mwanza 1,333,569 574,942 129,678 1,829,259 1,149,766 516,025 121,167 1,468,745 183,803 58,917 8,511 360,514
Mara 1,651,355 757,428 342,892 1,612,672 1,537,033 723,954 334,319 1,486,010 114,322 33,474 8,573 126,662
Manyara 1,807,094 1,542,414 581,246 1,103,236 1,723,725 1,503,308 568,568 1,011,352 83,369 39,106 12,678 91,884
Njombe 267,681 113,681 21,747 851,730 218,715 103,006 19,874 668,125 48,966 10,675 1,873 183,605
Katavi 363,036 177,808 25,703 550,571 321,111 155,001 23,700 463,860 41,925 22,807 2,003 86,711
Simiyu 1,595,889 929,895 389,366 1,673,455 1,551,598 913,283 385,302 1,623,553 44,291 16,612 4,064 49,902
Geita 817,195 427,622 47,692 1,183,162 765,447 403,332 45,645 1,105,383 51,748 24,290 2,047 77,779
Note: (i) N/A means that Data Not Available.
(ii) Dar es Salaam region has no rural component
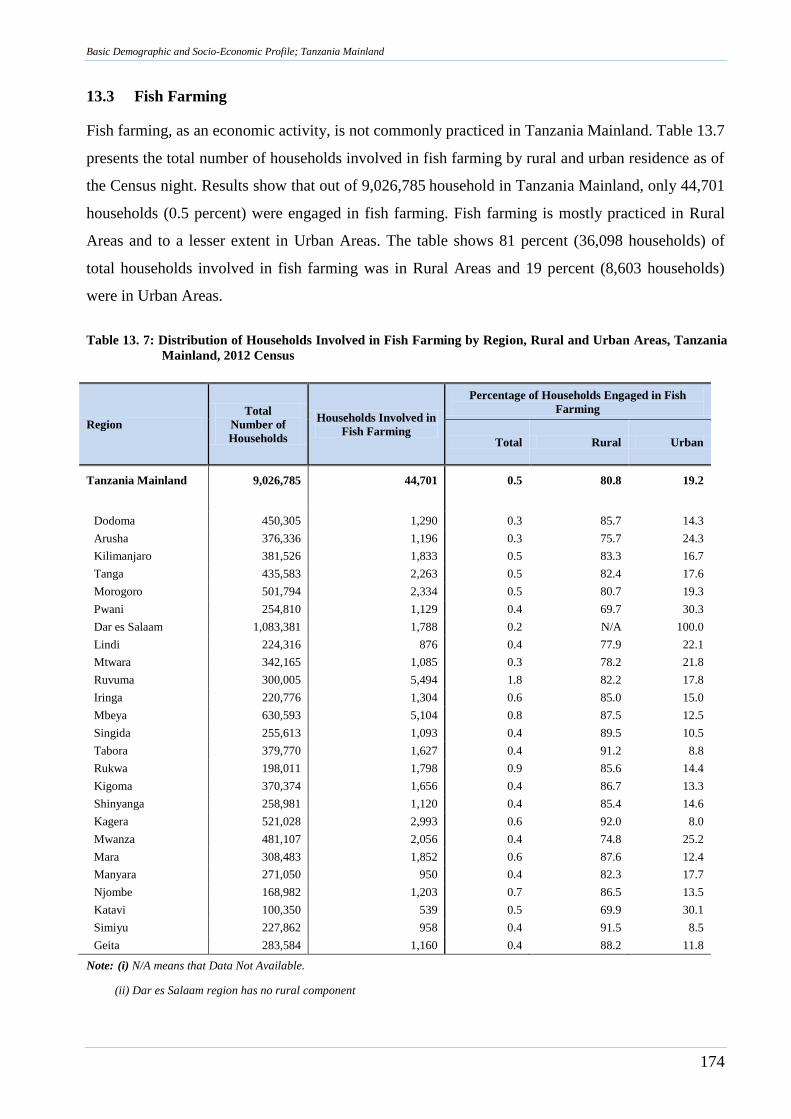
Basic Demographic and Socio-Economic Profile; Tanzania Mainland
174
13.3 Fish Farming
Fish farming, as an economic activity, is not commonly practiced in Tanzania Mainland. Table 13.7
presents the total number of households involved in fish farming by rural and urban residence as of
the Census night. Results show that out of 9,026,785 household in Tanzania Mainland, only 44,701
households (0.5 percent) were engaged in fish farming. Fish farming is mostly practiced in Rural
Areas and to a lesser extent in Urban Areas. The table shows 81 percent (36,098 households) of
total households involved in fish farming was in Rural Areas and 19 percent (8,603 households)
were in Urban Areas.
Table 13. 7: Distribution of Households Involved in Fish Farming by Region, Rural and Urban Areas, Tanzania
Mainland, 2012 Census
Region
Total
Number of
Households
Households Involved in
Fish Farming
Percentage of Households Engaged in Fish
Farming
Total Rural Urban
Tanzania Mainland 9,026,785 44,701 0.5 80.8 19.2
Dodoma 450,305 1,290 0.3 85.7 14.3
Arusha 376,336 1,196 0.3 75.7 24.3
Kilimanjaro 381,526 1,833 0.5 83.3 16.7
Tanga 435,583 2,263 0.5 82.4 17.6
Morogoro 501,794 2,334 0.5 80.7 19.3
Pwani 254,810 1,129 0.4 69.7 30.3
Dar es Salaam 1,083,381 1,788 0.2 N/A 100.0
Lindi 224,316 876 0.4 77.9 22.1
Mtwara 342,165 1,085 0.3 78.2 21.8
Ruvuma 300,005 5,494 1.8 82.2 17.8
Iringa 220,776 1,304 0.6 85.0 15.0
Mbeya 630,593 5,104 0.8 87.5 12.5
Singida 255,613 1,093 0.4 89.5 10.5
Tabora 379,770 1,627 0.4 91.2 8.8
Rukwa 198,011 1,798 0.9 85.6 14.4
Kigoma 370,374 1,656 0.4 86.7 13.3
Shinyanga 258,981 1,120 0.4 85.4 14.6
Kagera 521,028 2,993 0.6 92.0 8.0
Mwanza 481,107 2,056 0.4 74.8 25.2
Mara 308,483 1,852 0.6 87.6 12.4
Manyara 271,050 950 0.4 82.3 17.7
Njombe 168,982 1,203 0.7 86.5 13.5
Katavi 100,350 539 0.5 69.9 30.1
Simiyu 227,862 958 0.4 91.5 8.5
Geita 283,584 1,160 0.4 88.2 11.8
Note: (i) N/A means that Data Not Available.
(ii) Dar es Salaam region has no rural component

Basic Demographic and Socio-Economic Profile; Tanzania Mainland
175
References
National Bureau of Statistics (NBS), 2003. The 2002 Population and Housing Census, General
Report, Dar es Salaam, Tanzania
National Bureau of Statistics (NBS), 2003. The 2002 Population and Housing Census, Age and Sex
Distribution Report, Dar es Salaam, Tanzania
National Bureau of Statistics (NBS), 2004. The 2002 Population and Housing Census, National
Basic Demographic and Socio-Economic Profile, Dar es Salaam, Tanzania
National Bureau of Statistics (NBS), 2006. The 2002 Population and Housing Census, Analytical
Report, Dar es Salaam, Tanzania
National Bureau of Statistics (NBS), 2008. The 2012 Population and Housing Census Management
and Implementation Strategy, Dar es Salaam, Tanzania
National Bureau of Statistics (NBS), 2013. The 2012 Population and Housing Census, Population
Distribution by Administrative Areas (Volume I), Dar es Salaam, Tanzania
National Bureau of Statistics (NBS), 2013. The 2012 Population and Housing Census, Population
Distribution by Age and Sex (Volume II), Dar es Salaam, Tanzania
Population Reference Bureau, 2011. PRB’s Population Handbook, (Sixth Edition), Washington
DC, USA
Population Reference Bureau, 2012. 2012 WORLD POPULATION Data Sheet, Washington DC,
USA
United Nations, 2008. Principles and Recommendations for Population and Housing Censuses,
New York, USA

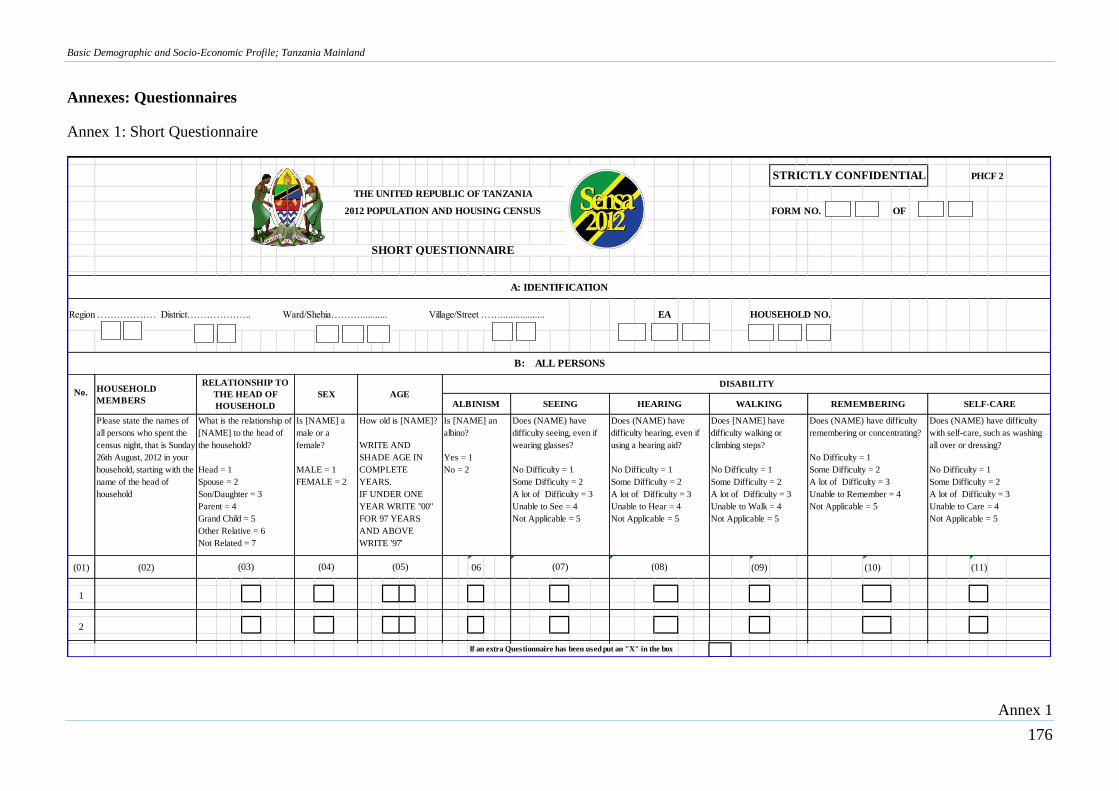
Basic Demographic and Socio-Economic Profile; Tanzania Mainland
Annex 1
176
Annexes: Questionnaires
Annex 1: Short Questionnaire
PHCF 2
FORM NO. OF
Region ……………… District……………….. Ward/Shehia………........... Village/Street …….................. EA
Please state the names of
all persons who spent the
census night, that is Sunday
26th August, 2012 in your
household, starting with the
name of the head of
household
(01) (02) 06 (09) (10) (11)
1
2
If an extra Questionnaire has been used put an "X" in the box
(08)
Does (NAME) have difficulty
remembering or concentrating?
No Difficulty = 1
Some Difficulty = 2
A lot of Difficulty = 3
Unable to Remember = 4
Not Applicable = 5
(07)
REMEMBERING
(03) (04) (05)
Does [NAME] have
difficulty walking or
climbing steps?
No Difficulty = 1
Some Difficulty = 2
A lot of Difficulty = 3
Unable to Walk = 4
Not Applicable = 5
WALKINGHEARINGALBINISMAGE
Does (NAME) have
difficulty hearing, even if
using a hearing aid?
No Difficulty = 1
Some Difficulty = 2
A lot of Difficulty = 3
Unable to Hear = 4
Not Applicable = 5
Does (NAME) have
difficulty seeing, even if
wearing glasses?
No Difficulty = 1
Some Difficulty = 2
A lot of Difficulty = 3
Unable to See = 4
Not Applicable = 5
STRICTLY CONFIDENTIAL
B: ALL PERSONS
No. HOUSEHOLD
MEMBERS
RELATIONSHIP TO
THE HEAD OF
HOUSEHOLD
SEX
Is [NAME] an
albino?
Yes = 1
No = 2
What is the relationship of
[NAME] to the head of
the household?
Head = 1
Spouse = 2
Son/Daughter = 3
Parent = 4
Grand Child = 5
Other Relative = 6
Not Related = 7
SEEING
Is [NAME] a
male or a
female?
MALE = 1
FEMALE = 2
HOUSEHOLD NO.
A: IDENTIFICATION
How old is [NAME]?
WRITE AND
SHADE AGE IN
COMPLETE
YEARS.
IF UNDER ONE
YEAR WRITE "00"
FOR 97 YEARS
AND ABOVE
WRITE '97'
THE UNITED REPUBLIC OF TANZANIA
2012 POPULATION AND HOUSING CENSUS
SHORT QUESTIONNAIRE
DISABILITY
Does (NAME) have difficulty
with self-care, such as washing
all over or dressing?
No Difficulty = 1
Some Difficulty = 2
A lot of Difficulty = 3
Unable to Care = 4
Not Applicable = 5
SELF-CARE
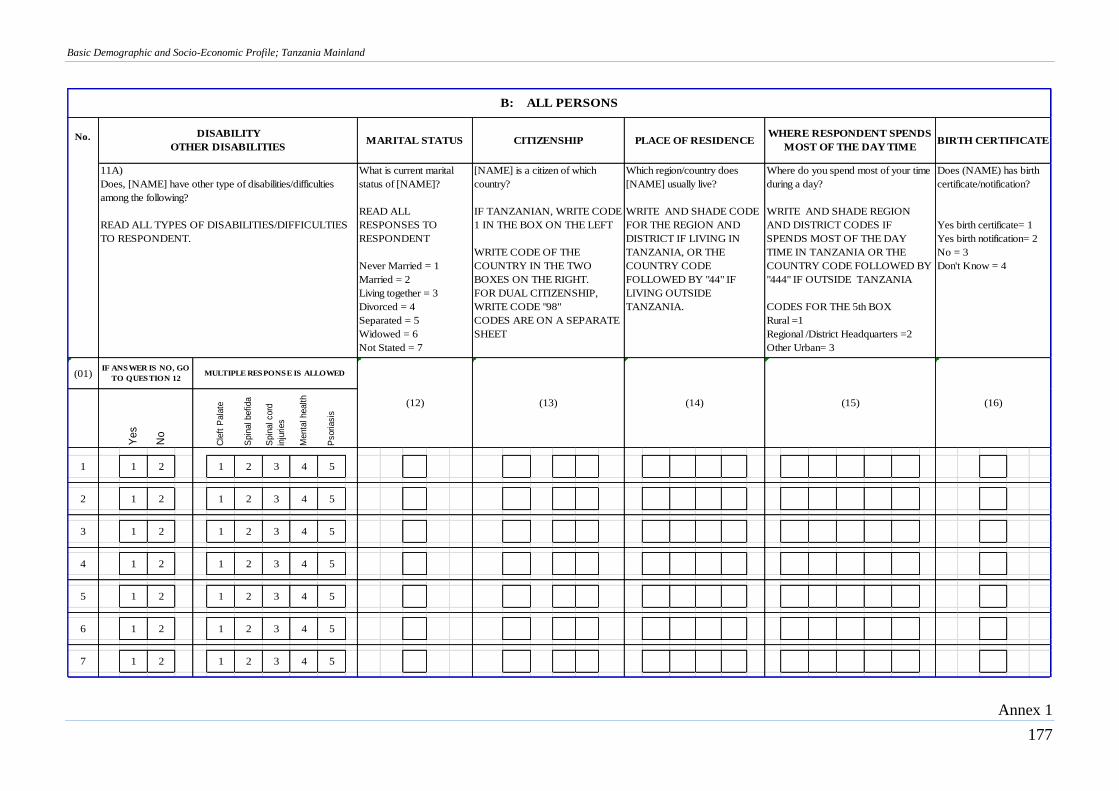
Basic Demographic and Socio-Economic Profile; Tanzania Mainland
Annex 1
177
(01)
Ye
s
No
Cle
ft P
ala
te
Spin
al befida
Spin
al cord
inju
ries
Menta
l health
Psoriasis
1 1 2 1 2 3 4 5
2 1 2 1 2 3 4 5
3 1 2 1 2 3 4 5
4 1 2 1 2 3 4 5
5 1 2 1 2 3 4 5
6 1 2 1 2 3 4 5
7 1 2 1 2 3 4 5
B: ALL PERSONS
What is current marital
status of [NAME]?
READ ALL
RESPONSES TO
RESPONDENT
Never Married = 1
Married = 2
Living together = 3
Divorced = 4
Separated = 5
Widowed = 6
Not Stated = 7
[NAME] is a citizen of which
country?
IF TANZANIAN, WRITE CODE
1 IN THE BOX ON THE LEFT
WRITE CODE OF THE
COUNTRY IN THE TWO
BOXES ON THE RIGHT.
FOR DUAL CITIZENSHIP,
WRITE CODE "98"
CODES ARE ON A SEPARATE
SHEET
Which region/country does
[NAME] usually live?
WRITE AND SHADE CODE
FOR THE REGION AND
DISTRICT IF LIVING IN
TANZANIA, OR THE
COUNTRY CODE
FOLLOWED BY "44" IF
LIVING OUTSIDE
TANZANIA.
Where do you spend most of your time
during a day?
WRITE AND SHADE REGION
AND DISTRICT CODES IF
SPENDS MOST OF THE DAY
TIME IN TANZANIA OR THE
COUNTRY CODE FOLLOWED BY
"444" IF OUTSIDE TANZANIA
CODES FOR THE 5th BOX
Rural =1
Regional /District Headquarters =2
Other Urban= 3
PLACE OF RESIDENCE BIRTH CERTIFICATENo. WHERE RESPONDENT SPENDS
MOST OF THE DAY TIME
Does (NAME) has birth
certificate/notification?
Yes birth certificate= 1
Yes birth notification= 2
No = 3
Don't Know = 4
DISABILITY
OTHER DISABILITIES
11A)
Does, [NAME] have other type of disabilities/difficulties
among the following?
READ ALL TYPES OF DISABILITIES/DIFFICULTIES
TO RESPONDENT.
(12) (13) (14) (15)
MARITAL STATUS CITIZENSHIP
(16)
IF ANSWER IS NO, GO
TO QUESTION 12MULTIPLE RESPONSE IS ALLOWED
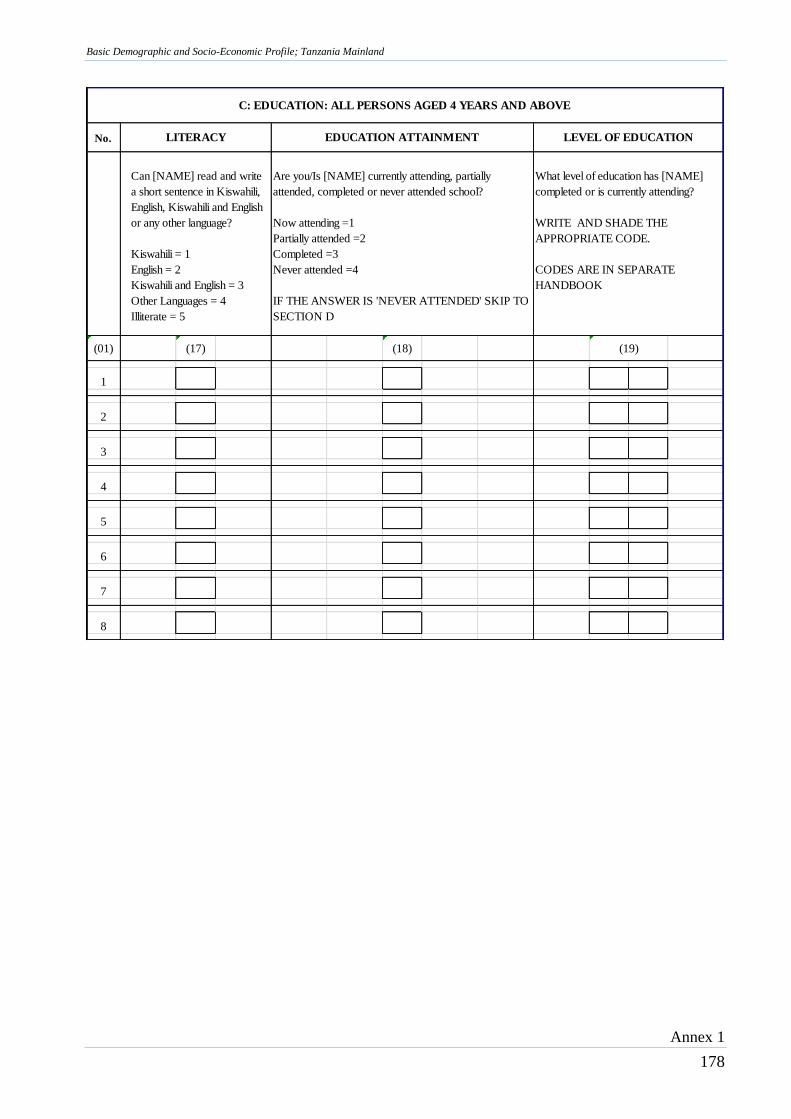
Basic Demographic and Socio-Economic Profile; Tanzania Mainland
Annex 1
178
No.
(01) (17) (18)
1
2
3
4
5
6
7
8
C: EDUCATION: ALL PERSONS AGED 4 YEARS AND ABOVE
(19)
LITERACY EDUCATION ATTAINMENT LEVEL OF EDUCATION
Can [NAME] read and write
a short sentence in Kiswahili,
English, Kiswahili and English
or any other language?
Kiswahili = 1
English = 2
Kiswahili and English = 3
Other Languages = 4
Illiterate = 5
Are you/Is [NAME] currently attending, partially
attended, completed or never attended school?
Now attending =1
Partially attended =2
Completed =3
Never attended =4
IF THE ANSWER IS 'NEVER ATTENDED' SKIP TO
SECTION D
What level of education has [NAME]
completed or is currently attending?
WRITE AND SHADE THE
APPROPRIATE CODE.
CODES ARE IN SEPARATE
HANDBOOK
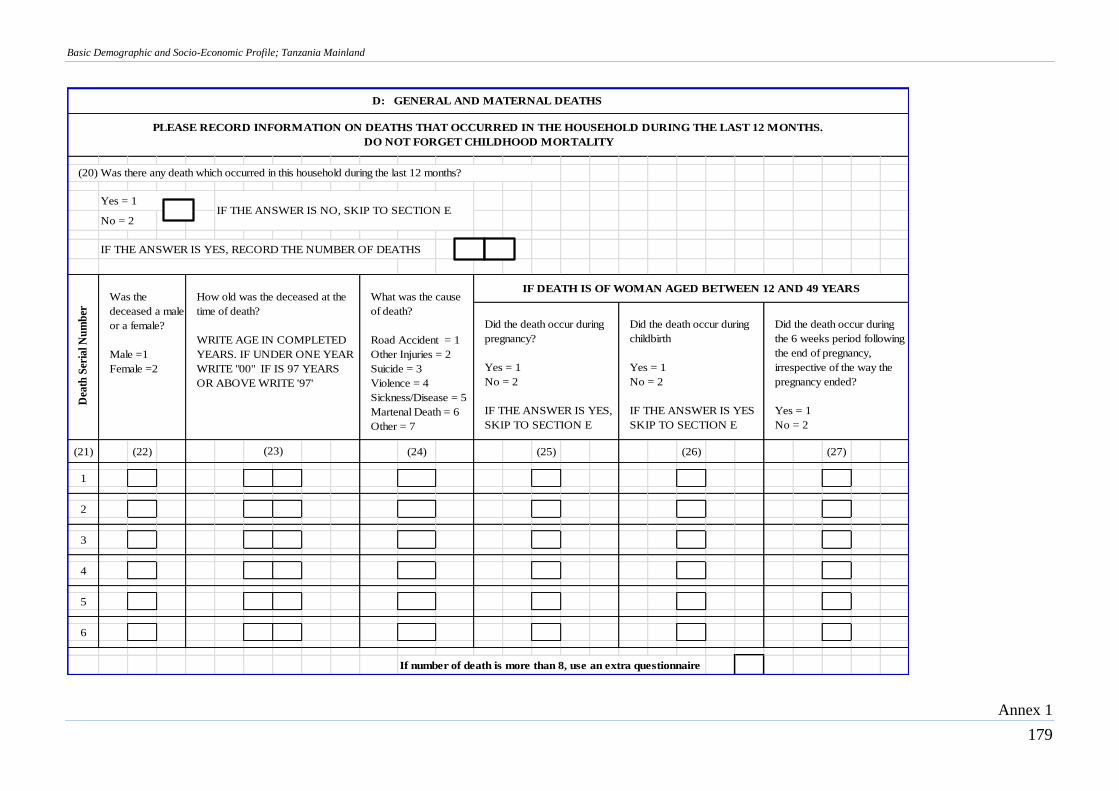
Basic Demographic and Socio-Economic Profile; Tanzania Mainland
Annex 1
179
Yes = 1
No = 2
IF THE ANSWER IS YES, RECORD THE NUMBER OF DEATHS
(21) (22) (24) (25) (26) (27)
1
2
3
4
5
6
If number of death is more than 8, use an extra questionnaire
What was the cause
of death?
Road Accident = 1
Other Injuries = 2
Suicide = 3
Violence = 4
Sickness/Disease = 5
Martenal Death = 6
Other = 7
How old was the deceased at the
time of death?
WRITE AGE IN COMPLETED
YEARS. IF UNDER ONE YEAR
WRITE "00" IF IS 97 YEARS
OR ABOVE WRITE '97'
D: GENERAL AND MATERNAL DEATHS
IF THE ANSWER IS NO, SKIP TO SECTION E
(23)
PLEASE RECORD INFORMATION ON DEATHS THAT OCCURRED IN THE HOUSEHOLD DURING THE LAST 12 MONTHS.
DO NOT FORGET CHILDHOOD MORTALITY
Did the death occur during
pregnancy?
Yes = 1
No = 2
IF THE ANSWER IS YES,
SKIP TO SECTION E
Did the death occur during
childbirth
Yes = 1
No = 2
IF THE ANSWER IS YES
SKIP TO SECTION E
Did the death occur during
the 6 weeks period following
the end of pregnancy,
irrespective of the way the
pregnancy ended?
Yes = 1
No = 2
IF DEATH IS OF WOMAN AGED BETWEEN 12 AND 49 YEARS
(20) Was there any death which occurred in this household during the last 12 months?
Dea
th S
eria
l N
um
ber
Was the
deceased a male
or a female?
Male =1
Female =2
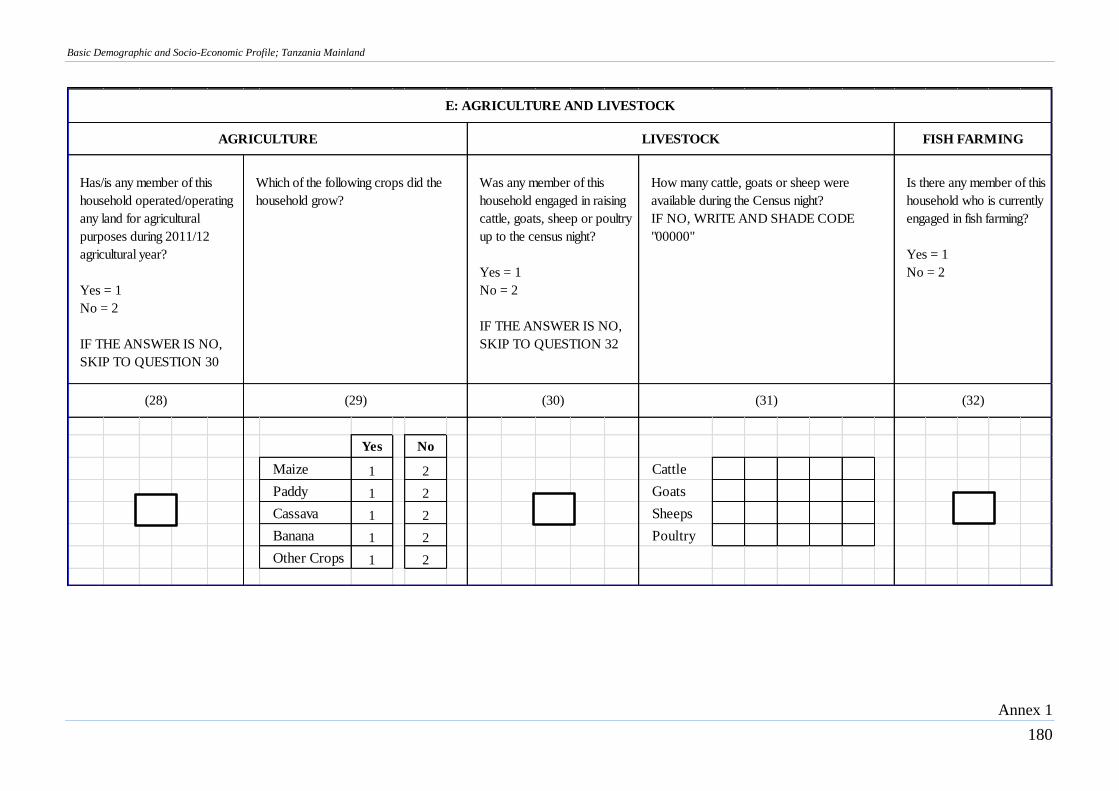
Basic Demographic and Socio-Economic Profile; Tanzania Mainland
Annex 1
180
Yes No
Maize 1 2 Cattle
Paddy 1 2 Goats
Cassava 1 2 Sheeps
Banana 1 2 Poultry
Other Crops 1 2
Has/is any member of this
household operated/operating
any land for agricultural
purposes during 2011/12
agricultural year?
Yes = 1
No = 2
IF THE ANSWER IS NO,
SKIP TO QUESTION 30
Which of the following crops did the
household grow?
Was any member of this
household engaged in raising
cattle, goats, sheep or poultry
up to the census night?
Yes = 1
No = 2
IF THE ANSWER IS NO,
SKIP TO QUESTION 32
How many cattle, goats or sheep were
available during the Census night?
IF NO, WRITE AND SHADE CODE
"00000"
E: AGRICULTURE AND LIVESTOCK
Is there any member of this
household who is currently
engaged in fish farming?
Yes = 1
No = 2
AGRICULTURE LIVESTOCK FISH FARMING
(28) (29) (30) (31) (32)
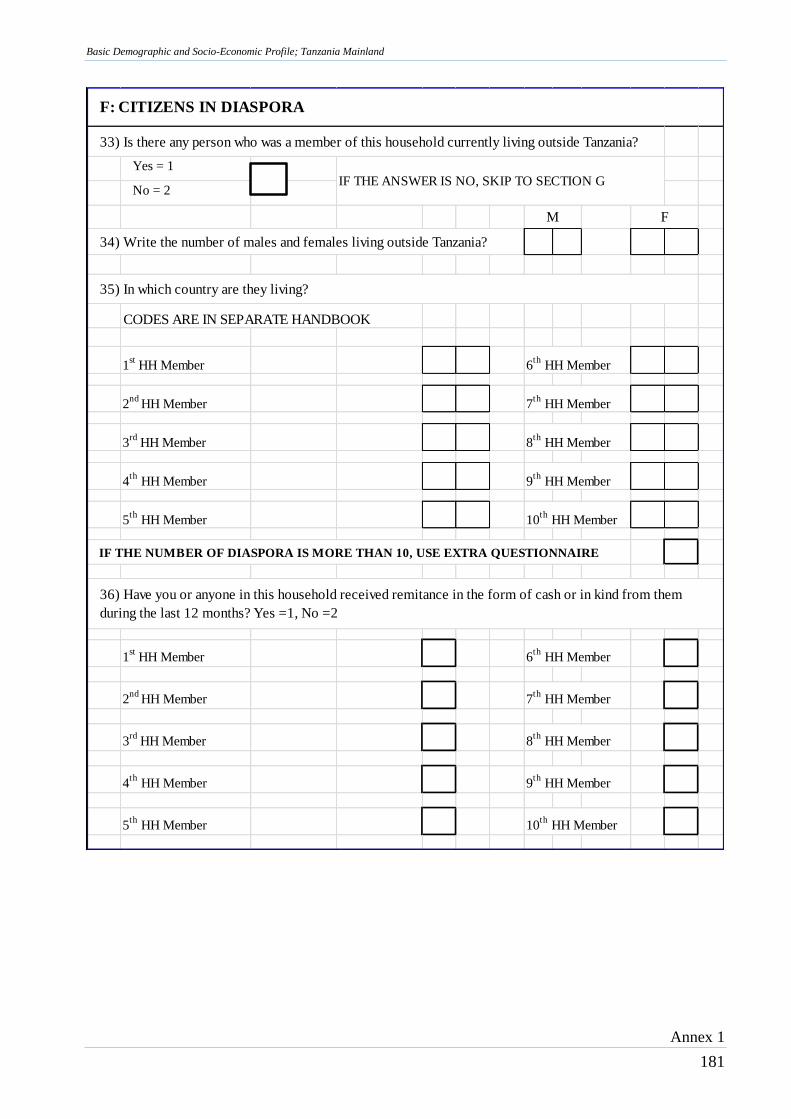
Basic Demographic and Socio-Economic Profile; Tanzania Mainland
Annex 1
181
33) Is there any person who was a member of this household currently living outside Tanzania?
Yes = 1
No = 2
34) Write the number of males and females living outside Tanzania?
CODES ARE IN SEPARATE HANDBOOK
1st
HH Member 6th
HH Member
2nd
HH Member 7th
HH Member
3rd
HH Member 8th
HH Member
4th
HH Member 9th
HH Member
5th
HH Member 10th
HH Member
IF THE NUMBER OF DIASPORA IS MORE THAN 10, USE EXTRA QUESTIONNAIRE
1st
HH Member 6th
HH Member
2nd
HH Member 7th
HH Member
3rd
HH Member 8th
HH Member
4th
HH Member 9th
HH Member
5th
HH Member 10th
HH Member
36) Have you or anyone in this household received remitance in the form of cash or in kind from them
during the last 12 months? Yes =1, No =2
F
IF THE ANSWER IS NO, SKIP TO SECTION G
F: CITIZENS IN DIASPORA
M
35) In which country are they living?
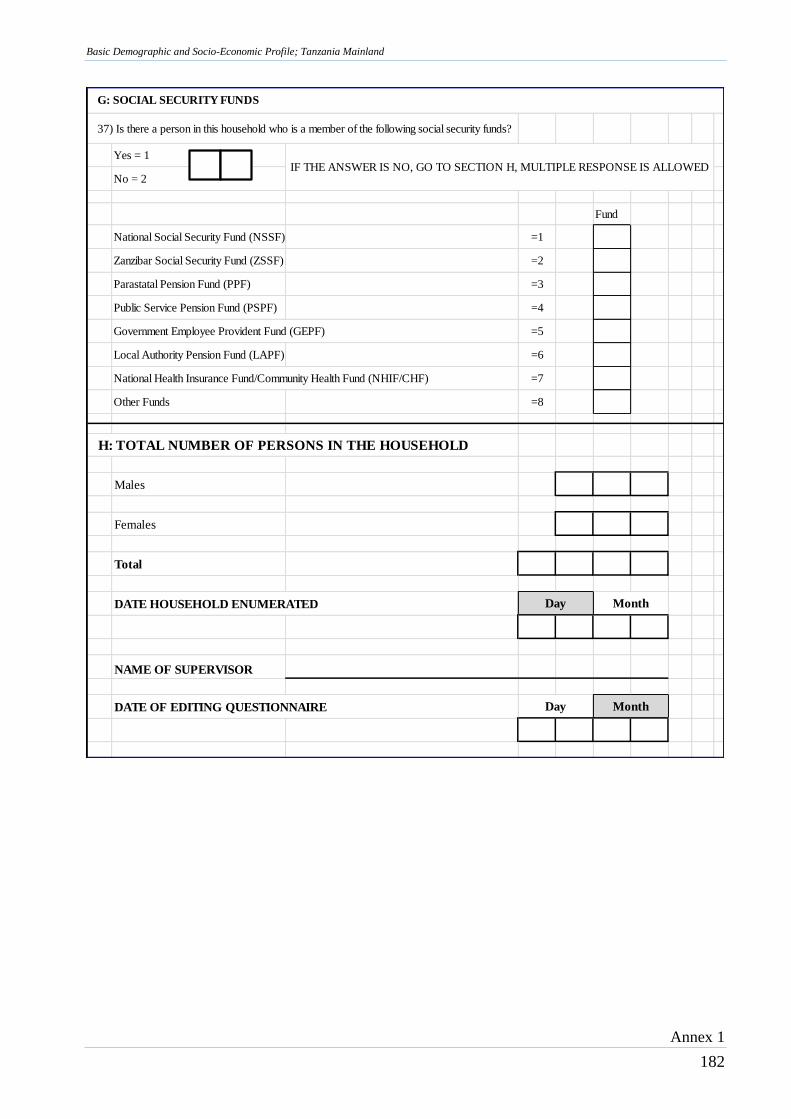
Basic Demographic and Socio-Economic Profile; Tanzania Mainland
Annex 1
182
37) Is there a person in this household who is a member of the following social security funds?
Yes = 1
No = 2
Fund
National Social Security Fund (NSSF) =1
Zanzibar Social Security Fund (ZSSF) =2
Parastatal Pension Fund (PPF) =3
Public Service Pension Fund (PSPF) =4
Government Employee Provident Fund (GEPF) =5
Local Authority Pension Fund (LAPF) =6
National Health Insurance Fund/Community Health Fund (NHIF/CHF) =7
Other Funds =8
H: TOTAL NUMBER OF PERSONS IN THE HOUSEHOLD
Males
Females
Total
DATE HOUSEHOLD ENUMERATED
NAME OF SUPERVISOR
DATE OF EDITING QUESTIONNAIRE
IF THE ANSWER IS NO, GO TO SECTION H, MULTIPLE RESPONSE IS ALLOWED
Day Month
G: SOCIAL SECURITY FUNDS
Day Month
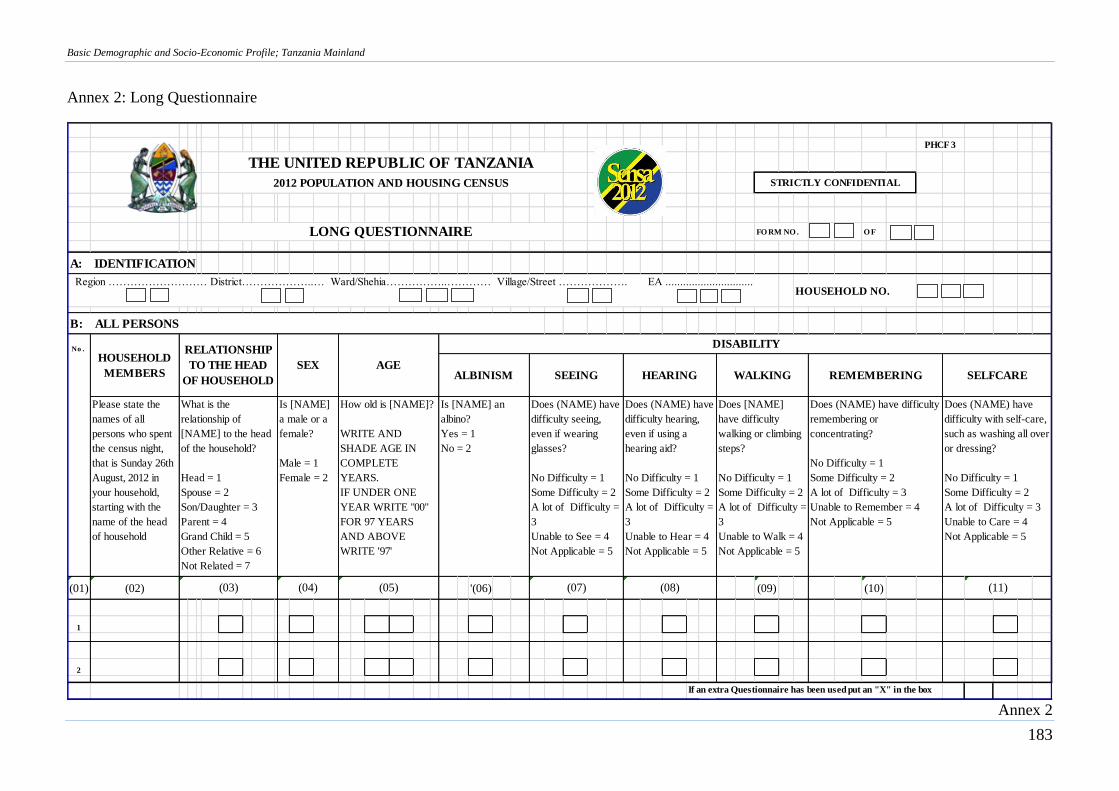
Basic Demographic and Socio-Economic Profile; Tanzania Mainland
Annex 2
183
Annex 2: Long Questionnaire
FO RM NO . O F
A: IDENTIFICATION
Region ……………………… District………………..… Ward/Shehia……………..………… Village/Street ………………. EA .............................. HOUSEHOLD NO.
Please state the
names of all
persons who spent
the census night,
that is Sunday 26th
August, 2012 in
your household,
starting with the
name of the head
of household
(01) (02) '(06) (09) (10)
1
2
If an extra Questionnaire has been used put an "X" in the box
Does (NAME) have difficulty
remembering or
concentrating?
No Difficulty = 1
Some Difficulty = 2
A lot of Difficulty = 3
Unable to Remember = 4
Not Applicable = 5
Does (NAME) have
difficulty with self-care,
such as washing all over
or dressing?
No Difficulty = 1
Some Difficulty = 2
A lot of Difficulty = 3
Unable to Care = 4
Not Applicable = 5
(03) (04) (05) (07) (08) (11)
WALKING REMEMBERING SELFCARE
What is the
relationship of
[NAME] to the head
of the household?
Head = 1
Spouse = 2
Son/Daughter = 3
Parent = 4
Grand Child = 5
Other Relative = 6
Not Related = 7
Is [NAME]
a male or a
female?
Male = 1
Female = 2
How old is [NAME]?
WRITE AND
SHADE AGE IN
COMPLETE
YEARS.
IF UNDER ONE
YEAR WRITE "00"
FOR 97 YEARS
AND ABOVE
WRITE '97'
Is [NAME] an
albino?
Yes = 1
No = 2
Does (NAME) have
difficulty seeing,
even if wearing
glasses?
No Difficulty = 1
Some Difficulty = 2
A lot of Difficulty =
3
Unable to See = 4
Not Applicable = 5
Does (NAME) have
difficulty hearing,
even if using a
hearing aid?
No Difficulty = 1
Some Difficulty = 2
A lot of Difficulty =
3
Unable to Hear = 4
Not Applicable = 5
Does [NAME]
have difficulty
walking or climbing
steps?
No Difficulty = 1
Some Difficulty = 2
A lot of Difficulty =
3
Unable to Walk = 4
Not Applicable = 5
B: ALL PERSONS
No .
HOUSEHOLD
MEMBERS
RELATIONSHIP
TO THE HEAD
OF HOUSEHOLD
SEX AGE
DISABILITY
ALBINISM SEEING HEARING
PHCF 3
THE UNITED REPUBLIC OF TANZANIA
2012 POPULATION AND HOUSING CENSUS STRICTLY CONFIDENTIAL
LONG QUESTIONNAIRE
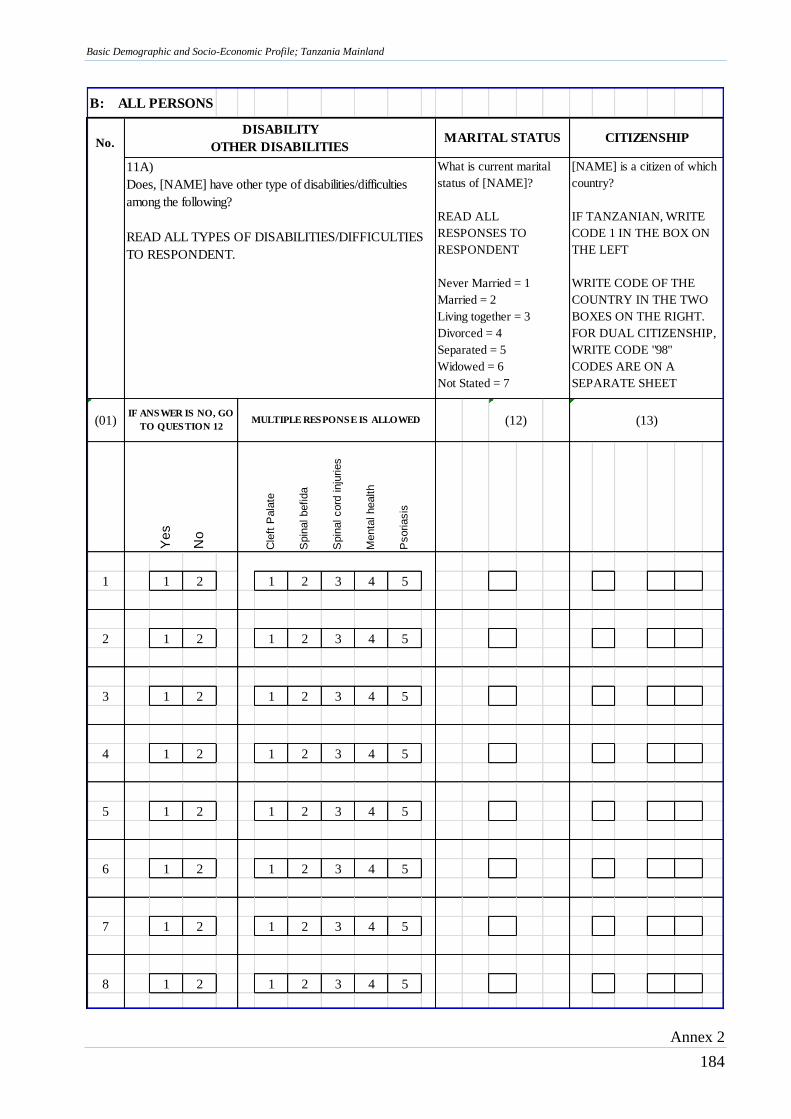
Basic Demographic and Socio-Economic Profile; Tanzania Mainland
Annex 2
184
B: ALL PERSONS
(01)
Ye
s
No
Cle
ft P
ala
te
Spin
al befida
Spin
al cord
inju
ries
Menta
l health
Psoriasis
1 1 2 1 2 3 4 5
2 1 2 1 2 3 4 5
3 1 2 1 2 3 4 5
4 1 2 1 2 3 4 5
5 1 2 1 2 3 4 5
6 1 2 1 2 3 4 5
7 1 2 1 2 3 4 5
8 1 2 1 2 3 4 5
No.DISABILITY
OTHER DISABILITIES
11A)
Does, [NAME] have other type of disabilities/difficulties
among the following?
READ ALL TYPES OF DISABILITIES/DIFFICULTIES
TO RESPONDENT.
IF ANSWER IS NO, GO
TO QUESTION 12MULTIPLE RESPONSE IS ALLOWED
What is current marital
status of [NAME]?
READ ALL
RESPONSES TO
RESPONDENT
Never Married = 1
Married = 2
Living together = 3
Divorced = 4
Separated = 5
Widowed = 6
Not Stated = 7
[NAME] is a citizen of which
country?
IF TANZANIAN, WRITE
CODE 1 IN THE BOX ON
THE LEFT
WRITE CODE OF THE
COUNTRY IN THE TWO
BOXES ON THE RIGHT.
FOR DUAL CITIZENSHIP,
WRITE CODE "98"
CODES ARE ON A
SEPARATE SHEET
MARITAL STATUS CITIZENSHIP
(12) (13)
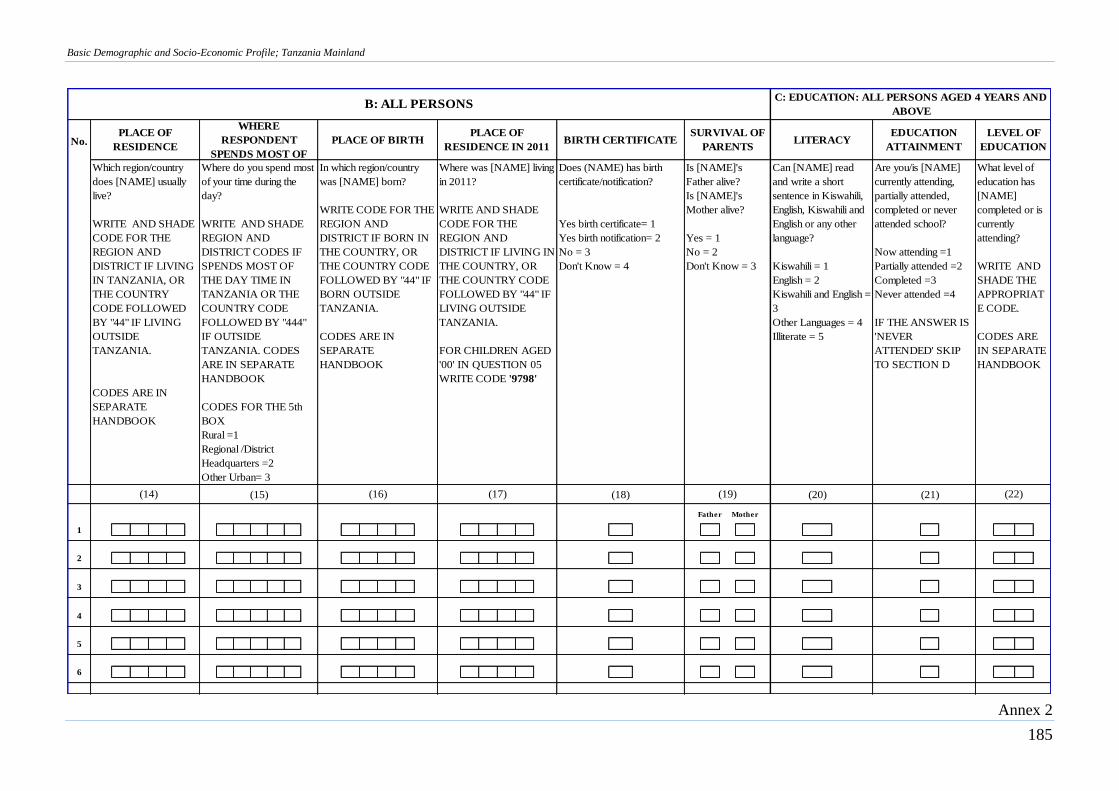
Basic Demographic and Socio-Economic Profile; Tanzania Mainland
Annex 2
185
(15) (18) (20) (21)
Father Mother
1
2
3
4
5
6
C: EDUCATION: ALL PERSONS AGED 4 YEARS AND
ABOVE
LITERACYEDUCATION
ATTAINMENT
LEVEL OF
EDUCATION
Which region/country
does [NAME] usually
live?
WRITE AND SHADE
CODE FOR THE
REGION AND
DISTRICT IF LIVING
IN TANZANIA, OR
THE COUNTRY
CODE FOLLOWED
BY "44" IF LIVING
OUTSIDE
TANZANIA.
CODES ARE IN
SEPARATE
HANDBOOK
B: ALL PERSONS
PLACE OF
RESIDENCENo.
(22)(16)
PLACE OF
RESIDENCE IN 2011
Where was [NAME] living
in 2011?
WRITE AND SHADE
CODE FOR THE
REGION AND
DISTRICT IF LIVING IN
THE COUNTRY, OR
THE COUNTRY CODE
FOLLOWED BY "44" IF
LIVING OUTSIDE
TANZANIA.
FOR CHILDREN AGED
'00' IN QUESTION 05
WRITE CODE '9798'
PLACE OF BIRTH
In which region/country
was [NAME] born?
WRITE CODE FOR THE
REGION AND
DISTRICT IF BORN IN
THE COUNTRY, OR
THE COUNTRY CODE
FOLLOWED BY "44" IF
BORN OUTSIDE
TANZANIA.
CODES ARE IN
SEPARATE
HANDBOOK
Is [NAME]'s
Father alive?
Is [NAME]'s
Mother alive?
Yes = 1
No = 2
Don't Know = 3
What level of
education has
[NAME]
completed or is
currently
attending?
WRITE AND
SHADE THE
APPROPRIAT
E CODE.
CODES ARE
IN SEPARATE
HANDBOOK
(14) (19)(17)
Are you/is [NAME]
currently attending,
partially attended,
completed or never
attended school?
Now attending =1
Partially attended =2
Completed =3
Never attended =4
IF THE ANSWER IS
'NEVER
ATTENDED' SKIP
TO SECTION D
BIRTH CERTIFICATE
Does (NAME) has birth
certificate/notification?
Yes birth certificate= 1
Yes birth notification= 2
No = 3
Don't Know = 4
Can [NAME] read
and write a short
sentence in Kiswahili,
English, Kiswahili and
English or any other
language?
Kiswahili = 1
English = 2
Kiswahili and English =
3
Other Languages = 4
Illiterate = 5
WHERE
RESPONDENT
SPENDS MOST OF
Where do you spend most
of your time during the
day?
WRITE AND SHADE
REGION AND
DISTRICT CODES IF
SPENDS MOST OF
THE DAY TIME IN
TANZANIA OR THE
COUNTRY CODE
FOLLOWED BY "444"
IF OUTSIDE
TANZANIA. CODES
ARE IN SEPARATE
HANDBOOK
CODES FOR THE 5th
BOX
Rural =1
Regional /District
Headquarters =2
Other Urban= 3
SURVIVAL OF
PARENTS
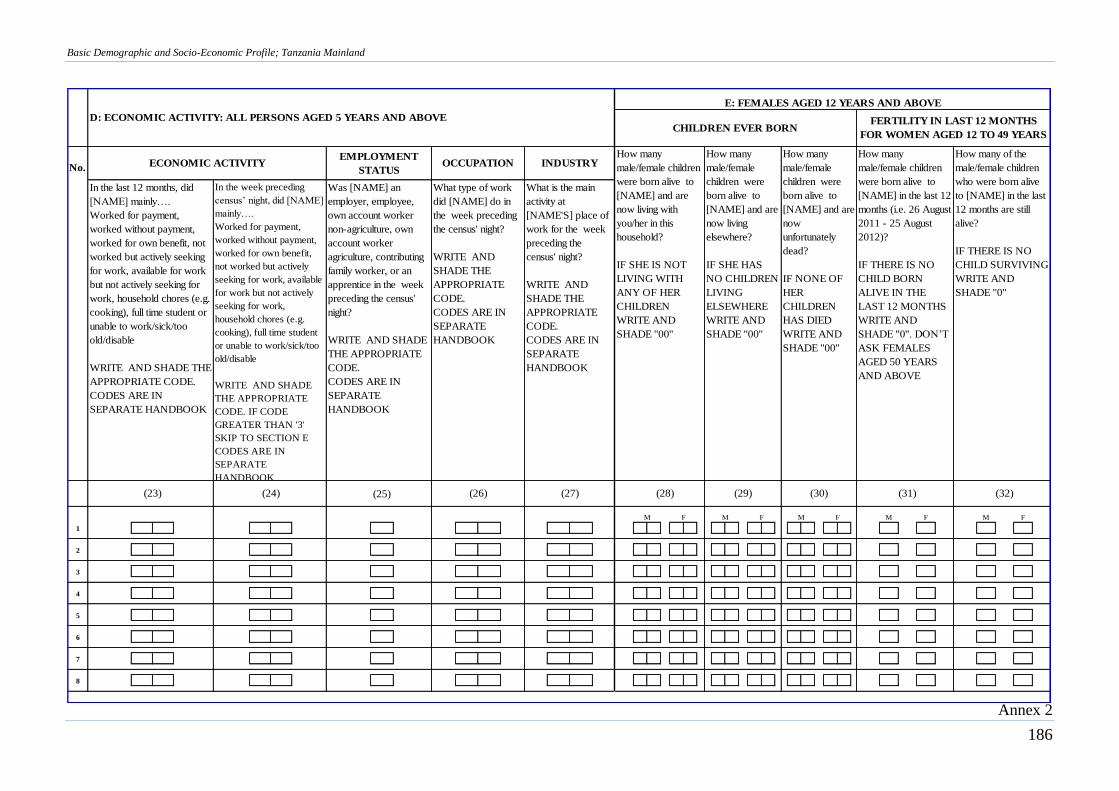
Basic Demographic and Socio-Economic Profile; Tanzania Mainland
Annex 2
186
(25)
M F M F
1
2
3
4
5
6
7
8
(27)(23) (24)
No.
In the last 12 months, did
[NAME] mainly….
Worked for payment,
worked without payment,
worked for own benefit, not
worked but actively seeking
for work, available for work
but not actively seeking for
work, household chores (e.g.
cooking), full time student or
unable to work/sick/too
old/disable
WRITE AND SHADE THE
APPROPRIATE CODE.
CODES ARE IN
SEPARATE HANDBOOK
In the week preceding
census‟ night, did [NAME]
mainly….
Worked for payment,
worked without payment,
worked for own benefit,
not worked but actively
seeking for work, available
for work but not actively
seeking for work,
household chores (e.g.
cooking), full time student
or unable to work/sick/too
old/disable
WRITE AND SHADE
THE APPROPRIATE
CODE. IF CODE
GREATER THAN '3'
SKIP TO SECTION E
CODES ARE IN
SEPARATE
HANDBOOK
Was [NAME] an
employer, employee,
own account worker
non-agriculture, own
account worker
agriculture, contributing
family worker, or an
apprentice in the week
preceding the census'
night?
WRITE AND SHADE
THE APPROPRIATE
CODE.
CODES ARE IN
SEPARATE
HANDBOOK
How many
male/female
children were
born alive to
[NAME] and are
now living
elsewhere?
IF SHE HAS
NO CHILDREN
LIVING
ELSEWHERE
WRITE AND
SHADE ''00''
How many
male/female
children were
born alive to
[NAME] and are
now
unfortunately
dead?
IF NONE OF
HER
CHILDREN
HAS DIED
WRITE AND
SHADE ''00''
How many of the
male/female children
who were born alive
to [NAME] in the last
12 months are still
alive?
IF THERE IS NO
CHILD SURVIVING
WRITE AND
SHADE ''0''
CHILDREN EVER BORN
INDUSTRY
What is the main
activity at
[NAME'S] place of
work for the week
preceding the
census' night?
WRITE AND
SHADE THE
APPROPRIATE
CODE.
CODES ARE IN
SEPARATE
HANDBOOK
How many
male/female children
were born alive to
[NAME] in the last 12
months (i.e. 26 August
2011 - 25 August
2012)?
IF THERE IS NO
CHILD BORN
ALIVE IN THE
LAST 12 MONTHS
WRITE AND
SHADE ''0''. DON‟T
ASK FEMALES
AGED 50 YEARS
AND ABOVE
(32)(28)
D: ECONOMIC ACTIVITY: ALL PERSONS AGED 5 YEARS AND ABOVE
(26)
What type of work
did [NAME] do in
the week preceding
the census' night?
WRITE AND
SHADE THE
APPROPRIATE
CODE.
CODES ARE IN
SEPARATE
HANDBOOK
ECONOMIC ACTIVITY OCCUPATION EMPLOYMENT
STATUS
E: FEMALES AGED 12 YEARS AND ABOVE
How many
male/female children
were born alive to
[NAME] and are
now living with
you/her in this
household?
IF SHE IS NOT
LIVING WITH
ANY OF HER
CHILDREN
WRITE AND
SHADE ''00''
(31)
FERTILITY IN LAST 12 MONTHS
FOR WOMEN AGED 12 TO 49 YEARS
M F
(29) (30)
M F M F
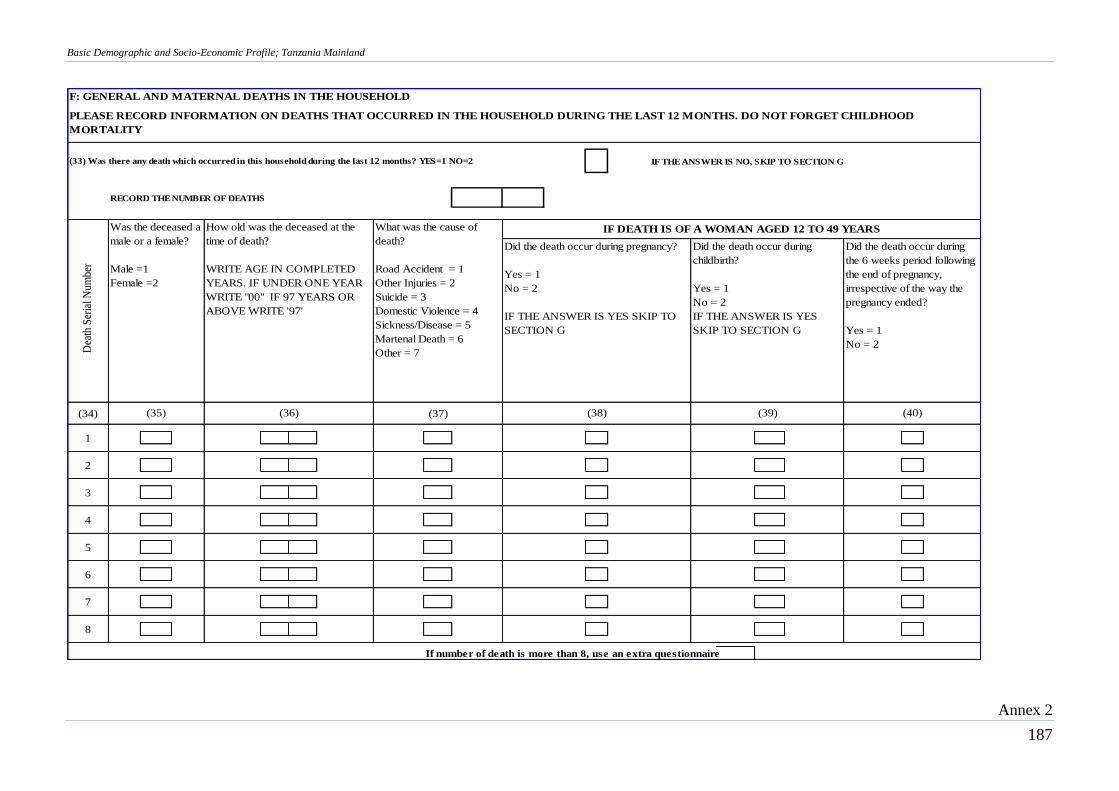
Basic Demographic and Socio-Economic Profile; Tanzania Mainland
Annex 2
187
F: GENERAL AND MATERNAL DEATHS IN THE HOUSEHOLD
IF THE ANSWER IS NO, SKIP TO SECTION G
RECORD THE NUMBER OF DEATHS
(34) (37)
1
2
3
4
5
6
7
8
If number of death is more than 8, use an extra questionnaire
PLEASE RECORD INFORMATION ON DEATHS THAT OCCURRED IN THE HOUSEHOLD DURING THE LAST 12 MONTHS. DO NOT FORGET CHILDHOOD
MORTALITY
Did the death occur during pregnancy?
Yes = 1
No = 2
IF THE ANSWER IS YES SKIP TO
SECTION G
Did the death occur during
childbirth?
Yes = 1
No = 2
IF THE ANSWER IS YES
SKIP TO SECTION G
Did the death occur during
the 6 weeks period following
the end of pregnancy,
irrespective of the way the
pregnancy ended?
Yes = 1
No = 2
IF DEATH IS OF A WOMAN AGED 12 TO 49 YEARS
Dea
th S
eria
l Num
ber
Was the deceased a
male or a female?
Male =1
Female =2
(40)(35)
What was the cause of
death?
Road Accident = 1
Other Injuries = 2
Suicide = 3
Domestic Violence = 4
Sickness/Disease = 5
Martenal Death = 6
Other = 7
(33) Was there any death which occurred in this household during the last 12 months? YES=1 NO=2
(38) (39)
How old was the deceased at the
time of death?
WRITE AGE IN COMPLETED
YEARS. IF UNDER ONE YEAR
WRITE "00" IF 97 YEARS OR
ABOVE WRITE '97'
(36)
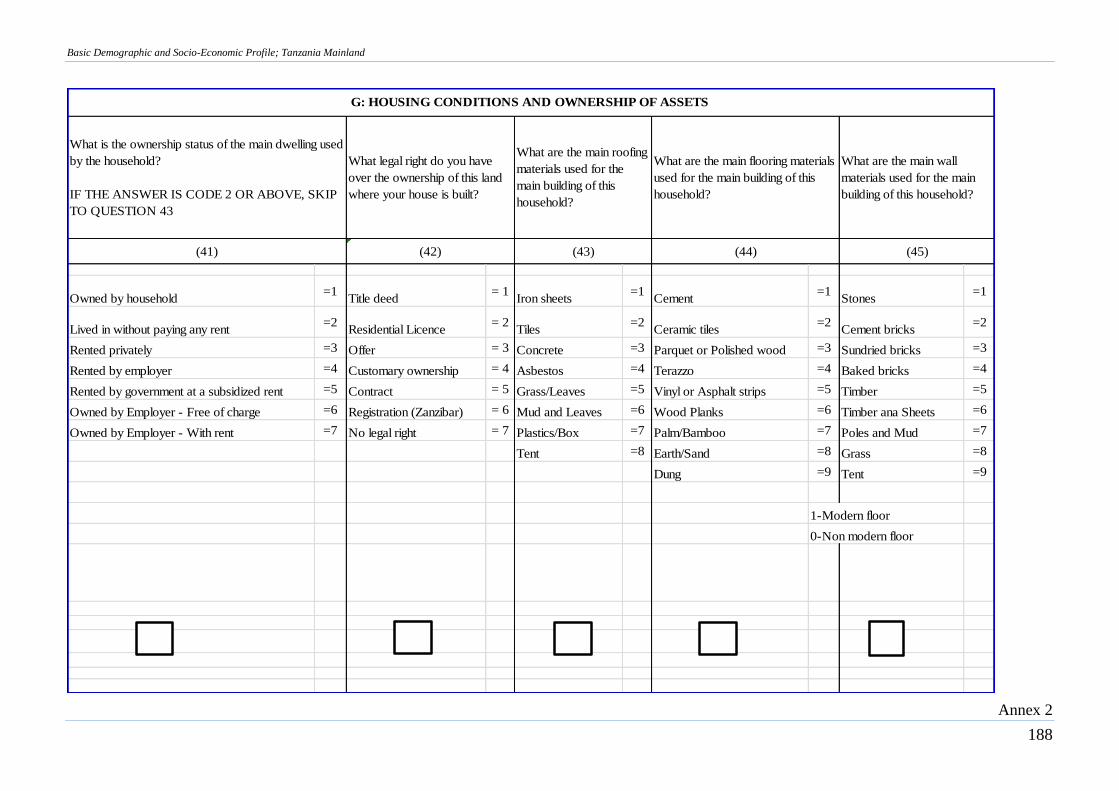
Basic Demographic and Socio-Economic Profile; Tanzania Mainland
Annex 2
188
Owned by household=1
Title deed= 1
Iron sheets =1
Cement =1
Stones =1
Lived in without paying any rent=2
Residential Licence= 2
Tiles =2
Ceramic tiles =2
Cement bricks =2
Rented privately =3 Offer = 3 Concrete =3 Parquet or Polished wood =3 Sundried bricks =3
Rented by employer =4 Customary ownership = 4 Asbestos =4 Terazzo =4 Baked bricks =4
Rented by government at a subsidized rent =5 Contract = 5 Grass/Leaves =5 Vinyl or Asphalt strips =5 Timber =5
Owned by Employer - Free of charge =6 Registration (Zanzibar) = 6 Mud and Leaves =6 Wood Planks =6 Timber ana Sheets =6
Owned by Employer - With rent =7 No legal right = 7 Plastics/Box =7 Palm/Bamboo =7 Poles and Mud =7
Tent =8 Earth/Sand =8 Grass =8
Dung =9 Tent =9
1-Modern floor
0-Non modern floor
(43)
What is the ownership status of the main dwelling used
by the household?
IF THE ANSWER IS CODE 2 OR ABOVE, SKIP
TO QUESTION 43
(42)
What legal right do you have
over the ownership of this land
where your house is built?
(45)
What are the main roofing
materials used for the
main building of this
household?
(44)
G: HOUSING CONDITIONS AND OWNERSHIP OF ASSETS
What are the main wall
materials used for the main
building of this household?
What are the main flooring materials
used for the main building of this
household?
(41)
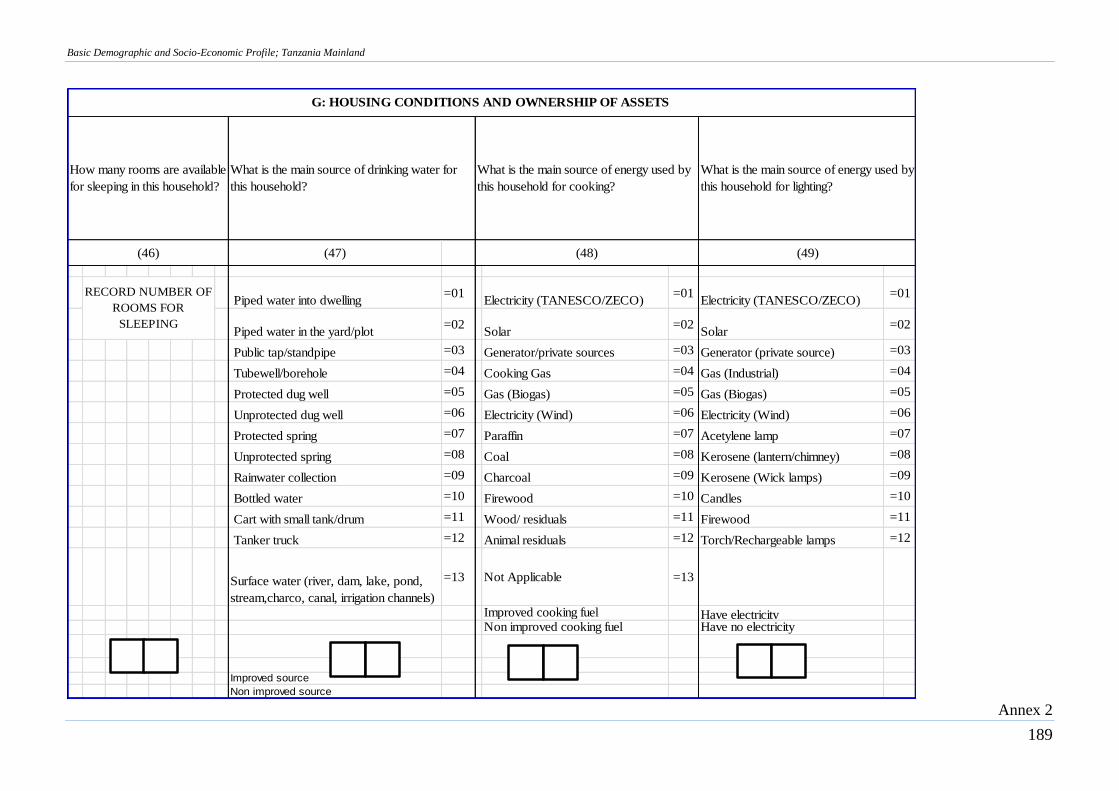
Basic Demographic and Socio-Economic Profile; Tanzania Mainland
Annex 2
189
(47)
Piped water into dwelling =01
Electricity (TANESCO/ZECO) =01
Electricity (TANESCO/ZECO) =01
Piped water in the yard/plot =02
Solar =02
Solar =02
Public tap/standpipe =03 Generator/private sources =03 Generator (private source) =03
Tubewell/borehole =04 Cooking Gas =04 Gas (Industrial) =04
Protected dug well =05 Gas (Biogas) =05 Gas (Biogas) =05
Unprotected dug well =06 Electricity (Wind) =06 Electricity (Wind) =06
Protected spring =07 Paraffin =07 Acetylene lamp =07
Unprotected spring =08 Coal =08 Kerosene (lantern/chimney) =08
Rainwater collection =09 Charcoal =09 Kerosene (Wick lamps) =09
Bottled water =10 Firewood =10 Candles =10
Cart with small tank/drum =11 Wood/ residuals =11 Firewood =11
Tanker truck =12 Animal residuals =12 Torch/Rechargeable lamps =12
Surface water (river, dam, lake, pond,
stream,charco, canal, irrigation channels)
=13 Not Applicable =13
Improved cooking fuel Have electricityNon improved cooking fuel Have no electricity
Improved source
Non improved source
What is the main source of drinking water for
this household?
(49)(48)
What is the main source of energy used by
this household for cooking?
What is the main source of energy used by
this household for lighting?
How many rooms are available
for sleeping in this household?
G: HOUSING CONDITIONS AND OWNERSHIP OF ASSETS
RECORD NUMBER OF
ROOMS FOR
SLEEPING
(46)
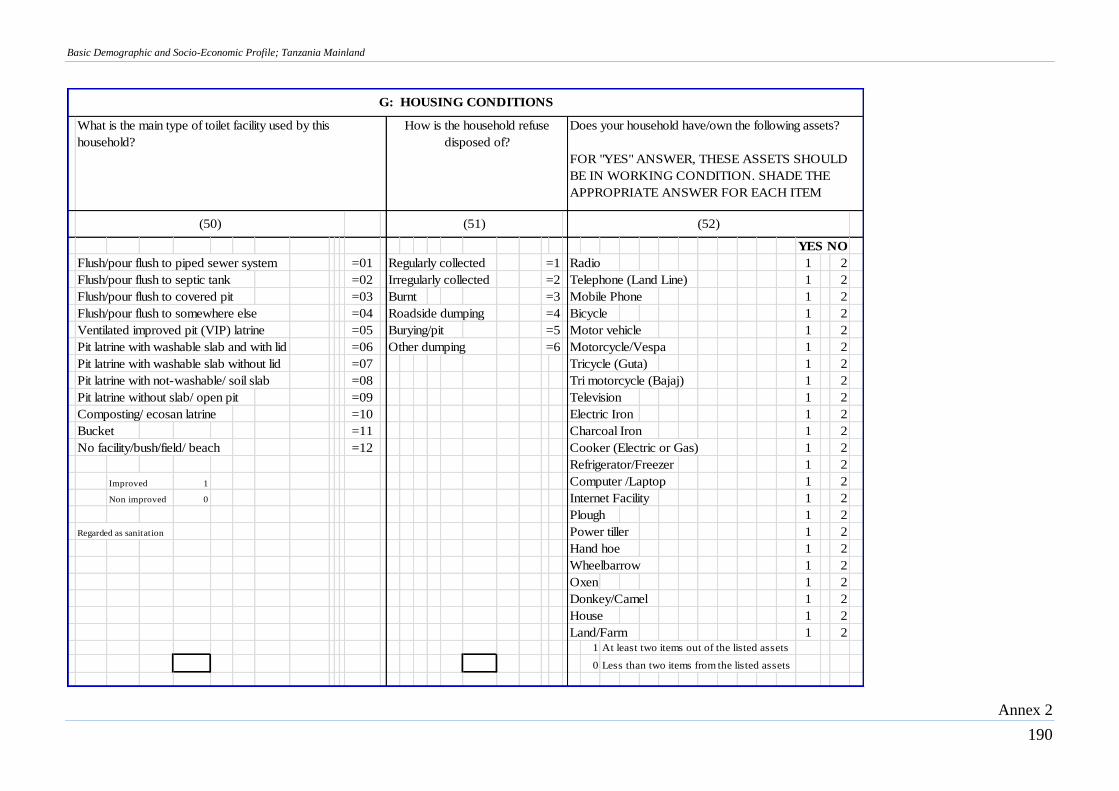
Basic Demographic and Socio-Economic Profile; Tanzania Mainland
Annex 2
190
YES NO
Flush/pour flush to piped sewer system =01 Regularly collected =1 Radio 1 2
Flush/pour flush to septic tank =02 Irregularly collected =2 Telephone (Land Line) 1 2
Flush/pour flush to covered pit =03 Burnt =3 Mobile Phone 1 2
Flush/pour flush to somewhere else =04 Roadside dumping =4 Bicycle 1 2
Ventilated improved pit (VIP) latrine =05 Burying/pit =5 Motor vehicle 1 2
Pit latrine with washable slab and with lid =06 Other dumping =6 Motorcycle/Vespa 1 2
Pit latrine with washable slab without lid =07 Tricycle (Guta) 1 2
Pit latrine with not-washable/ soil slab =08 Tri motorcycle (Bajaj) 1 2
Pit latrine without slab/ open pit =09 Television 1 2
Composting/ ecosan latrine =10 Electric Iron 1 2
Bucket =11 Charcoal Iron 1 2
No facility/bush/field/ beach =12 Cooker (Electric or Gas) 1 2
Refrigerator/Freezer 1 2
Improved 1 Computer /Laptop 1 2
Non improved 0 Internet Facility 1 2
Plough 1 2
Regarded as sanitation Power tiller 1 2
Hand hoe 1 2
Wheelbarrow 1 2
Oxen 1 2
Donkey/Camel 1 2
House 1 2
Land/Farm 1 21 At least two items out of the listed assets
0 Less than two items from the listed assets
G: HOUSING CONDITIONS
Does your household have/own the following assets?
FOR "YES" ANSWER, THESE ASSETS SHOULD
BE IN WORKING CONDITION. SHADE THE
APPROPRIATE ANSWER FOR EACH ITEM
(52)(51)(50)
What is the main type of toilet facility used by this
household?
How is the household refuse
disposed of?
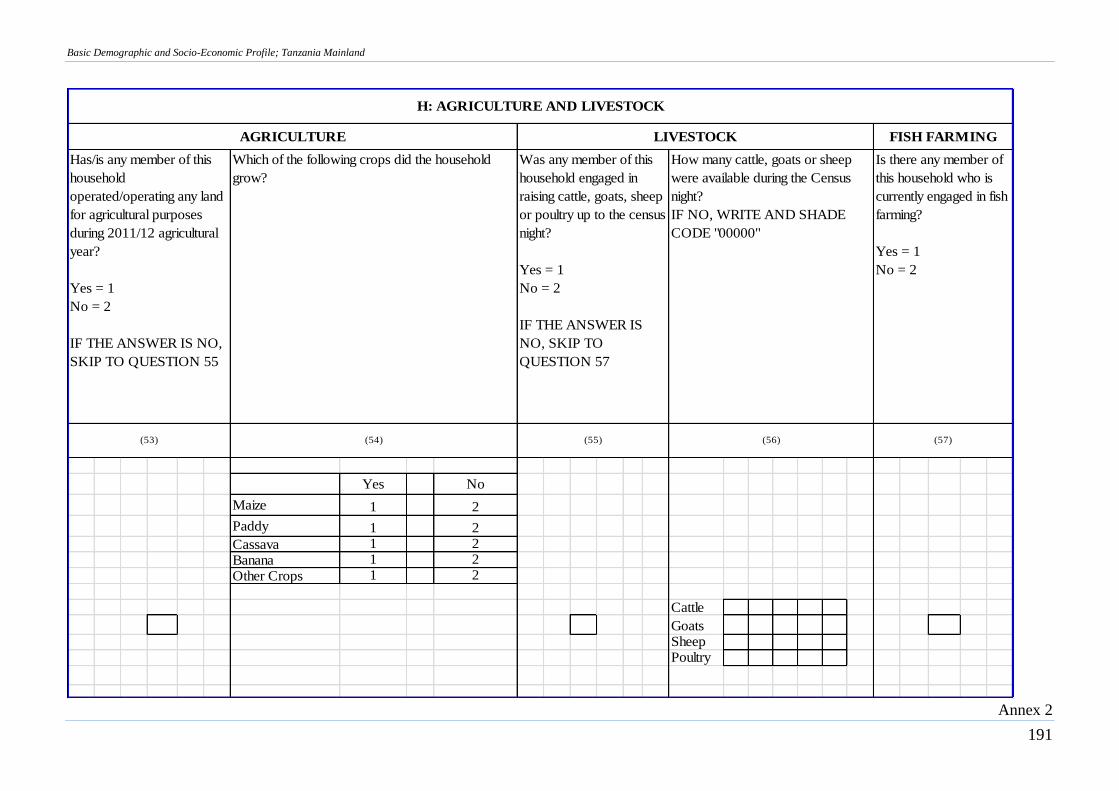
Basic Demographic and Socio-Economic Profile; Tanzania Mainland
Annex 2
191
Yes No
Maize 1 2
Paddy 1 2
Cassava 1 2
Banana 1 2
Other Crops 1 2
Cattle
GoatsSheepPoultry
LIVESTOCKAGRICULTURE
(54) (55) (56)
How many cattle, goats or sheep
were available during the Census
night?
IF NO, WRITE AND SHADE
CODE "00000"
Is there any member of
this household who is
currently engaged in fish
farming?
Yes = 1
No = 2
(57)(53)
H: AGRICULTURE AND LIVESTOCK
FISH FARMING
Has/is any member of this
household
operated/operating any land
for agricultural purposes
during 2011/12 agricultural
year?
Yes = 1
No = 2
IF THE ANSWER IS NO,
SKIP TO QUESTION 55
Which of the following crops did the household
grow?
Was any member of this
household engaged in
raising cattle, goats, sheep
or poultry up to the census
night?
Yes = 1
No = 2
IF THE ANSWER IS
NO, SKIP TO
QUESTION 57
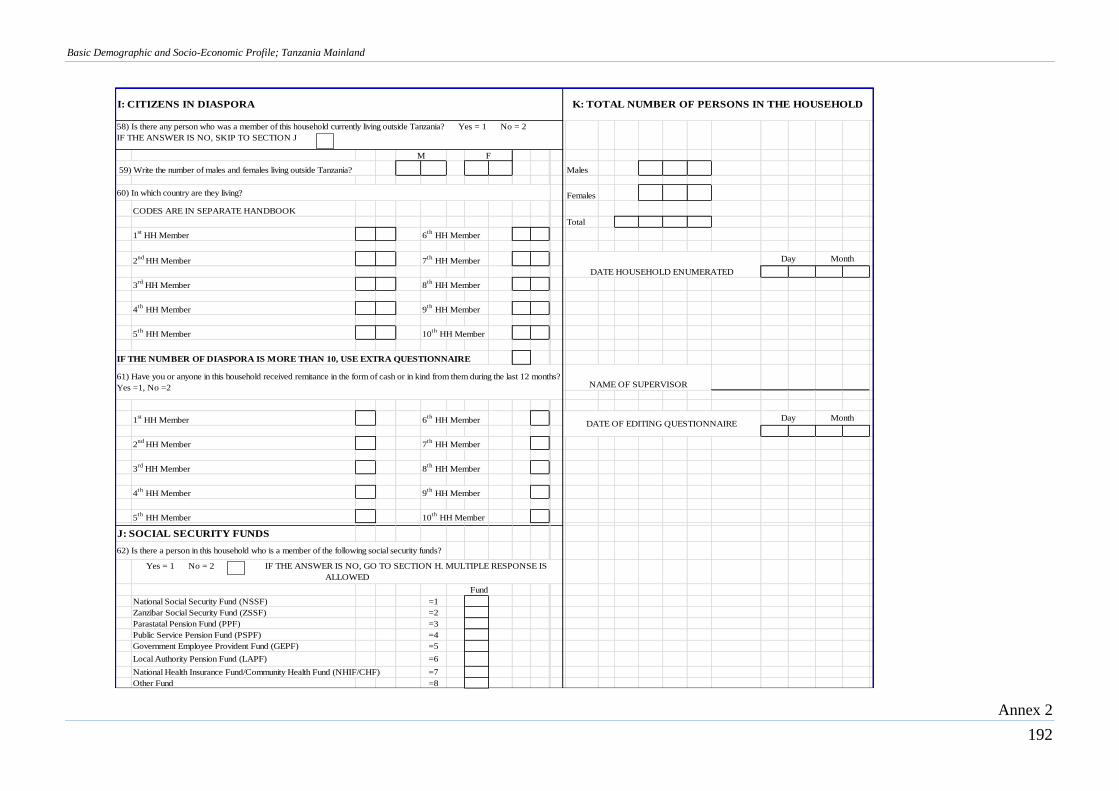
Basic Demographic and Socio-Economic Profile; Tanzania Mainland
Annex 2
192
59) Write the number of males and females living outside Tanzania? Males
Females
CODES ARE IN SEPARATE HANDBOOK
Total
1st
HH Member 6th
HH Member
2nd
HH Member 7th
HH Member
3rd
HH Member 8th
HH Member
4th
HH Member 9th
HH Member
5th
HH Member 10th
HH Member
IF THE NUMBER OF DIASPORA IS MORE THAN 10, USE EXTRA QUESTIONNAIRE
1st
HH Member 6th
HH Member
2nd
HH Member 7th
HH Member
3rd
HH Member 8th
HH Member
4th
HH Member 9th
HH Member
5th
HH Member 10th
HH Member
62) Is there a person in this household who is a member of the following social security funds?
National Social Security Fund (NSSF) =1
Zanzibar Social Security Fund (ZSSF) =2
Parastatal Pension Fund (PPF) =3
Public Service Pension Fund (PSPF) =4
Government Employee Provident Fund (GEPF) =5
Local Authority Pension Fund (LAPF) =6
National Health Insurance Fund/Community Health Fund (NHIF/CHF) =7
Other Fund =8
J: SOCIAL SECURITY FUNDS
60) In which country are they living?
Month
61) Have you or anyone in this household received remitance in the form of cash or in kind from them during the last 12 months?
Yes =1, No =2
DATE OF EDITING QUESTIONNAIREDay Month
Fund
NAME OF SUPERVISOR
Yes = 1 No = 2 IF THE ANSWER IS NO, GO TO SECTION H. MULTIPLE RESPONSE IS
ALLOWED
DATE HOUSEHOLD ENUMERATED
Day
I: CITIZENS IN DIASPORA K: TOTAL NUMBER OF PERSONS IN THE HOUSEHOLD
58) Is there any person who was a member of this household currently living outside Tanzania? Yes = 1 No = 2
IF THE ANSWER IS NO, SKIP TO SECTION J
M F