Basic Analytics Module for Sponsors
22
Action plan and SOP for Special Cause Variation Determine new Goals (UCL, LCL) 11/15 10/30 10/15 10/1 9/15 9/1 8/15 8/1 7/1 6/1 5/1 15 10 5 0 -5 O bservation D efect V olum e for 1160 Repaym ents _ X= 0.11 UCL= 0.63 LCL= -0.41 Before Im provem ents After Im provem ents 1 2 1 2 1 1 1 1 1 1 1 1 1 1 1 1 1 Reduction of 1160Repaym ent Defects(BeforeIm provem ent (9/1) and AfterIm provem ent)
Transcript of Basic Analytics Module for Sponsors

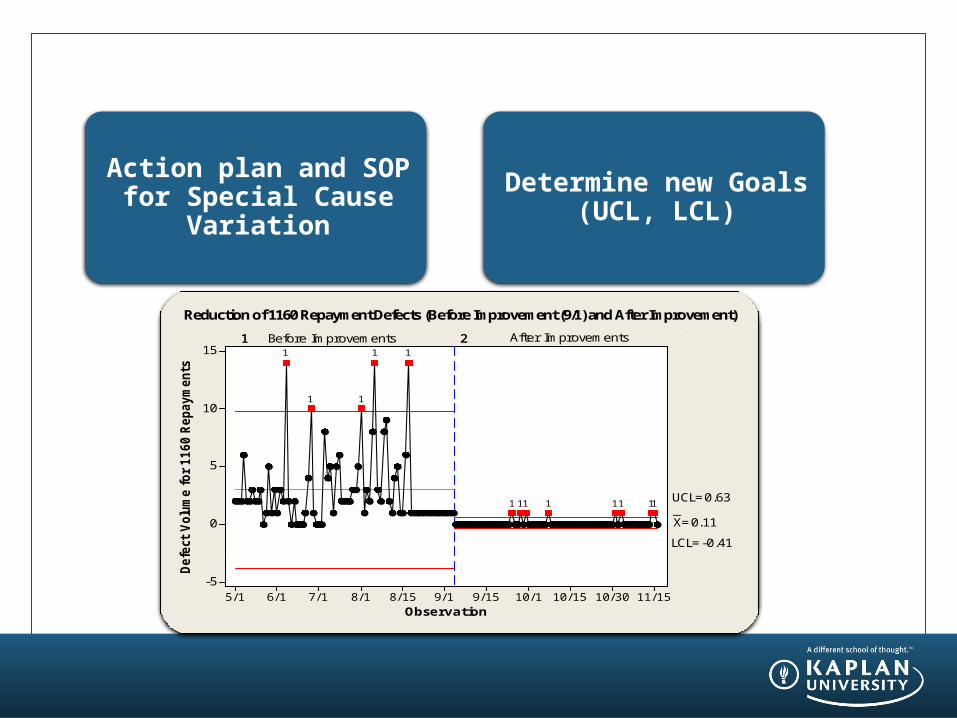
Action plan and SOP for Special Cause Variation
Determine new Goals (UCL, LCL)
11/1510/3010/1510/19/159/18/158/17/16/15/1
15
10
5
0
-5
Observation
Defe
ct V
olu
me for 1160 R
epaym
ents
_X=0.11
UCL=0.63
LCL=-0.41
Before Improvements After Improvements1 21 2
11111111
11
11
1
Reduction of 1160 Repayment Defects (Before Improvement (9/1) and After Improvement)

Module 8: Basic Analytics
Welcome to Champion Training
Facilitated by Kaplan’s Process Improvement Team

Agenda of Champion Training Modules # Module # Pages
1 Introduction 19
2 Project Selection and Engaging Process Improvement 22
3 Champion Role through Project Lifecycle 26
4 Calculating Financial Benefit/ the Cost of Poor Quality 13
5 Define Overview & Tools 26
6 Measure Overview & Tools 27
7 Analyze Overview & Tools 18
8 Basic Analytics 21
9 Improve Overview & Tools 33
10 Control Overview & Tools 28
11 How to Effectuate Change Using Change Management 31
12 Kaplan’s Work Out 15

Purpose of This Training
Provide Kaplan champions with the knowledge and skills to be effective leaders and coaches to their people engaged in Process Improvement/Six Sigma projects
“Everything should be made as simple as possible, but not too simple.”
Albert Einstein

Types of Statistics
Descriptive Statistics are used to describe the basic features of the data in a study. They provide simple summaries about the sample and the measures. Together with simple graphics analysis, they form the basis of virtually every quantitative analysis of data. With descriptive statistics you are simply describing what is, what the data shows.
Inferential Statistics investigate questions, models and hypotheses. In many cases, the conclusions from inferential statistics extend beyond the immediate data alone. For instance, we use inferential statistics to try to infer from the sample data what the population thinks. Or, we use inferential statistics to make judgments of the probability that an observed difference between groups is a dependable one or one that might have happened by chance in this study. Thus, we use inferential statistics to make inferences from our data to more general conditions; we use descriptive statistics simply to describe what's going on in our data.
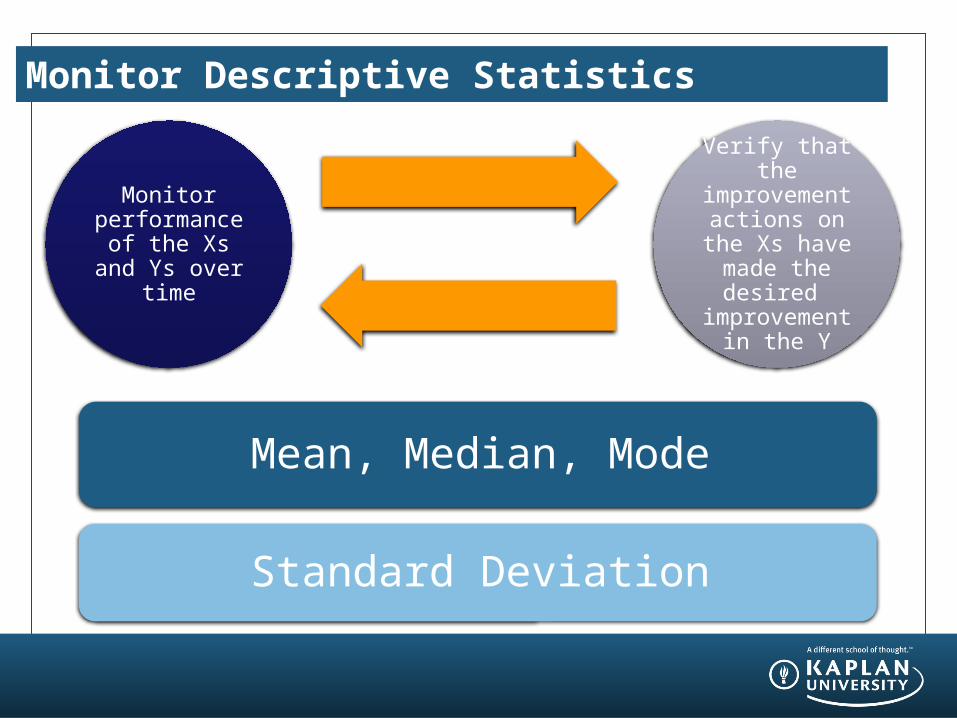
Monitor Descriptive Statistics
Monitor performance of the Xs and Ys
over time
Verify that the improvement actions on the Xs have made
the desired improvement in
the Y
Mean, Median, Mode
Standard Deviation

Numeric Display Terms
• The number of data points with non-missing values in the data set.N
• The AverageMean (Arithmetic Mean)
• The middle data point in the data set. Median (50th Percentile)
• The Value that occurs the most frequently in a data set.Mode
• The average distance from the mean.StDev (Standard Deviation)
• The highest value form the lowest 25% of the ranked data.Q1 (First Quartile or 25th Percentile)
• The lowest value from the highest 25% of the ranked data.Q3 (Third Quartile or 75th Percentile)
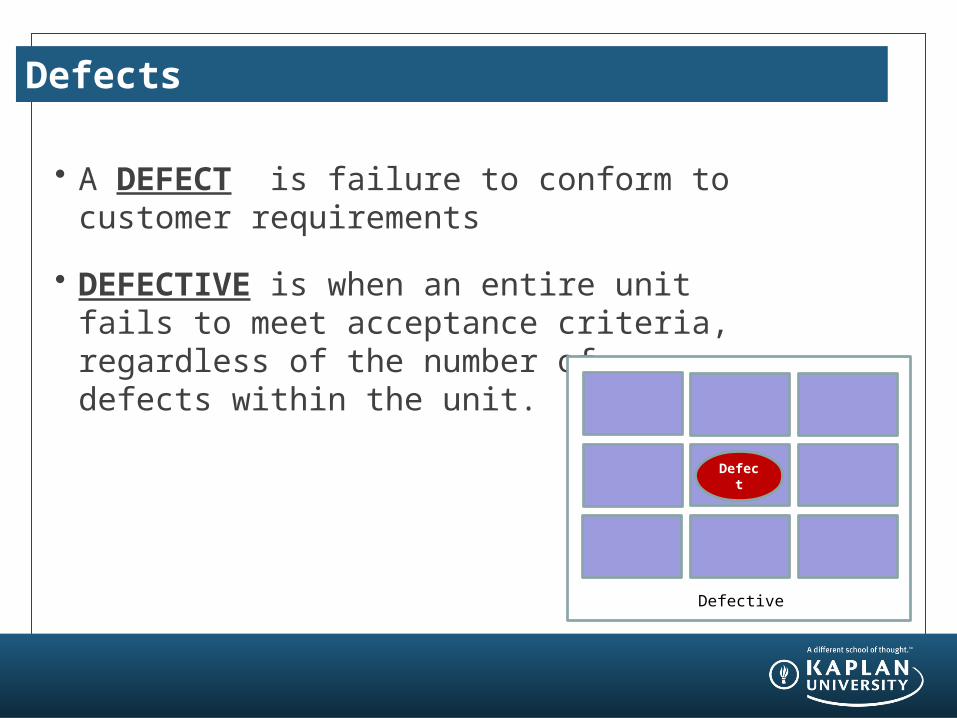
Defects
• A DEFECT is failure to conform to customer requirements
• DEFECTIVE is when an entire unit fails to meet acceptance criteria, regardless of the number of defects within the unit.
Defective
Defect
Defective
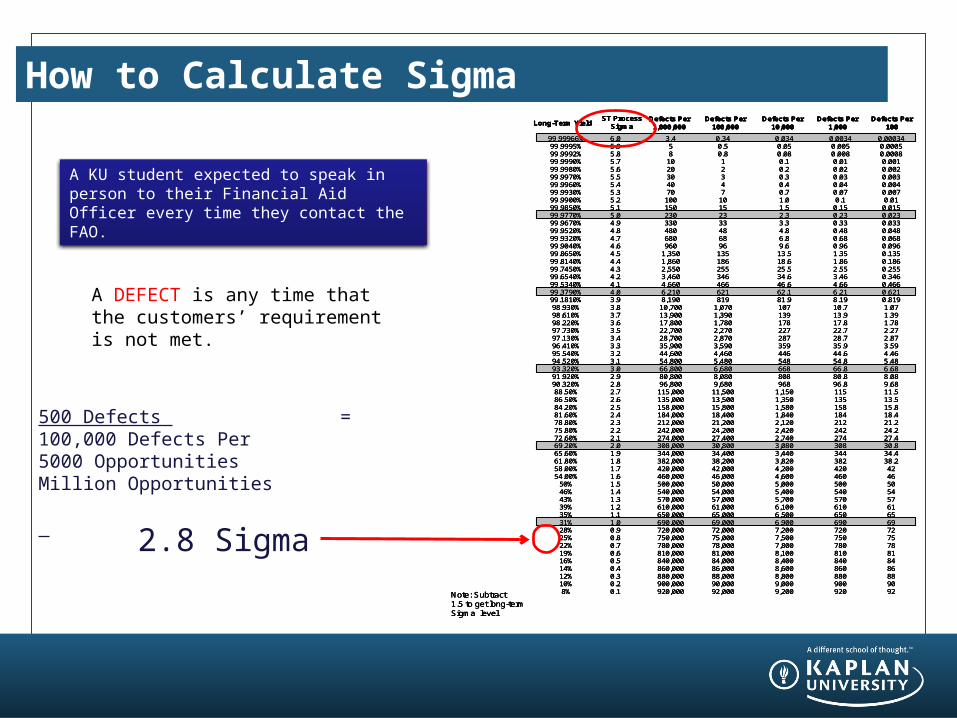
How to Calculate Sigma
3.458
1020304070100150230330480680960
1,3501,8602,5503,4604,6606,2108,19010,70013,90017,80022,70028,70035,90044,60054,80066,80080,80096,800
115,000135,000158,000184,000212,000242,000274,000308,000344,000382,000420,000460,000500,000540,000570,000610,000650,000690,000720,000750,000780,000810,000840,000860,000880,000900,000920,000
0.340.50.812347
10152333486896135186255346466621819
1,0701,3901,7802,2702,8703,5904,4605,4806,6808,0809,68011,50013,50015,80018,40021,20024,20027,40030,80034,40038,20042,00046,00050,00054,00057,00061,00065,00069,00072,00075,00078,00081,00084,00086,00088,00090,00092,000
0.0340.050.080.10.20.30.40.71.01.52.33.34.86.89.613.518.625.534.646.662.181.9107139178227287359446548668808968
1,1501,3501,5801,8402,1202,4202,7403,0803,4403,8204,2004,6005,0005,4005,7006,1006,5006,9007,2007,5007,8008,1008,4008,6008,8009,0009,200
0.00340.0050.0080.010.020.030.040.070.1
0.150.230.330.480.680.961.351.862.553.464.666.218.1910.713.917.822.728.735.944.654.866.880.896.8115135158184212242274308344382420460500540570610650690720750780810840860880900920
0.000340.00050.00080.0010.0020.0030.0040.0070.010.0150.0230.0330.0480.0680.0960.1350.1860.2550.3460.4660.6210.8191.071.391.782.272.873.594.465.486.688.089.6811.513.515.818.421.224.227.430.834.438.24246505457616569727578818486889092
99.99966%99.9995%99.9992%99.9990%99.9980%99.9970%99.9960%99.9930%99.9900%99.9850%99.9770%99.9670%99.9520%99.9320%99.9040%99.8650%99.8140%99.7450%99.6540%99.5340%99.3790%99.1810%98.930%98.610%98.220%97.730%97.130%96.410%95.540%94.520%93.320%91.920%90.320%88.50%86.50%84.20%81.60%78.80%75.80%72.60%69.20%65.60%61.80%58.00%54.00%
50%46%43%39%35%31%28%25%22%19%16%14%12%10%8%
6.05.95.85.75.65.55.45.35.25.15.04.94.84.74.64.54.44.34.24.14.03.93.83.73.63.53.43.33.23.13.02.92.82.72.62.52.42.32.22.12.01.91.81.71.61.51.41.31.21.11.00.90.80.70.60.50.40.30.20.1
Long-Term YieldST Process
SigmaDefects Per 1,000,000
Defects Per 100,000
Defects Per 10,000
Defects Per 1,000
Defects Per 100
Note: Subtract1.5 to get long-termSigma level
3.458
1020304070100150230330480680960
1,3501,8602,5503,4604,6606,2108,19010,70013,90017,80022,70028,70035,90044,60054,80066,80080,80096,800
115,000135,000158,000184,000212,000242,000274,000308,000344,000382,000420,000460,000500,000540,000570,000610,000650,000690,000720,000750,000780,000810,000840,000860,000880,000900,000920,000
0.340.50.812347
10152333486896135186255346466621819
1,0701,3901,7802,2702,8703,5904,4605,4806,6808,0809,68011,50013,50015,80018,40021,20024,20027,40030,80034,40038,20042,00046,00050,00054,00057,00061,00065,00069,00072,00075,00078,00081,00084,00086,00088,00090,00092,000
0.0340.050.080.10.20.30.40.71.01.52.33.34.86.89.613.518.625.534.646.662.181.9107139178227287359446548668808968
1,1501,3501,5801,8402,1202,4202,7403,0803,4403,8204,2004,6005,0005,4005,7006,1006,5006,9007,2007,5007,8008,1008,4008,6008,8009,0009,200
0.00340.0050.0080.010.020.030.040.070.1
0.150.230.330.480.680.961.351.862.553.464.666.218.1910.713.917.822.728.735.944.654.866.880.896.8115135158184212242274308344382420460500540570610650690720750780810840860880900920
0.000340.00050.00080.0010.0020.0030.0040.0070.010.0150.0230.0330.0480.0680.0960.1350.1860.2550.3460.4660.6210.8191.071.391.782.272.873.594.465.486.688.089.6811.513.515.818.421.224.227.430.834.438.24246505457616569727578818486889092
99.99966%99.9995%99.9992%99.9990%99.9980%99.9970%99.9960%99.9930%99.9900%99.9850%99.9770%99.9670%99.9520%99.9320%99.9040%99.8650%99.8140%99.7450%99.6540%99.5340%99.3790%99.1810%98.930%98.610%98.220%97.730%97.130%96.410%95.540%94.520%93.320%91.920%90.320%88.50%86.50%84.20%81.60%78.80%75.80%72.60%69.20%65.60%61.80%58.00%54.00%
50%46%43%39%35%31%28%25%22%19%16%14%12%10%8%
6.05.95.85.75.65.55.45.35.25.15.04.94.84.74.64.54.44.34.24.14.03.93.83.73.63.53.43.33.23.13.02.92.82.72.62.52.42.32.22.12.01.91.81.71.61.51.41.31.21.11.00.90.80.70.60.50.40.30.20.1
Long-Term YieldST Process
SigmaDefects Per 1,000,000
Defects Per 100,000
Defects Per 10,000
Defects Per 1,000
Defects Per 100
Long-Term YieldST Process
SigmaDefects Per 1,000,000
Defects Per 100,000
Defects Per 10,000
Defects Per 1,000
Defects Per 100
Note: Subtract1.5 to get long-termSigma level
A KU student expected to speak in person to their Financial Aid Officer every time they contact the FAO.
500 Defects = 100,000 Defects Per 5000 Opportunities Million Opportunities 2.8 Sigma
A DEFECT is any time that the customers’ requirement is not met.
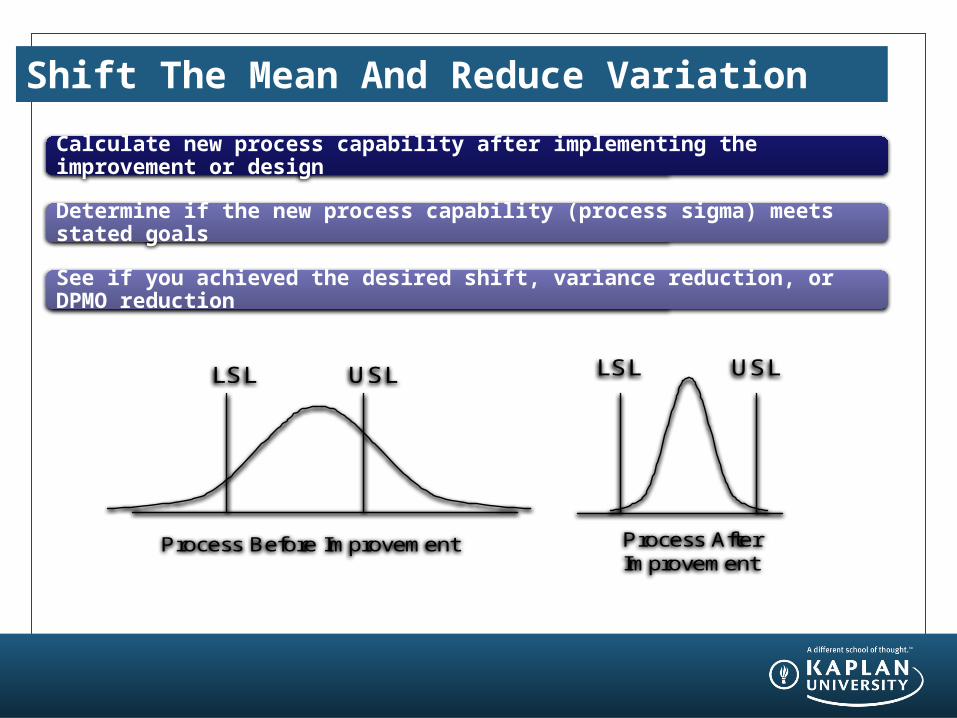
Shift The Mean And Reduce Variation
Calculate new process capability after implementing the improvement or design
Determine if the new process capability (process sigma) meets stated goals
See if you achieved the desired shift, variance reduction, or DPMO reduction
Process Before Improvement
LSL USL
Process AfterImprovement
LSL USL
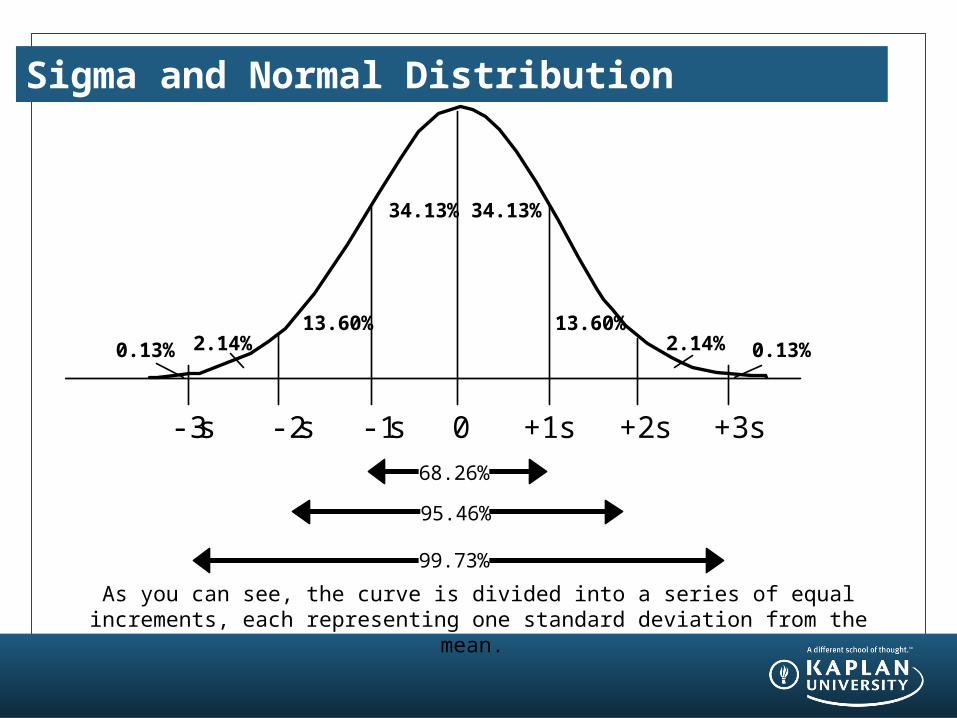
Sigma and Normal Distribution
-3s 0 +3s+2s+1s-2s -1s
3 4 .1 3 %3 4 .1 3 %
1 3 .6 0 % 1 3 .6 0 %2 .1 4 % 2 .1 4 %0 .1 3 % 0 .1 3 %
6 8 .2 6 %
9 5 .4 6 %
9 9 .7 3 %
As you can see, the curve is divided into a series of equal increments, each representing one standard deviation from the mean.

Histogram
100806040200-20
25
20
15
10
5
0
DAYS
Frequency
Mean 29.41StDev 24.45N 68
Days it Takes for FAO to Return callsSpec Limit is 5 days maximum
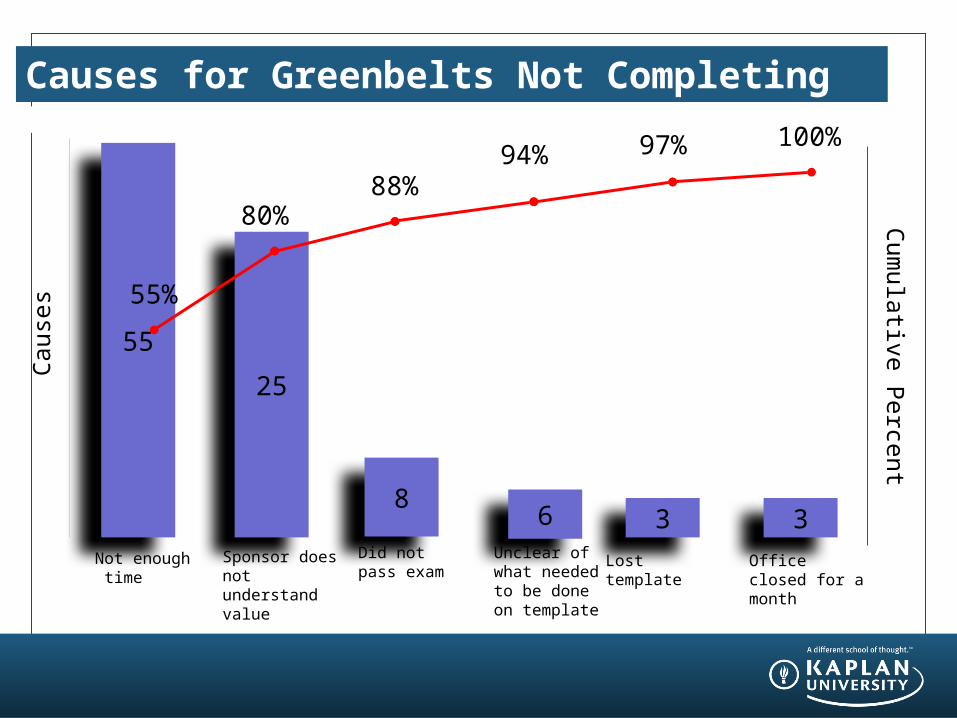
Causes for Greenbelts Not Completing Project
55
25
86 3 3
Not enough time
Sponsor does not understand value
Did not pass exam
Unclear of what needed to be done on template
Lost template Office closed for a month
55%
80%88%
94%100%97%
Cau
ses
Cum
ulative Percent

Central Limit Theorem
http://www.intuitor.com/statistics/CentralLim.html
If a random sample is drawn from any population, the sampling distribution of the sample mean is approximately normal for a sufficiently large sample size. The larger the sample size, the more closely the sampling distribution of the sample mean will resemble a normal distribution
1 3 15 30
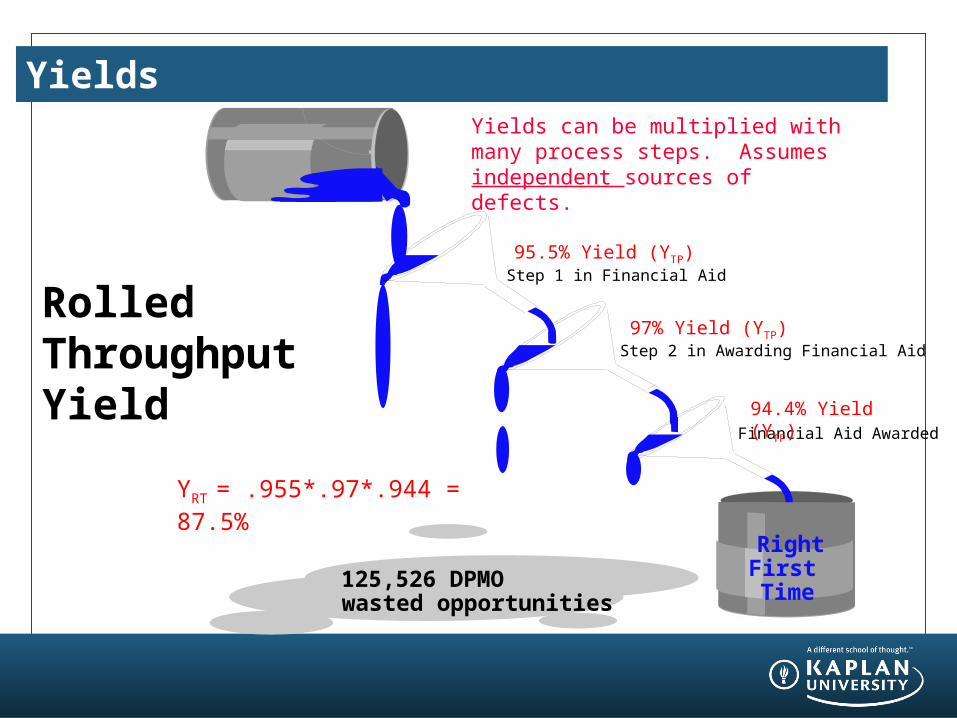
Yields
RolledThroughputYield
Receive request for Financial Aid
45,000 DPMO wastedStep 1 in Financial Aid
28,650 DPMO wasted
Step 2 in Awarding Financial Aid
51,876 DPMO wasted
Financial Aid Awarded
RightFirst Time
125,526 DPMO wasted opportunities
95.5% Yield (YTP)
97% Yield (YTP)
94.4% Yield (YTP)
Yields can be multiplied with many process steps. Assumes independent sources of defects.
YRT = .955*.97*.944 = 87.5%

Correlations are not Necessarily Causal
• City of Oldenburg, Germany• 1930- 1936 • X-axis: stork population • Y-axis: human populationWhat your mother told you about
babies when you were three is still not right, despite the strong correlation “evidence”.
Causal means that one variable results in the other thing occurring. In general, it is extremely difficult to establish causality between two correlated events or observances. There are many statistical tools to establish a statistical significant correlation.
Source: Box, Hunter, hunter Statistics For Experiments 1978

Regression
Regression can be used for prediction, inference, hypothesis testing, and modeling of causal relationships
The procedure calculates estimates of the relationship between the independent variables (advertising, price, etc.) and the dependent variable (sales).
Simple Linear Regression Analysis: Y = b0 + b1X
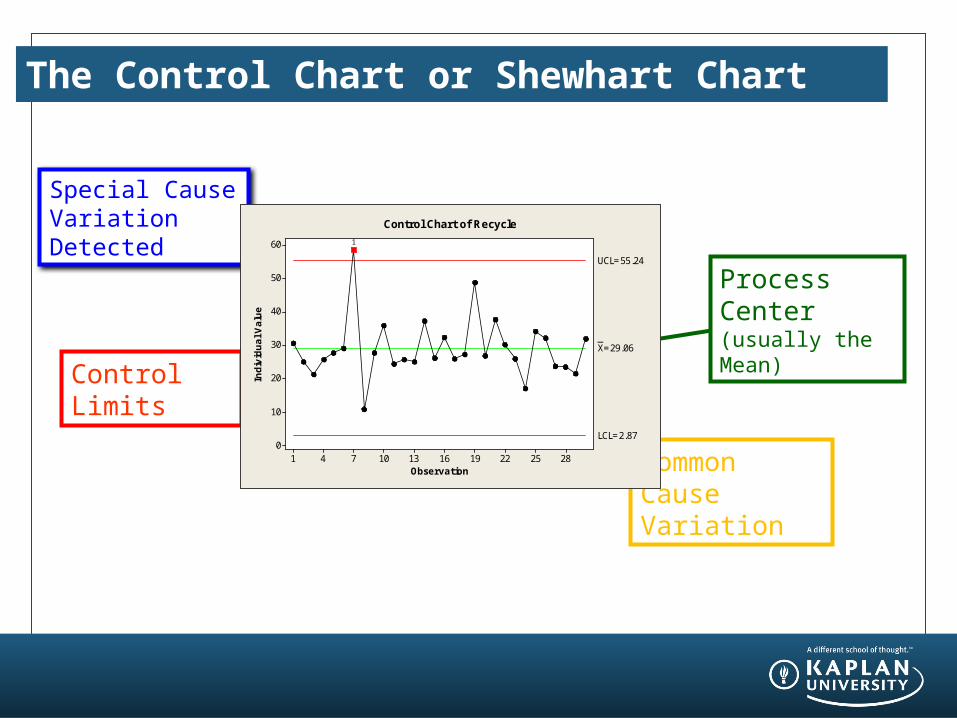
The Control Chart or Shewhart Chart
Observation
Indiv
idual V
alu
e
28252219161310741
60
50
40
30
20
10
0
_X=29.06
UCL=55.24
LCL=2.87
1
Control Chart of Recycle
Process Center(usually the Mean)
Special CauseVariation Detected
Control Limits
Common Cause Variation
Common Distributions
3210-1-2-3
0.8
0.7
0.6
0.5
0.4
0.3
0.2
0.1
0.0
x
f(x)
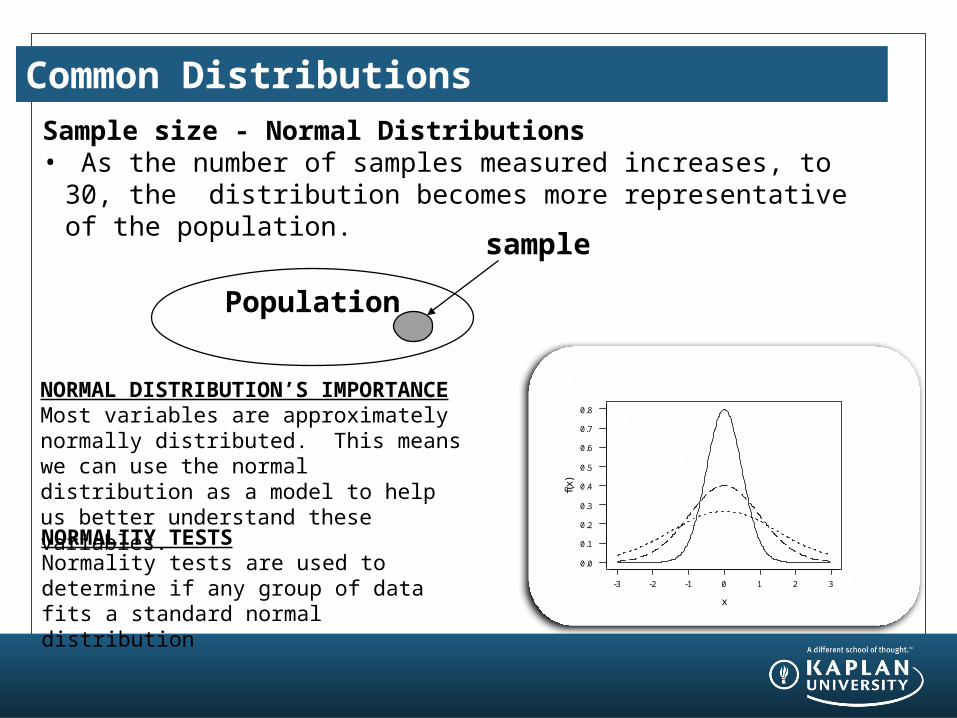
Sample size - Normal Distributions• As the number of samples measured increases, to 30, the
distribution becomes more representative of the population.
Population
sample
NORMAL DISTRIBUTION’S IMPORTANCEMost variables are approximately normally distributed. This means we can use the normal distribution as a model to help us better understand these variables.
NORMALITY TESTSNormality tests are used to determine if any group of data fits a standard normal distribution

Confirm New Capability
Calculate new process capability
Determine if the new process sigma meets stated goals
Process Before Improvement
LSL USL
Process AfterImprovement
LSL USL
Action plan and SOP for Special Cause Variation
Determine new Goals (UCL, LCL)
11/1510/3010/1510/19/159/18/158/17/16/15/1
15
10
5
0
-5
Observation
Defe
ct V
olu
me for 1160 R
epaym
ents
_X=0.11
UCL=0.63
LCL=-0.41
Before Improvements After Improvements1 21 2
11111111
11
11
1
Reduction of 1160 Repayment Defects (Before Improvement (9/1) and After Improvement)

Module Wrap Up
•Questions/Comments
•Discussions of Process Improvement Projects in Your Area
•Discuss Next Module
•Establish Time/Date of Next Meeting