BASF Report 2010 BASF...BASF Report 2010 BASF Group 2010* Economic data (million €) 2010 2009...
232
Economic, environmental and social performance BASF Report 2010
Transcript of BASF Report 2010 BASF...BASF Report 2010 BASF Group 2010* Economic data (million €) 2010 2009...
Economic, environmental andsocial performance
BASF Report 2010 BASF Group 2010*
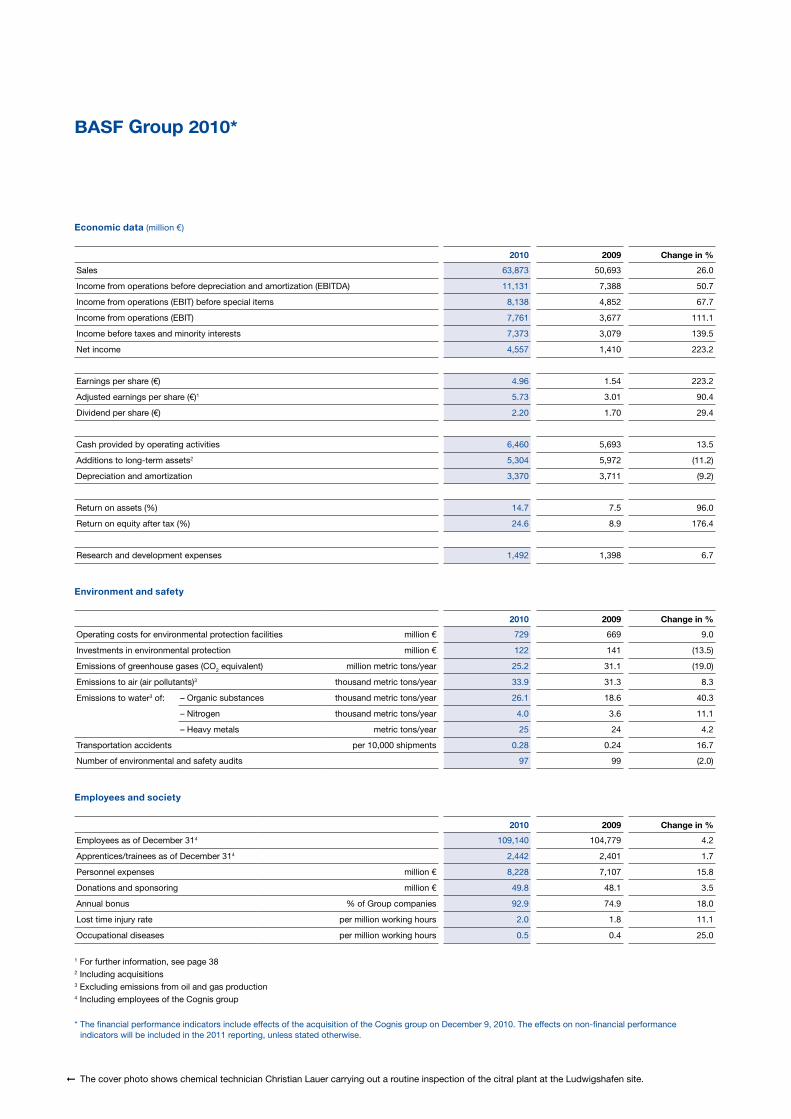
Economic data (million €)
2010 2009 Change in %
Sales 63,873 50,693 26.0
Income from operations before depreciation and amortization (EBITDA) 11,131 7,388 50.7
Income from operations (EBIT) before special items 8,138 4,852 67.7
Income from operations (EBIT) 7,761 3,677 111.1
Income before taxes and minority interests 7,373 3,079 139.5
Net income 4,557 1,410 223.2
Earnings per share (€) 4.96 1.54 223.2
Adjusted earnings per share (€)1 5.73 3.01 90.4
Dividend per share (€) 2.20 1.70 29.4
Cash provided by operating activities 6,460 5,693 13.5
Additions to longterm assets2 5,304 5,972 (11.2)
Depreciation and amortization 3,370 3,711 (9.2)
Return on assets (%) 14.7 7.5 96.0
Return on equity after tax (%) 24.6 8.9 176.4
Research and development expenses 1,492 1,398 6.7
Environment and safety
2010 2009 Change in %
Operating costs for environmental protection facilities million € 729 669 9.0
Investments in environmental protection million € 122 141 (13.5)
Emissions of greenhouse gases (CO2 equivalent) million metric tons/year 25.2 31.1 (19.0)
Emissions to air (air pollutants)3 thousand metric tons/year 33.9 31.3 8.3
Emissions to water3 of: – Organic substances thousand metric tons/year 26.1 18.6 40.3
– Nitrogen thousand metric tons/year 4.0 3.6 11.1
– Heavy metals metric tons/year 25 24 4.2
Transportation accidents per 10,000 shipments 0.28 0.24 16.7
Number of environmental and safety audits 97 99 (2.0)
Employees and society
2010 2009 Change in %
Employees as of December 314 109,140 104,779 4.2
Apprentices/trainees as of December 314 2,442 2,401 1.7
Personnel expenses million € 8,228 7,107 15.8
Donations and sponsoring million € 49.8 48.1 3.5
Annual bonus % of Group companies 92.9 74.9 18.0
Lost time injury rate per million working hours 2.0 1.8 11.1
Occupational diseases per million working hours 0.5 0.4 25.0
1 For further information, see page 382 Including acquisitions3 Excluding emissions from oil and gas production4 Including employees of the Cognis group
* The fi nancial performance indicators include effects of the acquisition of the Cognis group on December 9, 2010. The effects on nonfi nancial performance indicators will be included in the 2011 reporting, unless stated otherwise.
The cover photo shows chemical technician Christian Lauer carrying out a routine inspection of the citral plant at the Ludwigshafen site.
Annual Meeting 2011 / Interim report fi rst quarter 2011
May 6, 2011Interim report fi rst half 2011
July 28, 2011Interim report third quarter 2011
Oct. 27, 2011Full year results 2011
Feb. 24, 2012Annual Meeting 2012 / Interim report fi rst quarter 2012
April 27, 2012
BASF supports the chemical industry’s global initiative Responsible Care®.
BASF is a sponsor of the International Year of Chemistry 2011. For more, see basf.com/iyc
You can fi nd this and other publications fromBASF on the internet at www.basf.com
You can also order the reports:
– by telephone: +49 621 6099895– on the internet: basf.com/mediaorders
General inquiriesPhone: +49 621 600
Corporate Media RelationsJennifer MooreBraun, Phone: +49 621 6092693
Sustainability Center Dr. Eckhard Koch, Phone: +49 621 6078638
Investor Relations Magdalena Moll, Phone: +49 621 6048230
Internetwww.basf.com
ContactsFurther information
ZO
AC
110
2 E
IS
SN
186
693
87
Re
po
rt 2
01
0
Economic, environmental andsocial performance
BASF Report 2010 BASF Group 2010*
Economic data (million €)
2010 2009 Change in %
Sales 63,873 50,693 26.0
Income from operations before depreciation and amortization (EBITDA) 11,131 7,388 50.7
Income from operations (EBIT) before special items 8,138 4,852 67.7
Income from operations (EBIT) 7,761 3,677 111.1
Income before taxes and minority interests 7,373 3,079 139.5
Net income 4,557 1,410 223.2
Earnings per share (€) 4.96 1.54 223.2
Adjusted earnings per share (€)1 5.73 3.01 90.4
Dividend per share (€) 2.20 1.70 29.4
Cash provided by operating activities 6,460 5,693 13.5
Additions to longterm assets2 5,304 5,972 (11.2)
Depreciation and amortization 3,370 3,711 (9.2)
Return on assets (%) 14.7 7.5 96.0
Return on equity after tax (%) 24.6 8.9 176.4
Research and development expenses 1,492 1,398 6.7
Environment and safety
2010 2009 Change in %
Operating costs for environmental protection facilities million € 729 669 9.0
Investments in environmental protection million € 122 141 (13.5)
Emissions of greenhouse gases (CO2 equivalent) million metric tons/year 25.2 31.1 (19.0)
Emissions to air (air pollutants)3 thousand metric tons/year 33.9 31.3 8.3
Emissions to water3 of: – Organic substances thousand metric tons/year 26.1 18.6 40.3
– Nitrogen thousand metric tons/year 4.0 3.6 11.1
– Heavy metals metric tons/year 25 24 4.2
Transportation accidents per 10,000 shipments 0.28 0.24 16.7
Number of environmental and safety audits 97 99 (2.0)
Employees and society
2010 2009 Change in %
Employees as of December 314 109,140 104,779 4.2
Apprentices/trainees as of December 314 2,442 2,401 1.7
Personnel expenses million € 8,228 7,107 15.8
Donations and sponsoring million € 49.8 48.1 3.5
Annual bonus % of Group companies 92.9 74.9 18.0
Lost time injury rate per million working hours 2.0 1.8 11.1
Occupational diseases per million working hours 0.5 0.4 25.0
1 For further information, see page 382 Including acquisitions3 Excluding emissions from oil and gas production4 Including employees of the Cognis group
* The fi nancial performance indicators include effects of the acquisition of the Cognis group on December 9, 2010. The effects on nonfi nancial performance indicators will be included in the 2011 reporting, unless stated otherwise.
The cover photo shows chemical technician Christian Lauer carrying out a routine inspection of the citral plant at the Ludwigshafen site.
Annual Meeting 2011 / Interim report fi rst quarter 2011
May 6, 2011Interim report fi rst half 2011
July 28, 2011Interim report third quarter 2011
Oct. 27, 2011Full year results 2011
Feb. 24, 2012Annual Meeting 2012 / Interim report fi rst quarter 2012
April 27, 2012
BASF supports the chemical industry’s global initiative Responsible Care®.
BASF is a sponsor of the International Year of Chemistry 2011. For more, see basf.com/iyc
You can fi nd this and other publications fromBASF on the internet at www.basf.com
You can also order the reports:
– by telephone: +49 621 6099895– on the internet: basf.com/mediaorders
General inquiriesPhone: +49 621 600
Corporate Media RelationsJennifer MooreBraun, Phone: +49 621 6092693
Sustainability Center Dr. Eckhard Koch, Phone: +49 621 6078638
Investor Relations Magdalena Moll, Phone: +49 621 6048230
Internetwww.basf.com
ContactsFurther information
ZO
AC
110
2 E
IS
SN
186
693
87
Re
po
rt 2
01
0
BASF’s segments
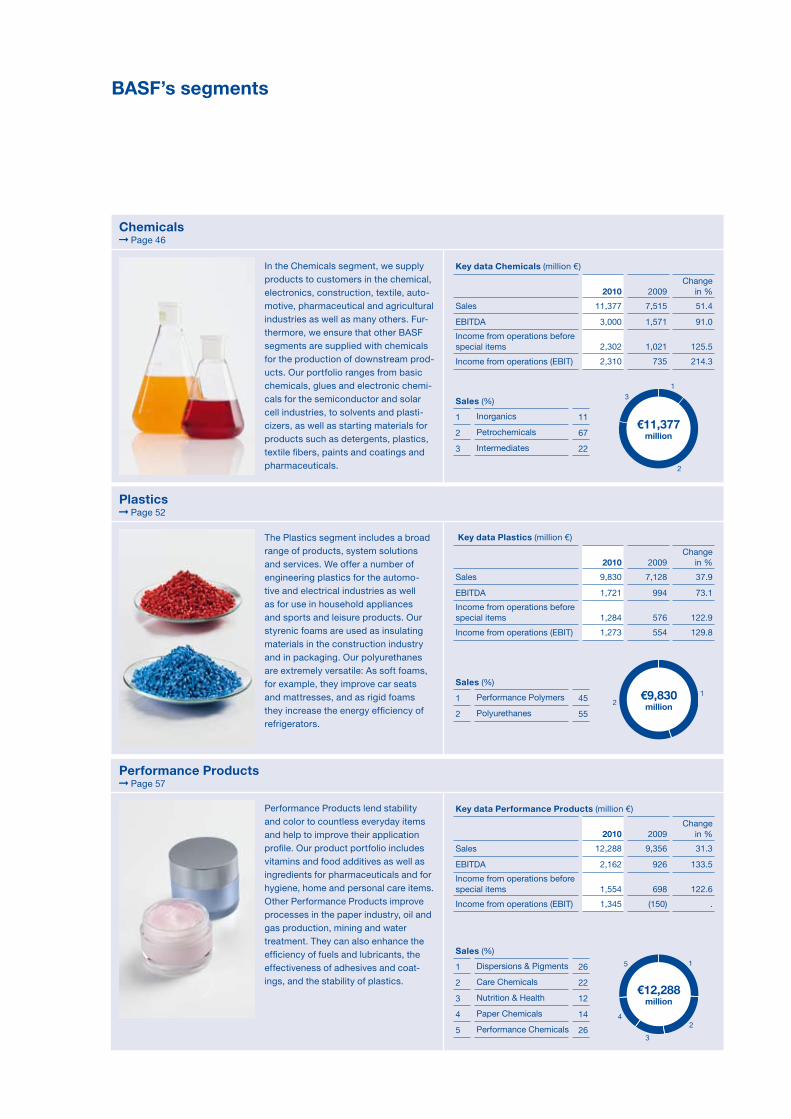
In the Chemicals segment, we supply products to customers in the chemical, electronics, construction, textile, automotive, pharmaceutical and agricultural industries as well as many others. Furthermore, we ensure that other BASF segments are supplied with chemicals for the production of downstream products. Our portfolio ranges from basic chemicals, glues and electronic chemicals for the semiconductor and solar cell industries, to solvents and plasticizers, as well as starting materials for products such as detergents, plastics, textile fi bers, paints and coatings and pharmaceuticals.
Key data Chemicals (million €)
2010 2009Change
in %
Sales 11,377 7,515 51.4
EBITDA 3,000 1,571 91.0
Income from operations before special items 2,302 1,021 125.5
Income from operations (EBIT) 2,310 735 214.3
Chemicals Page 46
The Plastics segment includes a broad range of products, system solutions and services. We offer a number of engineering plastics for the automotive and electrical industries as well as for use in household appliances and sports and leisure products. Our styrenic foams are used as insulating materials in the construction industry and in packaging. Our polyurethanes are extremely versatile: As soft foams, for example, they improve car seats and mattresses, and as rigid foams they increase the energy effi ciency of refrigerators.
Plastics Page 52
Performance Products lend stability and color to countless everyday items and help to improve their application profi le. Our product portfolio includes vitamins and food additives as well as ingredients for pharmaceuticals and for hygiene, home and personal care items. Other Performance Products improve processes in the paper industry, oil and gas production, mining and water treatment. They can also enhance the effi ciency of fuels and lubricants, the effectiveness of adhesives and coatings, and the stability of plastics.
Performance Products Page 57
Sales (%)
1 Inorganics 11
2 Petrochemicals 67
3 Intermediates 22
Sales (%)
1 Performance Polymers 45
2 Polyurethanes 55
Sales (%)
1 Dispersions & Pigments 26
2 Care Chemicals 22
3 Nutrition & Health 12
4 Paper Chemicals 14
5 Performance Chemicals 26
Key data Plastics (million €)
2010 2009Change
in %
Sales 9,830 7,128 37.9
EBITDA 1,721 994 73.1
Income from operations before special items 1,284 576 122.9
Income from operations (EBIT) 1,273 554 129.8
Key data Performance Products (million €)
2010 2009Change
in %
Sales 12,288 9,356 31.3
EBITDA 2,162 926 133.5
Income from operations before special items 1,554 698 122.6
Income from operations (EBIT) 1,345 (150) .
1
2
3
€11,377million
wird a
ktual
isier
t
12
€9,830million
1
2
3
4
5
€12,288million
O
verv
iew
of
BA
SF
’s s
egm
ents
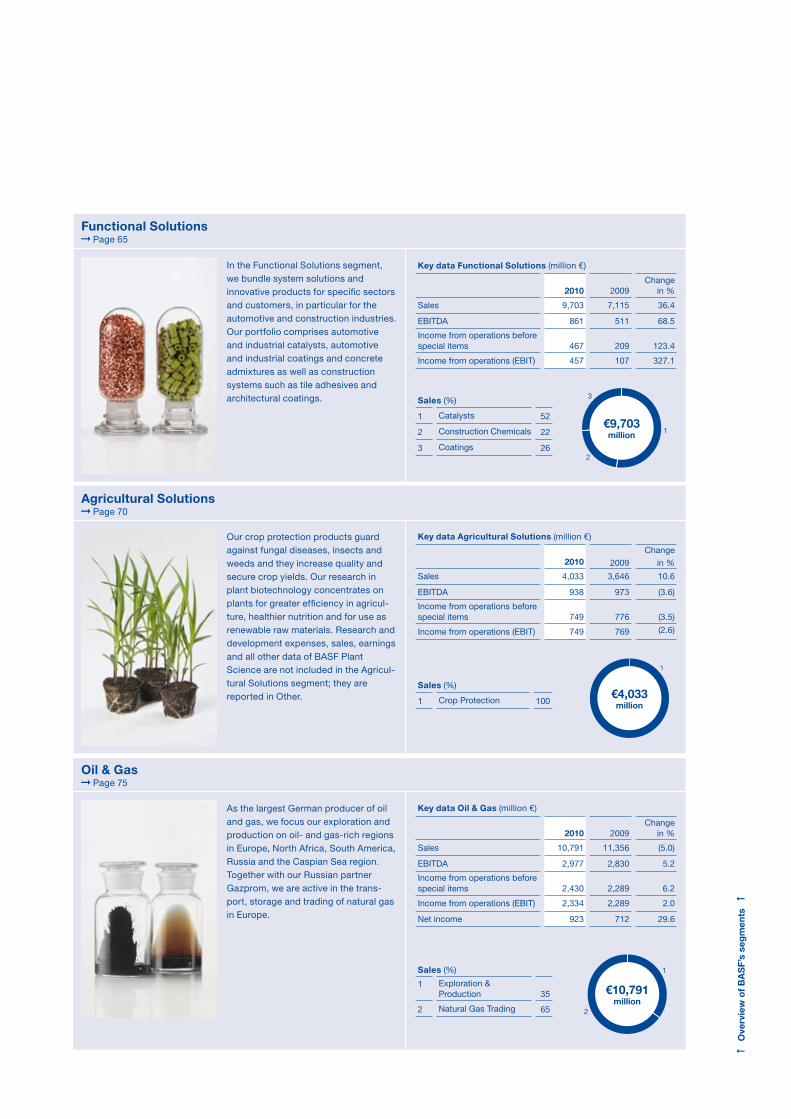
In the Functional Solutions segment, we bundle system solutions and innovative products for specifi c sectors and customers, in particular for the automotive and construction industries. Our portfolio comprises automotive and industrial catalysts, automotive and industrial coatings and concrete admixtures as well as construction systems such as tile adhesives and architectural coatings.
Key data Functional Solutions (million €)
2010 2009Change
in %
Sales 9,703 7,115 36.4
EBITDA 861 511 68.5
Income from operations before special items 467 209 123.4
Income from operations (EBIT) 457 107 327.1
Functional Solutions Page 65
Our crop protection products guard against fungal diseases, insects and weeds and they increase quality and secure crop yields. Our research in plant biotechnology concentrates on plants for greater effi ciency in agriculture, healthier nutrition and for use as renewable raw materials. Research and development expenses, sales, earnings and all other data of BASF Plant Science are not included in the Agricultural Solutions segment; they are reported in Other.
Agricultural Solutions Page 70
As the largest German producer of oil and gas, we focus our exploration and production on oil and gasrich regions in Europe, North Africa, South America, Russia and the Caspian Sea region. Together with our Russian partner Gazprom, we are active in the transport, storage and trading of natural gas in Europe.
Oil & Gas Page 75
Key data Agricultural Solutions (million €)
2010 2009
Change
in %
Sales 4,033 3,646 10.6
EBITDA 938 973 (3.6)
Income from operations before special items 749 776 (3.5)
Income from operations (EBIT) 749 769 (2.6)
Key data Oil & Gas (million €)
2010 2009Change
in %
Sales 10,791 11,356 (5.0)
EBITDA 2,977 2,830 5.2
Income from operations before special items 2,430 2,289 6.2
Income from operations (EBIT) 2,334 2,289 2.0
Net income 923 712 29.6
Sales (%)
1 Catalysts 52
2 Construction Chemicals 22
3 Coatings 26
Sales (%)
1 Crop Protection 100
Sales (%)
1 Exploration & Production 35
2 Natural Gas Trading 65
1
2
3
€9,703million
1
€4,033million
wird a
ktual
isier
t
1
2
€10,791million
Prizes and awards
This report contains forwardlooking statements. These statements are based on current estimates and projections of BASF management and currently available information. They are not guarantees of future performance, involve certain risks and uncertainties that are diffi cult to predict, and are based upon assumptions as to future events that may not be accurate. Many factors could cause the actual results, performance or achievements of BASF to be materially different from those that may be expressed or implied by such statements. Such factors include those discussed in the Risk Report from page 103 to 111. We do not assume any obligation to update the forwardlooking statements contained in this report.
Forward-looking statements
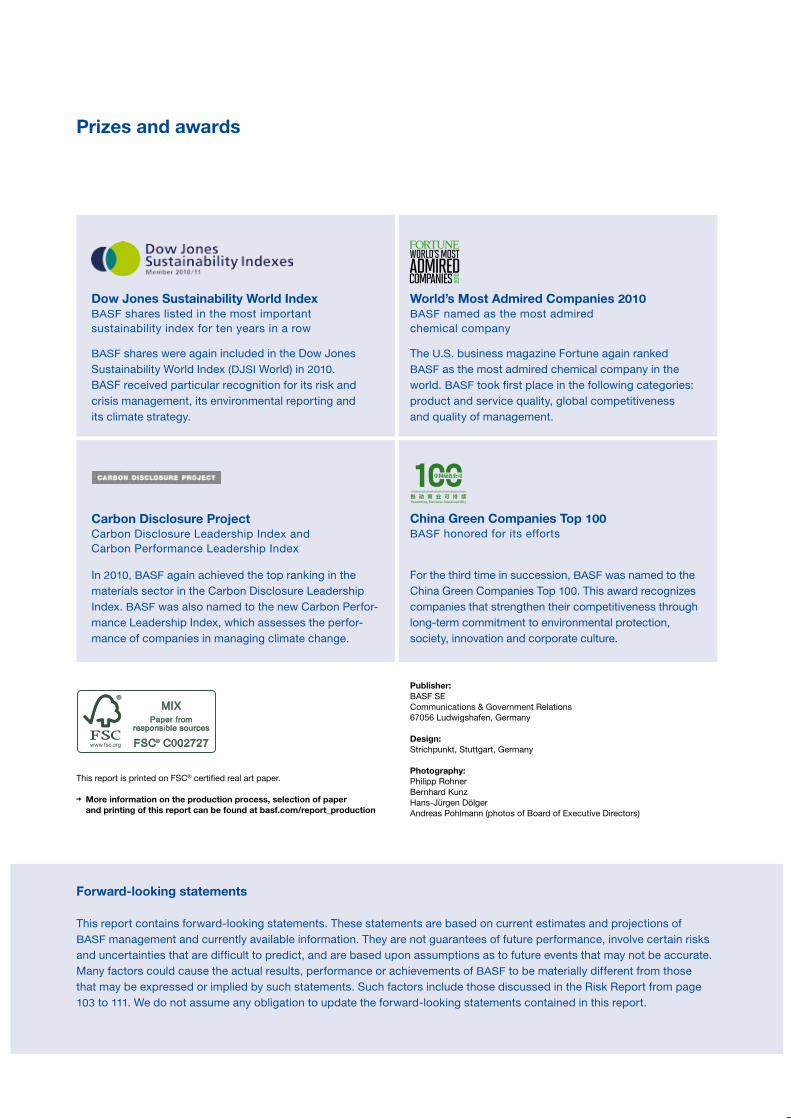
Dow Jones Sustainability World IndexBASF shares listed in the most important sustainability index for ten years in a row
World’s Most Admired Companies 2010BASF named as the most admired chemical company
BASF shares were again included in the Dow Jones Sustainability World Index (DJSI World) in 2010. BASF received particular recognition for its risk and crisis management, its environmental reporting and its climate strategy.
The U.S. business magazine Fortune again ranked BASF as the most admired chemical company in the world. BASF took fi rst place in the following categories: product and service quality, global competitiveness and quality of management.
Carbon Disclosure ProjectCarbon Disclosure Leadership Index and Carbon Performance Leadership Index
China Green Companies Top 100BASF honored for its efforts
In 2010, BASF again achieved the top ranking in the materials sector in the Carbon Disclosure Leadership Index. BASF was also named to the new Carbon Performance Leadership Index, which assesses the performance of companies in managing climate change.
For the third time in succession, BASF was named to the China Green Companies Top 100. This award recognizes companies that strengthen their competitiveness through longterm commitment to environmental protection, society, innovation and corporate culture.
This report is printed on FSC® certified real art paper.
More information on the production process, selection of paper and printing of this report can be found at basf.com/report_production
Publisher: BASF SECommunications & Government Relations 67056 Ludwigshafen, Germany
Design: Strichpunkt, Stuttgart, Germany
Photography: Philipp Rohner Bernhard KunzHansJürgen DölgerAndreas Pohlmann (photos of Board of Executive Directors)
O
verv
iew
of
BA
SF
’s s
egm
ents
In the Functional Solutions segment, we bundle system solutions and innovative products for specifi c sectors and customers, in particular for the automotive and construction industries. Our portfolio comprises automotive and industrial catalysts, automotive and industrial coatings and concrete admixtures as well as construction systems such as tile adhesives and architectural coatings.
Key data Functional Solutions (million €)
2010 2009Change
in %
Sales 9,703 7,115 36.4
EBITDA 861 511 68.5
Income from operations before special items 467 209 123.4
Income from operations (EBIT) 457 107 327.1
Functional Solutions Page 65
Our crop protection products guard against fungal diseases, insects and weeds and they increase quality and secure crop yields. Our research in plant biotechnology concentrates on plants for greater effi ciency in agriculture, healthier nutrition and for use as renewable raw materials. Research and development expenses, sales, earnings and all other data of BASF Plant Science are not included in the Agricultural Solutions segment; they are reported in Other.
Agricultural Solutions Page 70
As the largest German producer of oil and gas, we focus our exploration and production on oil and gasrich regions in Europe, North Africa, South America, Russia and the Caspian Sea region. Together with our Russian partner Gazprom, we are active in the transport, storage and trading of natural gas in Europe.
Oil & Gas Page 75
Key data Agricultural Solutions (million €)
2010 2009
Change
in %
Sales 4,033 3,646 10.6
EBITDA 938 973 (3.6)
Income from operations before special items 749 776 (3.5)
Income from operations (EBIT) 749 769 (2.6)
Key data Oil & Gas (million €)
2010 2009Change
in %
Sales 10,791 11,356 (5.0)
EBITDA 2,977 2,830 5.2
Income from operations before special items 2,430 2,289 6.2
Income from operations (EBIT) 2,334 2,289 2.0
Net income 923 712 29.6
Sales (%)
1 Catalysts 52
2 Construction Chemicals 22
3 Coatings 26
Sales (%)
1 Crop Protection 100
Sales (%)
1 Exploration & Production 35
2 Natural Gas Trading 65
1
2
3
€9,703million
1
€4,033million
wird a
ktual
isier
t
1
2
€10,791million
Prizes and awards
This report contains forwardlooking statements. These statements are based on current estimates and projections of BASF management and currently available information. They are not guarantees of future performance, involve certain risks and uncertainties that are diffi cult to predict, and are based upon assumptions as to future events that may not be accurate. Many factors could cause the actual results, performance or achievements of BASF to be materially different from those that may be expressed or implied by such statements. Such factors include those discussed in the Risk Report from page 103 to 111. We do not assume any obligation to update the forwardlooking statements contained in this report.
Forward-looking statements
Dow Jones Sustainability World IndexBASF shares listed in the most important sustainability index for ten years in a row
World’s Most Admired Companies 2010BASF named as the most admired chemical company
BASF shares were again included in the Dow Jones Sustainability World Index (DJSI World) in 2010. BASF received particular recognition for its risk and crisis management, its environmental reporting and its climate strategy.
The U.S. business magazine Fortune again ranked BASF as the most admired chemical company in the world. BASF took fi rst place in the following categories: product and service quality, global competitiveness and quality of management.
Carbon Disclosure ProjectCarbon Disclosure Leadership Index and Carbon Performance Leadership Index
China Green Companies Top 100BASF honored for its efforts
In 2010, BASF again achieved the top ranking in the materials sector in the Carbon Disclosure Leadership Index. BASF was also named to the new Carbon Performance Leadership Index, which assesses the performance of companies in managing climate change.
For the third time in succession, BASF was named to the China Green Companies Top 100. This award recognizes companies that strengthen their competitiveness through longterm commitment to environmental protection, society, innovation and corporate culture.
This report is printed on FSC® certified real art paper.
More information on the production process, selection of paper and printing of this report can be found at basf.com/report_production
Publisher: BASF SECommunications & Government Relations 67056 Ludwigshafen, Germany
Design: Strichpunkt, Stuttgart, Germany
Photography: Philipp Rohner Bernhard KunzHansJürgen DölgerAndreas Pohlmann (photos of Board of Executive Directors)
Economic, environmental andsocial performance
BASF Report 2010 BASF Group 2010*
Economic data (million €)
2010 2009 Change in %
Sales 63,873 50,693 26.0
Income from operations before depreciation and amortization (EBITDA) 11,131 7,388 50.7
Income from operations (EBIT) before special items 8,138 4,852 67.7
Income from operations (EBIT) 7,761 3,677 111.1
Income before taxes and minority interests 7,373 3,079 139.5
Net income 4,557 1,410 223.2
Earnings per share (€) 4.96 1.54 223.2
Adjusted earnings per share (€)1 5.73 3.01 90.4
Dividend per share (€) 2.20 1.70 29.4
Cash provided by operating activities 6,460 5,693 13.5
Additions to longterm assets2 5,304 5,972 (11.2)
Depreciation and amortization 3,370 3,711 (9.2)
Return on assets (%) 14.7 7.5 96.0
Return on equity after tax (%) 24.6 8.9 176.4
Research and development expenses 1,492 1,398 6.7
Environment and safety
2010 2009 Change in %
Operating costs for environmental protection facilities million € 729 669 9.0
Investments in environmental protection million € 122 141 (13.5)
Emissions of greenhouse gases (CO2 equivalent) million metric tons/year 25.2 31.1 (19.0)
Emissions to air (air pollutants)3 thousand metric tons/year 33.9 31.3 8.3
Emissions to water3 of: – Organic substances thousand metric tons/year 26.1 18.6 40.3
– Nitrogen thousand metric tons/year 4.0 3.6 11.1
– Heavy metals metric tons/year 25 24 4.2
Transportation accidents per 10,000 shipments 0.28 0.24 16.7
Number of environmental and safety audits 97 99 (2.0)
Employees and society
2010 2009 Change in %
Employees as of December 314 109,140 104,779 4.2
Apprentices/trainees as of December 314 2,442 2,401 1.7
Personnel expenses million € 8,228 7,107 15.8
Donations and sponsoring million € 49.8 48.1 3.5
Annual bonus % of Group companies 92.9 74.9 18.0
Lost time injury rate per million working hours 2.0 1.8 11.1
Occupational diseases per million working hours 0.5 0.4 25.0
1 For further information, see page 382 Including acquisitions3 Excluding emissions from oil and gas production4 Including employees of the Cognis group
* The fi nancial performance indicators include effects of the acquisition of the Cognis group on December 9, 2010. The effects on nonfi nancial performance indicators will be included in the 2011 reporting, unless stated otherwise.
The cover photo shows chemical technician Christian Lauer carrying out a routine inspection of the citral plant at the Ludwigshafen site.
Annual Meeting 2011 / Interim report fi rst quarter 2011
May 6, 2011Interim report fi rst half 2011
July 28, 2011Interim report third quarter 2011
Oct. 27, 2011Full year results 2011
Feb. 24, 2012Annual Meeting 2012 / Interim report fi rst quarter 2012
April 27, 2012
BASF supports the chemical industry’s global initiative Responsible Care®.
BASF is a sponsor of the International Year of Chemistry 2011. For more, see basf.com/iyc
You can fi nd this and other publications fromBASF on the internet at www.basf.com
You can also order the reports:
– by telephone: +49 621 6099895– on the internet: basf.com/mediaorders
General inquiriesPhone: +49 621 600
Corporate Media RelationsJennifer MooreBraun, Phone: +49 621 6092693
Sustainability Center Dr. Eckhard Koch, Phone: +49 621 6078638
Investor Relations Magdalena Moll, Phone: +49 621 6048230
Internetwww.basf.com
ContactsFurther information
ZO
AC
110
2 E
IS
SN
186
693
87
Re
po
rt 2
01
0
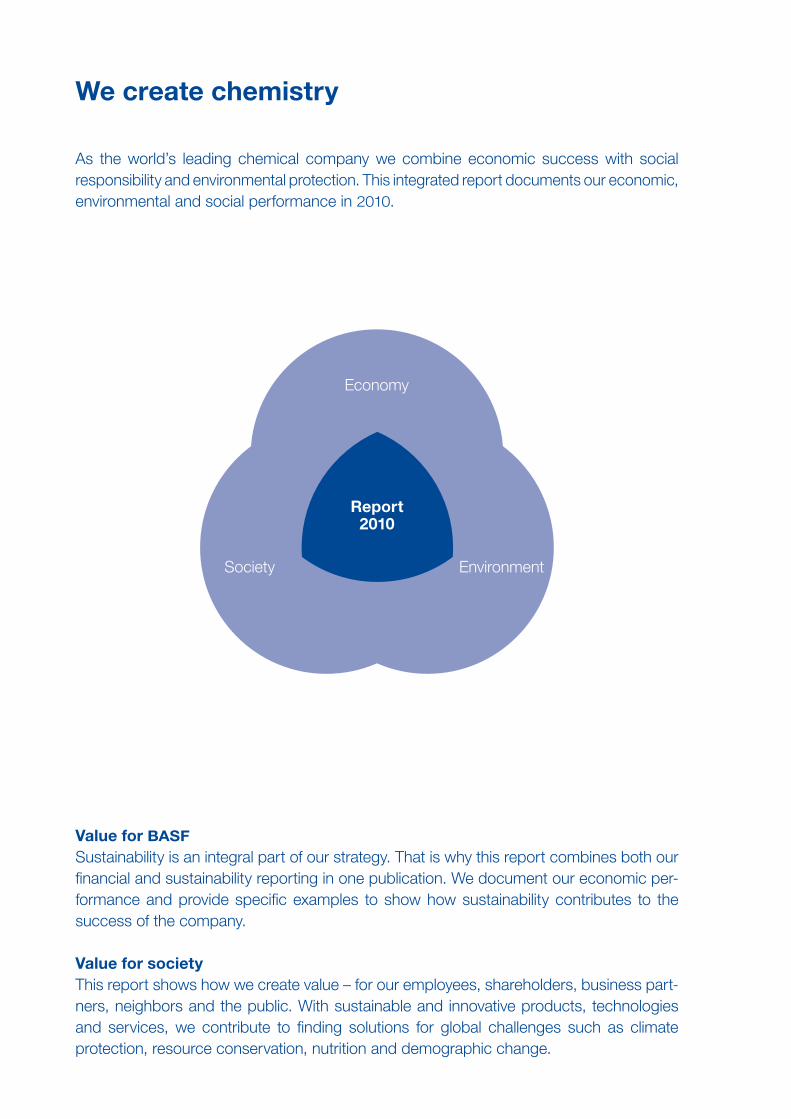
Value for BASFSustainability is an integral part of our strategy. That is why this report combines both our financial and sustainability reporting in one publication. We document our economic per-formance and provide specific examp les to show how sustainability contributes to the success of the company.
Value for societyThis report shows how we create value – for our employees, shareholders, business part-ners, neighbors and the public. With sustainable and innovative products, technologies and services, we contribute to finding solutions for global challenges such as climate protection, resource conservation, nutrition and demographic change.
We create chemistry
As the world’s leading chemical company we combine economic success with social responsibility and environmental protection. This integrated report documents our economic, environmental and social performance in 2010.
Economy
Society Environment
Report 2010
2
Content and structure
This report combines our financial and sustainability reporting and is addressed to readers interested in both areas. The reporting of the BASF Group is complemented by our short report BASF in Brief 2010.
In addition to the publication of this integrated report, we publish information on sustainability topics online. To find out more about these topics on our website, follow the links listed in the different chapters of this report. The information in the BASF Report 2010 also serves as a progress report on the implementation of the ten principles of the United Nations Global Compact. The symbol indicates information that is relevant to the principles of the Global Compact. These topics are listed in the Global Compact Index on page 213.
In addition to the traditional table of contents, “Topics at a glance” provides an overview of key topics such as business development, global megatrends, innovations and other topics of central importance for our business.
The 2010 online report can be found at basf.com/report
BASF in Brief 2010 can be found at basf.com/basf_in_brief
For more on sustainability, see basf.com/sustainability
For more on the implementation of the Global Compact principles, see basf.com/globalcompact_e
For more on the United Nations Global Compact, see www.globalcompact.org; for more on BASF’s participation in the Global Compact Lead, see basf.com/gclead_e
About this report BASF Report 2010
About this report
Overview
BASF – Report 2010 integrates our financial and sustainability reportingHTML – version of the report online contains additional information and service featuresMore extensive sustainability information online –Report serves as a progress report for the United –Nations Global Compact
Financial reporting is based on requirements of Interna –tional Financial Reporting Standards, German Commercial Code and German Accounting StandardsSustainability reporting follows guidelines of the Global –Reporting InitiativeDialogue with sustainability experts and stakeholders –regarding relevant topics
Topics
The information on the financial position and performance of the BASF Group is based on the requirements of International Financial Reporting Standards (IFRS), and, where applicable, the German Commercial Code as well as the German Account-ing Standards (GAS). After delisting from the NYSE, we have retained a modified form of the control system for financial reporting based on the guidelines of the Sarbanes-Oxley Act. Internal control mechanisms ensure the reliability of the infor-mation presented in this report. BASF’s management confirmed the effectiveness of the internal control measures and compli-ance with the regulations for financial reporting. Our sustainability reporting is aligned with the international guidelines (G3) of the Global Reporting Initiative (GRI). We want to identify and evaluate sustainability issues relevant for BASF at an early stage. To do so, we work with experts and use our materiality analysis to analyze sustainability issues. Our aim is to develop strategies well in advance for dealing with potential opportunities and risks. In 2010, we updated the analysis again and portrayed the results in a materiality matrix which consid-ers the degree of societal interest as well as the significance of these issues for BASF. We used this analysis as the basis for identifying key topics for the report.
For more on the Global Reporting Initiative, see www.globalreporting.org
For more on the selection of sustainability topics, see page 25 and basf.com/materiality
A short GRI and Global Compact index can be found on page 213; for a more comprehensive version, see basf.com/gri_gc_e
3BASF Report 2010 About this report
Our information and bases for calculation are in accord –ance with international standards for financial and sustainability reportingData collection on environmental protection and safety –follows the recommendations of the European Chemical Industry Council (CEFIC)
Report includes relevant information available up to the –editorial deadline of February 23, 2011
Financial and nonfinancial information audited by –KPMG AG WirtschaftsprüfungsgesellschaftVerification also in accordance with assurance standards –for sustainability reportingApplication level – A+ for sustainability reporting confirmed by Global Reporting Initiative
Data
All information and bases for calculation in this report are based on national and international standards for financial and sustainability reporting. All of the data and information for the reporting period were sourced from the responsible units using representative methods. The reporting period was the financial year 2010. BASF Group’s reporting includes BASF SE, the parent company, with its headquarters in Ludwigshafen, Germany, as well as all of its material subsidiaries. All financial performance indicators include the effects of the acquisition of the Cognis group from the closing date on December 9, 2010. The effects of Cognis on non-financial performance indicators will be included in our reporting for 2011. All employees of the BASF Group as of December 31, 2010, including the employees of the Cognis group, are represented in the information con-tained in the chapter Employees unless otherwise indicated. Our data collection methods for environmental protection and occupational safety are based on the recommendations of the European Chemical Industry Council (CEFIC). In the area of emissions and energy, we report on approximately 98% of all emissions from our production sites worldwide. The emissions of joint venture companies are included pro rata, based on our stake. We compile information on work-related accidents at all our sites worldwide. Accidents at joint venture sites are com-piled and reported in full. Further data on social responsibility apply to all consolidated group companies, unless otherwise indicated. To make this report as current as possible, we have includ ed relevant information available up to the editorial deadline of February 23, 2011. The report is published each year in English and in German.
For more on emissions, see the chapters Our goals, Climate protection, Energy and raw materials, Water, and Environmental, safety and security management
The Consolidated Financial Statements can be found on page 135
External audit and evaluation
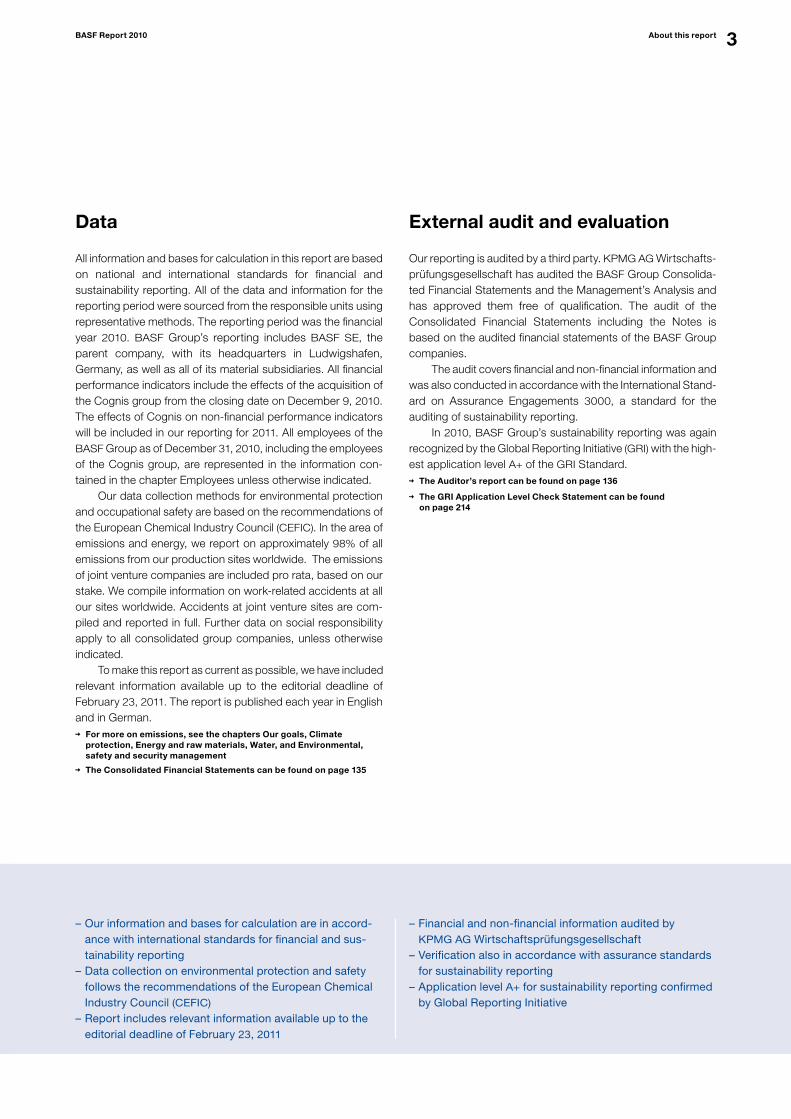
Our reporting is audited by a third party. KPMG AG Wirtschafts-prüfungsgesellschaft has audited the BASF Group Consolida-ted Financial Statements and the Management’s Analysis and has approved them free of qualification. The audit of the Consolidated Financial Statements including the Notes is based on the audited financial statements of the BASF Group companies. The audit covers financial and non-financial information and was also conducted in accordance with the International Stand-ard on Assurance Engagements 3000, a standard for the auditing of sustainability reporting. In 2010, BASF Group’s sustainability reporting was again recog nized by the Global Reporting Initiative (GRI) with the high-est application level A+ of the GRI Standard.
The Auditor’s report can be found on page 136
The GRI Application Level Check Statement can be found on page 214
Contents BASF Report 2010
BASF Report 2010Contents
Letter from the Chairman of the Board of Executive Directors 7Board of Executive Directors 10
Corporate Governance of the BASF Group 117
Management and Supervisory Boards 122
Compensation report 125
The BASF Group 17
Strategy and values 17
Our goals 20
Markets, structures and organization 22
Value-based management 24
Sustainability management 25
Value added statement 29
Research and development 30
The business year at BASF 32
Trends in the global economy 32
Trends in key customer industries 33
Trends in the chemical industry 34
Business review of the BASF Group 35
Consolidated balance sheets 39
Liquidity and capital resources 41
Business review by segments 44
BASF’s segments 46
Chemicals 46
Plastics 52
Performance Products 57
Functional Solutions 65
Agricultural Solutions 70
Oil & Gas 75
Regional results 81
BASF on the capital market 12
To our shareholders
Corporate Governance
Management’s Analysis
Employees and society 84
Employees 84
Occupational safety and health protection 89
Social commitment 90
Environment and safety 91
Environmental, safety and security management 91
Climate protection 95
Energy and raw materials 97
Water 99
Product stewardship 101
Risk report 103
Forecast 112
Economic environment in 2011 112
BASF Group outlook and opportunities 115
Report of the Supervisory Board 131
Declaration of conformity 134
Statement by the Board of Executive Directors 135
Auditor’s report 136
Consolidated statements of income 137
Consolidated statements of recognized income and expense 138
Consolidated balance sheets 139
Consolidated statements of cash flows 140
Consolidated statements of stockholders’ equity 141
BASF Group Consolidated Financial Statements and Notes 142
Consolidated Financial Statements
4
5BASF Report 2010 Contents
Glossary 203
Index 207
Registered Trademarks 209
Supplementary information on oil and gas producing activities 195
Ten-year summary 210
GRI and Global Compact Index 213
GRI Application Level Check Statement 214
Overviews
Supplementary Information on Oil and Gas Producing Activities
WWW.BASF.COMReport 2010 online
This report is also available in HTML format and as a PDF download on our website. Interactive tools enable individual compilation of texts, tables and diagrams, and quick selection according to subject. The direct link to the previous year’s report makes it easier to compare statements. Examples from this report and further information demonstrate how we create value – for BASF and for society.
Overview
About this report 2–3
Index 207–208
Strategy
Goals 18, 20 – 21, 24, 41– 43, 86, 89, 93, 95, 99, 101
Opportunities 25 – 28, 30 – 31, 81– 83, 85, 96, 100, 115
Minimizing risks 19, 25 – 28, 85, 89, 91– 94, 101–111, 115, 120
Portfolio 17, 22, 57
Efficiency 17, 81– 83, 97 – 98
Segment strategies 46, 52, 57, 65, 70, 75
Solutions for global challenges
Climate protection 30, 47, 53, 76, 95 – 98
Resources 31, 34, 59, 75 – 80, 97 –100
Health and nutrition 31, 33, 57, 63, 70 – 72, 113
Demographic change 85, 108
Construction and housing 31, 33, 52, 113
Mobility 30, 33, 53, 82, 113
Financial position and performance
Shares 12 –16, 35, 38
Balance sheet structure 39 – 40
Financial position 41– 43
Financial performance 35 – 38
Business development of the segments 44 – 45, 49 – 51, 55 – 56, 61– 64,
67 – 69, 73 – 74, 78 – 80
Forecast
Economic environment 112 –114
BASF Group outlook and opportunities 115 –116
Innovations
Growth clusters 17, 30 – 31, 72, 98
Innovations create value 17, 47, 53, 59, 65, 71, 76
Partnerships
Strategic partnerships 17, 30 – 31, 72, 83, 115
Cooperations 17, 30, 72, 102
Supply chain 26
Sustainability services 27, 96
Dialogue
Customers 18, 28, 33, 59, 66, 71
Other stakeholders 2, 15, 25, 27 – 28, 87 – 88, 90, 102
Prizes and awards back cover
GRI and Global Compact Index 213
Global Compact relevance
Topics at a glance
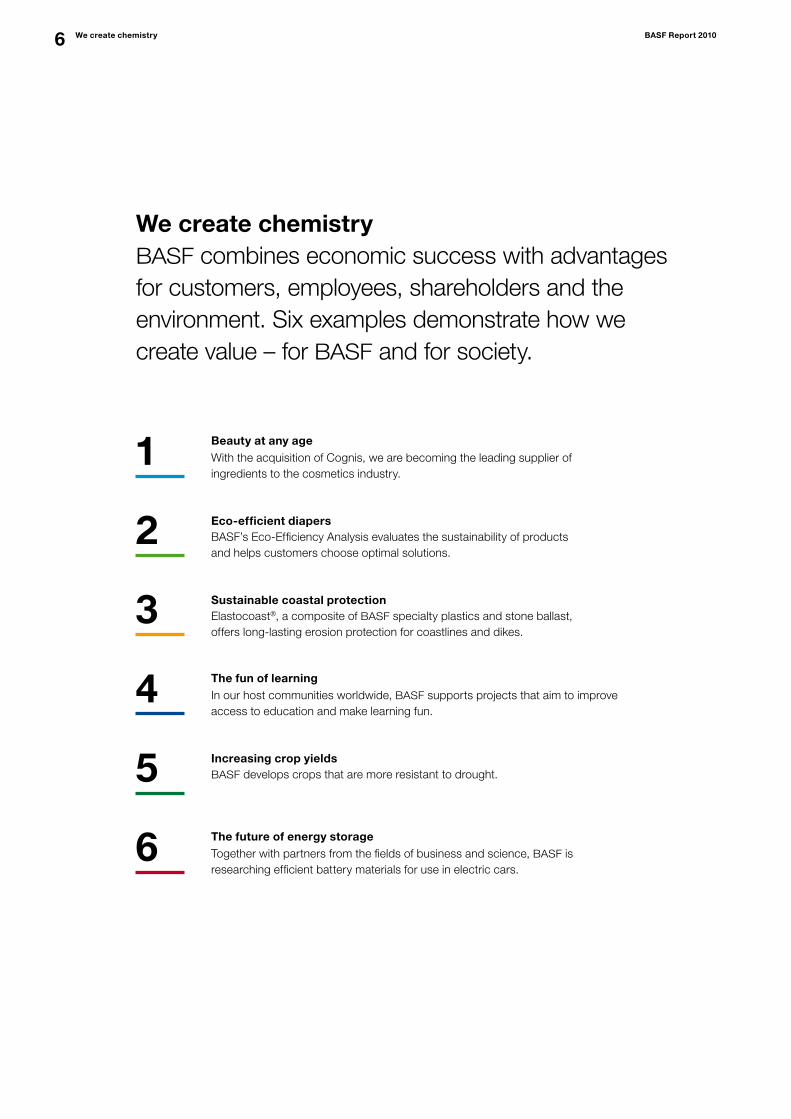
6 We create chemistry BASF Report 2010
We create chemistryBASF combines economic success with advantages for customers, employees, shareholders and the environment. Six examples demonstrate how we create value – for BASF and for society.
Sustainable coastal protectionElastocoast®, a composite of BASF specialty plastics and stone ballast, offers long-lasting erosion protection for coastlines and dikes.
Beauty at any ageWith the acquisition of Cognis, we are becoming the leading supplier of ingredients to the cosmetics industry.
The fun of learningIn our host communities worldwide, BASF supports projects that aim to improve access to education and make learning fun.
The future of energy storageTogether with partners from the fields of business and science, BASF is researching efficient battery materials for use in electric cars.
Increasing crop yieldsBASF develops crops that are more resistant to drought.
Eco-efficient diapersBASF’s Eco-Efficiency Analysis evaluates the sustainability of products and helps customers choose optimal solutions.
1
3
5
2
4
6

1Beauty at any age
When it comes to cosmetics, every age has specific product requirements. This will lead to greater demand for new ingredients in the future. With the acquisition of Cognis, BASF is becoming the leading supplier of ingredients to the cosmetics industry. Our portfolio is not only now more diverse, it is also more cyclically robust.
For more on the acquisition of Cognis, see page 57 onward
• T
O O
UR
SH
AR
EH
OL
DE
RS
7 Letter from the Chairman of the Board of Executive Directors
10 Board of Executive Directors
12 BASF on the capital market
To our shareholders
7BASF Report 2010 To our Shareholders
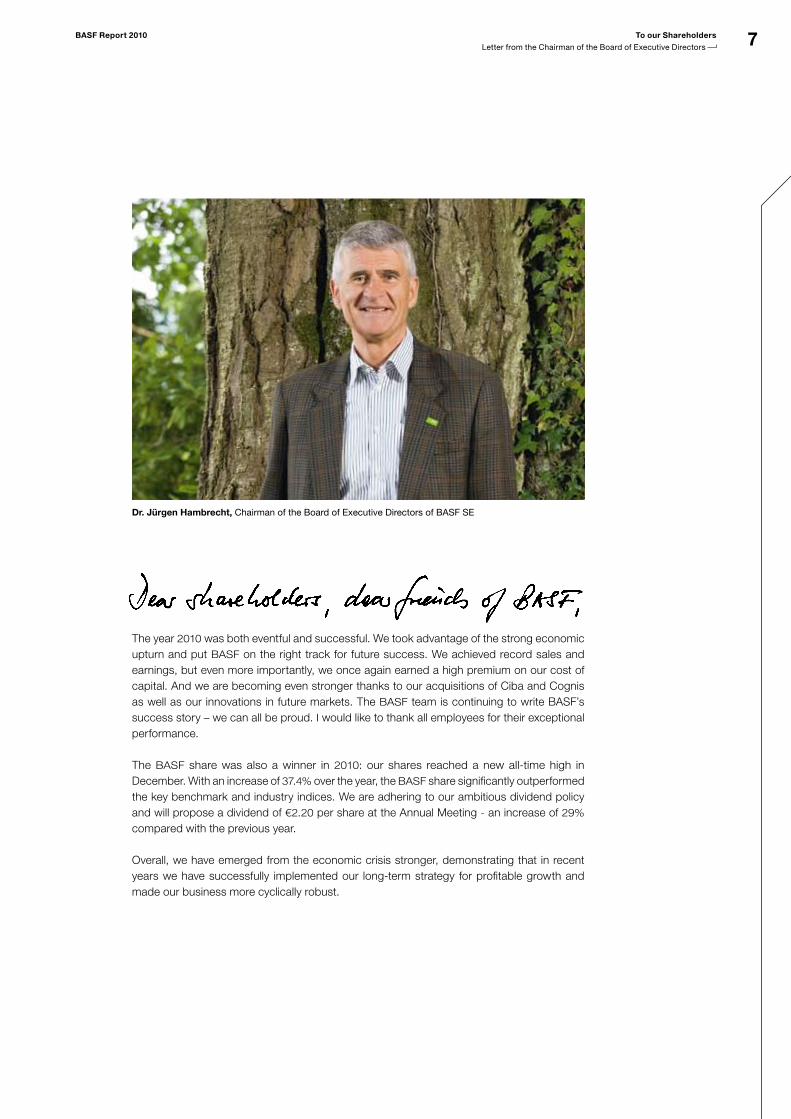
Letter from the Chairman of the Board of Executive Directors
Dr. Jürgen Hambrecht, Chairman of the Board of Executive Directors of BASF SE
The year 2010 was both eventful and successful. We took advantage of the strong economic upturn and put BASF on the right track for future success. We achieved record sales and earnings, but even more importantly, we once again earned a high premium on our cost of capital. And we are becoming even stronger thanks to our acquisitions of Ciba and Cognis as well as our innovations in future markets. The BASF team is continuing to write BASF’s success story – we can all be proud. I would like to thank all employees for their exceptional performance.
The BASF share was also a winner in 2010: our shares reached a new all-time high in December. With an increase of 37.4% over the year, the BASF share significantly outperformed the key benchmark and industry indices. We are adhering to our ambitious dividend policy and will propose a dividend of €2.20 per share at the Annual Meeting - an increase of 29% compared with the previous year.
Overall, we have emerged from the economic crisis stronger, demonstrating that in recent years we have successfully implemented our long-term strategy for profitable growth and made our business more cyclically robust.
8 To our Shareholders BASF Report 2010
Letter from the Chairman of the Board of Executive Directors
Strengthening our portfolioIn 2010, we made our portfolio even more oriented to our customers so that we can create sustainable value together. Our two major acquisitions have been crucial steps related to this: We rapidly and successfully integrated the former Ciba businesses and completed the pur-chase of Cognis at the end of 2010. This broadens our business with innovative activities that are growing faster than the industry average. At the end of 2010, we began the divestiture pro-cess with the carve-out of a large part of our styrenics activities. We plan to combine our busi-ness with that of INEOS in a 50-50 joint venture called Styrolution, thus creating a leading global styrenics company.
Securing future growthIn order to continue to grow profitably, we are active in growth markets. Between 2011 and 2015, we are planning investments of €12.6 billion, including projects with our strong part-ners. These include the expansion of our Verbund site in Nanjing, China, with Sinopec and in-vestments in world-scale production plants for specialty chemicals in Malaysia with PETRO-
NAS. Furthermore, we are also active in exploration and pipeline projects in the Oil & Gas segment, some with our partner Gazprom.
In recent years, we have renewed our regional strategies and set ourselves ambitious goals: In Europe, Asia and North and South America, we want to grow faster than the market aver-age and achieve sales of over €90 billion by 2020.
Opening up future marketsThrough innovation, we open up new markets to help people deal with important future issues and pressing challenges: significant global population growth, rising demand for food, increasing urbanization and the growing consumption of raw materials and energy. We have therefore further increased our investments in research and development to nearly €1.5 billion.
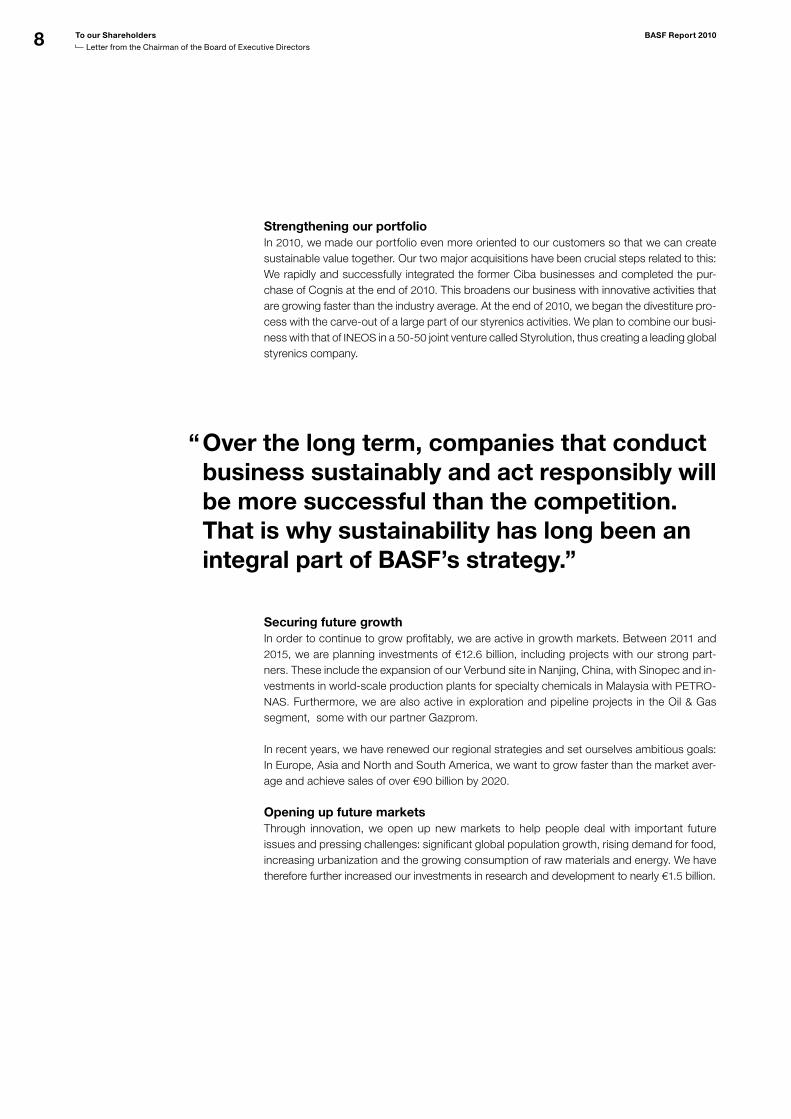
“ Over the long term, companies that conduct business sustainably and act responsibly will be more successful than the competition. That is why sustainability has long been an integral part of BASF’s strategy.”
9BASF Report 2010 To our Shareholders
Letter from the Chairman of the Board of Executive Directors
Dr. Jürgen HambrechtChairman of the Board of Executive Directors of BASF SE
Our research and development is mainly concentrated on these challenges, with a focus on five growth clusters: plant biotechnology, white biotechnology, nanotechnology, energy man-agement and raw material change.
For example, we are working with partners from science and business to conduct research on materials and components for innovative battery systems for electromobility and electric-ity storage. Other areas include higher-yielding crops, new catalysts and processes to man-ufacture petrochemicals from alternative raw materials as well as processes to capture and use carbon dioxide as a synthesis building block. Overall, we are investing up to €350 million annually in research projects related to these growth clusters, amounting to 25% of our research and development expenditures.
In 2015, we aim to generate sales of up to €8 billion with product innovations – new or improved products or applications that have been on the market for less than five years.
Conducting business sustainablyOver the long term, companies that conduct business sustainably and act responsibly will be more successful than the competition. That is why sustainability has long been an integral part of BASF’s strategy.
We consider it our ongoing responsibility to continuously improve our business and we are committed to the implementation of the principles of the Global Compact. Our strategy to reduce greenhouse gas emissions and our transparent reporting are recognized by investors: For the tenth year in succession, BASF has been included in the world’s most important sus-tainability index, the Dow Jones Sustainability World Index (DJSI World). We were also once again represented in the prestigious Carbon Disclosure Leadership Index (CDLI) and are now included in the new Carbon Performance Leadership Index (CPLI).
We are very confident for 2011. Despite continuing risks, the global economy will grow mod-erately. At the same time, we are prepared for increasingly volatile markets and intensifying competition. This means: the winners will be those who are faster, more flexible and more successful than their competitors. We are convinced of our ability to master this challenge. The global BASF team will actively take advantage of opportunities and work hard to shape BASF’s future. We look forward to your support in achieving this.
Sincerely yours,
10
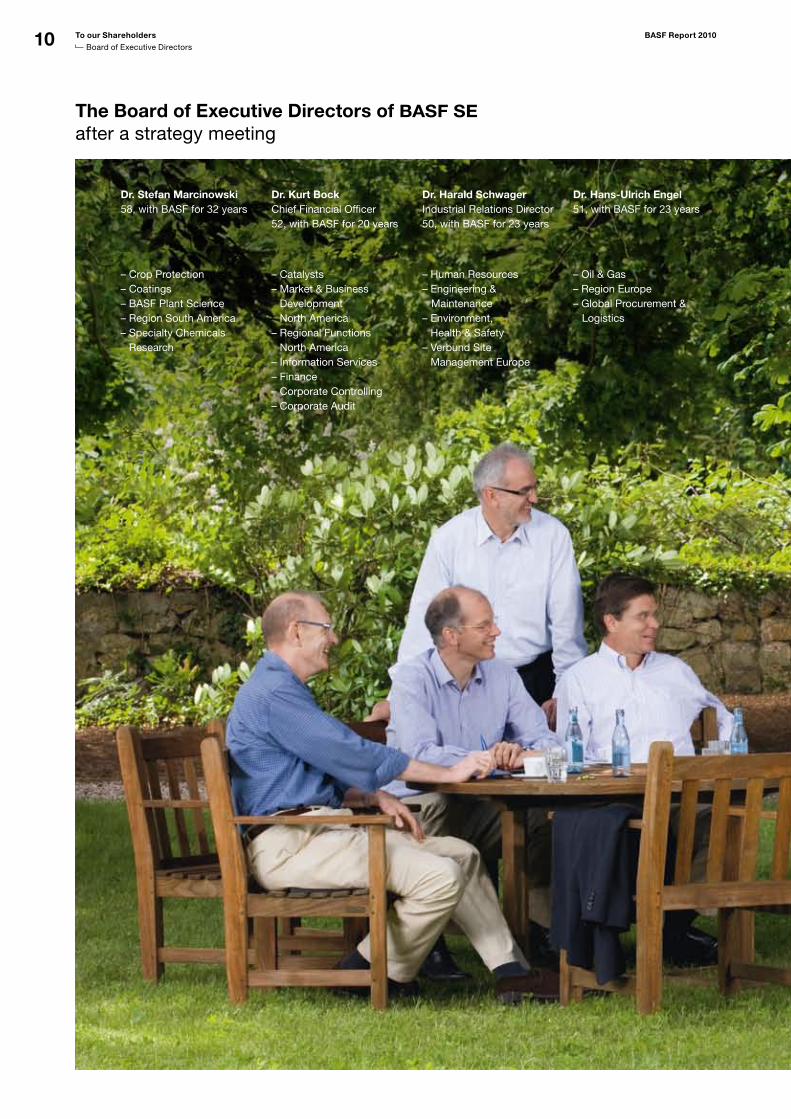
The Board of Executive Directors of BASF SE after a strategy meeting
Dr. Stefan Marcinowski58, with BASF for 32 years
– Crop Protection– Coatings– BASF Plant Science– Region South America– Specialty Chemicals
Research
Dr. Harald SchwagerIndustrial Relations Director50, with BASF for 23 years
– Human Resources– Engineering & Maintenance– Environment,
Health & Safety– Verbund Site
Management Europe
Dr. Hans-Ulrich Engel 51, with BASF for 23 years
– Oil & Gas– Region Europe – Global Procurement & Logistics
– Catalysts – Market & Business
Development North America
– Regional Functions North America
– Information Services– Finance– Corporate Controlling – Corporate Audit
Dr. Kurt BockChief Financial Officer 52, with BASF for 20 years
To our Shareholders BASF Report 2010
Board of Executive Directors
11
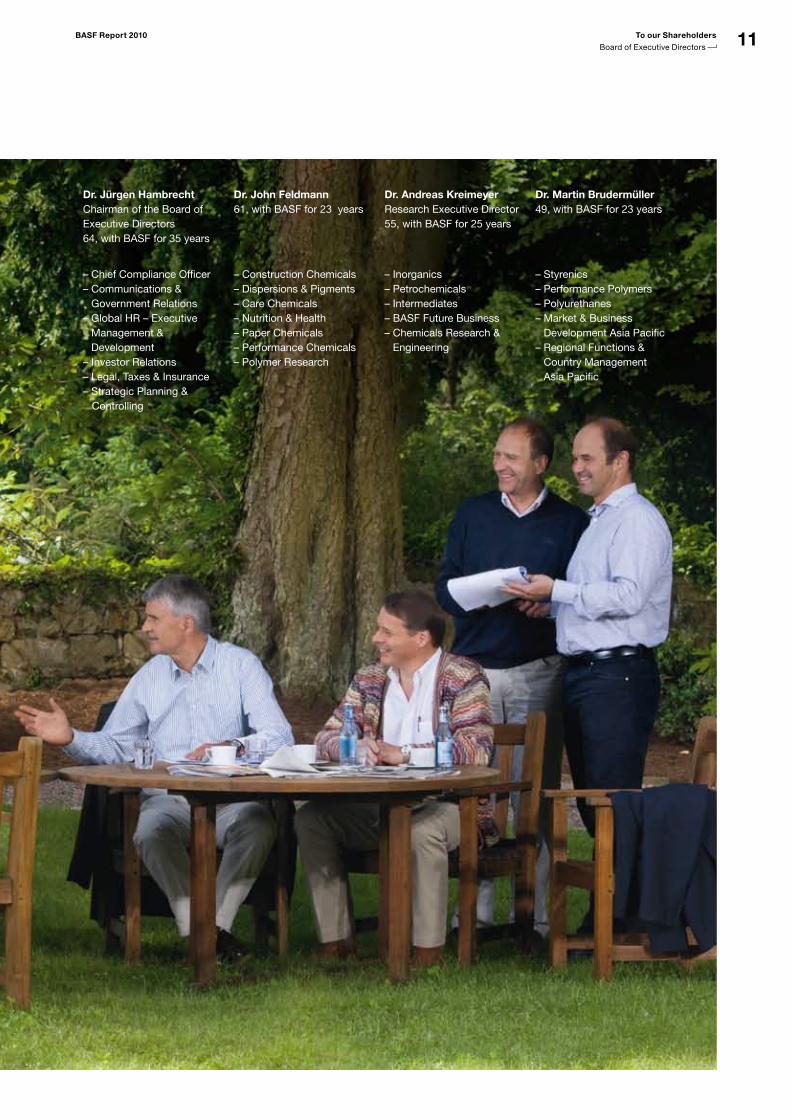
Dr. Andreas KreimeyerResearch Executive Director 55, with BASF for 25 years
– Inorganics– Petrochemicals– Intermediates– BASF Future Business– Chemicals Research &
Engineering
Dr. Martin Brudermüller49, with BASF for 23 years
– Styrenics– Performance Polymers– Polyurethanes– Market & Business
Development Asia Pacific– Regional Functions &
Country Management Asia Pacific
Dr. John Feldmann61, with BASF for 23 years
– Construction Chemicals– Dispersions & Pigments– Care Chemicals– Nutrition & Health– Paper Chemicals – Performance Chemicals– Polymer Research
– Chief Compliance Officer – Communications &
Government Relations– Global HR – Executive
Management & Development
– Investor Relations– Legal, Taxes & Insurance– Strategic Planning & Controlling
BASF Report 2010 To our Shareholders
Board of Executive Directors
Dr. Jürgen Hambrecht Chairman of the Board of Executive Directors 64, with BASF for 35 years
12
DECNOVOCTSEPAUGJULJUNMAYAPRMARFEBJAN
BASF share 42.7% DAX 30 16.1% MSCI World Chemicals 19.6%
50
70
90
110
130
150
50
70
90
110
130
150
wird aktualisiert
DECNOVOCTSEPAUGJULJUNMAYAPRMARFEBJAN
50
75
100
125
150
175
50
75
100
125
150
175
BASF share 00.0% DAX 30 00.0% MSCI World Chemicals 00.0%
DEZNOVOKTSEPAUGJULJUNMAIAPRMÄRFEBJAN
50
75
100
125
150
175
50
75
100
125
150
175
BASF-Aktie 00,0 % DAX 30 00,0 % MSCI World Chemicals 00,0 %
wird aktualisiert
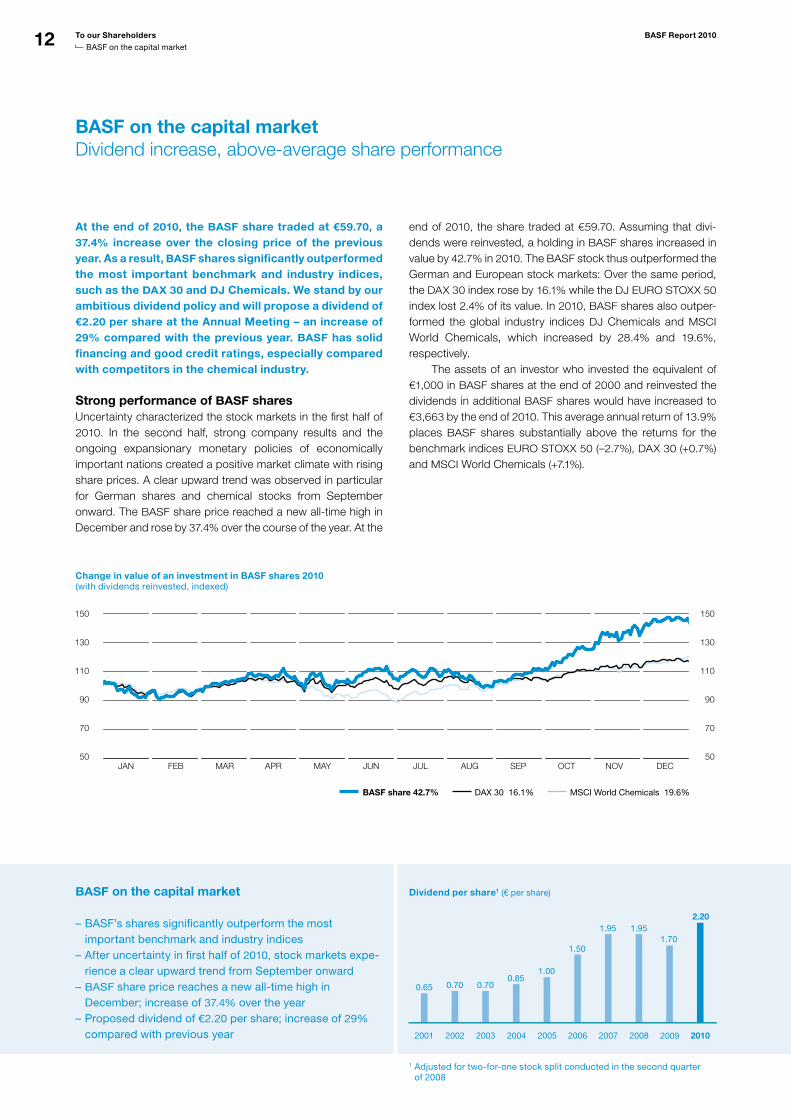
BASF on the capital marketDividend increase, above-average share performance
At the end of 2010, the BASF share traded at €59.70, a 37.4% increase over the closing price of the previous year. As a result, BASF shares significantly outperformed the most important benchmark and industry indices, such as the DAX 30 and DJ Chemicals. We stand by our ambitious dividend policy and will propose a dividend of €2.20 per share at the Annual Meeting – an increase of 29% compared with the previous year. BASF has solid financing and good credit ratings, especially compared with competitors in the chemical industry.
Strong performance of BASF sharesUncertainty characterized the stock markets in the first half of 2010. In the second half, strong company results and the ongoing expansionary monetary policies of economically important nations created a positive market climate with rising share prices. A clear upward trend was observed in particular for German shares and chemical stocks from September onward. The BASF share price reached a new all-time high in December and rose by 37.4% over the course of the year. At the
end of 2010, the share traded at €59.70. Assuming that divi-dends were reinvested, a holding in BASF shares increased in value by 42.7% in 2010. The BASF stock thus outperformed the German and European stock markets: Over the same period, the DAX 30 index rose by 16.1% while the DJ EURO STOXX 50 index lost 2.4% of its value. In 2010, BASF shares also outper-formed the global industry indices DJ Chemicals and MSCI World Chemicals, which increased by 28.4% and 19.6%, respectively. The assets of an investor who invested the equivalent of €1,000 in BASF shares at the end of 2000 and reinvested the dividends in additional BASF shares would have increased to €3,663 by the end of 2010. This average annual return of 13.9% places BASF shares substantially above the returns for the benchmark indices EURO STOXX 50 (–2.7%), DAX 30 (+0.7%) and MSCI World Chemicals (+7.1%).
BASF on the capital market
BASF’s shares significantly outperform the most –important benchmark and industry indicesAfter uncertainty in first half of – 2010, stock markets experience a clear upward trend from September onwardBASF – share price reaches a new alltime high in December; increase of 37.4% over the yearProposed dividend of – €2.20 per share; increase of 29% compared with previous year
Dividend per share1 (€ per share)
20102008 20092007200620052004200320022001
1.951.951.70
0.65 0.70 0.700.85
1.00
1.50
2.20
wird a
ktual
isier
t
Change in value of an investment in BASF shares 2010(with dividends reinvested, indexed)
1 Adjusted for twoforone stock split conducted in the second quarter of 2008
To our Shareholders BASF Report 2010
BASF on the capital market
13BASF Report 2010 To our Shareholders
BASF on the capital market
Long-term performance of BASF shares compared with indices (average annual performance with dividends reinvested)
2005 – 2010 17.8%
5.0%
–1.9%
7.1%
2000 – 2010 13.9%
0.7%
–2.7%
7.1%
BASF share EURO STOXX MSCI World ChemicalsDAX 30
Dividend increase to €2.20 per shareAt the Annual Meeting, the Board of Executive Directors and the Supervisory Board will propose a dividend payment of €2.20 per share. We stand by our ambitious dividend policy and plan to pay out around €2 billion to our shareholders (based on the number of qualifying shares on December 31, 2010). Based on the year-end share price for 2010, BASF shares offer a high div-idend yield of 3.69%. BASF belongs to the DivDAX share index, which contains the 15 companies with the highest dividend yield in the DAX 30. We continue to aim to increase our dividend each year, or at least maintain it at the previous year’s level.
Conversion to registered shares completedAt the beginning of August 2010, BASF shares were converted from bearer shares to registered shares, enabling better and more direct communication with shareholders. This will also simplify the registration process and issuing of proxies for the Annual Meeting.
wird a
ktual
isier
t
Broad base of international shareholdersWith over 400,000 shareholders, BASF is one of the largest publicly owned companies with a high free float. An analysis of the shareholder structure carried out in September 2010 showed that, at 15% of share capital, the United States and Canada make up the largest regional group of institutional investors. Institutional investors from Germany account for 12%. Share-holders from the United Kingdom and Ireland also hold 12% of BASF shares, while institutional investors from the rest of Europe hold a further 16% of capital. Approximately 26% of the company’s share capital is held by private investors, most of whom reside in Germany. Around 6% of all investors live in the greater Ludwigshafen area. With around one quarter of its shares held by private investors, BASF has the second-largest percentage of private shareholders among the DAX 30 companies.
Employees becoming shareholdersIn many countries, we offer share purchase programs to encourage our employees to become BASF shareholders. In 2010, more than 18,900 employees (2009: 20,800) purchased employee shares, worth a total of around €28 million (2009: €33 million).
For more on investment programs for employees, see page 87
Percentage of BASF shares in important indices as of December 31, 2010
%
DAX 30 9.2
DJ Chemicals 7.4
MSCI World Index 0.3
Shareholder structure (by region)
1 Germany 38%
2 United States/Canada 15%
3 United Kingdom/Ireland 12%
4 Rest of Europe 16%
5 Rest of the world 4%
6 Unidentified 15%
1
23
4
5
6
wird a
ktual
isier
t
14
BASF in key sustainability indicesFor the tenth year in succession, BASF was included in the world’s most important sustainability index, the Dow Jones Sustainability World Index (DJSI World). We received particular recognition for our risk and crisis management, environmental reporting and our climate strategy. BASF is also once again represented in the prestigious Carbon Disclosure Leadership Index (CDLI), scoring top marks in the materials sector for the second year in a row. The CDLI is used by investors to evaluate companies that excel in address-ing climate change and in the transparency of their reporting in this area. The Carbon Disclosure Project represents more than 500 institutional investors, with over $60 trillion in assets under management. BASF was also named to the new Carbon Performance Leadership Index (CPLI) in 2010. The CPLI also evaluates how companies deal with the opportunities and risks of climate change.
For more on the key sustainability indices, see basf.com/sustainabilityindices
Good credit ratings and solid financingWith “A/A-1/outlook stable” from rating agency Standard & Poor’s and “A1/P-1/outlook negative” from Moody’s, BASF con-tinues to have good credit ratings, especially when compared with competitors in the chemical industry. At year-end 2010, the financial indebtedness of the BASF Group was €15 billion with liquid funds of €1.5 billion. The aver-age time to maturity of our financial indebtedness was 3.4 years. Our medium to long-term debt financing is based on corporate bonds with a balanced maturity profile. For short-term debt financing, BASF has a commercial paper program which has an issuing volume of up to $12.5 billion. As back-up for the program, committed and unused credit lines of $6 billion are available.
For more on financial indebtedness and maturities, see the Notes on page 181
Analysts’ recommendationsAround thirty financial analysts regularly publish reports on BASF. At the end of 2010, 73% of these analysts had a buy rat-ing for our shares (end of 2009: 65%) while 21% of analysts rec-ommended holding our shares (end of 2009: 19%), and 6% had a sell rating (end of 2009: 16%). On December 31, 2010, the average target share price according to analyst consensus estimates was €63.26.
Continuously updated consensus estimates on BASF are available online at basf.com/share
Solid financing
Financial indebtedness of the – BASF Group at yearend 2010 was €15 billion; average time to maturity of 3.4 yearsCommercial paper program with an issuing volume –of up to $12.5 billionCommitted credit lines of – $6 billion
To our Shareholders BASF Report 2010
BASF on the capital market
BASF in sustainability indices
Again included in the most important sustainability indices –DJSI – World: particular recognition for risk and crisis management, environmental reporting and climate strategyCDLI: – top rank in the materials sectorCPLI: – included in the new index that evaluates how companies deal with the opportunities and risks of climate change
15BASF Report 2010 To our Shareholders
BASF on the capital market
Dialogue with the capital market Investor Relations
Global roadshows and oneonone meetings to inform –institutional investors and rating agenciesInformation events for private investors –Roundtable talks and investor days to provide indepth –information about certain topicsNumerous honors for – BASF Investor Relations
can be contacted at – Phone: +49 621 6048230 – Email: [email protected] – Internet: basf.com/share
The Investor Relations team’s newsletter keeps you informed about current BASF topics and acts as a useful reminder for important BASF dates. Subscribe at: basf.com/share/newsletter
Close dialogue with the capital marketOur corporate strategy aims to create sustainable value. We support this strategy through regular and open communication with all capital market participants. To keep institutional inves-tors and rating agencies informed, we host numerous one-on-one meetings and roadshows worldwide. We also hold events to provide private investors with an insight into the world of BASF. To delve more deeply into specific topics, we also held roundtable talks and an Investor Day in 2010. These talks were aimed at giving our investors in important financial centers information about certain key areas of our business. At the Performance Products Investor Day that took place in London and New York at the beginning of June, BASF’s management presented the new organization and goals of the restructured Performance Products segment following the Ciba integration. It is very important to us that analysts and investors have direct contact with BASF management as we feel that investors should get to know the people who lead our businesses. We also held special roadshows for investors who base their investment decisions on sustainability criteria, where we provided information about our measures relating to climate protection and energy efficiency, in particular.
Investors can find extensive information about BASF and BASF shares on our web page. In response to the increased popular-ity of social media, we have expanded our communication to include social media channels such as Twitter and Facebook. Interested users can always get the most up-to-date informa-tion about BASF in web 2.0.
Analysts and investors have confirmed the quality of our communication work – and have given BASF Investor Relations top ranks on multiple occasions. In June, BASF won the Inves-tor Relations Award from the business magazine Capital for the fourth time in a row. Furthermore, in the Thomson Extel Pan-European Survey 2010, BASF’s Investor Relations team was honored as “Best IR Team in Europe” and “Best IR Team in the Chemicals Sector.” At the IR Magazine Europe Awards 2010, BASF also picked up three top honors: Our Investor Relations team won the “Grand prix” for best overall investor relations at large cap companies, first prize in the chemical sector and the top spot for investor relations in Germany.
16
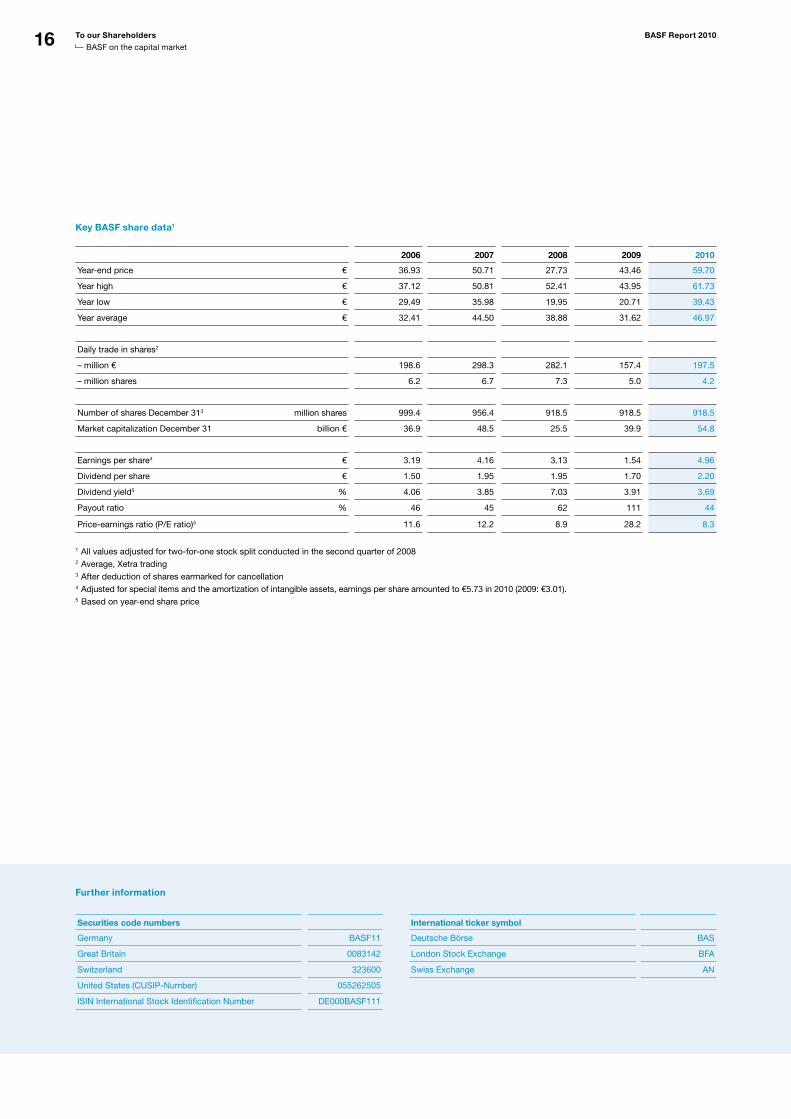
Key BASF share data1
2006 2007 2008 2009 2010
Yearend price € 36.93 50.71 27.73 43.46 59.70
Year high € 37.12 50.81 52.41 43.95 61.73
Year low € 29.49 35.98 19.95 20.71 39.43
Year average € 32.41 44.50 38.88 31.62 46.97
Daily trade in shares2
– million € 198.6 298.3 282.1 157.4 197.5
– million shares 6.2 6.7 7.3 5.0 4.2
Number of shares December 313 million shares 999.4 956.4 918.5 918.5 918.5
Market capitalization December 31 billion € 36.9 48.5 25.5 39.9 54.8
Earnings per share4 € 3.19 4.16 3.13 1.54 4.96
Dividend per share € 1.50 1.95 1.95 1.70 2.20
Dividend yield5 % 4.06 3.85 7.03 3.91 3.69
Payout ratio % 46 45 62 111 44
Priceearnings ratio (P/E ratio)5 11.6 12.2 8.9 28.2 8.3
1 All values adjusted for twoforone stock split conducted in the second quarter of 20082 Average, Xetra trading3 After deduction of shares earmarked for cancellation4 Adjusted for special items and the amortization of intangible assets, earnings per share amounted to €5.73 in 2010 (2009: €3.01).5 Based on yearend share price
Further information
Securities code numbers
Germany BASF11
Great Britain 0083142
Switzerland 323600
United States (CUSIPNumber) 055262505
ISIN International Stock Identification Number DE000BASF111
International ticker symbol
Deutsche Börse BAS
London Stock Exchange BFA
Swiss Exchange AN
To our Shareholders BASF Report 2010
BASF on the capital market

2Eco-efficient diapers
Resource conservation is a global challenge. BASF has developed an EcoEfficiency Analysis to evaluate the sustainability of a product throughout its entire life cycle. Optimized products are awarded a label to show they have been evaluated by an EcoEfficiency Analysis. Baby diapers are the first consumer product to carry this label. Customers and consumers can thus identify products that are more sustainable and take this into consideration when making their purchasing decisions.
For more on Eco-Efficiency Analysis, see page 27
• M
AN
AG
EM
EN
T’S
AN
ALY
SIS
17 The BASF Group17 Strategy and values
20 Our goals
22 Markets, structures and organization
24 Value-based management
25 Sustainability management
29 Value added statement
30 Research and development
32 The business year at BASF32 Trends in the global economy
33 Trends in key customer industries
34 Trends in the chemical industry
35 Business review of the BASF Group
39 Consolidated balance sheets
41 Liquidity and capital resources
44 Business review by segments
46 BASF’s segments
46 – Chemicals
52 – Plastics
57 – Performance Products
65 – Functional Solutions
70 – Agricultural Solutions
75 – Oil & Gas
81 Regional results
84 Employees and society84 Employees
89 Occupational safety and health protection
90 Social commitment
91 Environment and safety91 Environmental, safety and security management
95 Climate protection
97 Energy and raw materials
99 Water
101 Product stewardship
103 Risk report
112 Forecast
112 Economic environment in 2011
115 BASF Group outlook and opportunities
Management’s Analysis
17
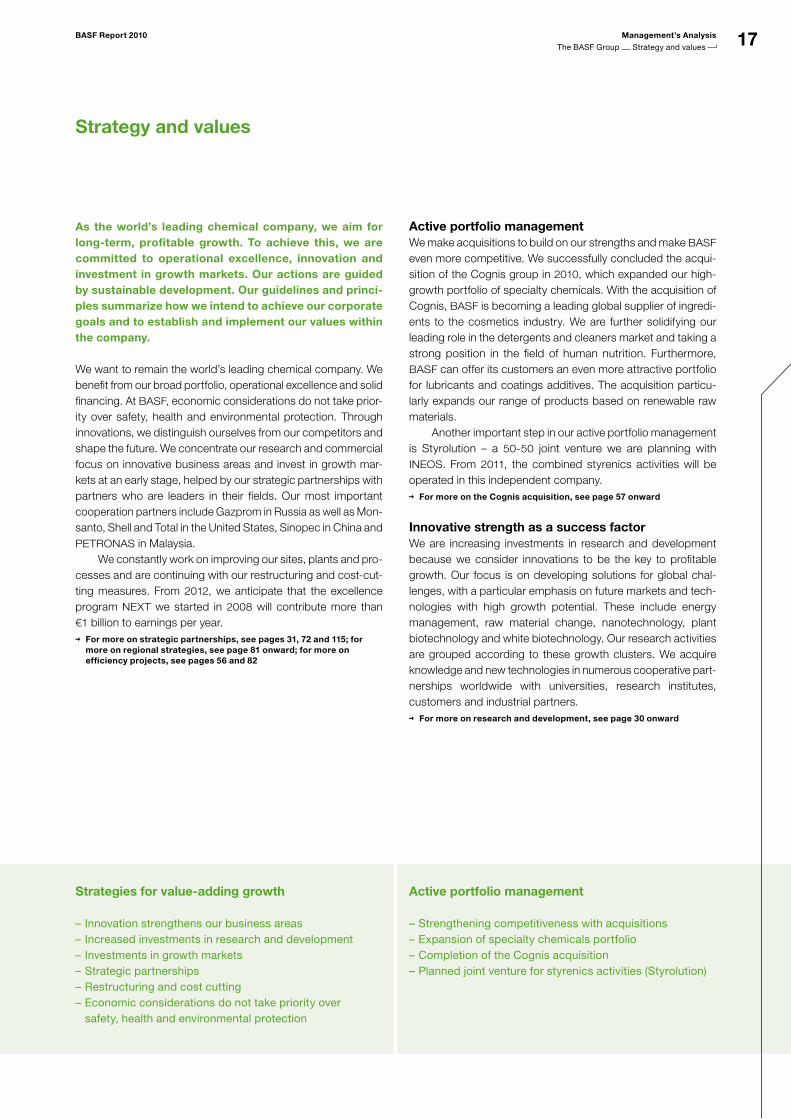
As the world’s leading chemical company, we aim for long-term, profitable growth. To achieve this, we are committed to operational excellence, innovation and investment in growth markets. Our actions are guided by sustainable development. Our guidelines and princi-ples summarize how we intend to achieve our corporate goals and to establish and implement our values within the company.
We want to remain the world’s leading chemical company. We benefit from our broad portfolio, operational excellence and solid financing. At BASF, economic considerations do not take prior-ity over safety, health and environmental protection. Through innovations, we distinguish ourselves from our competitors and shape the future. We concentrate our research and commercial focus on innovative business areas and invest in growth mar-kets at an early stage, helped by our strategic partnerships with partners who are leaders in their fields. Our most important cooperation partners include Gazprom in Russia as well as Mon-santo, Shell and Total in the United States, Sinopec in China and PETRONAS in Malaysia. We constantly work on improving our sites, plants and pro-cesses and are continuing with our restructuring and cost-cut-ting measures. From 2012, we anticipate that the excellence program NEXT we started in 2008 will contribute more than €1 billion to earnings per year.
For more on strategic partnerships, see pages 31, 72 and 115; for more on regional strategies, see page 81 onward; for more on efficiency projects, see pages 56 and 82
Strategy and values
Strategies for value-adding growth Active portfolio management
Innovation strengthens our business areas –Increased investments in research and development –Investments in growth markets –Strategic partnerships –Restructuring and cost cutting –Economic considerations do not take priority over –safety, health and environmental protection
Strengthening competitiveness with acquisitions –Expansion of specialty chemicals portfolio –Completion of the Cognis acquisition –Planned joint venture for styrenics activities (Styrolution) –
Active portfolio managementWe make acquisitions to build on our strengths and make BASF even more competitive. We successfully concluded the acqui-sition of the Cognis group in 2010, which expanded our high-growth portfolio of specialty chemicals. With the acquisition of Cognis, BASF is becoming a leading global supplier of ingredi-ents to the cosmetics industry. We are further solidifying our leading role in the detergents and cleaners market and taking a strong position in the field of human nutrition. Furthermore, BASF can offer its customers an even more attractive portfolio for lubricants and coatings additives. The acquisition particu-larly expands our range of products based on renewable raw materials. Another important step in our active portfolio management is Styrolution – a 50-50 joint venture we are planning with INEOS. From 2011, the combined styrenics activities will be operated in this independent company.
For more on the Cognis acquisition, see page 57 onward
Innovative strength as a success factorWe are increasing investments in research and development because we consider innovations to be the key to profitable growth. Our focus is on developing solutions for global chal-lenges, with a particular emphasis on future markets and tech-nologies with high growth potential. These include energy management, raw material change, nanotechnology, plant biotechnology and white biotechnology. Our research activities are grouped according to these growth clusters. We acquire knowledge and new technologies in numerous cooperative part-nerships worldwide with universities, research institutes, customers and industrial partners.
For more on research and development, see page 30 onward
BASF Report 2010 Management’s Analysis
The BASF Group Strategy and values
18
Strategic guidelines
Our four strategic guidelines form the basis of our activities:
We earn a premium on our cost of capital –We help our customers to be more successful –We form the best team in industry –We ensure sustainable development –
Our four strategic guidelines
We earn a premium on our cost of capital
The prerequisite for longterm success is earning a premium on our cost of capital. Earnings before interest and taxes (EBIT) after cost of capital is our key performance and management indicator.
For more on the implementation of this guideline, see page 24
We form the best team in industry
We want to recruit, support and retain the best employees. That is why we invest in our employees’ development and help them balance work and family life. With our Diversity + Inclusion initiative, we promote teams that create value with their different backgrounds and experiences.
For more on the implementation of this guideline, see page 84 onward
We help our customers to be more successful
We want to recognize what our customers will need tomorrow. As a reliable partner, we work with customers to develop solutions that will meet their individual needs and strengthen their competitiveness. To do this, we operate where our customers are – in all the world’s important markets.
For more on the implementation of this guideline, see pages 28, 47 and 59
We ensure sustainable development
For us, sustainable development means combining economic success with environmental and social responsibility. We have anchored sustainability in our corporate strategy and organization: With sustainable products and services, we create competitive advantages for both BASF and our customers.
For more on the implementation of this guideline, see page 25 onward
Management’s Analysis BASF Report 2010
The BASF Group Strategy and values
19BASF Report 2010 Management’s Analysis
The BASF Group Strategy and values
Our basic values
Sustainable profitable performance –Innovation for the success of our customers –Environmental protection, health and safety –Personal and professional competence –Mutual respect and open dialogue –Integrity –
Our values and global standardsWe act according to clearly defined values and standards of conduct that go beyond laws and regulations. As a global com-pany, we strive to ensure that our actions meet or exceed inter-nationally recognized standards. We observe and advocate:
the Universal Declaration of Human Rights and both United –Nations covenants on human rights,the ten principles of the – UN Global Compact,the ILO’s core labor standards and Tripartite Declaration of –Principles concerning Multinational Enterprises and Social Policy (MNE Declaration),the – OECD Guidelines for Multinational Enterprises,the Responsible Care – ® Global Charter, andthe German Corporate Governance Code. –
We have created Group-wide Values and Principles to apply these international guidelines to our business environment. Our actions are based on six basic values: sustainable profitable performance; innovation for the success of our customers; environmental protection, health and safety; personal and pro-fessional competence; mutual respect and open dialogue; and integrity. Each of these values is complemented by binding prin-ciples, which explain how they are implemented in our day-to-day business. Observance of our basic values and principles is an integral element in the annual target agreements of all senior executives in the BASF Group. With globally applicable stan-dards, we set out clear rules. We set ourselves ambitious envi-ronmental, health and safety goals and monitor our performance in these areas with regular audits. In this way, we also support the chemical industry’s global Responsible Care initiative. We have a monitoring system to assess our performance in terms of labor and social standards.
For more on values, see basf.com/value_system
For more on how our values are anchored in our day-to-day busi-ness, see the chapters Sustainability management from page 25 onward, Employees from page 87 onward, and Environmental and safety management from page 91 onward
For more on environmental, health and safety management and audits, see page 89 onward
For more on our monitoring system for labor and social standards, see page 26
Code of Conduct and complianceBinding standards of conduct ensure that our values are perma-nently established in day-to-day business activities. The frame-work for this is our corporate governance system, which encom-passes the management and monitoring of the company. The system includes organizations, commercial principles and guide-lines, as well as internal and external control and monitoring mechanisms. Integrity is one of our basic values and the foun-dation of our Compliance Program. For us, compliance means the duty to comply with laws and internal corporate directives. Based on our Group-wide basic values and principles, our Group companies have also created codes of conduct for indi-vidual countries, taking into account the local laws and customs. These codes of conduct are binding for all employees in the rel-evant countries and must be explained and incorporated in daily business operations. Compliance training for all employees worldwide is an important prerequisite for successful implemen-tation of the codes of conduct. Furthermore, employees have a number of options if they want to ask questions or seek advice and help: They can contact their supervisors, our legal and human resources departments and our compliance hotline.
For more on the Compliance Program, see page 120
Global standards
Regular audits on environment, health and safety –Support of the Responsible Care initiative –Global monitoring system for labor and social standards –
20 Management’s Analysis BASF Report 2010
The BASF Group Our goals
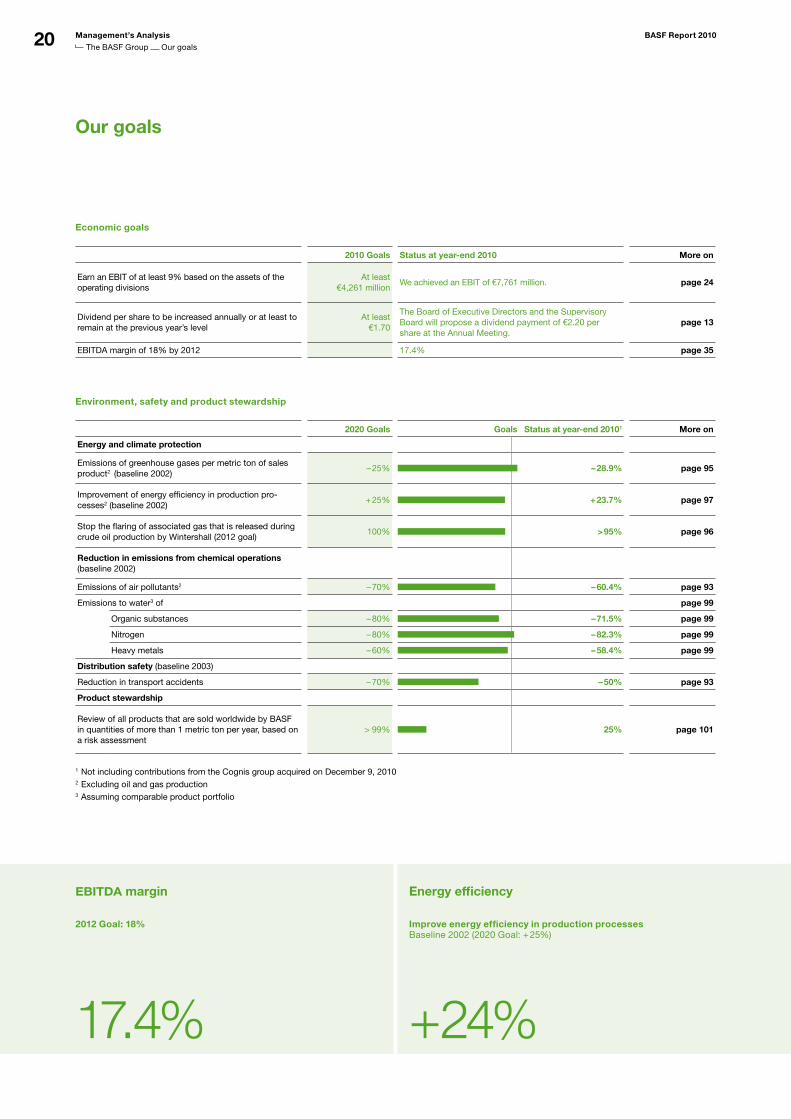
Our goals
Economic goals
2010 Goals Status at year-end 2010 More on
Earn an EBIT of at least 9% based on the assets of the operating divisions
At least€4,261 million
We achieved an EBIT of €7,761 million. page 24
Dividend per share to be increased annually or at least to remain at the previous year’s level
At least €1.70
The Board of Executive Directors and the Supervisory Board will propose a dividend payment of €2.20 per share at the Annual Meeting.
page 13
EBITDA margin of 18% by 2012 17.4% page 35
Environment, safety and product stewardship
2020 Goals Goals Status at year-end 20101 More on
Energy and climate protection
Emissions of greenhouse gases per metric ton of sales product2 (baseline 2002)
– 25% – 28.9% page 95
Improvement of energy efficiency in production processes2 (baseline 2002)
+ 25% + 23.7% page 97
Stop the flaring of associated gas that is released during crude oil production by Wintershall (2012 goal)
100% > 95% page 96
Reduction in emissions from chemical operations (baseline 2002)
Emissions of air pollutants2 – 70% – 60.4% page 93
Emissions to water3 of page 99
Organic substances – 80% – 71.5% page 99
Nitrogen – 80% – 82.3% page 99
Heavy metals – 60% – 58.4% page 99
Distribution safety (baseline 2003)
Reduction in transport accidents – 70% – 50% page 93
Product stewardship
Review of all products that are sold worldwide by BASF in quantities of more than 1 metric ton per year, based on a risk assessment
> 99% 25% page 101
1 Not including contributions from the Cognis group acquired on December 9, 20102 Excluding oil and gas production3 Assuming comparable product portfolio
2012 Goal: 18%
17.4%
Improve energy efficiency in production processesBaseline 2002 (2020 Goal: + 25%)
+ 24%
EBITDA margin Energy efficiency
21BASF Report 2010 Management’s Analysis
The BASF Group Our goals
Lost time injury rate per million working hoursBaseline 2002 (2020 Goal: –80%)
– 39%
Senior executives with international experience(Goal: >70%)
78%
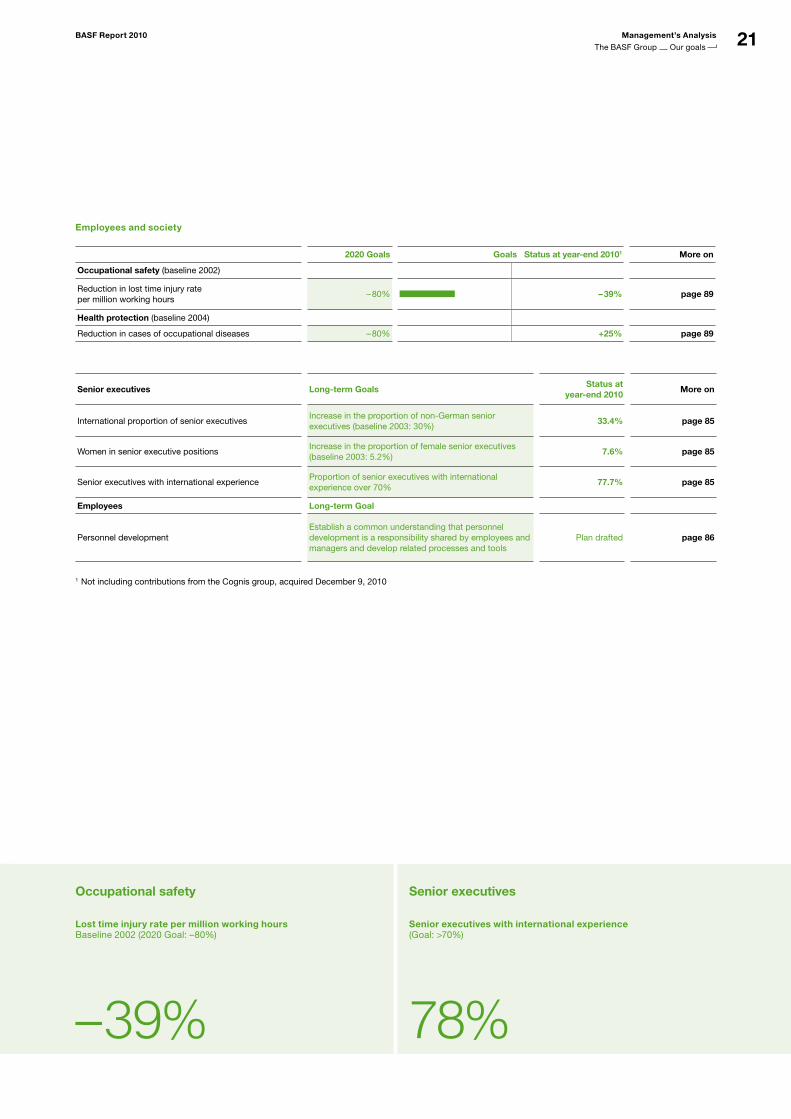
Employees and society
2020 Goals Goals Status at year-end 20101 More on
Occupational safety (baseline 2002)
Reduction in lost time injury rateper million working hours
– 80% – 39% page 89
Health protection (baseline 2004)
Reduction in cases of occupational diseases – 80% +25% page 89
Senior executives Long-term GoalsStatus at
year-end 2010More on
International proportion of senior executivesIncrease in the proportion of nonGerman senior executives (baseline 2003: 30%)
33.4% page 85
Women in senior executive positionsIncrease in the proportion of female senior executives (baseline 2003: 5.2%)
7.6% page 85
Senior executives with international experienceProportion of senior executives with international experience over 70%
77.7% page 85
Employees Long-term Goal
Personnel developmentEstablish a common understanding that personnel development is a responsibility shared by employees and managers and develop related processes and tools
Plan drafted page 86
1 Not including contributions from the Cognis group, acquired December 9, 2010
Occupational safety Senior executives
22
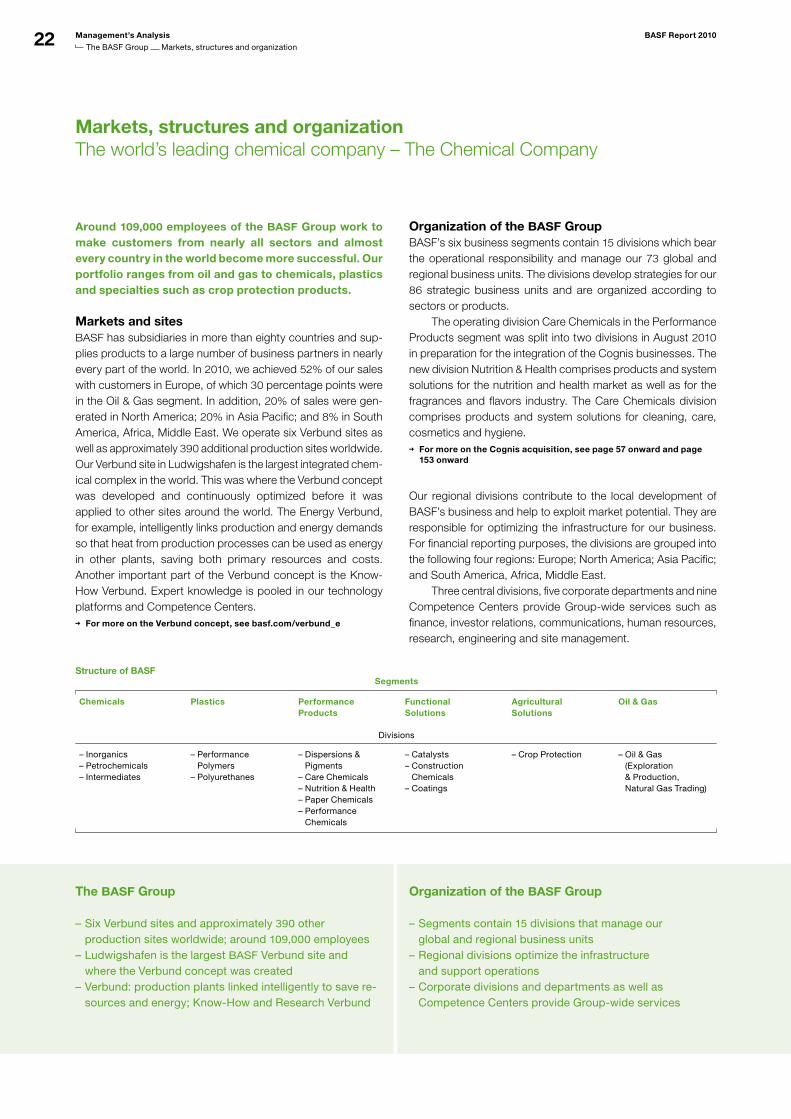
The BASF Group Organization of the BASF Group
Six Verbund sites and approximately – 390 other production sites worldwide; around 109,000 employeesLudwigshafen is the largest – BASF Verbund site and where the Verbund concept was createdVerbund: production plants linked intelligently to save re –sources and energy; KnowHow and Research Verbund
Segments contain – 15 divisions that manage our global and regional business units Regional divisions optimize the infrastructure –and support operationsCorporate divisions and departments as well as –Competence Centers provide Groupwide services
Markets, structures and organizationThe world’s leading chemical company – The Chemical Company
Around 109,000 employees of the BASF Group work to make customers from nearly all sectors and almost every country in the world become more successful. Our portfolio ranges from oil and gas to chemicals, plastics and specialties such as crop protection products.
Markets and sitesBASF has subsidiaries in more than eighty countries and sup-plies products to a large number of business partners in nearly every part of the world. In 2010, we achieved 52% of our sales with customers in Europe, of which 30 percentage points were in the Oil & Gas segment. In addition, 20% of sales were gen-erated in North America; 20% in Asia Pacific; and 8% in South America, Africa, Middle East. We operate six Verbund sites as well as approximately 390 additional production sites worldwide. Our Verbund site in Ludwigshafen is the largest integrated chem-ical complex in the world. This was where the Verbund concept was developed and continuously optimized before it was applied to other sites around the world. The Energy Verbund, for example, intelligently links production and energy demands so that heat from production processes can be used as energy in other plants, saving both primary resources and costs. Another important part of the Verbund concept is the Know-How Verbund. Expert knowledge is pooled in our technology platforms and Competence Centers.
For more on the Verbund concept, see basf.com/verbund_e
Organization of the BASF GroupBASF’s six business segments contain 15 divisions which bear the operational responsibility and manage our 73 global and regional business units. The divisions develop strategies for our 86 strategic business units and are organized according to sectors or products. The operating division Care Chemicals in the Performance Products segment was split into two divisions in August 2010 in preparation for the integration of the Cognis businesses. The new division Nutrition & Health comprises products and system solutions for the nutrition and health market as well as for the fragrances and flavors industry. The Care Chemicals division comprises products and system solutions for cleaning, care, cosmetics and hygiene.
For more on the Cognis acquisition, see page 57 onward and page 153 onward
Our regional divisions contribute to the local development of BASF’s business and help to exploit market potential. They are responsible for optimizing the infrastructure for our business. For financial reporting purposes, the divisions are grouped into the following four regions: Europe; North America; Asia Pacific; and South America, Africa, Middle East. Three central divisions, five corporate departments and nine Competence Centers provide Group-wide services such as finance, investor relations, communications, human resources, research, engineering and site management.
Management’s Analysis BASF Report 2010
The BASF Group Markets, structures and organization
Chemicals
– Inorganics– Petrochemicals– Intermediates
Plastics
– Performance Polymers
– Polyurethanes
Performance Products
– Dispersions & Pigments
– Care Chemicals– Nutrition & Health– Paper Chemicals– Performance
Chemicals
Functional Solutions
– Catalysts– Construction
Chemicals– Coatings
Agricultural Solutions
– Crop Protection
Oil & Gas
– Oil & Gas (Exploration & Production, Natural Gas Trading)
Structure of BASF
Divisions
Segments
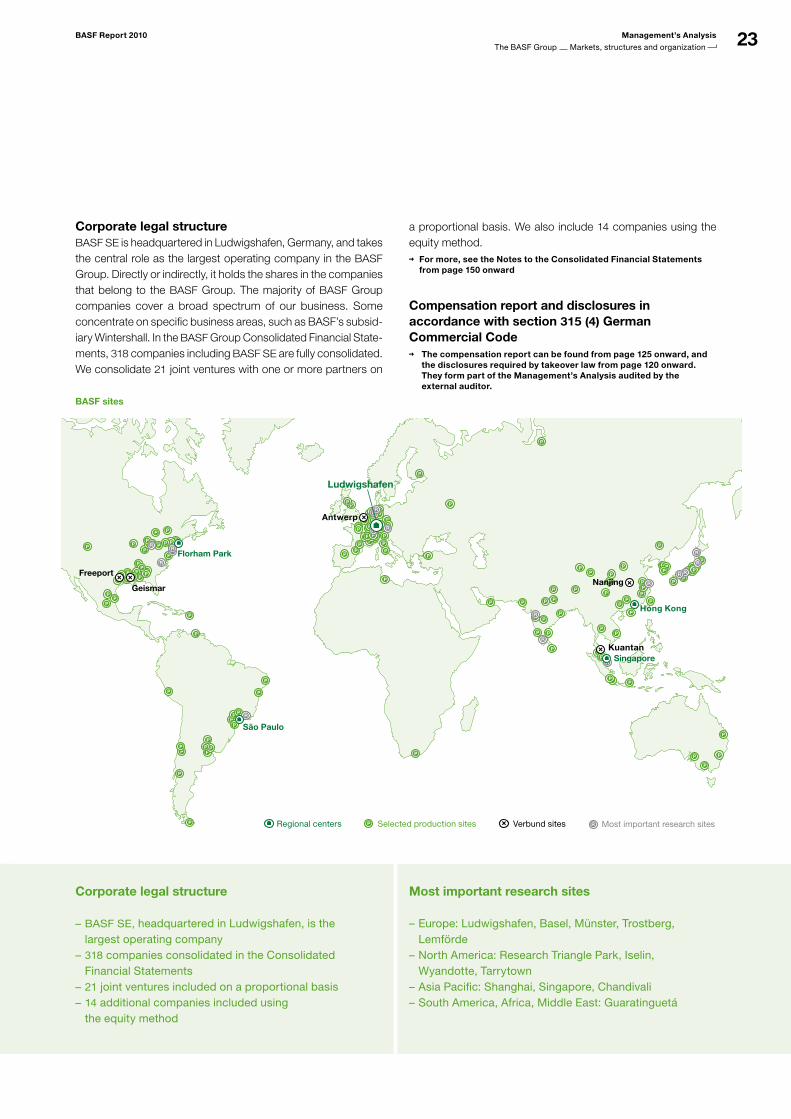
23BASF Report 2010 Management’s Analysis
The BASF Group Markets, structures and organization
Corporate legal structure Most important research sites
BASF – SE, headquartered in Ludwigshafen, is the largest operating company318 – companies consolidated in the Consolidated Financial Statements21 – joint ventures included on a proportional basis14 – additional companies included using the equity method
Europe: Ludwigshafen, Basel, Münster, Trostberg, –LemfördeNorth America: Research Triangle Park, Iselin, –Wyandotte, TarrytownAsia Pacific: Shanghai, Singapore, Chandivali –South America, Africa, Middle East: Guaratinguetá –
BASF sites
Corporate legal structureBASF SE is headquartered in Ludwigshafen, Germany, and takes the central role as the largest operating company in the BASF Group. Directly or indirectly, it holds the shares in the companies that belong to the BASF Group. The majority of BASF Group companies cover a broad spectrum of our business. Some concentrate on specific business areas, such as BASF’s subsid-iary Wintershall. In the BASF Group Consolidated Financial State-ments, 318 companies including BASF SE are fully consolidated. We consolidate 21 joint ventures with one or more partners on
a proportional basis. We also include 14 companies using the equity method.
For more, see the Notes to the Consolidated Financial Statements from page 150 onward
Compensation report and disclosures in accordance with section 315 (4) German Commercial Code
The compensation report can be found from page 125 onward, and the disclosures required by takeover law from page 120 onward. They form part of the Management’s Analysis audited by the external auditor.
Freeport
Geismar
Antwerpen
Nanjing
KuantanSingapur
Hongkong
Ludwigshafen
Florham Park
São Paulo
Regionaler Hauptsitz Ausgewählter Produktionsstandort VerbundstandortRegional centers
Freeport
Geismar
Antwerpen
Nanjing
KuantanSingapur
Hongkong
Ludwigshafen
Florham Park
São Paulo
Regionaler Hauptsitz Ausgewählter Produktionsstandort VerbundstandortSelected production sites
Freeport
Geismar
Antwerpen
Nanjing
KuantanSingapur
Hongkong
Ludwigshafen
Florham Park
São Paulo
Regionaler Hauptsitz Ausgewählter Produktionsstandort VerbundstandortVerbund sites Most important research sites
Freeport
Geismar
Ludwigshafen
Florham Park
Antwerp
Singapore
Hong Kong
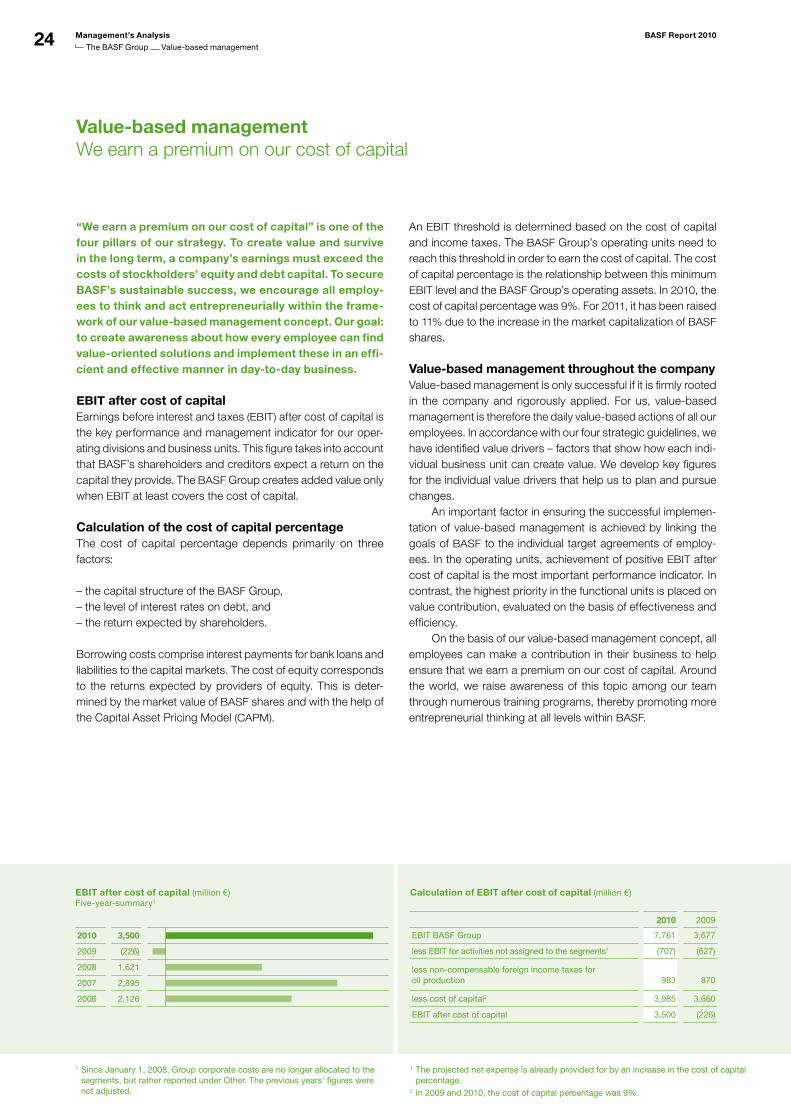
24
Value-based managementWe earn a premium on our cost of capital
“We earn a premium on our cost of capital” is one of the four pillars of our strategy. To create value and survive in the long term, a company’s earnings must exceed the costs of stockholders’ equity and debt capital. To secure BASF’s sustainable success, we encourage all employ-ees to think and act entrepreneurially within the frame-work of our value-based management concept. Our goal: to create awareness about how every employee can find value-oriented solutions and implement these in an effi-cient and effective manner in day-to-day business.
EBIT after cost of capitalEarnings before interest and taxes (EBIT) after cost of capital is the key performance and management indicator for our oper-ating divisions and business units. This figure takes into account that BASF’s shareholders and creditors expect a return on the capital they provide. The BASF Group creates added value only when EBIT at least covers the cost of capital.
Calculation of the cost of capital percentageThe cost of capital percentage depends primarily on three factors:
– the capital structure of the BASF Group,– the level of interest rates on debt, and– the return expected by shareholders.
Borrowing costs comprise interest payments for bank loans and liabilities to the capital markets. The cost of equity corresponds to the returns expected by providers of equity. This is deter-mined by the market value of BASF shares and with the help of the Capital Asset Pricing Model (CAPM).
An EBIT threshold is determined based on the cost of capital and income taxes. The BASF Group’s operating units need to reach this threshold in order to earn the cost of capital. The cost of capital percentage is the relationship between this minimum EBIT level and the BASF Group’s operating assets. In 2010, the cost of capital percentage was 9%. For 2011, it has been raised to 11% due to the increase in the market capitalization of BASF shares.
Value-based management throughout the companyValue-based management is only successful if it is firmly rooted in the company and rigorously applied. For us, value-based management is therefore the daily value-based actions of all our employees. In accordance with our four strategic guidelines, we have identified value drivers – factors that show how each indi-vidual business unit can create value. We develop key figures for the individual value drivers that help us to plan and pursue changes. An important factor in ensuring the successful implemen-tation of value-based management is achieved by linking the goals of BASF to the individual target agreements of employ-ees. In the operating units, achievement of positive EBIT after cost of capital is the most important performance indicator. In contrast, the highest priority in the functional units is placed on value contribution, evaluated on the basis of effectiveness and efficiency. On the basis of our value-based management concept, all employees can make a contribution in their business to help ensure that we earn a premium on our cost of capital. Around the world, we raise awareness of this topic among our team through numerous training programs, thereby promoting more entrepreneurial thinking at all levels within BASF.
Calculation of EBIT after cost of capital (million €)
2010 2009
EBIT BASF Group 7,761 3,677
less EBIT for activities not assigned to the segments1 (707) (627)
less noncompensable foreign income taxes for oil production
983
870
less cost of capital2 3,985 3,660
EBIT after cost of capital 3,500 (226)
1 The projected net expense is already provided for by an increase in the cost of capital percentage.
2 In 2009 and 2010, the cost of capital percentage was 9%.
1 Since January 1, 2008, Group corporate costs are no longer allocated to the segments, but rather reported under Other. The previous years’ figures were not adjusted.
EBIT after cost of capital (million €) Fiveyearsummary1
2010 3,500
wird aktualisiert
2009 (226)
2008 1,621
2007 2,895
2006 2,126
Management’s Analysis BASF Report 2010
The BASF Group Valuebased management
25
BASF’s sustainability management allows us to imple-ment our strategic guideline “We ensure sustainable development.” It anchors sustainability in our company, both strategically and organizationally, and regulates how this is implemented in day-to-day business. Sustain-able development helps us enhance our existing business, create new business opportunities and minimize risks.
StrategySustainability is a responsibility that cuts across the entire struc-ture of BASF. As part of this, we foster open dialogue with our stakeholders, identify important topics early on, and implement and monitor our voluntary commitments worldwide. We take advantage of business opportunities with products and services that have economic and environmental benefits for our custom-ers. To identify these, in 2010, we started taking sustainability aspects into account more systematically in the development of strategies for our strategic business units. When we acquire companies, we integrate them as quickly as possible in our management systems and organization for sustainability. We ensure that new employees are familiar and act in accordance with our global requirements for environmen-tal protection, health protection and safety as well as labor and social standards. We have expert teams who act as advisers on sustainability during the integration of acquired companies.
For more on the implementation of requirements related to environment, health, safety and security, see page 91 onward
Sustainability organizationOur global Sustainability Council is the central decision-making body for all relevant sustainability topics. It advises the Board of Executive Directors on decisions concerning sustainability. With global directives, the Council ensures that the BASF Group acts in accordance with the principles of sustainable development. The Council comprises nine heads of functional, operating and
regional divisions. The Chairman of the Council is Board mem-ber Dr. Harald Schwager. The Sustainability Council is supported by regional steering committees that identify key regional top-ics, initiate the corresponding projects, and implement global decisions locally. Our Sustainability Center coordinates the implementation of the sustainability strategy in our core busi-ness, liaising between the Sustainability Council, regional net-works and operating units.
For more, see basf.com/sustainability
Identifying relevant topicsWe want to recognize topics at an early stage that could repre-sent opportunities or risks for our business now or in the future. Therefore we regularly analyze the relevance of sustainability issues for BASF and for society. In 2010, we carried out a new materiality analysis. Together with external partners, we sur-veyed several hundred external experts and stakeholders as well as BASF managers about key sustainability topics. Subse-quently, BASF’s experts from several divisions identified the stra-tegic importance of these issues for BASF. We are using the results to develop strategies for these topics, paying special attention to topics that have come increasingly into focus, such as water, biodiversity and renewable raw materials. In 2010, the Sustainability Council decided that the sustainability strategy should be refined with regard to these topics. To do so, we will develop strategic positions and define goals. The first results will be presented to the Sustainability Council in 2011.
For more on our process for identifying sustainability topics and the new results, see basf.com/materiality
For more on materiality analysis, see page 2
Sustainability managementCreating new business opportunities and minimizing risks
Strategy Organization
Responsibility throughout entire company –Implementation of the strategic guideline “We ensure –sustainable development”Goal: create business opportunities, minimize risks –Sustainability is an important aspect in integrating –acquired companies
Global Sustainability Council is the central –decisionmaking bodyRegional steering committees for sustainability –Sustainability Center coordinates the implementation –in our core business
BASF Report 2010 Management’s Analysis
The BASF Group Sustainability management
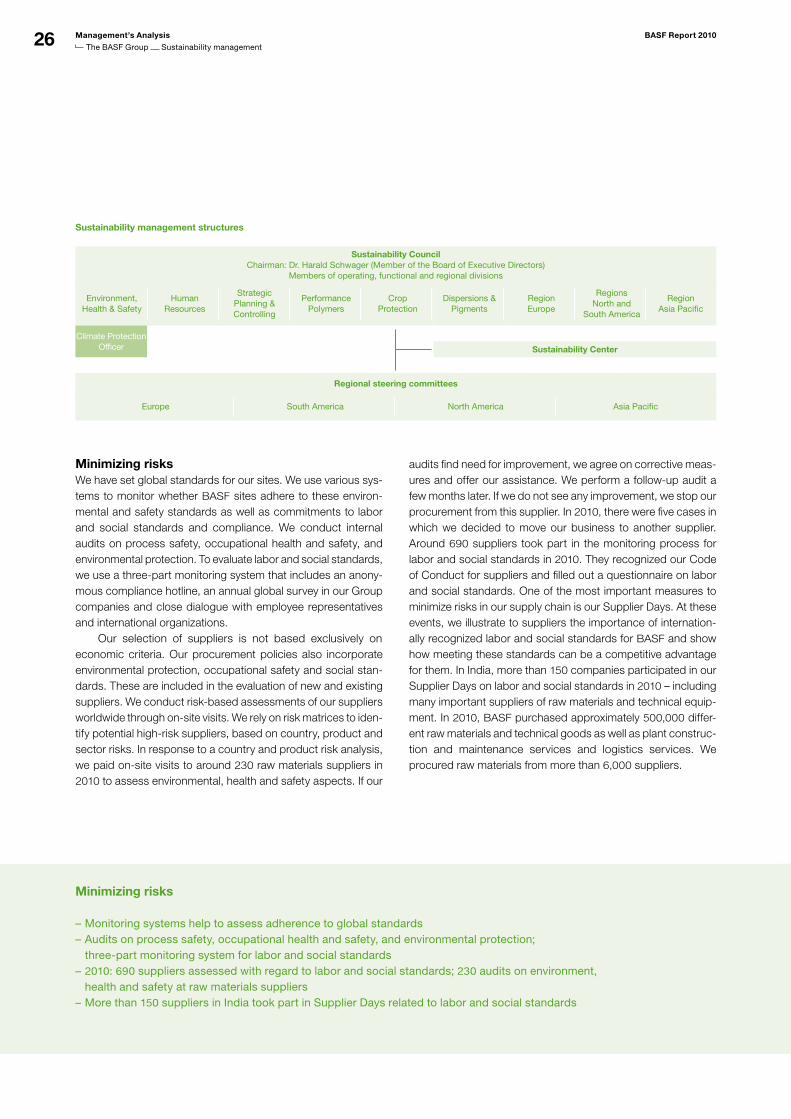
26 Management’s Analysis BASF Report 2010
The BASF Group Sustainability management
Minimizing risks We have set global standards for our sites. We use various sys-tems to monitor whether BASF sites adhere to these environ-mental and safety standards as well as commitments to labor and social standards and compliance. We conduct internal audits on process safety, occupational health and safety, and environmental protection. To evaluate labor and social standards, we use a three-part monitoring system that includes an anony-mous compliance hotline, an annual global survey in our Group companies and close dialogue with employee representatives and international organizations. Our selection of suppliers is not based exclusively on economic criteria. Our procurement policies also incorporate environmental protection, occupational safety and social stan-dards. These are included in the evaluation of new and existing suppliers. We conduct risk-based assessments of our suppliers worldwide through on-site visits. We rely on risk matrices to iden-tify potential high-risk suppliers, based on country, product and sector risks. In response to a country and product risk analysis, we paid on-site visits to around 230 raw materials suppliers in 2010 to assess environmental, health and safety aspects. If our
audits find need for improvement, we agree on corrective meas-ures and offer our assistance. We perform a follow-up audit a few months later. If we do not see any improvement, we stop our procurement from this supplier. In 2010, there were five cases in which we decided to move our business to another supplier. Around 690 suppliers took part in the monitoring process for labor and social standards in 2010. They recognized our Code of Conduct for suppliers and filled out a questionnaire on labor and social standards. One of the most important measures to minimize risks in our supply chain is our Supplier Days. At these events, we illustrate to suppliers the importance of internation-ally recognized labor and social standards for BASF and show how meeting these standards can be a competitive advantage for them. In India, more than 150 companies participated in our Supplier Days on labor and social standards in 2010 – including many important suppliers of raw materials and technical equip-ment. In 2010, BASF purchased approximately 500,000 differ-ent raw materials and technical goods as well as plant construc-tion and maintenance services and logistics services. We procured raw materials from more than 6,000 suppliers.
Minimizing risks
Monitoring systems help to assess adherence to global standards –Audits on process safety, occupational health and safety, and environmental protection; –threepart monitoring system for labor and social standards2010: – 690 suppliers assessed with regard to labor and social standards; 230 audits on environment, health and safety at raw materials suppliersMore than – 150 suppliers in India took part in Supplier Days related to labor and social standards
Sustainability CouncilChairman: Dr. Harald Schwager (Member of the Board of Executive Directors)
Members of operating, functional and regional divisions
Regional steering committees
Sustainability Center
Environment, Health & Safety
Human Resources
Strategic Planning & Controlling
Performance Polymers
Crop Protection
Dispersions & Pigments
Region Europe
RegionsNorth and
South America
Region Asia Pacific
Europe South America North America Asia Pacific
Sustainability management structures
Climate ProtectionOfficer
27BASF Report 2010 Management’s Analysis
The BASF Group Sustainability management
BASF Group’s purchasing volume in 2010 amounted to €30.1 bil-lion, excluding merchandise.
Information on compliance can be found from page 120 onward; for more on the monitoring system to evaluate labor and social standards, see basf.com/monitoring_e
For more on supply chain management, see basf.com/supplychain
Milestones 2010Sustainability management
Materiality analysis revised –450th EcoEfficiency Analysis carried out since 1996 –Supplier Days on labor and social standards –
Business opportunities with sustainabilityWith sustainability, we want to set ourselves apart from our com-petitors. We bring our expertise into customer relationships through the initiative “Success – Added Value through Sustain-ability.” Here, our business units investigate how they can broaden and strengthen relationships to customers and suppli-ers with sustainability. One example is our S.E.T. (Sustainability, Eco-efficiency, Traceability) initiative, which helps food and feed producers to develop sustainable products. BASF developed the Eco-Efficiency Analysis as a strategic tool for the evaluation of products and processes. It compares the economic benefits of a product to its impact on the environ-ment throughout its entire life cycle - from raw materials extrac-tion, to its use, and finally, to its recycling or disposal. The cat-egories examined include resource and energy consumption as well as emissions. Since 1996, the Eco-Efficiency Analysis has been helping us and our customers to identify areas of poten-tial economic or environmental improvement for products and processes. We performed the 450th Eco-Efficiency Analysis in 2010. In the Socio-Eco-Efficiency Analysis SEEBALANCE®, we expanded the Eco-Efficiency Analysis to include social impacts.
It incorporates additional social criteria such as the number of jobs and spending on research and development. In 2010, we started a new project that includes elements that will be partic-ularly important for agriculture in the future, for example, biodi-versity and soil protection issues such as erosion prevention; a special focus can also be on emerging markets. In order to develop a comprehensive assessment of the key criteria for sus-tainable agriculture, we are in dialogue around the world with various stakeholders such as environmental organizations and farmers’ representatives. Together with the GTZ (German governmental agency for international cooperation) and local partners, BASF has been sharing its sustainability expertise through the Espaço ECO foundation in Brazil for the past five years. Espaço ECO pro-motes sustainable development by transferring knowledge and technology, with a focus on Eco-Efficiency Analysis, environ-mental education and reforestation projects. The foundation helps organizations in South America use sustainability to be globally competitive. The initiative has reached over 94,000 peo-ple since 2005.
For more on the S.E.T. initiative, see www.set-initiative.com
For more on Espaço ECO, see www.espacoeco.org
For more on Eco-Efficiency Analysis and SEEBALANCE, see basf.com/eco-efficiency and page 96
For more on Responsible Care, see page 91
For more on product stewardship, see page 101 onward
For more on opportunities with climate protection products, see page 96
Stakeholder engagementOur most important stakeholders include customers, employ-ees, shareholders, neighbors, employee representatives, policy makers, media, non-governmental organizations and business partners. Our exchange with these stakeholder groups helps us to identify important issues and the ensuing opportunities and risks for BASF. The results of our dialogue with stakeholders feed into our issue management for sustainability.
Business opportunities with sustainability
Differentiation through the initiative “Success – Added Value through Sustainability”EcoEfficiency Analysis and – SEEBALANCE as strategic tools for evaluating the sustainability of products and processesSustainability is a component of innovative business strategies –For more on Success, see basf.com/success_e
28 Management’s Analysis BASF Report 2010
The BASF Group Sustainability management
We have a particular responsibility to our neighbors. We discuss current issues with them in 73 Community Advisory Panels (CAPs). The CAP at our site in Tarragona, Spain, for example, was established 15 years ago. The agenda here in 2010 included product safety, the implementation of the European chemical regulation and plant biotechnology. BASF also uses social media to intensify direct contact with its stakeholders. One example is the German-language dialogue platform www.amflora.de, where we respond to critical ques-tions about plant biotechnology. We aim to address skepticism in the public debate by pro-viding transparency about our activities. The trust of consum-ers, non-governmental organizations, policy makers and the general public is especially important for the successful intro-duction of products based on new technologies. We enter the political and public debate at an early stage of technological development, for example, with regard to nanotechnology. Since 2004, we have been involved in national and international dia-logues on nanotechnology. In our Dialogue Forum Nano in 2010, we met with representatives from environmental associations, consumer protection organizations and churches to discuss how to make communication transparent throughout the entire life cycle of a product. We also support the implementation of the Global Product Strategy (GPS) of the International Council of Chemical Associ-ations (ICCA). GPS aims to establish global standards and practices to improve the safe management of chemical sub-stances, especially in developing countries, and contributes to implementing the Responsible Care Global Charter. GPS offers capacity-building workshops for small and medium-sized en-terprises that are currently being carried out in Europe in cooperation with the European Commission as well as in devel-oping countries in Asia and North Africa. BASF experts are participating as trainers in these locations.
Good relationships with our customers and their satisfaction with our performance are key to our long-term business suc-cess. We measure customer satisfaction with our Non Confor-mance Management (NCM) system. In this centralized system for all units, we record and investigate problems with our prod-ucts and processes that arise for our customers. This helps us to learn from mistakes, reduce costs and continuously improve our performance. In 2010, we linked our NCM system more closely with our supply chain and finance processes. In our perspectives initiative, customers and BASF employ-ees analyze existing business relationships and new business opportunities, with the aim of further strengthening customer relationships. In a cross-divisional workshop in 2010, for exam-ple, we explored new potential for cooperation with Trelleborg Offshore, a manufacturer of insulating material for deepwater oil pipelines. Our focus was on improved production techniques and the use of innovative technologies to increase the efficiency of processes and generate more sales and earnings. In 2010, 2,800 employees took part in special training and workshops on topics related to marketing and sales. Our customers also honored our performance in 2010: In India, for example, BASF received awards from Tata Motors, Mahindra & Mahindra, and Honda Motorcycle and Scooter India (HMSI).
For more on the dialogue on plant biotechnology, see www.amflora.de (only available in German) and basf.com/dialogue_plantbiotechnology
For more on nanotechnology, see basf.com/dialogue-nanotechnology
Stakeholder engagement
BASF’s most important stakeholders include customers, employees, shareholders, neighbors, –employee representatives, policy makers, media, nongovernmental organizations and business partners Dialogue with stakeholders helps us identify important issues and the ensuing opportunities and risks –73 – Community Advisory Panels around the worldDialogue relating to new technologies provides information and creates trust –For more on the stakeholder dialogue, see basf.com/dialogue
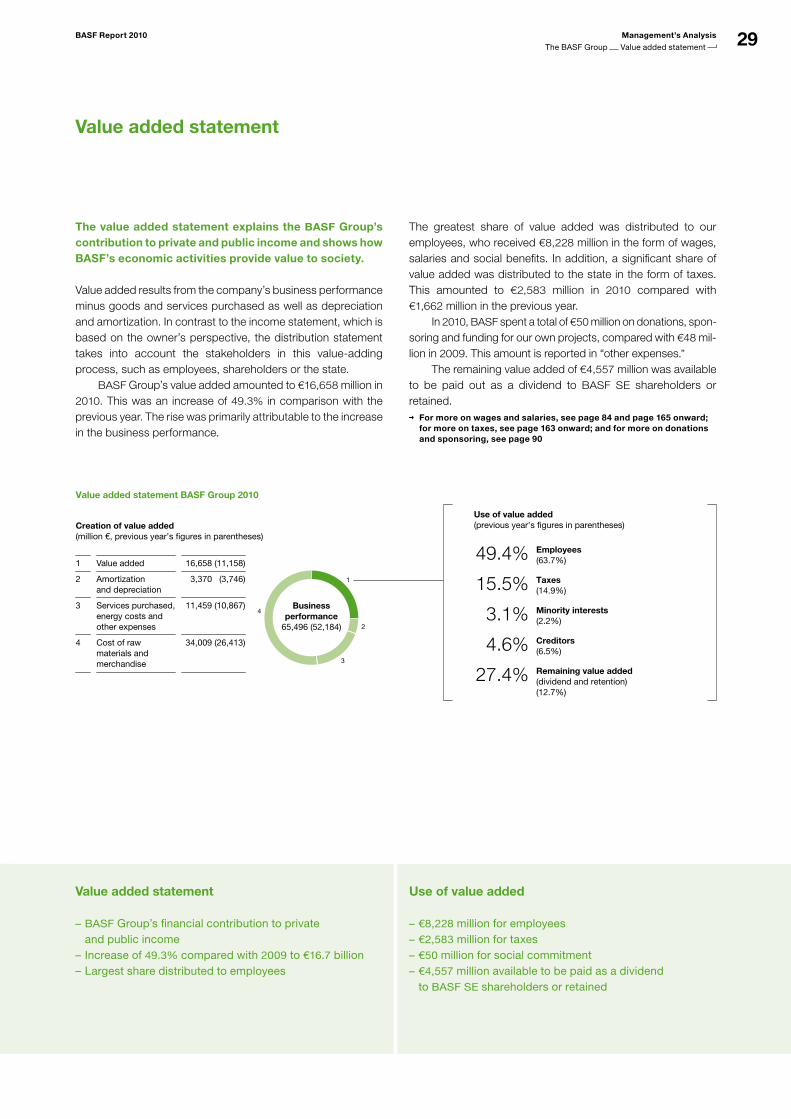
29BASF Report 2010 Management’s Analysis
The BASF Group Value added statement
Value added statement
The value added statement explains the BASF Group’s contribution to private and public income and shows how BASF’s economic activities provide value to society.
Value added results from the company’s business performance minus goods and services purchased as well as depreciation and amortization. In contrast to the income statement, which is based on the owner’s perspective, the distribution statement takes into account the stakeholders in this value-adding process, such as employees, shareholders or the state. BASF Group’s value added amounted to €16,658 million in 2010. This was an increase of 49.3% in comparison with the previous year. The rise was primarily attributable to the increase in the business performance.
The greatest share of value added was distributed to our employees, who received €8,228 million in the form of wages, salaries and social benefits. In addition, a significant share of value added was distributed to the state in the form of taxes. This amounted to €2,583 million in 2010 compared with €1,662 million in the previous year. In 2010, BASF spent a total of €50 million on donations, spon-soring and funding for our own projects, compared with €48 mil-lion in 2009. This amount is reported in “other expenses.” The remaining value added of €4,557 million was available to be paid out as a dividend to BASF SE shareholders or retained.
For more on wages and salaries, see page 84 and page 165 onward; for more on taxes, see page 163 onward; and for more on donations and sponsoring, see page 90
Value added statement Use of value added
BASF – Group’s financial contribution to private and public incomeIncrease of – 49.3% compared with 2009 to €16.7 billion Largest share distributed to employees –
€8,228 – million for employees€2,583 – million for taxes€50 – million for social commitment€4,557 – million available to be paid as a dividend to BASF SE shareholders or retained
1
2
3
4
Creation of value added(million €, previous year’s figures in parentheses)
Value added statement BASF Group 2010
Businessperformance
65,496 (52,184)
Use of value added(previous year’s figures in parentheses)
Employees(63.7%) 49.4%Taxes(14.9%) 15.5%Minority interests(2.2%) 3.1%Creditors(6.5%) 4.6%Remaining value added (dividend and retention)(12.7%)
27.4%
1 Value added 16,658 (11,158)
2 Amortization 3,370 (3,746) and depreciation
3 Services purchased, 11,459 (10,867) energy costs and other expenses
4 Cost of raw 34,009 (26,413) materials and merchandise
wird aktualisiert
wird aktualisiert
wird aktualisiert
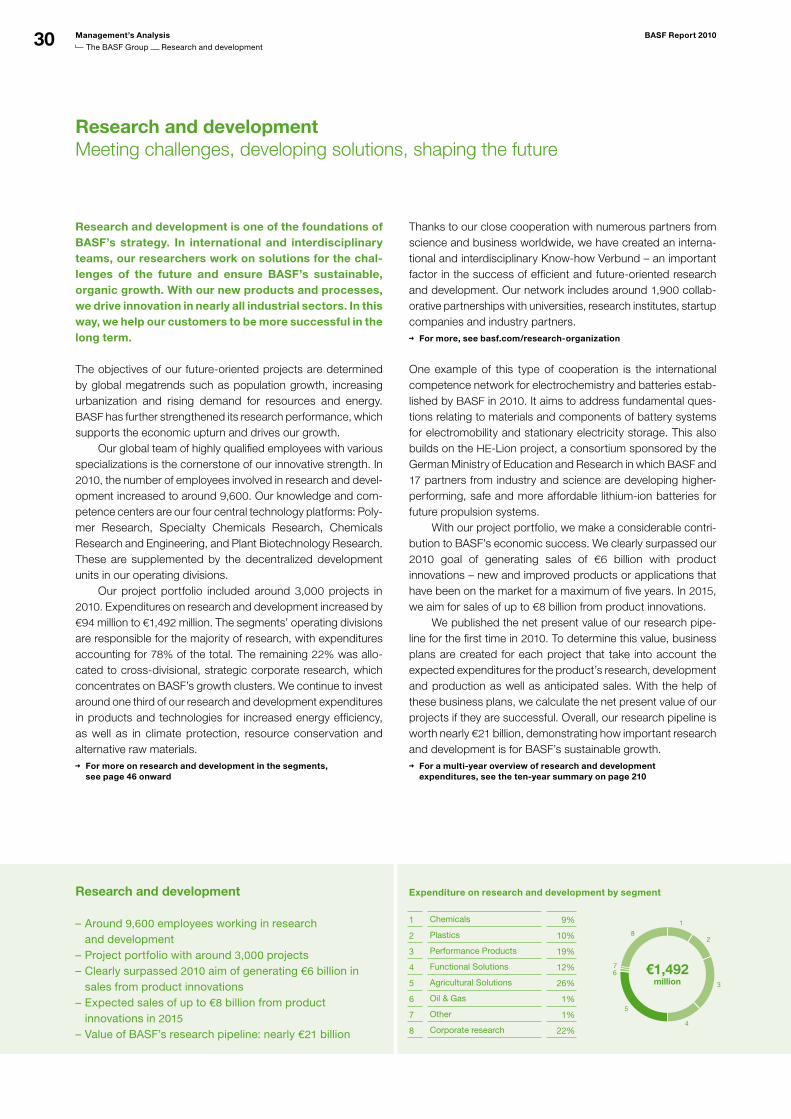
30 Management’s Analysis BASF Report 2010
The BASF Group Research and development
Research and developmentMeeting challenges, developing solutions, shaping the future
Research and development is one of the foundations of BASF’s strategy. In international and interdisciplinary teams, our researchers work on solutions for the chal-lenges of the future and ensure BASF’s sustainable, organic growth. With our new products and processes, we drive innovation in nearly all industrial sectors. In this way, we help our customers to be more successful in the long term.
The objectives of our future-oriented projects are determined by global megatrends such as population growth, increasing urbanization and rising demand for resources and energy. BASF has further strengthened its research performance, which supports the economic upturn and drives our growth. Our global team of highly qualified employees with various specializations is the cornerstone of our innovative strength. In 2010, the number of employees involved in research and devel-opment increased to around 9,600. Our knowledge and com-petence centers are our four central technology platforms: Poly-mer Research, Specialty Chemicals Research, Chemicals Research and Engineering, and Plant Biotechnology Research. These are supplemented by the decentralized development units in our operating divisions. Our project portfolio included around 3,000 projects in 2010. Expenditures on research and development increased by €94 million to €1,492 million. The segments’ operating divisions are responsible for the majority of research, with expenditures accounting for 78% of the total. The remaining 22% was allo-cated to cross-divisional, strategic corporate research, which concentrates on BASF’s growth clusters. We continue to invest around one third of our research and development expenditures in products and technologies for increased energy efficiency, as well as in climate protection, resource conservation and alternative raw materials.
For more on research and development in the segments, see page 46 onward
Thanks to our close cooperation with numerous partners from science and business worldwide, we have created an interna-tional and interdisciplinary Know-how Verbund – an important factor in the success of efficient and future-oriented research and development. Our network includes around 1,900 collab-orative partnerships with universities, research institutes, startup companies and industry partners.
For more, see basf.com/research-organization
One example of this type of cooperation is the international competence network for electrochemistry and batteries estab-lished by BASF in 2010. It aims to address fundamental ques-tions relating to materials and components of battery systems for electromobility and stationary electricity storage. This also builds on the HE-Lion project, a consortium sponsored by the German Ministry of Education and Research in which BASF and 17 partners from industry and science are developing higher-performing, safe and more affordable lithium-ion batteries for future propulsion systems. With our project portfolio, we make a considerable contri-bution to BASF’s economic success. We clearly surpassed our 2010 goal of generating sales of €6 billion with product innovations – new and improved products or applications that have been on the market for a maximum of five years. In 2015, we aim for sales of up to €8 billion from product innovations. We published the net present value of our research pipe-line for the first time in 2010. To determine this value, business plans are created for each project that take into account the expected expenditures for the product’s research, development and production as well as anticipated sales. With the help of these business plans, we calculate the net present value of our projects if they are successful. Overall, our research pipeline is worth nearly €21 billion, demonstrating how important research and development is for BASF’s sustainable growth.
For a multi-year overview of research and development expenditures, see the ten-year summary on page 210
Research and development
Around – 9,600 employees working in research and developmentProject portfolio with around – 3,000 projectsClearly surpassed – 2010 aim of generating €6 billion in sales from product innovations Expected sales of up to – €8 billion from product innovations in 2015 Value of BASF’s research pipeline: nearly – €21 billion
Expenditure on research and development by segment
1 Chemicals 9%
2 Plastics 10%
3 Performance Products 19%
4 Functional Solutions 12%
5 Agricultural Solutions 26%
6 Oil & Gas 1%
7 Other 1%
8 Corporate research 22%
1
2
3
4
67
8
5
€1,492million
wird a
ktual
isier
t
31BASF Report 2010 Management’s Analysis
The BASF Group Research and development
BASF the leader in Patent Asset Index
Patents are an important measure of research performance. They serve as indicators of long-term competitiveness and are a sign of a company’s innovative strength. The Patent Asset Index™ developed at the Otto Beisheim School of Management (WHU) near Koblenz, Germany, enabled us to compare our patent portfolio with those of other companies across the industry in 2009 for the first time. As in the previous year, we took first place in this ranking in 2010. This makes us one of the most innovative companies in the global chemical industry. In 2010, BASF filed around 1,100 patents worldwide.
BASF’s growth clusters Chemistry is a cross-sectional technology that helps us find solutions for the challenges arising from global megatrends. We group our research projects in the growth clusters plant biotechnology, white biotechnology, raw material change, energy management, and nanotechnology. In these clusters, the focus is on technologies and markets of the future. One of the core activities of the plant biotechnology growth cluster is to develop crops that offer farmers better and more reliable harvests – in order to allow the available farmland to produce food for a growing population. Our activities include a partnership with Monsanto to develop genetically modified plants that are more stress-tolerant and higher-yielding. The first product of this cooperation is a drought-tolerant corn (maize), which is scheduled to be introduced on the U.S. market in 2012. Our other partners in the development of important crops include Bayer CropScience (rice), the research center Centro de Tecnologia Canavieira (sugarcane) and KWS Saat AG (sugar beet). In the white biotechnology growth cluster, we use innovative technologies for biocatalysis and fermentation. For example, we are cooperating with our partner Solix Biofuels to research the production of specialty chemicals using algae.
Solix is using its own technology to test various kinds of algae for BASF. Algae are able to absorb carbon dioxide (CO2) during their life cycle and integrate it into their products of metabolism. This type of project enhances our technology portfolio in the field of industrial biotechnology. In the raw material change growth cluster, we are look-ing for alternatives to crude oil as a raw material for the chemi-cal industry. In addition to crude oil, in the long term, natural gas, renewable raw materials, and even CO2 could become starting materials for our value-adding chains, thus diversifying our raw materials sources. We are developing new technologies to use CO2 in the production of plastics, plastic precursors and impor-tant intermediates. The growing demand for energy is a driving factor behind our energy management growth cluster. Around 20% of global electricity consumption is used to generate light. We are working on the development of new materials for energy-saving light solutions based on organic light-emitting diodes (OLEDs). In a joint project funded by the German Federal Ministry of Education and Research, we are developing a highly efficient and stable blue emitter system – a key element for new OLED light sources. Sustainable system solutions for the automotive and construction industries are one focus for our nanotechnology growth cluster. Examples include heat management systems with intelligent infrared pigments as well as new foams that reg-ulate the heat absorption and release in cars or buildings. As a result, heating and cooling technology requires less energy. The success of our projects encourages us to continue to address global megatrends with our research activities. Research and development are essential for BASF’s long-term growth and they make an important contribution to sustainable development.
BASF’s growth clusters
In five growth clusters, we look for solutions to –challenges arising from global megatrendsGrowth clusters: plant biotechnology, white –biotechnology, raw materials change, energy management, and nanotechnologyGrowth clusters concentrate on future technologies –and markets
Patent Asset Index (standardized, as of December 31, 2010)An indicator of companies’ innovative strength1
BASF 100
Bayer 74
DuPont 66
Dow Chemical 64
Evonik 29
wird aktualisiert
Source: PatentSight; methodology: Prof. Ernst, WHU1 Based on the portfolio size (number of patent families) and the competitive
impact (number of citations in other patents and market coverage)
32 Management’s Analysis BASF Report 2010
The business year at BASF Group Trends in the global economy
Gross domestic product 2010Real change compared with the previous year
World 3.9%
wird a
ktual
isier
t
E.U. 1.9%
United States 3.0%
Asia (excl. Japan) 9.2%
Japan 3.5%
South America 6.1%
Trends in the global economy
There was a dynamic recovery in the global economy in all regions in 2010 following the severe recession in the previous year. The strong upturn in the first half of the year was followed by weaker growth in the second half. Global gross domestic product rose significantly overall in comparison with the previous year (+3.9%) and was higher than our original 2010 forecast (+2.7%).
In 2010, the strong growth in global gross domestic product (+3.9%) was mainly a result of the dynamic economic develop-ment in emerging markets in Asia and South America, the positive effects of government economic stimulus programs and the restocking of industrial inventories. Other growth impetus resulted from the worldwide rise in demand for capital goods and the marked revival of international trade, which particularly allowed export-oriented economies such as Germany and Japan to recover quickly.
Development by regionGiven the fiscal problems of some European countries, there were major discrepancies in the growth rates in Europe in 2010. Overall, gross domestic product increased sharply in the first half of the year, but growth weakened in the second half. Pri-vate consumption, in particular, slowed following the end of the fiscal stimulus programs. In contrast to the previous year, growth in gross domestic product in the European Union recovered (2009: –4.2%; 2010: +1.9%). There was a significant increase in industrial capacity utilization, which had fallen as a result of the economic crisis. Germany especially benefited from the global economic recovery: Strong foreign demand for capital goods led to a sharp increase in net exports and therefore to above-average growth (+3.6%).
In the United States, the average economic output in 2010 increased again markedly (+3.0%). Strong impetus was gener-ated by expansive fiscal and monetary policies. Relatively high unemployment hindered a recovery in private consump-tion. The continued low level of construction investment slowed overall economic growth. Uncertainties on the international capital and currency markets led over the course of the year to significant fluctuations in the value of the U.S. dollar versus other currencies. Economic output in Asia (excluding Japan) rose sharply in 2010 (+9.2%), driven in particular by China’s dynamic economic growth (+10.3%). The Chinese government’s massive economic stimulus and infrastructure programs strengthened the country’s economic development. Demand for consumer and capital goods in China acted as stimulus for the other econ-omies in Eastern and South East Asia. India had been relatively unaffected by the economic crisis and also experienced strong growth in 2010 (+10.6%).
While the growth rate in Japan was strong in the first quarter of 2010, the economy stagnated toward the end of the year. The significant rise in the value of the yen had a negative impact on foreign demand in the second half of the year. The end of fiscal stimulus programs also had a detrimental effect on economic growth. Japan’s export sector benefited from Chinese demand. Gross domestic product rose noticeably in comparison with the previous year (+3.5%). Growth in South America was considerable in 2010 (+6.1%). Economic recovery was powered by a renewed increase in raw materials exports, ongoing solid consumer demand and increasing foreign direct investment. Regional growth drivers were primarily increasing domestic demand and investing activity in Brazil.
For the forecast for the economic environment in 2011, see page 112 onward
Trends in the global economy in 2010
Significant yearonyear increase in global gross –domestic product (+3.9%), surpassing our original forecast (+2.7%)
Slight growth slowdown in the second half of the year –Economic growth supported by the dynamic develop –ment of emerging markets in Asia and South America, economic stimulus programs and inventory restocking
33BASF Report 2010 Management’s Analysis
The business year at BASF Group Trends in key customer industries
Trends in key customer industries
Following a sharp drop in the previous year (–8.1%), global industrial production grew considerably in 2010 (+8.9%). The recovery was more pronounced than we had fore-cast (+4.9%). The main reasons for the economic upturn included the strong growth in Asia as well as the fiscal and monetary stimulus programs around the world. In Asia’s emerging markets, industrial production (+14.5%) grew twice as fast as in the OECD industrialized countries (+7.2%).
The automotive industry benefited from government stimulus programs until mid-2010. Thanks to robust economic growth in Asia, the industry also experienced a strong increase in demand. The number of automobiles produced worldwide rose significantly (+21.5%). Following two weak years, U.S. automo-tive production grew very sharply (+35.0%). In Europe, the market also posted a considerable increase over the pre vious year (+8.4%).
The construction industry declined worldwide (–1.3%). It decreased again compared with the previous year, in particular in the United States (–11.0%), Japan (–8.0%) and the European Union (–3.6%). Government infrastructure projects were not able to offset the declines in housing and commercial building activity. In the emerging markets of Asia, on the other hand, construction activity continued to grow strongly (+8.2%). Thanks to catch-up effects worldwide, the electrical industry recovered markedly (+12.0%). Compared with the previous year, there was a significant increase in production in the industrialized countries (+10.1%), in Japan (+22.1%) and in the emerging markets of Asia (+19.0%).
The information and communication technology indus-try (ICT) also experienced a major recovery, in particular as a result of high demand for entertainment electronics. On account of the strong growth (+16.6%), production returned to the level seen before the economic crisis after just one year. In the textiles industry, the global trend to relocate pro-duction to Asia continued. Starting from a low production level, the industrialized countries posted positive growth (+6.4%) for
the first time in seven years. In Asia (excluding Japan), produc-tion grew considerably (+10.5%). Globally, it increased sharply (+8.8%). The paper industry grew worldwide by 7.9%. This was pri-marily attributable to the demand for packaging paper. Region-ally, growth was driven by the emerging markets of Asia (+13.4%). Production in industrialized countries was also significantly higher (+4.4%).
There was above-average growth in the food industry (+3.9%). Production rose measurably in both industrialized coun-tries (+2.5%) and emerging markets (+6.9%).
Agriculture grew considerably worldwide (+4.2%). In industrialized countries, production increased slightly (+1.7%). In emerging markets, favorable weather conditions in China and India led to significant overall growth (+5.5%).
For the forecast for the economic environment in 2011, see page 112 onward
Growth in key customer industries in 2010 Real change compared with the previous year
Industries total OECD 7.2%
wird a
ktual
isier
t
World 8.9%
Automotive OECD 19.6%
(perunit basis) World 21.5%
Construction OECD –5.4%
World –1.3%
Electrical OECD 10.1%
industry World 12.0%
Information and OECD 16.6%
communication World 16.6%
Textiles OECD 6.4%
World 8.8%
Paper OECD 4.4%
World 7.9%
Food OECD 2.5%
World 3.9%
Agriculture OECD 1.7%
World 4.2%
Development of industrial production in 2010
Sharp increase in global industrial production – (+8.9%); impetus from global economic stimulus programsMajor increase in automotive production – (+21.5%) owing to higher demand; construction industry declines globally (–1.3%)
Significant increases in production in electrical, – ICT, textiles, paper and food industries as well as in agriculture
BASF sales by industryDirect customers
> 15% Chemicals
10 –15% Automotive | Utilities
5 –10% Construction | Agriculture | Plastics industry | Oil industry
< 5% Electrical/Electronics | Furniture | Paper
10 –15% Other industries
34 Management’s Analysis BASF Report 2010
The business year at BASF Group Trends in the chemical industry
Trends in the chemical industry
There was a strong upturn in the chemical industry in 2010: Following negative growth rates in the previous two years, global chemical production in 2010 again reached the pre-crisis level. The first half of the year was particularly characterized by an exceptionally strong recovery. Growth became less dynamic in the second half. Global chemical production (excluding pharmaceuticals) grew by 9.3%.
Due to high demand and inventory restocking in key customer industries, global chemical production (excluding pharmaceu-ticals) in 2010 reached the level seen before the economic crisis. In industrialized countries such as Germany and Japan, production was boosted by dynamic export growth, which was better than expected. At the beginning of the upturn, there were worldwide production shortages in the chemical industry because plants had to be put back into operation again. Compared with other industrialized countries, chemical pro-duction in the European Union grew particularly fast (+10.1%). As a result of the close interconnectedness of the chemical industry with dynamically-growing, export-oriented customer industries, chemical production growth was particularly substantial in Germany (+17.7%). Japan also experienced exceptionally high growth (+8.8%). In the United States, the strength of the U.S. dollar at times had a damping effect on the growth dynamic (+5.0%). In contrast, chemical production grew strongly in South America (+6.4%) and Asia (excluding Japan) (+13.0%).
Chemical production (excluding pharmaceuticals) in 2010Real change compared with the previous year
World 9.3%
wird a
ktual
isier
t
E.U. 10.1%
United States 5.0%
Asia (excl. Japan) 13.0%
Japan 8.8%
South America 6.4%
The crude oil price for Brent blend increased in 2010; the fluctuations over the course of the year were relatively moder-ate. The average monthly prices ranged from $73 per barrel to $92 per barrel. The economic recovery and stronger demand led to rising prices over the course of the year. The average annual oil price was around $80 per barrel, an increase of around 30% over the previous year’s level and higher than the average price in the pre-crisis year 2007.
Average monthly prices for the chemical raw material naphtha ranged over the course of the year from a low of $620 per metric ton in July to a high of more than $840 per metric ton in December. The average annual price of naphtha was $710 per metric ton, an increase of around 35% over the previous year’s level. In 2010, the average price of natural gas in the United States ranged between $3/mbtu and $6/mbtu. The average annual price was around $4/mbtu, slightly higher than the 2009 average. In Europe, the average gas price fell slightly compared with the previous year and amounted to around $8/mbtu.
For the forecast for the economic environment in 2011, see page 112 onward
Trends in the chemical industry in 2010
Global chemical production (excluding pharmaceuticals) –grows by 9.3%; reaching precrisis level againCompared with other industrialized countries, –very strong increase in chemical production in the European Union (+10.1%)
Price of Brent blend crude oil increased in – 2010; relatively moderate fluctuations
Price trends for crude oil (Brent blend) and naphtha (US$/barrel, US$/metric ton)
15
30
45
75
60
90
105
120
135
150
300
450
600
750
900
1,050
1,200
Oil spot price (Brent blend) in US$/barrelNaphtha spot price in US$/metric ton
US$/-metric ton
US$/bbl
2010200920082007200615
30
45
75
60
90
105
120
135
20102009200820072006150
300
450
600
750
900
1.050
1.200
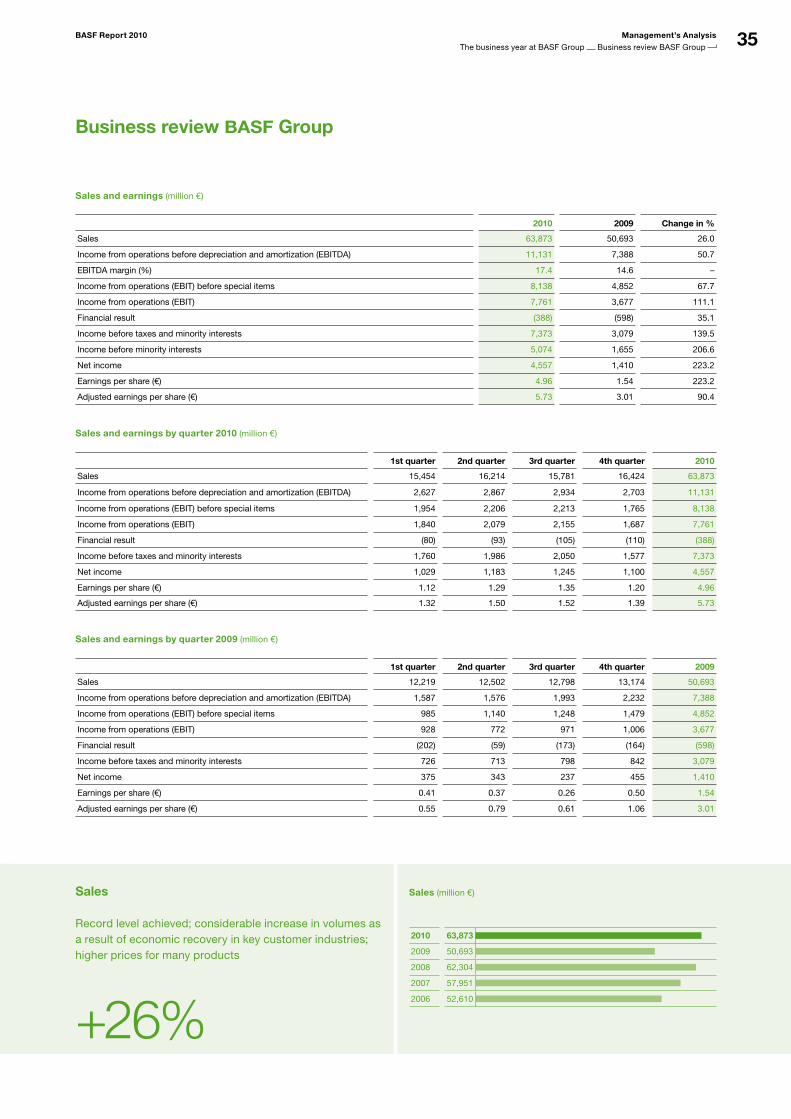
35BASF Report 2010 Management’s Analysis
The business year at BASF Group Business review BASF Group
Business review BASF Group
Sales (million €)
2010 63,873
2009 50,693
2008 62,304
2007 57,951
2006 52,610
wird aktualisiert
Sales and earnings (million €)
2010 2009 Change in %
Sales 63,873 50,693 26.0
Income from operations before depreciation and amortization (EBITDA) 11,131 7,388 50.7
EBITDA margin (%) 17.4 14.6 –
Income from operations (EBIT) before special items 8,138 4,852 67.7
Income from operations (EBIT) 7,761 3,677 111.1
Financial result (388) (598) 35.1
Income before taxes and minority interests 7,373 3,079 139.5
Income before minority interests 5,074 1,655 206.6
Net income 4,557 1,410 223.2
Earnings per share (€) 4.96 1.54 223.2
Adjusted earnings per share (€) 5.73 3.01 90.4
Sales and earnings by quarter 2010 (million €)
1st quarter 2nd quarter 3rd quarter 4th quarter 2010
Sales 15,454 16,214 15,781 16,424 63,873
Income from operations before depreciation and amortization (EBITDA) 2,627 2,867 2,934 2,703 11,131
Income from operations (EBIT) before special items 1,954 2,206 2,213 1,765 8,138
Income from operations (EBIT) 1,840 2,079 2,155 1,687 7,761
Financial result (80) (93) (105) (110) (388)
Income before taxes and minority interests 1,760 1,986 2,050 1,577 7,373
Net income 1,029 1,183 1,245 1,100 4,557
Earnings per share (€) 1.12 1.29 1.35 1.20 4.96
Adjusted earnings per share (€) 1.32 1.50 1.52 1.39 5.73
Sales and earnings by quarter 2009 (million €)
1st quarter 2nd quarter 3rd quarter 4th quarter 2009
Sales 12,219 12,502 12,798 13,174 50,693
Income from operations before depreciation and amortization (EBITDA) 1,587 1,576 1,993 2,232 7,388
Income from operations (EBIT) before special items 985 1,140 1,248 1,479 4,852
Income from operations (EBIT) 928 772 971 1,006 3,677
Financial result (202) (59) (173) (164) (598)
Income before taxes and minority interests 726 713 798 842 3,079
Net income 375 343 237 455 1,410
Earnings per share (€) 0.41 0.37 0.26 0.50 1.54
Adjusted earnings per share (€) 0.55 0.79 0.61 1.06 3.01
Sales
Record level achieved; considerable increase in volumes as a result of economic recovery in key customer industries; higher prices for many products
+26%
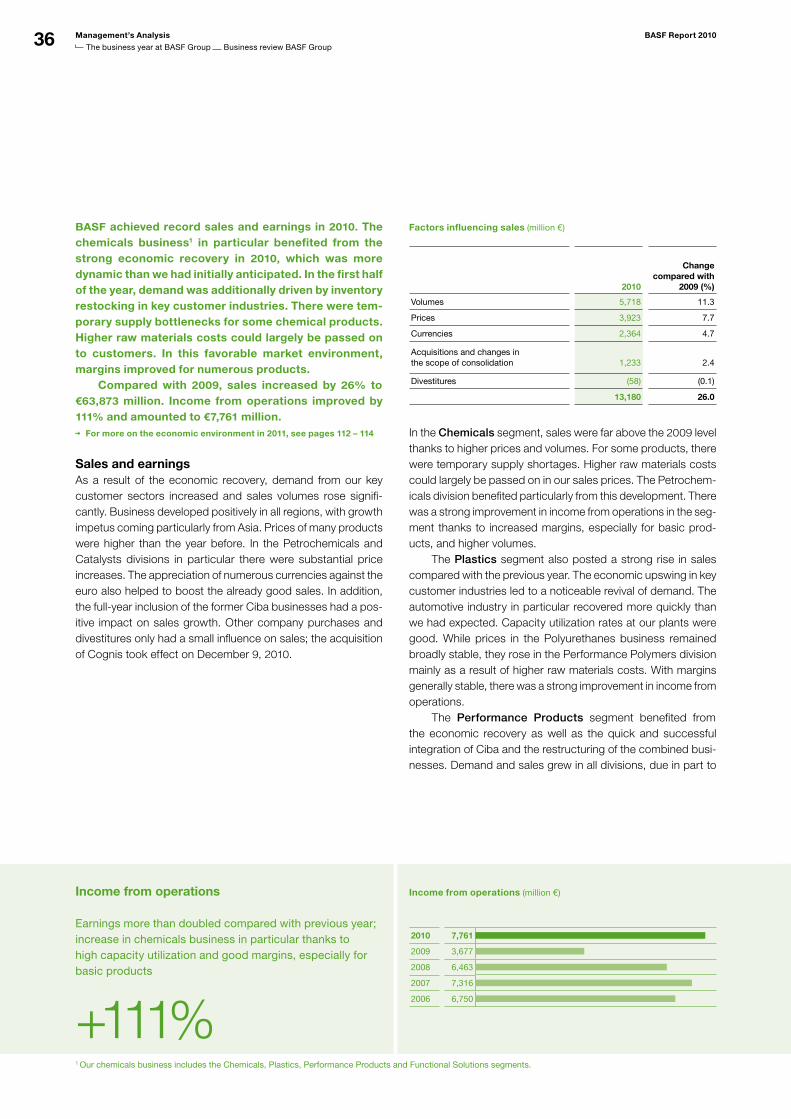
36 Management’s Analysis BASF Report 2010
The business year at BASF Group Business review BASF Group
Income from operations
BASF achieved record sales and earnings in 2010. The chemicals business1 in particular benefited from the strong economic recovery in 2010, which was more dynamic than we had initially anticipated. In the first half of the year, demand was additionally driven by inventory restocking in key customer industries. There were tem-porary supply bottlenecks for some chemical products. Higher raw materials costs could largely be passed on to customers. In this favorable market environment, margins improved for numerous products. Compared with 2009, sales increased by 26% to €63,873 million. Income from operations improved by 111% and amounted to €7,761 million.
For more on the economic environment in 2011, see pages 112 – 114
Sales and earningsAs a result of the economic recovery, demand from our key customer sectors increased and sales volumes rose signifi-cantly. Business developed positively in all regions, with growth impetus coming particularly from Asia. Prices of many products were higher than the year before. In the Petrochemicals and Catalysts divisions in particular there were substantial price increases. The appreciation of numerous currencies against the euro also helped to boost the already good sales. In addition, the full-year inclusion of the former Ciba businesses had a pos-itive impact on sales growth. Other company purchases and divestitures only had a small influence on sales; the acquisition of Cognis took effect on December 9, 2010.
Factors influencing sales (million €)
2010
Change compared with
2009 (%)
Volumes 5,718 11.3
Prices 3,923 7.7
Currencies 2,364 4.7
Acquisitions and changes in the scope of consolidation
1,233
2.4
Divestitures (58) (0.1)
13,180 26.0
In the Chemicals segment, sales were far above the 2009 level thanks to higher prices and volumes. For some products, there were temporary supply shortages. Higher raw materials costs could largely be passed on in our sales prices. The Petrochem-icals division benefited particularly from this development. There was a strong improvement in income from operations in the seg-ment thanks to increased margins, especially for basic prod-ucts, and higher volumes. The Plastics segment also posted a strong rise in sales compared with the previous year. The economic upswing in key customer industries led to a noticeable revival of demand. The automotive industry in particular recovered more quickly than we had expected. Capacity utilization rates at our plants were good. While prices in the Polyurethanes business remained broadly stable, they rose in the Performance Polymers division mainly as a result of higher raw materials costs. With margins generally stable, there was a strong improvement in income from operations. The Performance Products segment benefited from the economic recovery as well as the quick and successful integration of Ciba and the restructuring of the combined busi-nesses. Demand and sales grew in all divisions, due in part to
Earnings more than doubled compared with previous year; increase in chemicals business in particular thanks to high capacity utilization and good margins, especially for basic products
+111%
Income from operations (million €)
2010 7,761
2009 3,677
2008 6,463
2007 7,316
2006 6,750
wird aktualisiert
1 Our chemicals business includes the Chemicals, Plastics, Performance Products and Functional Solutions segments.
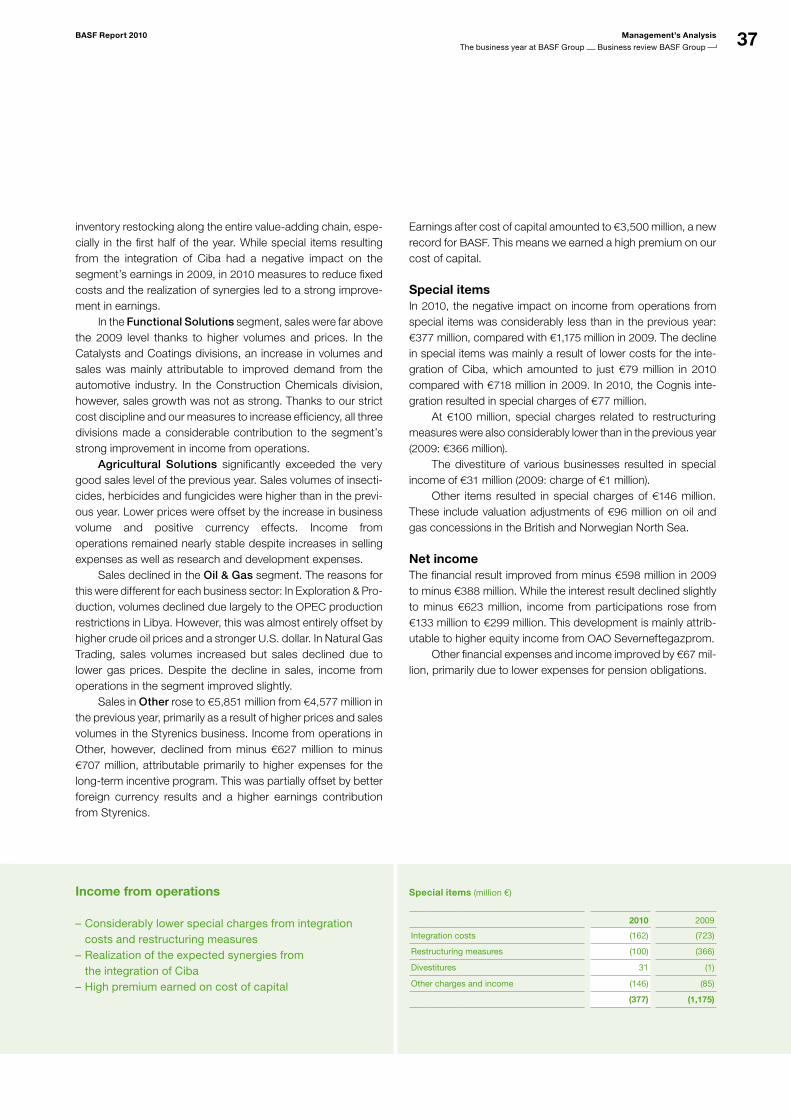
37BASF Report 2010 Management’s Analysis
The business year at BASF Group Business review BASF Group
Income from operations
Considerably lower special charges from integration –costs and restructuring measuresRealization of the expected synergies from –the integration of CibaHigh premium earned on cost of capital –
inventory restocking along the entire value-adding chain, espe-cially in the first half of the year. While special items resulting from the integration of Ciba had a negative impact on the segment’s earnings in 2009, in 2010 measures to reduce fixed costs and the realization of synergies led to a strong improve-ment in earnings. In the Functional Solutions segment, sales were far above the 2009 level thanks to higher volumes and prices. In the Catalysts and Coatings divisions, an increase in volumes and sales was mainly attributable to improved demand from the automotive industry. In the Construction Chemicals division, however, sales growth was not as strong. Thanks to our strict cost discipline and our measures to increase efficiency, all three divisions made a considerable contribution to the segment’s strong improvement in income from operations. Agricultural Solutions significantly exceeded the very good sales level of the previous year. Sales volumes of insecti-cides, herbicides and fungicides were higher than in the previ-ous year. Lower prices were offset by the increase in business volume and positive currency effects. Income from operations remained nearly stable despite increases in selling expenses as well as research and development expenses. Sales declined in the Oil & Gas segment. The reasons for this were different for each business sector: In Exploration & Pro-duction, volumes declined due largely to the OPEC production restrictions in Libya. However, this was almost entirely offset by higher crude oil prices and a stronger U.S. dollar. In Natural Gas Trading, sales volumes increased but sales declined due to lower gas prices. Despite the decline in sales, income from operations in the segment improved slightly. Sales in Other rose to €5,851 million from €4,577 million in the previous year, primarily as a result of higher prices and sales volumes in the Styrenics business. Income from operations in Other, however, declined from minus €627 million to minus €707 million, attributable primarily to higher expenses for the long-term incentive program. This was partially offset by better foreign currency results and a higher earnings contribution from Styrenics.
Earnings after cost of capital amounted to €3,500 million, a new record for BASF. This means we earned a high premium on our cost of capital.
Special itemsIn 2010, the negative impact on income from operations from special items was considerably less than in the previous year: €377 million, compared with €1,175 million in 2009. The decline in special items was mainly a result of lower costs for the inte-gration of Ciba, which amounted to just €79 million in 2010 compared with €718 million in 2009. In 2010, the Cognis inte-gration resulted in special charges of €77 million. At €100 million, special charges related to restructuring measures were also considerably lower than in the previous year (2009: €366 million). The divestiture of various businesses resulted in special income of €31 million (2009: charge of €1 million). Other items resulted in special charges of €146 million. These include valuation adjustments of €96 million on oil and gas concessions in the British and Norwegian North Sea.
Net incomeThe financial result improved from minus €598 million in 2009 to minus €388 million. While the interest result declined slightly to minus €623 million, income from participations rose from €133 million to €299 million. This development is mainly attrib-utable to higher equity income from OAO Severneftegazprom. Other financial expenses and income improved by €67 mil-lion, primarily due to lower expenses for pension obligations.
Special items (million €)
2010 2009
Integration costs (162) (723)
Restructuring measures (100) (366)
Divestitures 31 (1)
Other charges and income (146) (85)
(377) (1,175)
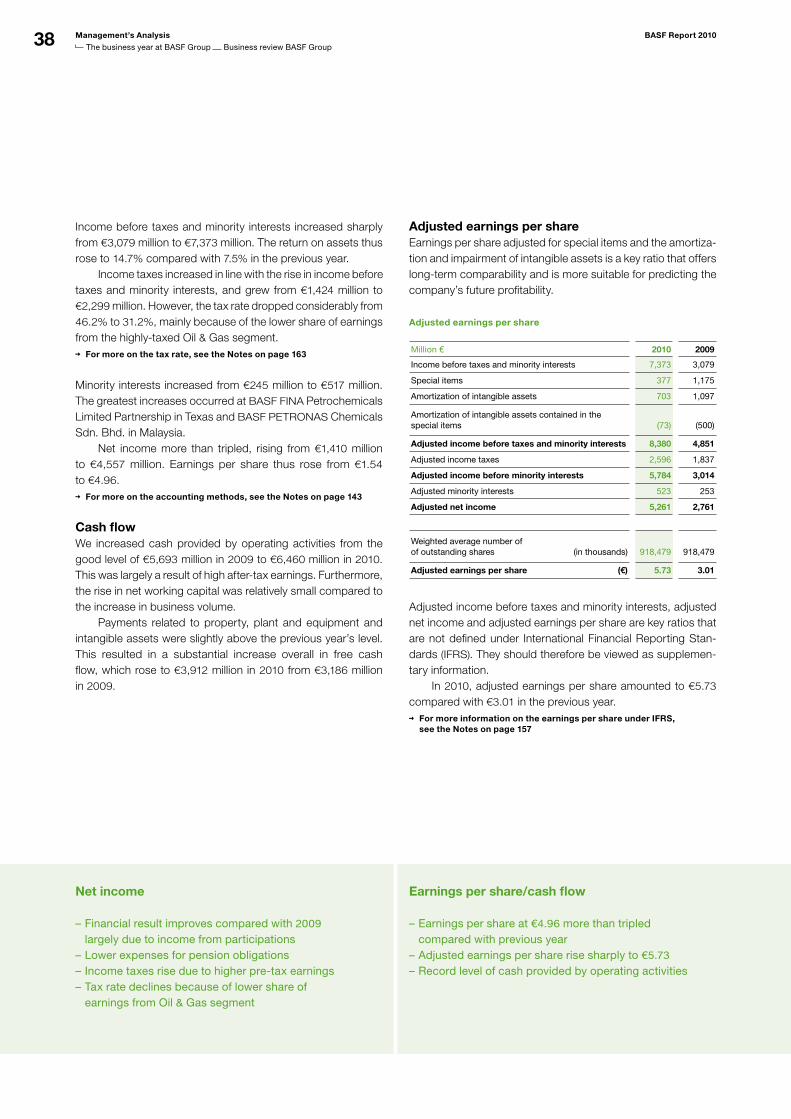
38 Management’s Analysis BASF Report 2010
The business year at BASF Group Business review BASF Group
Net income Earnings per share/cash flow
Financial result improves compared with – 2009 largely due to income from participationsLower expenses for pension obligations –Income taxes rise due to higher pretax earnings –Tax rate declines because of lower share of –earnings from Oil & Gas segment
Earnings per share at – €4.96 more than tripled compared with previous yearAdjusted earnings per share rise sharply to – €5.73
Record level of cash provided by operating activities –
Income before taxes and minority interests increased sharply from €3,079 million to €7,373 million. The return on assets thus rose to 14.7% compared with 7.5% in the previous year. Income taxes increased in line with the rise in income before taxes and minority interests, and grew from €1,424 million to €2,299 million. However, the tax rate dropped considerably from 46.2% to 31.2%, mainly because of the lower share of earnings from the highly-taxed Oil & Gas segment.
For more on the tax rate, see the Notes on page 163
Minority interests increased from €245 million to €517 million. The greatest increases occurred at BASF FINA Petrochemicals Limited Partnership in Texas and BASF PETRONAS Chemicals Sdn. Bhd. in Malaysia. Net income more than tripled, rising from €1,410 million to €4,557 million. Earnings per share thus rose from €1.54 to €4.96.
For more on the accounting methods, see the Notes on page 143
Cash flowWe increased cash provided by operating activities from the good level of €5,693 million in 2009 to €6,460 million in 2010. This was largely a result of high after-tax earnings. Furthermore, the rise in net working capital was relatively small compared to the increase in business volume. Payments related to property, plant and equipment and intangible assets were slightly above the previous year’s level. This resulted in a substantial increase overall in free cash flow, which rose to €3,912 million in 2010 from €3,186 million in 2009.
Adjusted earnings per shareEarnings per share adjusted for special items and the amortiza-tion and impairment of intangible assets is a key ratio that offers long-term comparability and is more suitable for predicting the company’s future profitability.
Adjusted earnings per share
Million € 2010 2009
Income before taxes and minority interests 7,373 3,079
Special items 377 1,175
Amortization of intangible assets 703 1,097
Amortization of intangible assets contained in the special items
(73) (500)
Adjusted income before taxes and minority interests 8,380 4,851
Adjusted income taxes 2,596 1,837
Adjusted income before minority interests 5,784 3,014
Adjusted minority interests 523 253
Adjusted net income 5,261 2,761
Weighted average number of of outstanding shares (in thousands)
918,479 918,479
Adjusted earnings per share (€) 5.73 3.01
Adjusted income before taxes and minority interests, adjusted net income and adjusted earnings per share are key ratios that are not defined under International Financial Reporting Stan-dards (IFRS). They should therefore be viewed as supplemen-tary information. In 2010, adjusted earnings per share amounted to €5.73 compared with €3.01 in the previous year.
For more information on the earnings per share under IFRS, see the Notes on page 157
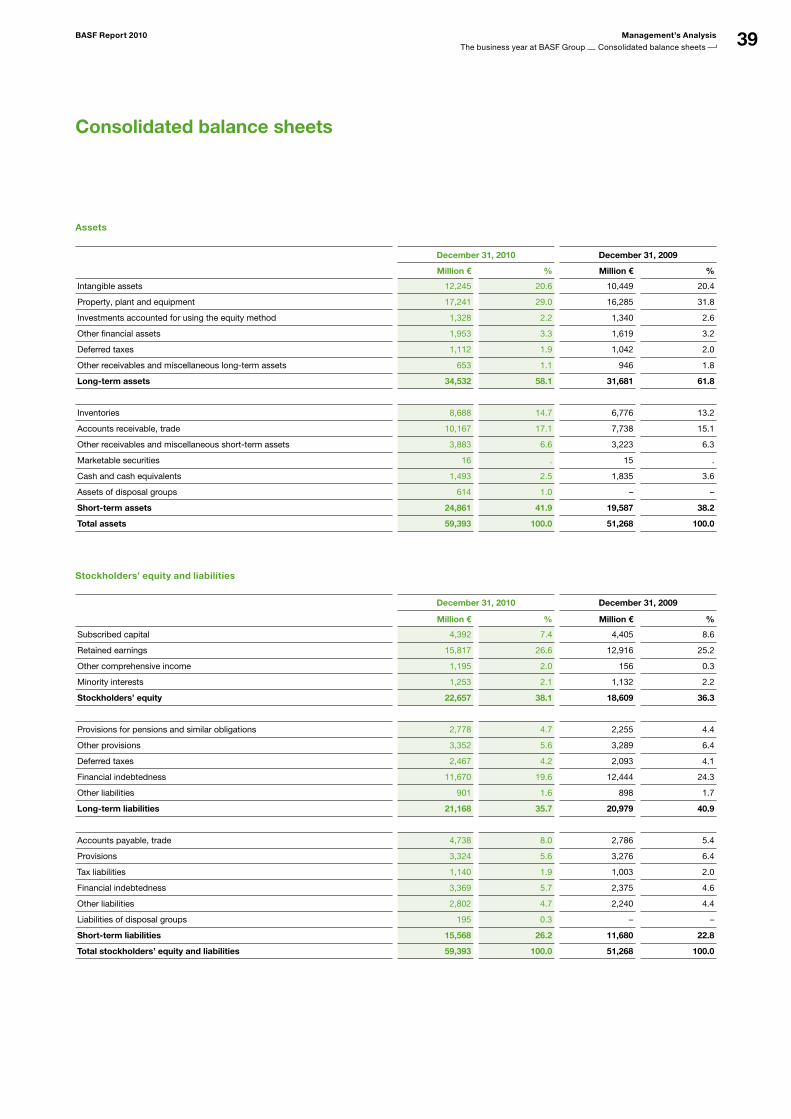
39BASF Report 2010 Management’s Analysis
The business year at BASF Group Consolidated balance sheets
Consolidated balance sheets
Assets
December 31, 2010 December 31, 2009
Million € % Million € %
Intangible assets 12,245 20.6 10,449 20.4
Property, plant and equipment 17,241 29.0 16,285 31.8
Investments accounted for using the equity method 1,328 2.2 1,340 2.6
Other financial assets 1,953 3.3 1,619 3.2
Deferred taxes 1,112 1.9 1,042 2.0
Other receivables and miscellaneous longterm assets 653 1.1 946 1.8
Long-term assets 34,532 58.1 31,681 61.8
Inventories 8,688 14.7 6,776 13.2
Accounts receivable, trade 10,167 17.1 7,738 15.1
Other receivables and miscellaneous shortterm assets 3,883 6.6 3,223 6.3
Marketable securities 16 . 15 .
Cash and cash equivalents 1,493 2.5 1,835 3.6
Assets of disposal groups 614 1.0 – –
Short-term assets 24,861 41.9 19,587 38.2
Total assets 59,393 100.0 51,268 100.0
Stockholders’ equity and liabilities
December 31, 2010 December 31, 2009
Million € % Million € %
Subscribed capital 4,392 7.4 4,405 8.6
Retained earnings 15,817 26.6 12,916 25.2
Other comprehensive income 1,195 2.0 156 0.3
Minority interests 1,253 2.1 1,132 2.2
Stockholders’ equity 22,657 38.1 18,609 36.3
Provisions for pensions and similar obligations 2,778 4.7 2,255 4.4
Other provisions 3,352 5.6 3,289 6.4
Deferred taxes 2,467 4.2 2,093 4.1
Financial indebtedness 11,670 19.6 12,444 24.3
Other liabilities 901 1.6 898 1.7
Long-term liabilities 21,168 35.7 20,979 40.9
Accounts payable, trade 4,738 8.0 2,786 5.4
Provisions 3,324 5.6 3,276 6.4
Tax liabilities 1,140 1.9 1,003 2.0
Financial indebtedness 3,369 5.7 2,375 4.6
Other liabilities 2,802 4.7 2,240 4.4
Liabilities of disposal groups 195 0.3 – –
Short-term liabilities 15,568 26.2 11,680 22.8
Total stockholders’ equity and liabilities 59,393 100.0 51,268 100.0
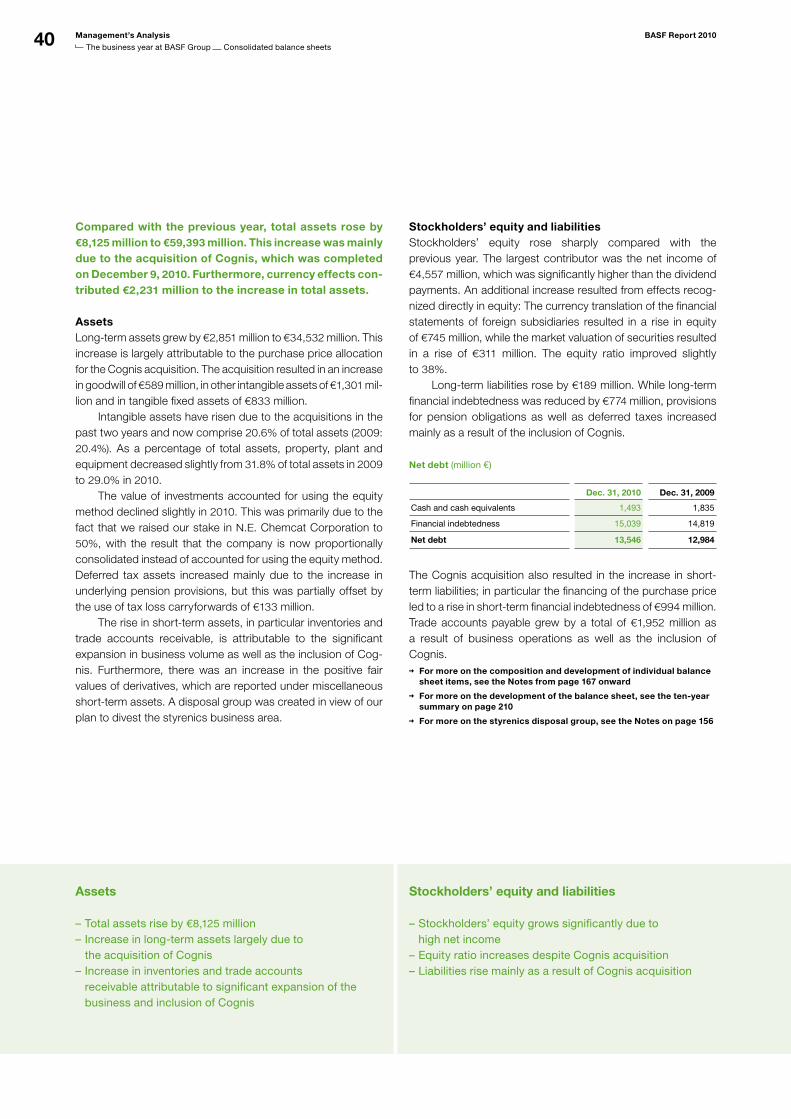
40 Management’s Analysis BASF Report 2010
The business year at BASF Group Consolidated balance sheets
Assets Stockholders’ equity and liabilities
Total assets rise by – €8,125 millionIncrease in longterm assets largely due to –the acquisition of CognisIncrease in inventories and trade accounts –receivable attributable to significant expansion of the business and inclusion of Cognis
Stockholders’ equity grows significantly due to –high net income Equity ratio increases despite Cognis acquisition – Liabilities rise mainly as a result of Cognis acquisition –
Compared with the previous year, total assets rose by €8,125 million to €59,393 million. This increase was mainly due to the acquisition of Cognis, which was completed on December 9, 2010. Furthermore, currency effects con-tributed €2,231 million to the increase in total assets.
AssetsLong-term assets grew by €2,851 million to €34,532 million. This increase is largely attributable to the purchase price allocation for the Cognis acquisition. The acquisition resulted in an increase in goodwill of €589 million, in other intangible assets of €1,301 mil-lion and in tangible fixed assets of €833 million. Intangible assets have risen due to the acquisitions in the past two years and now comprise 20.6% of total assets (2009: 20.4%). As a percentage of total assets, property, plant and equipment decreased slightly from 31.8% of total assets in 2009 to 29.0% in 2010. The value of investments accounted for using the equity method declined slightly in 2010. This was primarily due to the fact that we raised our stake in N.E. Chemcat Corporation to 50%, with the result that the company is now proportionally consolidated instead of accounted for using the equity method. Deferred tax assets increased mainly due to the increase in underlying pension provisions, but this was partially offset by the use of tax loss carryforwards of €133 million. The rise in short-term assets, in particular inventories and trade accounts receivable, is attributable to the significant expansion in business volume as well as the inclusion of Cog-nis. Furthermore, there was an increase in the positive fair values of derivatives, which are reported under miscellaneous short-term assets. A disposal group was created in view of our plan to divest the styrenics business area.
Stockholders’ equity and liabilitiesStockholders’ equity rose sharply compared with the previous year. The largest contributor was the net income of €4,557 million, which was significantly higher than the dividend payments. An additional increase resulted from effects recog-nized directly in equity: The currency translation of the financial statements of foreign subsidiaries resulted in a rise in equity of €745 million, while the market valuation of securities resulted in a rise of €311 million. The equity ratio improved slightly to 38%.
Long-term liabilities rose by €189 million. While long-term financial indebtedness was reduced by €774 million, provisions for pension obligations as well as deferred taxes increased mainly as a result of the inclusion of Cognis.
Net debt (million €)
Dec. 31, 2010 Dec. 31, 2009
Cash and cash equivalents 1,493 1,835
Financial indebtedness 15,039 14,819
Net debt 13,546 12,984
The Cognis acquisition also resulted in the increase in short-term liabilities; in particular the financing of the purchase price led to a rise in short-term financial indebtedness of €994 million. Trade accounts payable grew by a total of €1,952 million as a result of business operations as well as the inclusion of Cognis.
For more on the composition and development of individual balance sheet items, see the Notes from page 167 onward
For more on the development of the balance sheet, see the ten-year summary on page 210
For more on the styrenics disposal group, see the Notes on page 156
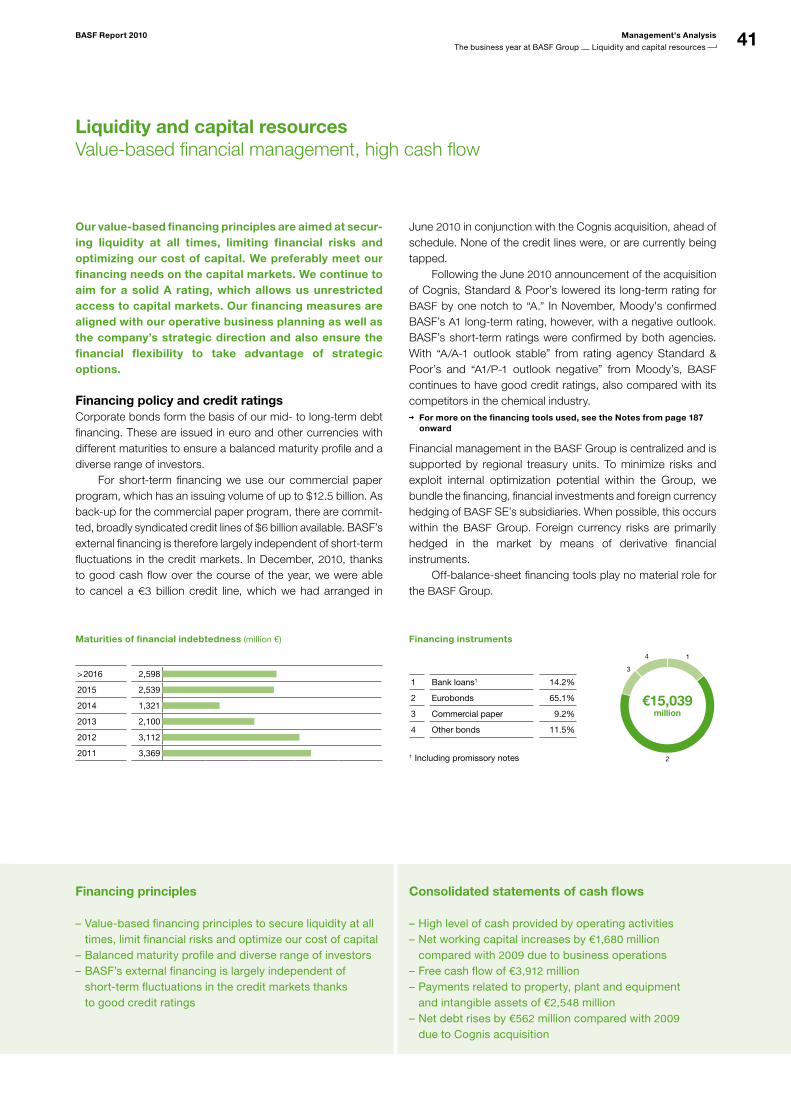
41BASF Report 2010 Management's Analysis
The business year at BASF Group Liquidity and capital resources
Liquidity and capital resourcesValue-based financial management, high cash flow
Our value-based financing principles are aimed at secur-ing liquidity at all times, limiting financial risks and optimizing our cost of capital. We preferably meet our financing needs on the capital markets. We continue to aim for a solid A rating, which allows us unrestricted access to capital markets. Our financing measures are aligned with our operative business planning as well as the company’s strategic direction and also ensure the financial flexibility to take advantage of strategic options.
Financing policy and credit ratingsCorporate bonds form the basis of our mid- to long-term debt financing. These are issued in euro and other currencies with different maturities to ensure a balanced maturity profile and a diverse range of investors. For short-term financing we use our commercial paper program, which has an issuing volume of up to $12.5 billion. As back-up for the commercial paper program, there are commit-ted, broadly syndicated credit lines of $6 billion available. BASF’s external financing is therefore largely independent of short-term fluctuations in the credit markets. In December, 2010, thanks to good cash flow over the course of the year, we were able to cancel a €3 billion credit line, which we had arranged in
June 2010 in conjunction with the Cognis acquisition, ahead of schedule. None of the credit lines were, or are currently being tapped. Following the June 2010 announcement of the acquisition of Cognis, Standard & Poor’s lowered its long-term rating for BASF by one notch to “A.” In November, Moody's confirmed BASF’s A1 long-term rating, however, with a negative outlook. BASF’s short-term ratings were confirmed by both agencies. With “A/A-1 outlook stable” from rating agency Standard & Poor’s and “A1/P-1 outlook negative” from Moody’s, BASF continues to have good credit ratings, also compared with its competitors in the chemical industry.
For more on the financing tools used, see the Notes from page 187 onward
Financial management in the BASF Group is centralized and is supported by regional treasury units. To minimize risks and exploit internal optimization potential within the Group, we bundle the financing, financial investments and foreign currency hedging of BASF SE’s subsidiaries. When possible, this occurs within the BASF Group. Foreign currency risks are primarily hedged in the market by means of derivative financial instruments. Off-balance-sheet financing tools play no material role for the BASF Group.
Financing principles Consolidated statements of cash flows
Valuebased financing principles to secure liquidity at all –times, limit financial risks and optimize our cost of capitalBalanced maturity profile and diverse range of investors –BASF’s external financing is largely independent of –shortterm fluctuations in the credit markets thanks to good credit ratings
High level of cash provided by operating activities –Net working capital increases by – €1,680 million compared with 2009 due to business operationsFree cash flow of – €3,912 million Payments related to property, plant and equipment –and intangible assets of €2,548 million Net debt rises by – €562 million compared with 2009 due to Cognis acquisition
Maturities of financial indebtedness (million €)
> 2016 2,598
2015 2,539
2014 1,321
2013 2,100
2012 3,112
2011 3,369
Financing instruments
1 Bank loans1 14.2%
2 Eurobonds 65.1%
3 Commercial paper 9.2%
4 Other bonds 11.5%
1 Including promissory notes
1
2
3
4
€15,039million
wird a
ktual
isier
t
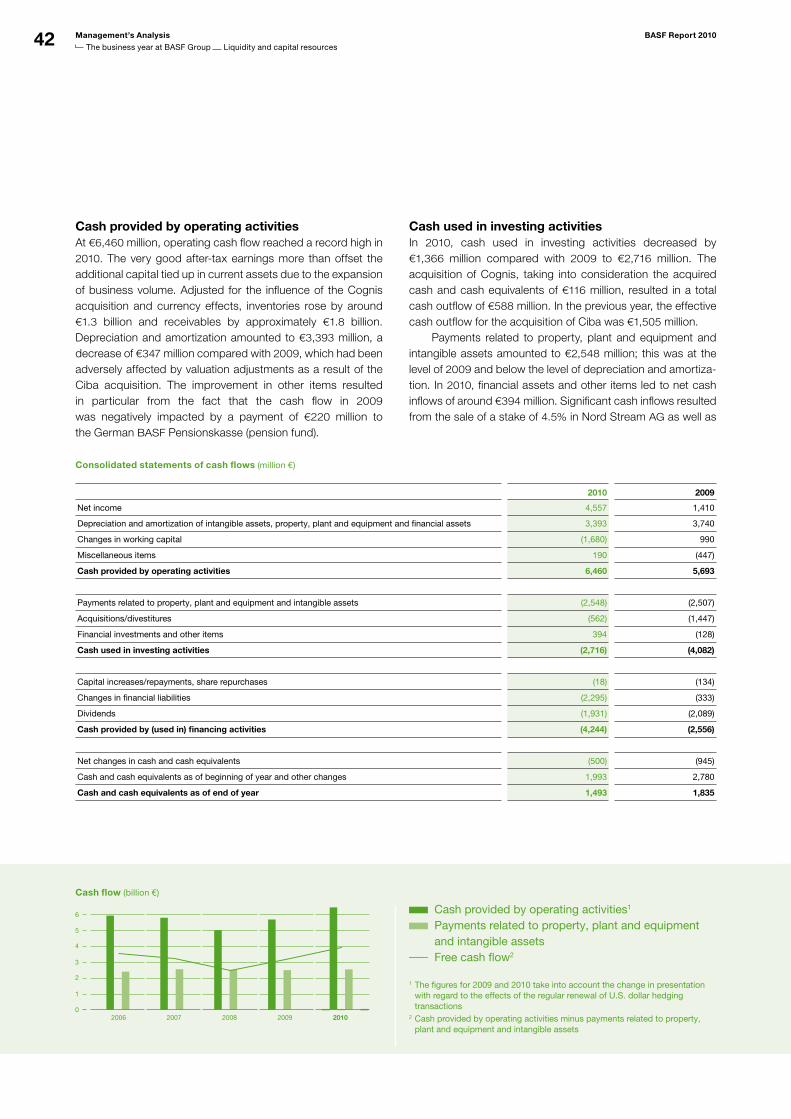
42
201020092008200720060
1
2
3
4
5
6
wird a
ktual
isier
t
Management’s Analysis BASF Report 2010
The business year at BASF Group Liquidity and capital resources
Consolidated statements of cash flows (million €)
2010 2009
Net income 4,557 1,410
Depreciation and amortization of intangible assets, property, plant and equipment and financial assets 3,393 3,740
Changes in working capital (1,680) 990
Miscellaneous items 190 (447)
Cash provided by operating activities 6,460 5,693
Payments related to property, plant and equipment and intangible assets (2,548) (2,507)
Acquisitions/divestitures (562) (1,447)
Financial investments and other items 394 (128)
Cash used in investing activities (2,716) (4,082)
Capital increases/repayments, share repurchases (18) (134)
Changes in financial liabilities (2,295) (333)
Dividends (1,931) (2,089)
Cash provided by (used in) financing activities (4,244) (2,556)
Net changes in cash and cash equivalents (500) (945)
Cash and cash equivalents as of beginning of year and other changes 1,993 2,780
Cash and cash equivalents as of end of year 1,493 1,835
Cash flow (billion €)
Cash provided by operating activities1
Payments related to property, plant and equipment and intangible assets
Free cash flow2
1 The figures for 2009 and 2010 take into account the change in presentation with regard to the effects of the regular renewal of U.S. dollar hedging transactions
2 Cash provided by operating activities minus payments related to property, plant and equipment and intangible assets
Cash provided by operating activitiesAt €6,460 million, operating cash flow reached a record high in 2010. The very good after-tax earnings more than offset the additional capital tied up in current assets due to the expansion of business volume. Adjusted for the influence of the Cognis acquisition and currency effects, inventories rose by around €1.3 billion and receivables by approximately €1.8 billion. Depreciation and amortization amounted to €3,393 million, a decrease of €347 million compared with 2009, which had been adversely affected by valuation adjustments as a result of the Ciba acquisition. The improvement in other items resulted in particular from the fact that the cash flow in 2009 was negatively impacted by a payment of €220 million to the German BASF Pensionskasse (pension fund).
Cash used in investing activitiesIn 2010, cash used in investing activities decreased by €1,366 million compared with 2009 to €2,716 million. The acquisition of Cognis, taking into consideration the acquired cash and cash equivalents of €116 million, resulted in a total cash outflow of €588 million. In the previous year, the effective cash outflow for the acquisition of Ciba was €1,505 million. Payments related to property, plant and equipment and intangible assets amounted to €2,548 million; this was at the level of 2009 and below the level of depreciation and amortiza-tion. In 2010, financial assets and other items led to net cash inflows of around €394 million. Significant cash inflows resulted from the sale of a stake of 4.5% in Nord Stream AG as well as
43BASF Report 2010 Management’s Analysis
The business year at BASF Group Liquidity and capital resources
the repayment of loans (especially by Severneftegazprom). On the other hand, these were offset by cash outflows for a capital increase at Nord Stream AG and various new loans.
For more information on additions to property, plant and equipment, see the Notes from page 170 onward
Cash used in financing activitiesIn 2010, cash used in financing activities amounted to €4,244 mil-lion. The material cash outflows comprised dividends of €1,561 million paid to shareholders of BASF SE and €370 mil-lion paid to minority shareholders in Group companies. In addi-tion, principal payments on bonds due amounted to €1 billion. No new long-term capital market liabilities were taken up in 2010. To finance the investment in gas pipelines in Germany, WINGAS GmbH & Co. KG took out long-term bank debt of €1 billion, of which €350 million had been tapped as of December 31, 2010. For most of 2010, short-term financial indebtedness was reduced significantly. However, it rose again at the end of the year as a result of the acquisition and repayment of Cognis’ debt as well as the issuance of commercial paper to finance the purchase price for Cognis in December 2010. Overall, net debt increased slightly by €562 million compared with the previous year and amounted to €13,546 million as of December 31, 2010. In 2010, we made a change to the presentation of cash flows from financing and operating activities in connection with the regular renewal of U.S. dollar hedging transactions. The fig-ures from the previous year have been adjusted accordingly. Overall, cash and cash equivalents declined by €342 mil-lion compared with the previous year and amounted to €1,493 million as of December 31, 2010.
For more information on the change in presentation of cash flow, see the Notes from page 166 onward
Financing goals 2011We will continue to adhere to our financing principles in 2011. We want to maintain our solid A rating. In addition, we aim to reduce indebtedness following the acquisition of Cognis. We want to maintain our level of cash and cash equivalents at the level of year-end 2010. Cash outflows will primarily result from the scheduled payment of principal for bonds with a total volume equivalent to €1,253 million. In addition, dividend payments are expected to result in cash outflows of €2,021 million. Payments related to property, plant and equipment and intangible assets will rise compared with the level in 2010. Due to our strong operating cash flow, we currently see no need for additional medium- and long-term financing. However, our unrestricted access to the capital market allows us to benefit from attractive conditions to finance the BASF Group flexibly at all times.
Financing goals 2011
Continue to aim for solid A rating; reduction –in debt level plannedCurrently no need for medium to longterm –financing thanks to good cash flowUnrestricted access to capital markets allows –flexible use of attractive financing conditions
Capital expenditures by region (%)
2010 2009
Europe 63 70
North America 19 19
Asia Pacific 15 9
South America, Africa, Middle East 3 2
100 100
44 Management’s Analysis BASF Report 2010
The business year at BASF Group Business review by segment
Business review by segment
Sales by segment
1 Chemicals 18%
2 Plastics 16%
3 Performance Products 19%
4 Functional Solutions 15%
5 Agricultural Solutions 6%
6 Oil & Gas 17%
7 Other 9%
1
2
34
5
6
7
€63,873million
wird a
ktual
isier
t
Contributions to EBITDA by segment
1 Chemicals 27%
2 Plastics 16%
3 Performance Products 19%
4 Functional Solutions 8%
5 Agricultural Solutions 8%
6 Oil & Gas 27%
7 Other (5%)
Segment overview (million €)
Sales
Income from operations before depreciation and amortization
(EBITDA)Income from operations (EBIT)
before special items
2010 2009 2010 2009 2010 2009
Chemicals 11,377 7,515 3,000 1,571 2,302 1,021
Plastics 9,830 7,128 1,721 994 1,284 576
Performance Products 12,288 9,356 2,162 926 1,554 698
Functional Solutions 9,703 7,115 861 511 467 209
Agricultural Solutions 4,033 3,646 938 973 749 776
Oil & Gas 10,791 11,356 2,977 2,830 2,430 2,289
Other1 5,851 4,577 (528) (417) (648) (717)
63,873 50,693 11,131 7,388 8,138 4,852
Segment overview (million €)
Income from operations (EBIT) Assets Capital expenditures2
2010 2009 2010 2009 2010 2009
Chemicals 2,310 735 6,526 5,688 535 482
Plastics 1,273 554 5,114 4,530 250 249
Performance Products 1,345 (150) 13,409 9,242 3,000 3,753
Functional Solutions 457 107 9,364 8,265 208 174
Agricultural Solutions 749 769 5,063 4,681 145 183
Oil & Gas 2,334 2,289 9,150 8,301 996 1,012
Other1 (707) (627) 10,767 10,561 170 119
7,761 3,677 59,393 51,268 5,304 5,972
1 Information on the composition of “Other” can be found in the Notes to the Consolidated Financial Statements from page 157 onward.2 Additions to property, plant and equipment (thereof from acquisitions: €833 million in 2010 and €1,766 million in 2009) and intangible assets
(thereof from acquisitions: €1,906 million in 2010 and €1,670 million in 2009)
wird a
ktual
isier
t
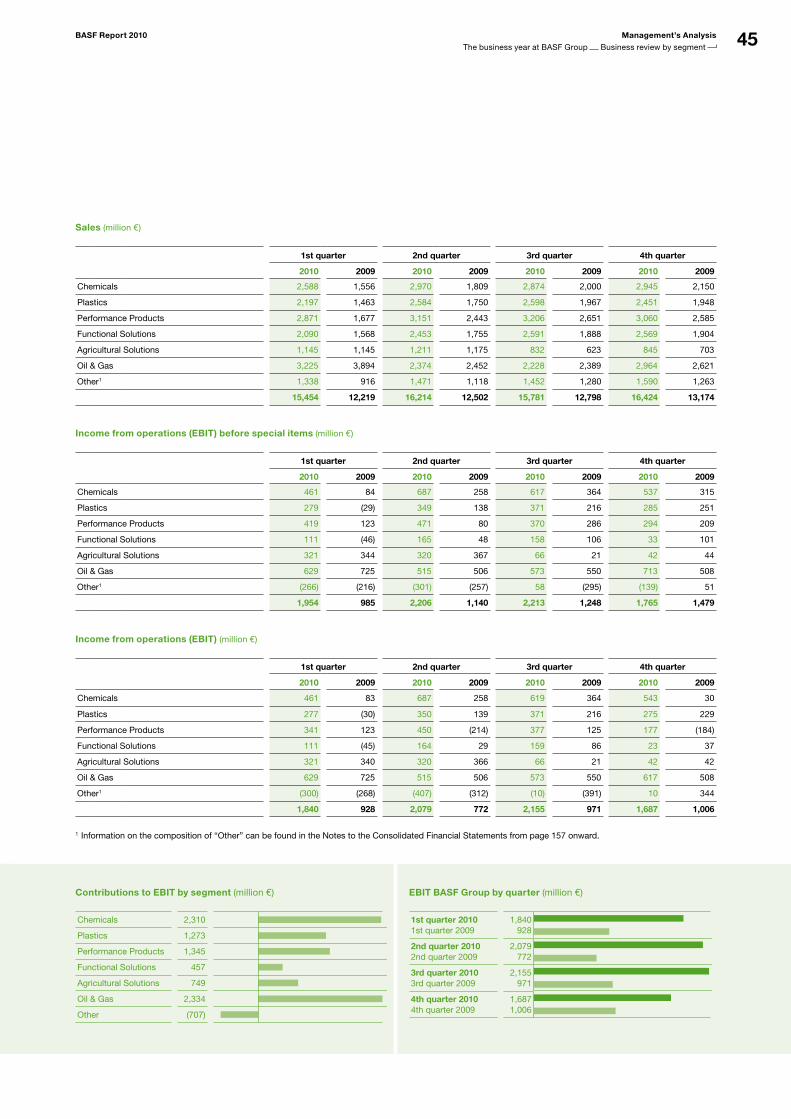
45BASF Report 2010 Management’s Analysis
The business year at BASF Group Business review by segment
Sales (million €)
1st quarter 2nd quarter 3rd quarter 4th quarter
2010 2009 2010 2009 2010 2009 2010 2009
Chemicals 2,588 1,556 2,970 1,809 2,874 2,000 2,945 2,150
Plastics 2,197 1,463 2,584 1,750 2,598 1,967 2,451 1,948
Performance Products 2,871 1,677 3,151 2,443 3,206 2,651 3,060 2,585
Functional Solutions 2,090 1,568 2,453 1,755 2,591 1,888 2,569 1,904
Agricultural Solutions 1,145 1,145 1,211 1,175 832 623 845 703
Oil & Gas 3,225 3,894 2,374 2,452 2,228 2,389 2,964 2,621
Other1 1,338 916 1,471 1,118 1,452 1,280 1,590 1,263
15,454 12,219 16,214 12,502 15,781 12,798 16,424 13,174
Income from operations (EBIT) before special items (million €)
1st quarter 2nd quarter 3rd quarter 4th quarter
2010 2009 2010 2009 2010 2009 2010 2009
Chemicals 461 84 687 258 617 364 537 315
Plastics 279 (29) 349 138 371 216 285 251
Performance Products 419 123 471 80 370 286 294 209
Functional Solutions 111 (46) 165 48 158 106 33 101
Agricultural Solutions 321 344 320 367 66 21 42 44
Oil & Gas 629 725 515 506 573 550 713 508
Other1 (266) (216) (301) (257) 58 (295) (139) 51
1,954 985 2,206 1,140 2,213 1,248 1,765 1,479
Income from operations (EBIT) (million €)
1st quarter 2nd quarter 3rd quarter 4th quarter
2010 2009 2010 2009 2010 2009 2010 2009
Chemicals 461 83 687 258 619 364 543 30
Plastics 277 (30) 350 139 371 216 275 229
Performance Products 341 123 450 (214) 377 125 177 (184)
Functional Solutions 111 (45) 164 29 159 86 23 37
Agricultural Solutions 321 340 320 366 66 21 42 42
Oil & Gas 629 725 515 506 573 550 617 508
Other1 (300) (268) (407) (312) (10) (391) 10 344
1,840 928 2,079 772 2,155 971 1,687 1,006
1 Information on the composition of “Other” can be found in the Notes to the Consolidated Financial Statements from page 157 onward.
Contributions to EBIT by segment (million €)
Chemicals 2,310
Plastics 1,273
Performance Products 1,345
Functional Solutions 457
Agricultural Solutions 749
Oil & Gas 2,334
Other (707)
EBIT BASF Group by quarter (million €)
1st quarter 20101st quarter 2009
1,840928
2nd quarter 20102nd quarter 2009
2,079772
3rd quarter 20103rd quarter 2009
2,155971
4th quarter 20104th quarter 2009
1,6871,006wird
akt
ualisi
ert
wird a
ktual
isier
t
46 Management’s Analysis BASF Report 2010
The business year at BASF Group BASF’s segments/Chemicals
The Chemicals segment consists of the Inorganics, Pet-rochemicals and Intermediates divisions. In our inte-grated production facilities – our Verbund – we produce a broad range of basic chemicals and downstream prod-ucts in Europe, Asia and North America for our internal and external customers.
Segment strategyWe create value by driving growth with an attractive portfolio, investments in future markets and process and product inno-vations as well as by the competitive and flexible integration of our production into the BASF Verbund structures. We supply the BASF segments with basic chemicals for the production of downstream products. As a reliable supplier, we market our products to customers in downstream industries; primarily in the chemical, electronics, construction, textile, automotive, pharmaceutical and agrochemical industries. We continually develop our value-adding chains with innovations, capital expenditures and acquisitions in future markets. Technology and cost leadership are among our most important success factors. We achieve them by improving processes, implement-ing market-oriented business models, and efficiently using the synergy potentials of our Verbund. We constantly optimize our portfolio and production structures and align them with regional market requirements.
Our productsThe success of the Inorganics division is based on a product range comprising basic products and specialties for use in our Verbund and our business with third parties. Our most impor-tant basic products are ammonia, methanol, caustic soda, chlo-rine as well as sulfuric and nitric acid. Our specialties are par-ticularly geared toward the electronics and pharmaceutical industries. We benefit from knowledge of our customers’ tech-nological requirements and demands. For the solar industry, for example, we develop special process chemicals that can be used in the manufacture of solar cells. We expanded our port-folio in 2010 with the addition of Seluris® Clean, a new environ-
mentally friendly cleaning solution. During key steps in the manufacturing process, this solution cleans the solar cell wafers, which prevents electrical interference when the cells are in operation. The Petrochemicals division, with its broad range of basic chemicals, is the foundation of BASF’s value-adding chains. Products such as ethylene, propylene, butadiene and benzene are produced in steam crackers from naphtha or natural gas to supply BASF’s own production. Using these, we produce alco-hols, solvents and plasticizers for the chemical and plastics industries. Alkylene oxides and glycols are starting materials for the detergents, automotive, packaging and textile industries. Our acrylic monomers are used in the production of paints, coat-ings and cosmetics as well as oilfield, construction and paper chemicals. To meet specific customer demands, we have a number of specialty monomers that can be ideally incorporated into the value-adding chain for acrylates and methacrylates. With more than 600 products, our Intermediates division develops, produces and markets the world’s most comprehen-sive range of intermediates. Our product lines include amines, diols, polyalcohols, acids and specialties. They serve as start-ing material for applications such as coatings, plastics, pharma-ceuticals, textile fibers, crop protection products as well as detergents and cleaners. Our product lines also help to improve the properties of the products they are used in and the efficiency of production processes. Worldwide, BASF is among the three largest suppliers of all significant intermediates. Research and developmentOur research activities are focused on the development of innovative production processes that will make us even more competitive. We continuously improve existing products and applications. In developing new products, we look at the needs of our internal and external customers as well as the opportu-nities offered by value-adding chains in the Verbund and in the markets. For example, we launched the new CypoSol® product line, which is used in the metallization of solar cell wafers. Solar cells are metallized to enable them to conduct the electricity
ChemicalsExcellence in the Verbund, technology and cost leadership
Strategy Products
Supplying the valueadding chains in the – BASF Verbund and marketing our products to external customersMost important success factors are technology –and cost leadershipProduct portfolio and regional production structures –are continuously optimized
Inorganics: basic products for our Verbund and special –ties for the electronics industry and other industriesPetrochemicals: broad range of basic chemicals for –BASF’s own production as well as for external customersIntermediates: with more than – 600 products, the most comprehensive range of intermediates worldwide; market leader for many intermediates
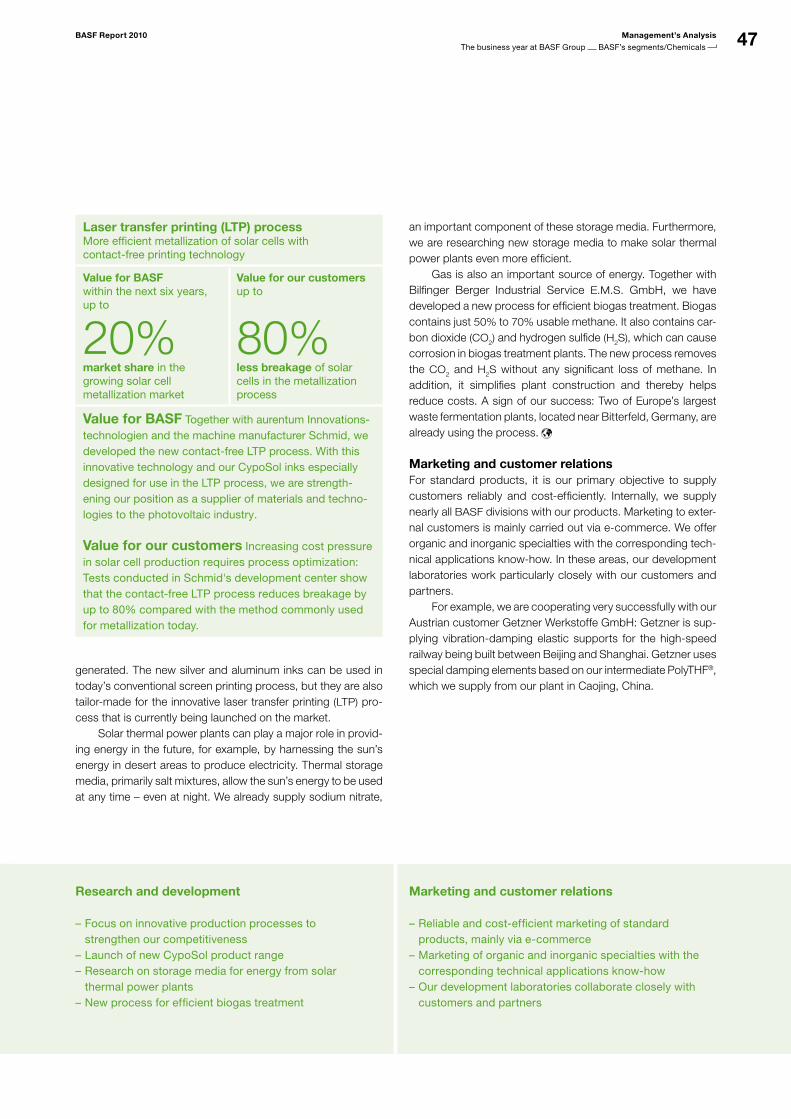
47BASF Report 2010 Management’s Analysis
The business year at BASF Group BASF’s segments/Chemicals
Laser transfer printing (LTP) processMore efficient metallization of solar cells with contactfree printing technology
Value for BASFwithin the next six years, up to
20%market share in the growing solar cell metallization market
Value for our customersup to
80%less breakage of solar cells in the metallization process
Value for BASF Together with aurentum Innovationstechnologien and the machine manufacturer Schmid, we developed the new contactfree LTP process. With this innovative technology and our CypoSol inks especially designed for use in the LTP process, we are strengthening our position as a supplier of materials and technologies to the photovoltaic industry.
Value for our customers Increasing cost pressure in solar cell production requires process optimization: Tests conducted in Schmid's development center show that the contactfree LTP process reduces breakage by up to 80% compared with the method commonly used for metallization today.
generated. The new silver and aluminum inks can be used in today’s conventional screen printing process, but they are also tailor-made for the innovative laser transfer printing (LTP) pro-cess that is currently being launched on the market. Solar thermal power plants can play a major role in provid-ing energy in the future, for example, by harnessing the sun’s energy in desert areas to produce electricity. Thermal storage media, primarily salt mixtures, allow the sun’s energy to be used at any time – even at night. We already supply sodium nitrate,
an important component of these storage media. Furthermore, we are researching new storage media to make solar thermal power plants even more efficient. Gas is also an important source of energy. Together with Bilfinger Berger Industrial Service E.M.S. GmbH, we have developed a new process for efficient biogas treatment. Biogas contains just 50% to 70% usable methane. It also contains car-bon dioxide (CO2) and hydrogen sulfide (H2S), which can cause corrosion in biogas treatment plants. The new process removes the CO2 and H2S without any significant loss of methane. In addition, it simplifies plant construction and thereby helps reduce costs. A sign of our success: Two of Europe’s largest waste fermentation plants, located near Bitterfeld, Germany, are already using the process.
Marketing and customer relationsFor standard products, it is our primary objective to supply customers reliably and cost-efficiently. Internally, we supply nearly all BASF divisions with our products. Marketing to exter-nal customers is mainly carried out via e-commerce. We offer organic and inorganic specialties with the corresponding tech-nical applications know-how. In these areas, our development laboratories work particularly closely with our customers and partners. For example, we are cooperating very successfully with our Austrian customer Getzner Werkstoffe GmbH: Getzner is sup-plying vibration-damping elastic supports for the high-speed railway being built between Beijing and Shanghai. Getzner uses special damping elements based on our intermediate PolyTHF®, which we supply from our plant in Caojing, China.
Focus on innovative production processes to –strengthen our competitivenessLaunch of new CypoSol product range –Research on storage media for energy from solar –thermal power plantsNew process for efficient biogas treatment –
Reliable and costefficient marketing of standard –products, mainly via ecommerceMarketing of organic and inorganic specialties with the –corresponding technical applications knowhowOur development laboratories collaborate closely with –customers and partners
Research and development Marketing and customer relations
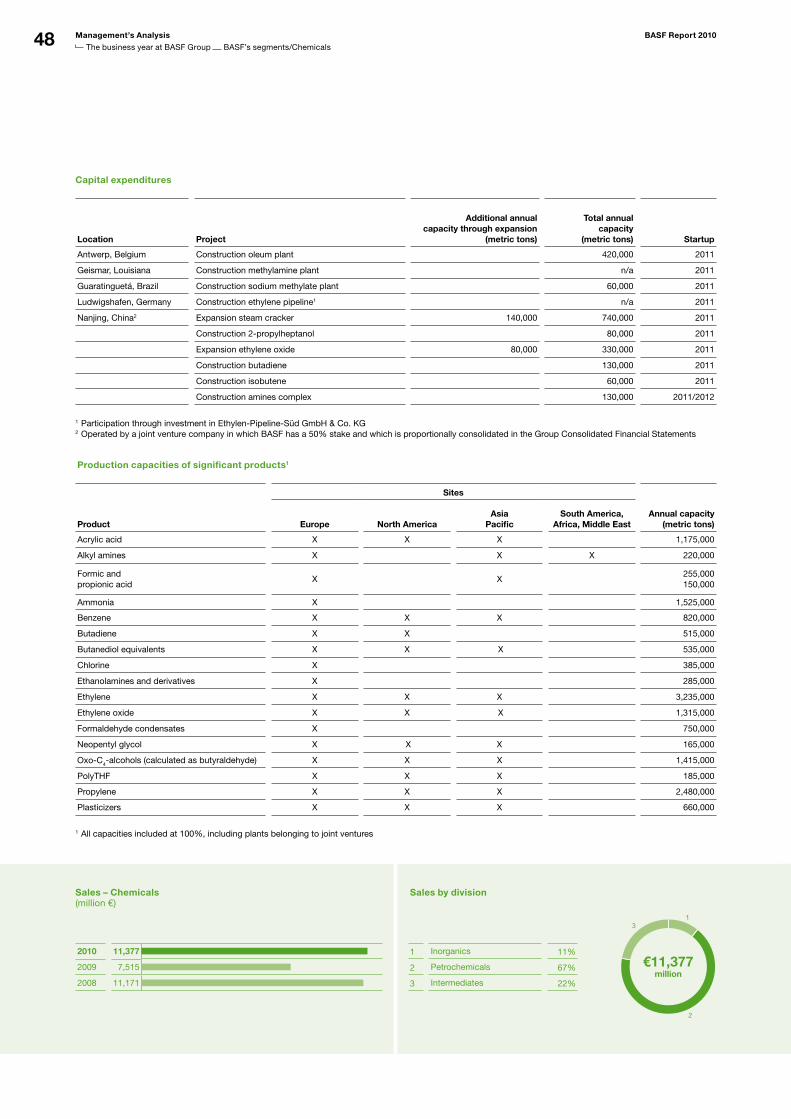
48 Management’s Analysis BASF Report 2010
The business year at BASF Group BASF’s segments/Chemicals
Sales – Chemicals(million €)
2010 11,377
wird aktualisiert
2009 7,515
2008 11,171
Capital expenditures
Location Project
Additional annual capacity through expansion
(metric tons)
Total annual capacity
(metric tons) Startup
Antwerp, Belgium Construction oleum plant 420,000 2011
Geismar, Louisiana Construction methylamine plant n/a 2011
Guaratinguetá, Brazil Construction sodium methylate plant 60,000 2011
Ludwigshafen, Germany Construction ethylene pipeline1 n/a 2011
Nanjing, China2 Expansion steam cracker 140,000 740,000 2011
Construction 2propylheptanol 80,000 2011
Expansion ethylene oxide 80,000 330,000 2011
Construction butadiene 130,000 2011
Construction isobutene 60,000 2011
Construction amines complex 130,000 2011/2012
1 Participation through investment in EthylenPipelineSüd GmbH & Co. KG 2 Operated by a joint venture company in which BASF has a 50% stake and which is proportionally consolidated in the Group Consolidated Financial Statements
Production capacities of significant products1
Product
Sites
Annual capacity (metric tons) Europe North America
Asia Pacific
South America, Africa, Middle East
Acrylic acid X X X 1,175,000
Alkyl amines X X X 220,000
Formic and propionic acid
X
X
255,000 150,000
Ammonia X 1,525,000
Benzene X X X 820,000
Butadiene X X 515,000
Butanediol equivalents X X X 535,000
Chlorine X 385,000
Ethanolamines and derivatives X 285,000
Ethylene X X X 3,235,000
Ethylene oxide X X X 1,315,000
Formaldehyde condensates X 750,000
Neopentyl glycol X X X 165,000
OxoC4alcohols (calculated as butyraldehyde) X X X 1,415,000
PolyTHF X X X 185,000
Propylene X X X 2,480,000
Plasticizers X X X 660,000
1 All capacities included at 100%, including plants belonging to joint ventures
Sales by division
1 Inorganics 11%
2 Petrochemicals 67%
3 Intermediates 22%
1
2
3
€11,377million
wird a
ktual
isier
t
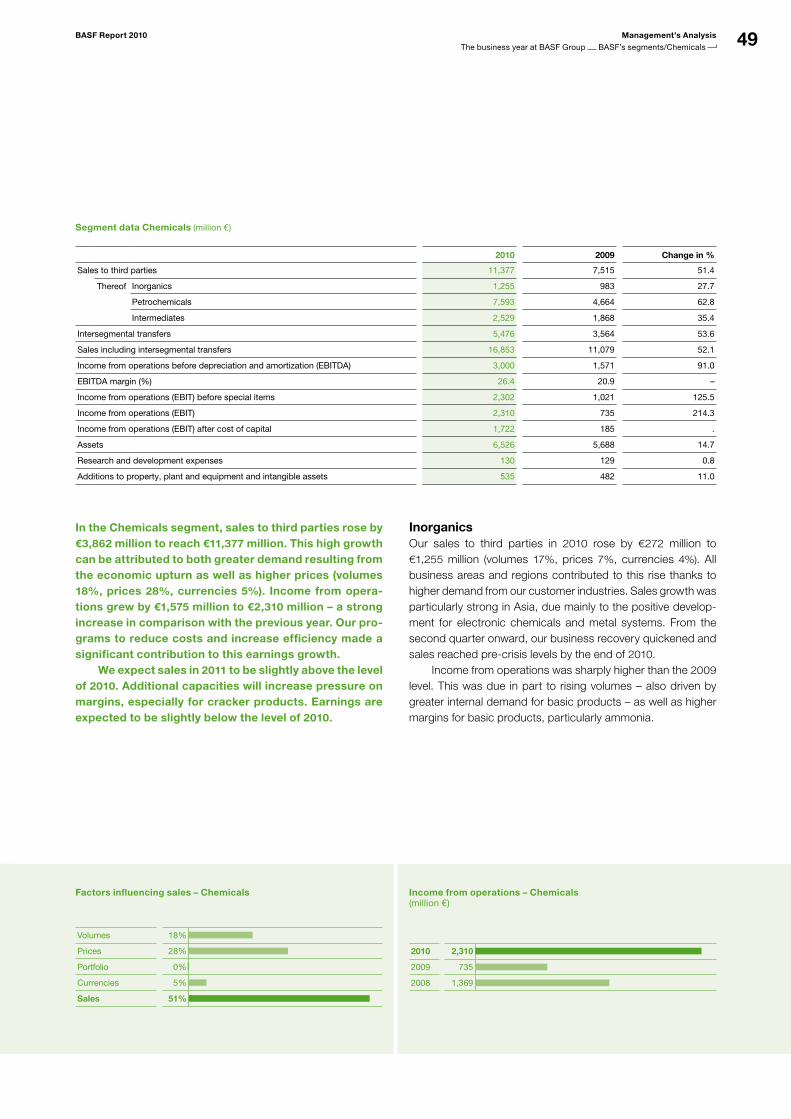
49BASF Report 2010 Management’s Analysis
The business year at BASF Group BASF’s segments/Chemicals
In the Chemicals segment, sales to third parties rose by €3,862 million to reach €11,377 million. This high growth can be attributed to both greater demand resulting from the economic upturn as well as higher prices (volumes 18%, prices 28%, currencies 5%). Income from opera-tions grew by €1,575 million to €2,310 million – a strong increase in comparison with the previous year. Our pro-grams to reduce costs and increase efficiency made a significant contribution to this earnings growth. We expect sales in 2011 to be slightly above the level of 2010. Additional capacities will increase pressure on margins, especially for cracker products. Earnings are expected to be slightly below the level of 2010.
InorganicsOur sales to third parties in 2010 rose by €272 million to €1,255 million (volumes 17%, prices 7%, currencies 4%). All business areas and regions contributed to this rise thanks to higher demand from our customer industries. Sales growth was particularly strong in Asia, due mainly to the positive develop-ment for electronic chemicals and metal systems. From the second quarter onward, our business recovery quickened and sales reached pre-crisis levels by the end of 2010. Income from operations was sharply higher than the 2009 level. This was due in part to rising volumes – also driven by greater internal demand for basic products – as well as higher margins for basic products, particularly ammonia.
Segment data Chemicals (million €)
2010 2009 Change in %
Sales to third parties 11,377 7,515 51.4
Thereof Inorganics 1,255 983 27.7
Petrochemicals 7,593 4,664 62.8
Intermediates 2,529 1,868 35.4
Intersegmental transfers 5,476 3,564 53.6
Sales including intersegmental transfers 16,853 11,079 52.1
Income from operations before depreciation and amortization (EBITDA) 3,000 1,571 91.0
EBITDA margin (%) 26.4 20.9 –
Income from operations (EBIT) before special items 2,302 1,021 125.5
Income from operations (EBIT) 2,310 735 214.3
Income from operations (EBIT) after cost of capital 1,722 185 .
Assets 6,526 5,688 14.7
Research and development expenses 130 129 0.8
Additions to property, plant and equipment and intangible assets 535 482 11.0
Factors influencing sales – Chemicals
Volumes 18%
Prices 28%
Portfolio 0%
Currencies 5%
Sales 51%
wird aktualisiert
Income from operations – Chemicals(million €)
2010 2,310
wird aktualisiert
2009 735
2008 1,369
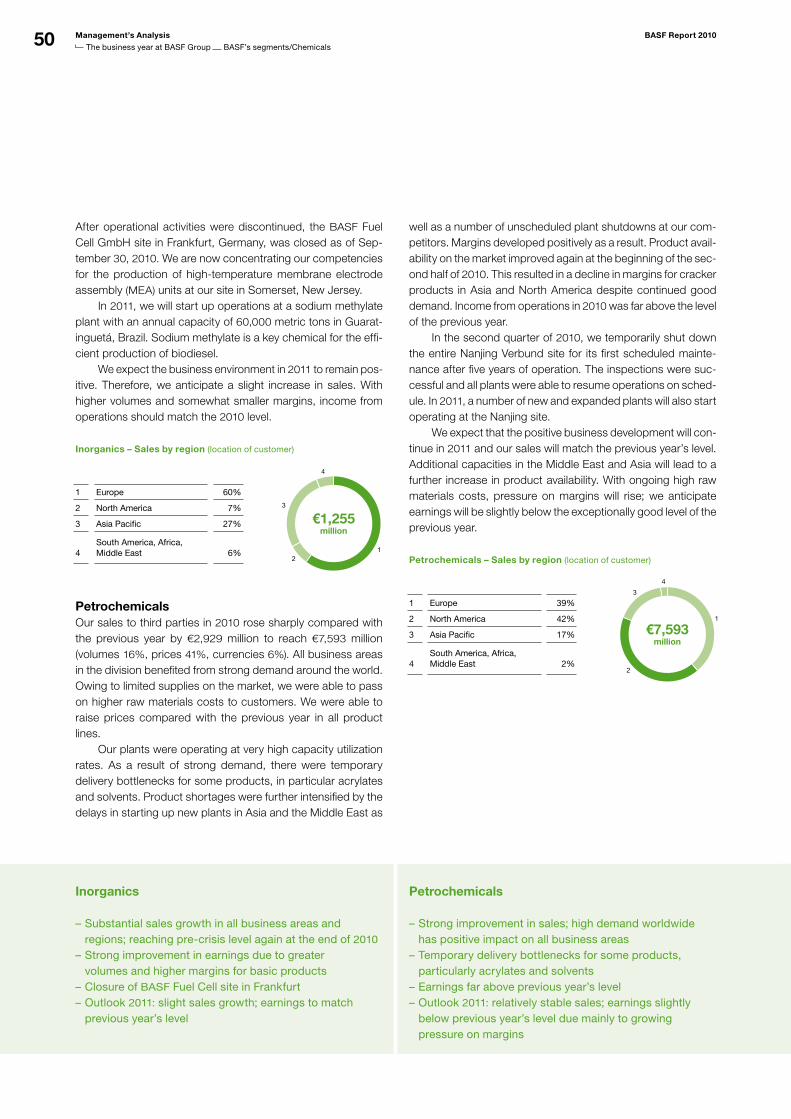
50 Management’s Analysis BASF Report 2010
The business year at BASF Group BASF’s segments/Chemicals
After operational activities were discontinued, the BASF Fuel Cell GmbH site in Frankfurt, Germany, was closed as of Sep-tember 30, 2010. We are now concentrating our competencies for the production of high-temperature membrane electrode assembly (MEA) units at our site in Somerset, New Jersey. In 2011, we will start up operations at a sodium methylate plant with an annual capacity of 60,000 metric tons in Guarat-inguetá, Brazil. Sodium methylate is a key chemical for the effi-cient production of biodiesel. We expect the business environment in 2011 to remain pos-itive. Therefore, we anticipate a slight increase in sales. With higher volumes and somewhat smaller margins, income from operations should match the 2010 level.
Inorganics – Sales by region (location of customer)
1 Europe 60%
2 North America 7%
3 Asia Pacific 27%
4South America, Africa, Middle East 6%
PetrochemicalsOur sales to third parties in 2010 rose sharply compared with the previous year by €2,929 million to reach €7,593 million (volumes 16%, prices 41%, currencies 6%). All business areas in the division benefited from strong demand around the world. Owing to limited supplies on the market, we were able to pass on higher raw materials costs to customers. We were able to raise prices compared with the previous year in all product lines. Our plants were operating at very high capacity utilization rates. As a result of strong demand, there were temporary delivery bottlenecks for some products, in particular acrylates and solvents. Product shortages were further intensified by the delays in starting up new plants in Asia and the Middle East as
12
3
4
€1,255million
wird a
ktual
isier
t
well as a number of unscheduled plant shutdowns at our com-petitors. Margins developed positively as a result. Product avail-ability on the market improved again at the beginning of the sec-ond half of 2010. This resulted in a decline in margins for cracker products in Asia and North America despite continued good demand. Income from operations in 2010 was far above the level of the previous year. In the second quarter of 2010, we temporarily shut down the entire Nanjing Verbund site for its first scheduled mainte-nance after five years of operation. The inspections were suc-cessful and all plants were able to resume operations on sched-ule. In 2011, a number of new and expanded plants will also start operating at the Nanjing site. We expect that the positive business development will con-tinue in 2011 and our sales will match the previous year’s level. Additional capacities in the Middle East and Asia will lead to a further increase in product availability. With ongoing high raw materials costs, pressure on margins will rise; we anticipate earnings will be slightly below the exceptionally good level of the previous year.
Petrochemicals – Sales by region (location of customer)
1 Europe 39%
2 North America 42%
3 Asia Pacific 17%
4South America, Africa, Middle East 2%
1
2
3
4
€7,593million
wird a
ktual
isier
t
Substantial sales growth in all business areas and –regions; reaching precrisis level again at the end of 2010
Strong improvement in earnings due to greater –volumes and higher margins for basic productsClosure of – BASF Fuel Cell site in FrankfurtOutlook – 2011: slight sales growth; earnings to match previous year’s level
Strong improvement in sales; high demand worldwide –has positive impact on all business areasTemporary delivery bottlenecks for some products, –particularly acrylates and solventsEarnings far above previous year’s level –Outlook – 2011: relatively stable sales; earnings slightly below previous year’s level due mainly to growing pressure on margins
Inorganics Petrochemicals
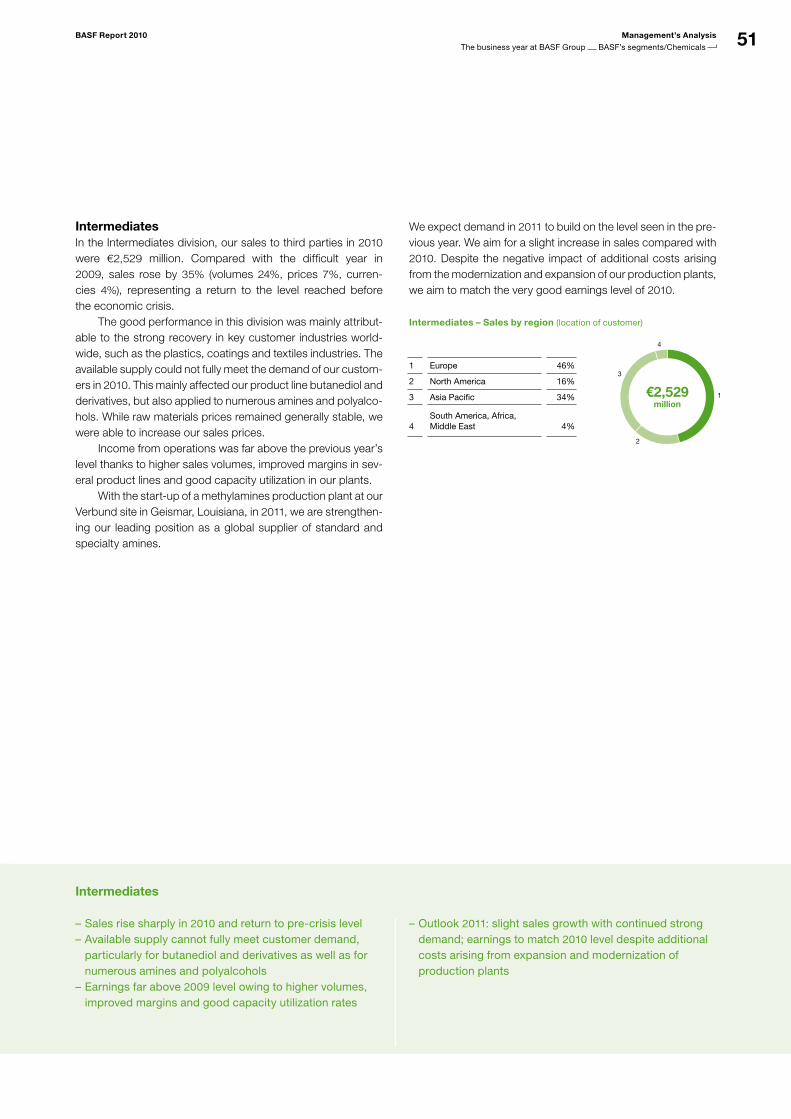
51BASF Report 2010 Management’s Analysis
The business year at BASF Group BASF’s segments/Chemicals
IntermediatesIn the Intermediates division, our sales to third parties in 2010 were €2,529 million. Compared with the difficult year in 2009, sales rose by 35% (volumes 24%, prices 7%, curren-cies 4%), representing a return to the level reached before the economic crisis. The good performance in this division was mainly attribut-able to the strong recovery in key customer industries world-wide, such as the plastics, coatings and textiles industries. The available supply could not fully meet the demand of our custom-ers in 2010. This mainly affected our product line butanediol and derivatives, but also applied to numerous amines and polyalco-hols. While raw materials prices remained generally stable, we were able to increase our sales prices. Income from operations was far above the previous year’s level thanks to higher sales volumes, improved margins in sev-eral product lines and good capacity utilization in our plants. With the start-up of a methylamines production plant at our Verbund site in Geismar, Louisiana, in 2011, we are strengthen-ing our leading position as a global supplier of standard and specialty amines.
We expect demand in 2011 to build on the level seen in the pre-vious year. We aim for a slight increase in sales compared with 2010. Despite the negative impact of additional costs arising from the modernization and expansion of our production plants, we aim to match the very good earnings level of 2010.
Intermediates – Sales by region (location of customer)
1 Europe 46%
2 North America 16%
3 Asia Pacific 34%
4
South America, Africa, Middle East 4%
1
2
3
4
€2,529million
wird a
ktual
isier
t
Sales rise sharply in – 2010 and return to precrisis levelAvailable supply cannot fully meet customer demand, –particularly for butanediol and derivatives as well as for numerous amines and polyalcoholsEarnings far above – 2009 level owing to higher volumes, improved margins and good capacity utilization rates
Outlook – 2011: slight sales growth with continued strong demand; earnings to match 2010 level despite additional costs arising from expansion and modernization of production plants
Intermediates
52 Management’s Analysis BASF Report 2010
The business year at BASF Group BASF’s segments/Plastics
BASF is one of the world’s leading producers of high-quality plastics. In the Performance Polymers and Poly-urethanes divisions, we offer energy-efficient products and customer-oriented system solutions.
Segment strategyWe concentrate on activities which allow us to distinguish our-selves from our market competitors and offer us profitable growth opportunities. Our customers are primarily in the con-struction, automotive, electrical and electronics, textile, pack-aging and furniture industries. The versatility of our products enables us to offer sustainable solutions that substitute conven-tional materials in a wide variety of applications, thus broaden-ing our portfolio to many customer industries. Furthermore, we are positioning ourselves to grow faster than the market and become less dependent on the cyclicality of individual indus-tries. We work closely with our customers – always with the aim of offering the best solutions in terms of cost-effective raw materials, energy efficiency and functionality.
Our productsThe Performance Polymers division is one of the world’s lead-ing suppliers of engineering plastics, polyamides and polyamide intermediates as well as foams and specialty plastics. We offer our customers a broad portfolio of engineering plastics based on polyamide 6 and polyamide 6,6 (Ultramid®). This is complemented by our products Ultradur®, Ultraform® and Ultrason®. Due to their special mechanical properties and the combination of low weight with high temperature and chemical resistance, our engineering plastics are widely used in the automotive, electrical and electronics industries. They are also used in the manufacture of household and leisure goods, and increasingly for design-oriented consumer products.
For the packaging, textile and food industries, we offer poly-amide polymers as important base products for the manufac-turing of fibers and films. Our product range also includes Ecoflex® and Ecovio® – biodegradable specialty plastics for the packaging industry. Styropor® and its innovative refinement Neopor® – both styrene-based precursors for foams – are used as insulating material for construction and packaging. Our foams contribute not only to energy efficiency: The melamine-based foam Baso-tect® also provides excellent sound absorption in buildings, cars and airplanes. The Polyurethanes division is one of the leading suppliers of basic products, systems and specialties. With our compre-hensive product and service portfolio, we are the preferred part-ner of our customers in many industries. Our polyurethane solutions help to save energy and are very often used in insulating materials. Polyurethane rigid foam products are the preferred material for many cooling systems for food or pharmaceutical products. Furthermore, nearly all refrigerators and freezers produced worldwide are insulated with polyurethane. The use of polyurethane insulation in all the steps of a cold chain – from production to transport and storage – saves up to 16 times more energy than is required to manufac-ture the polyurethane. Our products Elastopor®, Elastopir® and Elastocool® combine greater insulation capacity with innovative technology to guarantee superior refrigeration. Furthermore, polyurethane solutions are used in applications to effectively prevent heat loss, such as to insulate hot water tanks and district heating pipelines.
For more on energy efficiency, see page 97
PlasticsEnergy-efficient products and system solutions for our customers
Strategy Products
Tapping into new market segments with a diversified –and innovative portfolioClose cooperation with customers in the development –of new products and system solutionsOur goal: to offer the best solution in terms of –costeffective raw materials, energy efficiency and functionality
Performance Polymers: engineering plastics, polyamide –and polyamide intermediates as well as foams and specialty plastics for diverse applicationsPolyurethanes: basic products, tailormade systems and –specialties for the construction and automotive industries, household appliances and sports equipment
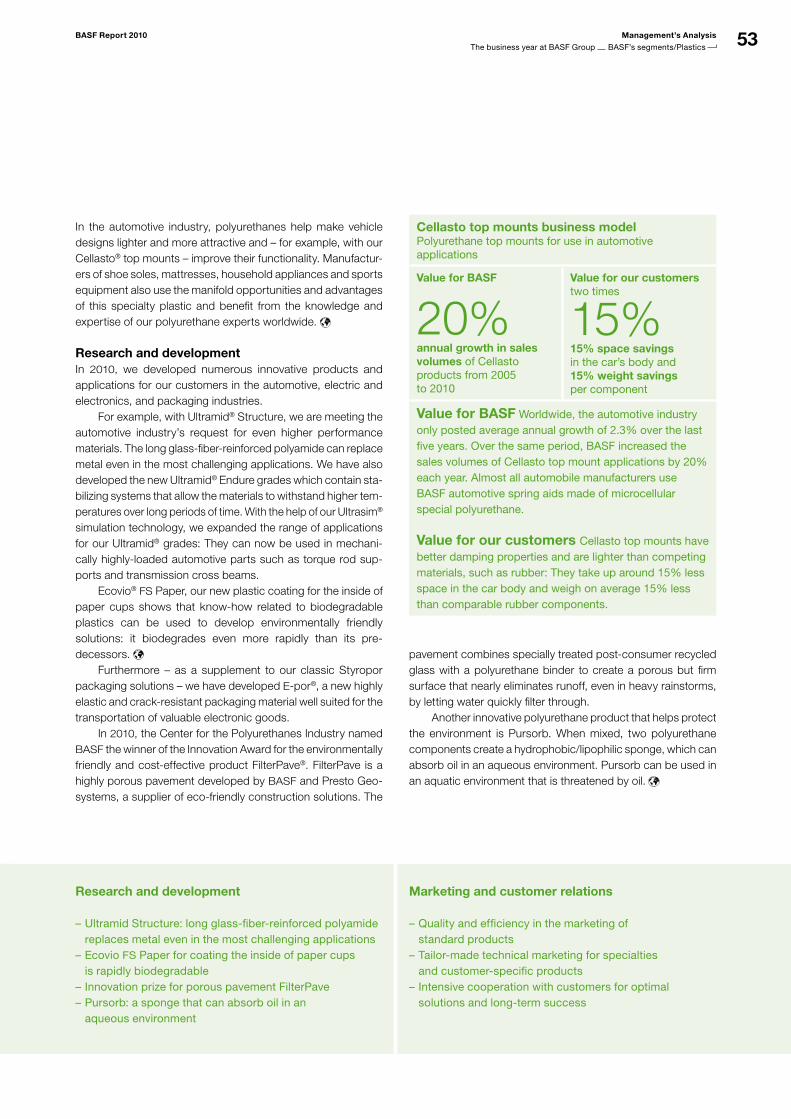
53BASF Report 2010 Management’s Analysis
The business year at BASF Group BASF’s segments/Plastics
In the automotive industry, polyurethanes help make vehicle designs lighter and more attractive and – for example, with our Cellasto® top mounts – improve their functionality. Manufactur-ers of shoe soles, mattresses, household appliances and sports equipment also use the manifold opportunities and advantages of this specialty plastic and benefit from the knowledge and expertise of our polyurethane experts worldwide.
Research and developmentIn 2010, we developed numerous innovative products and applications for our customers in the automotive, electric and electronics, and packaging industries. For example, with Ultramid® Structure, we are meeting the automotive industry’s request for even higher performance materials. The long glass-fiber-reinforced polyamide can replace metal even in the most challenging applications. We have also developed the new Ultramid® Endure grades which contain sta-bilizing systems that allow the materials to withstand higher tem-peratures over long periods of time. With the help of our Ultrasim® simulation technology, we expanded the range of applications for our Ultramid® grades: They can now be used in mechani-cally highly-loaded automotive parts such as torque rod sup-ports and transmission cross beams. Ecovio® FS Paper, our new plastic coating for the inside of paper cups shows that know-how related to biodegradable plastics can be used to develop environmentally friendly solutions: it biodegrades even more rapidly than its pre-decessors.
Furthermore – as a supplement to our classic Styropor packaging solutions – we have developed E-por®, a new highly elastic and crack-resistant packaging material well suited for the transportation of valuable electronic goods. In 2010, the Center for the Polyurethanes Industry named BASF the winner of the Innovation Award for the environmentally friendly and cost-effective product FilterPave®. FilterPave is a highly porous pavement developed by BASF and Presto Geo-systems, a supplier of eco-friendly construction solutions. The
Cellasto top mounts business model Polyurethane top mounts for use in automotive applications
Value for BASF
20%annual growth in sales volumes of Cellasto products from 2005 to 2010
Value for our customerstwo times
1 5%15% space savings in the car’s body and15% weight savings per component
Value for BASF Worldwide, the automotive industry only posted average annual growth of 2.3% over the last five years. Over the same period, BASF increased the sales volumes of Cellasto top mount applications by 20% each year. Almost all automobile manufacturers use BASF automotive spring aids made of microcellular special polyurethane.
Value for our customers Cellasto top mounts have better damping properties and are lighter than competing materials, such as rubber: They take up around 15% less space in the car body and weigh on average 15% less than comparable rubber components.
pavement combines specially treated post-consumer recycled glass with a polyurethane binder to create a porous but firm surface that nearly eliminates runoff, even in heavy rainstorms, by letting water quickly filter through. Another innovative polyurethane product that helps protect the environment is Pursorb. When mixed, two polyurethane components create a hydrophobic/lipophilic sponge, which can absorb oil in an aqueous environment. Pursorb can be used in an aquatic environment that is threatened by oil.
Ultramid Structure: long glassfiberreinforced polyamide –replaces metal even in the most challenging applicationsEcovio – FS Paper for coating the inside of paper cups is rapidly biodegradableInnovation prize for porous pavement FilterPave –Pursorb: a sponge that can absorb oil in an –aqueous environment
Quality and efficiency in the marketing of –standard productsTailormade technical marketing for specialties –and customerspecific productsIntensive cooperation with customers for optimal –solutions and longterm success
Research and development Marketing and customer relations
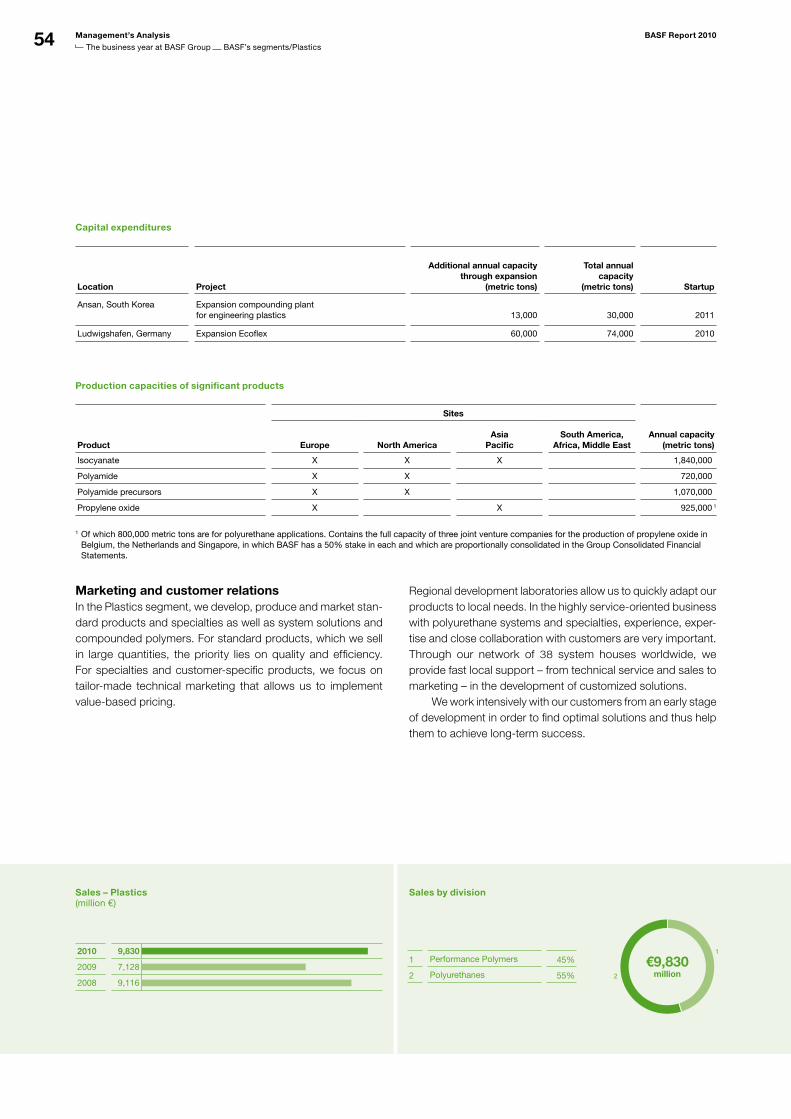
54 Management’s Analysis BASF Report 2010
The business year at BASF Group BASF’s segments/Plastics
Capital expenditures
Location Project
Additional annual capacity through expansion
(metric tons)
Total annual capacity
(metric tons) Startup
Ansan, South Korea Expansion compounding plant for engineering plastics
13,000
30,000
2011
Ludwigshafen, Germany Expansion Ecoflex 60,000 74,000 2010
Production capacities of significant products
Product
Sites
Annual capacity (metric tons) Europe North America
Asia Pacific
South America, Africa, Middle East
Isocyanate X X X 1,840,000
Polyamide X X 720,000
Polyamide precursors X X 1,070,000
Propylene oxide X X 925,000 1
1 Of which 800,000 metric tons are for polyurethane applications. Contains the full capacity of three joint venture companies for the production of propylene oxide in Belgium, the Netherlands and Singapore, in which BASF has a 50% stake in each and which are proportionally consolidated in the Group Consolidated Financial Statements.
Marketing and customer relationsIn the Plastics segment, we develop, produce and market stan-dard products and specialties as well as system solutions and compounded polymers. For standard products, which we sell in large quantities, the priority lies on quality and efficiency. For specialties and customer-specific products, we focus on tailor-made technical marketing that allows us to implement value-based pricing.
Regional development laboratories allow us to quickly adapt our products to local needs. In the highly service-oriented business with polyurethane systems and specialties, experience, exper-tise and close collaboration with customers are very important. Through our network of 38 system houses worldwide, we provide fast local support – from technical service and sales to marketing – in the development of customized solutions. We work intensively with our customers from an early stage of development in order to find optimal solutions and thus help them to achieve long-term success.
Sales – Plastics(million €)
2010 9,830
wird aktualisiert
2009 7,128
2008 9,116
Sales by division
1 Performance Polymers 45%
2 Polyurethanes 55%
1
2
€9,830million
wird a
ktual
isier
t
55BASF Report 2010 Management’s Analysis
The business year at BASF Group BASF’s segments/Plastics
Segment data Plastics (million €)
2010 2009 Change in %
Sales to third parties 9,830 7,128 37.9
Thereof Performance Polymers 4,389 3,005 46.1
Polyurethanes 5,441 4,123 32.0
Intersegmental transfers 546 363 50.4
Sales including intersegmental transfers 10,376 7,491 38.5
Income from operations before depreciation and amortization (EBITDA) 1,721 994 73.1
EBITDA margin (%) 17.5 13.9 –
Income from operations (EBIT) before special items 1,284 576 122.9
Income from operations (EBIT) 1,273 554 129.8
Income from operations (EBIT) after cost of capital 816 139 487.1
Assets 5,114 4,530 12.9
Research and development expenses 141 126 11.9
Additions to property, plant and equipment and intangible assets 250 249 0.4
In the Plastics segment, sales to third parties grew sharply compared with the previous year, rising by €2,702 million to €9,830 million (volumes 22%, prices 10%, currencies 6%). At €1,273 million, income from operations was also far above the 2009 level. This posi-tive development was due to the unexpectedly high demand from nearly all customer industries as well as supply shortages for certain products, especially poly-amide intermediates. Our measures to increase effi-ciency also contributed to the rise in earnings. We expect sales and earnings in 2011 to slightly exceed the level of the previous year. We anticipate that demand for our products will remain volatile and that increasing product availability will have a negative impact on margins.
Performance PolymersOur sales to third parties were €4,389 million, a strong increase over the previous year (volumes 20%, prices 21%, currencies 5%). The pace of global economic recovery quickened in 2010;
there was a substantial revival in demand from our key customer industries – the automotive, construction, and electrical indus-tries as well as the Asian textiles industry. Capacity utilization rates at our plants were very high. While the division had already experienced rising volumes in Asia in 2009, it was not until 2010 that these began to increase considerably in Europe and North America. The engineering plastics business, which had been hardest hit by the economic crisis, benefited from government stimulus programs for the automotive and household appliance industries and posted a 40% increase in sales volumes compared with the previous year. Growing interest in thermal insulation for buildings helped lift sales volumes of foams despite the difficult economic situation in the construction sector. Increasing volumes and higher prices contributed to sales growth. In particular for standard products such as polyamides and foams, sales prices rose as a result of sharply higher raw materials costs. Thanks to good demand and tight product supplies, we were able to raise prices for engineering plastics.
Factors influencing sales – Plastics
Volumes 22%
Prices 10%
Portfolio 0%
Currencies 6%
Sales 38%
wird aktualisiert
Income from operations – Plastics(million €)
2010 1,273
wird aktualisiert
2009 554
2008 539
56 Management’s Analysis BASF Report 2010
The business year at BASF Group BASF’s segments/Plastics
Performance Polymers Polyurethanes
Strong growth in sales due to higher volumes –Earnings far above – 2009 level in part due to some supply shortages and considerable price increasesProjects to increase efficiency successfully –continued worldwideOutlook – 2011: slight increase in sales; earnings at previous year’s level
Sales in all regions and product lines sharply increase –due to higher sales volumes and positive currency effectsEarnings far above the level of the previous year –Continuous expansion of our system house network –Outlook – 2011: slight sales and earnings growth
Income from operations increased sharply, owing to the unex-pectedly robust economic recovery – especially in the automo-tive sector – as well as some supply shortages and consider-able price increases. We continued to carry out our projects to increase efficiency around the world. These included, in particular, the restructur-ing of the polyamide 6 activities in Germany and the closure of unprofitable production plants in Pakistan and Brazil. Moreover, we introduced measures to increase the transparency and efficiency of complex business processes and optimized sales structures. In 2011, we aim to grow faster than our most important markets, particularly with engineering plastics and specialties. Despite better product supply on the market, we aim for a slight increase in sales. We expect earnings to match the previous year’s level.
Performance Polymers – Sales by region (location of customer)
1 Europe 49%
2 North America 20%
3 Asia Pacific 26%
4
South America, Africa, Middle East
5%
PolyurethanesOur sales to third parties were €5,441 million, exceeding the pre-vious year’s level by €1,318 million (volumes 24%, prices 1%, currencies 7%). We posted strong sales growth in all product lines and all regions in 2010 due to higher sales volumes as well as positive currency effects. Demand from key customer industries, such as automotive and construction, recovered faster than expected, especially in Asia and Europe. Thanks to the strong economic upturn in China, demand for polyurethanes increased considerably com-pared with the previous year, particularly in Asia.
1
2
3
4
€4,389million
wird a
ktual
isier
t
However, we only marginally increased our sales prices in 2010. It was not until the middle of the year that we were able to grad-ually raise MDI prices as a result of supply shortages. Our margins – in particular for MDI and TDI – did not match the 2009 level as a result of the sharp rise in raw materials prices at the beginning of the year. Nevertheless, income from opera-tions was far above the 2009 level due to higher volumes. In par-ticular, earnings in our specialties business developed positively, as a result of high demand from the automotive sector. As a leading supplier of polyurethane solutions, we are con-tinuously expanding our global network of system houses. We now have 38 system houses that offer fast local support in the development of individual solutions as well as technical service for our customers in numerous major industries. Our location in Srem, Poland, started operations in October 2010. Another system house will open in Dubai in 2011. Furthermore, we are planning to construct two polyurethane system houses in Chongqing in Western China and Tianjin in Northern China. In 2011, we expect the market environment to remain unchanged. We anticipate that our sales and earnings will slightly exceed the level of the previous year.
Polyurethanes – Sales by region (location of customer)
1 Europe 36%
2 North America 20%
3 Asia Pacific 37%
4
South America, Africa, Middle East
7%
1
2
3
4
€5,441million
wird a
ktual
isier
t
57BASF Report 2010 Management’s Analysis
The business year at BASF Group BASF’s segments/Performance Products
Performance ProductsInnovative, fast-growing and cyclically resilient
Strategy Acquisition of Cognis
Specialties: innovation, close relationships to –leading customer companies, expertise in applications and developmentStandard products: efficient production structures in –the Verbund, technology and cost leadershipSignificantly strengthened market position with –Cognis acquisition; now market leader in personal care ingredients
December – 9, 2010: acquisition of specialty chemicals company CognisEquity purchase price of – €704 million, net financial debt of €1,806 million, pension obligations of €551 millionCognis businesses nearly entirely integrated into the –Performance Products segment
The Performance Products segment consists of the Dis-persions & Pigments, Care Chemicals, Nutrition & Health, Paper Chemicals and Performance Chemicals divisions. Our customers use our products and services to make their production processes more efficient as well as to give their products an improved application profile and special characteristics to design, protect and maintain surfaces. Care Chemicals and Nutrition & Health offer high-performance products for cleaning, for cosmetics and for better nutrition.
Segment strategySpecialties make up a major part of our product range. Key success factors are innovations, close relationships with lead-ing companies in our customer industries as well as special expertise in applications and development. Our products cre-ate additional value for our customers, which allows them to stand out from their competitors. This is why we prefer to de-velop new solutions together with our customers and strive for long-term collaborations which create profitable growth oppor-tunities for both sides. We have a different business model for standard products, such as dispersions for paper coatings or vitamins. Here, effi-cient production structures within the BASF Verbund, capacity management as well as technology and cost leadership are crucial. We support our customers by being a reliable supplier with lean processes, consistent product quality and a good price/performance ratio. A central element of the value-adding strategy is the active management of our business and product portfolio. We expand the share of innovative, cyclically resilient and fast-growing busi-nesses through acquisitions and divestitures. In April 2010, we completed the structural integration of the businesses acquired from Ciba as planned. At the end of 2010, the synergies from the combined businesses had already reached more than €350 million. By the end of 2012, they will rise to more than €450 million annually. With the acquisition of Cognis on Decem-
ber 9, 2010, we have further strengthened the Performance Products segment and added products to the portfolio that are based on renewable raw materials. This deal has significantly strengthened our position in some markets, particularly for per-sonal care ingredients where we are now the market leader. In the Performance Products segment, we aim for long-term profitable growth. While we are actively expanding some business activities, in other areas we are focusing on the imple-mentation of restructuring and repositioning plans. To this end, we are defining and implementing new strategies and appropri-ate business models.
Cognis acquisition BASF acquired the specialty chemicals company Cognis on December 9, 2010. The equity purchase price was €704 mil-lion; on the acquisition date, net financial debt of €1,806 million and pension obligations of €551 million were assumed. Almost all of the Cognis businesses have been integrated into the Performance Products segment. To prepare for the realization of the integration, the divisional structure of the seg-ment was modified as of August 1, 2010: The existing Care Chemicals division was split in two. The new division Nutrition & Health comprises products and system solutions for the nutrition and health market as well as for the fragrances and flavors industry. It combines BASF’s businesses with Human and Animal Nutrition, Pharma Ingredients & Services, and Aroma Chemicals with the former Cognis segment Nutrition & Health. The Care Chemicals division now comprises products and system solutions for cleaning, cosmetics and hygiene. It merges BASF’s businesses Personal Care, Hygiene, Home Care and Formulation Technologies with the former Cognis segment Care Chemicals, which contained the businesses Personal Care and Home Care. Thanks to the integration of Cognis, we are also now able to offer our customers in the Performance Chemicals and Dis-persions & Pigments divisions an even more attractive product portfolio: Formulation additives and resins from Cognis have
58 Management’s Analysis BASF Report 2010
The business year at BASF Group BASF’s segments/Performance Products
Care Chemicals division split into two divisions Products
Existing Care Chemicals division split into the divisions –Care Chemicals and Nutrition & Health Nutrition – & Health comprises products and system solutions for the nutrition and health market as well as for the fragrances and flavors industryThe Care Chemicals division comprises products –and system solutions for cleaning, cosmetics and hygiene
Dispersions – & Pigments: products for coatings and paintsCare Chemicals: ingredients for cosmetics, detergents – & cleaners as well as hygieneNutrition – & Health: products for human and animal nutrition, pharma and aroma chemicalsPaper Chemicals: products for the paper industry –Performance Chemicals: system solutions –for industrial applications
expanded our product range in the Dispersions & Pigments division. New additions to the Performance Chemicals division’s portfolio include Cognis’ mining chemicals and synthetic lubri-cants businesses. Detailed integration plans will be developed by the end of March 2011 and the structural integration should be completed by the end of 2011.
Our productsThe Dispersions & Pigments division mainly comprises prod-ucts for the coatings and paints industry in particular. Our portfolio includes pigments, resins, dispersions and additives such as photoinitiators, light stabilizers and formulation addi-tives. Other customer industries include the adhesive as well as the printing and packaging industries. Our product range for these customers includes everything from dispersions for labels, protective film and adhesive tape to color and effect pig-ments as well as resins for water-based printing systems. Our dispersions and additives are also used in the production of nonwoven materials, natural fiber composites and construction chemicals. The Care Chemicals portfolio comprises products for cos-metics, detergents & cleaners, and hygiene. Through the acqui-sition of Cognis, we have become the leading supplier of ingre-dients to the cosmetics industry. With our broad range of products we are represented in all personal care applications, such as sun protection, skin and body care, oral hygiene, hair care and decorative cosmetics. The Cognis activities will also expand our wide variety of products for the detergents and cleaners industry which serve as the basis for our customers’ formulations. Our portfolio mainly comprises surfactants, poly-mers, emollients, chelating agents, UV filters and other special-ties that are also used in technical applications. Superabsor-bents round out our portfolio; we offer our customers tailor-made products, developed to their specific requirements in all fields of hygiene applications.
Human and animal nutrition, pharma and aroma chemicals are the core business areas of the Nutrition & Health division. The main animal nutrition products are vitamins, carotenoids and enzymes. In human nutrition, in addition to vitamins, carotenoids and omega-3 fatty acids, an increasingly important role is played by products based on renewable raw materials such as sterols and conjugated linoleic acids. Food additives such as emulsifi-ers and enzymes are also becoming more significant. With the acquisition of Cognis, we have considerably strengthened our market position in these areas. We provide the pharmaceutical industry with active ingredients such as caffeine and ibuprofen, as well as excipients and customized synthesis services. In addition, we produce aroma chemicals for the fragrances and flavors industry. Paper Chemicals supplies products for the paper indus-try. Our portfolio comprises binders, functional chemicals, pro-cess chemicals and kaolin minerals. By using our products to improve efficiency in the paper manufacturing process, our cus-tomers are able to reduce costs. Furthermore, our products give paper certain attributes and enhance the aesthetics and per-formance of printed paper and board. Performance Chemicals is an innovative partner for various industrial customer sectors and offers specific system solutions. The plastic additives business comprises a product portfolio of antioxidants, pigments and light stabilizers. We want to continue to grow through innovation and targeted market development in the business areas mining and oilfield chemi-cals as well as water treatment chemicals. For the automotive and refinery industries, we develop, produce and market brake fluids, engine coolants, fuel and lubricant additives as well as process and refinery chemicals. The division also manufac-tures chemicals for the production and finishing of leather and textiles.
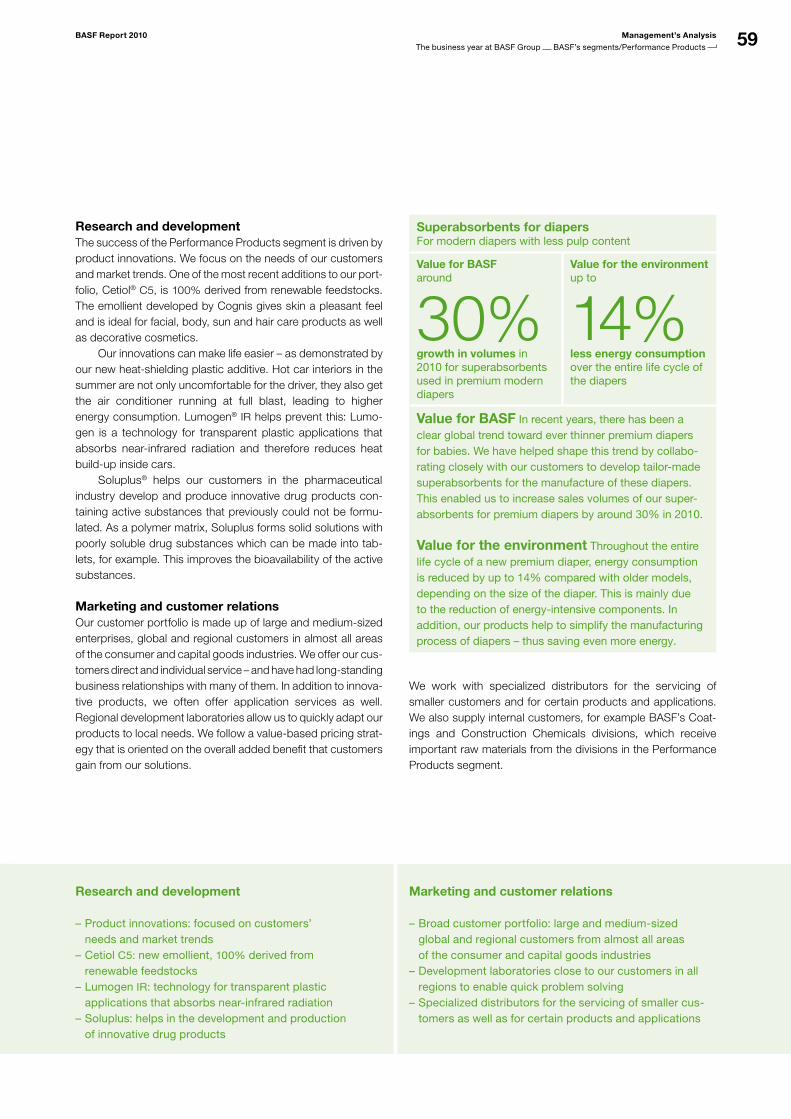
59BASF Report 2010 Management’s Analysis
The business year at BASF Group BASF’s segments/Performance Products
Research and development Marketing and customer relations
Product innovations: focused on customers’ –needs and market trendsCetiol – C5: new emollient, 100% derived from renewable feedstocksLumogen – IR: technology for transparent plastic applications that absorbs nearinfrared radiation Soluplus: helps in the development and production –of innovative drug products
Broad customer portfolio: large and mediumsized –global and regional customers from almost all areas of the consumer and capital goods industriesDevelopment laboratories close to our customers in all – regions to enable quick problem solvingSpecialized distributors for the servicing of smaller cus –tomers as well as for certain products and applications
Research and developmentThe success of the Performance Products segment is driven by product innovations. We focus on the needs of our customers and market trends. One of the most recent additions to our port-folio, Cetiol® C5, is 100% derived from renewable feedstocks. The emollient developed by Cognis gives skin a pleasant feel and is ideal for facial, body, sun and hair care products as well as decorative cosmetics. Our innovations can make life easier – as demonstrated by our new heat-shielding plastic additive. Hot car interiors in the summer are not only uncomfortable for the driver, they also get the air conditioner running at full blast, leading to higher energy consumption. Lumogen® IR helps prevent this: Lumo-gen is a technology for transparent plastic applications that absorbs near-infrared radiation and therefore reduces heat build-up inside cars. Soluplus® helps our customers in the pharmaceutical industry develop and produce innovative drug products con-taining active substances that previously could not be formu-lated. As a polymer matrix, Soluplus forms solid solutions with poorly soluble drug substances which can be made into tab-lets, for example. This improves the bioavailability of the active substances.
Marketing and customer relationsOur customer portfolio is made up of large and medium-sized enterprises, global and regional customers in almost all areas of the consumer and capital goods industries. We offer our cus-tomers direct and individual service – and have had long-standing business relationships with many of them. In addition to innova-tive products, we often offer application services as well. Regional development laboratories allow us to quickly adapt our products to local needs. We follow a value-based pricing strat-egy that is oriented on the overall added benefit that customers gain from our solutions.
Superabsorbents for diapersFor modern diapers with less pulp content
Value for BASFaround
30%growth in volumes in 2010 for superabsorbents used in premium modern diapers
Value for the environment up to
14%less energy consumption over the entire life cycle of the diapers
Value for BASF In recent years, there has been a clear global trend toward ever thinner premium diapers for babies. We have helped shape this trend by collaborating closely with our customers to develop tailormade superabsorbents for the manufacture of these diapers. This enabled us to increase sales volumes of our superabsorbents for premium diapers by around 30% in 2010.
Value for the environment Throughout the entire life cycle of a new premium diaper, energy consumption is reduced by up to 14% compared with older models, depending on the size of the diaper. This is mainly due to the reduction of energyintensive components. In addition, our products help to simplify the manufacturing process of diapers – thus saving even more energy.
We work with specialized distributors for the servicing of smaller customers and for certain products and applications. We also supply internal customers, for example BASF’s Coat-ings and Construction Chemicals divisions, which receive important raw materials from the divisions in the Performance Products segment.
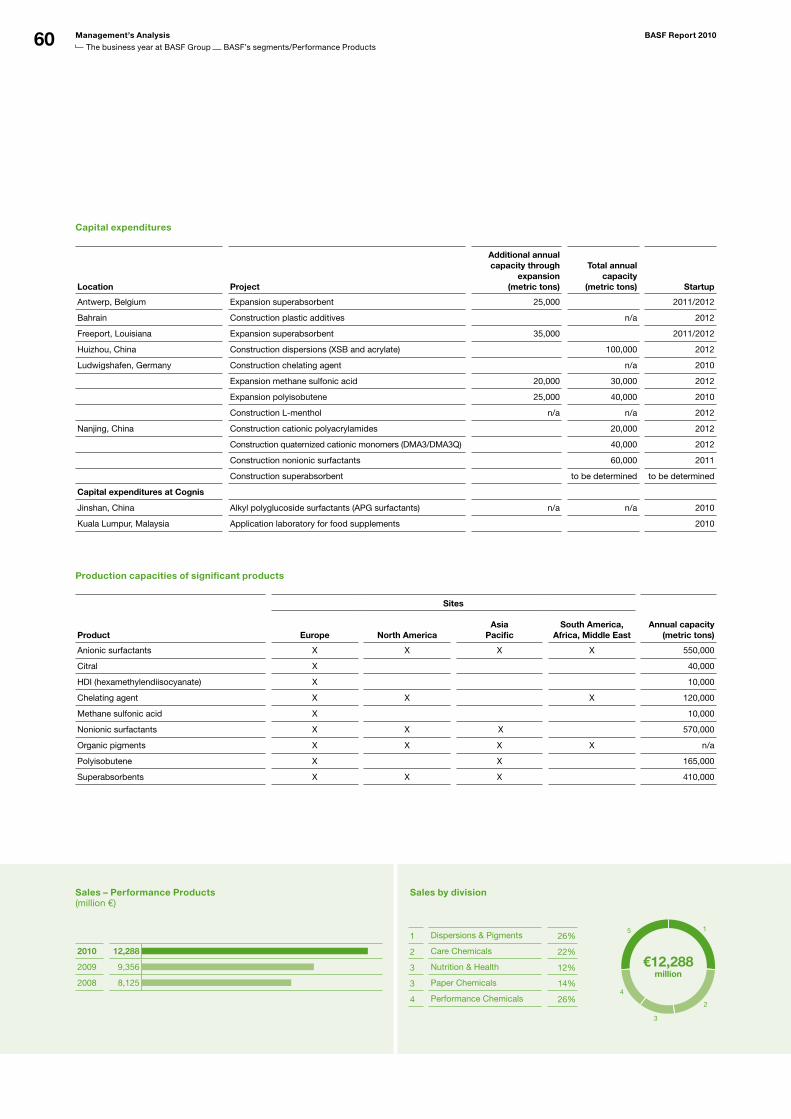
60 Management’s Analysis BASF Report 2010
The business year at BASF Group BASF’s segments/Performance Products
Capital expenditures
Location Project
Additional annual capacity through
expansion (metric tons)
Total annual capacity
(metric tons) Startup
Antwerp, Belgium Expansion superabsorbent 25,000 2011/2012
Bahrain Construction plastic additives n/a 2012
Freeport, Louisiana Expansion superabsorbent 35,000 2011/2012
Huizhou, China Construction dispersions (XSB and acrylate) 100,000 2012
Ludwigshafen, Germany Construction chelating agent n/a 2010
Expansion methane sulfonic acid 20,000 30,000 2012
Expansion polyisobutene 25,000 40,000 2010
Construction Lmenthol n/a n/a 2012
Nanjing, China Construction cationic polyacrylamides 20,000 2012
Construction quaternized cationic monomers (DMA3/DMA3Q) 40,000 2012
Construction nonionic surfactants 60,000 2011
Construction superabsorbent to be determined to be determined
Capital expenditures at Cognis
Jinshan, China Alkyl polyglucoside surfactants (APG surfactants) n/a n/a 2010
Kuala Lumpur, Malaysia Application laboratory for food supplements 2010
Production capacities of significant products
Product
Sites
Annual capacity (metric tons) Europe North America
Asia Pacific
South America, Africa, Middle East
Anionic surfactants X X X X 550,000
Citral X 40,000
HDI (hexamethylendiisocyanate) X 10,000
Chelating agent X X X 120,000
Methane sulfonic acid X 10,000
Nonionic surfactants X X X 570,000
Organic pigments X X X X n/a
Polyisobutene X X 165,000
Superabsorbents X X X 410,000
Sales – Performance Products(million €)
2010 12,288
wird aktualisiert
2009 9,356
2008 8,125
Sales by division
1 Dispersions & Pigments 26%
2 Care Chemicals 22%
3 Nutrition & Health 12%
3 Paper Chemicals 14%
4 Performance Chemicals 26%
1
2
3
4
5
€12,288million
wird a
ktual
isier
t
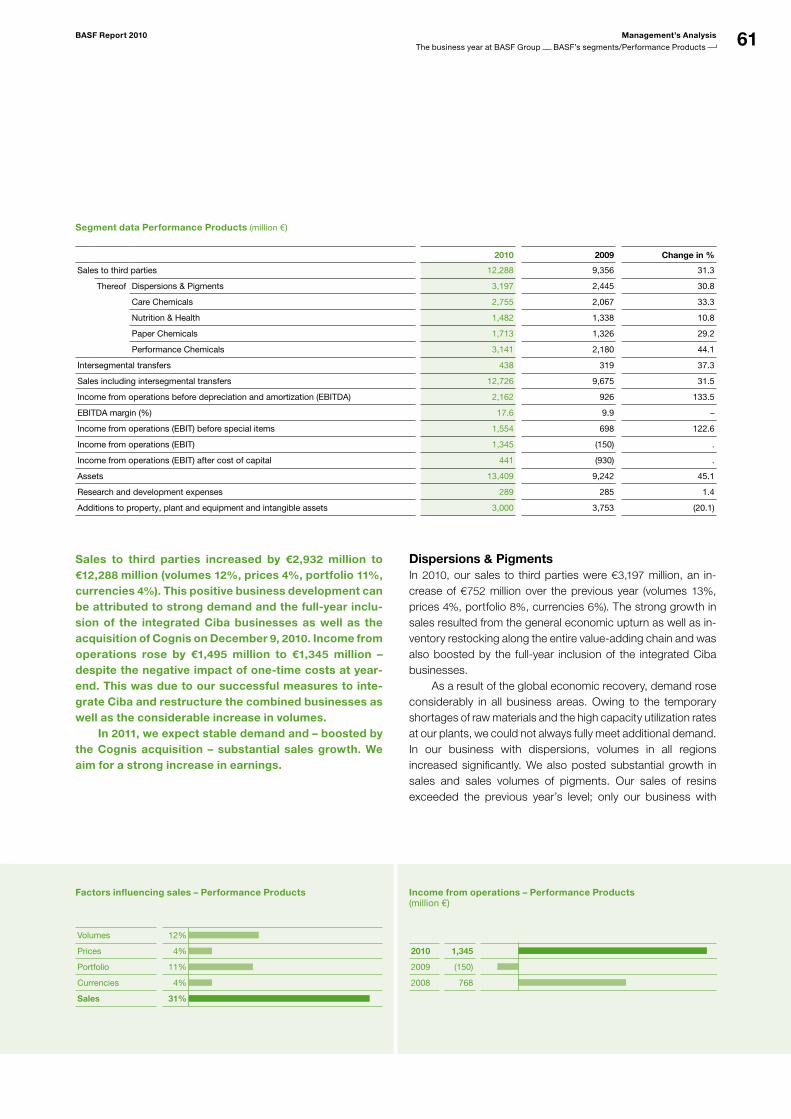
61BASF Report 2010 Management’s Analysis
The business year at BASF Group BASF’s segments/Performance Products
Segment data Performance Products (million €)
2010 2009 Change in %
Sales to third parties 12,288 9,356 31.3
Thereof Dispersions & Pigments 3,197 2,445 30.8
Care Chemicals 2,755 2,067 33.3
Nutrition & Health 1,482 1,338 10.8
Paper Chemicals 1,713 1,326 29.2
Performance Chemicals 3,141 2,180 44.1
Intersegmental transfers 438 319 37.3
Sales including intersegmental transfers 12,726 9,675 31.5
Income from operations before depreciation and amortization (EBITDA) 2,162 926 133.5
EBITDA margin (%) 17.6 9.9 –
Income from operations (EBIT) before special items 1,554 698 122.6
Income from operations (EBIT) 1,345 (150) .
Income from operations (EBIT) after cost of capital 441 (930) .
Assets 13,409 9,242 45.1
Research and development expenses 289 285 1.4
Additions to property, plant and equipment and intangible assets 3,000 3,753 (20.1)
Sales to third parties increased by €2,932 million to €12,288 million (volumes 12%, prices 4%, portfolio 11%, currencies 4%). This positive business development can be attributed to strong demand and the full-year inclu-sion of the integrated Ciba businesses as well as the acquisition of Cognis on December 9, 2010. Income from operations rose by €1,495 million to €1,345 million – despite the negative impact of one-time costs at year-end. This was due to our successful measures to inte-grate Ciba and restructure the combined businesses as well as the considerable increase in volumes. In 2011, we expect stable demand and – boosted by the Cognis acquisition – substantial sales growth. We aim for a strong increase in earnings.
Dispersions & PigmentsIn 2010, our sales to third parties were €3,197 million, an in-crease of €752 million over the previous year (volumes 13%, prices 4%, portfolio 8%, currencies 6%). The strong growth in sales resulted from the general economic upturn as well as in-ventory restocking along the entire value-adding chain and was also boosted by the full-year inclusion of the integrated Ciba businesses. As a result of the global economic recovery, demand rose considerably in all business areas. Owing to the temporary shortages of raw materials and the high capacity utilization rates at our plants, we could not always fully meet additional demand. In our business with dispersions, volumes in all regions increased significantly. We also posted substantial growth in sales and sales volumes of pigments. Our sales of resins exceeded the previous year’s level; only our business with
Factors influencing sales – Performance Products
Volumes 12%
Prices 4%
Portfolio 11%
Currencies 4%
Sales 31%
wird aktualisiert
Income from operations – Performance Products(million €)
2010 1,345
2009 (150)
2008 768
wird aktualisiert
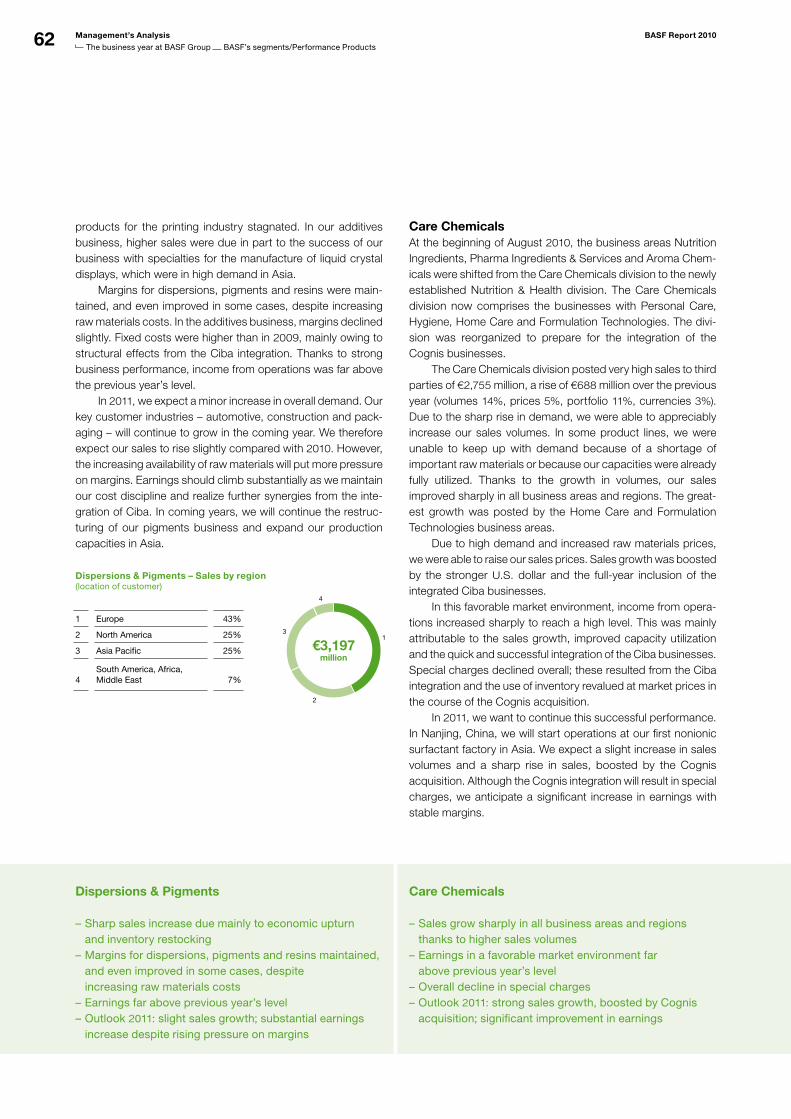
62 Management’s Analysis BASF Report 2010
The business year at BASF Group BASF’s segments/Performance Products
Dispersions & Pigments Care Chemicals
Sharp sales increase due mainly to economic upturn –and inventory restockingMargins for dispersions, pigments and resins maintained, –and even improved in some cases, despite increasing raw materials costsEarnings far above previous year’s level –Outlook – 2011: slight sales growth; substantial earnings increase despite rising pressure on margins
Sales grow sharply in all business areas and regions –thanks to higher sales volumesEarnings in a favorable market environment far –above previous year’s levelOverall decline in special charges –Outlook – 2011: strong sales growth, boosted by Cognis acquisition; significant improvement in earnings
products for the printing industry stagnated. In our additives business, higher sales were due in part to the success of our business with specialties for the manufacture of liquid crystal displays, which were in high demand in Asia. Margins for dispersions, pigments and resins were main-tained, and even improved in some cases, despite increasing raw materials costs. In the additives business, margins declined slightly. Fixed costs were higher than in 2009, mainly owing to structural effects from the Ciba integration. Thanks to strong business performance, income from operations was far above the previous year’s level. In 2011, we expect a minor increase in overall demand. Our key customer industries – automotive, construction and pack-aging – will continue to grow in the coming year. We therefore expect our sales to rise slightly compared with 2010. However, the increasing availability of raw materials will put more pressure on margins. Earnings should climb substantially as we maintain our cost discipline and realize further synergies from the inte-gration of Ciba. In coming years, we will continue the restruc-turing of our pigments business and expand our production capacities in Asia.
Dispersions & Pigments – Sales by region (location of customer)
1 Europe 43%
2 North America 25%
3 Asia Pacific 25%
4
South America, Africa, Middle East 7%
1
2
3
4
€3,197million
wird a
ktual
isier
t
Care ChemicalsAt the beginning of August 2010, the business areas Nutrition Ingredients, Pharma Ingredients & Services and Aroma Chem-icals were shifted from the Care Chemicals division to the newly established Nutrition & Health division. The Care Chemicals division now comprises the businesses with Personal Care, Hygiene, Home Care and Formulation Technologies. The divi-sion was reorganized to prepare for the integration of the Cognis businesses. The Care Chemicals division posted very high sales to third parties of €2,755 million, a rise of €688 million over the previous year (volumes 14%, prices 5%, portfolio 11%, currencies 3%). Due to the sharp rise in demand, we were able to appreciably increase our sales volumes. In some product lines, we were unable to keep up with demand because of a shortage of important raw materials or because our capacities were already fully utilized. Thanks to the growth in volumes, our sales improved sharply in all business areas and regions. The great-est growth was posted by the Home Care and Formulation Technologies business areas. Due to high demand and increased raw materials prices, we were able to raise our sales prices. Sales growth was boosted by the stronger U.S. dollar and the full-year inclusion of the integrated Ciba businesses. In this favorable market environment, income from opera-tions increased sharply to reach a high level. This was mainly attributable to the sales growth, improved capacity utilization and the quick and successful integration of the Ciba businesses. Special charges declined overall; these resulted from the Ciba integration and the use of inventory revalued at market prices in the course of the Cognis acquisition. In 2011, we want to continue this successful performance. In Nanjing, China, we will start operations at our first nonionic surfactant factory in Asia. We expect a slight increase in sales volumes and a sharp rise in sales, boosted by the Cognis acquisition. Although the Cognis integration will result in special charges, we anticipate a significant increase in earnings with stable margins.
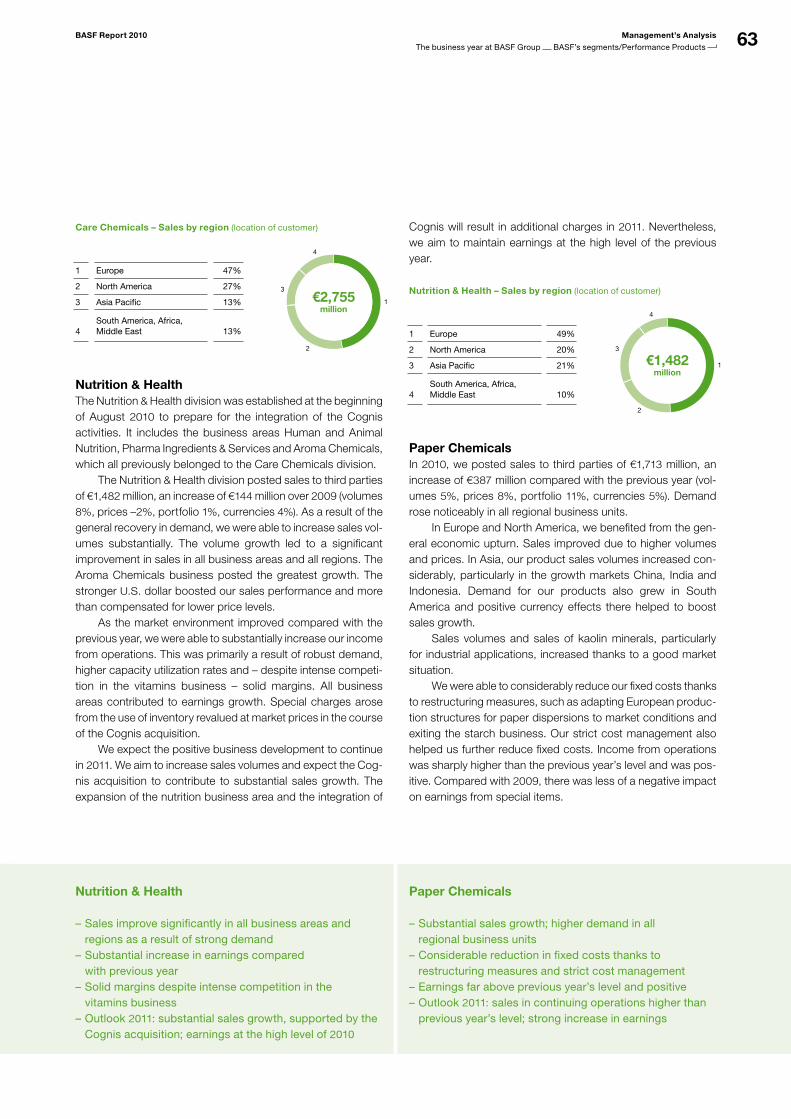
63BASF Report 2010 Management’s Analysis
The business year at BASF Group BASF’s segments/Performance Products
Care Chemicals – Sales by region (location of customer)
1 Europe 47%
2 North America 27%
3 Asia Pacific 13%
4
South America, Africa, Middle East 13%
Nutrition & HealthThe Nutrition & Health division was established at the beginning of August 2010 to prepare for the integration of the Cognis activities. It includes the business areas Human and Animal Nutrition, Pharma Ingredients & Services and Aroma Chemicals, which all previously belonged to the Care Chemicals division. The Nutrition & Health division posted sales to third parties of €1,482 million, an increase of €144 million over 2009 (volumes 8%, prices –2%, portfolio 1%, currencies 4%). As a result of the general recovery in demand, we were able to increase sales vol-umes substantially. The volume growth led to a significant improvement in sales in all business areas and all regions. The Aroma Chemicals business posted the greatest growth. The stronger U.S. dollar boosted our sales performance and more than compensated for lower price levels. As the market environment improved compared with the previous year, we were able to substantially increase our income from operations. This was primarily a result of robust demand, higher capacity utilization rates and – despite intense competi-tion in the vitamins business – solid margins. All business areas contributed to earnings growth. Special charges arose from the use of inventory revalued at market prices in the course of the Cognis acquisition. We expect the positive business development to continue in 2011. We aim to increase sales volumes and expect the Cog-nis acquisition to contribute to substantial sales growth. The expansion of the nutrition business area and the integration of
1
2
3
4
€2,755million
wird a
ktual
isier
t
Cognis will result in additional charges in 2011. Nevertheless, we aim to maintain earnings at the high level of the previous year.
Nutrition & Health – Sales by region (location of customer)
1 Europe 49%
2 North America 20%
3 Asia Pacific 21%
4
South America, Africa, Middle East 10%
Paper ChemicalsIn 2010, we posted sales to third parties of €1,713 million, an increase of €387 million compared with the previous year (vol-umes 5%, prices 8%, portfolio 11%, currencies 5%). Demand rose noticeably in all regional business units. In Europe and North America, we benefited from the gen-eral economic upturn. Sales improved due to higher volumes and prices. In Asia, our product sales volumes increased con-siderably, particularly in the growth markets China, India and Indonesia. Demand for our products also grew in South America and positive currency effects there helped to boost sales growth. Sales volumes and sales of kaolin minerals, particularly for industrial applications, increased thanks to a good market situation. We were able to considerably reduce our fixed costs thanks to restructuring measures, such as adapting European produc-tion structures for paper dispersions to market conditions and exiting the starch business. Our strict cost management also helped us further reduce fixed costs. Income from operations was sharply higher than the previous year’s level and was pos-itive. Compared with 2009, there was less of a negative impact on earnings from special items.
1
2
3
4
€1,482million
wird a
ktual
isier
t
Nutrition & Health Paper Chemicals
Sales improve significantly in all business areas and –regions as a result of strong demandSubstantial increase in earnings compared –with previous yearSolid margins despite intense competition in the –vitamins businessOutlook – 2011: substantial sales growth, supported by the Cognis acquisition; earnings at the high level of 2010
Substantial sales growth; higher demand in all –regional business unitsConsiderable reduction in fixed costs thanks to –restructuring measures and strict cost managementEarnings far above previous year’s level and positive –Outlook – 2011: sales in continuing operations higher than previous year’s level; strong increase in earnings
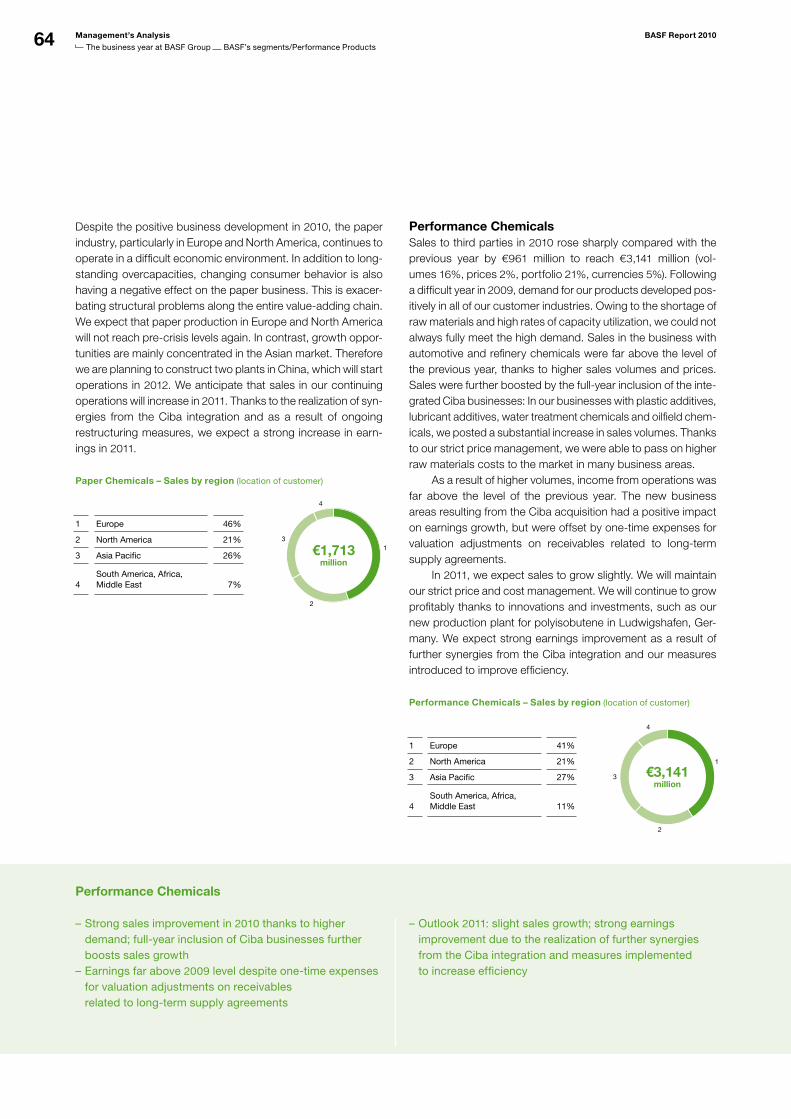
64 Management’s Analysis BASF Report 2010
The business year at BASF Group BASF’s segments/Performance Products
Performance Chemicals
Despite the positive business development in 2010, the paper industry, particularly in Europe and North America, continues to operate in a difficult economic environment. In addition to long-standing overcapacities, changing consumer behavior is also having a negative effect on the paper business. This is exacer-bating structural problems along the entire value-adding chain. We expect that paper production in Europe and North America will not reach pre-crisis levels again. In contrast, growth oppor-tunities are mainly concentrated in the Asian market. Therefore we are planning to construct two plants in China, which will start operations in 2012. We anticipate that sales in our continuing operations will increase in 2011. Thanks to the realization of syn-ergies from the Ciba integration and as a result of ongoing restructuring measures, we expect a strong increase in earn-ings in 2011.
Paper Chemicals – Sales by region (location of customer)
1 Europe 46%
2 North America 21%
3 Asia Pacific 26%
4
South America, Africa, Middle East 7%
1
2
3
4
€1,713million
wird a
ktual
isier
t
Performance ChemicalsSales to third parties in 2010 rose sharply compared with the previous year by €961 million to reach €3,141 million (vol-umes 16%, prices 2%, portfolio 21%, currencies 5%). Following a difficult year in 2009, demand for our products developed pos-itively in all of our customer industries. Owing to the shortage of raw materials and high rates of capacity utilization, we could not always fully meet the high demand. Sales in the business with automotive and refinery chemicals were far above the level of the previous year, thanks to higher sales volumes and prices. Sales were further boosted by the full-year inclusion of the inte-grated Ciba businesses: In our businesses with plastic additives, lubricant additives, water treatment chemicals and oilfield chem-icals, we posted a substantial increase in sales volumes. Thanks to our strict price management, we were able to pass on higher raw materials costs to the market in many business areas. As a result of higher volumes, income from operations was far above the level of the previous year. The new business areas resulting from the Ciba acquisition had a positive impact on earnings growth, but were offset by one-time expenses for valuation adjustments on receivables related to long-term supply agreements. In 2011, we expect sales to grow slightly. We will maintain our strict price and cost management. We will continue to grow profitably thanks to innovations and investments, such as our new production plant for polyisobutene in Ludwigshafen, Ger-many. We expect strong earnings improvement as a result of further synergies from the Ciba integration and our measures introduced to improve efficiency.
Performance Chemicals – Sales by region (location of customer)
1 Europe 41%
2 North America 21%
3 Asia Pacific 27%
4
South America, Africa, Middle East 11%
1
2
3
4
€3,141million
wird a
ktual
isier
t
Strong sales improvement in – 2010 thanks to higher demand; fullyear inclusion of Ciba businesses further boosts sales growthEarnings far above – 2009 level despite onetime expenses for valuation adjustments on receivables related to longterm supply agreements
Outlook – 2011: slight sales growth; strong earnings improvement due to the realization of further synergies from the Ciba integration and measures implemented to increase efficiency
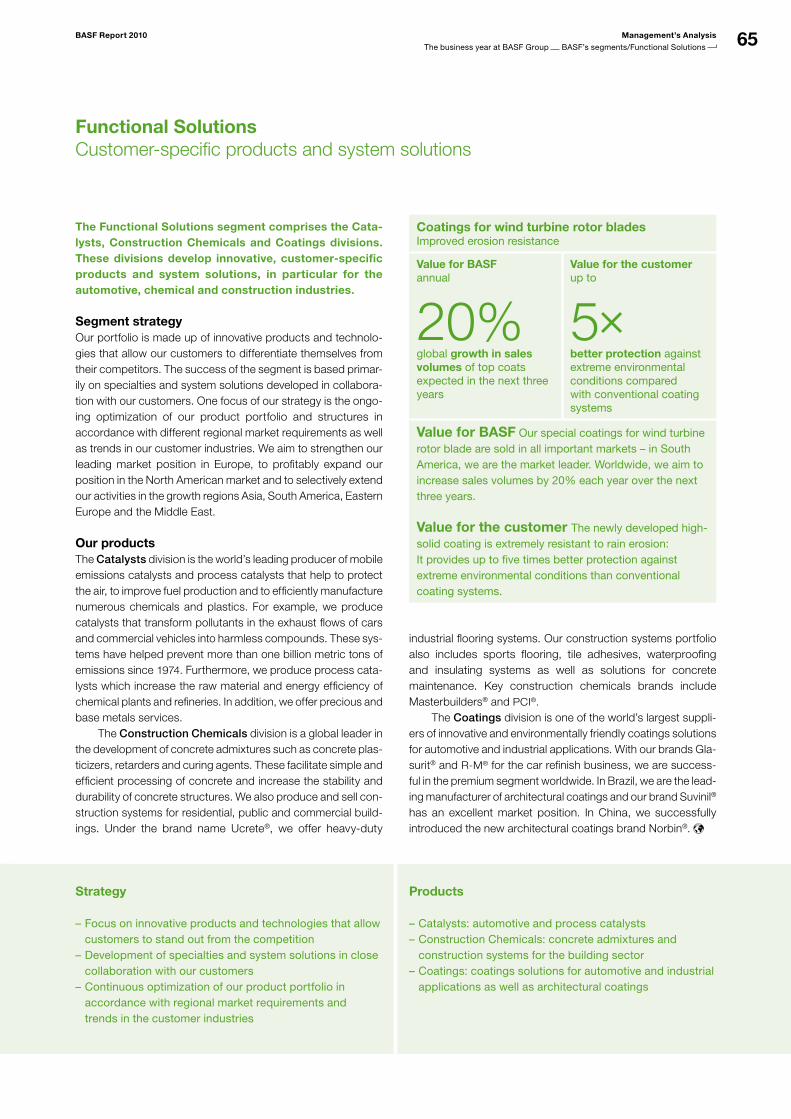
65BASF Report 2010 Management’s Analysis
The business year at BASF Group BASF’s segments/Functional Solutions
Functional SolutionsCustomer-specific products and system solutions
The Functional Solutions segment comprises the Cata-lysts, Construction Chemicals and Coatings divisions. These divisions develop innovative, customer-specific products and system solutions, in particular for the automotive, chemical and construction industries.
Segment strategyOur portfolio is made up of innovative products and technolo-gies that allow our customers to differentiate themselves from their competitors. The success of the segment is based primar-ily on specialties and system solutions developed in collabora-tion with our customers. One focus of our strategy is the ongo-ing optimization of our product portfolio and structures in accordance with different regional market requirements as well as trends in our customer industries. We aim to strengthen our leading market position in Europe, to profitably expand our position in the North American market and to selectively extend our activities in the growth regions Asia, South America, Eastern Europe and the Middle East.
Our productsThe Catalysts division is the world’s leading producer of mobile emissions catalysts and process catalysts that help to protect the air, to improve fuel production and to efficiently manufacture numerous chemicals and plastics. For example, we produce catalysts that transform pollutants in the exhaust flows of cars and commercial vehicles into harmless compounds. These sys-tems have helped prevent more than one billion metric tons of emissions since 1974. Furthermore, we produce process cata-lysts which increase the raw material and energy efficiency of chemical plants and refineries. In addition, we offer precious and base metals services. The Construction Chemicals division is a global leader in the development of concrete admixtures such as concrete plas-ticizers, retarders and curing agents. These facilitate simple and efficient processing of concrete and increase the stability and durability of concrete structures. We also produce and sell con-struction systems for residential, public and commercial build-ings. Under the brand name Ucrete®, we offer heavy-duty
Coatings for wind turbine rotor bladesImproved erosion resistance
Value for BASFannual
20%global growth in sales volumes of top coats expected in the next three years
Value for the customerup to
5 better protection against extreme environmental conditions compared with conventional coating systems
Value for BASF Our special coatings for wind turbine rotor blade are sold in all important markets – in South America, we are the market leader. Worldwide, we aim to increase sales volumes by 20% each year over the next three years.
Value for the customer The newly developed highsolid coating is extremely resistant to rain erosion: It provides up to five times better protection against extreme environmental conditions than conventional coating systems.
industrial flooring systems. Our construction systems portfolio also includes sports flooring, tile adhesives, waterproofing and insulating systems as well as solutions for concrete maintenance. Key construction chemicals brands include Masterbuilders® and PCI®.
The Coatings division is one of the world’s largest suppli-ers of innovative and environmentally friendly coatings solutions for automotive and industrial applications. With our brands Gla-surit® and R-M® for the car refinish business, we are success-ful in the premium segment worldwide. In Brazil, we are the lead-ing manufacturer of architectural coatings and our brand Suvinil® has an excellent market position. In China, we successfully introduced the new architectural coatings brand Norbin®.
Strategy Products
Focus on innovative products and technologies that allow –customers to stand out from the competitionDevelopment of specialties and system solutions in close –collaboration with our customersContinuous optimization of our product portfolio in –accordance with regional market requirements and trends in the customer industries
Catalysts: automotive and process catalysts –Construction Chemicals: concrete admixtures and –construction systems for the building sectorCoatings: coatings solutions for automotive and industrial –applications as well as architectural coatings
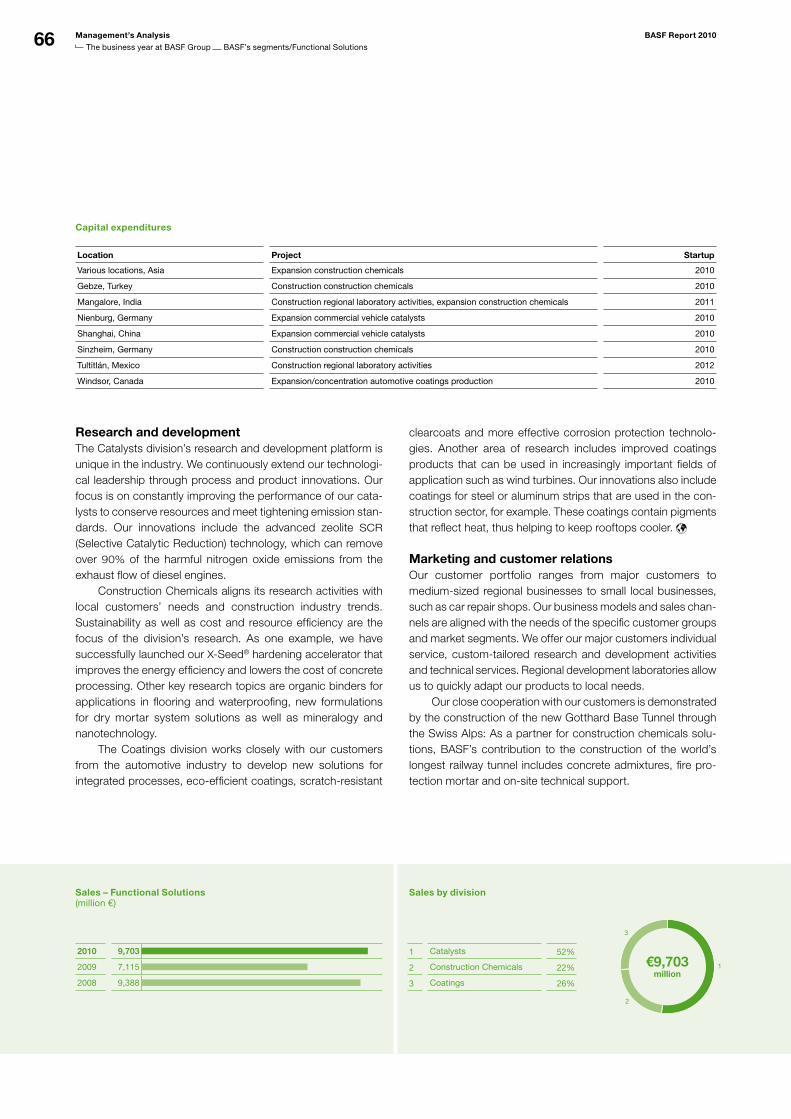
66 Management’s Analysis BASF Report 2010
The business year at BASF Group BASF’s segments/Functional Solutions
Capital expenditures
Location Project Startup
Various locations, Asia Expansion construction chemicals 2010
Gebze, Turkey Construction construction chemicals 2010
Mangalore, India Construction regional laboratory activities, expansion construction chemicals 2011
Nienburg, Germany Expansion commercial vehicle catalysts 2010
Shanghai, China Expansion commercial vehicle catalysts 2010
Sinzheim, Germany Construction construction chemicals 2010
Tultitlán, Mexico Construction regional laboratory activities 2012
Windsor, Canada Expansion/concentration automotive coatings production 2010
Sales – Functional Solutions(million €)
2010 9,703
wird aktualisiert
2009 7,115
2008 9,388
Research and developmentThe Catalysts division’s research and development platform is unique in the industry. We continuously extend our technologi-cal leadership through process and product innovations. Our focus is on constantly improving the performance of our cata-lysts to conserve resources and meet tightening emission stan-dards. Our innovations include the advanced zeolite SCR ( Selective Catalytic Reduction) technology, which can remove over 90% of the harmful nitrogen oxide emissions from the exhaust flow of diesel engines. Construction Chemicals aligns its research activities with local customers’ needs and construction industry trends. Sustainability as well as cost and resource efficiency are the focus of the division’s research. As one example, we have successfully launched our X-Seed® hardening accelerator that improves the energy efficiency and lowers the cost of concrete processing. Other key research topics are organic binders for applications in flooring and waterproofing, new formulations for dry mortar system solutions as well as mineralogy and nanotechnology. The Coatings division works closely with our customers from the automotive industry to develop new solutions for integrated processes, eco-efficient coatings, scratch-resistant
clearcoats and more effective corrosion protection technolo-gies. Another area of research includes improved coatings products that can be used in increasingly important fields of application such as wind turbines. Our innovations also include coatings for steel or aluminum strips that are used in the con-struction sector, for example. These coatings contain pigments that reflect heat, thus helping to keep rooftops cooler.
Marketing and customer relationsOur customer portfolio ranges from major customers to medium-sized regional businesses to small local businesses, such as car repair shops. Our business models and sales chan-nels are aligned with the needs of the specific customer groups and market segments. We offer our major customers individual service, custom-tailored research and development activities and technical services. Regional development laboratories allow us to quickly adapt our products to local needs. Our close cooperation with our customers is demonstrated by the construction of the new Gotthard Base Tunnel through the Swiss Alps: As a partner for construction chemicals solu-tions, BASF’s contribution to the construction of the world’s longest railway tunnel includes concrete admixtures, fire pro-tection mortar and on-site technical support.
Sales by division
1 Catalysts 52%
2 Construction Chemicals 22%
3 Coatings 26%
1
2
3
€9,703million
wird a
ktual
isier
t
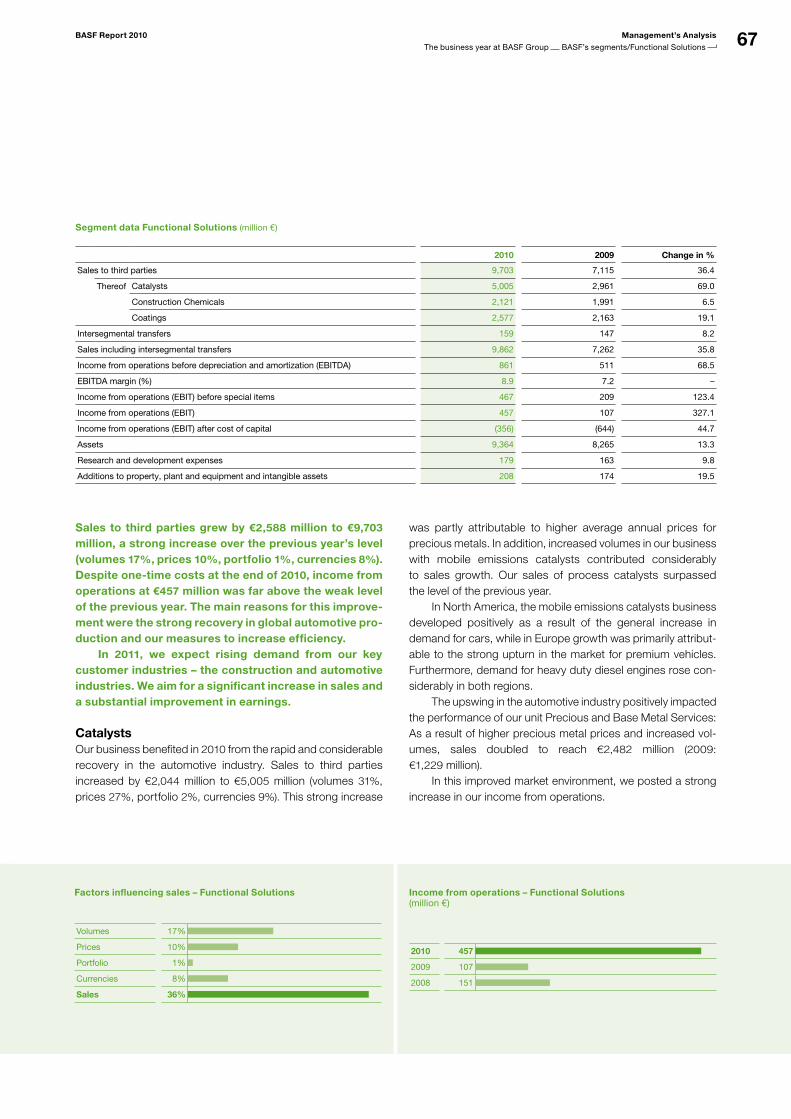
67BASF Report 2010 Management’s Analysis
The business year at BASF Group BASF’s segments/Functional Solutions
Segment data Functional Solutions (million €)
2010 2009 Change in %
Sales to third parties 9,703 7,115 36.4
Thereof Catalysts 5,005 2,961 69.0
Construction Chemicals 2,121 1,991 6.5
Coatings 2,577 2,163 19.1
Intersegmental transfers 159 147 8.2
Sales including intersegmental transfers 9,862 7,262 35.8
Income from operations before depreciation and amortization (EBITDA) 861 511 68.5
EBITDA margin (%) 8.9 7.2 –
Income from operations (EBIT) before special items 467 209 123.4
Income from operations (EBIT) 457 107 327.1
Income from operations (EBIT) after cost of capital (356) (644) 44.7
Assets 9,364 8,265 13.3
Research and development expenses 179 163 9.8
Additions to property, plant and equipment and intangible assets 208 174 19.5
Sales to third parties grew by €2,588 million to €9,703 million, a strong increase over the previous year’s level (volumes 17%, prices 10%, portfolio 1%, currencies 8%). Despite one-time costs at the end of 2010, income from operations at €457 million was far above the weak level of the previous year. The main reasons for this improve-ment were the strong recovery in global automotive pro-duction and our measures to increase efficiency. In 2011, we expect rising demand from our key customer industries – the construction and automotive industries. We aim for a significant increase in sales and a substantial improvement in earnings.
CatalystsOur business benefited in 2010 from the rapid and considerable recovery in the automotive industry. Sales to third parties increased by €2,044 million to €5,005 million (volumes 31%, prices 27%, portfolio 2%, currencies 9%). This strong increase
was partly attributable to higher average annual prices for precious metals. In addition, increased volumes in our business with mobile emissions catalysts contributed considerably to sales growth. Our sales of process catalysts surpassed the level of the previous year. In North America, the mobile emissions catalysts business developed positively as a result of the general increase in demand for cars, while in Europe growth was primarily attribut-able to the strong upturn in the market for premium vehicles. Furthermore, demand for heavy duty diesel engines rose con-siderably in both regions. The upswing in the automotive industry positively impacted the performance of our unit Precious and Base Metal Services: As a result of higher precious metal prices and increased vol-umes, sales doubled to reach €2,482 million (2009: €1,229 million). In this improved market environment, we posted a strong increase in our income from operations.
Factors influencing sales – Functional Solutions
Volumes 17%
Prices 10%
Portfolio 1%
Currencies 8%
Sales 36%
wird aktualisiert
Income from operations – Functional Solutions(million €)
2010 457
wird aktualisiert
2009 107
2008 151
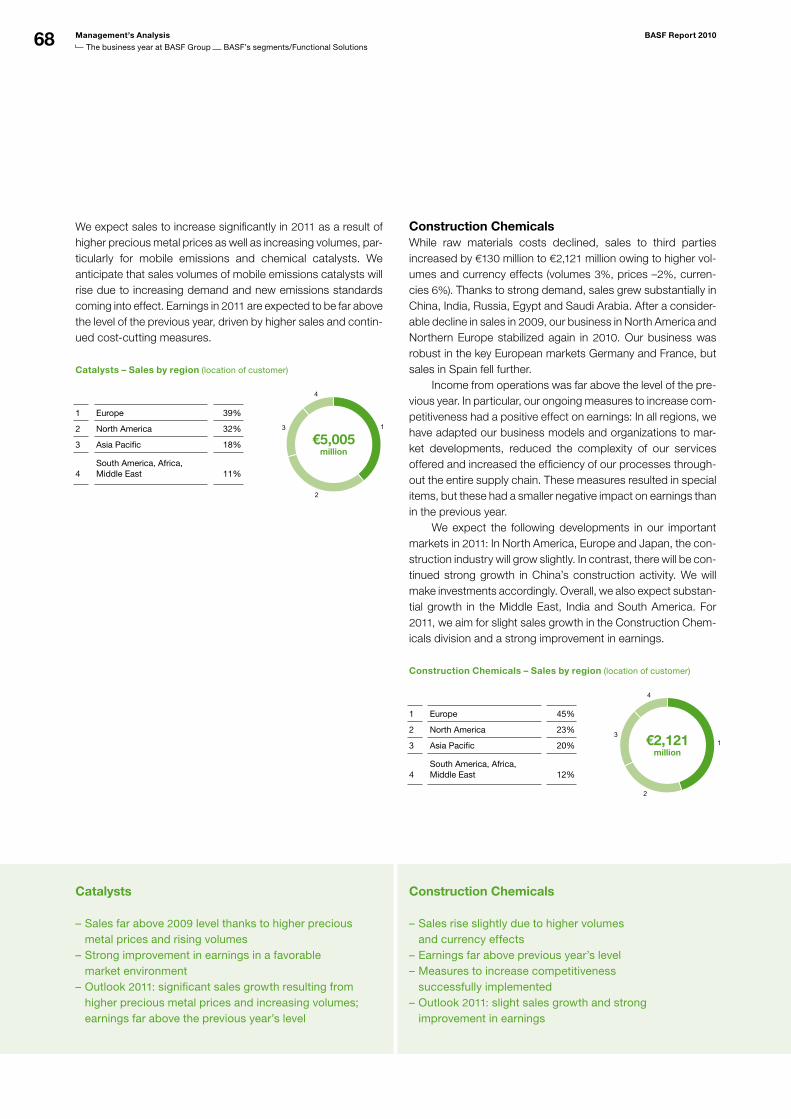
68 Management’s Analysis BASF Report 2010
The business year at BASF Group BASF’s segments/Functional Solutions
Catalysts Construction Chemicals
Sales far above – 2009 level thanks to higher precious metal prices and rising volumesStrong improvement in earnings in a favorable –market environmentOutlook – 2011: significant sales growth resulting from higher precious metal prices and increasing volumes; earnings far above the previous year’s level
Sales rise slightly due to higher volumes –and currency effectsEarnings far above previous year’s level –Measures to increase competitiveness –successfully implementedOutlook – 2011: slight sales growth and strong improvement in earnings
We expect sales to increase significantly in 2011 as a result of higher precious metal prices as well as increasing volumes, par-ticularly for mobile emissions and chemical catalysts. We anticipate that sales volumes of mobile emissions catalysts will rise due to increasing demand and new emissions standards coming into effect. Earnings in 2011 are expected to be far above the level of the previous year, driven by higher sales and contin-ued cost-cutting measures.
Catalysts – Sales by region (location of customer)
1 Europe 39%
2 North America 32%
3 Asia Pacific 18%
4
South America, Africa, Middle East 11%
1
2
3
4
€5,005million
wird a
ktual
isier
t
Construction ChemicalsWhile raw materials costs declined, sales to third parties increased by €130 million to €2,121 million owing to higher vol-umes and currency effects (volumes 3%, prices –2%, curren-cies 6%). Thanks to strong demand, sales grew substantially in China, India, Russia, Egypt and Saudi Arabia. After a consider-able decline in sales in 2009, our business in North America and Northern Europe stabilized again in 2010. Our business was robust in the key European markets Germany and France, but sales in Spain fell further. Income from operations was far above the level of the pre-vious year. In particular, our ongoing measures to increase com-petitiveness had a positive effect on earnings: In all regions, we have adapted our business models and organizations to mar-ket developments, reduced the complexity of our services offered and increased the efficiency of our processes through-out the entire supply chain. These measures resulted in special items, but these had a smaller negative impact on earnings than in the previous year. We expect the following developments in our important markets in 2011: In North America, Europe and Japan, the con-struction industry will grow slightly. In contrast, there will be con-tinued strong growth in China’s construction activity. We will make investments accordingly. Overall, we also expect substan-tial growth in the Middle East, India and South America. For 2011, we aim for slight sales growth in the Construction Chem-icals division and a strong improvement in earnings.
Construction Chemicals – Sales by region (location of customer)
1 Europe 45%
2 North America 23%
3 Asia Pacific 20%
4
South America, Africa, Middle East 12%
1
2
3
4
€2,121million
wird a
ktual
isier
t
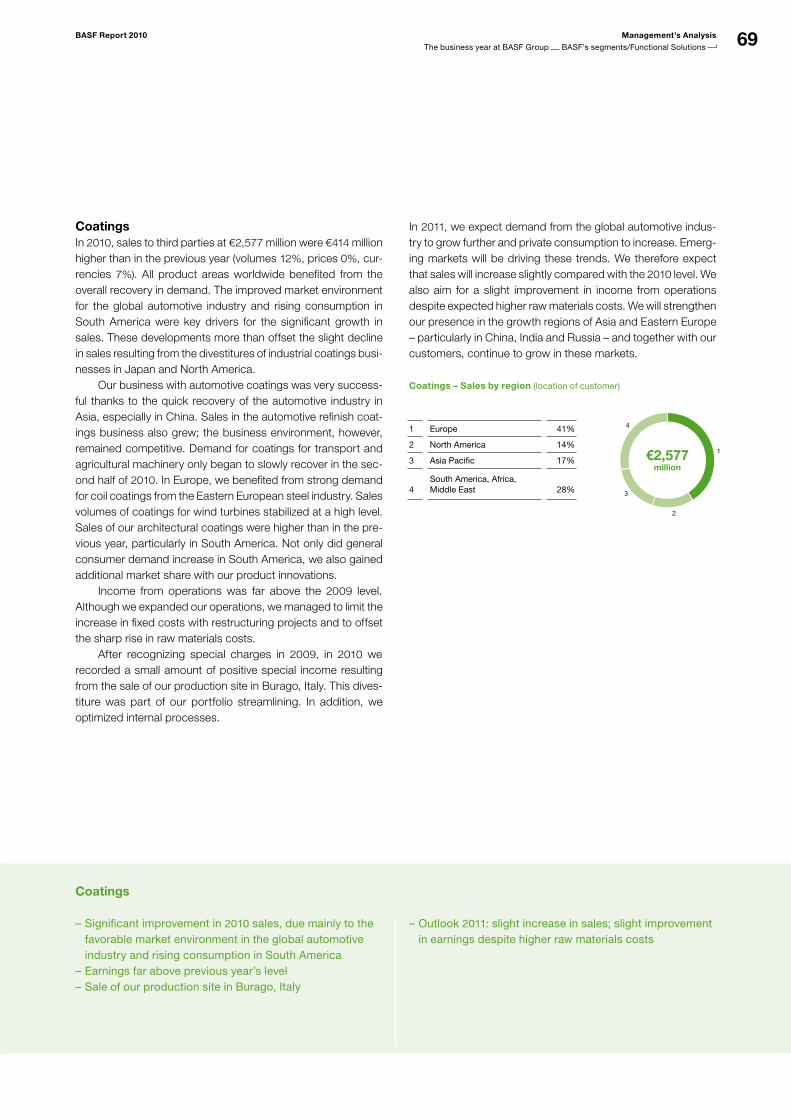
69BASF Report 2010 Management’s Analysis
The business year at BASF Group BASF’s segments/Functional Solutions
Coatings
Significant improvement in – 2010 sales, due mainly to the favorable market environment in the global automotive industry and rising consumption in South AmericaEarnings far above previous year’s level –Sale of our production site in Burago, Italy –
Outlook – 2011: slight increase in sales; slight improvement in earnings despite higher raw materials costs
CoatingsIn 2010, sales to third parties at €2,577 million were €414 million higher than in the previous year (volumes 12%, prices 0%, cur-rencies 7%). All product areas worldwide benefited from the overall recovery in demand. The improved market environment for the global automotive industry and rising consumption in South America were key drivers for the significant growth in sales. These developments more than offset the slight decline in sales resulting from the divestitures of industrial coatings busi-nesses in Japan and North America. Our business with automotive coatings was very success-ful thanks to the quick recovery of the automotive industry in Asia, especially in China. Sales in the automotive refinish coat-ings business also grew; the business environment, however, remained competitive. Demand for coatings for transport and agricultural machinery only began to slowly recover in the sec-ond half of 2010. In Europe, we benefited from strong demand for coil coatings from the Eastern European steel industry. Sales volumes of coatings for wind turbines stabilized at a high level. Sales of our architectural coatings were higher than in the pre-vious year, particularly in South America. Not only did general consumer demand increase in South America, we also gained additional market share with our product innovations. Income from operations was far above the 2009 level. Although we expanded our operations, we managed to limit the increase in fixed costs with restructuring projects and to offset the sharp rise in raw materials costs. After recognizing special charges in 2009, in 2010 we recorded a small amount of positive special income resulting from the sale of our production site in Burago, Italy. This dives-titure was part of our portfolio streamlining. In addition, we optimized internal processes.
In 2011, we expect demand from the global automotive indus-try to grow further and private consumption to increase. Emerg-ing markets will be driving these trends. We therefore expect that sales will increase slightly compared with the 2010 level. We also aim for a slight improvement in income from operations despite expected higher raw materials costs. We will strengthen our presence in the growth regions of Asia and Eastern Europe – particularly in China, India and Russia – and together with our customers, continue to grow in these markets.
Coatings – Sales by region (location of customer)
1 Europe 41%
2 North America 14%
3 Asia Pacific 17%
4
South America, Africa, Middle East 28%
1
2
3
4
€2,577million
wird a
ktual
isier
t
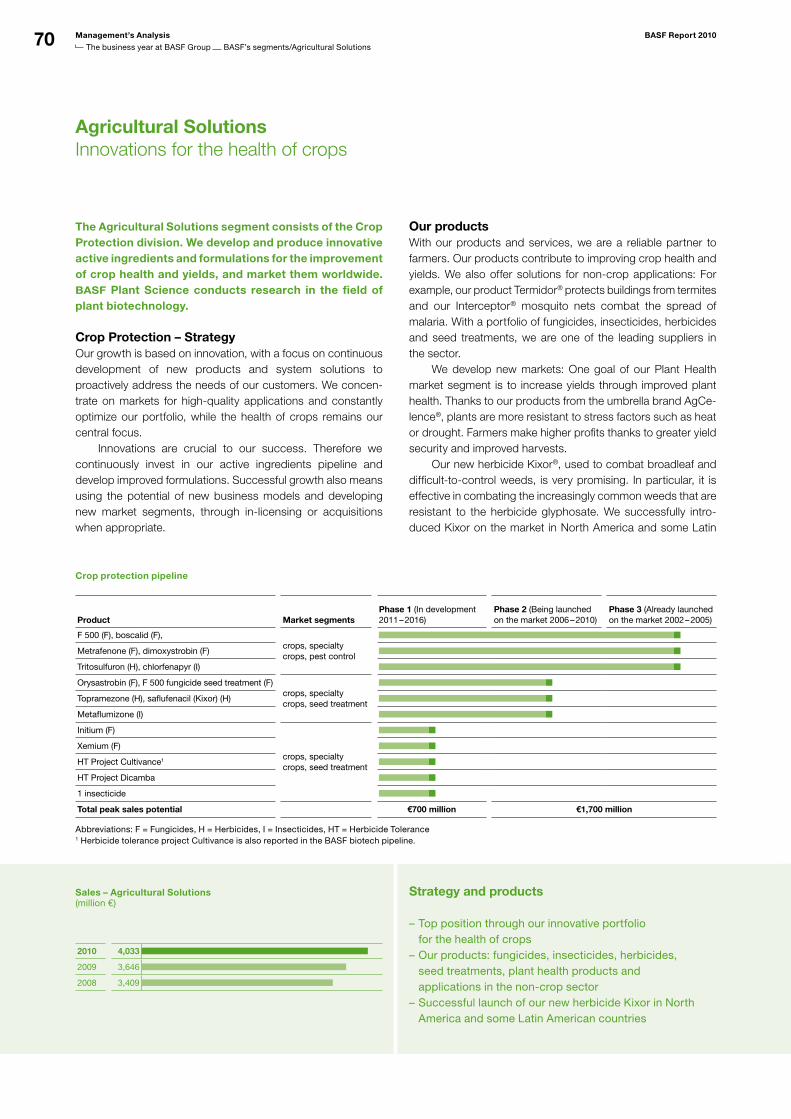
70 Management’s Analysis BASF Report 2010
The business year at BASF Group BASF’s segments/Agricultural Solutions
Agricultural SolutionsInnovations for the health of crops
The Agricultural Solutions segment consists of the Crop Protection division. We develop and produce innovative active ingredients and formulations for the improvement of crop health and yields, and market them worldwide. BASF Plant Science conducts research in the field of plant biotechnology.
Crop Protection – StrategyOur growth is based on innovation, with a focus on continuous development of new products and system solutions to proactively address the needs of our customers. We concen-trate on markets for high-quality applications and constantly optimize our portfolio, while the health of crops remains our central focus. Innovations are crucial to our success. Therefore we continuously invest in our active ingredients pipeline and develop improved formulations. Successful growth also means using the potential of new business models and developing new market segments, through in-licensing or acquisitions when appropriate.
Our productsWith our products and services, we are a reliable partner to farmers. Our products contribute to improving crop health and yields. We also offer solutions for non-crop applications: For example, our product Termidor® protects buildings from termites and our Interceptor® mosquito nets combat the spread of malaria. With a portfolio of fungicides, insecticides, herbicides and seed treatments, we are one of the leading suppliers in the sector. We develop new markets: One goal of our Plant Health market segment is to increase yields through improved plant health. Thanks to our products from the umbrella brand AgCe-lence®, plants are more resistant to stress factors such as heat or drought. Farmers make higher profits thanks to greater yield security and improved harvests. Our new herbicide Kixor®, used to combat broadleaf and difficult-to-control weeds, is very promising. In particular, it is effective in combating the increasingly common weeds that are resistant to the herbicide glyphosate. We successfully intro-duced Kixor on the market in North America and some Latin
Sales – Agricultural Solutions(million €)
2010 4,033
wird aktualisiert
2009 3,646
2008 3,409
Strategy and products
Top position through our innovative portfolio –for the health of cropsOur products: fungicides, insecticides, herbicides, –seed treatments, plant health products and applications in the noncrop sectorSuccessful launch of our new herbicide Kixor in North –America and some Latin American countries
Crop protection pipeline
Product Market segmentsPhase 1 (In development 2011 – 2016)
Phase 2 (Being launched on the market 2006 – 2010)
Phase 3 (Already launched on the market 2002 – 2005)
F 500 (F), boscalid (F),crops, specialty crops, pest control
Metrafenone (F), dimoxystrobin (F)
Tritosulfuron (H), chlorfenapyr (I)
Orysastrobin (F), F 500 fungicide seed treatment (F)crops, specialty crops, seed treatment
Topramezone (H), saflufenacil (Kixor) (H)
Metaflumizone (I)
Initium (F)
crops, specialty crops, seed treatment
Xemium (F)
HT Project Cultivance1
HT Project Dicamba
1 insecticide
Total peak sales potential €700 million €1,700 million
Abbreviations: F = Fungicides, H = Herbicides, I = Insecticides, HT = Herbicide Tolerance1 Herbicide tolerance project Cultivance is also reported in the BASF biotech pipeline.
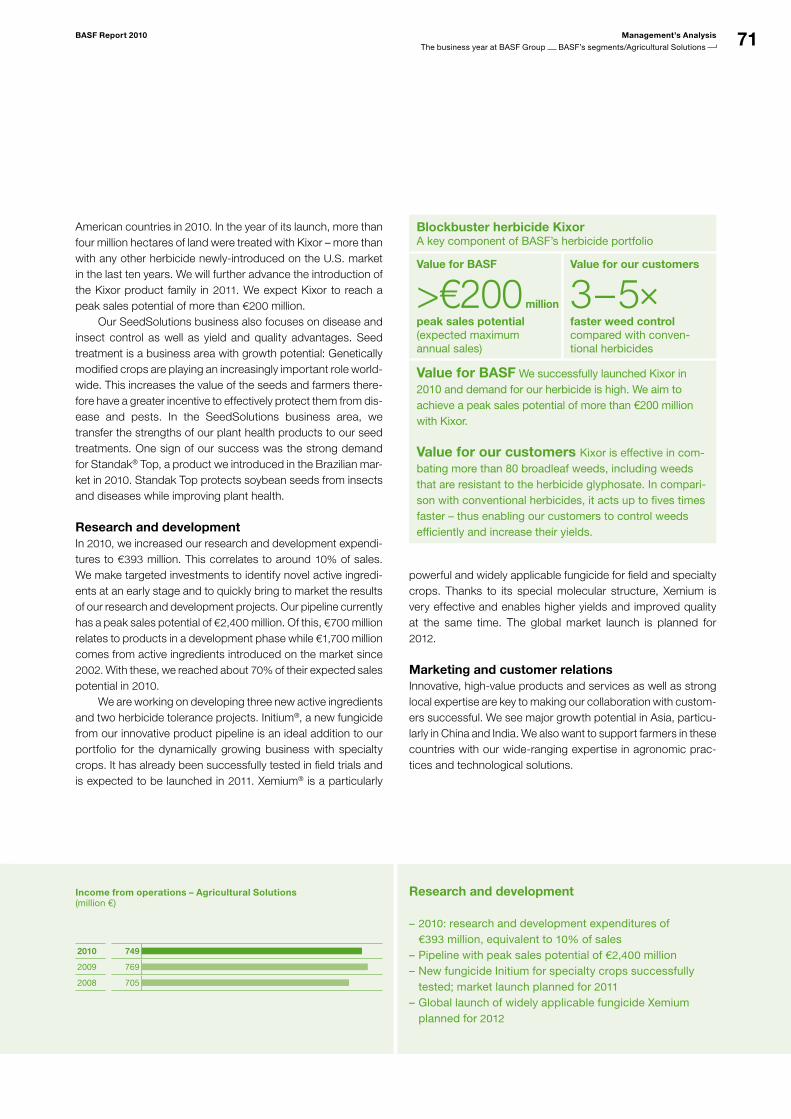
71BASF Report 2010 Management’s Analysis
The business year at BASF Group BASF’s segments/Agricultural Solutions
American countries in 2010. In the year of its launch, more than four million hectares of land were treated with Kixor – more than with any other herbicide newly-introduced on the U.S. market in the last ten years. We will further advance the introduction of the Kixor product family in 2011. We expect Kixor to reach a peak sales potential of more than €200 million. Our SeedSolutions business also focuses on disease and insect control as well as yield and quality advantages. Seed treatment is a business area with growth potential: Genetically modified crops are playing an increasingly important role world-wide. This increases the value of the seeds and farmers there-fore have a greater incentive to effectively protect them from dis-ease and pests. In the SeedSolutions business area, we transfer the strengths of our plant health products to our seed treatments. One sign of our success was the strong demand for Standak® Top, a product we introduced in the Brazilian mar-ket in 2010. Standak Top protects soybean seeds from insects and diseases while improving plant health.
Research and developmentIn 2010, we increased our research and development expendi-tures to €393 million. This correlates to around 10% of sales. We make targeted investments to identify novel active ingredi-ents at an early stage and to quickly bring to market the results of our research and development projects. Our pipeline currently has a peak sales potential of €2,400 million. Of this, €700 million relates to products in a development phase while €1,700 million comes from active ingredients introduced on the market since 2002. With these, we reached about 70% of their expected sales potential in 2010.
We are working on developing three new active ingredients and two herbicide tolerance projects. Initium®, a new fungicide from our innovative product pipeline is an ideal addition to our portfolio for the dynamically growing business with specialty crops. It has already been successfully tested in field trials and is expected to be launched in 2011. Xemium® is a particularly
Blockbuster herbicide KixorA key component of BASF’s herbicide portfolio
Value for BASF
>€200 million
peak sales potential (expected maximum annual sales)
Value for our customers
3 – 5 faster weed control compared with conventional herbicides
Value for BASF We successfully launched Kixor in 2010 and demand for our herbicide is high. We aim to achieve a peak sales potential of more than €200 million with Kixor.
Value for our customers Kixor is effective in combating more than 80 broadleaf weeds, including weeds that are resistant to the herbicide glyphosate. In comparison with conventional herbicides, it acts up to fives times faster – thus enabling our customers to control weeds efficiently and increase their yields.
powerful and widely applicable fungicide for field and specialty crops. Thanks to its special molecular structure, Xemium is very effective and enables higher yields and improved quality at the same time. The global market launch is planned for 2012.
Marketing and customer relationsInnovative, high-value products and services as well as strong local expertise are key to making our collaboration with custom-ers successful. We see major growth potential in Asia, particu-larly in China and India. We also want to support farmers in these countries with our wide-ranging expertise in agronomic prac-tices and technological solutions.
Research and development
2010: – research and development expenditures of €393 million, equivalent to 10% of salesPipeline with peak sales potential of – €2,400 millionNew fungicide Initium for specialty crops successfully –tested; market launch planned for 2011
Global launch of widely applicable fungicide Xemium –planned for 2012
Income from operations – Agricultural Solutions(million €)
2010 749
wird aktualisiert
2009 769
2008 705
72 Management’s Analysis BASF Report 2010
The business year at BASF Group BASF’s segments/Agricultural Solutions
InvestmentsIn 2010, we invested €145 million. A large part of this amount was directly related to the capacity expansion for our fungicide F 500®. Furthermore, we are in the process of building new pro-duction capacities for our fungicide Xemium. To be able to meet the ongoing high demand for our innovative crop protection products in the future, we will continue to invest in our produc-tion capacities. To do this, we plan an average investment volume of €100 million to €150 million annually in the next few years.
BASF Plant SciencePlant biotechnology at BASFAt eight sites in Europe and North America, BASF Plant Science has around 700 employees developing crops with clear advan-tages for farmers, consumers and the environment. Plant bio-technology enables us to give crops desired characteristics through the targeted transfer of genes. In comparison to con-ventional breeding methods, this makes available a much larger repertoire of genetic traits from a variety of organisms. Research expenditures for BASF Plant Science amount to around €150 million annually. In 2010, we received approval in Europe for the first prod-uct in our pipeline: Amflora®. Amflora is a potato with an opti-mized starch composition for use in various industrial applica-tions. In Amflora fields in Sweden in 2010, we found some plants of another genetically modified potato variety. We quickly iden-tified the cause of the comingling and took measures to prevent it from occurring again. For more on Amflora, see page 102
StrategyAs a partner to leading seed companies, we research and develop traits such as higher yield, drought tolerance or disease resistance. We offer seed companies solutions ranging from development to end product, depending on the characteristics and the crop. Together with our partners, we bring the seeds to market. In addition to crops that offer farmers higher and more secure yields, we develop plants that can improve nutrition or be used as renewable raw materials. There is a controversial discussion about plant biotechnol-ogy, particularly in Europe. We take our social responsibility seriously: We enter into close dialogue with farmers, politicians and consumers to explain the benefits of the processes used as well as our products, and we strive for greater acceptance of plant biotechnology.
Research and developmentBASF Plant Science cooperates with a number of research institutes, universities and biotechnology companies worldwide. Since 2007, we have been working with Monsanto to develop higher-yielding and more tolerant corn (maize), soybean, canola (oil-seed rape) and cotton plants. In 2010, we expanded this cooperation further and are now also working on the develop-ment of higher-yielding and stress-tolerant wheat. The launch of the world’s first corn that can survive drought periods with-out reduced yields is expected in North America in 2012. At the end of 2010, we started a cooperation with Bayer CropScience. This long-term collaboration aims to develop and commercial-ize hybrid rice seeds that enable yield gains of 10% or more over conventional seeds. The first product from this project is expected to be launched by 2020. Our other cooperation part-ners include KWS Saat AG and the Brazilian research center CTC (Centro de Tecnologia Canavieira). We are working with them on the development of sugar beet (KWS) and sugarcane (CTC) with higher yields and better drought tolerance.
BASF Plant Science Research and development
BASF’s plant biotechnology company with around – 700 employees worldwideDevelopment of crops with clear advantages for famers, –consumers and the environmentApproval for starch potato Amflora –
Expanding our cooperation with Monsanto: development –of higheryielding and stresstolerant wheatCooperation with Bayer CropScience: development and –commercialization of hybrid rice seedCooperative partnerships with – KWS Saat AG (sugar beet) and CTC (sugarcane) to develop plants with higher yields and better drought tolerance
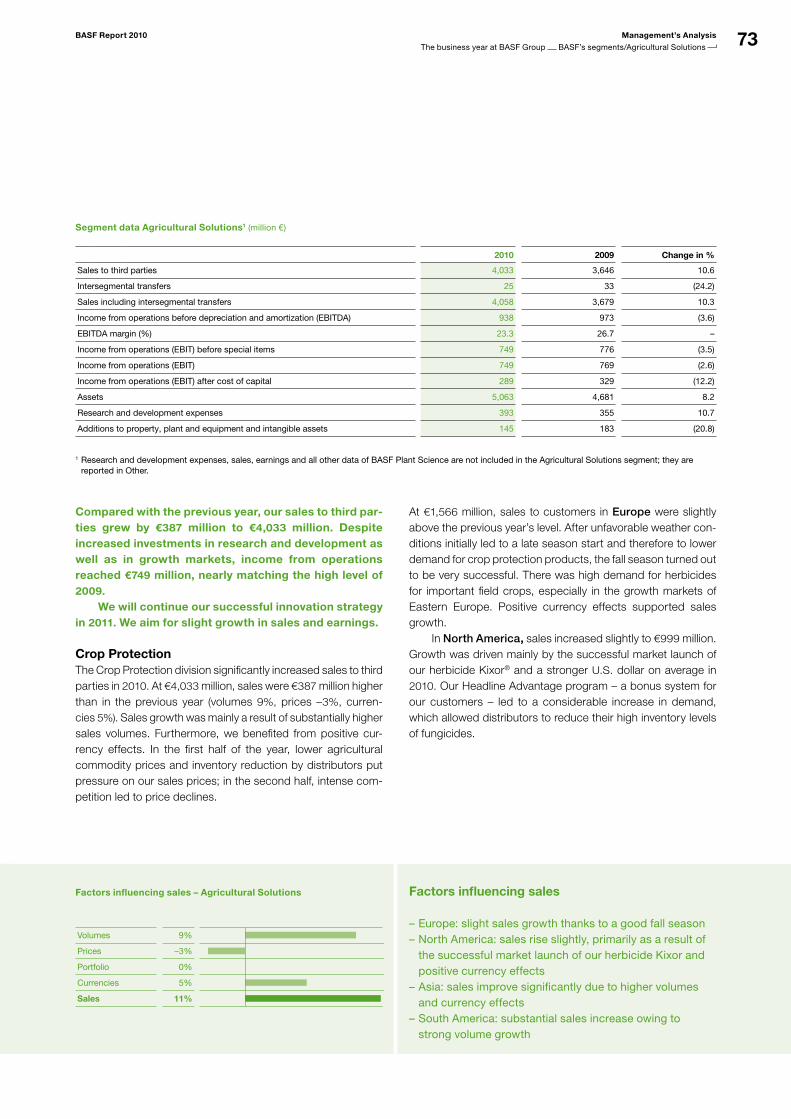
73BASF Report 2010 Management’s Analysis
The business year at BASF Group BASF’s segments/Agricultural Solutions
Segment data Agricultural Solutions1 (million €)
2010 2009 Change in %
Sales to third parties 4,033 3,646 10.6
Intersegmental transfers 25 33 (24.2)
Sales including intersegmental transfers 4,058 3,679 10.3
Income from operations before depreciation and amortization (EBITDA) 938 973 (3.6)
EBITDA margin (%) 23.3 26.7 –
Income from operations (EBIT) before special items 749 776 (3.5)
Income from operations (EBIT) 749 769 (2.6)
Income from operations (EBIT) after cost of capital 289 329 (12.2)
Assets 5,063 4,681 8.2
Research and development expenses 393 355 10.7
Additions to property, plant and equipment and intangible assets 145 183 (20.8)
1 Research and development expenses, sales, earnings and all other data of BASF Plant Science are not included in the Agricultural Solutions segment; they are reported in Other.
Factors influencing sales
Europe: slight sales growth thanks to a good fall season –North America: sales rise slightly, primarily as a result of –the successful market launch of our herbicide Kixor and positive currency effectsAsia: sales improve significantly due to higher volumes –and currency effectsSouth America: substantial sales increase owing to –strong volume growth
Compared with the previous year, our sales to third par-ties grew by €387 million to €4,033 million. Despite increased investments in research and development as well as in growth markets, income from operations reached €749 million, nearly matching the high level of 2009.
We will continue our successful innovation strategy in 2011. We aim for slight growth in sales and earnings.
Crop ProtectionThe Crop Protection division significantly increased sales to third parties in 2010. At €4,033 million, sales were €387 million higher than in the previous year (volumes 9%, prices –3%, curren-cies 5%). Sales growth was mainly a result of substantially higher sales volumes. Furthermore, we benefited from positive cur-rency effects. In the first half of the year, lower agricultural commodity prices and inventory reduction by distributors put pressure on our sales prices; in the second half, intense com-petition led to price declines.
At €1,566 million, sales to customers in Europe were slightly above the previous year’s level. After unfavorable weather con-ditions initially led to a late season start and therefore to lower demand for crop protection products, the fall season turned out to be very successful. There was high demand for herbicides for important field crops, especially in the growth markets of Eastern Europe. Positive currency effects supported sales growth. In North America, sales increased slightly to €999 million. Growth was driven mainly by the successful market launch of our herbicide Kixor® and a stronger U.S. dollar on average in 2010. Our Headline Advantage program – a bonus system for our customers – led to a considerable increase in demand, which allowed distributors to reduce their high inventory levels of fungicides.
Factors influencing sales – Agricultural Solutions
Volumes 9%
Prices –3%
Portfolio 0%
Currencies 5%
Sales 11%
wird aktualisiert
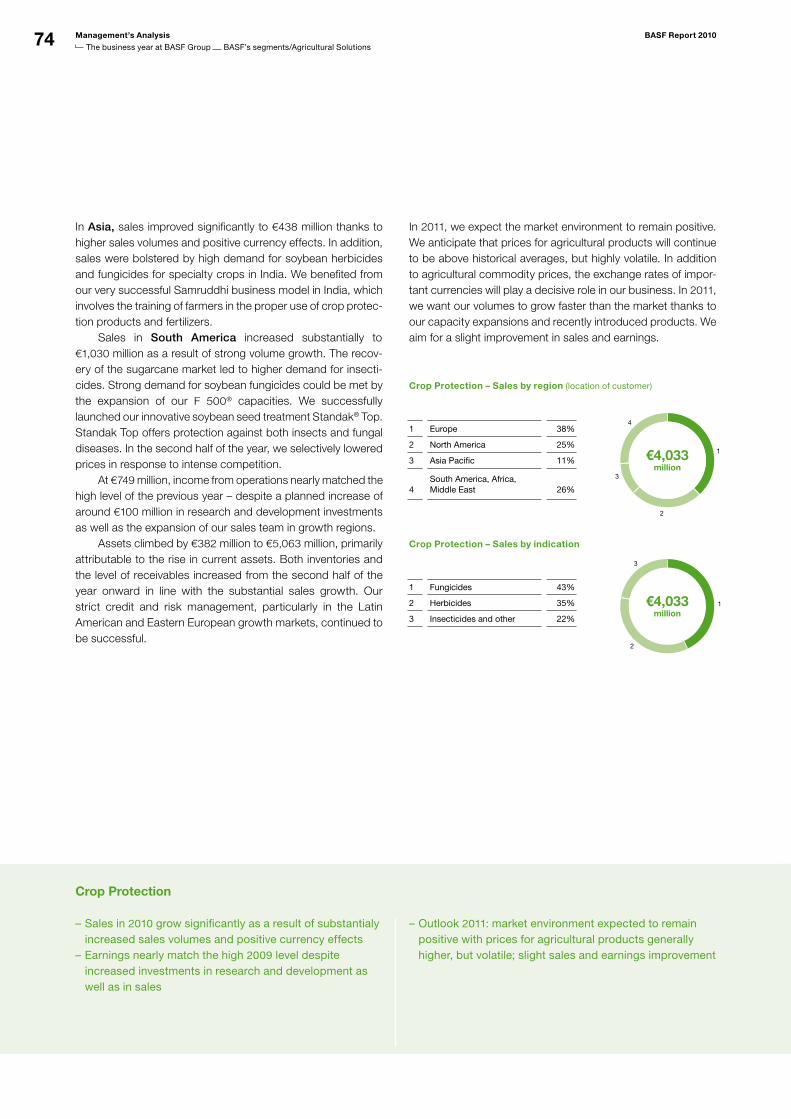
74 Management’s Analysis BASF Report 2010
The business year at BASF Group BASF’s segments/Agricultural Solutions
Crop Protection
Sales in – 2010 grow significantly as a result of substantialy increased sales volumes and positive currency effectsEarnings nearly match the high – 2009 level despite increased investments in research and development as well as in sales
Outlook – 2011: market environment expected to remain positive with prices for agricultural products generally higher, but volatile; slight sales and earnings improvement
In Asia, sales improved significantly to €438 million thanks to higher sales volumes and positive currency effects. In addition, sales were bolstered by high demand for soybean herbicides and fungicides for specialty crops in India. We benefited from our very successful Samruddhi business model in India, which involves the training of farmers in the proper use of crop protec-tion products and fertilizers. Sales in South America increased substantially to €1,030 million as a result of strong volume growth. The recov-ery of the sugarcane market led to higher demand for insecti-cides. Strong demand for soybean fungicides could be met by the expansion of our F 500® capacities. We successfully launched our innovative soybean seed treatment Standak® Top. Standak Top offers protection against both insects and fungal diseases. In the second half of the year, we selectively lowered prices in response to intense competition. At €749 million, income from operations nearly matched the high level of the previous year – despite a planned increase of around €100 million in research and development investments as well as the expansion of our sales team in growth regions. Assets climbed by €382 million to €5,063 million, primarily attributable to the rise in current assets. Both inventories and the level of receivables increased from the second half of the year onward in line with the substantial sales growth. Our strict credit and risk management, particularly in the Latin American and Eastern European growth markets, continued to be successful.
In 2011, we expect the market environment to remain positive. We anticipate that prices for agricultural products will continue to be above historical averages, but highly volatile. In addition to agricultural commodity prices, the exchange rates of impor-tant currencies will play a decisive role in our business. In 2011, we want our volumes to grow faster than the market thanks to our capacity expansions and recently introduced products. We aim for a slight improvement in sales and earnings.
Crop Protection – Sales by region (location of customer)
1 Europe 38%
2 North America 25%
3 Asia Pacific 11%
4
South America, Africa, Middle East 26%
Crop Protection – Sales by indication
1 Fungicides 43%
2 Herbicides 35%
3 Insecticides and other 22%
1
2
3
4
€4,033million
wird a
ktual
isier
t
1
2
3
€4,033million
wird a
ktual
isier
t
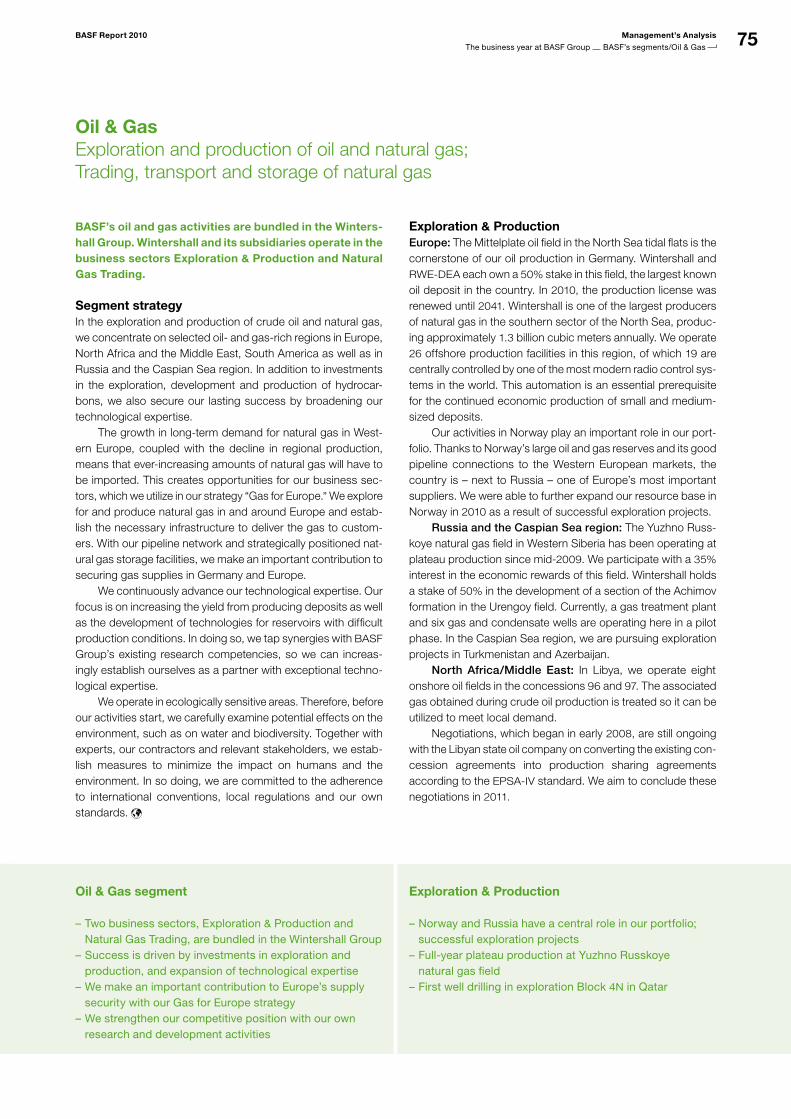
75BASF Report 2010 Management’s Analysis
The business year at BASF Group BASF’s segments/Oil & Gas
Oil & GasExploration and production of oil and natural gas; Trading, transport and storage of natural gas
Oil & Gas segment Exploration & Production
Two business sectors, Exploration – & Production and Natural Gas Trading, are bundled in the Wintershall GroupSuccess is driven by investments in exploration and –production, and expansion of technological expertiseWe make an important contribution to Europe’s supply –security with our Gas for Europe strategyWe strengthen our competitive position with our own – research and development activities
Norway and Russia have a central role in our portfolio; –successful exploration projectsFullyear plateau production at Yuzhno Russkoye –natural gas field First well drilling in exploration Block – 4N in Qatar
BASF’s oil and gas activities are bundled in the Winters-hall Group. Wintershall and its subsidiaries operate in the business sectors Exploration & Production and Natural Gas Trading.
Segment strategyIn the exploration and production of crude oil and natural gas, we concentrate on selected oil- and gas-rich regions in Europe, North Africa and the Middle East, South America as well as in Russia and the Caspian Sea region. In addition to investments in the exploration, development and production of hydrocar-bons, we also secure our lasting success by broadening our technological expertise. The growth in long-term demand for natural gas in West-ern Europe, coupled with the decline in regional production, means that ever-increasing amounts of natural gas will have to be imported. This creates opportunities for our business sec-tors, which we utilize in our strategy “Gas for Europe.” We explore for and produce natural gas in and around Europe and estab-lish the necessary infrastructure to deliver the gas to custom-ers. With our pipeline network and strategically positioned nat-ural gas storage facilities, we make an important contribution to securing gas supplies in Germany and Europe. We continuously advance our technological expertise. Our focus is on increasing the yield from producing deposits as well as the development of technologies for reservoirs with difficult production conditions. In doing so, we tap synergies with BASF Group’s existing research competencies, so we can increas-ingly establish ourselves as a partner with exceptional techno-logical expertise. We operate in ecologically sensitive areas. Therefore, before our activities start, we carefully examine potential effects on the environment, such as on water and biodiversity. Together with experts, our contractors and relevant stakeholders, we estab-lish measures to minimize the impact on humans and the environment. In so doing, we are committed to the adherence to international conventions, local regulations and our own standards.
Exploration & ProductionEurope: The Mittelplate oil field in the North Sea tidal flats is the cornerstone of our oil production in Germany. Wintershall and RWE-DEA each own a 50% stake in this field, the largest known oil deposit in the country. In 2010, the production license was renewed until 2041. Wintershall is one of the largest producers of natural gas in the southern sector of the North Sea, produc-ing approximately 1.3 billion cubic meters annually. We operate 26 offshore production facilities in this region, of which 19 are centrally controlled by one of the most modern radio control sys-tems in the world. This automation is an essential prerequisite for the continued economic production of small and medium-sized deposits. Our activities in Norway play an important role in our port-folio. Thanks to Norway’s large oil and gas reserves and its good pipeline connections to the Western European markets, the country is – next to Russia – one of Europe’s most important suppliers. We were able to further expand our resource base in Norway in 2010 as a result of successful exploration projects. Russia and the Caspian Sea region: The Yuzhno Russ-koye natural gas field in Western Siberia has been operating at plateau production since mid-2009. We participate with a 35% interest in the economic rewards of this field. Wintershall holds a stake of 50% in the development of a section of the Achimov formation in the Urengoy field. Currently, a gas treatment plant and six gas and condensate wells are operating here in a pilot phase. In the Caspian Sea region, we are pursuing exploration projects in Turkmenistan and Azerbaijan. North Africa/Middle East: In Libya, we operate eight onshore oil fields in the concessions 96 and 97. The associated gas obtained during crude oil production is treated so it can be utilized to meet local demand. Negotiations, which began in early 2008, are still ongoing with the Libyan state oil company on converting the existing con-cession agreements into production sharing agreements according to the EPSA-IV standard. We aim to conclude these negotiations in 2011.
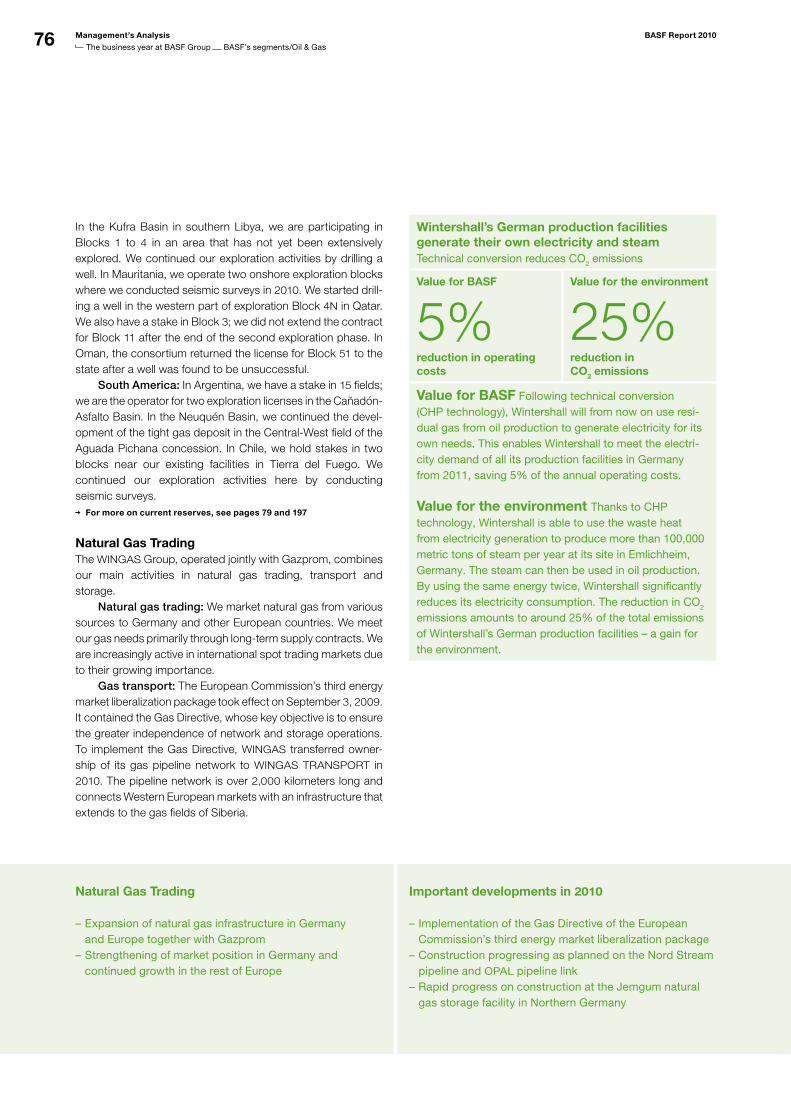
76 Management’s Analysis BASF Report 2010
The business year at BASF Group BASF’s segments/Oil & Gas
In the Kufra Basin in southern Libya, we are participating in Blocks 1 to 4 in an area that has not yet been extensively explored. We continued our exploration activities by drilling a well. In Mauritania, we operate two onshore exploration blocks where we conducted seismic surveys in 2010. We started drill-ing a well in the western part of exploration Block 4N in Qatar. We also have a stake in Block 3; we did not extend the contract for Block 11 after the end of the second exploration phase. In Oman, the consortium returned the license for Block 51 to the state after a well was found to be unsuccessful. South America: In Argentina, we have a stake in 15 fields; we are the operator for two exploration licenses in the Cañadón-Asfalto Basin. In the Neuquén Basin, we continued the devel-opment of the tight gas deposit in the Central-West field of the Aguada Pichana concession. In Chile, we hold stakes in two blocks near our existing facilities in Tierra del Fuego. We continued our exploration activities here by conducting seismic surveys.
For more on current reserves, see pages 79 and 197
Natural Gas TradingThe WINGAS Group, operated jointly with Gazprom, combines our main activities in natural gas trading, transport and storage. Natural gas trading: We market natural gas from various sources to Germany and other European countries. We meet our gas needs primarily through long-term supply contracts. We are increasingly active in international spot trading markets due to their growing importance. Gas transport: The European Commission’s third energy market liberalization package took effect on September 3, 2009. It contained the Gas Directive, whose key objective is to ensure the greater independence of network and storage operations. To implement the Gas Directive, WINGAS transferred owner-ship of its gas pipeline network to WINGAS TRANSPORT in 2010. The pipeline network is over 2,000 kilometers long and connects Western European markets with an infrastructure that extends to the gas fields of Siberia.
Wintershall’s German production facilities generate their own electricity and steamTechnical conversion reduces CO2 emissions
Value for BASF
5%reduction in operating costs
Value for the environment
25%reduction in CO2 emissions
Value for BASF Following technical conversion (CHP technology), Wintershall will from now on use residual gas from oil production to generate electricity for its own needs. This enables Wintershall to meet the electricity demand of all its production facilities in Germany from 2011, saving 5% of the annual operating costs.
Value for the environment Thanks to CHP technology, Wintershall is able to use the waste heat from electricity generation to produce more than 100,000 metric tons of steam per year at its site in Emlichheim, Germany. The steam can then be used in oil production. By using the same energy twice, Wintershall significantly reduces its electricity consumption. The reduction in CO2 emissions amounts to around 25% of the total emissions of Wintershall’s German production facilities – a gain for the environment.
Natural Gas Trading Important developments in 2010
Expansion of natural gas infrastructure in Germany –and Europe together with GazpromStrengthening of market position in Germany and –continued growth in the rest of Europe
Implementation of the Gas Directive of the European –Commission’s third energy market liberalization packageConstruction progressing as planned on the Nord Stream –pipeline and OPAL pipeline linkRapid progress on construction at the Jemgum natural –gas storage facility in Northern Germany
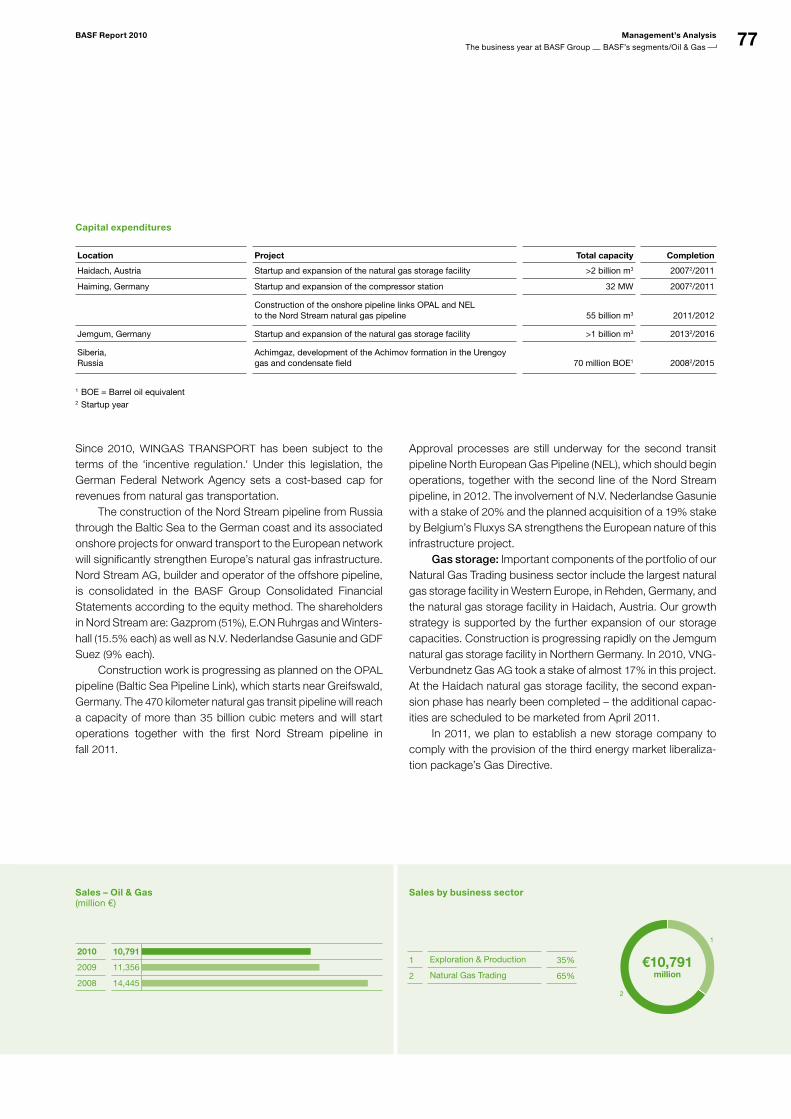
77BASF Report 2010 Management’s Analysis
The business year at BASF Group BASF’s segments/Oil & Gas
Capital expenditures
Location Project Total capacity Completion
Haidach, Austria Startup and expansion of the natural gas storage facility >2 billion m3 20072/2011
Haiming, Germany Startup and expansion of the compressor station 32 MW 20072/2011
Construction of the onshore pipeline links OPAL and NEL to the Nord Stream natural gas pipeline
55 billion m3
2011/2012
Jemgum, Germany Startup and expansion of the natural gas storage facility >1 billion m3 20132/2016
Siberia,Russia
Achimgaz, development of the Achimov formation in the Urengoy gas and condensate field
70 million BOE1 20082/2015
1 BOE = Barrel oil equivalent2 Startup year
Sales – Oil & Gas(million €)
2010 10,791
wird aktualisiert
2009 11,356
2008 14,445
Since 2010, WINGAS TRANSPORT has been subject to the terms of the ‘incentive regulation.’ Under this legislation, the German Federal Network Agency sets a cost-based cap for revenues from natural gas transportation. The construction of the Nord Stream pipeline from Russia through the Baltic Sea to the German coast and its associated onshore projects for onward transport to the European network will significantly strengthen Europe’s natural gas infrastructure. Nord Stream AG, builder and operator of the offshore pipeline, is consolidated in the BASF Group Consolidated Financial Statements according to the equity method. The shareholders in Nord Stream are: Gazprom (51%), E.ON Ruhrgas and Winters-hall (15.5% each) as well as N.V. Nederlandse Gasunie and GDF Suez (9% each). Construction work is progressing as planned on the OPAL pipeline (Baltic Sea Pipeline Link), which starts near Greifswald, Germany. The 470 kilometer natural gas transit pipeline will reach a capacity of more than 35 billion cubic meters and will start operations together with the first Nord Stream pipeline in fall 2011.
Approval processes are still underway for the second transit pipeline North European Gas Pipeline (NEL), which should begin operations, together with the second line of the Nord Stream pipeline, in 2012. The involvement of N.V. Nederlandse Gasunie with a stake of 20% and the planned acquisition of a 19% stake by Belgium’s Fluxys SA strengthens the European nature of this infrastructure project. Gas storage: Important components of the portfolio of our Natural Gas Trading business sector include the largest natural gas storage facility in Western Europe, in Rehden, Germany, and the natural gas storage facility in Haidach, Austria. Our growth strategy is supported by the further expansion of our storage capacities. Construction is progressing rapidly on the Jemgum natural gas storage facility in Northern Germany. In 2010, VNG-Verbundnetz Gas AG took a stake of almost 17% in this project. At the Haidach natural gas storage facility, the second expan-sion phase has nearly been completed – the additional capac-ities are scheduled to be marketed from April 2011.
In 2011, we plan to establish a new storage company to comply with the provision of the third energy market liberaliza-tion package’s Gas Directive.
Sales by business sector
1 Exploration & Production 35%
2 Natural Gas Trading 65%
1
2
€10,791million
wird a
ktual
isier
t
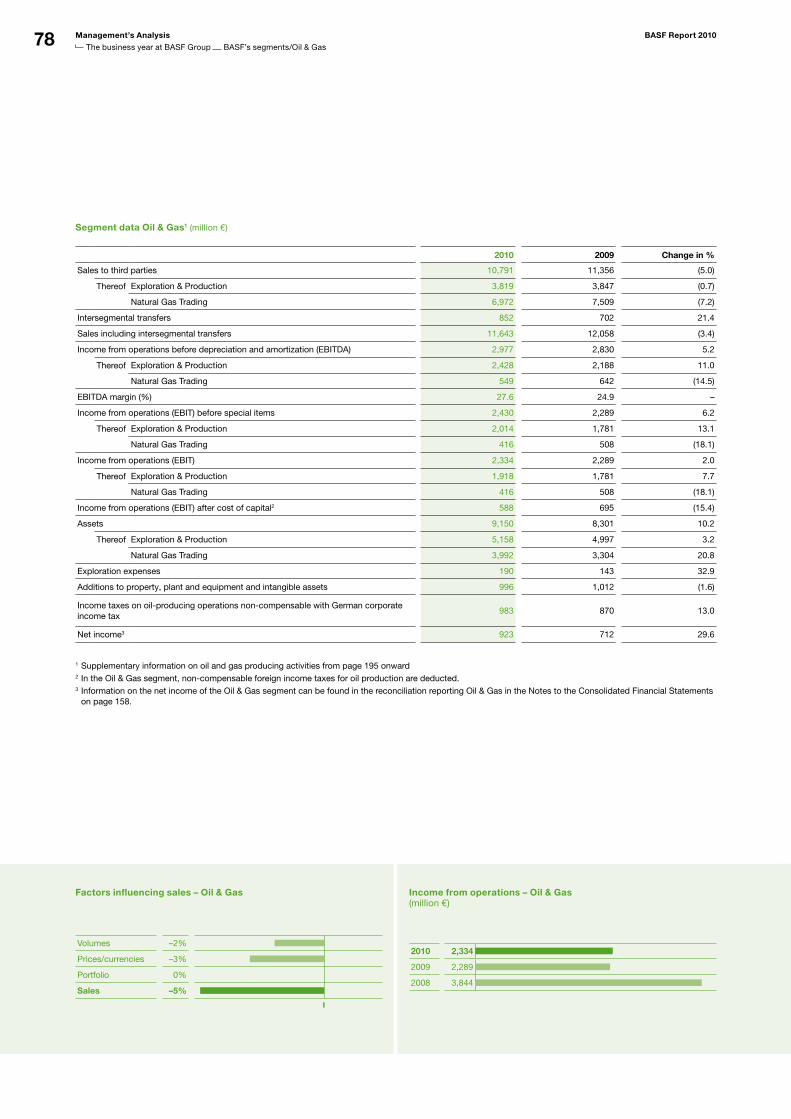
78 Management’s Analysis BASF Report 2010
The business year at BASF Group BASF’s segments/Oil & Gas
Income from operations – Oil & Gas(million €)
2010 2,334
wird aktualisiert
2009 2,289
2008 3,844
Segment data Oil & Gas1 (million €)
2010 2009 Change in %
Sales to third parties 10,791 11,356 (5.0)
Thereof Exploration & Production 3,819 3,847 (0.7)
Natural Gas Trading 6,972 7,509 (7.2)
Intersegmental transfers 852 702 21.4
Sales including intersegmental transfers 11,643 12,058 (3.4)
Income from operations before depreciation and amortization (EBITDA) 2,977 2,830 5.2
Thereof Exploration & Production 2,428 2,188 11.0
Natural Gas Trading 549 642 (14.5)
EBITDA margin (%) 27.6 24.9 –
Income from operations (EBIT) before special items 2,430 2,289 6.2
Thereof Exploration & Production 2,014 1,781 13.1
Natural Gas Trading 416 508 (18.1)
Income from operations (EBIT) 2,334 2,289 2.0
Thereof Exploration & Production 1,918 1,781 7.7
Natural Gas Trading 416 508 (18.1)
Income from operations (EBIT) after cost of capital2 588 695 (15.4)
Assets 9,150 8,301 10.2
Thereof Exploration & Production 5,158 4,997 3.2
Natural Gas Trading 3,992 3,304 20.8
Exploration expenses 190 143 32.9
Additions to property, plant and equipment and intangible assets 996 1,012 (1.6)
Income taxes on oilproducing operations noncompensable with German corporate income tax
983 870 13.0
Net income3 923 712 29.6
1 Supplementary information on oil and gas producing activities from page 195 onward2 In the Oil & Gas segment, noncompensable foreign income taxes for oil production are deducted.3 Information on the net income of the Oil & Gas segment can be found in the reconciliation reporting Oil & Gas in the Notes to the Consolidated Financial Statements
on page 158.
Factors influencing sales – Oil & Gas
Volumes –2%
Prices/currencies –3%
Portfolio 0%
Sales –5%
wird aktualisiert
79BASF Report 2010 Management’s Analysis
The business year at BASF Group BASF’s segments/Oil & Gas
Sales to third parties in the Oil & Gas segment in 2010 decreased by €565 million to €10,791 million (volumes –2%, prices/currencies –3%). In contrast, income from operations improved by €45 million to €2,334 million. Net income increased by €211 million to €923 million. We expect the oil price in 2011 to be higher than the average price seen in 2010. Our planning is based on an oil price of $90 per barrel and an average euro/dollar exchange rate of $1.35 per euro in 2011. Based on these assumptions, we aim for a significant increase in sales and a substantial improvement in earnings.
For more on the segment’s net income, see Notes to the Consoli-dated Financial Statements on page 158
Exploration & ProductionSales to third parties of €3,819 million matched the previous year’s level (2009: €3,847 million). The average price of Brent crude in 2010 rose by around $18 per barrel compared with the previous year to reach about $80 per barrel. As the U.S. dollar also strengthened against the euro, the price of crude oil in euro rose by approximately €16 per barrel to around €60 per barrel. At 133 million barrels of oil equivalent (BOE), crude oil and nat-ural gas production was slightly below the previous year’s level, due primarily to production restrictions in our Libyan onshore concessions. This figure includes minority interests from Gaz-prom’s stake in a German Wintershall subsidiary that holds the Libyan concessions 96 and 97. Volumes from the Western Siberian Achimgaz project are not included due to legal and contractual stipulations.
Income from operations improved by €137 million to €1,918 mil-lion, as a result of higher prices. Earnings include income taxes on oil production in Libya of €983 million that are non-compen-sable with German corporate income tax (2009: €870 million). These taxes are reported as income taxes. Valuation adjust-ments on oil and gas licenses in the North Sea were recognized as special charges. In 2010, we completed the drilling of 23 exploration and appraisal wells in the search for new oil and natural gas depos-its, of which 12 were successful. Exploration expenses rose by €47 million to €190 million. Proven crude oil and natural gas reserves decreased by 1% compared with the end of 2009 to 1,123 million BOE. The reserve-to-production ratio of these reserves is 10 years (2009: 10 years). This is based on Wintershall’s share of production in 2010 and refers to the reserves at year-end. We replenished 89% of the volumes produced in 2010. These figures do not include the volumes from the Achimgaz project due to the underlying service agreement. For 2011, we expect sales to grow significantly and earn-ings to improve substantially in the Exploration & Production business sector owing to higher prices and increasing produc-tion volumes.
Oil & Gas segment
Sales in – 2010 decline; earnings improve slightly primarily due to high contribution from Exploration & ProductionConstruction starts on Nord Stream pipeline; delivery of –first gas volumes expected in October 2011
Work continues on Jemgum natural gas storage facility –and OPAL pipeline (Baltic Sea Pipeline Link)
The oil price in – 2011 is expected to be higher than the 2010 average price; our planning is based on the following annual average assumptions: oil price of $90 per barrel, euro/dollar exchange rate of $1.35 per euroOutlook – 2011: significant increase in sales; substantial improvement in earnings
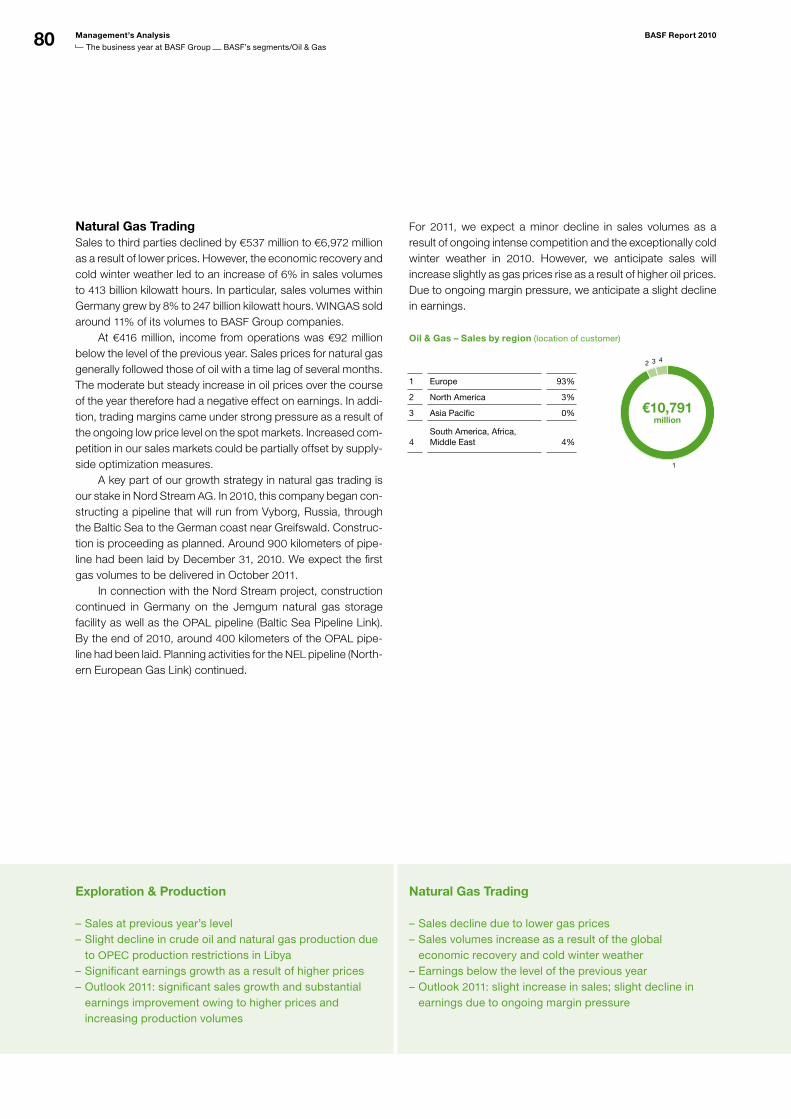
80 Management’s Analysis BASF Report 2010
The business year at BASF Group BASF’s segments/Oil & Gas
Exploration & Production Natural Gas Trading
Sales at previous year’s level –Slight decline in crude oil and natural gas production due –to OPEC production restrictions in LibyaSignificant earnings growth as a result of higher prices –Outlook – 2011: significant sales growth and substantial earnings improvement owing to higher prices and increasing production volumes
Sales decline due to lower gas prices –Sales volumes increase as a result of the global –economic recovery and cold winter weatherEarnings below the level of the previous year –Outlook – 2011: slight increase in sales; slight decline in earnings due to ongoing margin pressure
Natural Gas TradingSales to third parties declined by €537 million to €6,972 million as a result of lower prices. However, the economic recovery and cold winter weather led to an increase of 6% in sales volumes to 413 billion kilowatt hours. In particular, sales volumes within Germany grew by 8% to 247 billion kilowatt hours. WINGAS sold around 11% of its volumes to BASF Group companies. At €416 million, income from operations was €92 million below the level of the previous year. Sales prices for natural gas generally followed those of oil with a time lag of several months. The moderate but steady increase in oil prices over the course of the year therefore had a negative effect on earnings. In addi-tion, trading margins came under strong pressure as a result of the ongoing low price level on the spot markets. Increased com-petition in our sales markets could be partially offset by supply-side optimization measures. A key part of our growth strategy in natural gas trading is our stake in Nord Stream AG. In 2010, this company began con-structing a pipeline that will run from Vyborg, Russia, through the Baltic Sea to the German coast near Greifswald. Construc-tion is proceeding as planned. Around 900 kilometers of pipe-line had been laid by December 31, 2010. We expect the first gas volumes to be delivered in October 2011.
In connection with the Nord Stream project, construction continued in Germany on the Jemgum natural gas storage facility as well as the OPAL pipeline (Baltic Sea Pipeline Link). By the end of 2010, around 400 kilometers of the OPAL pipe-line had been laid. Planning activities for the NEL pipeline (North-ern European Gas Link) continued.
For 2011, we expect a minor decline in sales volumes as a result of ongoing intense competition and the exceptionally cold winter weather in 2010. However, we anticipate sales will increase slightly as gas prices rise as a result of higher oil prices. Due to ongoing margin pressure, we anticipate a slight decline in earnings.
Oil & Gas – Sales by region (location of customer)
1 Europe 93%
2 North America 3%
3 Asia Pacific 0%
4
South America, Africa, Middle East
4%
1
2 3 4
€10,791million
wird a
ktual
isier
t
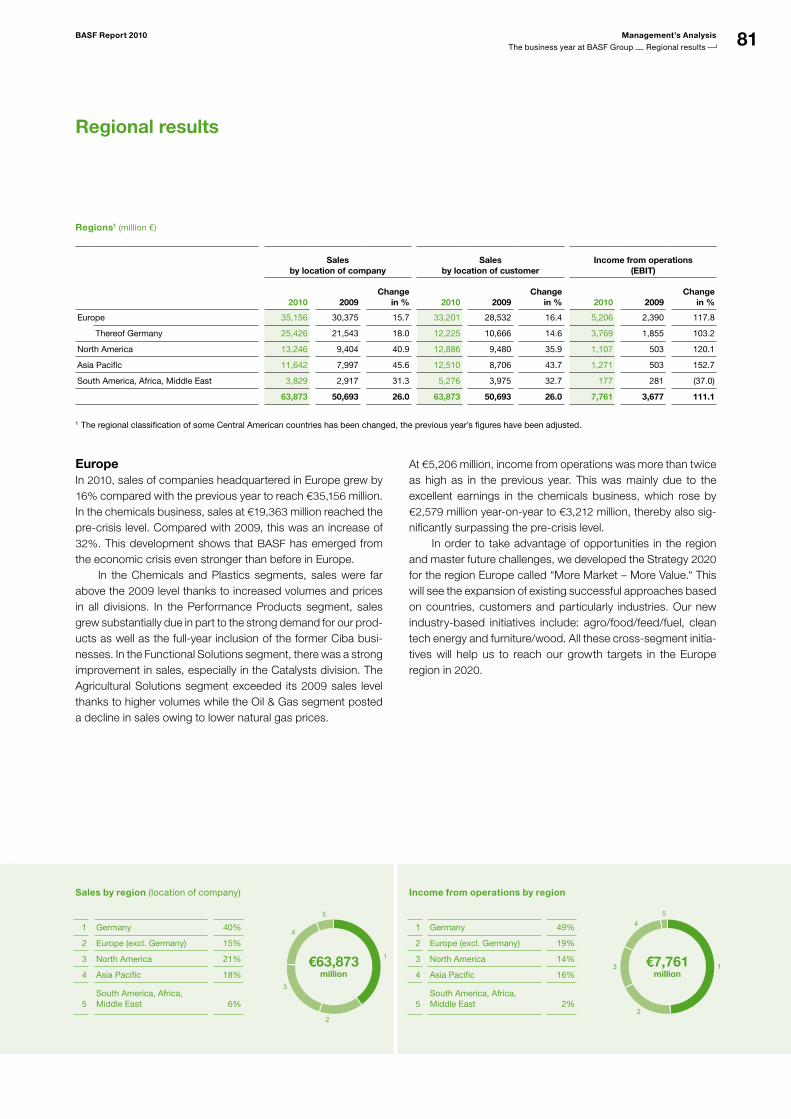
81BASF Report 2010 Management’s Analysis
The business year at BASF Group Regional results
Regional results
Regions1 (million €)
Sales
by location of companySales
by location of customerIncome from operations
(EBIT)
2010 2009Change
in % 2010 2009Change
in % 2010 2009Change
in %
Europe 35,156 30,375 15.7 33,201 28,532 16.4 5,206 2,390 117.8
Thereof Germany 25,426 21,543 18.0 12,225 10,666 14.6 3,769 1,855 103.2
North America 13,246 9,404 40.9 12,886 9,480 35.9 1,107 503 120.1
Asia Pacific 11,642 7,997 45.6 12,510 8,706 43.7 1,271 503 152.7
South America, Africa, Middle East 3,829 2,917 31.3 5,276 3,975 32.7 177 281 (37.0)
63,873 50,693 26.0 63,873 50,693 26.0 7,761 3,677 111.1
1 The regional classification of some Central American countries has been changed, the previous year’s figures have been adjusted.
Sales by region (location of company)
1 Germany 40%
2 Europe (excl. Germany) 15%
3 North America 21%
4 Asia Pacific 18%
5
South America, Africa, Middle East 6%
1
2
3
4
5
€63,873million
wird a
ktual
isier
t
Income from operations by region
1 Germany 49%
2 Europe (excl. Germany) 19%
3 North America 14%
4 Asia Pacific 16%
5
South America, Africa, Middle East 2%
1
2
3
4
5
€7,761million
wird a
ktual
isier
t
EuropeIn 2010, sales of companies headquartered in Europe grew by 16% compared with the previous year to reach €35,156 million. In the chemicals business, sales at €19,363 million reached the pre-crisis level. Compared with 2009, this was an increase of 32%. This development shows that BASF has emerged from the economic crisis even stronger than before in Europe. In the Chemicals and Plastics segments, sales were far above the 2009 level thanks to increased volumes and prices in all divisions. In the Performance Products segment, sales grew substantially due in part to the strong demand for our prod-ucts as well as the full-year inclusion of the former Ciba busi-nesses. In the Functional Solutions segment, there was a strong improvement in sales, especially in the Catalysts division. The Agricultural Solutions segment exceeded its 2009 sales level thanks to higher volumes while the Oil & Gas segment posted a decline in sales owing to lower natural gas prices.
At €5,206 million, income from operations was more than twice as high as in the previous year. This was mainly due to the excellent earnings in the chemicals business, which rose by €2,579 million year-on-year to €3,212 million, thereby also sig-nificantly surpassing the pre-crisis level. In order to take advantage of opportunities in the region and master future challenges, we developed the Strategy 2020 for the region Europe called “More Market – More Value.” This will see the expansion of existing successful approaches based on countries, customers and particularly industries. Our new industry-based initiatives include: agro/food/feed/fuel, clean tech energy and furniture/wood. All these cross-segment initia-tives will help us to reach our growth targets in the Europe region in 2020.
82 Management’s Analysis BASF Report 2010
The business year at BASF Group Regional results
Regional trends
Europe: development of Strategy – 2020; expansion of existing successful approaches based on countries, customers and industries North America: concentration on innovation, crossdivisional cooperation and attractive customer and –market segments; construction of a plant in Elyria, Ohio, to produce innovative cathode materials Asia Pacific: agreement to expand cooperation with partners – PETRONAS in Malaysia and Sinopec in China; significant progress in implementing Strategy 2020 for Asia PacificSouth America, Africa, Middle East: construction of a plant for sodium methylate – a key chemical for the –efficient production of biodiesel – in Guaratinguetá, Brazil
North AmericaIndustrial production recovered markedly in the region at the beginning of the year, but the economic upturn generally weak-ened over the course of the year. The business environment in the construction industry remained difficult. Sales of companies based in North America rose by 41% to €13,246 million, or 34% in local currency terms. Nearly all seg-ments posted considerable gains in sales volumes and sales compared with the previous year. The Agricultural Solutions seg-ment exceeded the high sales level of 2009 thanks to the suc-cessful market launch of our innovative herbicide Kixor®. In the Chemicals, Plastics and Functional Solutions segments in par-ticular, good demand and higher prices led to sales growth. Income from operations in 2010 reached a new record of €1,107 million, representing an increase of €604 million over the previous year. Only the Agricultural Solutions segment posted a decline in earnings, owing to lower prices. The strong increase in earnings in the other segments was mainly due to good demand and better capacity utilization at our plants. Further-more, supply bottlenecks led to better margins for some basic products in the Petrochemicals and Performance Polymers divisions. While the Performance Products segment had incurred high costs for the integration of Ciba in 2009, in 2010 the divi-sion’s earning power was boosted by synergy effects and the successful restructuring of the combined businesses. At our site in Elyria, Ohio, we are building a plant to produce innovative cathode materials. These will be used from 2012 in lithium-ion batteries in hybrid vehicles and electric cars for the North American market. The new plant is being built with the help of a grant from the U.S. Department of Energy. Together with the research facility in Beachwood, Ohio, the new plant is part of our long-term strategy to enter the future market for elec-tromobility.
In 2011, we will also start up operations of a methylamines plant at our Verbund site in Geismar, Louisiana. We continue to successfully implement our regional strat-egy for North America that was developed in 2008. The central part of this strategy is an even stronger market and customer focus. We are concentrating on innovation, cross-divisional cooperation and attractive customer and market segments. At the same time, we are increasing our operative excellence through ongoing improvements while we continue to harmonize and improve the efficiency of our business processes.
Asia PacificIn 2010, our business in Asia Pacific rapidly recovered from the economic crisis, with good performance in all sectors. Thanks to strong recovery in demand, the full-year inclusion of Ciba and our strategic focus on attractive market and customer segments, sales of companies based in this region grew by 46% to €11,642 million. In local currency terms, sales rose by 35%. Sales increased in all segments, particularly in our chemicals business. We posted record income from operations, which rose by €768 million to €1,271 million thanks mainly to higher volumes. Our cost discipline as well as progress with our Site Optimiza-tion Asia Pacific project also contributed to this growth. By 2012 we want to improve earnings by €150 million annually in the Asia Pacific region under the NEXT global excellence program. The savings potential is thus far higher than we had expected. We also made significant progress in 2010 with the imple-mentation of our Strategy 2020 for Asia Pacific. The main aim of this strategy is to grow on average two percentage points faster than the Asia Pacific chemical market each year while earning a premium on our cost of capital in this region as well.
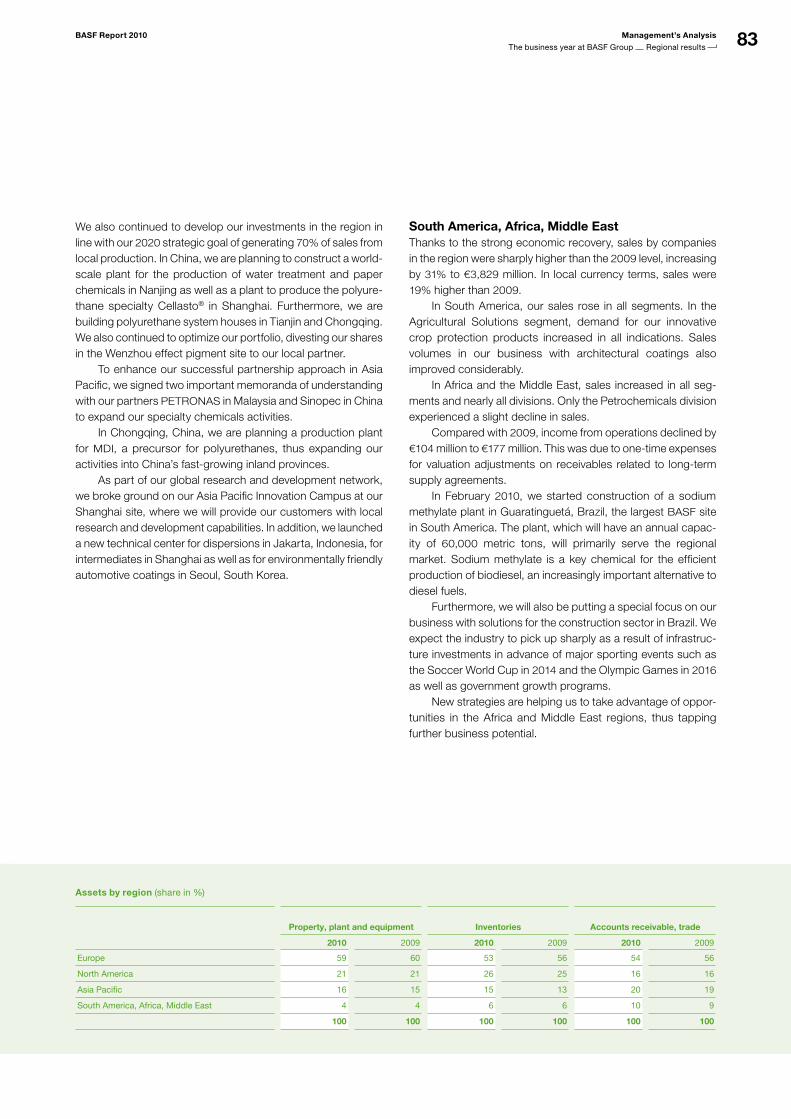
83BASF Report 2010 Management’s Analysis
The business year at BASF Group Regional results
Assets by region (share in %)
Property, plant and equipment
Inventories Accounts receivable, trade
2010 2009 2010 2009 2010 2009
Europe 59 60 53 56 54 56
North America 21 21 26 25 16 16
Asia Pacific 16 15 15 13 20 19
South America, Africa, Middle East 4 4 6 6 10 9
100 100 100 100 100 100
We also continued to develop our investments in the region in line with our 2020 strategic goal of generating 70% of sales from local production. In China, we are planning to construct a world-scale plant for the production of water treatment and paper chemicals in Nanjing as well as a plant to produce the polyure-thane specialty Cellasto® in Shanghai. Furthermore, we are building polyurethane system houses in Tianjin and Chongqing. We also continued to optimize our portfolio, divesting our shares in the Wenzhou effect pigment site to our local partner. To enhance our successful partnership approach in Asia Pacific, we signed two important memoranda of understanding with our partners PETRONAS in Malaysia and Sinopec in China to expand our specialty chemicals activities. In Chongqing, China, we are planning a production plant for MDI, a precursor for polyurethanes, thus expanding our activities into China’s fast-growing inland provinces. As part of our global research and development network, we broke ground on our Asia Pacific Innovation Campus at our Shanghai site, where we will provide our customers with local research and development capabilities. In addition, we launched a new technical center for dispersions in Jakarta, Indonesia, for intermediates in Shanghai as well as for environmentally friendly automotive coatings in Seoul, South Korea.
South America, Africa, Middle EastThanks to the strong economic recovery, sales by companies in the region were sharply higher than the 2009 level, increasing by 31% to €3,829 million. In local currency terms, sales were 19% higher than 2009.
In South America, our sales rose in all segments. In the Agricultural Solutions segment, demand for our innovative crop protection products increased in all indications. Sales volumes in our business with architectural coatings also improved considerably. In Africa and the Middle East, sales increased in all seg-ments and nearly all divisions. Only the Petrochemicals division experienced a slight decline in sales. Compared with 2009, income from operations declined by €104 million to €177 million. This was due to one-time expenses for valuation adjustments on receivables related to long-term supply agreements. In February 2010, we started construction of a sodium methylate plant in Guaratinguetá, Brazil, the largest BASF site in South America. The plant, which will have an annual capac-ity of 60,000 metric tons, will primarily serve the regional market. Sodium methylate is a key chemical for the efficient production of biodiesel, an increasingly important alternative to diesel fuels. Furthermore, we will also be putting a special focus on our business with solutions for the construction sector in Brazil. We expect the industry to pick up sharply as a result of infrastruc-ture investments in advance of major sporting events such as the Soccer World Cup in 2014 and the Olympic Games in 2016 as well as government growth programs. New strategies are helping us to take advantage of oppor-tunities in the Africa and Middle East regions, thus tapping further business potential.
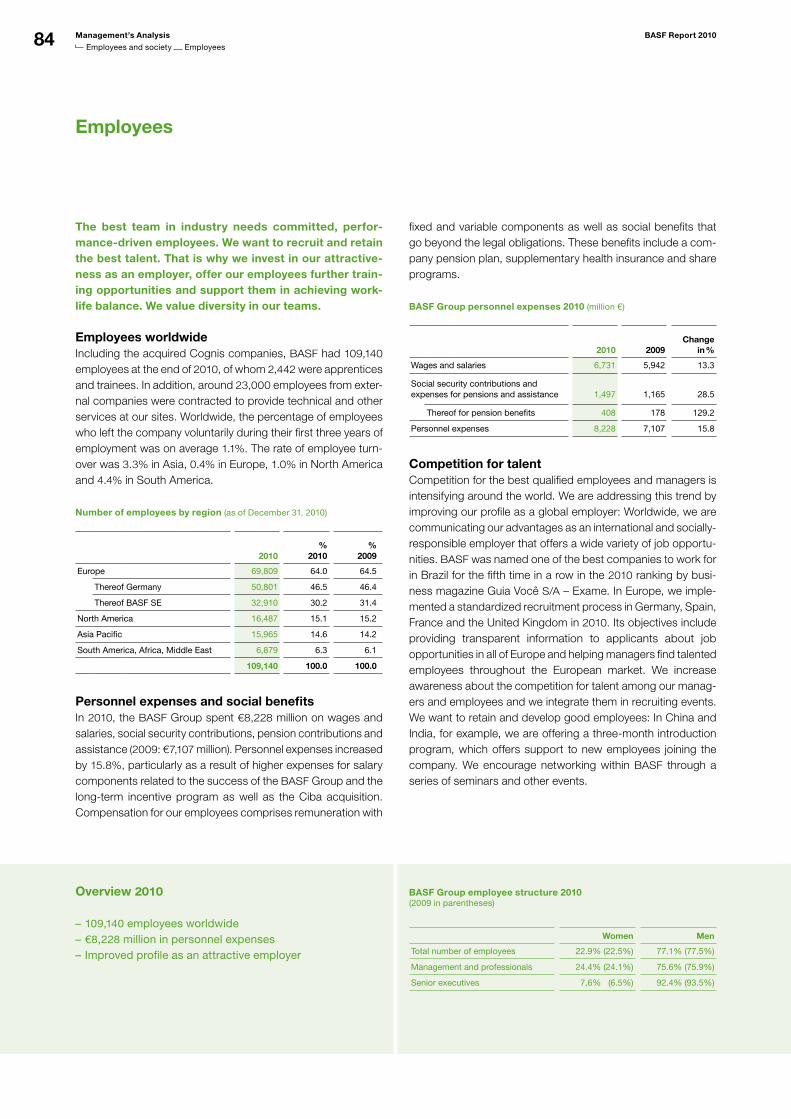
84 Management’s Analysis BASF Report 2010
Employees and society Employees
The best team in industry needs committed, perfor-mance-driven employees. We want to recruit and retain the best talent. That is why we invest in our attractive-ness as an employer, offer our employees further train-ing opportunities and support them in achieving work-life balance. We value diversity in our teams.
Employees worldwide Including the acquired Cognis companies, BASF had 109,140 employees at the end of 2010, of whom 2,442 were apprentices and trainees. In addition, around 23,000 employees from exter-nal companies were contracted to provide technical and other services at our sites. Worldwide, the percentage of employees who left the company voluntarily during their first three years of employment was on average 1.1%. The rate of employee turn-over was 3.3% in Asia, 0.4% in Europe, 1.0% in North America and 4.4% in South America.
Number of employees by region (as of December 31, 2010)
2010%
2010%
2009
Europe 69,809 64.0 64.5
Thereof Germany 50,801 46.5 46.4
Thereof BASF SE 32,910 30.2 31.4
North America 16,487 15.1 15.2
Asia Pacific 15,965 14.6 14.2
South America, Africa, Middle East 6,879 6.3 6.1
109,140 100.0 100.0
Personnel expenses and social benefits In 2010, the BASF Group spent €8,228 million on wages and salaries, social security contributions, pension contributions and assistance (2009: €7,107 million). Personnel expenses increased by 15.8%, particularly as a result of higher expenses for salary components related to the success of the BASF Group and the long-term incentive program as well as the Ciba acquisition. Compensation for our employees comprises remuneration with
fixed and variable components as well as social benefits that go beyond the legal obligations. These benefits include a com-pany pension plan, supplementary health insurance and share programs.
BASF Group personnel expenses 2010 (million €)
2010 2009Change
in %
Wages and salaries 6,731 5,942 13.3
Social security contributions and expenses for pensions and assistance 1,497 1,165 28.5
Thereof for pension benefits 408 178 129.2
Personnel expenses 8,228 7,107 15.8
Competition for talent Competition for the best qualified employees and managers is intensifying around the world. We are addressing this trend by improving our profile as a global employer: Worldwide, we are communicating our advantages as an international and socially- responsible employer that offers a wide variety of job opportu-nities. BASF was named one of the best companies to work for in Brazil for the fifth time in a row in the 2010 ranking by busi-ness magazine Guia Você S/A – Exame. In Europe, we imple-mented a standardized recruitment process in Germany, Spain, France and the United Kingdom in 2010. Its objectives include providing transparent information to applicants about job opportunities in all of Europe and helping managers find talented employees throughout the European market. We increase awareness about the competition for talent among our manag-ers and employees and we integrate them in recruiting events. We want to retain and develop good employees: In China and India, for example, we are offering a three-month introduction program, which offers support to new employees joining the company. We encourage networking within BASF through a series of seminars and other events.
Employees
Overview 2010 BASF Group employee structure 2010 (2009 in parentheses)
Women Men
Total number of employees 22.9% (22.5%) 77.1% (77.5%)
Management and professionals 24.4% (24.1%) 75.6% (75.9%)
Senior executives 7.6% (6.5%) 92.4% (93.5%)
109,140 – employees worldwide€8,228 – million in personnel expenses Improved profile as an attractive employer –
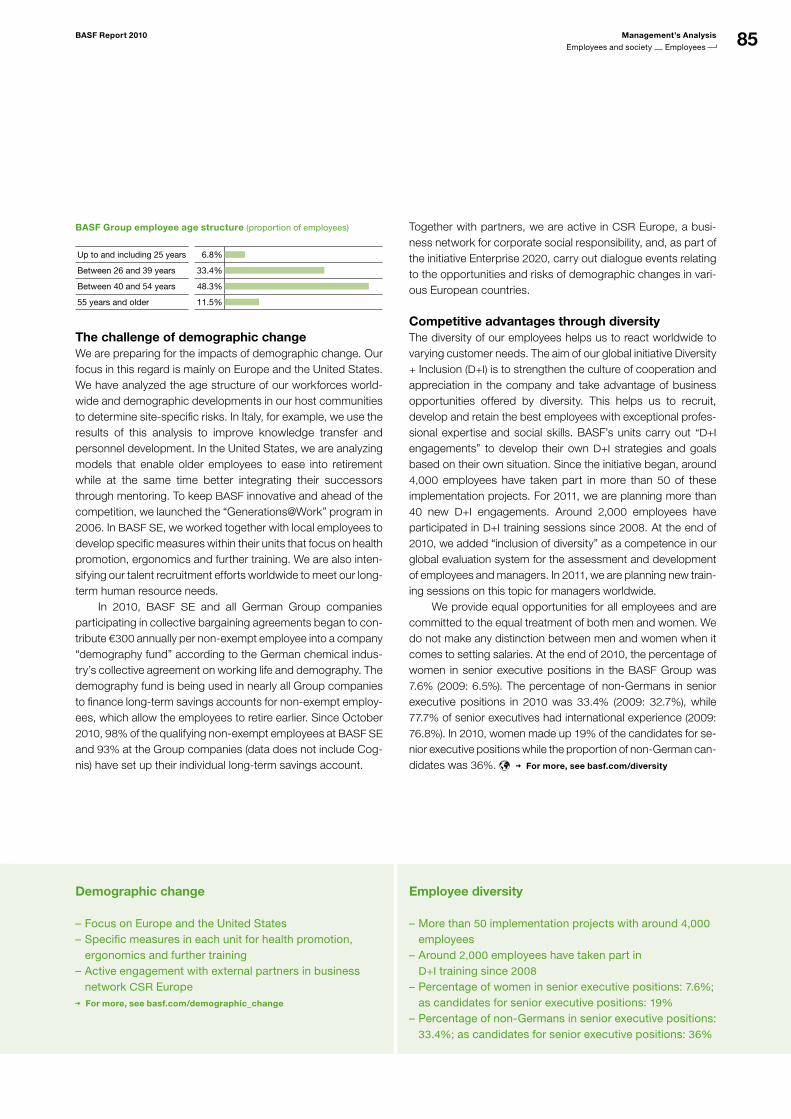
85BASF Report 2010 Management’s Analysis
Employees and society Employees
BASF Group employee age structure (proportion of employees)
Up to and including 25 years 6.8%
wird aktualisiert
Between 26 and 39 years 33.4%
Between 40 and 54 years 48.3%
55 years and older 11.5%
The challenge of demographic changeWe are preparing for the impacts of demographic change. Our focus in this regard is mainly on Europe and the United States. We have analyzed the age structure of our workforces world-wide and demographic developments in our host communities to determine site-specific risks. In Italy, for example, we use the results of this analysis to improve knowledge transfer and personnel development. In the United States, we are analyzing models that enable older employees to ease into retirement while at the same time better integrating their successors through mentoring. To keep BASF innovative and ahead of the competition, we launched the “Generations@Work” program in 2006. In BASF SE, we worked together with local employees to develop specific measures within their units that focus on health promotion, ergonomics and further training. We are also inten-sifying our talent recruitment efforts worldwide to meet our long-term human resource needs. In 2010, BASF SE and all German Group companies participating in collective bargaining agreements began to con-tribute €300 annually per non-exempt employee into a company “demography fund” according to the German chemical indus-try’s collective agreement on working life and demography. The demography fund is being used in nearly all Group companies to finance long-term savings accounts for non-exempt employ-ees, which allow the employees to retire earlier. Since October 2010, 98% of the qualifying non-exempt employees at BASF SE and 93% at the Group companies (data does not include Cog-nis) have set up their individual long-term savings account.
Together with partners, we are active in CSR Europe, a busi-ness network for corporate social responsibility, and, as part of the initiative Enterprise 2020, carry out dialogue events relating to the opportunities and risks of demographic changes in vari-ous European countries.
Competitive advantages through diversityThe diversity of our employees helps us to react worldwide to varying customer needs. The aim of our global initiative Diversity + Inclusion (D+I) is to strengthen the culture of cooperation and appreciation in the company and take advantage of business opportunities offered by diversity. This helps us to recruit, develop and retain the best employees with exceptional profes-sional expertise and social skills. BASF’s units carry out “D+I engagements” to develop their own D+I strategies and goals based on their own situation. Since the initiative began, around 4,000 employees have taken part in more than 50 of these implementation projects. For 2011, we are planning more than 40 new D+I engagements. Around 2,000 employees have participated in D+I training sessions since 2008. At the end of 2010, we added “inclusion of diversity” as a competence in our global evaluation system for the assessment and development of employees and managers. In 2011, we are planning new train-ing sessions on this topic for managers worldwide. We provide equal opportunities for all employees and are committed to the equal treatment of both men and women. We do not make any distinction between men and women when it comes to setting salaries. At the end of 2010, the percentage of women in senior executive positions in the BASF Group was 7.6% (2009: 6.5%). The percentage of non-Germans in senior executive positions in 2010 was 33.4% (2009: 32.7%), while 77.7% of senior executives had international experience (2009: 76.8%). In 2010, women made up 19% of the candidates for se-nior executive positions while the proportion of non-German can-didates was 36%. For more, see basf.com/diversity
Demographic change Employee diversity
Focus on Europe and the United States –Specific measures in each unit for health promotion, –ergonomics and further trainingActive engagement with external partners in business –network CSR EuropeFor more, see basf.com/demographic_change
More than – 50 implementation projects with around 4,000 employeesAround – 2,000 employees have taken part in D+I training since 2008
Percentage of women in senior executive positions: – 7.6%; as candidates for senior executive positions: 19%
Percentage of nonGermans in senior executive positions: –33.4%; as candidates for senior executive positions: 36%
86 Management’s Analysis BASF Report 2010
Employees and society Employees
Vocational and further training Promoting work-life balance
Worldwide, – 2,442 apprentices and trainees in over 60 occupationsAround – €155 million invested in vocational and further trainingMore than – 87,000 employees participate in training programs worldwideKnowledge transfer programs –Start of new global initiative for personnel development –
Flexible working models –Regional initiatives to meet the needs of our –employees at a local levelServices for employees who are caring for relatives –BASF – Sozialberatung offers support to employees in difficult personal situations
Vocational training BASF is currently training 2,442 young people in more than 60 occupations in 16 countries. In 2010, 1,115 young people started apprenticeships and traineeships at German Group companies and in the BASF Training Verbund. Since 2004, the BASF Train-ing Verbund, which today has around 700 partner companies, has been creating additional apprenticeship positions in Ger-many and is currently training 3,572 young people. After pass-ing their final examination, 96% of the apprentices and trainees at BASF SE received a job offer in 2010, as did 77% of the train-ees in the BASF Training Verbund. Worldwide, we invested around €71.9 million in our apprentices and trainees in 2010. In addition, as part of our social commitment, we invested approx-imately €23.7 million in the Training Verbund. Our exchange programs, for example, between Germany, France, Norway and Spain, offer apprentices the opportunity to strengthen their intercultural skills. In 2010, 50 apprentices from BASF SE and BASF Schwarzheide took part in the program.
Further training and personnel developmentThe further training of our employees is an investment in BASF’s future success. In annual performance reviews, we determine every employee’s need for professional development and further training. In addition to individual seminars and work-shops, we also offer a wide range of opportunities for indepen-dent learning via electronic media worldwide. To promote the systematic transfer of experience in BASF SE, we use the “knowledge relay,” in which employees leaving a position meet with their successor and external experts to identify and docu-ment their experience. In 2010, BASF invested around €155 million (2009: €134 million) in vocational training and further training (data does not include Cognis). More than 87,000 employees worldwide participated in training programs. On average, each employee spent 4.1 days at further training events (2009: 3.5 days). With our initiative “Employee Development BASF Group,” we want to
ensure that employees and managers share responsibility for personnel development. The objective is to make career paths transparent and to establish corresponding instruments and processes that allow employees to actively plan their career.
Work-life balanceAround the world, we are expanding and enhancing our diverse range of programs to improve work-life balance. To compete for the best employees, we are responding to the differing needs and life stages of our employees. Our programs include flexible working-time models, such as telecommuting, flexitime, part-time and leaves of absence. We have regional initiatives to meet the individual needs of our employees at a local level. In Asia, for example, we started a new work-life balance program in 2010, which includes flexible working-time models as well as health programs and calls on managers to act as role models. At our Ludwigshafen site, we enlarged our daycare center LuKids in 2010. In addition, we meet with employees before they go on parental leave to develop a plan for their return to work, which we support with special seminars. At the end of 2010, 520 BASF SE employees were on parental leave, of whom 45 (8.7%) were fathers. The percentage of employees working part-time for BASF SE is 10.4%. We offer special training opportunities for employees working part-time. Employees caring for their relatives benefit from the oppor-tunity to share experiences, receive caregiver counseling and access an expanded array of media resources. BASF Sozial-beratung (BASF social assistance) supports employees, partic-ularly at BASF SE, who find themselves in difficult personal sit-uations and it helps them to continue performing their jobs. In North America, our efforts were honored in 2009 with the Alfred P. Sloan Award for Business Excellence in Workplace Flexibility, mainly in recognition of our regional “Designed to Fit” initiative for flexible working hours introduced in 2008. For more, see basf.com/worklife_balance
87BASF Report 2010 Management’s Analysis
Employees and society Employees
Participation in the company’s success Feedback from our employees
“plus” – share program encourages employees to make longterm investments through incentive shares; 18,932 employees purchased 632,560 BASF shares in 2010
Longterm incentive – (LTI) program ties a proportion of senior executives’ compensation to the longterm performance of BASF shares; in 2010, 91% of the senior executives eligible participated worldwide
Over – 1,500 measures introduced following the global employee survey in 2008
Employees evaluated implementation of the –measures in a followup survey in spring 2010
Systematic feedback for managers in –exempt positions will become mandatory
Employee participation in the company’s successWe want to foster our employees’ interest in the company’s success and business performance. With variable remuneration systems, we allow employees to share in the company’s success and be rewarded for their individual performance. The same basic principles apply to all employees. The variable component is determined by the eco-nomic success of the BASF Group – measured by the return on assets – and the employee’s individual performance. Despite the difficult economic environment in 2009, BASF was able to give employees a bonus in 2010 and announced it would reward its employees for their performance during the crisis with a special payment. The bonus payment for 2010 will be signifi-cantly higher than the year before. The “plus” share program promotes the long-term partici-pation of our employees through incentive shares, allowing them to invest part of their remuneration in BASF shares. In 2010, 18,932 employees purchased 632,560 shares under the “plus” program. Since 1999, BASF has offered its senior executives the opportunity to participate in a stock price-based compen-sation program. This long-term incentive (LTI) program ties a proportion of their compensation to the long-term performance of BASF shares. In 2010, 91% of the approximately 1,100 senior executives eligible participated in the LTI program worldwide, investing up to 30% of their variable compensation.
For more, see the Notes on page 185
Feedback from our employeesIn the process of evaluating the results of our first global employee survey in 2008, we introduced over 1,500 measures worldwide to improve the working environment. In the follow-up survey in spring 2010, employees from 72 countries had the opportunity to assess the implementation of the measures, 62% of the employees surveyed responded. After the completion of the sur-vey, employees and managers discuss the results and identify potential areas for improvement. There is particular focus on areas that have been evaluated critically, such as communication
and how managers show involvement. We also measure the implementation of our strategic guideline “We form the best team in industry.” We will establish the global employee survey, includ-ing the follow-up process, in the entire BASF Group on a perma-nent basis. In 2011, BASF SE will introduce a mandatory training pro-gram for all new managers, which will be extended to include experienced managers from 2012. Managers in exempt positions will be required to obtain systematic feedback.
Dialogue with employee representativesUsing established procedures, we involve employee represen-tatives in decision-making processes and procedures in our Group companies. If restructuring leads to staff downsizing, as it did in the course of the Ciba integration, we work with employee representatives to develop socially responsible imple-mentation measures. This is done in accordance with the respective legal regulations and mutual agreements. In addition to the local structures for cooperation, a national body for employee representation was established in France in 2010. For cross-border matters, the BASF Europa Betriebsrat (Europe Works Council) has been responsible for employees in Europe since 2008. As a result of the higher number of employees in 2009, it was expanded to include two more representatives in 2010. BASF SE management and employee representatives at the Ludwigshafen site signed a new agreement in 2010, which includes a package of measures to increase flexibility regarding the allocation of personnel resources as well as a pledge that there will be no enforced redundancies through the end of 2015. For more, see basf.com/employeerepresentation
Responsibility for employees – global standardsCompliance with national law and the core labor standards of the International Labor Organization (ILO) is the foundation of our social responsibility. Moreover, we aim to harmonize our working conditions with our voluntary commitments and rele-vant ILO conventions. We evaluate our adherence to our
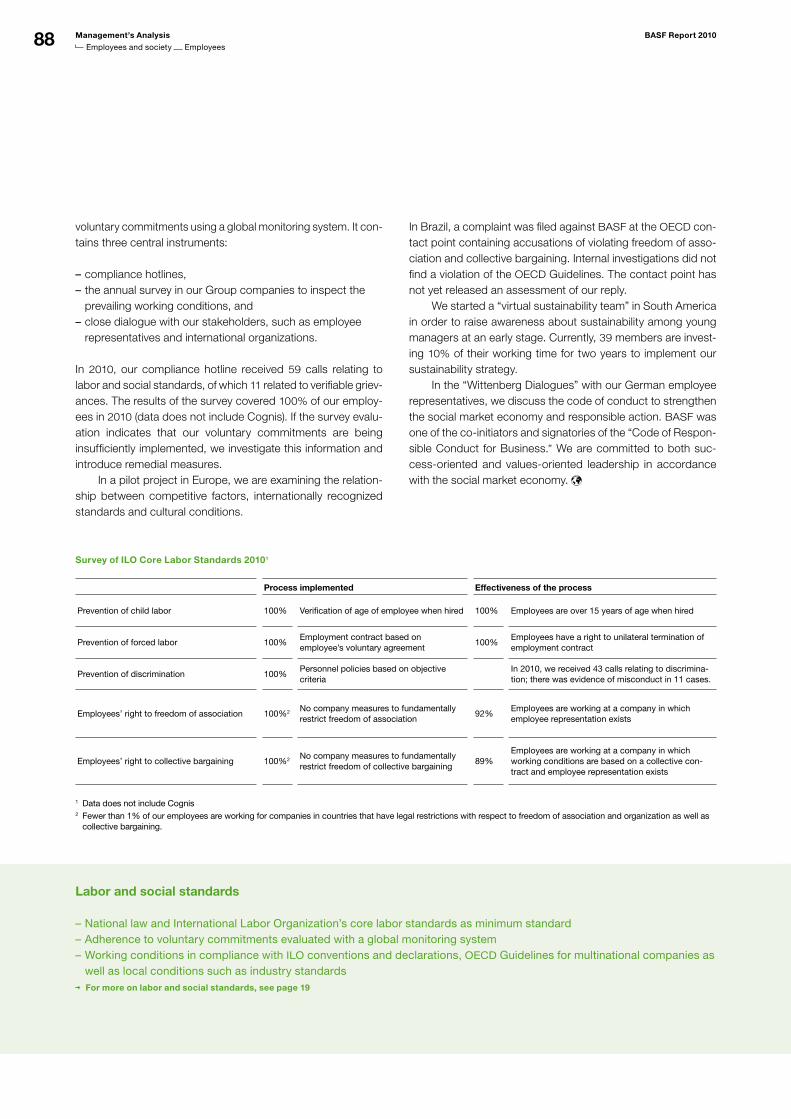
88 Management’s Analysis BASF Report 2010
Employees and society Employees
Labor and social standards
National law and International Labor Organization’s core labor standards as minimum standard –Adherence to voluntary commitments evaluated with a global monitoring system –Working conditions in compliance with – ILO conventions and declarations, OECD Guidelines for multinational companies as well as local conditions such as industry standards For more on labor and social standards, see page 19
voluntary commitments using a global monitoring system. It con-tains three central instruments:
compliance hotlines, –the annual survey in our Group companies to inspect the –prevailing working conditions, andclose dialogue with our stakeholders, such as employee –representatives and international organizations.
In 2010, our compliance hotline received 59 calls relating to labor and social standards, of which 11 related to verifiable griev-ances. The results of the survey covered 100% of our employ-ees in 2010 (data does not include Cognis). If the survey evalu-ation indicates that our voluntary commitments are being insufficiently implemented, we investigate this information and introduce remedial measures. In a pilot project in Europe, we are examining the relation-ship between competitive factors, internationally recognized standards and cultural conditions.
In Brazil, a complaint was filed against BASF at the OECD con-tact point containing accusations of violating freedom of asso-ciation and collective bargaining. Internal investigations did not find a violation of the OECD Guidelines. The contact point has not yet released an assessment of our reply. We started a “virtual sustainability team” in South America in order to raise awareness about sustainability among young managers at an early stage. Currently, 39 members are invest-ing 10% of their working time for two years to implement our sustainability strategy. In the “Wittenberg Dialogues” with our German employee representatives, we discuss the code of conduct to strengthen the social market economy and responsible action. BASF was one of the co-initiators and signatories of the “Code of Respon-sible Conduct for Business.” We are committed to both suc-cess-oriented and values-oriented leadership in accordance with the social market economy.
Survey of ILO Core Labor Standards 20101
Process implemented Effectiveness of the process
Prevention of child labor 100% Verification of age of employee when hired 100% Employees are over 15 years of age when hired
Prevention of forced labor 100%Employment contract based on employ ee’s voluntary agreement
100%Employees have a right to unilateral termination of employment contract
Prevention of discrimination 100%Personnel policies based on objective criteria
In 2010, we received 43 calls relating to discrimination; there was evidence of misconduct in 11 cases.
Employees’ right to freedom of association 100%2 No company measures to fundamentally restrict freedom of association
92%Employees are working at a company in which employee representation exists
Employees’ right to collective bargaining 100%2 No company measures to fundamentally restrict freedom of collective bargaining
89%Employees are working at a company in which working conditions are based on a collective contract and employee representation exists
1 Data does not include Cognis2 Fewer than 1% of our employees are working for companies in countries that have legal restrictions with respect to freedom of association and organization as well as
collective bargaining.
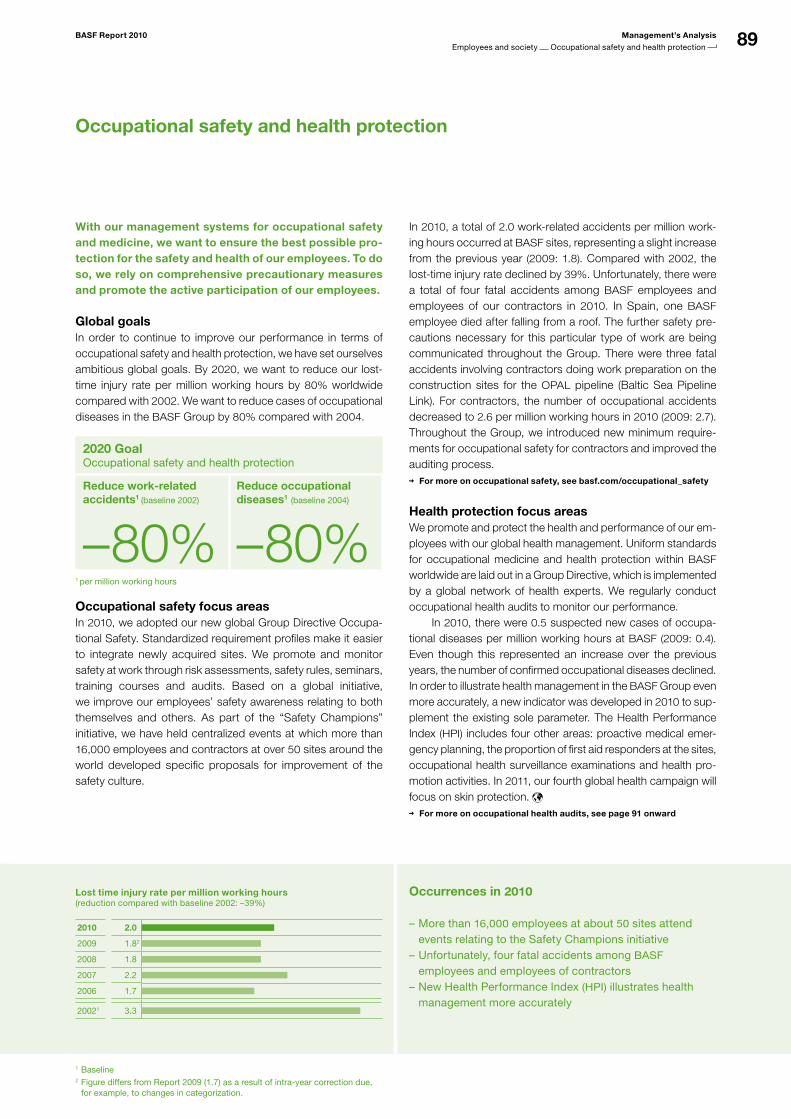
89BASF Report 2010 Management’s Analysis
Employees and society Occupational safety and health protection
Occurrences in 2010
More than – 16,000 employees at about 50 sites attend events relating to the Safety Champions initiativeUnfortunately, four fatal accidents among – BASF employees and employees of contractorsNew Health Performance Index – (HPI) illustrates health management more accurately
Occupational safety and health protection
With our management systems for occupational safety and medicine, we want to ensure the best possible pro-tection for the safety and health of our employees. To do so, we rely on comprehensive precautionary measures and promote the active participation of our employees.
Global goalsIn order to continue to improve our performance in terms of occupational safety and health protection, we have set ourselves ambitious global goals. By 2020, we want to reduce our lost-time injury rate per million working hours by 80% worldwide compared with 2002. We want to reduce cases of occupational diseases in the BASF Group by 80% compared with 2004.
2020 GoalOccupational safety and health protection
Reduce work-related accidents1 (baseline 2002)
– 80%Reduce occupational diseases1 (baseline 2004)
– 80%1 per million working hours
Occupational safety focus areasIn 2010, we adopted our new global Group Directive Occupa-tional Safety. Standardized requirement profiles make it easier to integrate newly acquired sites. We promote and monitor safety at work through risk assessments, safety rules, seminars, training courses and audits. Based on a global initiative, we improve our employees’ safety awareness relating to both themselves and others. As part of the “Safety Champions” initiative, we have held centralized events at which more than 16,000 employees and contractors at over 50 sites around the world developed specific proposals for improvement of the safety culture.
In 2010, a total of 2.0 work-related accidents per million work-ing hours occurred at BASF sites, representing a slight increase from the previous year (2009: 1.8). Compared with 2002, the lost-time injury rate declined by 39%. Unfortunately, there were a total of four fatal accidents among BASF employees and employees of our contractors in 2010. In Spain, one BASF employee died after falling from a roof. The further safety pre-cautions necessary for this particular type of work are being communicated throughout the Group. There were three fatal accidents involving contractors doing work preparation on the construction sites for the OPAL pipeline (Baltic Sea Pipeline Link). For contractors, the number of occupational accidents decreased to 2.6 per million working hours in 2010 (2009: 2.7). Throughout the Group, we introduced new minimum require-ments for occupational safety for contractors and improved the auditing process.
For more on occupational safety, see basf.com/occupational_safety
Health protection focus areasWe promote and protect the health and performance of our em-ployees with our global health management. Uniform standards for occupational medicine and health protection within BASF worldwide are laid out in a Group Directive, which is implemented by a global network of health experts. We regularly conduct occupational health audits to monitor our performance. In 2010, there were 0.5 suspected new cases of occupa-tional diseases per million working hours at BASF (2009: 0.4). Even though this represented an increase over the previous years, the number of confirmed occupational diseases declined. In order to illustrate health management in the BASF Group even more accurately, a new indicator was developed in 2010 to sup-plement the existing sole parameter. The Health Performance Index (HPI) includes four other areas: proactive medical emer-gency planning, the proportion of first aid responders at the sites, occupational health surveillance examinations and health pro-motion activities. In 2011, our fourth global health campaign will focus on skin protection.
For more on occupational health audits, see page 91 onward
Lost time injury rate per million working hours (reduction compared with baseline 2002: –39%)
2010 2.0
wird a
ktual
isier
t
2009 1.82
2008 1.8
2007 2.2
2006 1.7
20021 3.3
1 Baseline2 Figure differs from Report 2009 (1.7) as a result of intrayear correction due,
for example, to changes in categorization.
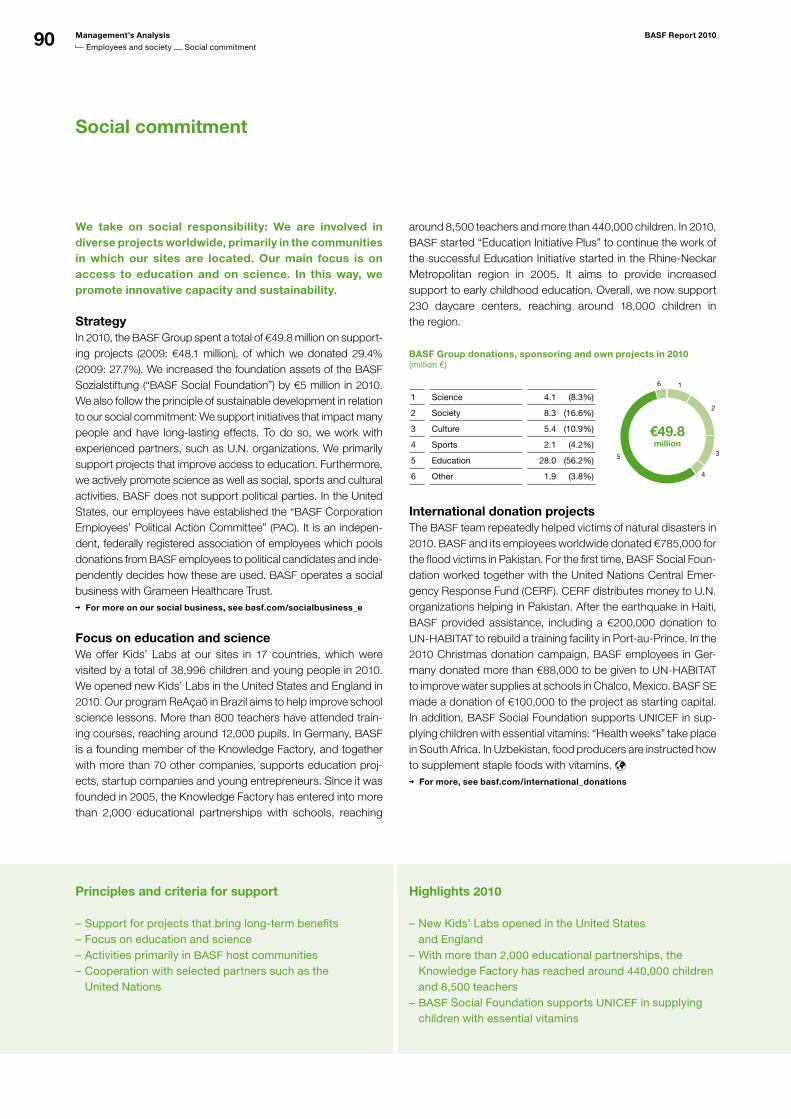
90 Management’s Analysis BASF Report 2010
Employees and society Social commitment
1 Basisjahr
Social commitment
Highlights 2010 Principles and criteria for support
New Kids’ Labs opened in the United States –and EnglandWith more than – 2,000 educational partnerships, the Knowledge Factory has reached around 440,000 children and 8,500 teachersBASF – Social Foundation supports UNICEF in supplying children with essential vitamins
Support for projects that bring longterm benefits –Focus on education and science –Activities primarily in – BASF host communitiesCooperation with selected partners such as the –United Nations
We take on social responsibility: We are involved in diverse projects worldwide, primarily in the communities in which our sites are located. Our main focus is on access to education and on science. In this way, we promote innovative capacity and sustainability.
StrategyIn 2010, the BASF Group spent a total of €49.8 million on support-ing projects (2009: €48.1 million), of which we donated 29.4% (2009: 27.7%). We increased the foundation assets of the BASF Sozialstiftung (“BASF Social Foundation”) by €5 million in 2010. We also follow the principle of sustainable development in relation to our social commitment: We support initiatives that impact many people and have long-lasting effects. To do so, we work with experienced partners, such as U.N. organizations. We primarily support projects that improve access to education. Furthermore, we actively promote science as well as social, sports and cultural activities. BASF does not support political parties. In the United States, our employees have established the “BASF Corporation Employees’ Political Action Committee” (PAC). It is an indepen-dent, federally registered association of employees which pools donations from BASF employees to political candidates and inde-pendently decides how these are used. BASF operates a social business with Grameen Healthcare Trust.
For more on our social business, see basf.com/socialbusiness_e
Focus on education and scienceWe offer Kids’ Labs at our sites in 17 countries, which were visited by a total of 38,996 children and young people in 2010. We opened new Kids’ Labs in the United States and England in 2010. Our program ReAçaõ in Brazil aims to help improve school science lessons. More than 800 teachers have attended train-ing courses, reaching around 12,000 pupils. In Germany, BASF is a founding member of the Knowledge Factory, and together with more than 70 other companies, supports education proj-ects, startup companies and young entrepreneurs. Since it was founded in 2005, the Knowledge Factory has entered into more than 2,000 educational partnerships with schools, reaching
around 8,500 teachers and more than 440,000 children. In 2010, BASF started “Education Initiative Plus” to continue the work of the successful Education Initiative started in the Rhine-Neckar Metropolitan region in 2005. It aims to provide increased support to early childhood education. Overall, we now support 230 daycare centers, reaching around 18,000 children in the region.
BASF Group donations, sponsoring and own projects in 2010 (million €)
1 Science 4.1 (8.3%)
2 Society 8.3 (16.6%)
3 Culture 5.4 (10.9%)
4 Sports 2.1 (4.2%)
5 Education 28.0 (56.2%)
6 Other 1.9 (3.8%)
International donation projectsThe BASF team repeatedly helped victims of natural disasters in 2010. BASF and its employees worldwide donated €785,000 for the flood victims in Pakistan. For the first time, BASF Social Foun-dation worked together with the United Nations Central Emer-gency Response Fund (CERF). CERF distributes money to U.N. organizations helping in Pakistan. After the earthquake in Haiti, BASF provided assistance, including a €200,000 donation to UN-HABITAT to rebuild a training facility in Port-au-Prince. In the 2010 Christmas donation campaign, BASF employees in Ger-many donated more than €88,000 to be given to UN-HABITAT to improve water supplies at schools in Chalco, Mexico. BASF SE made a donation of €100,000 to the project as starting capital. In addition, BASF Social Foundation supports UNICEF in sup-plying children with essential vitamins: “Health weeks” take place in South Africa. In Uzbekistan, food producers are instructed how to supplement staple foods with vitamins.
For more, see basf.com/international_donations
1
2
3
4
5
6
€49.8million
wird a
ktual
isier
t
91BASF Report 2010 Management’s Analysis
Environment and safety Environmental, safety and security management
Environmental, safety and security management
Environmental protection, safety and security are defined in our corporate guidelines – and are therefore important management responsibilities of BASF. With our Responsible Care Management System, we set out how we implement our voluntary commitments. Our top priority is to protect our employees and neighbors and to safeguard our productivity.
Strategy and management systemsOur Responsible Care Management System (RCMS) forms the framework for environmental protection, safety and security at BASF. It sets out globally applicable standards with clear rules in these subject areas. Binding global directives define the requirements, responsibilities and assessment methods for the implementation of these standards. We regularly conduct audits to monitor our performance. In order to further improve our per-formance, we set ourselves ambitious environmental protection, safety and security goals and regularly report on our progress. The RCMS defines the processes that we use to measure our progress toward these goals. In 2010, we introduced our Group Directive Occupational Safety. In addition, we also defined global minimum requirements for occupational and site safety. We continuously work on improving our environmental, safety and security management system. To this end, we rely on preventive measures and analyze weak points in everything from production to logistics that could have potential effects on our employees’ safety and security, the environment or our commu-nities. Collecting and evaluating data on a global basis helps us to systematically learn from our mistakes. Databases record all accidents, near-misses and other incidents at the sites or on transportation routes. We also include incidents involving employees of personnel leasing companies and contractors.
We raise our employees’ awareness of environmental protection and occupational safety in the workplace. To do this, we must communicate openly about mistakes and challenges, which we support through activities such as our global safety initiative. To further improve our environmental and safety sys-tems, we also incorporate information from dialogue with stake-holders, for example, from our materiality analysis. We received several external honors for our safety work in 2010. At the National Safety Awards in Sri Lanka, BASF Lanka (Pvt) Ltd. was honored as the safest workplace in the small-scale category of “All Sectors.” In 2010, German customs authorities certified BASF SE’s sites in Ludwigshafen and Limburgerhof as a trusted supplier with regards to product deliveries to the con-sumer. This certification allows customs procedures to be sim-plified, making it easier for our divisions to supply customers quickly and on time.
For more on our strategic guidelines, see page 18; for more on our standards for occupational safety and health protection, see pages 19 and 87 onward; for more on Responsible Care, see basf.com/responsible-care_e
AuditsRegular audits help us to ensure consistently high standards within the BASF Group in all areas of environmental protection, safety, security and health protection. The requirements for the inspections are set out in our BASF Group Directive Responsi-ble Care Audits. These also include a defined procedure to be followed if standards are not adhered to. When a site or plant is audited, an environmental, safety and security profile is created on the basis of clearly defined criteria. We use a matrix to show if our safety, security and environmental performance is suffi-cient to address the existing risk potential. If this is not the case, we stipulate measures and conduct follow-up audits on their implementation soon afterward. We carry out audits at BASF sites and companies in which BASF is a majority shareholder. In 2010, 97 safety, security and environment audits were carried out in the BASF Group at 66 sites. BASF carried out audits relating to occupational medicine and health protection at 34 sites.
Responsible Care Management Audits
RCMS – is the framework for safe production and transport of products and regulates the conditions for the implementation of our voluntary commitmentsNew Group directive on occupational safety –introduced in 2010
Recording and evaluating events helps us –learn from mistakes
Regular audits help ensure uniformly high standards for –environmental protection, safety, security and healthGlobal directive specifies requirements and –implementation of audits97 – audits on safety, security and environment, 34 audits on occupational medicine and health protection in 2010
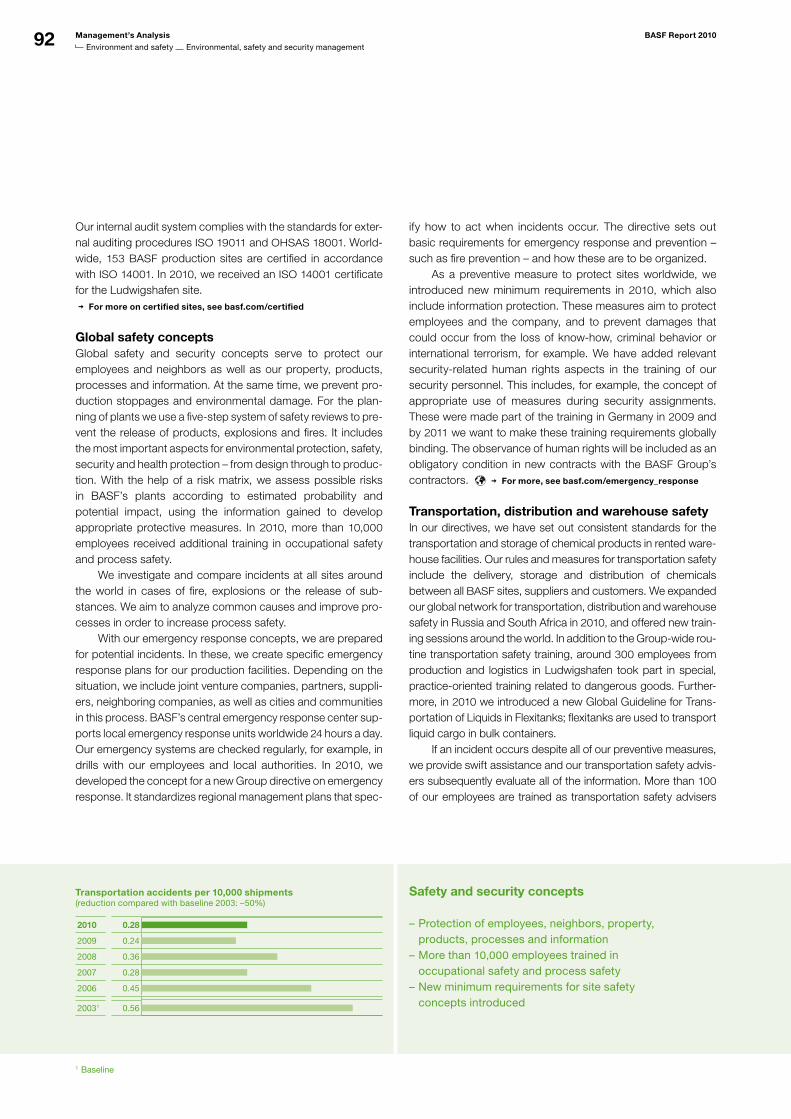
92 Management’s Analysis BASF Report 2010
Environment and safety Environmental, safety and security management
Our internal audit system complies with the standards for exter-nal auditing procedures ISO 19011 and OHSAS 18001. World-wide, 153 BASF production sites are certified in accordance with ISO 14001. In 2010, we received an ISO 14001 certificate for the Ludwigshafen site. For more on certified sites, see basf.com/certified
Global safety conceptsGlobal safety and security concepts serve to protect our employees and neighbors as well as our property, products, processes and information. At the same time, we prevent pro-duction stoppages and environmental damage. For the plan-ning of plants we use a five-step system of safety reviews to pre-vent the release of products, explosions and fires. It includes the most important aspects for environmental protection, safety, security and health protection – from design through to produc-tion. With the help of a risk matrix, we assess possible risks in BASF’s plants according to estimated probability and potential impact, using the information gained to develop appropriate protective measures. In 2010, more than 10,000 employees received additional training in occupational safety and process safety. We investigate and compare incidents at all sites around the world in cases of fire, explosions or the release of sub-stances. We aim to analyze common causes and improve pro-cesses in order to increase process safety. With our emergency response concepts, we are prepared for potential incidents. In these, we create specific emergency response plans for our production facilities. Depending on the situation, we include joint venture companies, partners, suppli-ers, neighboring companies, as well as cities and communities in this process. BASF’s central emergency response center sup-ports local emergency response units worldwide 24 hours a day. Our emergency systems are checked regularly, for example, in drills with our employees and local authorities. In 2010, we developed the concept for a new Group directive on emergency response. It standardizes regional management plans that spec-
ify how to act when incidents occur. The directive sets out basic requirements for emergency response and prevention – such as fire prevention – and how these are to be organized. As a preventive measure to protect sites worldwide, we introduced new minimum requirements in 2010, which also include information protection. These measures aim to protect employees and the company, and to prevent damages that could occur from the loss of know-how, criminal behavior or international terrorism, for example. We have added relevant security-related human rights aspects in the training of our security personnel. This includes, for example, the concept of appropriate use of measures during security assignments. These were made part of the training in Germany in 2009 and by 2011 we want to make these training requirements globally binding. The observance of human rights will be included as an obligatory condition in new contracts with the BASF Group’s contractors. For more, see basf.com/emergency_response
Transportation, distribution and warehouse safetyIn our directives, we have set out consistent standards for the transportation and storage of chemical products in rented ware-house facilities. Our rules and measures for transportation safety include the delivery, storage and distribution of chemicals between all BASF sites, suppliers and customers. We expanded our global network for transportation, distribution and warehouse safety in Russia and South Africa in 2010, and offered new train-ing sessions around the world. In addition to the Group-wide rou-tine transportation safety training, around 300 employees from production and logistics in Ludwigshafen took part in special, practice-oriented training related to dangerous goods. Further-more, in 2010 we introduced a new Global Guideline for Trans-portation of Liquids in Flexitanks; flexitanks are used to transport liquid cargo in bulk containers. If an incident occurs despite all of our preventive measures, we provide swift assistance and our transportation safety advis-ers subsequently evaluate all of the information. More than 100 of our employees are trained as transportation safety advisers
Safety and security concepts
Protection of employees, neighbors, property, –products, processes and informationMore than – 10,000 employees trained in occupational safety and process safetyNew minimum requirements for site safety –concepts introduced
Transportation accidents per 10,000 shipments(reduction compared with baseline 2003: –50%)
2010 0.28
wird a
ktual
isier
t
2009 0.24
2008 0.36
2007 0.28
2006 0.45
20031 0.56
1 Baseline
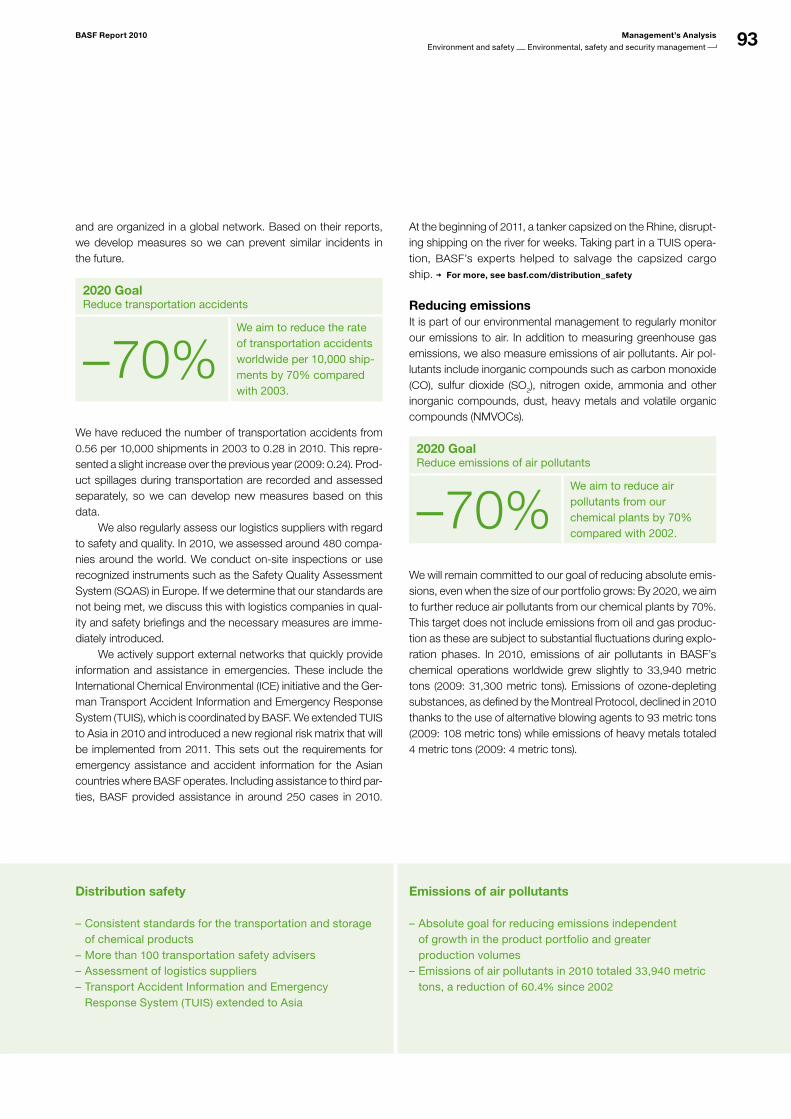
93BASF Report 2010 Management’s Analysis
Environment and safety Environmental, safety and security management
and are organized in a global network. Based on their reports, we develop measures so we can prevent similar incidents in the future.
2020 GoalReduce transportation accidents
– 70%We aim to reduce the rate of transportation accidents worldwide per 10,000 shipments by 70% compared with 2003.
We have reduced the number of transportation accidents from 0.56 per 10,000 shipments in 2003 to 0.28 in 2010. This repre-sented a slight increase over the previous year (2009: 0.24). Prod-uct spillages during transportation are recorded and assessed separately, so we can develop new measures based on this data. We also regularly assess our logistics suppliers with regard to safety and quality. In 2010, we assessed around 480 compa-nies around the world. We conduct on-site inspections or use recognized instruments such as the Safety Quality Assessment System (SQAS) in Europe. If we determine that our standards are not being met, we discuss this with logistics companies in qual-ity and safety briefings and the necessary measures are imme-diately introduced. We actively support external networks that quickly provide information and assistance in emergencies. These include the International Chemical Environmental (ICE) initiative and the Ger-man Transport Accident Information and Emergency Response System (TUIS), which is coordinated by BASF. We extended TUIS to Asia in 2010 and introduced a new regional risk matrix that will be implemented from 2011. This sets out the requirements for emergency assistance and accident information for the Asian countries where BASF operates. Including assistance to third par-ties, BASF provided assistance in around 250 cases in 2010.
At the beginning of 2011, a tanker capsized on the Rhine, disrupt-ing shipping on the river for weeks. Taking part in a TUIS opera-tion, BASF’s experts helped to salvage the capsized cargo ship. For more, see basf.com/distribution_safety
Reducing emissionsIt is part of our environmental management to regularly monitor our emissions to air. In addition to measuring greenhouse gas emissions, we also measure emissions of air pollutants. Air pol-lutants include inorganic compounds such as carbon monoxide (CO), sulfur dioxide (SO2), nitrogen oxide, ammonia and other inorganic compounds, dust, heavy metals and volatile organic compounds (NMVOCs).
2020 GoalReduce emissions of air pollutants
– 70%We aim to reduce air pollutants from our chemical plants by 70% compared with 2002.
We will remain committed to our goal of reducing absolute emis-sions, even when the size of our portfolio grows: By 2020, we aim to further reduce air pollutants from our chemical plants by 70%. This target does not include emissions from oil and gas produc-tion as these are subject to substantial fluctuations during explo-ration phases. In 2010, emissions of air pollutants in BASF’s chemical operations worldwide grew slightly to 33,940 metric tons (2009: 31,300 metric tons). Emissions of ozone-depleting substances, as defined by the Montreal Protocol, declined in 2010 thanks to the use of alternative blowing agents to 93 metric tons (2009: 108 metric tons) while emissions of heavy metals totaled 4 metric tons (2009: 4 metric tons).
Distribution safety
Consistent standards for the transportation and storage –of chemical productsMore than – 100 transportation safety advisersAssessment of logistics suppliers –Transport Accident Information and Emergency –Response System (TUIS) extended to Asia
Emissions of air pollutants
Absolute goal for reducing emissions independent –of growth in the product portfolio and greater production volumesEmissions of air pollutants in – 2010 totaled 33,940 metric tons, a reduction of 60.4% since 2002
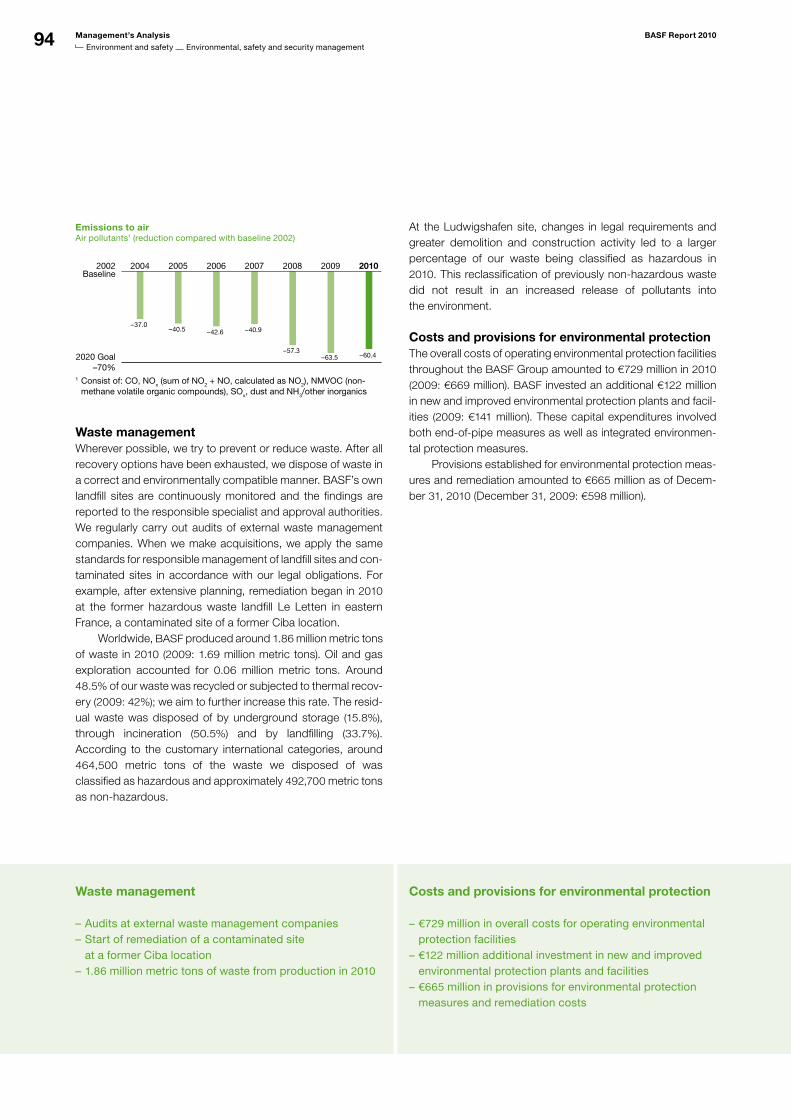
94 Management’s Analysis BASF Report 2010
Environment and safety Environmental, safety and security management
Emissions to air Air pollutants1 (reduction compared with baseline 2002)
2020 Goal–70%
2002Baseline
–37.0–42.6 –40.9
–57.3
–40.5
–63.5 –60.4
20102007 2008 2009200620052004
wird a
ktual
isier
t
1 Consist of: CO, NOx (sum of NO2 + NO, calculated as NO2), NMVOC (nonmethane volatile organic compounds), SOx, dust and NH3/other inorganics
Waste managementWherever possible, we try to prevent or reduce waste. After all recovery options have been exhausted, we dispose of waste in a correct and environmentally compatible manner. BASF’s own landfill sites are continuously monitored and the findings are reported to the responsible specialist and approval authorities. We regularly carry out audits of external waste management companies. When we make acquisitions, we apply the same standards for responsible management of landfill sites and con-taminated sites in accordance with our legal obligations. For example, after extensive planning, remediation began in 2010 at the former hazardous waste landfill Le Letten in eastern France, a contaminated site of a former Ciba location. Worldwide, BASF produced around 1.86 million metric tons of waste in 2010 (2009: 1.69 million metric tons). Oil and gas exploration accounted for 0.06 million metric tons. Around 48.5% of our waste was recycled or subjected to thermal recov-ery (2009: 42%); we aim to further increase this rate. The resid-ual waste was disposed of by underground storage (15.8%), through incineration (50.5%) and by landfilling (33.7%). According to the customary international categories, around 464,500 metric tons of the waste we disposed of was classified as hazardous and approximately 492,700 metric tons as non-hazardous.
At the Ludwigshafen site, changes in legal requirements and greater demolition and construction activity led to a larger percentage of our waste being classified as hazardous in 2010. This reclassification of previously non-hazardous waste did not result in an increased release of pollutants into the environment.
Costs and provisions for environmental protectionThe overall costs of operating environmental protection facilities throughout the BASF Group amounted to €729 million in 2010 (2009: €669 million). BASF invested an additional €122 million in new and improved environmental protection plants and facil-ities (2009: €141 million). These capital expenditures involved both end-of-pipe measures as well as integrated environmen-tal protection measures. Provisions established for environmental protection meas-ures and remediation amounted to €665 million as of Decem-ber 31, 2010 (December 31, 2009: €598 million).
Costs and provisions for environmental protectionWaste management
€729 – million in overall costs for operating environmental protection facilities€122 – million additional investment in new and improved environmental protection plants and facilities€665 – million in provisions for environmental protection measures and remediation costs
Audits at external waste management companies –Start of remediation of a contaminated site –at a former Ciba location1.86 – million metric tons of waste from production in 2010
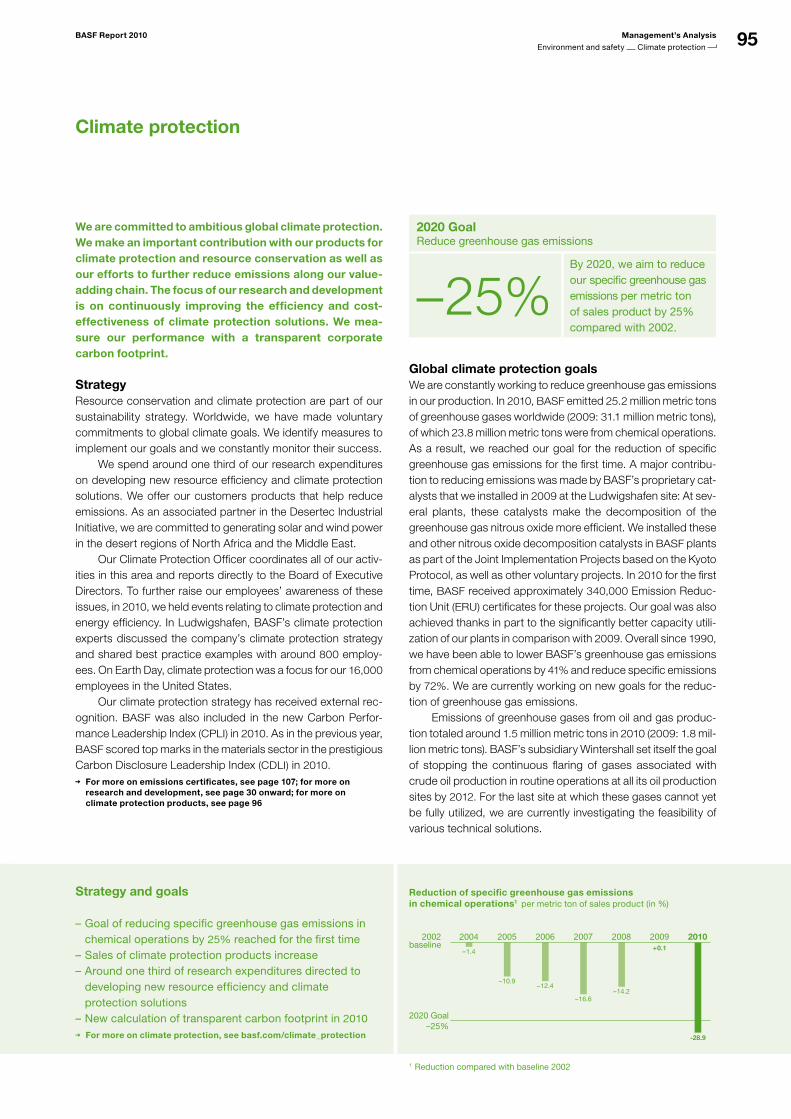
95BASF Report 2010 Management’s Analysis
Environment and safety Climate protection
Climate protection
2020 GoalReduce greenhouse gas emissions
– 25%By 2020, we aim to reduce our specific greenhouse gas emissions per metric ton of sales product by 25% compared with 2002.
Global climate protection goalsWe are constantly working to reduce greenhouse gas emissions in our production. In 2010, BASF emitted 25.2 million metric tons of greenhouse gases worldwide (2009: 31.1 million metric tons), of which 23.8 million metric tons were from chemical operations. As a result, we reached our goal for the reduction of specific greenhouse gas emissions for the first time. A major contribu-tion to reducing emissions was made by BASF’s proprietary cat-alysts that we installed in 2009 at the Ludwigshafen site: At sev-eral plants, these catalysts make the decomposition of the greenhouse gas nitrous oxide more efficient. We installed these and other nitrous oxide decomposition catalysts in BASF plants as part of the Joint Implementation Projects based on the Kyoto Protocol, as well as other voluntary projects. In 2010 for the first time, BASF received approximately 340,000 Emission Reduc-tion Unit (ERU) certificates for these projects. Our goal was also achieved thanks in part to the significantly better capacity utili-zation of our plants in comparison with 2009. Overall since 1990, we have been able to lower BASF’s greenhouse gas emissions from chemical operations by 41% and reduce specific emissions by 72%. We are currently working on new goals for the reduc-tion of greenhouse gas emissions. Emissions of greenhouse gases from oil and gas produc-tion totaled around 1.5 million metric tons in 2010 (2009: 1.8 mil-lion metric tons). BASF’s subsidiary Wintershall set itself the goal of stopping the continuous flaring of gases associated with crude oil production in routine operations at all its oil production sites by 2012. For the last site at which these gases cannot yet be fully utilized, we are currently investigating the feasibility of various technical solutions.
We are committed to ambitious global climate protection. We make an important contribution with our products for climate protection and resource conservation as well as our efforts to further reduce emissions along our value-adding chain. The focus of our research and development is on continuously improving the efficiency and cost- effectiveness of climate protection solutions. We mea-sure our performance with a transparent corporate carbon footprint.
StrategyResource conservation and climate protection are part of our sustainability strategy. Worldwide, we have made voluntary commitments to global climate goals. We identify measures to implement our goals and we constantly monitor their success. We spend around one third of our research expenditures on developing new resource efficiency and climate protection solutions. We offer our customers products that help reduce emissions. As an associated partner in the Desertec Industrial Initiative, we are committed to generating solar and wind power in the desert regions of North Africa and the Middle East. Our Climate Protection Officer coordinates all of our activ-ities in this area and reports directly to the Board of Executive Directors. To further raise our employees’ awareness of these issues, in 2010, we held events relating to climate protection and energy efficiency. In Ludwigshafen, BASF’s climate protection experts discussed the company’s climate protection strategy and shared best practice examples with around 800 employ-ees. On Earth Day, climate protection was a focus for our 16,000 employees in the United States. Our climate protection strategy has received external rec-ognition. BASF was also included in the new Carbon Perfor-mance Leadership Index (CPLI) in 2010. As in the previous year, BASF scored top marks in the materials sector in the prestigious Carbon Disclosure Leadership Index (CDLI) in 2010.
For more on emissions certificates, see page 107; for more on research and development, see page 30 onward; for more on climate protection products, see page 96
Strategy and goals
Goal of reducing specific greenhouse gas emissions in –chemical operations by 25% reached for the first timeSales of climate protection products increase –Around one third of research expenditures directed to –developing new resource efficiency and climate protection solutionsNew calculation of transparent carbon footprint in – 2010
For more on climate protection, see basf.com/climate_protection
20102007 2008 2009200620052004
2020 Goal–25%
2002baseline
Reduction of specific greenhouse gas emissions1
per metric ton of sales (baseline 2002)
+0.1
-28.9
–1.4
–12.4
–16.6–14.2
–10.9
wird a
ktual
isier
t
Reduction of specific greenhouse gas emissions in chemical operations1 per metric ton of sales product (in %)
1 Reduction compared with baseline 2002
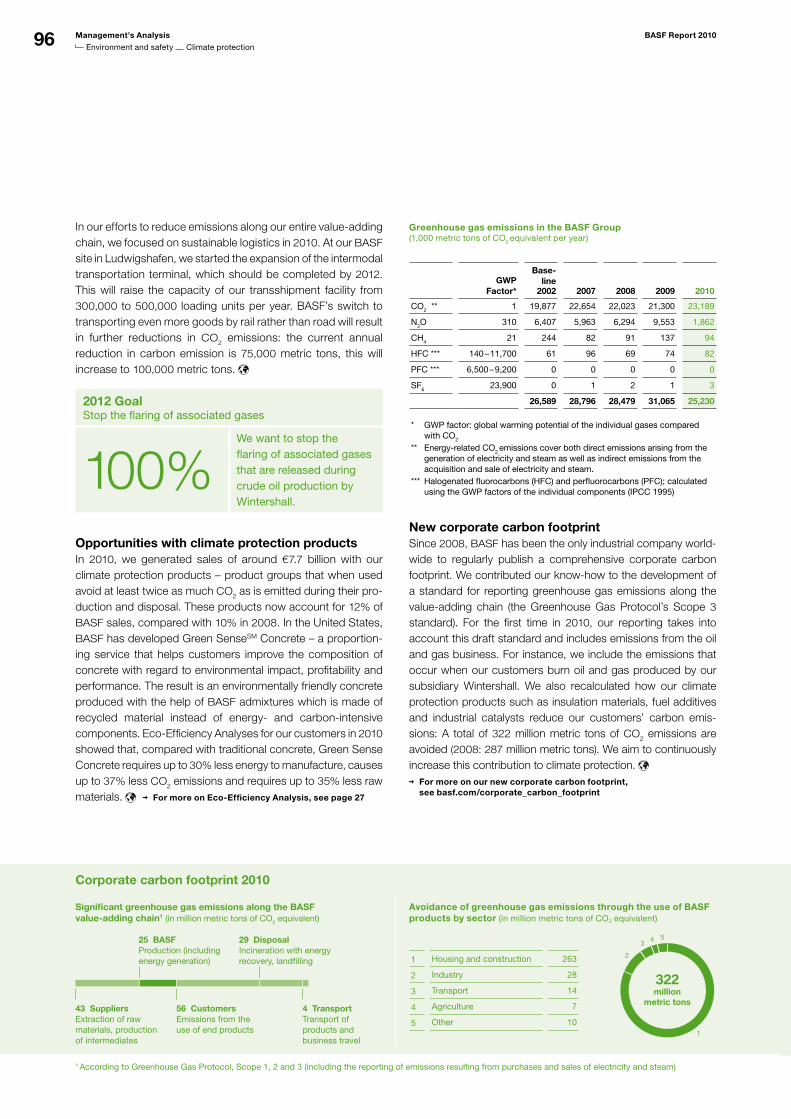
96 Management’s Analysis BASF Report 2010
Environment and safety Climate protection
In our efforts to reduce emissions along our entire value-adding chain, we focused on sustainable logistics in 2010. At our BASF site in Ludwigshafen, we started the expansion of the intermodal transportation terminal, which should be completed by 2012. This will raise the capacity of our transshipment facility from 300,000 to 500,000 loading units per year. BASF’s switch to transporting even more goods by rail rather than road will result in further reductions in CO2 emissions: the current annual reduction in carbon emission is 75,000 metric tons, this will increase to 100,000 metric tons.
2012 GoalStop the flaring of associated gases
100%We want to stop the flaring of associated gases that are released during crude oil production by Wintershall.
Opportunities with climate protection productsIn 2010, we generated sales of around €7.7 billion with our climate protection products – product groups that when used avoid at least twice as much CO2 as is emitted during their pro-duction and disposal. These products now account for 12% of BASF sales, compared with 10% in 2008. In the United States, BASF has developed Green SenseSM Concrete – a proportion-ing service that helps customers improve the composition of concrete with regard to environmental impact, profitability and performance. The result is an environmentally friendly concrete produced with the help of BASF admixtures which is made of recycled material instead of energy- and carbon-intensive components. Eco-Efficiency Analyses for our customers in 2010 showed that, compared with traditional concrete, Green Sense Concrete requires up to 30% less energy to manufacture, causes up to 37% less CO2 emissions and requires up to 35% less raw materials. For more on Eco-Efficiency Analysis, see page 27
Greenhouse gas emissions in the BASF Group (1,000 metric tons of CO2 equivalent per year)
GWP
Factor*
Base-line
2002 2007 2008 2009 2010
CO2 ** 1 19,877 22,654 22,023 21,300 23,189
N2O 310 6,407 5,963 6,294 9,553 1,862
CH4 21 244 82 91 137 94
HFC *** 140 – 11,700 61 96 69 74 82
PFC *** 6,500 – 9,200 0 0 0 0 0
SF6 23,900 0 1 2 1 3
26,589 28,796 28,479 31,065 25,230
* GWP factor: global warming potential of the individual gases compared with CO2
** Energyrelated CO2 emissions cover both direct emissions arising from the generation of electricity and steam as well as indirect emissions from the acquisition and sale of electricity and steam.
*** Halogenated fluorocarbons (HFC) and perfluorocarbons (PFC); calculated using the GWP factors of the individual components (IPCC 1995)
New corporate carbon footprintSince 2008, BASF has been the only industrial company world-wide to regularly publish a comprehensive corporate carbon footprint. We contributed our know-how to the development of a standard for reporting greenhouse gas emissions along the value-adding chain (the Greenhouse Gas Protocol’s Scope 3 standard). For the first time in 2010, our reporting takes into account this draft standard and includes emissions from the oil and gas business. For instance, we include the emissions that occur when our customers burn oil and gas produced by our subsidiary Wintershall. We also recalculated how our climate protection products such as insulation materials, fuel additives and industrial catalysts reduce our customers’ carbon emis-sions: A total of 322 million metric tons of CO2 emissions are avoided (2008: 287 million metric tons). We aim to continuously increase this contribution to climate protection.
For more on our new corporate carbon footprint, see basf.com/corporate_carbon_footprint
Significant greenhouse gas emissions along the BASFvalue-adding chain1 (in million metric tons of CO2 equivalent)
43 SuppliersExtraction of raw materials, production of intermediates
25 BASFProduction (including energy generation)
29 DisposalIncineration with energy recovery, landfilling
56 CustomersEmissions from theuse of end products
4 TransportTransport of products andbusiness travel
Corporate carbon footprint 2010
1 According to Greenhouse Gas Protocol, Scope 1, 2 and 3 (including the reporting of emissions resulting from purchases and sales of electricity and steam)
Avoidance of greenhouse gas emissions through the use of BASF products by sector (in million metric tons of CO2 equivalent)
1 Housing and construction 263
2 Industry 28
3 Transport 14
4 Agriculture 7
5 Other 101
2
34 5
322million
metric tons
wird a
ktual
isier
t
97BASF Report 2010 Management’s Analysis
Environment and safety Energy and raw materials
Energy and raw materials
The conservation of resources is one of our fundamen-tal economic principles. We focus on efficient energy generation technologies, energy-efficient production and comprehensive energy management. We also make products that help conserve resources.
StrategyWe offer our customers products and technologies that help them conserve resources, save energy and make renewable energies more economic in the long run. We focus on the responsible use of raw materials in our own production: As a company in an energy-intensive industry, our success depends on the long-term security of our supplies of energy and raw materials. For us, energy efficiency is the most important means of combining climate protection, resource con-servation and economic benefits. That is why we have started a program to increase our energy efficiency – measured as the volume of sales products produced in relation to the energy required for their production – which includes a global goal for our production processes. We take three approaches to meet-ing our goal: efficient energy generation; savings through our Energy Verbund; and our energy management, which includes all those activities we use to analyze and continue to increase energy efficiency at BASF plants.
For more on products for renewable energies, see pages 65 and 47
For more on energy-efficient products, see page 52
2020 Goal
Increase energy efficiency
+ 25%We want to improve the energy efficiency of our production processes by 25% compared with 2002.
Global goals In 2008, we set ourselves a new goal to increase energy effi-ciency in our chemicals business. In recent years, we have already taken advantage of the greatest potential to increase energy efficiency – for example, by using combined heat and power (CHP) technology. Other individual measures in 2010 also helped us come closer to reaching our goal. In Asia, our energy efficiency measures led to savings of approximately €18 million between 2008 and 2010. Most of the potential savings identi-fied in previous years have thus already been achieved. In North America, energy savings of more than €5 million were achieved through more than 60 individual projects in 2010. The savings in Europe amounted to more than €3 million in 2010, from mea-sures implemented at approximately 40 sites. In 2010, BASF’s energy efficiency rose by 23.7% in relation to the baseline year 2002. This represented an increase of around 8 percentage points compared with 2009, resulting pri-marily from the higher capacity utilization in our plants. Further-more, this also reflects the positive effects of our measures introduced to conserve energy. We also focused more on energy efficiency topics in our Responsible Care Management System in 2010. From 2011, we plan to incorporate energy man-agement into our Responsible Care audit system.
Energy and resource efficiencyTo supply our production sites with energy, we operate highly efficient CHP plants that generate both power and steam. By using CHP technology, we are able to meet more than 70% of BASF’s electricity demand and saved more than 12 million MWh of fossil fuels in 2010, compared to conventional electricity and steam generation. We are examining the use of renewable energy sources. But these will only play a permanent role in our energy mix when they become competitive in terms of costs and supply security. We analyze energy consumption and costs
Strategy Progress toward goals
Products that help customers conserve resources, –save energy and make renewable energies more economic in the long runThreepronged approach: efficient energy production, –savings through the Energy Verbund and successful energy managementQuantitative goal to increase energy efficiency –
Savings of approximately – €18 million between 2008 and 2010 from energy efficiency measures in AsiaEnergy savings of more than – €5 million achieved in North AmericaEnergy efficiency improves by – 23.7% compared with baseline year 2002
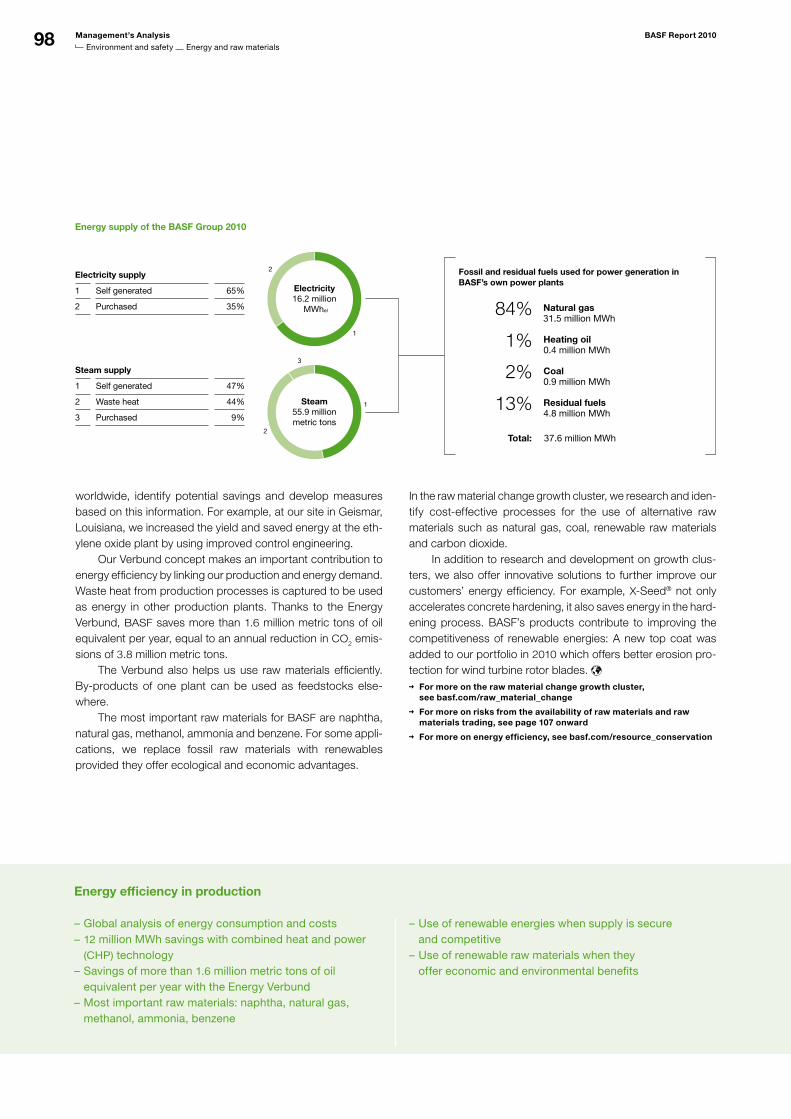
98 Management’s Analysis BASF Report 2010
Environment and safety Energy and raw materials
Energy efficiency in production
Global analysis of energy consumption and costs –12 – million MWh savings with combined heat and power (CHP) technology Savings of more than – 1.6 million metric tons of oil equivalent per year with the Energy VerbundMost important raw materials: naphtha, natural gas, –methanol, ammonia, benzene
Use of renewable energies when supply is secure –and competitiveUse of renewable raw materials when they –offer economic and environmental benefits
worldwide, identify potential savings and develop measures based on this information. For example, at our site in Geismar, Louisiana, we increased the yield and saved energy at the eth-ylene oxide plant by using improved control engineering. Our Verbund concept makes an important contribution to energy efficiency by linking our production and energy demand. Waste heat from production processes is captured to be used as energy in other production plants. Thanks to the Energy Verbund, BASF saves more than 1.6 million metric tons of oil equivalent per year, equal to an annual reduction in CO2 emis-sions of 3.8 million metric tons. The Verbund also helps us use raw materials efficiently. By-products of one plant can be used as feedstocks else-where. The most important raw materials for BASF are naphtha, natural gas, methanol, ammonia and benzene. For some appli-cations, we replace fossil raw materials with renewables provided they offer ecological and economic advantages.
In the raw material change growth cluster, we research and iden-tify cost-effective processes for the use of alternative raw materials such as natural gas, coal, renewable raw materials and carbon dioxide. In addition to research and development on growth clus-ters, we also offer innovative solutions to further improve our customers’ energy efficiency. For example, X-Seed® not only accelerates concrete hardening, it also saves energy in the hard-ening process. BASF’s products contribute to improving the competitiveness of renewable energies: A new top coat was added to our portfolio in 2010 which offers better erosion pro-tection for wind turbine rotor blades.
For more on the raw material change growth cluster, see basf.com/raw_material_change
For more on risks from the availability of raw materials and raw materials trading, see page 107 onward
For more on energy efficiency, see basf.com/resource_conservation
1
2
1
2
3
Electricity supply
1 Self generated 65%
2 Purchased 35%
Steam supply
1 Self generated 47%
2 Waste heat 44%
3 Purchased 9%
Natural gas31.5 million MWh
84%
Heating oil0.4 million MWh
1%
Coal0.9 million MWh
2%
Residual fuels4.8 million MWh
13%
Fossil and residual fuels used for power generation in BASF’s own power plants
Energy supply of the BASF Group 2010
37.6 million MWhTotal:
Steam55.9 millionmetric tons
Electricity16.2 million
MWhel
wird a
ktual
isier
t
wird a
ktual
isier
t
wird a
ktual
isier
t
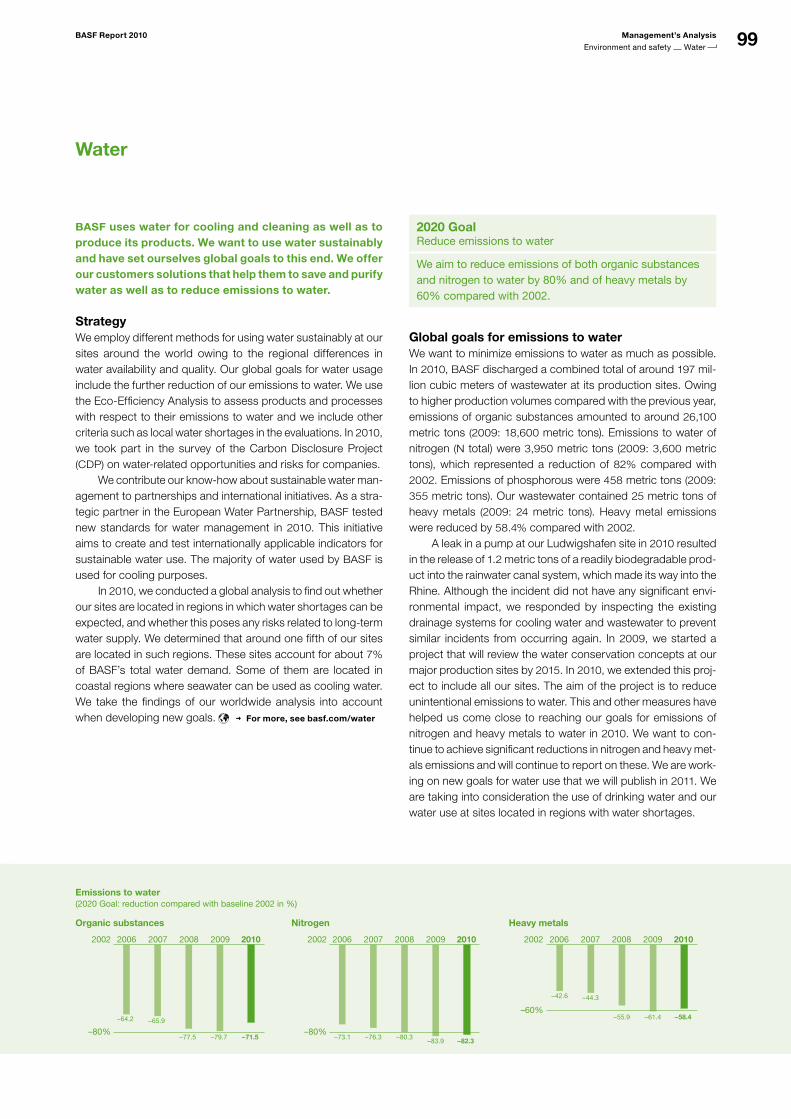
99BASF Report 2010 Management’s Analysis
Environment and safety Water
Emissions to water
(2020 Goal: reduction compared with baseline 2002 in %)
Water
BASF uses water for cooling and cleaning as well as to produce its products. We want to use water sustainably and have set ourselves global goals to this end. We offer our customers solutions that help them to save and purify water as well as to reduce emissions to water.
StrategyWe employ different methods for using water sustainably at our sites around the world owing to the regional differences in water availability and quality. Our global goals for water usage include the further reduction of our emissions to water. We use the Eco-Efficiency Analysis to assess products and processes with respect to their emissions to water and we include other criteria such as local water shortages in the evaluations. In 2010, we took part in the survey of the Carbon Disclosure Project (CDP) on water-related opportunities and risks for companies. We contribute our know-how about sustainable water man-agement to partnerships and international initiatives. As a stra-tegic partner in the European Water Partnership, BASF tested new standards for water management in 2010. This initiative aims to create and test internationally applicable indicators for sustainable water use. The majority of water used by BASF is used for cooling purposes. In 2010, we conducted a global analysis to find out whether our sites are located in regions in which water shortages can be expected, and whether this poses any risks related to long-term water supply. We determined that around one fifth of our sites are located in such regions. These sites account for about 7% of BASF’s total water demand. Some of them are located in coastal regions where seawater can be used as cooling water. We take the findings of our worldwide analysis into account when developing new goals. For more, see basf.com/water
2020 GoalReduce emissions to water
We aim to reduce emissions of both organic substances and nitrogen to water by 80% and of heavy metals by 60% compared with 2002.
Global goals for emissions to water We want to minimize emissions to water as much as possible. In 2010, BASF discharged a combined total of around 197 mil-lion cubic meters of wastewater at its production sites. Owing to higher production volumes compared with the previous year, emissions of organic substances amounted to around 26,100 metric tons (2009: 18,600 metric tons). Emissions to water of nitrogen (N total) were 3,950 metric tons (2009: 3,600 metric tons), which represented a reduction of 82% compared with 2002. Emissions of phosphorous were 458 metric tons (2009: 355 metric tons). Our wastewater contained 25 metric tons of heavy metals (2009: 24 metric tons). Heavy metal emissions were reduced by 58.4% compared with 2002. A leak in a pump at our Ludwigshafen site in 2010 resulted in the release of 1.2 metric tons of a readily biodegradable prod-uct into the rainwater canal system, which made its way into the Rhine. Although the incident did not have any significant envi-ronmental impact, we responded by inspecting the existing drainage systems for cooling water and wastewater to prevent similar incidents from occurring again. In 2009, we started a project that will review the water conservation concepts at our major production sites by 2015. In 2010, we extended this proj-ect to include all our sites. The aim of the project is to reduce unintentional emissions to water. This and other measures have helped us come close to reaching our goals for emissions of nitrogen and heavy metals to water in 2010. We want to con-tinue to achieve significant reductions in nitrogen and heavy met-als emissions and will continue to report on these. We are work-ing on new goals for water use that we will publish in 2011. We are taking into consideration the use of drinking water and our water use at sites located in regions with water shortages.
Organic substances Nitrogen Heavy metals
–64.2
–77.5 –79.7 –71.5–82.3
–58.4–65.9
–76.3 –80.3–83.9
–73.1
–44.3
–55.9 –61.4
–42.6
–80% –80%
–60%
2009 2010200820072006 2009 2010200820072006 2009 201020082007200620022002 2002
wird a
ktual
isier
t
wird a
ktual
isier
t
wird a
ktual
isier
t
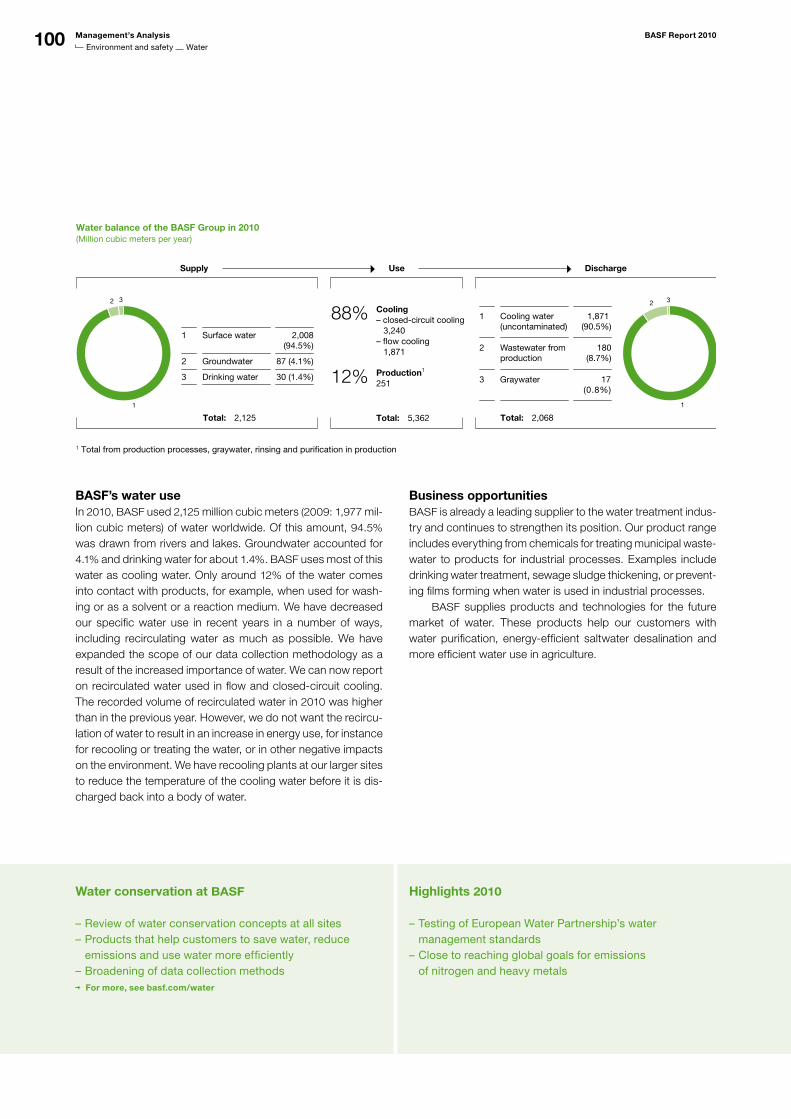
100 Management’s Analysis BASF Report 2010
Environment and safety Water
1
2 3 2 3
1
Use DischargeSupply
Water balance of the BASF Group in 2010(Million cubic meters per year)
1 Total from production processes, graywater, rinsing and purification in production
Production1
251
Cooling– closed-circuit cooling 3,240– flow cooling 1,871
1 Surface water 2,008 (94.5%)
2 Groundwater 87 (4.1%)
3 Drinking water 30 (1.4%)
1 Cooling water 1,871 (uncontaminated) (90.5%)
3 17 (0.8%)
2 Wastewater from 180 production (8.7%)
Total: 5,362Total: 2,125 Total: 2,068
88%
12%
Kühlung– Kreislaufkühlung 3.240– Durchlaufkühlung 1.871
Graywater
wird aktualisiert
wird aktualisiert
wird aktualisiert
Highlights 2010
Testing of European Water Partnership’s water –management standardsClose to reaching global goals for emissions –of nitrogen and heavy metals
Water conservation at BASF
Review of water conservation concepts at all sites –Products that help customers to save water, reduce –emissions and use water more efficientlyBroadening of data collection methods –For more, see basf.com/water
BASF’s water useIn 2010, BASF used 2,125 million cubic meters (2009: 1,977 mil-lion cubic meters) of water worldwide. Of this amount, 94.5% was drawn from rivers and lakes. Groundwater accounted for 4.1% and drinking water for about 1.4%. BASF uses most of this water as cooling water. Only around 12% of the water comes into contact with products, for example, when used for wash-ing or as a solvent or a reaction medium. We have decreased our specific water use in recent years in a number of ways, including recirculating water as much as possible. We have expanded the scope of our data collection methodology as a result of the increased importance of water. We can now report on recirculated water used in flow and closed-circuit cooling. The recorded volume of recirculated water in 2010 was higher than in the previous year. However, we do not want the recircu-lation of water to result in an increase in energy use, for instance for recooling or treating the water, or in other negative impacts on the environment. We have recooling plants at our larger sites to reduce the temperature of the cooling water before it is dis-charged back into a body of water.
Business opportunities BASF is already a leading supplier to the water treatment indus-try and continues to strengthen its position. Our product range includes everything from chemicals for treating municipal waste-water to products for industrial processes. Examples include drinking water treatment, sewage sludge thickening, or prevent-ing films forming when water is used in industrial processes. BASF supplies products and technologies for the future market of water. These products help our customers with water purification, energy-efficient saltwater desalination and more efficient water use in agriculture.
101BASF Report 2010 Management’s Analysis
Environment and safety Product stewardship
Product stewardship
Product stewardship strategy – GPS REACH implementation
Product safety reviewed along the –entire valueadding chainTransparency thanks to database containing –environmental, health and safety information on substances and productsGlobal directives with uniformly high –product safety standards worldwideImplementation of the Global Product Strategy – (GPS)
Successful completion of the first registration stage, –around 600 substances registeredImplementation of second registration phase from – 2011
More than – 10,000 questions from customers and suppliers answeredREACH – not expected to result in major changes to our portfolio
For us, product stewardship does not end at the factory gates. We review the safety of our products along the entire value-adding chain – from our raw materials suppliers to our own production and finally to our cus-tomers’ use of the products. Our highest priority is to ensure that our products pose no risk to people or the environment when they are used responsibly and in the manner intended.
StrategyWe ensure uniformly high standards for product stewardship worldwide which often go beyond legal requirements. These are based on our Group-wide directives on product stewardship, with voluntary commitments and global goals for this area. They apply to all of BASF’s operative decision makers around the world, who are responsible for implementing them. We inform our customers and the public about the properties of our sub-stances with the help of a global database containing constantly updated environmental, health and safety data on our sub-stances and products. Safety data sheets on all our chemical sales products are available in 39 languages. Our global emer-gency hotline network provides information around the clock. If required, we train our customers in the safe use of our products, such as crop protection products. With our global goals for risk assessment, we are also sup-porting the implementation of the Global Product Strategy (GPS) of the International Council of Chemical Associations (ICCA). GPS is establishing global standards and best practices to improve the safe management of chemical substances. In 2010, BASF took a leading role in creating ICCA’s new Chemical Information Search portal. It contains more than 1,600 GPS Safety Summaries, which include relevant information about chemicals and products. For more on auditing of suppliers, see page 26; for more on GPS, see
basf.com/gps_e and page 28
2020 GoalRisk assessment of all products
>99%Risk assessment of all products that we sell in quantities of more than one metric ton per year
Global goalsOur global product stewardship goals go beyond legal require-ments. We will review our risk assessments for all substances we produce or sell worldwide in quantities of more than one metric ton per year. The risk associated with using a substance is the combination of its hazardous properties and the degree of exposure to people and the environment. Further-more, we will review our sales products, including mixtures, in the same way.
REACH and other legal requirementsBASF is implementing the requirements of the European Union’s new chemical regulation REACH and successfully completed the first stage of registration in 2010. Around 600 substances that are produced or imported in quantities over 1,000 metric tons per year were officially registered with the European Chem-icals Agency (ECHA). These included substances from Ciba Holding AG, which was acquired in 2009. From 2011 we will continuously work on implementing the second registration phase. By 2013, all substances produced or imported in quan-tities between 100 and 1,000 metric tons per year will be regis-tered. We still expect that the cost of implementing REACH will average around €50 million per year. We consider it an impor-tant competitive advantage that we have expertise in evaluating substances as well as processes, which we can use to cost- effectively implement these regulations. When it comes to REACH, we are in close contact with our customers and sup-pliers to ensure we will have secure supplies of the raw materi-als we need and to strengthen customer relationships. By 2010, BASF’s REACH experts had answered more than 10,000
102 Management’s Analysis BASF Report 2010
Environment and safety Product stewardship
Use of animal studies New technologies
Ecological and toxicological testing of products –before they are launched on the marketUse of alternative methods whenever possible and –accepted by the authoritiesOwn laboratory for developing alternative methods –
Innovative technologies offer opportunities for –society’s challengesClose dialogue with stakeholders on –nanotechnology since 2004
Amflora: quality assurance processes further improved – For more on nanotechnology, see basf.com/dialogue-nanotechnology
REACH-related questions from customers and suppliers. The decision whether to continue producing a product in the future depends on a multitude of factors, of which REACH is just one. At present, we are not expecting REACH to result in any major changes to our portfolio. As a further contribution to international chemical safety, BASF supports the aim of the Globally Harmonized System of Classification and Labelling of Chemicals (GHS). We are making the related labels and safety data sheets available worldwide. Ecological and toxicological testingBefore launching products on the market, we subject them to a variety of ecological and toxicological testing. We only conduct animal studies with chemical substances when we are obliged to by legal requirements and regulations. The provisions of the REACH regulation will lead to an increase of these legally required animal studies because they demand more informa-tion on the properties of chemical products. We are continu-ously developing alternative and complementary methods that we put into practice whenever it is possible and accepted by the authorities. The finalists for the BASF Innovation Award 2010 included a research team that developed more than 20 alterna-tive methods to animal studies. Since 2009, there has been a laboratory that performs routine toxicological studies for BASF, exclusively using alternative methods. We are now using alternative methods in more than one third of all toxicological testing. Currently 25 alternative methods are being used by BASF and another ten are in a development stage. Since 1987, the annual number of vertebrates used by BASF in animal stud-ies has been reduced by around 60% while the number of fish used has fallen by 80%. For studies where alternative meth-ods cannot be applied or these are not approved by the author-ities, we are constantly working to optimize our tests and obtain better data.
Management of new technologiesInnovative technologies such as nanotechnology or plant bio-technology offer solutions for the key challenges facing our society – for climate protection or in the area of health and nutrition, for example. The same product stewardship standards that apply to all other BASF products are also applied to new technologies. Our management of nanomaterials is described in our Code of Conduct Nanotechnology. The dialogue with our stakehold-ers plays an important role. Since 2004, we have been involved in national and international dialogue forums for nanotechnol-ogy. Furthermore, we are committed to safety research, the find-ings of which are published. Our most recent project is NanoGEM, sponsored by the German Federal Ministry of Edu-cation and Research (BMBF). NanoGEM is investigating the absorption and distribution of nanoparticles in the human body. In the past four years alone, BASF has taken part in approxi-mately 20 projects, collaborations and partnerships. In our plant biotechnology activities, we further improved our internal quality control processes for the genetically modi-fied potato variety Amflora® after identifying small quantities of another genetically modified potato during in-house quality con-trols of Amflora fields in northern Sweden in 2010. We provided the authorities with access to all documents regarding our potato production and worked with them to determine the nec-essary steps. We were able to trace the history of all the pota-toes and thereby find the cause of the problem.
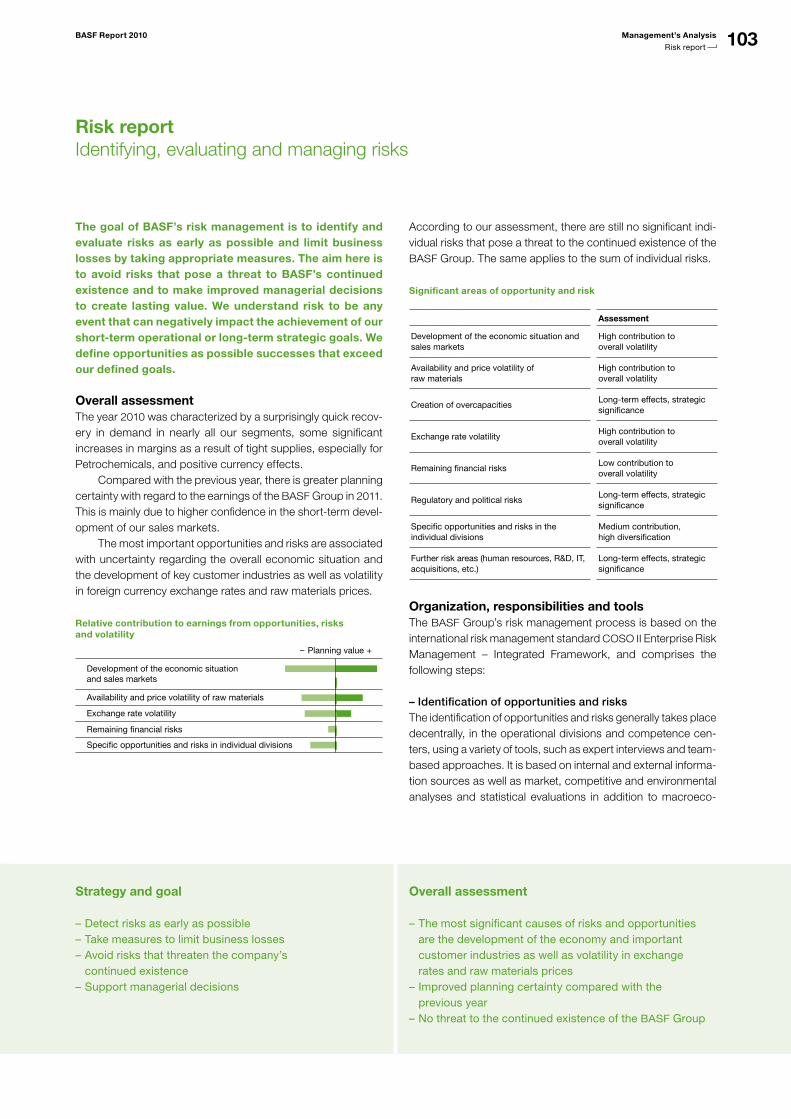
103BASF Report 2010 Management’s Analysis
Risk report
Risk reportIdentifying, evaluating and managing risks
Strategy and goal Overall assessment
Detect risks as early as possible –Take measures to limit business losses –Avoid risks that threaten the company’s –continued existenceSupport managerial decisions –
The most significant causes of risks and opportunities –are the development of the economy and important customer industries as well as volatility in exchange rates and raw materials pricesImproved planning certainty compared with the –previous yearNo threat to the continued existence of the – BASF Group
The goal of BASF’s risk management is to identify and evaluate risks as early as possible and limit business losses by taking appropriate measures. The aim here is to avoid risks that pose a threat to BASF’s continued existence and to make improved managerial decisions to create lasting value. We understand risk to be any event that can negatively impact the achievement of our short-term operational or long-term strategic goals. We define opportunities as possible successes that exceed our defined goals.
Overall assessmentThe year 2010 was characterized by a surprisingly quick recov-ery in demand in nearly all our segments, some significant increases in margins as a result of tight supplies, especially for Petrochemicals, and positive currency effects. Compared with the previous year, there is greater planning certainty with regard to the earnings of the BASF Group in 2011. This is mainly due to higher confidence in the short-term devel-opment of our sales markets. The most important opportunities and risks are associated with uncertainty regarding the overall economic situation and the development of key customer industries as well as volatility in foreign currency exchange rates and raw materials prices.
Relative contribution to earnings from opportunities, risks and volatility
Availability and price volatility of raw materials
Development of the economic situation and sales markets
Exchange rate volatility
Remaining financial risks
Specific opportunities and risks in individual divisions
Planning value– +
According to our assessment, there are still no significant indi-vidual risks that pose a threat to the continued existence of the BASF Group. The same applies to the sum of individual risks.
Significant areas of opportunity and risk
Assessment
Development of the economic situation and sales markets
High contribution to overall volatility
Availability and price volatility of raw materials
High contribution to overall volatility
Creation of overcapacitiesLongterm effects, strategic significance
Exchange rate volatilityHigh contribution to overall volatility
Remaining financial risksLow contribution to overall volatility
Regulatory and political risksLongterm effects, strategic significance
Specific opportunities and risks in the individual divisions
Medium contribution, high diversification
Further risk areas (human resources, R&D, IT, acquisitions, etc.)
Longterm effects, strategic significance
Organization, responsibilities and toolsThe BASF Group’s risk management process is based on the international risk management standard COSO II Enterprise Risk Management – Integrated Framework, and comprises the following steps:
– Identification of opportunities and risksThe identification of opportunities and risks generally takes place decentrally, in the operational divisions and competence cen-ters, using a variety of tools, such as expert interviews and team-based approaches. It is based on internal and external informa-tion sources as well as market, competitive and environmental analyses and statistical evaluations in addition to macroeco-
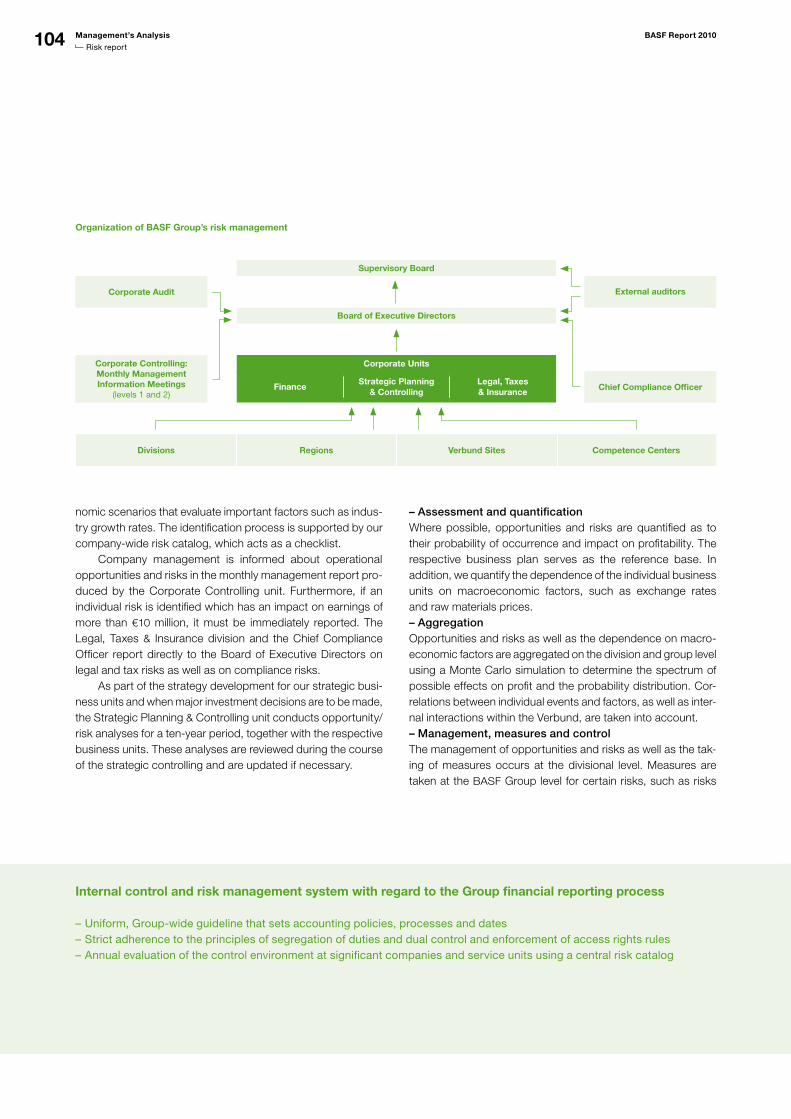
104 Management’s Analysis BASF Report 2010
Risk report
Internal control and risk management system with regard to the Group financial reporting process
Uniform, Groupwide guideline that sets accounting policies, processes and dates –Strict adherence to the principles of segregation of duties and dual control and enforcement of access rights rules –Annual evaluation of the control environment at significant companies and service units using a central risk catalog –
nomic scenarios that evaluate important factors such as indus-try growth rates. The identification process is supported by our company-wide risk catalog, which acts as a checklist. Company management is informed about operational opportunities and risks in the monthly management report pro-duced by the Corporate Controlling unit. Furthermore, if an individual risk is identified which has an impact on earnings of more than €10 million, it must be immediately reported. The Legal, Taxes & Insurance division and the Chief Compliance Officer report directly to the Board of Executive Directors on legal and tax risks as well as on compliance risks. As part of the strategy development for our strategic busi-ness units and when major investment decisions are to be made, the Strategic Planning & Controlling unit conducts opportunity/risk analyses for a ten-year period, together with the respective business units. These analyses are reviewed during the course of the strategic controlling and are updated if necessary.
– Assessment and quantificationWhere possible, opportunities and risks are quantified as to their probability of occurrence and impact on profitability. The respective business plan serves as the reference base. In addition, we quantify the dependence of the individual business units on macroeconomic factors, such as exchange rates and raw materials prices.– AggregationOpportunities and risks as well as the dependence on macro-economic factors are aggregated on the division and group level using a Monte Carlo simulation to determine the spectrum of possible effects on profit and the probability distribution. Cor-relations between individual events and factors, as well as inter-nal interactions within the Verbund, are taken into account.– Management, measures and controlThe management of opportunities and risks as well as the tak-ing of measures occurs at the divisional level. Measures are taken at the BASF Group level for certain risks, such as risks
Supervisory Board
Board of Executive Directors
Chief Compliance Officer
External auditorsCorporate Audit
Divisions Competence CentersVerbund SitesRegions
Corporate Units
FinanceStrategic Planning
& Controlling
Organization of BASF Group’s risk management
Legal, Taxes & Insurance
Corporate Controlling:Monthly Management Information Meetings
(levels 1 and 2)
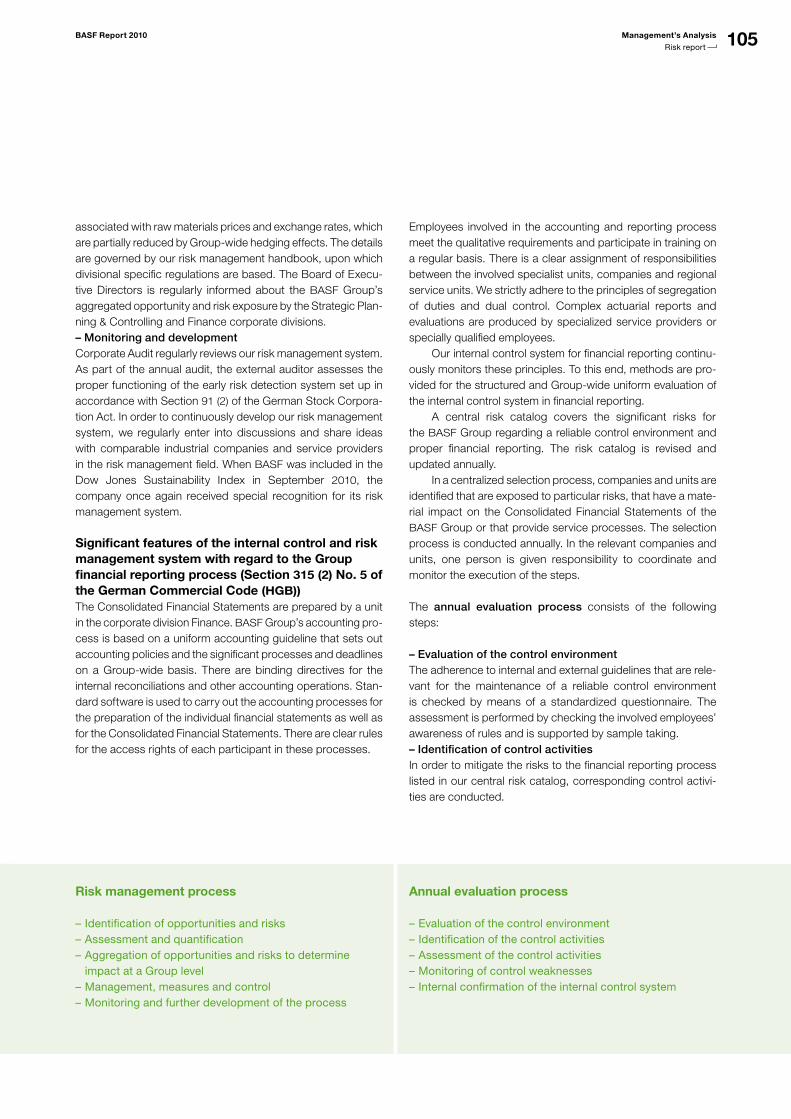
105BASF Report 2010 Management’s Analysis
Risk report
Identification of opportunities and risks –Assessment and quantification –Aggregation of opportunities and risks to determine – impact at a Group levelManagement, measures and control –Monitoring and further development of the process –
associated with raw materials prices and exchange rates, which are partially reduced by Group-wide hedging effects. The details are governed by our risk management handbook, upon which divisional specific regulations are based. The Board of Execu-tive Directors is regularly informed about the BASF Group’s aggregated opportunity and risk exposure by the Strategic Plan-ning & Controlling and Finance corporate divisions. – Monitoring and developmentCorporate Audit regularly reviews our risk management system. As part of the annual audit, the external auditor assesses the proper functioning of the early risk detection system set up in accordance with Section 91 (2) of the German Stock Corpora-tion Act. In order to continuously develop our risk management system, we regularly enter into discussions and share ideas with comparable industrial companies and service providers in the risk management field. When BASF was included in the Dow Jones Sustainability Index in September 2010, the company once again received special recognition for its risk management system.
Significant features of the internal control and risk management system with regard to the Group financial reporting process (Section 315 (2) No. 5 of the German Commercial Code (HGB))The Consolidated Financial Statements are prepared by a unit in the corporate division Finance. BASF Group’s accounting pro-cess is based on a uniform accounting guideline that sets out accounting policies and the significant processes and deadlines on a Group-wide basis. There are binding directives for the internal reconciliations and other accounting operations. Stan-dard software is used to carry out the accounting processes for the preparation of the individual financial statements as well as for the Consolidated Financial Statements. There are clear rules for the access rights of each participant in these processes.
Employees involved in the accounting and reporting process meet the qualitative requirements and participate in training on a regular basis. There is a clear assignment of responsibilities between the involved specialist units, companies and regional service units. We strictly adhere to the principles of segregation of duties and dual control. Complex actuarial reports and evaluations are produced by specialized service providers or specially qualified employees. Our internal control system for financial reporting continu-ously monitors these principles. To this end, methods are pro-vided for the structured and Group-wide uniform evaluation of the internal control system in financial reporting. A central risk catalog covers the significant risks for the BASF Group regarding a reliable control environment and proper financial reporting. The risk catalog is revised and updated annually. In a centralized selection process, companies and units are identified that are exposed to particular risks, that have a mate-rial impact on the Consolidated Financial Statements of the BASF Group or that provide service processes. The selection process is conducted annually. In the relevant companies and units, one person is given responsibility to coordinate and monitor the execution of the steps.
The annual evaluation process consists of the following steps:
– Evaluation of the control environmentThe adherence to internal and external guidelines that are rele-vant for the maintenance of a reliable control environment is checked by means of a standardized questionnaire. The assessment is performed by checking the involved employees’ awareness of rules and is supported by sample taking.– Identification of control activitiesIn order to mitigate the risks to the financial reporting process listed in our central risk catalog, corresponding control activi-ties are conducted.
Risk management process Annual evaluation process
Evaluation of the control environment –Identification of the control activities –Assessment of the control activities –Monitoring of control weaknesses –Internal confirmation of the internal control system –
106 Management’s Analysis BASF Report 2010
Risk report
– Assessment of the control activitiesAfter documentation, a test is performed to verify whether the described controls are capable of adequately mitigating the risks. In the subsequent test phase, samples are taken to test whether the controls were effective in practice.– Monitoring of control weaknessesThe responsible managers receive reports on any control weak-nesses and their resolution, and an interdisciplinary committee investigates their relevance for the BASF Group. The Board of Executive Directors is informed once control weaknesses have been identified that have a considerable impact on the financial reporting.– Internal confirmation of the internal control systemThe responsible managing director and chief financial officer for each consolidated Group company confirm to the Board of Executive Directors of BASF SE at the end of the annual cycle the effectiveness of the internal control system over accounting as well as the reliability of financial reporting.
Economic and sector-specific opportunities and risksDevelopment of demand: The development of demand in our sales markets represents one of the three most important sources of opportunities and risks, in addition to the volatility in currency exchange rates and raw materials prices. Our assump-tions regarding short-term growth rates for the global economy, regions and key customer industries (in particular the chemi-cals, automotive and construction sectors) can be found in the Forecast section. In addition to this baseline scenario, we also consider risk scenarios such as another recession in North America or a sig-nificant decrease in growth in China. This could lead to a decline in global demand, a devaluation of the U.S. dollar and a drop in the price of crude oil, which together would have a negative impact on our income from operations.
Some of our customers are still very dependent on credit. If credit were to become less accessible and our customers were therefore unable to refinance their businesses, this could also have a negative impact on our business in the short-term. Inversely, we also have the possibility to take advantage of increased demand as far as our existing production capaci-ties allow. Overall, there is less uncertainty than one year ago regard-ing the development of the world economy.
For more on the outlook, see our Forecast from page 115 onward
Development of supply: In the chemical industry, 2010 was characterized by unscheduled plant shutdowns and project delays, also at our competitors, which resulted in supply bottle-necks. In 2011, we anticipate that new petrochemical produc-tion facilities will be completed, particularly in the Middle East and China, which will lead to better product supply. Our planning takes into consideration the related declines in capacity utilization and prices as well as less opportunity to pass on higher raw materials prices to our customers. In this respect, there is a risk that our assumptions could turn out still to be too high. However, if the product shortages existing in some value-adding chains at the end of 2010 continue, this would offer the opportunity to keep the respective margins sta-ble or to improve them. Where possible, risks related to the development of sales markets are mitigated using operational measures, for example, through close cooperation with customers, optimized produc-tion management and appropriate scheduling of maintenance shutdowns. We manage the construction and expansion of plants and sites for each product based on expected demand. Having customers from various regions and industries also reduces our risk. We are pursuing our goal of making our business less cyclical. We are exiting markets in which we do not see satis-factory opportunities to differentiate ourselves from our com-petitors in the long term.
Development of supply
Growing global product supply expected due to comple –tion of new plants in the Middle East and China; increased risks regarding capacity utilization, prices and margins Longterm goal to make our business less cyclical –Demanddriven, productspecific plant expansion –and constructionDivestitures of businesses that do not provide sufficient –opportunity for differentiation from our competitors
Development of demand
Decrease in uncertainty regarding the development of –the economy Ongoing refinancing risks for our customers, with short –term sales risks for our businessTaking advantage of opportunities arising from higher – demand as far as our production capacities allow
107BASF Report 2010 Management’s Analysis
Risk report
Regulatory and political risks
REACH: – competitive disadvantage for European companies due to costintensive testing and registration proceduresEmissions trading: risk of undersupply and additional –costs due to need to purchase certificatesIntensification of geopolitical tensions and erection of –trade barriers
Availability and price volatility of raw materials
In order to achieve lasting profitable growth, we are committed to operational excellence, innovation and investment in growth markets. We concentrate our research and business on inno-vative business areas, such as crop protection and plant bio-technology, which we also develop through strategic partner-ships with important partners.
Regulatory and political risks: Due to the European chemi-cals directive REACH, which came into force in 2007, BASF and our European customers face the risk of being placed at a dis-advantage to our non-European competitors due to the cost-intensive test and registration procedures. Within the framework of E.U. emissions trading, the BASF Group was allocated emission certificates for the second trad-ing period from 2008 to 2012. We do not currently expect any undersupply of certificates for our activities in Europe in this sec-ond trading period. It is still unclear how many CO2 certificates will be allocated free-of-charge from 2013. BASF will likely be required to purchase several million additional certificates annually. Depending on the trading prices for CO2 certificates, this will affect our cost position and therefore the global com-petitiveness of our German and European sites. This also applies to the most recent increase in the elec-tricity tax and the German government’s plans to limit the exemptions for energy-intensive industries from paying levies under the Renewable Energy Sources Act (EEG).
Due to the amendment of the E.U. directive on industrial emissions (IED), additional costs could arise for the conversion of existing plants and to meet additional reporting obligations. Other risks for us include further regulation, for example, for the use of chemicals or in the gas business as well as the intensification of geopolitical tensions, the destabilization of political systems and the erection of trade barriers (for example, Chinese restrictions on exports of rare earths or OPEC quotas for oil production).
Overall, the probability that regulatory and political risks will occur has increased; the financial impact can be classified as low in the short term and elevated in the medium term.
Weather: Colder or warmer winter weather can result in fluctu-ations in gas consumption, which can have positive or negative effects on the performance of our gas trading business. Simi-larly, growing seasons that are wet and warm or dry and cold can have positive or negative effects on the performance of our crop protection business.
Company-specific opportunities and risksAvailability of raw materials: As a result of the unexpectedly rapid economic recovery, there were some cases of procure-ment bottlenecks in 2010. We are not expecting any significant bottlenecks of this type in 2011. But with the considerable rise in demand, also in the medium term, the structural shortage of some raw materials is increasingly relevant for the segments Performance Products and Functional Solutions. In addition, China has limited the export of rare earths, which are used in the production of our catalysts, for example. There continues to be a risk of non-performance among some of our suppliers owing to their weak financial situation. We minimize procurement risks through our broad port-folio, our global purchasing activities and the purchase of addi-tional quantities of raw materials on spot markets. If possible, we avoid procuring raw materials from a single supplier. When this cannot be avoided, we try to foster competition or we know-ingly enter into this relationship and assess the consequences of potential non-delivery. We continuously monitor the credit risk of important business partners, both customers as well as sup-pliers. We adopt a similar approach regarding the purchasing of services.
Economic upturn increases risks related to –raw materials availabilityProcurement risks minimized by a broad portfolio, global –purchasing activities and careful selection of suppliersContinued high volatility in raw materials prices expected –Use of commodity derivatives to minimize cost risks –
108 Management’s Analysis BASF Report 2010
Risk report
In addition to economic criteria, both new and existing suppli-ers are evaluated on the basis of environmental protection, occupational safety and social standards. If we establish that our standards are only being partially or not met, we agree on corrective measures and provide help with imple-menting these.
For more on supply chain management, see page 26
Raw material price volatility: The volatility of prices for feed-stocks, especially oil-based chemicals, and for energy is one of the three main drivers of opportunity and risk at BASF. We con-tinue to assume that the volatility of raw materials prices, at least in the short term, will be above the historical level. Our depen-dence on the oil price is reduced through the contribution of our Oil & Gas business. Earnings in this business rise by around €35 million for every $1 increase in the average annual barrel price of Brent crude. Furthermore, we minimize cost risks by using commodity derivatives. These measures help to secure margins when sharply rising raw materials prices are expected, which in times of low demand cannot be passed on via product prices, or only to a limited extent. This could lead to expenses if prices do not move as expected.
Research and development: Due to the high degree of com-plexity and uncertainty involved in chemical and biological research, there is a risk that projects might be discontinued for technical or economic reasons, budgets may be exceeded or developed products will not receive regulatory approval for sale or will not achieve the expected commercial success. Our global Know-how Verbund, our collaboration with part-ners and customers as well as our innovation process reduce this risk. Within our project management framework, we con-tinuously review the efficiency, chances of success and the underlying assumptions of research projects; this review includes all phases from idea generation to product launch. The trust of customers and consumers is essential for the success-
ful introduction of new technologies. That is why we enter into dialogue with stakeholders at an early stage of development.
For more on the stakeholder dialogue, see page 27
Exploration: Geological uncertainties can result in varying degrees of success in the search for and development of oil and natural gas reserves. We lessen such risks by using state-of-the-art exploration methods and having a balanced exploration portfolio.
Personnel: Particularly in Germany, flexible working time mod-els including short-time work were an effective way of avoiding redundancies during the economic crisis. These also allowed us to take advantage of the opportunities offered by the rapid economic recovery in 2010. The new agreement between BASF SE management and employee representatives at our largest site in Ludwigshafen comprises a package of measures, which also include increased flexibility in allocating personnel resources; this offers opportunities to manage fluctuating capacity utilization. Our senior executives have the opportunity to participate in a stock-price based compensation program. The need for related provisions varies according to the development of the BASF share price and leads to a corresponding increase or decrease in personnel costs. The continued improvement in the economic environment in 2010 led to an increase in global competition for highly- qualified employees and managers; in the medium to long term, this will be further intensified by demographic change. This increases the risk that job vacancies cannot be filled with suit-able applicants, or only with a significant delay. In Europe, this affects the engineering and scientific professions in particular; a decline in the number of suitable applicants is already notice-able. In this field, and among business graduates as well, we are facing the challenge of positioning BASF as an employer of choice worldwide.
Personnel
Intensified global competition for highlyqualified –specialist and management candidatesDanger of loss of expertise through numerous retirements –and undesired turnoverMore effective personnel recruitment and retention with –the help of various measures
Research and development risks
Risk that activities do not lead to the development of – marketable products and therefore are not commercially successfulReduction of risks through Knowhow Verbund as well as –continuous review of the efficiency, chances of success and operating environment of research projectsOngoing dialogue with customers and consumers to – improve chances of success
109BASF Report 2010 Management’s Analysis
Risk report
Sustainability
Voluntary commitment to environmental protection –and socially responsible conductAdherence to standards assured by monitoring systems –Global management system for early recognition of –important issuesOngoing dialogue with stakeholders –
Legal risks
The loss of expertise due to the high number of retirements in North America and Europe and the comparatively high level of undesired turnover in Asia may have negative effects on busi-ness in the medium to long term. With our global programs Generations@Work and Diversity + Inclusion, the further development of our employer brand and an emphasis on personnel development as well as additional regional initiatives, we want to make BASF an attractive employer and retain our employees in the long term.
For more on the individual initiatives and our goals, see page 84 onward
Overall, we currently rate the risk of a negative impact on our business due to the loss of managers and employees as low. However, we expect this risk to increase in the medium to long term, and are already working to counter these developments using the above-mentioned methods as well as increased investment in human resources marketing and personnel development.
Sustainability: BASF is committed to integrating environmen-tal protection and socially responsible conduct into its business activities. Contraventions to our voluntary commitment to sus-tainability or to laws represent a reputational risk and could lead to operational or strategic risks. We have set up a global issue management system for sustainability to enable us to promptly recognize risks and opportunities related to sustainability. The results are then used to initiate change processes in the com-pany in order to be prepared for any risks and to exploit oppor-tunities accordingly. We have established global monitoring sys-tems to enable us to ensure the adherence to laws and our voluntary commitments in the areas of environment, health and safety as well as to labor and social standards. These systems include our entire supply chain. In order to assure society’s acceptance of our business activities, we remain in continuous dialogue with relevant stakeholders.
For more on monitoring tools, see page 120 onward
Information technology: Risks are caused primarily by the non-availability of IT systems and applications, delayed provision of important data, loss or manipulation of data and the disclosure of confidential information. This can have negative conse-quences for the respective business processes. To minimize such risks, BASF has stable and redundantly designed IT systems, back-up processes, virus and access pro-tection and encoding systems as well as integrated, Group-wide-standardized IT infrastructures and applications. The sys-tems used for information security are continuously tested and updated. In addition, our employees receive regular training on information and data protection. IT-related risk management is conducted using Group-wide regulations for organization and application, as well as an internal control system based on this. Due to the measures taken, we regard the probability of a risk to our IT system as limited. However, the potential impacts would be high.
Legal risks: In order to assess the risks from current legal dis-putes and proceedings and any requirement to recognize pro-visions, we prepare our own analysis and assessment of the cir-cumstances and claims considered. In addition, in individual cases, we consider the results of comparable proceedings and independent legal opinions. Furthermore, assumptions are made regarding the probability of claims being successful and their potential financial impact. The actual costs can deviate from these estimates. We limit risks from potential wrongdoing or legal infringements by using an internal control system. For example, we try to avoid patent and licensing disputes whenever possi-ble with the help of extensive clearance research. As part of our Group-wide compliance program, our employees receive regular training.
For more on our Group-wide compliance program, see page 19 and page 119 onward
Avoidance of legal risks with the help –of an internal control systemEstimate of monetary effects from legal disputes –and proceedings as realistic as possibleRegular employee training as part of Groupwide –compliance program
110 Management’s Analysis BASF Report 2010
Risk report
Acquisition risks: Implementing acquisition and investment decisions involves complex risks. The evaluation of risks and opportunities already plays a significant role during the assess-ment of potential acquisition targets. A detailed analysis and quantification are conducted as part of due diligence. Examples of risks are: increased staff turnover, delayed realization of syn-ergies or the assumption of obligations that were not exactly quantifiable in advance. Therefore implementation and follow-up assessments take place along defined processes. By nature, the acquired businesses are subject to general market risks and business-specific risks. For this reason, acquired businesses are promptly incorporated into BASF’s risk management pro-cess. The recently acquired Cognis business is currently being integrated into our risk management process. Based on the measures taken, we classify the risk of damages as low and the potential of an impact on earnings as medium.
Technical risks: In addition to risks related to raw materials availability, there is the risk that unscheduled shutdowns of our plants will be required for safety reasons or due to techni-cal problems, which could result in delivery bottlenecks for our products. For example, as a precaution we shut down plants at our sites on the U.S. Gulf Coast in the event of hurricane warnings. We minimize technical risks through continuous monitor-ing and improvement of facilities and processes as well as through our global production Verbund; therefore we consider the probability of occurrence and impact to be low.
Financial risksThe management of currency and interest rate risks is con-ducted in the Treasury unit. The management of commodity price risks takes place in the Global Procurement & Logistics competence center or in the appropriately authorized Group companies. Detailed guidelines and procedures exist for deal-ing with financial risks. Among other things, they provide for the segregation of trading and back office functions.
Exchange rate volatility: Our competitiveness on global mar-kets is influenced by fluctuations in exchange rates. For the BASF Group, this generates sales market risks in particular when the U.S. dollar exchange rate fluctuates. A full-year rise in the value of the U.S. dollar/euro exchange rate by $0.01 would re-sult in an increase of €40 million in BASF’s earnings, assuming other conditions remain the same. On the production side, we mitigate foreign currency risks by having local production sites in the respective currency zones. Financial foreign currency risks result from the transla-tion of receivables, liabilities and other monetary items in terms of IAS 21 at the closing rate into the functional currency of the respective Group company. In addition, we incorporate planned purchase and sales transactions in foreign currencies in our financial foreign cur-rency risk management. These risks are hedged using deriva-tive instruments, if required. Exchange rate volatility is one of the top three driving forces for opportunities and risks within the BASF Group.
Interest rate risks: Interest rate risks result from potential changes in prevailing market interest rates, which can cause a change in the present value of fixed-rate instruments, and changes in the interest payments of variable-rate instruments. To hedge these risks, interest rate swaps and combined inter-est rate and currency derivatives are used in individual cases.
Exchange rate volatility
Exchange rate volatility a significant risk factor; salesside –opportunities and risks in particular from U.S. dollar exchange rate fluctuationsProductionrelated foreign currency risks limited by – having local sitesForeign currency denominated receivables and liabilities –as well as planned foreign currency transactions hedged with derivatives
Financial risks
Exchange rate volatility –Interest rate risks –Risks from metal and raw materials trading –Liquidity risks –Risk of default on receivables –Impairment risks –Risks from pension obligations –
111
Liquidity risks
Recognition of risks from cash flow fluctuations by means –of liquidity planningGood ratings, economic and reliable commercial paper –program as well as committed credit lines ensure access to liquid funds at any time
BASF Report 2010 Management’s Analysis
Risk report
In addition, if our credit ratings were to be downgraded by credit rating agencies, this could lead to increased refinancing costs. In the short to medium term, BASF is largely protected from the possible effects on the interest result thanks to the well-balanced maturity profile of its financial debt.
For more on the maturity profile, see Notes to the Consolidated Financial Statements on page 181
Risks from metal and raw materials trading: In the catalysts business, BASF employs commodity derivatives for precious metals and trades precious metals on behalf of third parties and on its own account. In addition, we use our knowledge of the markets for crude oil and oil products to generate earnings from the trade of raw materials within predetermined limits. These activities are subject to constant monitoring.
Liquidity risks: Risks from cash flow fluctuations are recog-nized in a timely manner as part of our liquidity planning. We sig-nificantly reduced the risks of refinancing in 2009 by issuing medium and long-term bonds. We have access to comprehen-sive liquid funds at any time thanks to our good ratings, the com-mercial paper program and committed bank credit lines. The commercial paper program constituted a reliable and economic source of liquidity for BASF, even during the financial crisis. We therefore rate our liquidity risks as low.
For more on financial risks, see the Notes to the Consolidated Finan-cial Statements from page 187 onward
Risk of default on receivables: We limit country-specific risks by internally determining country ratings, which are continuously updated to reflect changing environment conditions. We use export credit insurance and investment guarantees as the main tools to limit specific country-related risks. We lower credit risks for our financial investments by engaging in transactions only with business partners and banks with good credit ratings and
by adhering to fixed limits. Monetary transactions are also conducted through such banks. We continuously check the creditworthiness of our partner banks. We reduce the risk of default on receivables by continuously monitoring the credit-worthiness and payment behavior of our customers and by setting appropriate credit limits. Thanks to the worldwide activities and diversified customer structure of the BASF Group, there is no large concentration of credit default risk. Risks are also limited through the use of credit insurance and bank guarantees.
Impairment risks: The risk of an asset impairment occurs if the assumed interest rate in an impairment test increases or the forecast cash flows decline. In the current business environ-ment, we consider the risk of impairment of individual assets such as customer relationships, technologies and brands, as well as goodwill, to be low.
Risks from pension obligations: We predominantly finance company pension obligations externally through separate plan assets. In addition to the large pension plans of our Group com-panies in North America, the United Kingdom and Switzerland, this applies particularly to BASF Pensionskasse VVaG and the BASF Pensionstreuhand e.V. in Germany. To address the risk of underfunding due to market volatility of plan assets, we align the investment strategy in terms of return and risk optimization to the structure of the pension obligations. Stress scenarios are simulated regularly by means of portfolio analyses. Further-more, new employees are almost always offered defined contribution plans.
Risks of default on receivables
Export credit insurance and investment guarantees to –hedge countryrelated risksReduction of credit risks through credit checks and –transaction limitsUse of credit insurance and bank guarantees –No concentration of risk of default on receivables at any –individual business partner
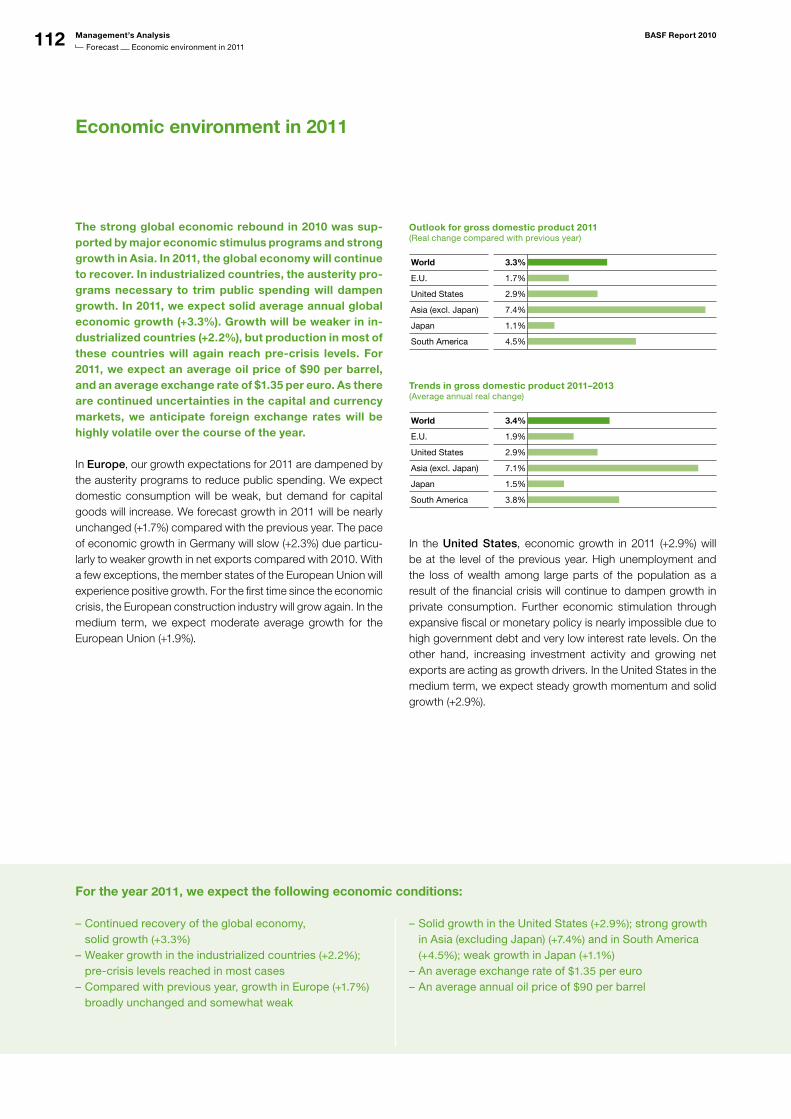
112 Management’s Analysis BASF Report 2010
Forecast Economic environment in 2011
Economic environment in 2011
The strong global economic rebound in 2010 was sup-ported by major economic stimulus programs and strong growth in Asia. In 2011, the global economy will continue to recover. In industrialized countries, the austerity pro-grams necessary to trim public spending will dampen growth. In 2011, we expect solid average annual global economic growth (+3.3%). Growth will be weaker in in-dustrialized countries (+2.2%), but production in most of these countries will again reach pre-crisis levels. For 2011, we expect an average oil price of $90 per barrel, and an average exchange rate of $1.35 per euro. As there are continued uncertainties in the capital and currency markets, we anticipate foreign exchange rates will be highly volatile over the course of the year.
In Europe, our growth expectations for 2011 are dampened by the austerity programs to reduce public spending. We expect domestic consumption will be weak, but demand for capital goods will increase. We forecast growth in 2011 will be nearly unchanged (+1.7%) compared with the previous year. The pace of economic growth in Germany will slow (+2.3%) due particu-larly to weaker growth in net exports compared with 2010. With a few exceptions, the member states of the European Union will experience positive growth. For the first time since the economic crisis, the European construction industry will grow again. In the medium term, we expect moderate average growth for the European Union (+1.9%).
Outlook for gross domestic product 2011 (Real change compared with previous year)
World 3.3%
E.U. 1.7%
United States 2.9%
Asia (excl. Japan) 7.4%
Japan 1.1%
South America 4.5%
Trends in gross domestic product 2011–2013 (Average annual real change)
World 3.4%
wird a
ktual
isier
t
E.U. 1.9%
United States 2.9%
Asia (excl. Japan) 7.1%
Japan 1.5%
South America 3.8%
In the United States, economic growth in 2011 (+2.9%) will be at the level of the previous year. High unemployment and the loss of wealth among large parts of the population as a result of the financial crisis will continue to dampen growth in private consumption. Further economic stimulation through expansive fiscal or monetary policy is nearly impossible due to high government debt and very low interest rate levels. On the other hand, increasing investment activity and growing net exports are acting as growth drivers. In the United States in the medium term, we expect steady growth momentum and solid growth (+2.9%).
For the year 2011, we expect the following economic conditions:
Continued recovery of the global economy, –solid growth (+3.3%)
Weaker growth in the industrialized countries – (+2.2%); precrisis levels reached in most casesCompared with previous year, growth in Europe – (+1.7%) broadly unchanged and somewhat weak
Solid growth in the United States – (+2.9%); strong growth in Asia (excluding Japan) (+7.4%) and in South America (+4.5%); weak growth in Japan (+1.1%)
An average exchange rate of – $1.35 per euroAn average annual oil price of – $90 per barrel
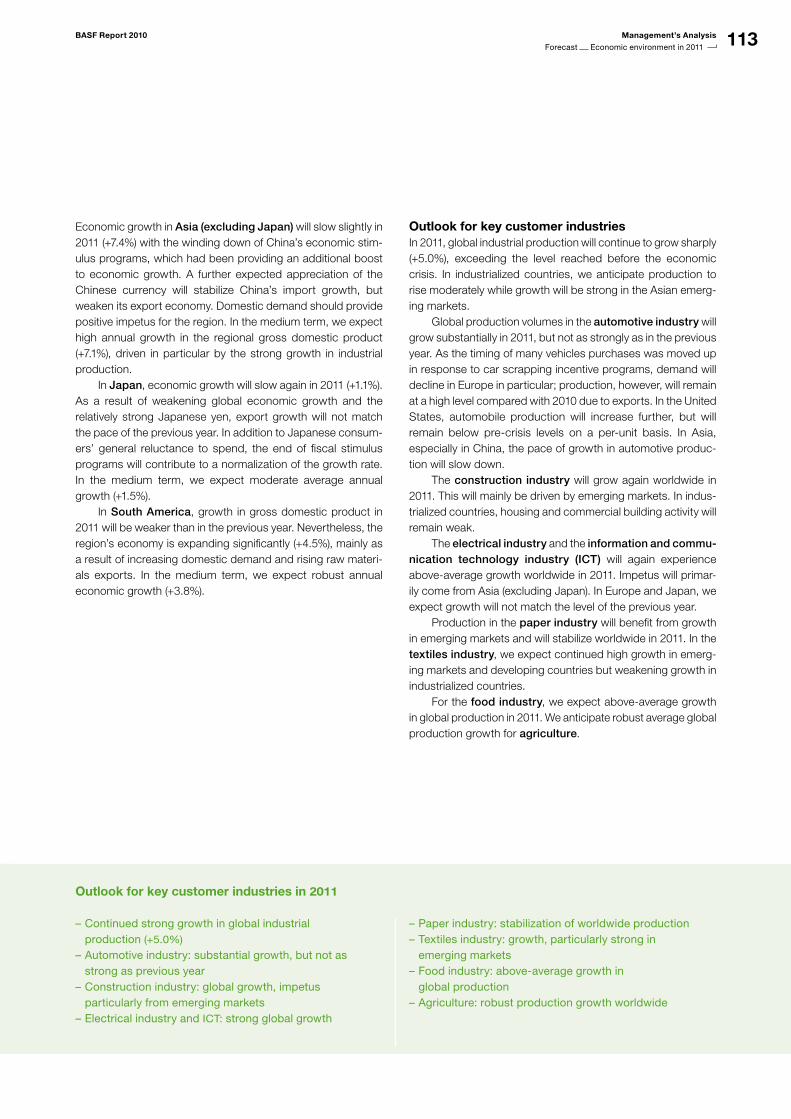
113BASF Report 2010 Management’s Analysis
Forecast Economic environment in 2011
Economic growth in Asia (excluding Japan) will slow slightly in 2011 (+7.4%) with the winding down of China’s economic stim-ulus programs, which had been providing an additional boost to economic growth. A further expected appreciation of the Chinese currency will stabilize China’s import growth, but weaken its export economy. Domestic demand should provide positive impetus for the region. In the medium term, we expect high annual growth in the regional gross domestic product (+7.1%), driven in particular by the strong growth in industrial production. In Japan, economic growth will slow again in 2011 (+1.1%). As a result of weakening global economic growth and the relatively strong Japanese yen, export growth will not match the pace of the previous year. In addition to Japanese consum-ers’ general reluctance to spend, the end of fiscal stimulus programs will contribute to a normalization of the growth rate. In the medium term, we expect moderate average annual growth (+1.5%). In South America, growth in gross domestic product in 2011 will be weaker than in the previous year. Nevertheless, the region’s economy is expanding significantly (+4.5%), mainly as a result of increasing domestic demand and rising raw materi-als exports. In the medium term, we expect robust annual economic growth (+3.8%).
Outlook for key customer industriesIn 2011, global industrial production will continue to grow sharply (+5.0%), exceeding the level reached before the economic crisis. In industrialized countries, we anticipate production to rise moderately while growth will be strong in the Asian emerg-ing markets. Global production volumes in the automotive industry will grow substantially in 2011, but not as strongly as in the previous year. As the timing of many vehicles purchases was moved up in response to car scrapping incentive programs, demand will decline in Europe in particular; production, however, will remain at a high level compared with 2010 due to exports. In the United States, automobile production will increase further, but will remain below pre-crisis levels on a per-unit basis. In Asia, especially in China, the pace of growth in automotive produc-tion will slow down. The construction industry will grow again worldwide in 2011. This will mainly be driven by emerging markets. In indus-trialized countries, housing and commercial building activity will remain weak. The electrical industry and the information and commu-nication technology industry (ICT) will again experience above-average growth worldwide in 2011. Impetus will primar-ily come from Asia (excluding Japan). In Europe and Japan, we expect growth will not match the level of the previous year. Production in the paper industry will benefit from growth in emerging markets and will stabilize worldwide in 2011. In the textiles industry, we expect continued high growth in emerg-ing markets and developing countries but weakening growth in industrialized countries. For the food industry, we expect above-average growth in global production in 2011. We anticipate robust average global production growth for agriculture.
Outlook for key customer industries in 2011
Continued strong growth in global industrial –production (+5.0%)
Automotive industry: substantial growth, but not as –strong as previous yearConstruction industry: global growth, impetus –particularly from emerging marketsElectrical industry and – ICT: strong global growth
Paper industry: stabilization of worldwide production –Textiles industry: growth, particularly strong in –emerging marketsFood industry: aboveaverage growth in –global productionAgriculture: robust production growth worldwide –
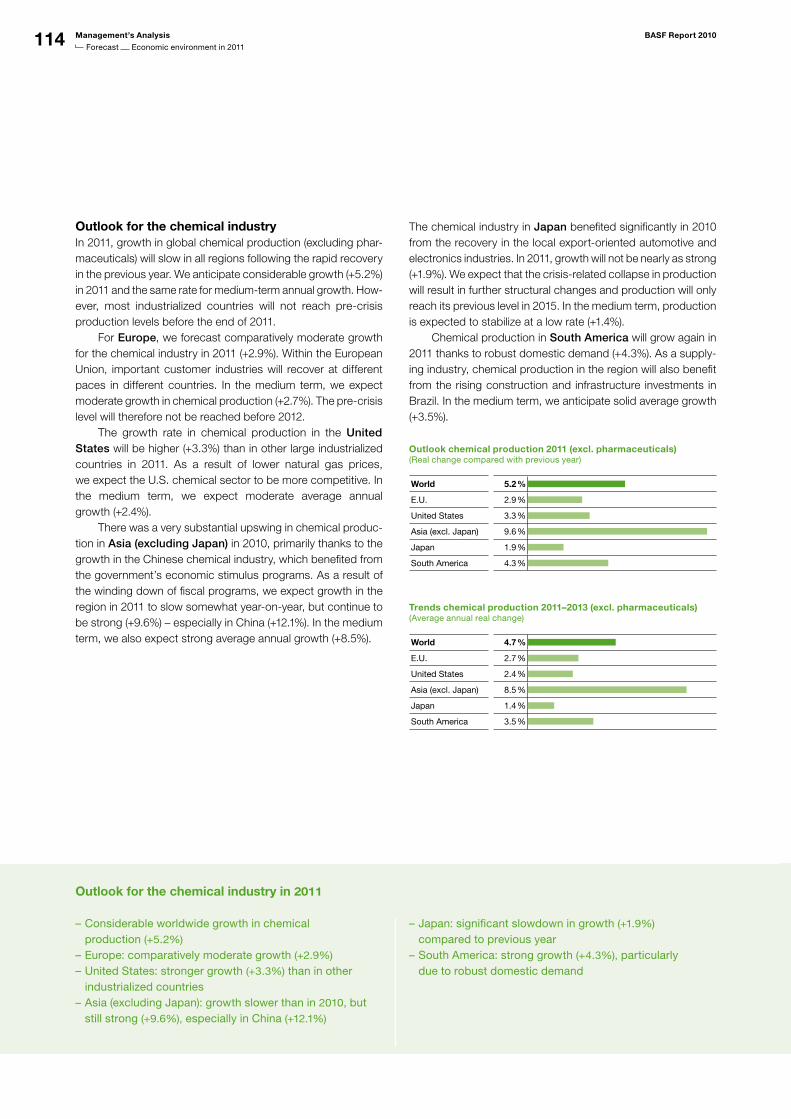
114 Management’s Analysis BASF Report 2010
Forecast Economic environment in 2011
Outlook for the chemical industryIn 2011, growth in global chemical production (excluding phar-maceuticals) will slow in all regions following the rapid recovery in the previous year. We anticipate considerable growth (+5.2%) in 2011 and the same rate for medium-term annual growth. How-ever, most industrialized countries will not reach pre-crisis production levels before the end of 2011. For Europe, we forecast comparatively moderate growth for the chemical industry in 2011 (+2.9%). Within the European Union, important customer industries will recover at different paces in different countries. In the medium term, we expect moderate growth in chemical production (+2.7%). The pre- crisis level will therefore not be reached before 2012. The growth rate in chemical production in the United States will be higher (+3.3%) than in other large industrialized countries in 2011. As a result of lower natural gas prices, we expect the U.S. chemical sector to be more competitive. In the medium term, we expect moderate average annual growth (+2.4%). There was a very substantial upswing in chemical produc-tion in Asia (excluding Japan) in 2010, primarily thanks to the growth in the Chinese chemical industry, which benefited from the government’s economic stimulus programs. As a result of the winding down of fiscal programs, we expect growth in the region in 2011 to slow somewhat year-on-year, but continue to be strong (+9.6%) – especially in China (+12.1%). In the medium term, we also expect strong average annual growth (+8.5%).
The chemical industry in Japan benefited significantly in 2010 from the recovery in the local export-oriented automotive and electronics industries. In 2011, growth will not be nearly as strong (+1.9%). We expect that the crisis-related collapse in production will result in further structural changes and production will only reach its previous level in 2015. In the medium term, production is expected to stabilize at a low rate (+1.4%). Chemical production in South America will grow again in 2011 thanks to robust domestic demand (+4.3%). As a supply-ing industry, chemical production in the region will also benefit from the rising construction and infrastructure investments in Brazil. In the medium term, we anticipate solid average growth (+3.5%).
Outlook chemical production 2011 (excl. pharmaceuticals) (Real change compared with previous year)
World 5.2 %
wird a
ktual
isier
t
E.U. 2.9 %
United States 3.3 %
Asia (excl. Japan) 9.6 %
Japan 1.9 %
South America 4.3 %
Trends chemical production 2011–2013 (excl. pharmaceuticals) (Average annual real change)
World 4.7 %
wird a
ktual
isier
t
E.U. 2.7 %
United States 2.4 %
Asia (excl. Japan) 8.5 %
Japan 1.4 %
South America 3.5 %
Outlook for the chemical industry in 2011
Considerable worldwide growth in chemical –production (+5.2%)
Europe: comparatively moderate growth – (+2.9%)
United States: stronger growth – (+3.3%) than in other industrialized countriesAsia (excluding Japan): growth slower than in – 2010, but still strong (+9.6%), especially in China (+12.1%)
Japan: significant slowdown in growth – (+1.9%) compared to previous yearSouth America: strong growth – (+4.3%), particularly due to robust domestic demand
115BASF Report 2010 Management’s Analysis
Forecast BASF Group outlook and opportunities
BASF Group outlook and opportunitiesProfitable growth thanks to the right strategy
Outlook 2011
In 2011, economic growth is expected to slow down. Excluding the effects of acquisitions and divestitures, we aim for a slight increase in sales volumes and sales. Sales will be additionally boosted by the inclusion of the Cognis businesses. Overall, we aim to significantly exceed the 2010 record levels in sales and income from operations. We expect to earn a high premium on our cost of capital once again in 2011.
BASF took advantage of the favorable economic environ-ment in 2010 and achieved record sales and earnings. There was strong demand for chemical products and growth impetus came from all regions. The successful integration of the Ciba businesses and our initiatives to increase operative excellence made a significant contri-bution to this performance. We expect economic growth to slow down in 2011. Excluding the effects of acquisitions and divestitures, we aim for a slight increase in sales volumes and sales. Sales will additionally be boosted by the inclusion of the Cognis businesses. Overall, we aim to significantly exceed the 2010 record levels in sales and income from operations.
OpportunitiesIn 2011, we may be presented with opportunities arising from stronger growth in the global economy and our customer industries. Furthermore, decreasing raw materials costs, ongo-ing product shortages – especially in the Chemicals and Plas-tics segments – as well as an appreciation of the U.S. dollar would have positive effects on our margins. Additional oppor-tunities for our Oil & Gas segment could arise if exploration wells are more successful or the recovery rates from deposits are greater than expected. With the acquisition of Ciba and Cognis, we have expanded our portfolio to include innovation-driven businesses that are growing faster than the industry average and make our portfo-lio more cyclically robust. With the profitable further develop-ment of the combined businesses, we want to achieve an EBITDA margin of at least 20% in the Performance Products segment from 2013.
An important step in our active portfolio management is the establishment of Styrolution, a 50-50 joint venture in which BASF and INEOS will combine their styrenics activities. A letter of intent was signed in November 2010. Styrolution will be
the world’s leading company for styrenics and set new stan-dards for efficiency, customer service, product quality and competitiveness. Opportunities also arise from the expansion of our pres-ence in fast-growing emerging markets. For example, we want to deepen our successful long-standing cooperation with our partners PETRONAS in Malaysia, and Sinopec in China. We have signed two important agreements for upcoming joint projects to expand our cooperation in the area of specialty chemicals. The objectives of our future-oriented projects are deter-mined by global megatrends such as population growth, increasing urbanization as well as rising energy and resource demand. BASF’s corporate research is a strategic tool we use to develop growth clusters and secure BASF’s long-term competence with regard to technology and methods. In 2015, we aim to generate sales of up to €8 billion with product inno-vations – new or improved products or applications that have been on the market for less than five years. The segments Agricultural Solutions and Performance Products, in particular, will contribute to our profitable growth in coming years thanks to product innovations.
RisksAs described in detail in the Risk report on pages 103 to 111, risks to our business are associated with:
Weaker business volume due to slower growth in our – customer industries Intensification of the debt crisis –Margin declines as a result of rising raw materials prices or –overcapacities, especially for basic products and plasticsExchange rate volatility –Delivery bottlenecks due to the shutdown of production –facilities or insufficient supply of raw materialsRising personnel costs –Growing geopolitical tensions –Protectionism and the erection of new trade barriers –
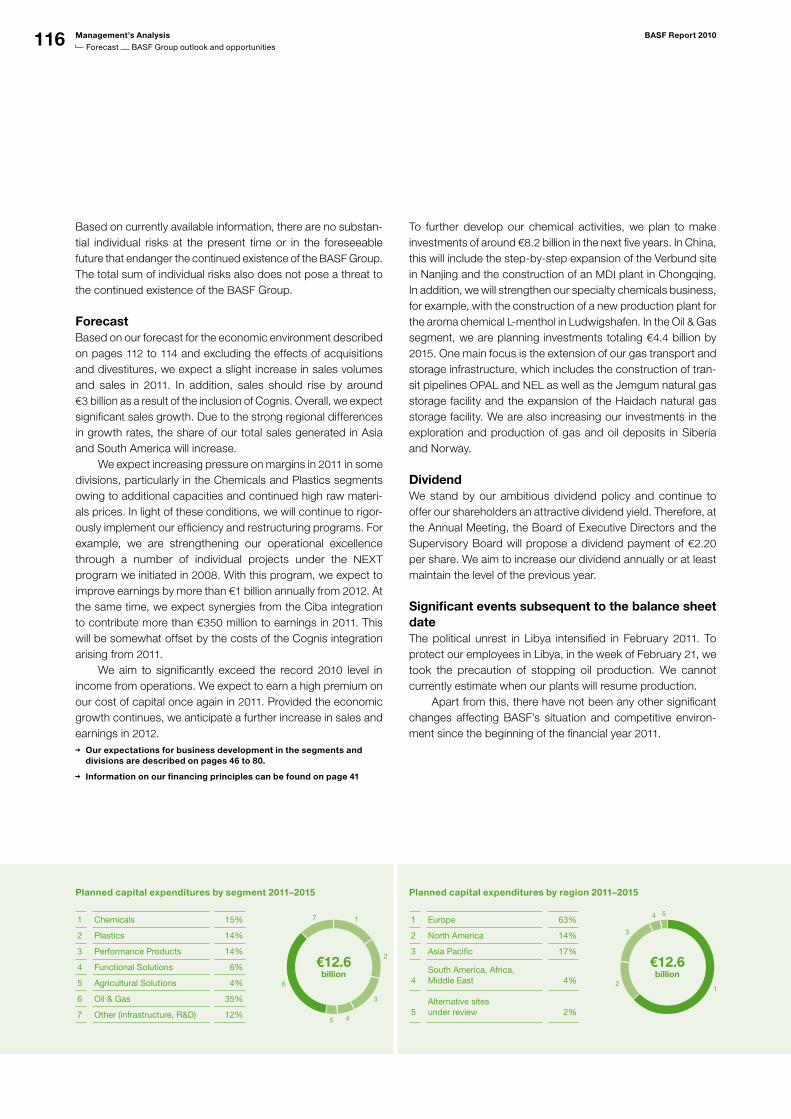
116 Management’s Analysis BASF Report 2010
Forecast BASF Group outlook and opportunities
Planned capital expenditures by segment 2011–2015
1 Chemicals 15%
2 Plastics 14%
3 Performance Products 14%
4 Functional Solutions 6%
5 Agricultural Solutions 4%
6 Oil & Gas 35%
7 Other (infrastructure, R&D) 12%
1
2
3
45
6
7
€12.6billion
wird a
ktual
isier
t
Planned capital expenditures by region 2011–2015
1 Europe 63%
2 North America 14%
3 Asia Pacific 17%
4
South America, Africa, Middle East
4%
5
Alternative sites under review
2%
12
3
4 5
€12.6billion
wird a
ktual
isier
t
Based on currently available information, there are no substan-tial individual risks at the present time or in the foreseeable future that endanger the continued existence of the BASF Group. The total sum of individual risks also does not pose a threat to the continued existence of the BASF Group.
ForecastBased on our forecast for the economic environment described on pages 112 to 114 and excluding the effects of acquisitions and divestitures, we expect a slight increase in sales volumes and sales in 2011. In addition, sales should rise by around €3 billion as a result of the inclusion of Cognis. Overall, we expect significant sales growth. Due to the strong regional differences in growth rates, the share of our total sales generated in Asia and South America will increase. We expect increasing pressure on margins in 2011 in some divisions, particularly in the Chemicals and Plastics segments owing to additional capacities and continued high raw materi-als prices. In light of these conditions, we will continue to rigor-ously implement our efficiency and restructuring programs. For example, we are strengthening our operational excellence through a number of individual projects under the NEXT program we initiated in 2008. With this program, we expect to improve earnings by more than €1 billion annually from 2012. At the same time, we expect synergies from the Ciba integration to contribute more than €350 million to earnings in 2011. This will be somewhat offset by the costs of the Cognis integration arising from 2011.
We aim to significantly exceed the record 2010 level in income from operations. We expect to earn a high premium on our cost of capital once again in 2011. Provided the economic growth continues, we anticipate a further increase in sales and earnings in 2012.
Our expectations for business development in the segments and divisions are described on pages 46 to 80.
Information on our financing principles can be found on page 41
To further develop our chemical activities, we plan to make investments of around €8.2 billion in the next five years. In China, this will include the step-by-step expansion of the Verbund site in Nanjing and the construction of an MDI plant in Chongqing. In addition, we will strengthen our specialty chemicals business, for example, with the construction of a new production plant for the aroma chemical L-menthol in Ludwigshafen. In the Oil & Gas segment, we are planning investments totaling €4.4 billion by 2015. One main focus is the extension of our gas transport and storage infrastructure, which includes the construction of tran-sit pipelines OPAL and NEL as well as the Jemgum natural gas storage facility and the expansion of the Haidach natural gas storage facility. We are also increasing our investments in the exploration and production of gas and oil deposits in Siberia and Norway.
DividendWe stand by our ambitious dividend policy and continue to offer our shareholders an attractive dividend yield. Therefore, at the Annual Meeting, the Board of Executive Directors and the Supervisory Board will propose a dividend payment of €2.20 per share. We aim to increase our dividend annually or at least maintain the level of the previous year.
Significant events subsequent to the balance sheet dateThe political unrest in Libya intensified in February 2011. To protect our employees in Libya, in the week of February 21, we took the precaution of stopping oil production. We cannot currently estimate when our plants will resume production. Apart from this, there have not been any other significant changes affecting BASF’s situation and competitive environ-ment since the beginning of the financial year 2011.
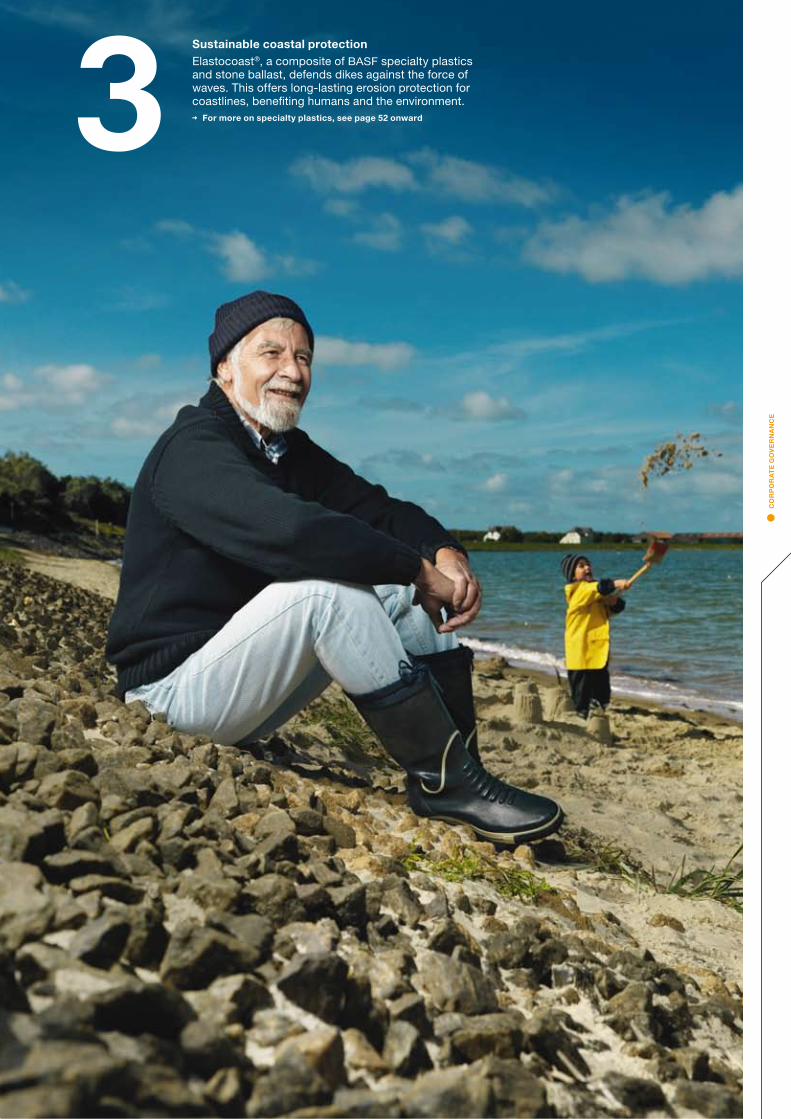
3Sustainable coastal protection
Elastocoast®, a composite of BASF specialty plastics and stone ballast, defends dikes against the force of waves. This offers longlasting erosion protection for coastlines, benefiting humans and the environment.
For more on specialty plastics, see page 52 onward
• C
OR
PO
RA
TE
GO
VE
RN
AN
CE

117 Corporate Governance of the BASF Group
122 Management and Supervisory Boards
125 Compensation report
131 Report of the Supervisory Board
134 Declaration of conformity
Corporate Governance
117BASF Report 2010 Corporate Governance
Corporate governance of the BASF Group
Corporate Governanceof the BASF Group
Corporate governance refers to the entire system for managing and supervising a company, including its organization, its commercial principles and guidelines, as well as all internal and external regulatory and moni-toring mechanisms. Effective and transparent corporate governance guarantees that BASF is managed and monitored in a responsible and value-driven manner. This fosters the confidence of our domestic and international investors, the financial markets, our customers and other business partners, employees and the public in the company.
As of January 14, 2008, BASF took on the new European legal form of a European Company (Societas Europaea). A highly significant goal of the conversion into BASF SE was the strength-ening of BASF’s corporate governance structure. By reducing the size of the Supervisory Board to 12 members while main-taining the equal representation of shareholders and employ-ees and broadening the European composition of the employee representatives’ side, the future direction for a modern and efficient corporate constitution has been set. Proven structures such as the two-tier administrative system of BASF’s Board of Executive Directors and Supervisory Board have been retained in the SE.
Management and supervision in BASF SEThe legal foundations of BASF SE’s corporate constitution are primarily the SE Council Regulation of the European Union, the German SE Implementation Act and the German Stock Corpo-ration Act. Despite these new legal foundations, the proven fun-damental elements of the German Aktiengesellschaft’s corpo-rate constitution remain unchanged in BASF SE: these are the two-tier management system consisting of BASF’s Board of Executive Directors and the Supervisory Board, the equal representation of shareholders and employees in the Supervi-sory Board, and the shareholders’ rights of co-administration and supervision at the Annual Meeting.
Direction and management by the Board of Executive DirectorsUnder the two-tier management system of BASF SE, the Board of Executive Directors is responsible for the management of the company, and represents BASF SE in business undertakings with third parties. BASF’s Board of Executive Directors is strictly separated from the Supervisory Board: A member of the Board of Executive Directors cannot simultaneously be a member of the Supervisory Board. The Board of Executive Directors agrees on the BASF Group’s company goals and corporate strategy, and manages and monitors the business units of the BASF Group through the planning and setting of the company bud-get, the allocation of resources and management capacities, the monitoring and decision making regarding significant indi-vidual measures and the control of the operational management.
The Board’s actions and decisions are aligned with the compa-ny’s best interests. It is committed to the goal of increasing the company’s value in the long term. Decisions that are reserved for the Board as a whole by law, through the Board of Execu-tive’s Rules of Procedure or through resolutions adopted by the Board, are taken based on a simple majority. In the case of a tied vote, the casting vote is given by the Chairman of the Board. However, the Chairman of the Board does not have the right to veto the decisions of the Board of Executive Directors. Members of the Board of Executive Directors are authorized to make decisions individually in their assigned business areas. The Board of Executive Directors reports to the Supervi-sory Board regularly, comprehensively and in a timely manner on all relevant matters concerning the company with regard to strategic planning, business development, risks and risk management. Furthermore, the Board agrees on corporate strategy with the Supervisory Board. Where required by the Statutes of BASF SE, the Board of Executive Directors must have the approval of the Supervisory Board for certain transac-tions before they are concluded. Such cases include the acqui-sition and disposal of enterprises and parts of enterprises, the issuance of bonds or comparable financial instruments provided the acquisition or disposal price or the amount of the issue in an individual case exceeds 3% of the equity reported in the last approved Consolidated Financial Statements of the BASF Group.
The members of the Board of Executive Directors, including their memberships on the boards of other companies, are listed on page 122. Compensation of the Board of Executive Directors is de-scribed in detail in the compensation report on the pages 125 to 129.
Monitoring of company management by the Supervisory BoardThe Supervisory Board appoints the members of the Board of Executive Directors and monitors and advises the Board on management issues. Members of the Supervisory Board can-not simultaneously be members of the Board of Executive Directors. Structurally, this ensures a high level of autonomy with regards to the supervision of the Board of Executive Directors. The change in legal form to an SE brought about substan-tial changes in the Supervisory Board. The German Codetermi-nation Act, which is the relevant statutory foundation regarding the size and composition of the Supervisory Board of an Aktiengesellschaft, does not apply to the SE. Together with the SE Council Regulation, the relevant statutory foundations are the Statutes of BASF SE and the Agreement Concerning the Involvement of Employees in BASF SE (Employee Participation Agreement) that was signed on November 15, 2007, by the com-pany management and the representatives of the BASF Group’s European employees.
For more on the Statutes of BASF SE and the Employee Participation Agreement, see basf.com/investor/cg_e
118 Corporate Governance BASF Report 2010
Corporate governance of the BASF Group
The Supervisory Board of BASF SE comprises 12 members. Six members are elected by the shareholders at the Annual Meeting. The remaining six members are elected by the BASF Europa Betriebsrat (European works council), the European employee representation body of the BASF Group, as agreed to in the Employee Participation Agreement.
The Supervisory Board, including their membership on the boards of other companies, are listed on pages 123 and 124. Compensation of the Supervisory Board is described in detail in the Compensation report on pages 129 and 130.
It is very important for good corporate governance that the company ensures that seats on the responsible corporate bodies, the Board of Executives and the Supervisory Board, are appropriately filled. Criteria in this case include professional and personal qualifications, the diversity of the board members and the independence of the Supervisory Board. Seats on the Board of Executive Directors and Supervisory Board should be filled with members who as a group possess the necessary know-ledge, skills and personal qualifications to manage and super-vise BASF as a large, globally operating, capital market-oriented company in the chemical industry. In its meeting of October 21, 2010, the Supervisory Board agreed upon objectives for the composition of the Supervisory Board in accordance with Section 5.4.1 of the German Corporate Governance Code. According to these objectives, the Supervisory Board shall be composed in such a way that the members as a group possess knowledge, ability and expert experience
in the management of an internationally operating company, –in cross-industry value creation along different value-adding –chains,in the application of accounting principles and internal con- –trol procedures, andin the field of technical and scientific innovations in the –chemical sector and associated industries as well as in the sectors using chemical products.
With regard to diversity, the Supervisory Board shall consider a variety of professional and international experience as well as the participation of women. Individuals who may have a conflict of interest shall not be nominated for election to the Supervisory Board. The same applies to candidates who will have reached the age of 70 by the day of the election.
In accordance with these objectives, the Supervisory Board will propose Ms. Anke Schäferkordt to be elected in a by-election at the Annual Meeting on May 6, 2011, replacing Mr. Stephen K. Green as a member of the Supervisory Board. Mr. Green resigned from the Supervisory Board following his appointment to become the United Kingdom’s Minister of State for Trade and Investment. As a result, there will be two women among the 12 members of the Supervisory Board. We are committed to main-
taining or, if possible, raising the proportion of women on the Supervisory Board at the next scheduled election to the Super-visory Board in 2014. The Nomination Committee will include both appropriately qualified women and candidates with inter-national experience in its selection process. We firmly believe the current formation of the Supervisory Board already fulfills the objectives agreed on by the Supervisory Board regarding its composition on October 21, 2010.
Resolutions of the Supervisory Board are passed by a simple majority of the votes of the participating members of the Super-visory Board. In the event of a tie, the vote of the Chairman of the Supervisory Board, who must always be a shareholder representative, shall be the casting vote. This resolution process is also applicable for the appointment and dismissal of members of the Board of Executive Directors by the Supervi-sory Board. BASF SE’s Supervisory Board has established a total of three Supervisory Board Committees: the Personnel Commit-tee, the Audit Committee and the Nomination Committee.
The Personnel Committee’s duties include, amongst others, preparing the appointment of members to the Board of Execu-tive Directors by the Supervisory Board and the employment contracts to be entered into with members of the Board of Executive Directors. When making recommendations on appointments to the Board of Executive Directors, the Person-nel Committee takes into account their professional qualifica-tions, international experience and leadership skills, long-term succession planning as well as diversity and, in particular, the appropriate consideration of women. It also prepares the resolutions made by the Supervisory Board with regard to the system and determination of the amount of compensation paid to members of the Board of Executive Directors. The commit-tee comprises Supervisory Board Chairman Dr. h.c. Eggert Voscherau (chairman), Supervisory Board Deputy Chairmen Michael Diekmann and Robert Oswald, as well as Michael Vassiliadis.
The Audit Committee prepares the negotiations and resolu-tions of the Supervisory Board for the approval of the Financial Statements and Consolidated Financial Statements, and considers the quarterly and first-half financial reports with the Board of Executive Directors prior to their publication. It also deals with: monitoring the financial reporting process, the annual audit, the effectiveness of the internal control system, the risk management system, and the internal auditing system as well as compliance issues. The Audit Committee is also responsible for business relations with the company’s external auditor: It prepares the Supervisory Board’s proposal to the Annual Meeting regarding the selection of an auditor, monitors the auditor’s independence, defines the main focuses of the audit together with the auditor, negotiates auditing fees and
119BASF Report 2010 Corporate Governance
Corporate governance of the BASF Group
establishes the conditions for the provision of the auditor’s non-audit services. The Audit Committee is authorized to request any information that it deems necessary from the auditors or Board of Executive Directors. It can also view all of BASF’s busi-ness documents and examine these and all other assets belonging to BASF. The Audit Committee can also engage experts such as auditors or lawyers to carry out these inspec-tions. The members of this committee are Max Dietrich Kley (chairman), Ralf-Gerd Bastian, Franz Fehrenbach and Michael Vassiliadis. Max Dietrich Kley has particular knowledge and experience in the application of accounting principles and inter-nal audit procedures, as he was Chief Financial Officer of BASF Aktiengesellschaft until April 2003.
According to the recommendation of the German Corporate Governance Code, BASF SE’s Supervisory Board established a Nomination Committee that will prepare the proposals for the Supervisory Board members to be elected at the Annual Meeting. The members of the Nomination Committee are the members of the Supervisory Board elected at the Annual Meeting: Dr. h.c. Eggert Voscherau, Prof. Dr. François Dieder-ich, Michael Diekmann, Franz Fehrenbach, Stephen K. Green (until December 16, 2010), Max Dietrich Kley and Anke Schäfer-kordt (since December 17, 2010).
Shareholders’ rights At the Annual Meeting, shareholders perform their rights of co-administration and supervision. Each BASF SE share repre-sents one vote. Following the conversion of BASF shares to registered shares, which was approved at the Annual Meeting on April 29, 2010 and completed in August 2010, those BASF shareholders who are listed in the share register are entitled to vote. There are no registration restrictions and there is no limit to the number of shares that can be registered to one share-holder. Shareholders may exercise their voting rights at the Annual Meeting either personally, through a representative of their choice or through a company-appointed proxy authorized by the shareholders to vote according to their instructions. There are neither voting caps to limit the number of votes a shareholder may cast nor special voting rights. BASF has fully implemented the principle of “one share, one vote.” All shareholders entered in the share register are entitled to participate in the Annual Meeting, to have their say concerning any resolution and to demand information about company issues to the extent that it serves to help make an informed judgment about the resolution under discussion. Half of the members of the Supervisory Board are elected at the Annual Meeting where, above all, the formal discharge of the Board of Executive Directors and the Supervi-sory Board is decided on as well as the distribution of profits, capital measures, the authorization of share buybacks and changes to the statutes.
German Corporate Governance Code BASF accords great importance to good corporate governance. BASF therefore supports the German Corporate Governance Code, which it regards as an important tool in the capital market-focused continuing development of corporate gover-nance and control, and advocates responsible corporate governance that focuses on a sustainable increase in the value of the company. BASF SE follows all recommendations of the German Corporate Governance Code in its revised version of May 2010. This applies also to the Code’s new recommendations regard-ing the composition of the Board of Executive Directors and the Supervisory Board as well as diversity in the staffing of execu-tive positions. The joint declaration of conformity 2010 of the Board of Executive Directors and Supervisory Board of BASF SE is rendered at the end of this section on page 134. In the same manner, BASF fulfills nearly all of the non- obligatory suggestions of the German Corporate Governance Code. The only exceptions are the suggestions to allow share-holders to follow the entire Annual Meeting online and to consider components based on the long-term success of the company in the compensation of the Supervisory Board. Compensation of the Supervisory Board of BASF SE does not contain any special compensation components that are tied to long-term company success assessed over a number of years. However, the annual variable compensation component based on profit per share is aligned with long-term profit increases, insofar as the profit per share required for the same variable compensation increases annually. This creates an incentive to pay special attention to the company’s long-term performance and to sustainably increase the value of the company in the interest of the shareholders. The Annual Meeting will be openly accessible to all via online broadcast until the end of the speech by the Chairman of the Board of Executive Directors. The subsequent discussion of resolutions will not be accessible online in order to preserve the character of the Annual Meeting as a meeting attended by our shareholders on-site.
For more on the declaration of conformity 2010, an overview of the implementation of the Code’s suggestions and the German Corporate Governance Code, see basf.com/governance_e
Values and Principles of the BASF Group/ Code of conduct To ensure high standards of corporate governance, the Board of Executive Directors has set out the business principles and rules of conduct for all BASF activities in the Values and Princi-ples of the BASF Group, and the Code of Conduct/Compliance Program, which have been introduced throughout the company. The Code of Conduct describes in detail the conduct we expect from BASF employees – based on the principle of integ-rity. Compliance with all relevant legislation is especially impor-tant to us, in particular antitrust and competition legislation, embargo and export controls regulations – including those
120 Corporate Governance BASF Report 2010
Corporate governance of the BASF Group
relating to chemical weapons – as well as labor laws and plant safety regulations. Other issues covered are bans on insider dealing for personal benefit and bans on facilitation payments to, or from, business partners or government officials, and the responsible treatment of BASF’s assets. The Corporate Audit department, together with BASF’s Chief Compliance Officer, monitors compliance on a regular basis.
For more on BASF’s Values and Principles and the Code of Conduct, see basf.com/values
ComplianceThe basis for our Compliance Program is a system of training, information points and monitoring instruments. New employees at BASF receive mandatory basic compliance training. This is supplemented by subsequent refresher courses and training on special topics such as competition law and embargo regula-tions. More than 41,000 employees participated in compliance training in 2010. We implement our Compliance Program in the company with Group-wide codes of conduct. In this way, we ensure our employees to know the rules and guidelines. The aim is to prevent legal violations such as incidents of corruption and to minimize potential compliance risks for BASF. Our Chief Compliance Officer manages the global imple-mentation of the program, with the help of around 100 Compli-ance Managers worldwide. The Chief Compliance Officer regularly reports to the Board of Executive Directors on the implementation and, if necessary, the sharpening of the Com-pliance Program as well as findings from the company’s activi-ties. Furthermore, the Chief Compliance Officer reports to the Supervisory Board’s Audit Committee in at least one of its meet-ings each year on the content and implementation of the com-pliance program and the handling of major individual issues. In the event of significant incidents, the Audit Committee is imme-diately informed by the Board of Executive Directors. If, despite all preventive measures, violations occur, we aim to investigate and rectify these as quickly as possible. Our exter-nal Group-wide hotlines enable employees to anonymously seek advice regarding personal conduct as well as report incidents in the company that they consider dubious. In 2010, there were 234 calls and e-mails received. The majority of the inquiries were related to questions regarding the employee’s own behavior. The rest related to a wide variety of topics, ranging from business- related advice to questions about personnel management and suspicion of personal enrichment at the company’s cost. Our Cor-porate Audit department audits adherence to our principles. In 2010, we carried out 48 compliance audits throughout the Group (2009: 109). We investigate all cases of suspected misconduct detected in these audits or reported to our hotline. In cases of serious violations, sanctions can range up to dismissal and claims for damages. In addition, the Chief Compliance Officer and BASF’s data protection representatives in Germany reviewed the processes for proper handling of employee data in 2010.
When selecting suppliers in non-OECD countries, we use a questionnaire to determine whether they have established a code of conduct. In 2010, we developed a new checklist to survey compliance for contractors, consultants and third-party companies that sell our products. We are involved in initiatives to prevent corruption outside of our company. As a participant in the United Nations Global Compact, we work to implement the Global Compact principle on fighting corruption. As a member of Transparency Interna-tional Deutschland e.V. since 2003, we support the fight against corruption. Since 2008, we have been participating in the “Part-nering Against Corruption Initiative” (PACI) of the World Economic Forum in Davos, Switzerland. In 2010, we surveyed around 1,000 executives and employees of BASF SE about their perception of compliance in the company, including questions such as how often they feel confronted with conflict situations and whether the Compliance Program gives them sufficient orientation. More than 50% of those polled took part in the voluntary, anonymous survey. In 2011, we plan to extend the survey to include signifi-cant Group companies.
For more on our Values and Principles, see Strategy and Values from page 17 onward
Disclosure according to Section 315 (4) of the Ger-man Commercial Code and the explanatory report of the Board of Executive Directors according to Section 176 (1) Sentence 1 of the German Stock Corporation ActAs of December 31, 2010, the subscribed capital of BASF SE was €1,175,652,728.32, divided into 918,478,694 registered shares with no par value. Each share shall, at an Annual Meet-ing, entitle the holder to one vote. Restrictions on the right to vote or transfer shares do not exist. The same rights and duties apply to all shares. According to the Statutes, shareholders are not entitled to receive share certificates. There are neither different classes of shares nor shares with preferential voting rights (golden shares). The appointment and dismissal of members of the Board of Executive Directors is legally governed by the regulations in Arti-cle 39 of the SE Council Regulation, Section 16 of the SE Imple-mentation Act and Sections 84, 85 of the German Stock Corpo-ration Act, as well as Article 7 of the BASF SE Statutes. Members of the Board of Executive Directors are appointed and dismissed by the Supervisory Board according to these regulations. The members of the Board of Executive Directors are appointed for a maximum of five years, re-appointments being permissible. The Supervisory Board can dismiss a member of the Board of Exec-utive Directors if there is serious cause to do so. Serious cause includes, in particular, a gross breach of the duties pertaining to the Board of Executive Directors and a vote of no confidence at the Annual Meeting. The Supervisory Board decides on appoint-ments and dismissals according to their own dutiful discretion.
121BASF Report 2010 Corporate Governance
Corporate governance of the BASF Group
According to Article 59 (1) SE Council Regulation, amendments to the Statutes of BASF SE require a resolution of the Annual Meeting adopted with at least a two-thirds majority of the votes cast, provided that the legal provisions applicable to German stock corporations under the German Stock Corporation Act do not stipulate or allow for larger majority requirements. In the case of amendments to the Statutes, Section 179 (2) of the German Stock Corporation Act requires a majority of at least three quarters of the subscribed capital represented. Pursuant to Article 12 No. 6 of the Statutes of BASF SE, the Supervisory Board is authorized to make amendments to the Statutes that merely concern their wording. This applies in particular to the alignment of share capital and the number of shares after a BASF share buyback and after a new issue of shares from the authorized capital. Until April 30, 2014, the Board of Executive Directors of BASF SE is empowered by a resolution passed at the Annual Meeting of April 30, 2009 to increase the subscribed capital by a total amount of €500 million through the issue of new shares (authorized capital). This must have the approval of the Super-visory Board. A right to subscribe to the new shares shall be granted to shareholders. This can also be done by a credit institution acquiring the new shares with the obligation to offer these to shareholders (indirect subscription right). The Board of Executive Directors is authorized to exclude the statutory sub-scription right of shareholders in certain exceptional cases that are narrowly defined in Article 5 No. 8 of the BASF SE Statutes. This applies in particular, if for capital increases in return for cash contributions, the issue price of the new shares is not substan-tially lower than the stock market price of BASF shares and the total number of shares issued under this authorization is not more than 10% of the subscribed capital on the date of issue. In the event of a change of control, members of the Board of Executive Directors shall, under certain additional conditions, receive compensation (details of which are listed in the com-pensation report on page 128). A change of control is assumed when a shareholder informs BASF of a shareholding of at least 25% or the increase of such a holding. In addition, employees of BASF SE and its subsidiaries who are classed as ‘senior executives’ (Obere Führungskräfte) will receive a severance pay-ment if their contract of employment is terminated by BASF within 18 months of the occurrence of a change of control provided the employee has not given cause for the termination. The employee whose service contract has been terminated in such a case will receive a severance payment to the maximum of 1.5 times the annual salary (fixed component) depending on the number of months that have passed since the change-of-control event. The remaining specifications stipulated in Section 315 (4) of the German Commercial Code refer to situations that are not applicable to BASF SE.
Directors’ and Officers’ liability insurance BASF has taken out liability insurance that covers the activities of members of the Board of Executive Directors and the Supervisory Board (D&O insurance). This policy provides for the level of deductibles for the Board of Executive Directors as pre-scribed by Section 93 (2) 3 of the German Stock Corporation Act and for the level of deductibles for the Supervisory Board as recommended in Section 3.8, Paragraph 3 of the German Corporate Governance Code.
Share ownership by Members of the Board of Executive Directors and the Supervisory Board No member of the Board of Executive Directors or the Supervi-sory Board owns shares in BASF SE and related options or other derivatives that account for 1% or more of the share capital. Fur-thermore, the entire holdings by members of the Board of Executive Directors and the Supervisory Board account for less than 1% of the shares issued by the company.
Share dealings of the Board of Executive Directors and Supervisory Board (Directors’ Dealings under Section 15a of German Securities Trading Act) In accordance with Section 15a of the German Securities Trading Act (Wertpapierhandelsgesetz), all members of the Board of Executive Directors and the Supervisory Board, as well as certain members of their families, are required to disclose the purchase or sale of BASF shares and other related rights to the German Financial Supervisory Authority (Bundesanstalt für Finanzdienstleistungsaufsicht) and to the company if transac-tions within the calendar year exceed the threshold of €5,000.
In 2010, a total of six purchases subject to disclosure as Directors’ Dealings by members of the Board of Executive Directors and the Supervisory Board and members of their fam-ilies subject to disclosure were reported. The transactions involved between 100 and 2,000 shares with a per share price of between €41.23 and €45.00. The volume of the individual trades was between €4,437 and €90,000.
For more on directors’ dealings in 2010, see basf.com/governance/sharedealings_e
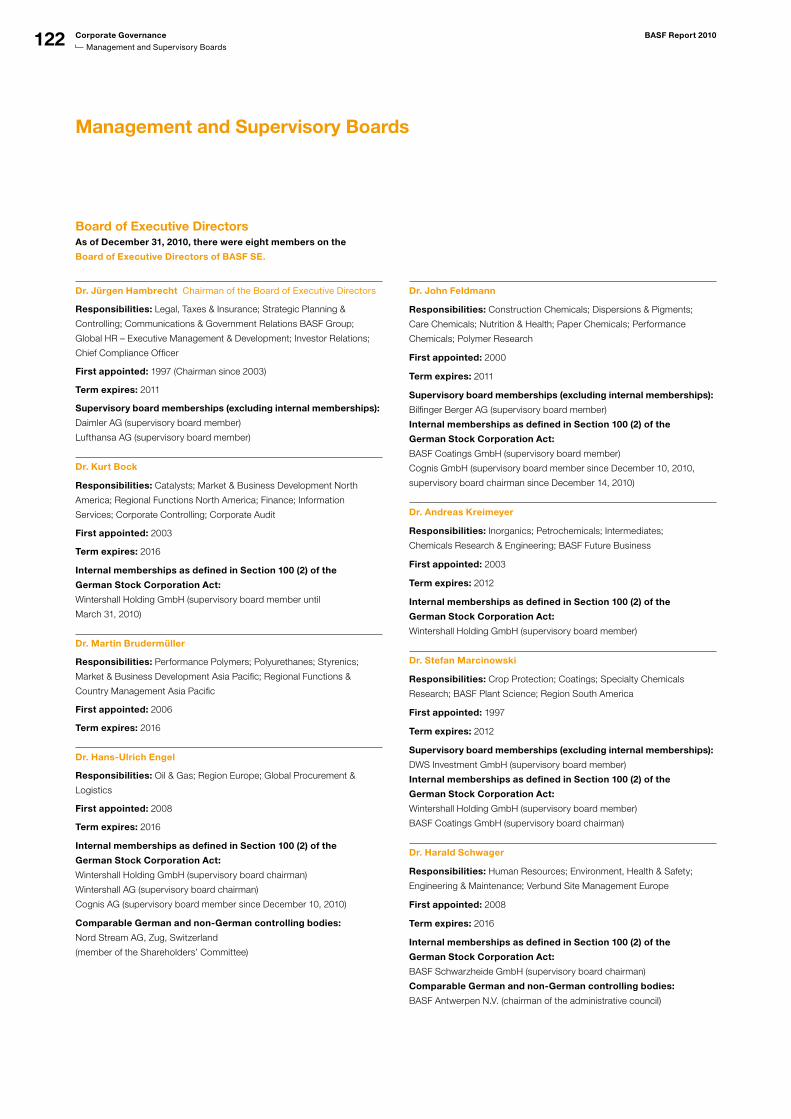
122 Corporate Governance BASF Report 2010
Management and Supervisory Boards
Management and Supervisory Boards
Board of Executive DirectorsAs of December 31, 2010, there were eight members on the
Board of Executive Directors of BASF SE.
Dr. Jürgen Hambrecht Chairman of the Board of Executive Directors
Responsibilities: Legal, Taxes & Insurance; Strategic Planning &
Con trolling; Communications & Government Relations BASF Group;
Global HR – Executive Management & Development; Investor Relations;
Chief Compliance Officer
First appointed: 1997 (Chairman since 2003)
Term expires: 2011
Supervisory board memberships (excluding internal memberships):
Daimler AG (supervisory board member)
Lufthansa AG (supervisory board member)
Dr. Kurt Bock
Responsibilities: Catalysts; Market & Business Development North
America; Regional Functions North America; Finance; Information
Services; Corporate Controlling; Corporate Audit
First appointed: 2003
Term expires: 2016
Internal memberships as defined in Section 100 (2) of the
German Stock Corporation Act:
Wintershall Holding GmbH (supervisory board member until
March 31, 2010)
Dr. Martin Brudermüller
Responsibilities: Performance Polymers; Polyurethanes; Styrenics;
Market & Business Development Asia Pacific; Regional Functions &
Country Management Asia Pacific
First appointed: 2006
Term expires: 2016
Dr. Hans-Ulrich Engel
Responsibilities: Oil & Gas; Region Europe; Global Procurement &
Logistics
First appointed: 2008
Term expires: 2016
Internal memberships as defined in Section 100 (2) of the
German Stock Corporation Act:
Wintershall Holding GmbH (supervisory board chairman)
Wintershall AG (supervisory board chairman)
Cognis AG (supervisory board member since December 10, 2010)
Comparable German and non-German controlling bodies:
Nord Stream AG, Zug, Switzerland
(member of the Shareholders’ Committee)
Dr. John Feldmann
Responsibilities: Construction Chemicals; Dispersions & Pigments;
Care Chemicals; Nutrition & Health; Paper Chemicals; Performance
Chemicals; Polymer Research
First appointed: 2000
Term expires: 2011
Supervisory board memberships (excluding internal memberships):
Bilfinger Berger AG (supervisory board member)
Internal memberships as defined in Section 100 (2) of the
German Stock Corporation Act:
BASF Coatings GmbH (supervisory board member)
Cognis GmbH (supervisory board member since December 10, 2010,
supervisory board chairman since December 14, 2010)
Dr. Andreas Kreimeyer
Responsibilities: Inorganics; Petrochemicals; Intermediates;
Chemicals Research & Engineering; BASF Future Business
First appointed: 2003
Term expires: 2012
Internal memberships as defined in Section 100 (2) of the
German Stock Corporation Act:
Wintershall Holding GmbH (supervisory board member)
Dr. Stefan Marcinowski
Responsibilities: Crop Protection; Coatings; Specialty Chemicals
Research; BASF Plant Science; Region South America
First appointed: 1997
Term expires: 2012
Supervisory board memberships (excluding internal memberships):
DWS Investment GmbH (supervisory board member)
Internal memberships as defined in Section 100 (2) of the
German Stock Corporation Act:
Wintershall Holding GmbH (supervisory board member)
BASF Coatings GmbH (supervisory board chairman)
Dr. Harald Schwager
Responsibilities: Human Resources; Environment, Health & Safety;
Engineering & Maintenance; Verbund Site Management Europe
First appointed: 2008
Term expires: 2016
Internal memberships as defined in Section 100 (2) of the
German Stock Corporation Act:
BASF Schwarzheide GmbH (supervisory board chairman)
Comparable German and non-German controlling bodies:
BASF Antwerpen N.V. (chairman of the administrative council)
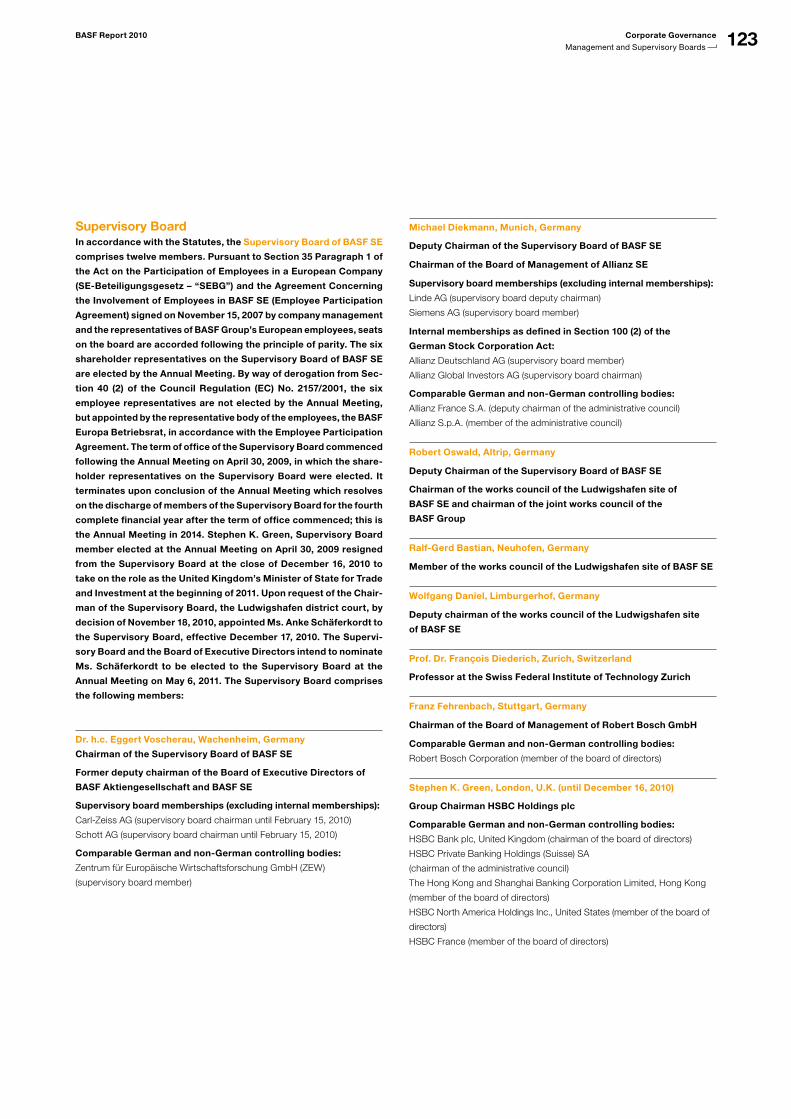
123BASF Report 2010 Corporate Governance
Management and Supervisory Boards
Supervisory BoardIn accordance with the Statutes, the Supervisory Board of BASF SE
comprises twelve members. Pursuant to Section 35 Paragraph 1 of
the Act on the Participation of Employees in a European Company
(SE-Beteiligungsgesetz – “SEBG”) and the Agreement Concerning
the Involvement of Employees in BASF SE (Employee Participation
Agreement) signed on November 15, 2007 by company management
and the representatives of BASF Group’s European employees, seats
on the board are accorded following the principle of parity. The six
shareholder representatives on the Supervisory Board of BASF SE
are elected by the Annual Meeting. By way of derogation from Sec-
tion 40 (2) of the Council Regulation (EC) No. 2157/2001, the six
employee representatives are not elected by the Annual Meeting,
but appointed by the representative body of the employees, the BASF
Europa Betriebsrat, in accordance with the Employee Participation
Agreement. The term of office of the Supervisory Board commenced
following the Annual Meeting on April 30, 2009, in which the share-
holder representatives on the Supervisory Board were elected. It
terminates upon conclusion of the Annual Meeting which resolves
on the discharge of members of the Supervisory Board for the fourth
complete financial year after the term of office commenced; this is
the Annual Meeting in 2014. Stephen K. Green, Supervisory Board
member elected at the Annual Meeting on April 30, 2009 resigned
from the Supervisory Board at the close of December 16, 2010 to
take on the role as the United Kingdom’s Minister of State for Trade
and Investment at the beginning of 2011. Upon request of the Chair-
man of the Supervisory Board, the Ludwigshafen district court, by
decision of November 18, 2010, appointed Ms. Anke Schäferkordt to
the Supervisory Board, effective December 17, 2010. The Supervi-
sory Board and the Board of Executive Directors intend to nominate
Ms. Schäferkordt to be elected to the Supervisory Board at the
Annual Meeting on May 6, 2011. The Supervisory Board comprises
the following members:
Dr. h.c. Eggert Voscherau, Wachenheim, Germany
Chairman of the Supervisory Board of BASF SE
Former deputy chairman of the Board of Executive Directors of
BASF Aktiengesellschaft and BASF SE
Supervisory board memberships (excluding internal memberships):
Carl-Zeiss AG (supervisory board chairman until February 15, 2010)
Schott AG (supervisory board chairman until February 15, 2010)
Comparable German and non-German controlling bodies:
Zentrum für Europäische Wirtschaftsforschung GmbH (ZEW)
(supervisory board member)
Michael Diekmann, Munich, Germany
Deputy Chairman of the Supervisory Board of BASF SE
Chairman of the Board of Management of Allianz SE
Supervisory board memberships (excluding internal memberships):
Linde AG (supervisory board deputy chairman)
Siemens AG (supervisory board member)
Internal memberships as defined in Section 100 (2) of the
German Stock Corporation Act:
Allianz Deutschland AG (supervisory board member)
Allianz Global Investors AG (supervisory board chairman)
Comparable German and non-German controlling bodies:
Allianz France S.A. (deputy chairman of the administrative council)
Allianz S.p.A. (member of the administrative council)
Robert Oswald, Altrip, Germany
Deputy Chairman of the Supervisory Board of BASF SE
Chairman of the works council of the Ludwigshafen site of
BASF SE and chairman of the joint works council of the
BASF Group
Ralf-Gerd Bastian, Neuhofen, Germany
Member of the works council of the Ludwigshafen site of BASF SE
Wolfgang Daniel, Limburgerhof, Germany
Deputy chairman of the works council of the Ludwigshafen site
of BASF SE
Prof. Dr. François Diederich, Zurich, Switzerland
Professor at the Swiss Federal Institute of Technology Zurich
Franz Fehrenbach, Stuttgart, Germany
Chairman of the Board of Management of Robert Bosch GmbH
Comparable German and non-German controlling bodies:
Robert Bosch Corporation (member of the board of directors)
Stephen K. Green, London, U.K. (until December 16, 2010)
Group Chairman HSBC Holdings plc
Comparable German and non-German controlling bodies:
HSBC Bank plc, United Kingdom (chairman of the board of directors)
HSBC Private Banking Holdings (Suisse) SA
(chairman of the administrative council)
The Hong Kong and Shanghai Banking Corporation Limited, Hong Kong
(member of the board of directors)
HSBC North America Holdings Inc., United States (member of the board of
directors)
HSBC France (member of the board of directors)
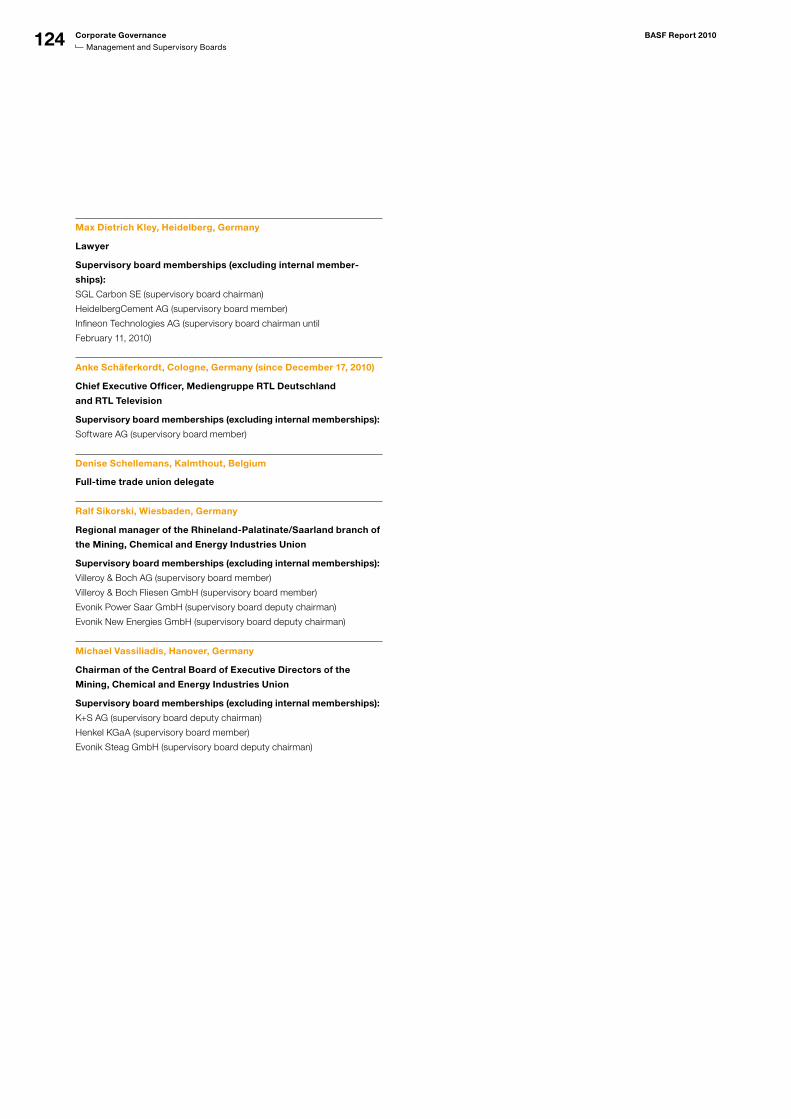
124 Corporate Governance BASF Report 2010
Management and Supervisory Boards
Max Dietrich Kley, Heidelberg, Germany
Lawyer
Supervisory board memberships (excluding internal member-
ships):
SGL Carbon SE (supervisory board chairman)
HeidelbergCement AG (supervisory board member)
Infineon Technologies AG (supervisory board chairman until
February 11, 2010)
Anke Schäferkordt, Cologne, Germany (since December 17, 2010)
Chief Executive Officer, Mediengruppe RTL Deutschland
and RTL Television
Supervisory board memberships (excluding internal memberships):
Software AG (supervisory board member)
Denise Schellemans, Kalmthout, Belgium
Full-time trade union delegate
Ralf Sikorski, Wiesbaden, Germany
Regional manager of the Rhineland-Palatinate/Saarland branch of
the Mining, Chemical and Energy Industries Union
Supervisory board memberships (excluding internal memberships):
Villeroy & Boch AG (supervisory board member)
Villeroy & Boch Fliesen GmbH (supervisory board member)
Evonik Power Saar GmbH (supervisory board deputy chairman)
Evonik New Energies GmbH (supervisory board deputy chairman)
Michael Vassiliadis, Hanover, Germany
Chairman of the Central Board of Executive Directors of the
Mining, Chemical and Energy Industries Union
Supervisory board memberships (excluding internal memberships):
K+S AG (supervisory board deputy chairman)
Henkel KGaA (supervisory board member)
Evonik Steag GmbH (supervisory board deputy chairman)
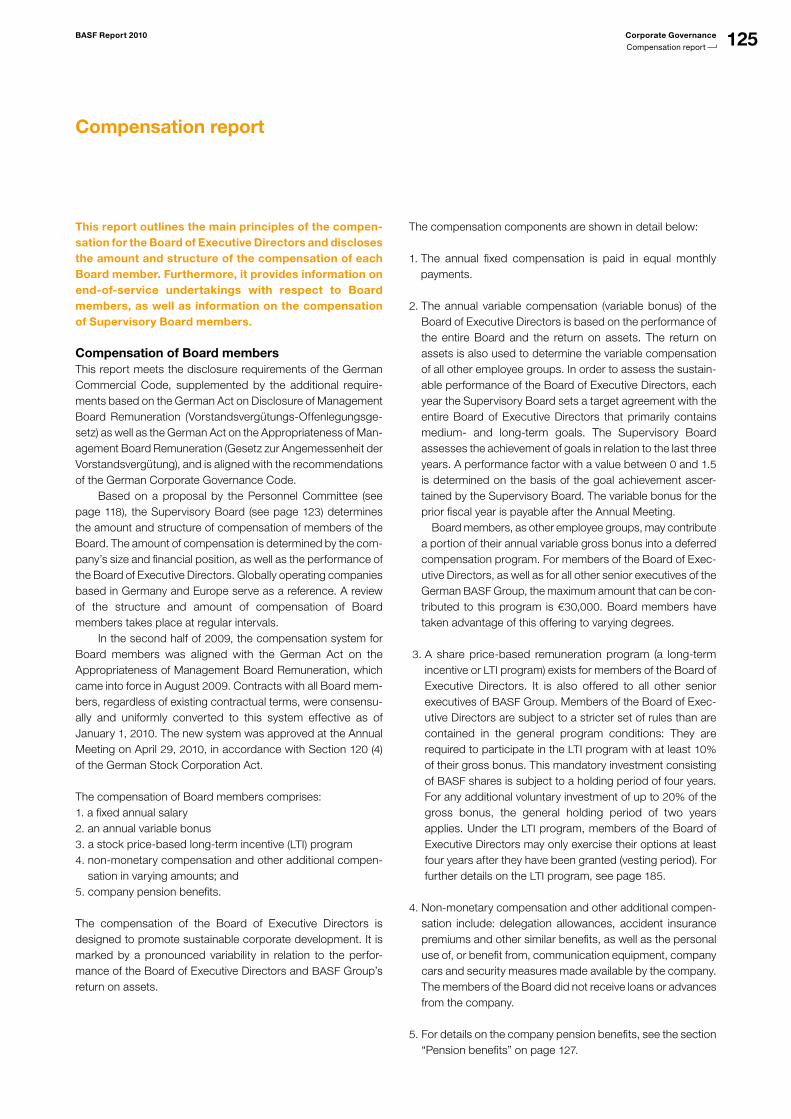
125BASF Report 2010 Corporate Governance
Compensation report
Compensation report
This report outlines the main principles of the compen-sation for the Board of Executive Directors and discloses the amount and structure of the compensation of each Board member. Furthermore, it provides information on end-of-service undertakings with respect to Board members, as well as information on the compensation of Supervisory Board members.
Compensation of Board membersThis report meets the disclosure requirements of the German Commercial Code, supplemented by the additional require-ments based on the German Act on Disclosure of Management Board Remuneration (Vorstandsvergütungs-Offenlegungsge-setz) as well as the German Act on the Appropriateness of Man-agement Board Remuneration (Gesetz zur Angemessenheit der Vorstandsvergütung), and is aligned with the recommendations of the German Corporate Governance Code. Based on a proposal by the Personnel Committee (see page 118), the Supervisory Board (see page 123) determines the amount and structure of compensation of members of the Board. The amount of compensation is determined by the com-pany’s size and financial position, as well as the performance of the Board of Executive Directors. Globally operating companies based in Germany and Europe serve as a reference. A review of the structure and amount of compensation of Board members takes place at regular intervals. In the second half of 2009, the compensation system for Board members was aligned with the German Act on the Appropriateness of Management Board Remuneration, which came into force in August 2009. Contracts with all Board mem-bers, regardless of existing contractual terms, were consensu-ally and uniformly converted to this system effective as of January 1, 2010. The new system was approved at the Annual Meeting on April 29, 2010, in accordance with Section 120 (4) of the German Stock Corporation Act.
The compensation of Board members comprises:1. a fixed annual salary 2. an annual variable bonus 3. a stock price-based long-term incentive (LTI) program 4. non-monetary compensation and other additional compen-
sation in varying amounts; and 5. company pension benefits.
The compensation of the Board of Executive Directors is designed to promote sustainable corporate development. It is marked by a pronounced variability in relation to the perfor-mance of the Board of Executive Directors and BASF Group’s return on assets.
The compensation components are shown in detail below:
1. The annual fixed compensation is paid in equal monthly payments.
2. The annual variable compensation (variable bonus) of the Board of Executive Directors is based on the performance of the entire Board and the return on assets. The return on assets is also used to determine the variable compensation of all other employee groups. In order to assess the sustain-able performance of the Board of Executive Directors, each year the Supervisory Board sets a target agreement with the entire Board of Executive Directors that primarily contains medium- and long-term goals. The Supervisory Board assesses the achievement of goals in relation to the last three years. A performance factor with a value between 0 and 1.5 is determined on the basis of the goal achievement ascer-tained by the Supervisory Board. The variable bonus for the prior fiscal year is payable after the Annual Meeting.
Board members, as other employee groups, may contribute a portion of their annual variable gross bonus into a deferred compensation program. For members of the Board of Exec-utive Directors, as well as for all other senior executives of the German BASF Group, the maximum amount that can be con-tributed to this program is €30,000. Board members have taken advantage of this offering to varying degrees.
3. A share price-based remuneration program (a long-term incentive or LTI program) exists for members of the Board of Executive Directors. It is also offered to all other senior executives of BASF Group. Members of the Board of Exec-utive Directors are subject to a stricter set of rules than are contained in the general program conditions: They are required to participate in the LTI program with at least 10% of their gross bonus. This mandatory investment consisting of BASF shares is subject to a holding period of four years. For any additional voluntary investment of up to 20% of the gross bonus, the general holding period of two years applies. Under the LTI program, members of the Board of Executive Directors may only exercise their options at least four years after they have been granted (vesting period). For further details on the LTI program, see page 185.
4. Non-monetary compensation and other additional compen-sation include: delegation allowances, accident insurance premiums and other similar benefits, as well as the personal use of, or benefit from, communication equipment, company cars and security measures made available by the company. The members of the Board did not receive loans or advances from the company.
5. For details on the company pension benefits, see the section “Pension benefits” on page 127.
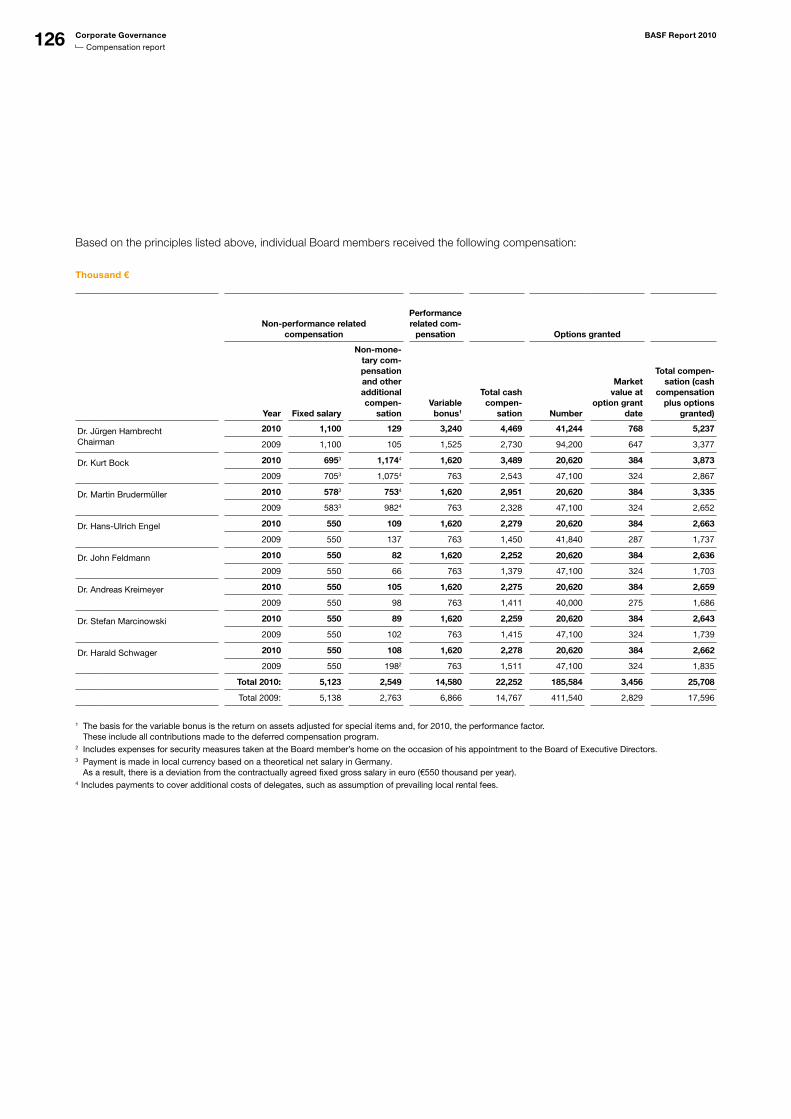
126 Corporate Governance BASF Report 2010
Compensation report
Based on the principles listed above, individual Board members received the following compensation:
Thousand €
Non-performance related compensation
Performance related com-
pensation Options granted
Year Fixed salary
Non-mone-tary com-pensation and other additional compen-
sationVariable bonus1
Total cash compen-
sation Number
Market value at
option grant date
Total compen-sation (cash
compensation plus options
granted)
Dr. Jürgen Hambrecht Chairman
2010 1,100 129 3,240 4,469 41,244 768 5,237
2009 1,100 105 1,525 2,730 94,200 647 3,377
Dr. Kurt Bock 2010 6953 1,1744 1,620 3,489 20,620 384 3,873
2009 7053 1,0754 763 2,543 47,100 324 2,867
Dr. Martin Brudermüller 2010 5783 7534 1,620 2,951 20,620 384 3,335
2009 5833 9824 763 2,328 47,100 324 2,652
Dr. HansUlrich Engel 2010 550 109 1,620 2,279 20,620 384 2,663
2009 550 137 763 1,450 41,840 287 1,737
Dr. John Feldmann 2010 550 82 1,620 2,252 20,620 384 2,636
2009 550 66 763 1,379 47,100 324 1,703
Dr. Andreas Kreimeyer 2010 550 105 1,620 2,275 20,620 384 2,659
2009 550 98 763 1,411 40,000 275 1,686
Dr. Stefan Marcinowski 2010 550 89 1,620 2,259 20,620 384 2,643
2009 550 102 763 1,415 47,100 324 1,739
Dr. Harald Schwager 2010 550 108 1,620 2,278 20,620 384 2,662
2009 550 1982 763 1,511 47,100 324 1,835
Total 2010: 5,123 2,549 14,580 22,252 185,584 3,456 25,708
Total 2009: 5,138 2,763 6,866 14,767 411,540 2,829 17,596
1 The basis for the variable bonus is the return on assets adjusted for special items and, for 2010, the performance factor. These include all contributions made to the deferred compensation program.
2 Includes expenses for security measures taken at the Board member’s home on the occasion of his appointment to the Board of Executive Directors.3 Payment is made in local currency based on a theoretical net salary in Germany.
As a result, there is a deviation from the contractually agreed fixed gross salary in euro (€550 thousand per year).4 Includes payments to cover additional costs of delegates, such as assumption of prevailing local rental fees.
127BASF Report 2010 Corporate Governance
Compensation report
The options granted led to expenses (personnel expense) in 2010. This personnel expense refers to the sum of all options from the LTI programs 2002 to 2010. It is calculated as the difference in the value of the options on December 31, 2010, compared with the value on December 31, 2009, considering the options exercised and granted in 2010. The value of the options is based primarily on the development of the BASF share price and its outperformance compared with the benchmark indices specified for the LTI programs 2002 to 2010. The rise in the personnel expense in 2010 compared with the previous year was primarily a result of a higher valuation of these option rights as of December 31, 2010. The main reasons for this were the increase in the share price at year-end (2010: €59.70; 2009: €43.46) and the share’s outperformance compared with the benchmark indices. The personnel expenses reported below are purely accounting figures which do not equate with the actual cash gains should options be exercised. The members of the Board may each decide on the timing and scope of the exercise of options of the individual years, while taking into account the general terms and conditions and ceilings of the LTI program. The personnel expenses for the year 2010 relating to all options issued were as follows: Dr. Jürgen Hambrecht €12,171 thousand (2009: €3,666 thousand); Dr. Kurt Bock €4,919 thousand (2009: €2,480 thousand); Dr. Martin Brudermüller €4,087 thousand (2009: €1,883 thousand); Dr. Hans-Ulrich Engel €3,198 thou-sand (2009: €1,918 thousand); Dr. John Feldmann €5,256 thou-sand (2009: €1,833 thousand); Dr. Andreas Kreimeyer €3,449 thousand (2009: €1,768 thousand); Dr. Stefan Marci-nowski €4,034 thousand (2009: €1,833 thousand); and Dr. Harald Schwager €3,105 thousand (2009: €901 thousand).
For more on the LTI program, see page 185 onward
The members of the Board are covered by loss liability insur-ance concluded by the company (D&O insurance) which includes a deductible.
Pension benefitsAnnual pension units are accrued for the members of the Board (“Board Performance Pension”). The method of determination of the amount of the pension benefits generally corresponds to that used for other employee groups. The method is designed such that both the performance of the company and the pro-gression of the individual Board member’s career significantly affect the pension entitlement. The annual pension benefits accruing to Board members in a given reporting year (pension unit) are composed of a fixed and a variable component. The fixed component is calculated by multiplying the annual fixed compensation above the Social Security Contribution Ceiling by 32% (contribution factor). The resulting amount is converted into a lifelong pension using actuarial factors based on an actuarial interest rate (5%), the probability of death, invalidity and mortality (Heubeck-Rich-ttafeln, 2005G) and an assumed pension increase (1.5% per annum). This is the amount that is payable upon retirement. The variable component of the pension unit depends on the return on assets in the reporting year and the performance factor, which is also decisive for the bonus. The variable component of the pension unit is based on a ROA of 12% and on a perfor-mance factor of 1.0 at which point the variable component is equal in value to the fixed component. With regard to the return on assets, there is a linear relationship between the variable component and the ROA figures between 10% and 14%. Should the return on assets exceed 14%, the variable component levels off; should the return on assets fall below 10%, the decline accelerates. With regard to the performance factor, there is a linear relationship between the variable component of the pension unit and a goal achievement of more than 50% and less than 125%. The performance factor ranges between 0 for a goal achievement of 50% or less and 1.5 for a goal achievement of 125% and more. The fixed and the variable components together result in the acquired pension unit for the reporting year. The sum of the pension units accumulated over the reporting years determines the respective Board member’s pension benefit in the event of a claim. The pension benefit takes effect at the end of service upon reaching retirement age of 60 years or disabil-ity or death. Pension payments are adjusted on an annual basis, by at least 1% annually, in accordance with changes in the German consumer price index.
128 Corporate Governance BASF Report 2010
Compensation report
The pension units also include survivor benefits. Upon the death of an active or former member of the Board, the surviving spouse receives a survivor pension amounting to 60% of the Board member’s pension entitlement. The orphan pension amounts to 10% for each half-orphan, 33% for an orphan, 25% each for two orphans and 20% each for three or more orphans of the pension entitlement of the deceased (former) Board member. The survivor benefits may not exceed 75% of the Board member’s total pension entitlement. If the survivor pensions exceed the upper limit, they will be proportionately reduced. Board members are members of the BASF Pensionskasse VVaG, as are generally all employees of BASF SE. Contributions and benefits are determined by the Statutes of the BASF Pen-sionskasse VVaG and the General Conditions of Insurance. The service costs attributable to 2010 include costs for BASF Pensionskasse VVaG as well as for the Performance Pension and are as follows: Dr. Jürgen Hambrecht €9 thou- sand (2009: €58 thousand); Dr. Kurt Bock €430 thousand (2009: €163 thousand); Dr. Martin Brudermüller €414 thousand (2009: €136 thousand); Dr. Hans-Ulrich Engel €439 thousand (2009: €447 thousand); Dr. John Feldmann €236 thousand (2009: €228 thousand); Dr. Andreas Kreimeyer €456 thousand (2009: €209 thousand); Dr. Stefan Marcinowski €460 thousand (2009: €219 thousand); and Dr. Harald Schwager €420 thousand (2009: €175 thousand). The present value of pension benefits (defined benefit obligation) is an accounting figure for the entitlements that the Board members have accumulated in their years of service at BASF. The defined benefit obligation up to and including 2010 are as follows: Dr. Jürgen Hambrecht €14,555 thousand; Dr. Kurt Bock €7,416 thousand; Dr. Martin Brudermüller €4,884 thousand; Dr. Hans-Ulrich Engel €3,862 thousand; Dr. John Feldmann €6,883 thousand; Dr. Andreas Kreimeyer €6,899 thou-sand; Dr. Stefan Marcinowski €7,914 thousand; and Dr. Harald Schwager €3,566 thousand.
End of service benefitsIn the event that a member of the Board of Executive Directors retires from employment before the age of 60, either because his appointment was not extended or was revoked for an important reason, he is entitled to pension benefits if he has served on the Board for at least ten years or if the time needed to reach legal retirement age is less than ten years. The com-pany is entitled to offset compensation received for any other work done against pension benefits until the legal retirement age is reached. The following applies to end-of-service due to a change-of-control event: A change-of-control event, in terms of this provision, occurs when a shareholder informs BASF of a share-holding of at least 25%, or the increase of such a holding. If a Board member’s position is revoked within one year fol-lowing a change-of-control event, the Board member will receive the contractually agreed payments for the remaining contractual term of office as a one-off payment (fixed compen-sation and variable bonus based on a return of assets of 12% as well as target achievement of 100%). Furthermore, the Board member may receive the fair value of the option rights acquired in connection with the LTI program within a period of three months or may continue to hold the existing rights under the terms of the program. For the determination of the accrued pen-sion benefits from the “Board Performance Pension,” the time up to the regular expiry of office is taken into consideration. There is a general limit on severance pay (severance payment cap) for all Board members. Accordingly, payments made to a Board member upon premature termination of their contract, without serious cause, may not exceed the value of two years’ compensation nor compensate more than the remaining term of the contract. The severance payment cap is to be calculated on the basis of the total compensation for the past full financial year and, if appropriate, also the expected total compensation for the current financial year. If membership of the Board of Executive Directors is terminated prematurely as the result of a “Change of Control,” the payments may not exceed 150% of the severance compensation cap.
129BASF Report 2010 Corporate Governance
Compensation report
Former Board membersTotal compensation for previous Board members and their sur-viving dependents amounted to €13.2 million in 2010 (2009: €12.3 million). This figure also contains payments that previous Board members have themselves financed through the deferred compensation program and personnel expense for the year 2010 relating to options that previous members of the Board still hold from the time of their active service period. The continua-tion of the options that have not yet been exercised at the time of retirement, along with the continuation of the associated hold-ing period for individual investment in BASF shares under the conditions of the program, is intended in order to particularly emphasize how sustainability is incorporated into the compen-sation for the Board members. Pension provisions for previous Board members and their surviving dependents amounted to €95.4 million (2009: €87.9 million).
Compensation of Supervisory Board membersThe disclosure of compensation of the Supervisory Board is based on the German Commercial Code and is aligned with the recommendations of the German Corporate Governance Code. The compensation of the Supervisory Board is regulated by the Articles of Association of BASF SE passed by the Annual Meeting. Each member of the Supervisory Board receives an annual fixed compensation of €60,000 and a performance-oriented variable compensation for each full €0.01 by which the earnings per share of the BASF Group, as declared in the BASF Group Consolidated Financial Statements for the year for which the remuneration is paid, exceeds the minimum earnings per share. The minimum earnings per share figure for the year 2010 is €1.45. The performance-oriented variable remuneration is €800 for each full €0.01 of earnings per share up to an earnings per share of €2.20, €600 for each further €0.01 of earnings per share up to an earnings per share of €2.70, and €400 for each €0.01 beyond this. The performance-oriented variable remuneration is limited to a maximum amount of €120,000. The minimum earnings per share and the corresponding thresholds shall increase by €0.05 for each subsequent financial year. Based on the earnings per share of €4.96 published in the BASF Group Consolidated Statements 2010, the performance-oriented compensation reached the maximum amount of €120,000. The chairman of the Supervisory Board receives two-and-a-half times and a deputy chairman one-and-a-half times the compensation of an ordinary member. Members of the Supervisory Board who are members of a committee, except for the Nomination Committee, shall receive a further fixed compensation for this purpose in the amount of €12,500. For the Audit Committee, the further fixed compensa-tion shall be €25,000. The chairman of a committee shall receive twice and a deputy chairman one-and-a-half times the further fixed compensation. The company reimburses members of the Supervisory Board for out-of-pocket expenses and value-added tax to be paid with regard to their activities as members of the Supervi-sory Board or of a committee. The company further grants the members of the Supervisory Board a fee of €500 for attending a meeting of the Supervisory Board or one of its committees to which they belong and includes the performance of the duties of the members of the Supervisory Board in the cover of a loss liability insurance concluded by it (D&O insurance), which includes a deductible.
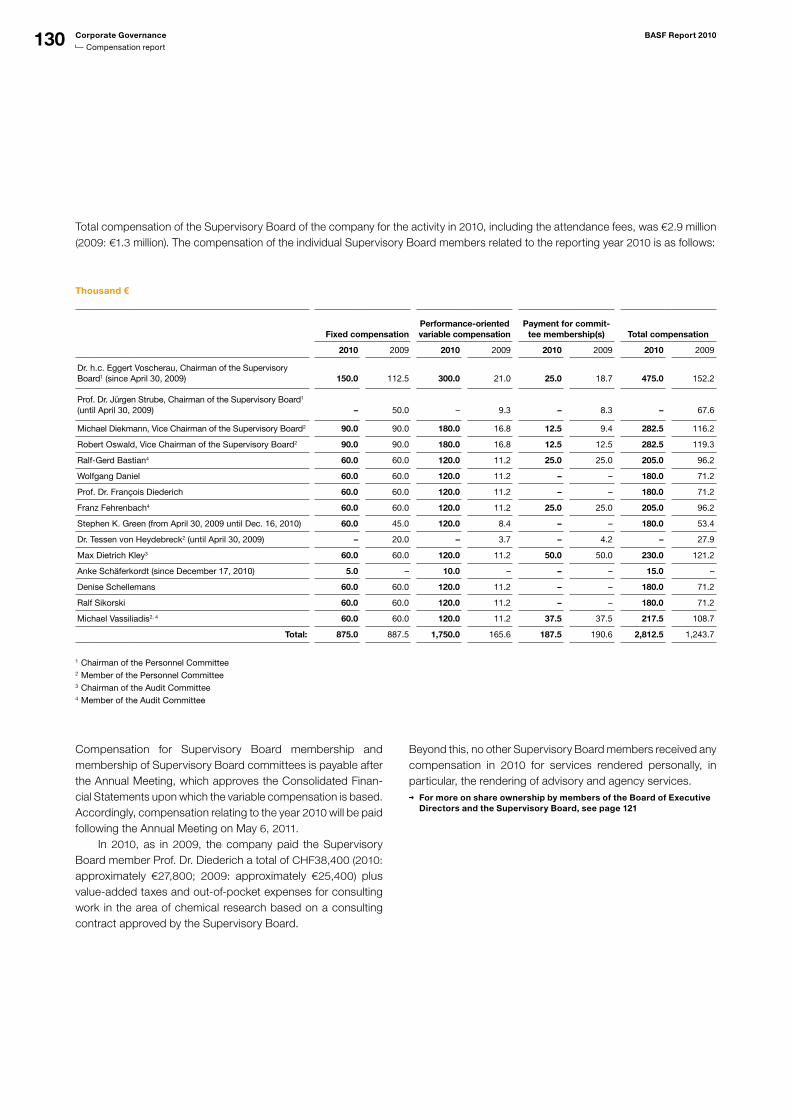
130 Corporate Governance BASF Report 2010
Compensation report
Thousand €
Fixed compensationPerformance-oriented variable compensation
Payment for commit-tee membership(s) Total compensation
2010 2009 2010 2009 2010 2009 2010 2009
Dr. h.c. Eggert Voscherau, Chairman of the Supervisory Board1 (since April 30, 2009)
150.0
112.5
300.0
21.0
25.0
18.7
475.0
152.2
Prof. Dr. Jürgen Strube, Chairman of the Supervisory Board1 (until April 30, 2009)
–
50.0
–
9.3
–
8.3
–
67.6
Michael Diekmann, Vice Chairman of the Supervisory Board2 90.0 90.0 180.0 16.8 12.5 9.4 282.5 116.2
Robert Oswald, Vice Chairman of the Supervisory Board2 90.0 90.0 180.0 16.8 12.5 12.5 282.5 119.3
RalfGerd Bastian4 60.0 60.0 120.0 11.2 25.0 25.0 205.0 96.2
Wolfgang Daniel 60.0 60.0 120.0 11.2 – – 180.0 71.2
Prof. Dr. François Diederich 60.0 60.0 120.0 11.2 – – 180.0 71.2
Franz Fehrenbach4 60.0 60.0 120.0 11.2 25.0 25.0 205.0 96.2
Stephen K. Green (from April 30, 2009 until Dec. 16, 2010) 60.0 45.0 120.0 8.4 – – 180.0 53.4
Dr. Tessen von Heydebreck2 (until April 30, 2009) – 20.0 – 3.7 – 4.2 – 27.9
Max Dietrich Kley3 60.0 60.0 120.0 11.2 50.0 50.0 230.0 121.2
Anke Schäferkordt (since December 17, 2010) 5.0 – 10.0 – – – 15.0 –
Denise Schellemans 60.0 60.0 120.0 11.2 – – 180.0 71.2
Ralf Sikorski 60.0 60.0 120.0 11.2 – – 180.0 71.2
Michael Vassiliadis2, 4 60.0 60.0 120.0 11.2 37.5 37.5 217.5 108.7
Total: 875.0 887.5 1,750.0 165.6 187.5 190.6 2,812.5 1,243.7
1 Chairman of the Personnel Committee 2 Member of the Personnel Committee 3 Chairman of the Audit Committee 4 Member of the Audit Committee
Compensation for Supervisory Board membership and membership of Supervisory Board committees is payable after the Annual Meeting, which approves the Consolidated Finan-cial Statements upon which the variable compensation is based. Accordingly, compensation relating to the year 2010 will be paid following the Annual Meeting on May 6, 2011.
In 2010, as in 2009, the company paid the Supervisory Board member Prof. Dr. Diederich a total of CHF38,400 (2010: approximately €27,800; 2009: approximately €25,400) plus value-added taxes and out-of-pocket expenses for consulting work in the area of chemical research based on a consulting contract approved by the Supervisory Board.
Total compensation of the Supervisory Board of the company for the activity in 2010, including the attendance fees, was €2.9 million (2009: €1.3 million). The compensation of the individual Supervisory Board members related to the reporting year 2010 is as follows:
Beyond this, no other Supervisory Board members received any compensation in 2010 for services rendered personally, in particular, the rendering of advisory and agency services.
For more on share ownership by members of the Board of Executive Directors and the Supervisory Board, see page 121
131BASF Report 2010 Corporate Governance
Report of the Supervisory Board
Dear Shareholders,
Following a difficult year in 2009, we experienced an unexpect-edly fast and strong economic recovery in 2010. This upturn is also reflected in BASF’s performance, with new records for sales and earnings. This would not have been possible without the impressive work of the Board of Executive Directors and employees and the strategic decisions taken in recent years – they have made BASF robust. The company has the right strat-egy comprising a broad range of business areas and its future-oriented focus on fast-growing, innovative chemicals markets. The Supervisory Board wants to make an important con-tribution to BASF’s continued successful development by deciding on the future composition of the Board of Executive Directors. In May 2010, we decided to appoint Dr. Kurt Bock as Chairman of the Board and Dr. Martin Brudermüller as Vice Chairman. Margret Suckale and Michael Heinz were appointed as members of the Board in October 2010. This ensures BASF will continue to have a very good team to write the next chap-ter in its success story.
Monitoring and consultation in an ongoing dialogue with the Board of Executive DirectorsIn 2010, the Supervisory Board of BASF SE exercised its duties required by law and the Statutes with the utmost care. We regularly monitored the management of the Board of Executive Directors and provided advice on the company’s strategic development and important individual measures. To this end, the Supervisory Board requested detailed information from the Board of Executive Directors at six meetings, in the form of written and verbal reports. The topics included: business policies and the business situation as well as the company’s perfor-mance, profitability, and planning with regard to finances, cap-ital expenditures and human resources at BASF SE and its major subsidiaries. Deviations of business performance from the planning were also included in the information. The Super-visory Board discussed in detail the reports from the Board of Executive Directors and also discussed prospects for the com-pany as a whole and its individual business areas with the Board of Executive Directors. The Chairman of the Supervisory Board also regularly requested information from the Chairman of the Board of Executive Directors with regard to current business developments and important events outside of Supervisory Board meetings. The Supervisory Board was always involved at an early stage in decisions of major importance. The Supervisory Board discussed and voted on all of those individual measures taken by the Board of Executive Directors, which by law or the Statutes required the approval of the Supervisory Board. The members of the Supervisory Board elected by sharehol-ders and those elected by the employees prepared for the meetings in separate preliminary discussions. With the exception
of two meetings where one of the 12 members was absent, all members were present at all Supervisory Board meetings in 2010. In all of its meetings, the Supervisory Board discussed the further development of the BASF Group’s business activities through acquisitions, divestitures and investment projects and advised the Board of Executive Directors on these significant questions impacting the future of the company. The major topics of discussion were the acquisition of Cognis and the plan to bring BASF’s worldwide activities in the Styrenics business unit into a joint venture with Ineos. We discussed both of these projects at every Supervisory Board meeting in 2010. Another focus of our monitoring activities was once again the oil and gas business. At the meeting on July 22, 2010, following the sinking of BP’s oil drilling rig Deepwater Horizon in the Gulf of Mexico, we intensively discussed risk management and risk standards related to oil and gas exploration at Wintershall, which bundles BASF’s oil and gas business. At the meeting on October 21, 2010, we received a comprehensive briefing on the upcoming changes to the German Renewable Energy Sources Act (EEG) and the German Electricity Tax Act as well as the potential additional impact of these for BASF as a company with energy-intensive production. At the meeting on December 16, 2010, we discussed and approved the Board of Executive Directors’ operative and financial planning for the year 2011. Furthermore, we empowered the Board of Executive Directors to procure financing under certain conditions. Personnel issues were particularly significant in 2010. At the meeting on May 31, 2010, the Supervisory Board named Dr. Kurt Bock as Chairman of the Board of Executive Directors, effective as of the close of the Annual Meeting on May 6, 2011. He succeeds Dr. Jürgen Hambrecht, who retires from the Board of Executive Directors on this date. The Supervisory Board also named Dr. Martin Brudermüller as Vice Chairman of the Board of Executive Directors, effective May 6, 2011. To ensure the long-term effectiveness of these decisions, it was mutually agreed to shorten the current appointments of Dr. Bock and Dr. Bruder-müller, which were set to expire at the Annual Meeting 2012 and Annual Meeting 2013, respectively. These appointments were terminated effective as of the close of the Annual Meeting on May 6, 2011, and the Supervisory Board reappointed these two Board members to new terms as of May 6, 2011, which expire at the close of the Annual Meeting 2016. At the meeting on October 21, 2010, we appointed Margret Suckale and Michael Heinz as members of the Board of Executive Directors, effec-tive as of the close of the Annual Meeting on May 6, 2011, until the Annual Meeting 2014. Ms. Suckale was also named Indus-trial Relations Director of BASF SE. At the meeting on Decem-ber 16, 2010, we extended the appointments of Board mem-bers Dr. Hans-Ulrich Engel and Dr. Harald Schwager until the Annual Meeting 2016.
Report of the Supervisory Board
132 Corporate Governance BASF Report 2010
Report of the Supervisory Board
CommitteesBASF SE’s Supervisory Board has established a total of three committees: the committee for personnel affairs of the Board of Executive Directors as well as the granting of loans in accor-dance with Section 89 (4) of the German Stock Corporation Act (Personnel Committee), the Audit Committee and the Nomina-tion Committee. The Supervisory Board received regular reports on the activities of these committees. The Personnel Committee comprises Supervisory Board Chairman Dr. h.c. Eggert Voscherau (chairman), Supervisory Board Deputy Chairmen Michael Diekmann and Robert Oswald, as well as Supervisory Board member Michael Vassiliadis. The Personnel Committee met five times in 2010. At its meetings, sometimes with the Chairman of the Board of Executive Direc-tors, it discussed in particular in detail the long-term succession planning for the Board of Executive Directors as well as the com-pensation of the Board of Executive Directors and the contents of employment contracts for the members of the Board of Executive Directors. The necessary new appointments to the Board of Executive Directors were the main topic of the discus-sions of the Personnel Committee. The Supervisory Board adopted the proposals recommended by the Personnel Com-mittee at its meetings on May 31, October 21, and December 16, 2010. Furthermore, the Committee discussed and made recommendations to the Supervisory Board regarding the pro-cess of creating target agreements between the Supervisory Board and members of the Board of Executive Directors, the target agreements for the period 2010-2012 and the achieve-ment of targets in 2010. The Audit Committee consists of Supervisory Board mem-bers Max Dietrich Kley, Ralf Gerd Bastian, Franz Fehrenbach and Michael Vassiliadis. The Chairman of the Audit Committee is Max Dietrich Kley, who has also been appointed “Audit Com-mittee Financial Expert.” The Audit Committee is responsible for all the tasks of an audit committee listed in Section 107 Para-graph (3) Sentence 2 of the German Stock Corporation Act and in subsection 5.3.2 of the German Corporate Governance Code from May 26, 2010. The Audit Committee met five times in 2010. The core duties were to review the Financial Statements 2009 of BASF SE as well as the Consolidated Financial Statements 2009 and to discuss the quarterly and first-half financial reports with the Board of Executive Directors prior to their publication. Other important activities included advising the Board of Exec-utive Directors on accounting issues as well as discussing and defining the focus of the annual audit. The business relations with the auditor were regulated with the adoption of a resolution regarding the provision of non-audit services by the auditor. The committee also reached an agreement with the auditor on the auditing fees and continuously monitored the auditor’s indepen-dence. In one of its meetings, the Audit Committee dealt inten-sively with the topic of compliance in the BASF Group following a report from the Chief Compliance Officer. The members of the Nomination Committee are exclusively the members of the Supervisory Board elected at the Annual Meeting. These are Dr. h.c. Eggert Voscherau, Prof. Dr. Fran-çois Diederich, Michael Diekmann, Franz Fehrenbach, Stephen K. Green (until December 16, 2010) and Max Dietrich Kley. The Nomination Committee is responsible for preparing candidate proposals for the election of those Supervisory Board members
who are elected by the Annual Meeting. Following Stephen K. Green’s resignation from the Supervisory Board, the members of the Nomination Committee discussed his succession and recommended that the Supervisory Board nominate Ms. Anke Schäferkordt for election to the Supervisory Board at the Annual Meeting. The Nomination Committee based its recommenda-tion on the objectives for the composition of the Supervisory Board decided by the Supervisory Board at its meeting on October 21, 2010.
Corporate governance and Declaration of conformityIn 2010, the Supervisory Board again addressed in detail the corporate governance standards applied by BASF as well as the basic conditions in Germany as to capital market and com-pany law. This mainly included the German Corporate Gover-nance Code, which was once again amended to include further recommendations related to the Supervisory Board (version dated May 26, 2010). It was discussed at the meetings on October 21, and December 16, 2010. We paid particular atten-tion to the Code’s new recommendations and decided that BASF will comply with them. The main topic of discussion was the creation of objectives for the composition of the Supervisory Board to implement the recommendation in Section 5.4.1 of the German Corporate Governance Code. We approved these at the meeting on October 21, 2010. They address the knowledge, ability and expert experience required for membership on the Supervisory Board of BASF as well as the necessity of diversity in the Supervisory Board relating to a variety of professional and international experience and, in particular, the participation of women. Furthermore, the independence of the Supervisory Board shall be ensured by the avoidance of conflicts of interest. At its meeting on December 16, 2010, the Supervisory Board approved the joint Declaration of Conformity by the Supervisory Board and the Board of Executive Directors in ac-cordance with Section 161 of the German Stock Corporation Act. Furthermore, at this meeting the Supervisory Board carried out an examination of efficiency and an assessment of indepen-dence. BASF complies with the recommendations of the Ger-man Corporate Governance Code in its version of May 26, 2010, without exception. The complete wording of the Declaration of Conformity is provided on page 134 and is also available to shareholders on BASF’s website. The compensation report containing full details on the structure and amount of the compensation for the Board of Executive Directors and the Supervisory Board, including the pension benefits of the members of the Board of Executive Directors, can be found on pages 125 to 130.
133BASF Report 2010 Corporate Governance
Report of the Supervisory Board
Annual Financial Statements of BASF SE and Consolidated Financial StatementsKPMG AG Wirtschaftsprüfungsgesellschaft, the auditor elected by the Annual Meeting for the fiscal year 2010, has audited the Financial Statements of BASF SE and the Consolidated Finan-cial Statements including Management’s Analysis under con-sideration of bookkeeping, and have approved them free of qualification. Furthermore, the auditor certified that the Board of Executive Directors had taken the measures incumbent on it under Section 91 (2) of the German Stock Corporation Act in an appropriate way. In particular, it had instituted a suitable infor-mation and monitoring system that met the needs of the com-pany and appeared suitable, both in design and the way in which it had been applied, to provide early warning of developments that pose a threat to the continued existence of the company. The documents to be examined and the auditor’s reports were sent in a timely manner to every member of the Supervi-sory Board. The auditor attended the accounts review meeting of the Audit Committee on February 23, 2011, as well as the accounts meeting of the Supervisory Board on March 3, 2011, and reported on the main findings of his audit. The auditor also provided detailed explanations of his reports on the day before the accounts meeting of the Supervisory Board. The Audit Committee reviewed the audits and Manage-ment’s Analysis at its meeting on February 23, 2011, and dis-cussed them in detail with the auditor. The Chairman of the Audit Committee gave a detailed account of the preliminary review at the Supervisory Board meeting on March 3, 2011.
On the basis of this preliminary review by the Audit Com-mittee, the Supervisory Board has examined the Financial State-ments and Management’s Analysis of BASF SE for 2010, the proposal by the Board of Executive Directors for the appropri-ation of profit as well as the Consolidated Financial Statements and Management’s Analysis for the BASF Group for 2010. We have reviewed, acknowledged and approved the auditor’s reports. The results of the preliminary review by the Audit Com-mittee and the results of our own examination fully concur with those of the audit. The Supervisory Board sees no grounds for objection to the management and submitted reports. At the Supervisory Board’s accounts meeting on March 3, 2011, we approved the Financial Statements of BASF SE and the Consolidated Financial Statements of the BASF Group pre-pared by the Board of Executive Directors, making the Finan-cial Statements final. We concur with the proposal of the Board of Executive Directors regarding the appropriation of profit and the payment of a dividend of €2.20 per share.
Composition of the Supervisory Board The Supervisory Board member Stephen K. Green, elected by the Annual Meeting on April 30, 2009, resigned from the Super-visory Board effective December 16, 2010, in order to accept an appointment as the United Kingdom’s Minister of State for Trade and Investment at the beginning of 2011. Upon request of the Chairman of the Supervisory Board, the Ludwigshafen district court, by decision of November 18, 2010, appointed Ms. Anke Schäferkordt to the Supervisory Board, effective December 17, 2010.
ThanksThe Supervisory Board thanks all employees of the BASF Group worldwide and the management of the company for the work they performed in 2010.
The Supervisory Board would like to extend special thanks to Mr. Green for his work on the board.
Ludwigshafen, March 3, 2011
The Supervisory Board
Dr. h.c. Eggert VoscherauChairman of the Supervisory Board
134 Corporate Governance BASF Report 2010
Declaration of conformity 2010
Declaration of conformity 2010of the Board of Executive Directors and the Supervisory Board of BASF SE
The Board of Executive Directors and the Supervisory Board of BASF SE hereby declare pursuant to § 161 AktG (Stock Corporation Act)
1. The recommendations of the Government Commission on the German Corporate Governance Code published by the Federal Ministry of Justice on August 5, 2009 in the official section of the electronic Federal Gazette have been complied with since the submission of the last Declaration of Conformity on December 11, 2009.
2. The recommendations of the Government Commission on the German Corporate Governance Code published by the Federal Ministry of Justice on July 2, 2010 in the official section of the electronic Federal Gazette are complied with and will be complied with.
Ludwigshafen, dated December 16, 2010
The Supervisory Board of BASF SE
The Board of Executive Directorsof BASF SE
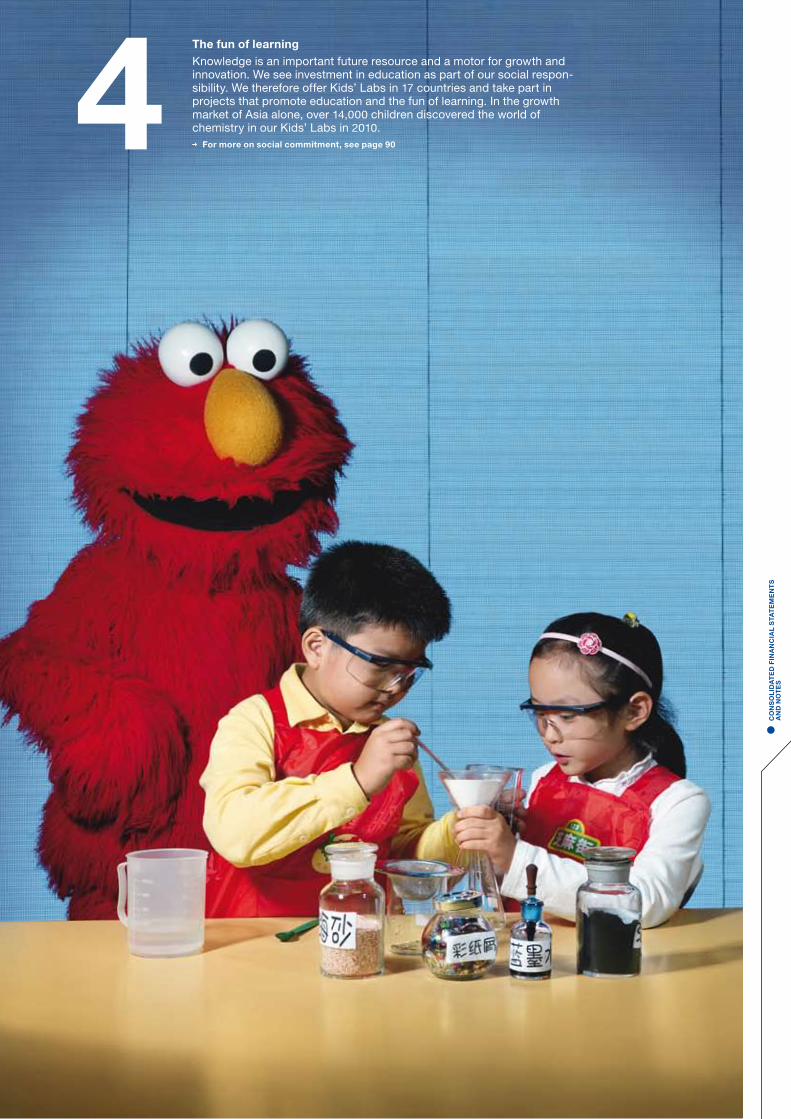
4The fun of learning
Knowledge is an important future resource and a motor for growth and innovation. We see investment in education as part of our social responsibility. We therefore offer Kids’ Labs in 17 countries and take part in projects that promote education and the fun of learning. In the growth market of Asia alone, over 14,000 children discovered the world of chemistry in our Kids’ Labs in 2010.
For more on social commitment, see page 90
• C
ON
SO
LID
AT
ED
FIN
AN
CIA
L S
TAT
EM
EN
TS
A
ND
NO
TE
S
135 Statement by the Board of Executive Directors
136 Auditor’s report
137 Consolidated statements of income
138 Consolidated statements of recognized income and expense
139 Consolidated balance sheets
140 Consolidated statements of cash flows
141 Consolidated statements of stockholders’ equity
142 Consolidated Financial Statements and Notes142 Summary of accounting policies
150 Scope of consolidation
157 Earnings per share
157 Reporting by segment and region
160 Other operating income
161 Other operating expenses
162 Financial result
163 Income taxes
165 Minority interests
165 Other information
166 Consolidated statements of cash flows and capital structure management
167 Intangible assets
170 Property, plant and equipment
172 Investments accounted for using the equity method and other financial assets
173 Inventories
173 Receivables and miscellaneous assets
175 Capital and reserves
175 Retained earnings and other comprehensive income
176 Minority interests
176 Provisions for pensions and similar obligations
180 Other provisions
181 Liabilities
183 Contingent liabilities and other financial obligations
184 Risks from litigation and claims
185 Stock price-based compensation program and BASF incentive share program
187 Financial risks and derivative financial instruments
192 Leasing
193 Compensation for the Board of Executive Directors and Supervisory Board of BASF SE
193 Related party transactions
194 Services provided by the external auditor
194 List of Shares Held
Consolidated Financial Statements and Notes
135BASF Report 2010 Consolidated Financial Statements
Statement by the Board of Executive Directors
Consolidated Financial StatementsBASF Group
The Board of Executive Directors of BASF SE is responsible for preparing the Consolidated Financial Statements and Manage-ment’s Analysis of the BASF Group. The Consolidated Financial Statements 2010 were pre-pared according to the International Financial Reporting Standards (IFRS), which are published by the International Accounting Standards Board (IASB), London, and have been endorsed by the European Union. In order to ensure the adherence of the Consolidated Financial Statements of the BASF Group and Management’s Analysis to the applicable accounting rules, and the accuracy of reporting, we have established effective internal control systems. The adherence to uniform, Group-wide accounting and reporting standards, and the reliability and effectiveness of our control systems are continually audited throughout the Group by our internal audit department. The risk management system we have set up is designed to identify material risks in a timely manner, thus enabling the Board of Executive Directors to take appropriate defensive measures as required.
To the best of our knowledge, and in accordance with the applicable reporting principles, the Consolidated Financial Statements of the BASF Group give a true and fair view of the assets, liabilities, financial position and profit situation of the Group, and the Management’s Analysis includes a fair review of the development and performance of the business and the position of the Group, together with a description of the princi-pal opportunities and risks associated with the expected development of the Group. KPMG AG Wirtschaftsprüfungsgesellschaft has audited the Consolidated Financial Statements of the BASF Group and Management’s Analysis and approved them free of qualifica-tion. The Consolidated Financial Statements of the BASF Group, the Management’s Analysis and the auditors’ report were examined at length by the Audit Committee of the Supervisory Board in the presence of the auditors at its meeting on Febru-ary 23, 2011. For the results of the Supervisory Board’s exami-nation, please refer to the Report of the Supervisory Board.
Ludwigshafen, February 23, 2011
DR. JüRGEN HAMBRECHTChairman of the Board of Executive Directors
DR. MARTIN BRUDERMüLLER
DR. JOHN FELDMANN
DR. STEFAN MARCINOWSKI
DR. KURT BOCKChief Financial Officer
DR. HANS-ULRICH ENGEL
DR. ANDREAS KREIMEYER
DR. HARALD SCHWAGER
Statement by the Board of Executive Directors and assurance pursuant to Section 297(2), Section 315(1) German Commercial Code
136 Consolidated Financial Statements BASF Report 2010
Auditor’s report
We have audited the Consolidated Financial Statements pre-pared by the BASF SE, Ludwigshafen am Rhein, Germany, com-prising the income statement, the balance sheet, statement of recognized income and expense, cash flow statement, the development in stockholders’ equity and the Notes to the Consolidated Financial Statements, together with the Manage-ment’s Analysis for the business year from January 1 to Decem-ber 31, 2010. The preparation of the Consolidated Financial Statements and Management’s Analysis in accordance with IFRSs as adopted by the E.U., and the additional requirements of German commercial law pursuant to § 315a Abs. [paragraph] 1 HGB [Handelsgesetzbuch “German Commercial Code”] are the responsibility of the parent company’s management. Our responsibility is to express an opinion on the Consolidated Financial Statements and on the Management’s Analysis based on our audit. In addition, we have been instructed to express an opinion as to whether the Consolidated Financial Statements comply with full IFRS.
We conducted our audit of the Consolidated Financial Statements in accordance with § 317 German Commercial Code and German generally accepted standards for the audit of finan-cial statements promulgated by the Institut der Wirtschaftsprüfer [Institute of Public Auditors in Germany] (IDW). Those standards require that we plan and perform the audit such that misstatements materially affecting the presentation of the net assets, financial position and results of operations in the Consolidated Financial Statements in accordance with the applicable financial reporting framework and in the Manage-
ment’s Analysis are detected with reasonable assurance. Knowledge of the business activities and the economic and legal environment of the Group and expectations as to pos-sible misstatements are taken into account in the determination of audit procedures. The effectiveness of the accounting-related internal control system and the evidence supporting the disclo-sures in the Consolidated Financial Statements and Manage-ment’s Analysis are examined primarily on a test basis within the framework of the audit. The audit includes assessing the annual financial statements of those entities included in consolidation, the determination of entities to be included in consolidation, the accounting and consolidation principles used and significant estimates made by management, as well as evaluating the over-all presentation of the Consolidated Financial Statements and Management’s Analysis. We believe that our audit provides a reasonable basis for our opinion. Our audit has not led to any reservations. In our opinion, based on the findings of our audit, the Consolidated Financial Statements comply with IFRSs as adopted by the E.U., the additional requirements of German commercial law pursuant to § 315a Abs. 1 HGB and full IFRS and give a true and fair view of the net assets, financial position and results of operations of the Group in accordance with these requirements. The Management’s Analysis is consistent with the Consolidated Financial Statements and as a whole provides a suitable view of the Group’s position and suitably presents the opportunities and risks of future development.
Auditor’s report
Frankfurt am Main, February 23, 2011
KPMG AGWirtschaftsprüfungsgesellschaft
PROF. DR. JOACHIM SCHINDLER Wirtschaftsprüfer
HANS-DIETER KRAUSSWirtschaftsprüfer
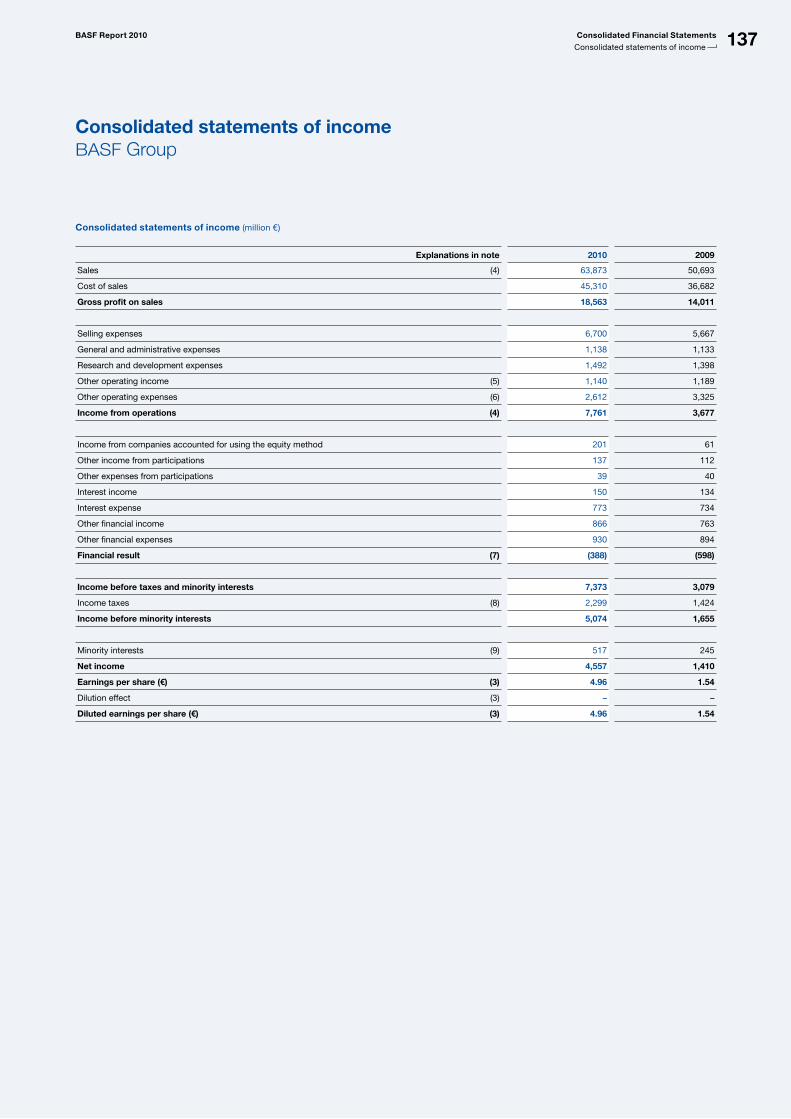
137BASF Report 2010 Consolidated Financial Statements
Consolidated statements of income
Consolidated statements of income (million €)
Explanations in note 2010 2009
Sales (4) 63,873 50,693
Cost of sales 45,310 36,682
Gross profit on sales 18,563 14,011
Selling expenses 6,700 5,667
General and administrative expenses 1,138 1,133
Research and development expenses 1,492 1,398
Other operating income (5) 1,140 1,189
Other operating expenses (6) 2,612 3,325
Income from operations (4) 7,761 3,677
Income from companies accounted for using the equity method 201 61
Other income from participations 137 112
Other expenses from participations 39 40
Interest income 150 134
Interest expense 773 734
Other financial income 866 763
Other financial expenses 930 894
Financial result (7) (388) (598)
Income before taxes and minority interests 7,373 3,079
Income taxes (8) 2,299 1,424
Income before minority interests 5,074 1,655
Minority interests (9) 517 245
Net income 4,557 1,410
Earnings per share (€) (3) 4.96 1.54
Dilution effect (3) – –
Diluted earnings per share (€) (3) 4.96 1.54
Consolidated statements of incomeBASF Group
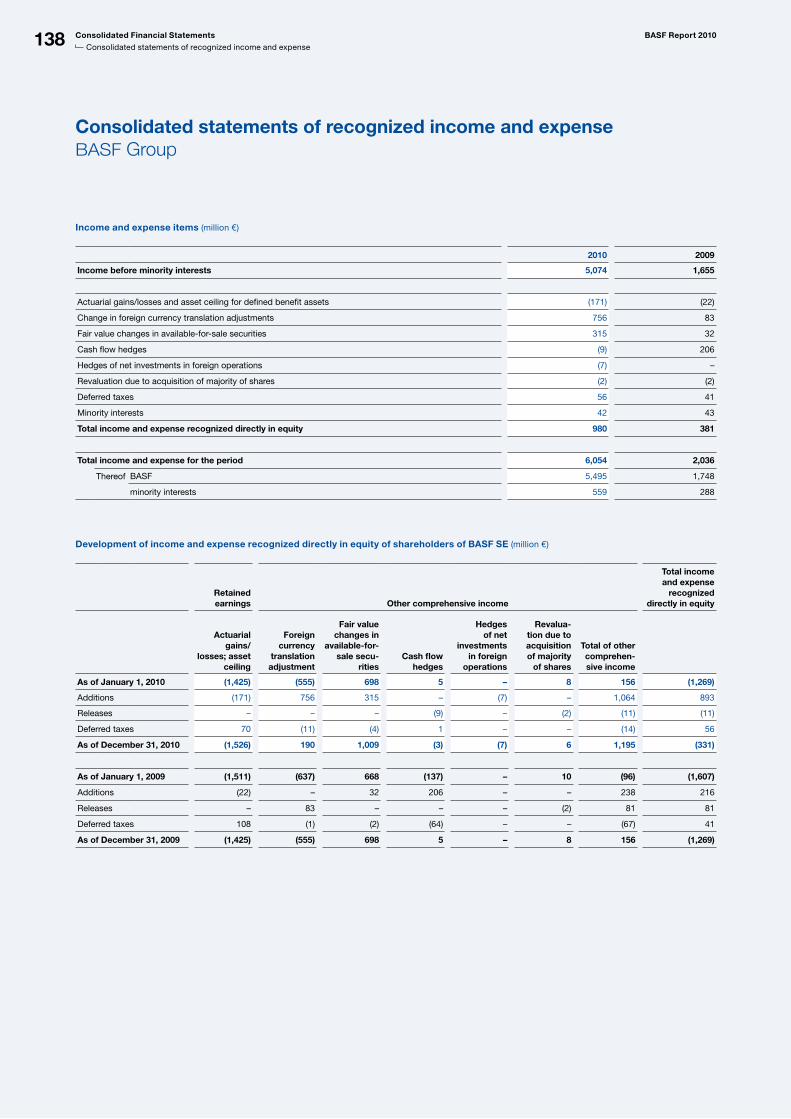
138 Consolidated Financial Statements BASF Report 2010
Consolidated statements of recognized income and expense
Consolidated statements of recognized income and expenseBASF Group
Income and expense items (million €)
2010 2009
Income before minority interests 5,074 1,655
Actuarial gains/losses and asset ceiling for defined benefit assets (171) (22)
Change in foreign currency translation adjustments 756 83
Fair value changes in availableforsale securities 315 32
Cash flow hedges (9) 206
Hedges of net investments in foreign operations (7) –
Revaluation due to acquisition of majority of shares (2) (2)
Deferred taxes 56 41
Minority interests 42 43
Total income and expense recognized directly in equity 980 381
Total income and expense for the period 6,054 2,036
Thereof BASF 5,495 1,748
minority interests 559 288
Development of income and expense recognized directly in equity of shareholders of BASF SE (million €)
Retained earnings Other comprehensive income
Total income and expense
recognized directly in equity
Actuarial
gains/ losses; asset
ceiling
Foreign currency
translation adjustment
Fair value changes in
available-for- sale secu-
ritiesCash flow
hedges
Hedges of net
investments in foreign
operations
Revalua-tion due to acquisition of majority
of shares
Total of other comprehen-sive income
As of January 1, 2010 (1,425) (555) 698 5 – 8 156 (1,269)
Additions (171) 756 315 – (7) – 1,064 893
Releases – – – (9) – (2) (11) (11)
Deferred taxes 70 (11) (4) 1 – – (14) 56
As of December 31, 2010 (1,526) 190 1,009 (3) (7) 6 1,195 (331)
As of January 1, 2009 (1,511) (637) 668 (137) – 10 (96) (1,607)
Additions (22) – 32 206 – – 238 216
Releases – 83 – – – (2) 81 81
Deferred taxes 108 (1) (2) (64) – – (67) 41
As of December 31, 2009 (1,425) (555) 698 5 – 8 156 (1,269)
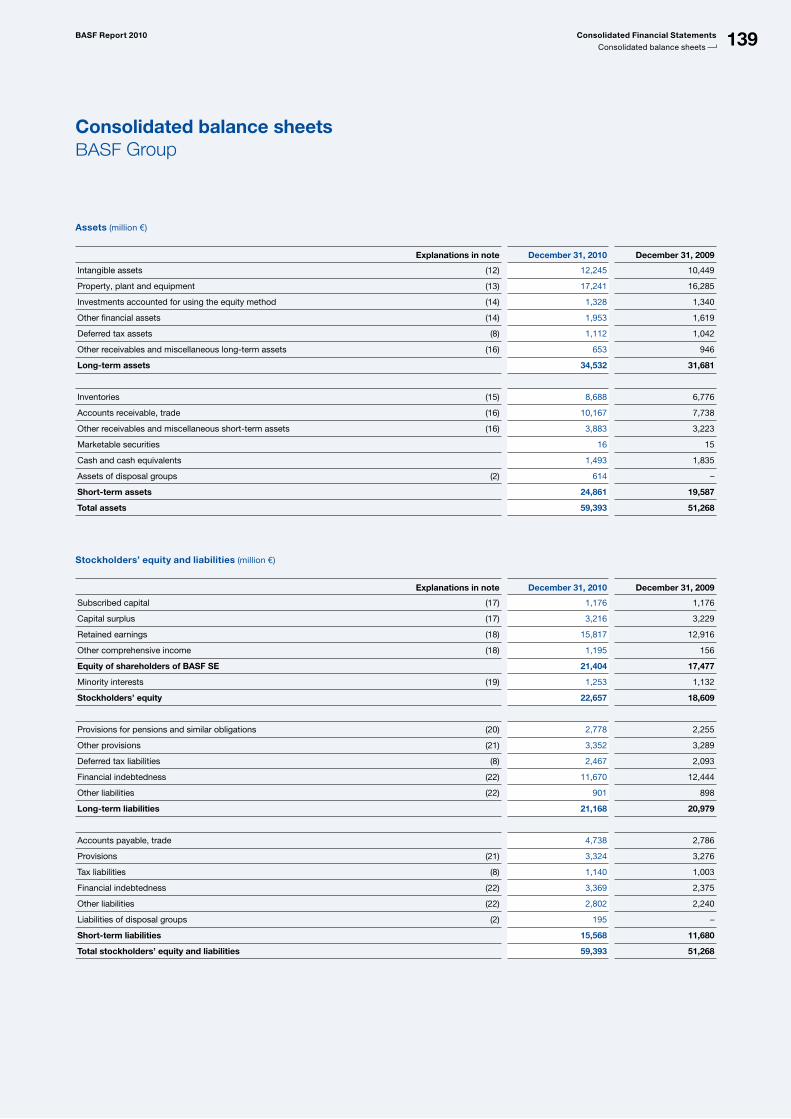
139BASF Report 2010 Consolidated Financial Statements
Consolidated balance sheets
Consolidated balance sheetsBASF Group
Assets (million €)
Explanations in note December 31, 2010 December 31, 2009
Intangible assets (12) 12,245 10,449
Property, plant and equipment (13) 17,241 16,285
Investments accounted for using the equity method (14) 1,328 1,340
Other financial assets (14) 1,953 1,619
Deferred tax assets (8) 1,112 1,042
Other receivables and miscellaneous longterm assets (16) 653 946
Long-term assets 34,532 31,681
Inventories (15) 8,688 6,776
Accounts receivable, trade (16) 10,167 7,738
Other receivables and miscellaneous shortterm assets (16) 3,883 3,223
Marketable securities 16 15
Cash and cash equivalents 1,493 1,835
Assets of disposal groups (2) 614 –
Short-term assets 24,861 19,587
Total assets 59,393 51,268
Stockholders’ equity and liabilities (million €)
Explanations in note December 31, 2010 December 31, 2009
Subscribed capital (17) 1,176 1,176
Capital surplus (17) 3,216 3,229
Retained earnings (18) 15,817 12,916
Other comprehensive income (18) 1,195 156
Equity of shareholders of BASF SE 21,404 17,477
Minority interests (19) 1,253 1,132
Stockholders’ equity 22,657 18,609
Provisions for pensions and similar obligations (20) 2,778 2,255
Other provisions (21) 3,352 3,289
Deferred tax liabilities (8) 2,467 2,093
Financial indebtedness (22) 11,670 12,444
Other liabilities (22) 901 898
Long-term liabilities 21,168 20,979
Accounts payable, trade 4,738 2,786
Provisions (21) 3,324 3,276
Tax liabilities (8) 1,140 1,003
Financial indebtedness (22) 3,369 2,375
Other liabilities (22) 2,802 2,240
Liabilities of disposal groups (2) 195 –
Short-term liabilities 15,568 11,680
Total stockholders’ equity and liabilities 59,393 51,268
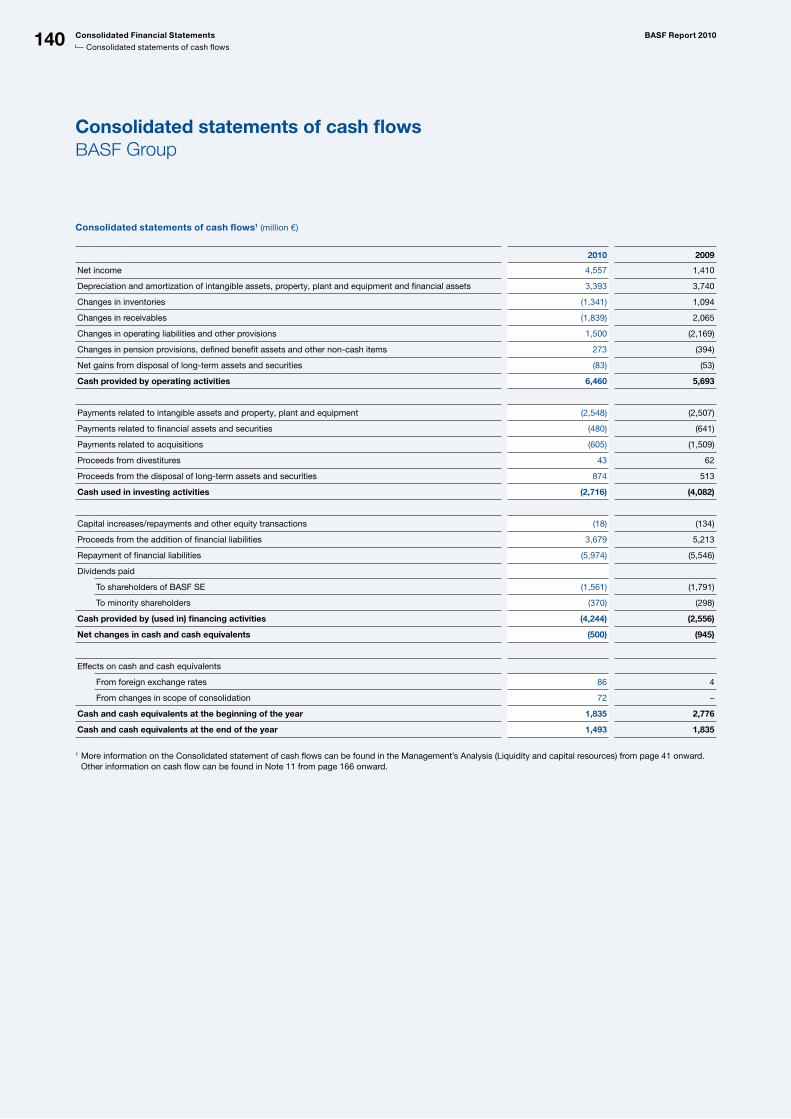
140 Consolidated Financial Statements BASF Report 2010
Consolidated statements of cash flows
Consolidated statements of cash flowsBASF Group
Consolidated statements of cash flows1 (million €)
2010 2009
Net income 4,557 1,410
Depreciation and amortization of intangible assets, property, plant and equipment and financial assets 3,393 3,740
Changes in inventories (1,341) 1,094
Changes in receivables (1,839) 2,065
Changes in operating liabilities and other provisions 1,500 (2,169)
Changes in pension provisions, defined benefit assets and other noncash items 273 (394)
Net gains from disposal of longterm assets and securities (83) (53)
Cash provided by operating activities 6,460 5,693
Payments related to intangible assets and property, plant and equipment (2,548) (2,507)
Payments related to financial assets and securities (480) (641)
Payments related to acquisitions (605) (1,509)
Proceeds from divestitures 43 62
Proceeds from the disposal of longterm assets and securities 874 513
Cash used in investing activities (2,716) (4,082)
Capital increases/repayments and other equity transactions (18) (134)
Proceeds from the addition of financial liabilities 3,679 5,213
Repayment of financial liabilities (5,974) (5,546)
Dividends paid
To shareholders of BASF SE (1,561) (1,791)
To minority shareholders (370) (298)
Cash provided by (used in) financing activities (4,244) (2,556)
Net changes in cash and cash equivalents (500) (945)
Effects on cash and cash equivalents
From foreign exchange rates 86 4
From changes in scope of consolidation 72 –
Cash and cash equivalents at the beginning of the year 1,835 2,776
Cash and cash equivalents at the end of the year 1,493 1,835
1 More information on the Consolidated statement of cash flows can be found in the Management’s Analysis (Liquidity and capital resources) from page 41 onward. Other information on cash flow can be found in Note 11 from page 166 onward.
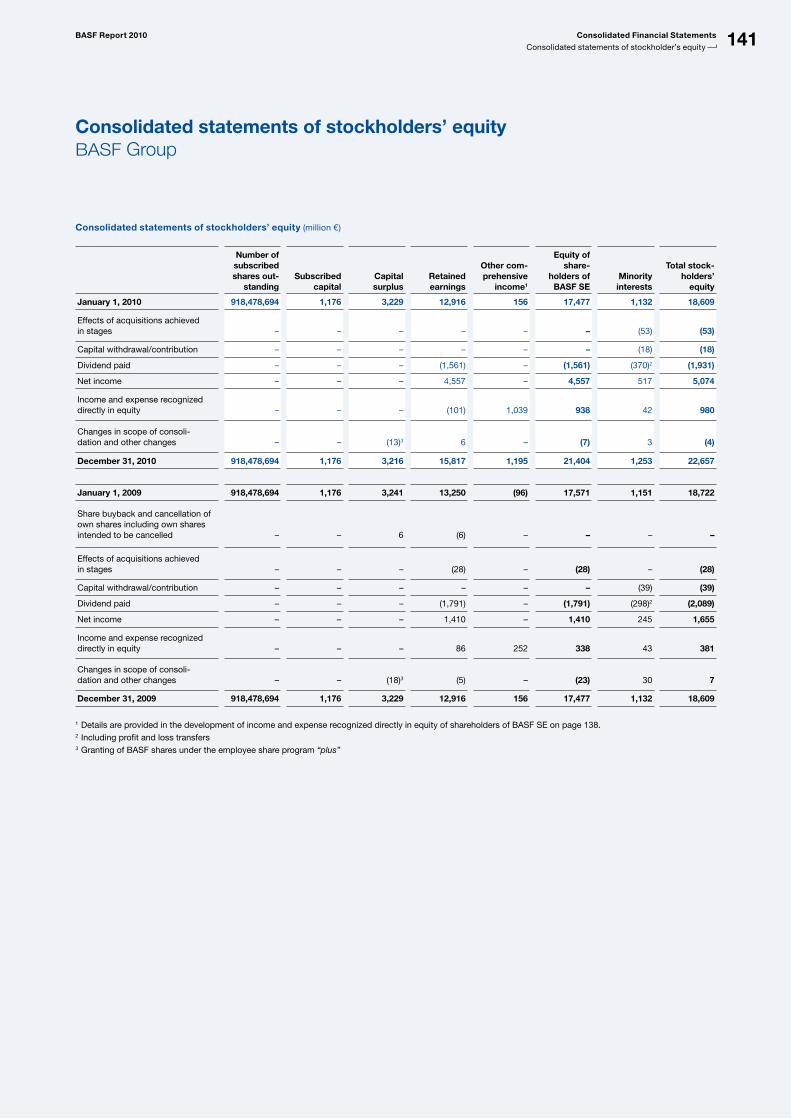
141BASF Report 2010 Consolidated Financial Statements
Consolidated statements of stockholder’s equity
Consolidated statements of stockholders’ equityBASF Group
Consolidated statements of stockholders’ equity (million €)
Number of subscribed shares out-
standingSubscribed
capitalCapital surplus
Retained earnings
Other com-prehensive
income1
Equity of share-
holders of BASF SE
Minority interests
Total stock-holders’
equity
January 1, 2010 918,478,694 1,176 3,229 12,916 156 17,477 1,132 18,609
Effects of acquisitions achieved in stages
–
–
–
–
–
–
(53)
(53)
Capital withdrawal/contribution – – – – – – (18) (18)
Dividend paid – – – (1,561) – (1,561) (370)2 (1,931)
Net income – – – 4,557 – 4,557 517 5,074
Income and expense recognized directly in equity
–
–
–
(101)
1,039
938
42
980
Changes in scope of consoli dation and other changes
–
–
(13)3
6 –
(7)
3
(4)
December 31, 2010 918,478,694 1,176 3,216 15,817 1,195 21,404 1,253 22,657
January 1, 2009 918,478,694 1,176 3,241 13,250 (96) 17,571 1,151 18,722
Share buyback and cancellation of own shares including own shares intended to be cancelled
–
–
6
(6)
–
– –
–
Effects of acquisitions achieved in stages –
–
–
(28)
–
(28)
–
(28)
Capital withdrawal/contribution – – – – – – (39) (39)
Dividend paid – – – (1,791) – (1,791) (298)2 (2,089)
Net income – – – 1,410 – 1,410 245 1,655
Income and expense recognized directly in equity
–
–
–
86
252
338
43
381
Changes in scope of consoli dation and other changes
–
– (18)3 (5)
– (23) 30 7
December 31, 2009 918,478,694 1,176 3,229 12,916 156 17,477 1,132 18,609
1 Details are provided in the development of income and expense recognized directly in equity of shareholders of BASF SE on page 138.2 Including profit and loss transfers3 Granting of BASF shares under the employee share program “plus”
142 Consolidated Financial Statements BASF Report 2010
Notes
A – Group accounting principles
Accounting standards applied: The Consolidated Financial Statements of BASF SE as of December 31, 2010, have been prepared in accordance with International Financial Reporting Standards (IFRS) and Section 315a (1) of the German Commer-cial Code (HGB). The individual financial statements of the com-panies consolidated in the Consolidated Financial Statements of the BASF Group (hereinafter referred to as “consolidated companies”) are prepared as of the balance sheet date of the Consolidated Financial Statements. All of the binding IFRS in the fiscal year 2010 as well as the pronouncements of the Inter-national Financial Reporting Interpretations Committee (IFRIC) were applied. Those IFRSs which had not been endorsed by the Euro-pean Union at the balance sheet date had no effect on BASF’s Consolidated Financial Statements. The accounting policies that have been applied are the same as those in 2009. Exceptions to this are changes required by the application of new or revised standards and interpreta-tions. In this regard, there were no material changes in 2010. A change was made to the presentation of the consolidated state-ments of cash flows.
For more information, see Note 11 from page 166 onward
On February 22, 2011, the Consolidated Financial State-ments were authorized for issue by the Board of Executive Directors and submitted for approval by the Audit Committee to the Supervisory Board of BASF SE at its meeting on March 3, 2011.
Scope of consolidation: The Consolidated Financial State-ments include BASF SE, the parent company, with its headquar-ters in Ludwigshafen, Germany, as well as all the material sub-sidiaries in which BASF has control or directly or indirectly exercises a majority of the voting rights. Material, jointly operated companies are included on a pro-portional consolidation basis. Associated companies are accounted for using the equity method. These are companies in which the Company has a par-ticipation of at least 20% as a rule and can exercise a significant influence over the operating and financial policies. A subsidiary whose business is dormant or of low volume and that is insignificant for the presentation of a true and fair view of the net assets, financial position and results of opera-tions as well as the cash flows of the Company are not consol-idated. These companies are carried at amortized cost and are written down in the case of an impairment. The aggregate assets and stockholders’ equity of these subsidiaries amounts to less than 1% of the corresponding value at group level. Consolidation methods: Assets and liabilities of consoli-dated companies are accounted for and valued uniformly in accordance with the principles described herein. For compa-nies accounted for using the equity method, material deviations from our accounting policies are adjusted for.
Transactions between consolidated companies as well as inter-company profits resulting from sales and services rendered between consolidated companies are eliminated in full. For jointly operated companies, this is conducted on a pro rata basis. Material inter-company profits related to companies accounted for using the equity method are eliminated. Capital consolidation at the acquisition date is based on the purchase method. Initially, all assets, liabilities and additional intangible assets that are to be capitalized are valued at fair value. Finally, the acquisition cost is compared with the propor-tionate share of the net assets acquired at fair value. The result-ing positive differences are capitalized as goodwill and are only written down in the case of impairment. The incidental acquisition costs of a business combination are recognized in the income statement. Translation of foreign currency financial statements: The translation of foreign currency financial statements depends on the functional currency of the consolidated companies. Translation into the reporting currency is based on the closing rate method: Balance sheet items are translated into euro at closing rates on the balance sheet date; expenses and income are translated into euro at monthly average rates and accumu-lated for the year. The translation adjustments due to the use of the closing rate method are shown under currency translation adjustments as a component of other comprehensive income in equity and are recognized in profit or loss only upon the dis-posal of a company. For certain companies outside the euro or U.S. dollar zone, the euro or U.S. dollar is the functional currency.
Selected exchange rates
Closing rates Average rates
1 EUR equalsDec. 31,
2010 Dec. 31,
2009
2010
2009
Brazil (BRL) 2.22 2.51 2.33 2.77
China (CNY) 8.82 9.84 8.97 9.53
Great Britain (GBP) 0.86 0.89 0.86 0.89
Japan (JPY) 108.65 133.16 116.24 130.34
Malaysia (MYR) 4.10 4.93 4.27 4.91
Mexico (MXN) 16.55 18.92 16.74 18.80
The Russian Federation (RUB) 40.82 43.15 40.26 44.14
Switzerland (CHF) 1.25 1.48 1.38 1.51
South Korea (KRW) 1,499.06 1,666.97 1,531.82 1,772.90
United States (USD) 1.34 1.44 1.33 1.39
1 – Summary of accounting policies
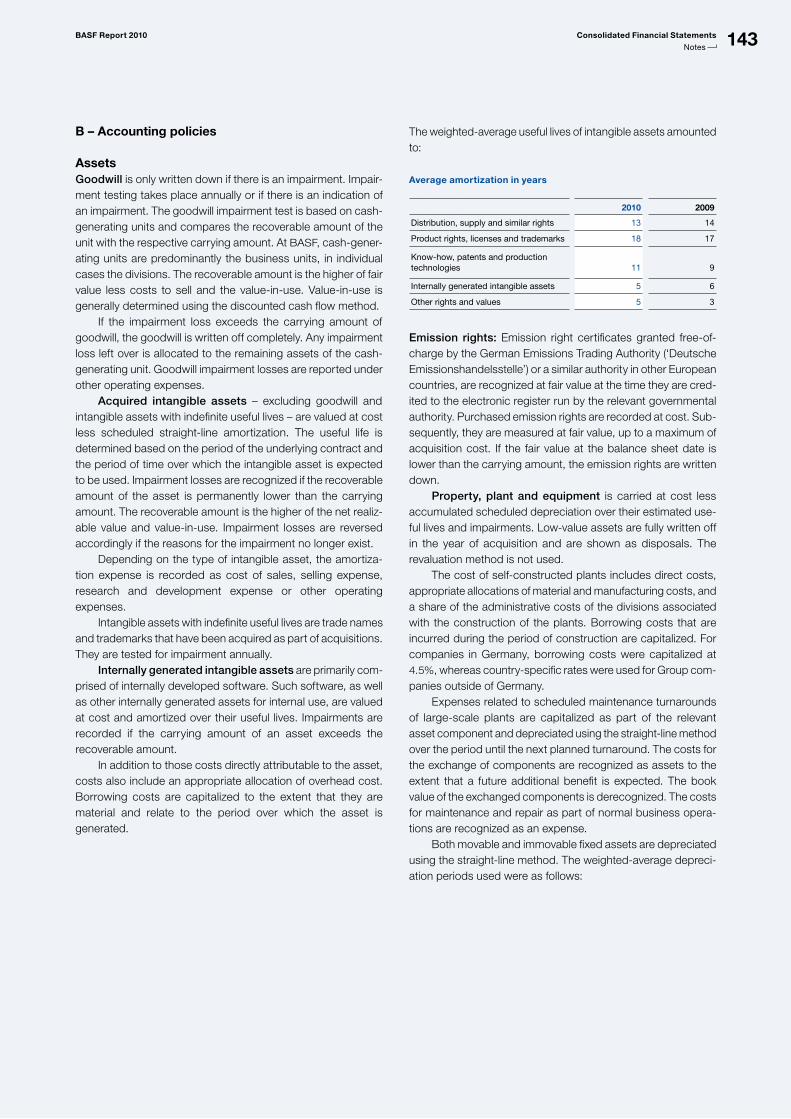
143BASF Report 2010 Consolidated Financial Statements
Notes
B – Accounting policies
AssetsGoodwill is only written down if there is an impairment. Impair-ment testing takes place annually or if there is an indication of an impairment. The goodwill impairment test is based on cash-generating units and compares the recoverable amount of the unit with the respective carrying amount. At BASF, cash-gener-ating units are predominantly the business units, in individual cases the divisions. The recoverable amount is the higher of fair value less costs to sell and the value-in-use. Value-in-use is generally determined using the discounted cash flow method. If the impairment loss exceeds the carrying amount of goodwill, the goodwill is written off completely. Any impairment loss left over is allocated to the remaining assets of the cash-generating unit. Goodwill impairment losses are reported under other operating expenses. Acquired intangible assets – excluding goodwill and intangible assets with indefinite useful lives – are valued at cost less scheduled straight-line amortization. The useful life is determined based on the period of the underlying contract and the period of time over which the intangible asset is expected to be used. Impairment losses are recognized if the recoverable amount of the asset is permanently lower than the carrying amount. The recoverable amount is the higher of the net realiz-able value and value-in-use. Impairment losses are reversed accordingly if the reasons for the impairment no longer exist. Depending on the type of intangible asset, the amortiza-tion expense is recorded as cost of sales, selling expense, research and development expense or other operating expenses. Intangible assets with indefinite useful lives are trade names and trademarks that have been acquired as part of acquisitions. They are tested for impairment annually. Internally generated intangible assets are primarily com-prised of internally developed software. Such software, as well as other internally generated assets for internal use, are valued at cost and amortized over their useful lives. Impairments are recorded if the carrying amount of an asset exceeds the recoverable amount. In addition to those costs directly attributable to the asset, costs also include an appropriate allocation of overhead cost. Borrowing costs are capitalized to the extent that they are material and relate to the period over which the asset is generated.
The weighted-average useful lives of intangible assets amounted to:
Average amortization in years
2010 2009
Distribution, supply and similar rights 13 14
Product rights, licenses and trademarks 18 17
Knowhow, patents and production technologies
11
9
Internally generated intangible assets 5 6
Other rights and values 5 3
Emission rights: Emission right certificates granted free-of-charge by the German Emissions Trading Authority (‘Deutsche Emissionshandelsstelle’) or a similar authority in other European countries, are recognized at fair value at the time they are cred-ited to the electronic register run by the relevant governmental authority. Purchased emission rights are recorded at cost. Sub-sequently, they are measured at fair value, up to a maximum of acquisition cost. If the fair value at the balance sheet date is lower than the carrying amount, the emission rights are written down. Property, plant and equipment is carried at cost less accumulated scheduled depreciation over their estimated use-ful lives and impairments. Low-value assets are fully written off in the year of acquisition and are shown as disposals. The revaluation method is not used. The cost of self-constructed plants includes direct costs, appropriate allocations of material and manufacturing costs, and a share of the administrative costs of the divisions associated with the construction of the plants. Borrowing costs that are incurred during the period of construction are capitalized. For companies in Germany, borrowing costs were capitalized at 4.5%, whereas country-specific rates were used for Group com-panies outside of Germany. Expenses related to scheduled maintenance turnarounds of large-scale plants are capitalized as part of the relevant asset component and depreciated using the straight-line method over the period until the next planned turnaround. The costs for the exchange of components are recognized as assets to the extent that a future additional benefit is expected. The book value of the exchanged components is derecognized. The costs for maintenance and repair as part of normal business opera-tions are recognized as an expense. Both movable and immovable fixed assets are depreciated using the straight-line method. The weighted-average depreci-ation periods used were as follows:
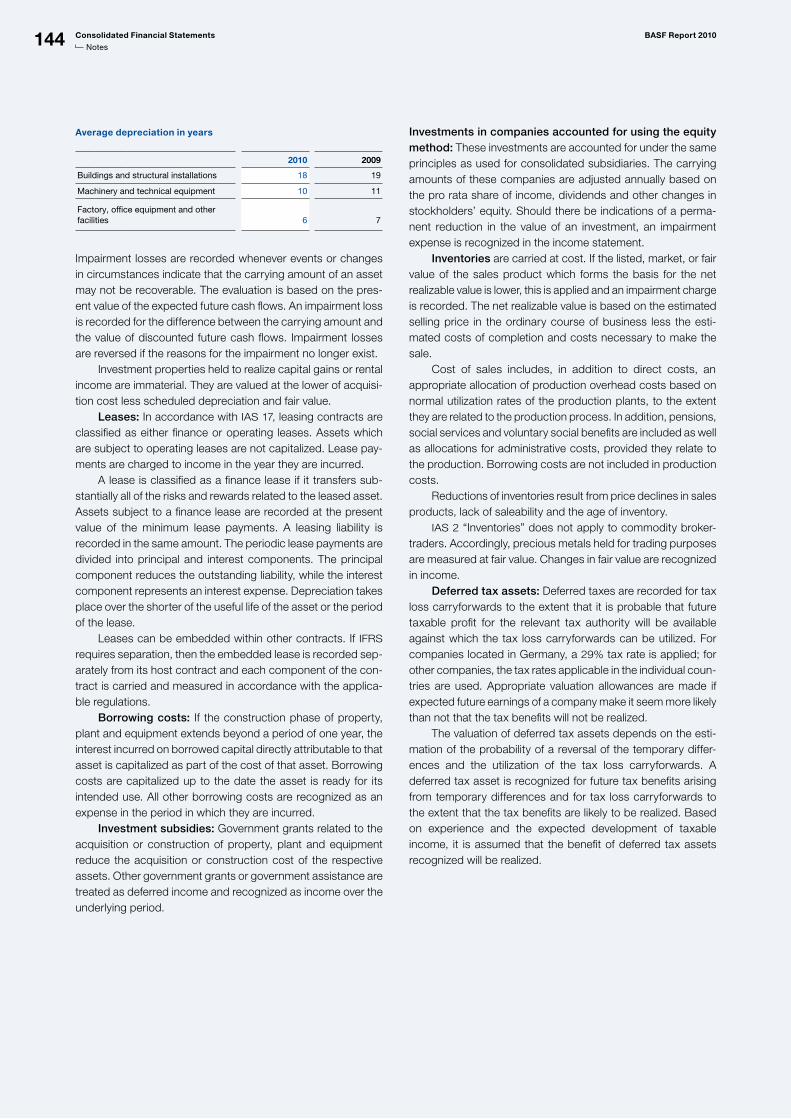
144 Consolidated Financial Statements BASF Report 2010
Notes
Average depreciation in years
2010 2009
Buildings and structural installations 18 19
Machinery and technical equipment 10 11
Factory, office equipment and other facilities
6 7
Impairment losses are recorded whenever events or changes in circumstances indicate that the carrying amount of an asset may not be recoverable. The evaluation is based on the pres-ent value of the expected future cash flows. An impairment loss is recorded for the difference between the carrying amount and the value of discounted future cash flows. Impairment losses are reversed if the reasons for the impairment no longer exist. Investment properties held to realize capital gains or rental income are immaterial. They are valued at the lower of acquisi-tion cost less scheduled depreciation and fair value. Leases: In accordance with IAS 17, leasing contracts are classified as either finance or operating leases. Assets which are subject to operating leases are not capitalized. Lease pay-ments are charged to income in the year they are incurred. A lease is classified as a finance lease if it transfers sub-stantially all of the risks and rewards related to the leased asset. Assets subject to a finance lease are recorded at the present value of the minimum lease payments. A leasing liability is recorded in the same amount. The periodic lease payments are divided into principal and interest components. The principal component reduces the outstanding liability, while the interest component represents an interest expense. Depreciation takes place over the shorter of the useful life of the asset or the period of the lease. Leases can be embedded within other contracts. If IFRS requires separation, then the embedded lease is recorded sep-arately from its host contract and each component of the con-tract is carried and measured in accordance with the applica-ble regulations. Borrowing costs: If the construction phase of property, plant and equipment extends beyond a period of one year, the interest incurred on borrowed capital directly attributable to that asset is capitalized as part of the cost of that asset. Borrowing costs are capitalized up to the date the asset is ready for its intended use. All other borrowing costs are recognized as an expense in the period in which they are incurred. Investment subsidies: Government grants related to the acquisition or construction of property, plant and equipment reduce the acquisition or construction cost of the respective assets. Other government grants or government assistance are treated as deferred income and recognized as income over the underlying period.
Investments in companies accounted for using the equity method: These investments are accounted for under the same principles as used for consolidated subsidiaries. The carrying amounts of these companies are adjusted annually based on the pro rata share of income, dividends and other changes in stockholders’ equity. Should there be indications of a perma-nent reduction in the value of an investment, an impairment expense is recognized in the income statement. Inventories are carried at cost. If the listed, market, or fair value of the sales product which forms the basis for the net realizable value is lower, this is applied and an impairment charge is recorded. The net realizable value is based on the estimated selling price in the ordinary course of business less the esti-mated costs of completion and costs necessary to make the sale. Cost of sales includes, in addition to direct costs, an appropriate allocation of production overhead costs based on normal utilization rates of the production plants, to the extent they are related to the production process. In addition, pensions, social services and voluntary social benefits are included as well as allocations for administrative costs, provided they relate to the production. Borrowing costs are not included in production costs. Reductions of inventories result from price declines in sales products, lack of saleability and the age of inventory. IAS 2 “Inventories” does not apply to commodity broker-traders. Accordingly, precious metals held for trading purposes are measured at fair value. Changes in fair value are recognized in income. Deferred tax assets: Deferred taxes are recorded for tax loss carryforwards to the extent that it is probable that future taxable profit for the relevant tax authority will be available against which the tax loss carryforwards can be utilized. For companies located in Germany, a 29% tax rate is applied; for other companies, the tax rates applicable in the individual coun-tries are used. Appropriate valuation allowances are made if expected future earnings of a company make it seem more likely than not that the tax benefits will not be realized. The valuation of deferred tax assets depends on the esti-mation of the probability of a reversal of the temporary differ-ences and the utilization of the tax loss carryforwards. A deferred tax asset is recognized for future tax benefits arising from temporary differences and for tax loss carryforwards to the extent that the tax benefits are likely to be realized. Based on experience and the expected development of taxable income, it is assumed that the benefit of deferred tax assets recognized will be realized.
145BASF Report 2010 Consolidated Financial Statements
Notes
Financial instrumentsFinancial assets and financial liabilities are recorded on the bal-ance sheet when the BASF Group becomes a party to a finan-cial instrument. Financial assets are derecognized when the contractual rights to the cash flows from the financial asset expire or when the financial asset, with all risks and rewards of ownership, is transferred. Financial liabilities are derecognized when the contractual obligation expires, is discharged or can-celled. Standard purchases and sales of financial instruments are accounted for using the settlement date, and in precious metals trading using the day of trading. The fair value is the amount for which an instrument could be exchanged in an arm’s length transaction between knowl-edgeable, willing parties. When pricing on an active market is available, for example on a stock exchange, this price is used. In other cases, a valuation is based on internal valuation mod-els using current market parameters or external valuations, for example from banks. These internal valuations predominantly use net present value method and option pricing models. If there is objective evidence of a permanent impairment of an available-for-sale financial instrument, an impairment charge is taken. If the reason for the impairment of loans and receivables as well as held-to-maturity financial instruments no longer exists, the amortization is reversed up to the amortized cost and rec-ognized as income. Impairment losses on financial instruments are booked separately. Financial assets and liabilities are divided into the following valuation categories:
Financial assets and liabilities that are measured at fair –value and recognized in income consist of derivatives and other trading instruments. At BASF, this valuation category only includes derivatives. Derivatives are reported in other short-term assets or other short-term liabilities. BASF does not make use of the fair value option under IAS 39. The cal-culation of fair values is based on market parameters or valu-ation methods based on such.Loans and receivables – comprise financial assets with fixed or determinable payments, which are not quoted on an active market and are not derivatives or classified as available-for-sale. Included in this category are trade accounts receivable, loans classified under other financial assets as well as other receivables and loans classified under other receivables and miscellaneous assets. Initial valuation is done at fair value, which generally matches the nominal value of the receivable or loan. Interest-free and low-interest long-term loans and receivables are recorded at present value. Subsequent valu-ations are generally made at amortized cost, under consider-ation of the effective interest method. If there is objective evi-dence for an impairment of a receivable or loan, an individual
valuation adjustment is done. In addition, an impairment loss occurs when the contractual conditions which form the basis for the receivable or loan need to be changed through renegotiation in such a way that the present value of the future cash flows decreases. Receivables and loans are writ-ten off when their uncollectibility is finally determined. Recei-vables for which no objective indication for an impairment exists may be impaired, if necessary, based on historical default rates. In addition, valuation adjustments on receivables for transfer risks in certain countries are established. Held-to-maturity financial assets – consist of non-derivative financial assets with fixed or determinable payments and a fixed term, for which there is the ability and intent to hold until maturity, and which do not fall under other valuation cat-egories. Initial valuation is made at fair value, which, in most cases, matches the nominal value. Subsequently, measure-ment is carried out at amortized cost, under consideration of the effective interest method. For BASF, there are no material financial assets that fall under this category.Available-for-sale financial assets – comprise financial assets which are not derivatives and do not fall under any of the previously stated valuation categories. This valuation cat-egory comprises participations not accounted for using the equity method under the item ‘other financial assets’ and ‘long-term securities.’ Securities contained under the item ‘marketable securities’ also fall under this valuation category. Initial valuation is carried out at fair value. Changes in fair value are booked to equity under the item other comprehensive income and are only recorded in the income statement when the assets are disposed of or have been impaired. The fair values are determined using market prices. Participations whose fair value cannot be reliably determined are carried at amortized cost and are written down in the case of an impair-ment. For these participations, the book values represent the best estimate of value. In the case of available-for-sale securities, write-ups are not recognized in the income statement, but rather directly in equity (other comprehensive income). Write-ups to the amount of the original write-down are recognized in income in the case of debt instruments; write-ups above this amount are recog-nized in equity.
146 Consolidated Financial Statements BASF Report 2010
Notes
Financial liabilities which are not derivatives – are initially measured at fair value. This normally corresponds to the amount received. Subsequently, measurement is carried out at amortized cost, under consideration of the effective inter-est method. Cash and cash equivalents – relate primarily to cash on hand and bank balances.
There were no reclassifications between the valuation catego-ries in 2010 and 2009. Revenue from interest-bearing assets is recognized on the outstanding receivables at the balance sheet date using inter-est rates calculated by means of the effective interest method. Dividends from participations not accounted for under the equity method are recognized when the shareholders’ right to receive payment is established. Derivative financial instruments can be embedded within other contracts. If IFRS requires separation, then the embed-ded derivative is recorded separately from its host contract and shown at fair value. Financial guarantees of the BASF Group are contracts that require deficiency payments to be made to the guarantee holder if a debtor fails to make payment when due under terms of the financial guarantee. Financial guarantees are measured at fair value upon initial recognition. In future periods, financial guar-antees are carried at the higher of amortized cost and the best estimate of the present obligation on the financial reporting date. Cash flow hedge accounting is applied for selected deals to hedge future transactions. The effective portion of the change in fair value is thereby recognized directly in equity under other comprehensive income, taking deferred taxes into account. The ineffective portion is recognized immediately in income. In the case of future transactions that will lead to a non-financial asset or a non-financial debt, the cumulative fair value changes in equity are either charged against the acquisition costs on initial recognition or recognized in profit or loss in the reporting period in which the hedged item is recorded in the income statement. For hedges based on financial assets or debts, the cumulative fair value changes of the hedges are transferred from stockhold-ers’ equity to the income statement in the reporting period in which the hedged item is recognized in the income statement. The maturity of the hedging instrument is based upon the effective date of the future transaction. To hedge the translation risk from the net investment in a foreign subsidiary, BASF uses hedge accounting in individual cases (hedge of a net investment in a foreign operation). The effective portion is recognized in stockholders’ equity. If the for-eign operation is disposed of, these amounts are reclassified to profit or loss. The ineffective portion of the hedge is immediately recognized in profit or loss.
BASF does not currently hedge any fair values under fair value hedges. The derivatives employed by BASF for hedging purposes are effective hedges from an economic point of view. Changes in the fair value of the derivatives almost completely offset the change in the value of the underlying contracts.
DebtProvisions for pensions and similar obligations: Provisions for pensions are based on actuarial computations made accord-ing to the projected unit credit method. Similar obligations, especially those arising from commitments in North America to pay the healthcare costs and life insurance premiums of retired staff and their dependents, are included in pension provisions. Actuarial profits and losses are offset against retained earn-ings. The calculation of pension provisions is based on actuarial reports. Other provisions: Other provisions are accrued when there is a present obligation as a result of a past event and when there is a probable outflow of resources whose amount can be reli-ably estimated. Provisions are recognized at the probable set-tlement value. Provisions for German trade income tax, German corpo-rate income tax and similar income taxes are made in the amount necessary to meet the expected payment obligations, less any prepayments that have been made. Other taxes assessed are appropriately considered. Provisions are established for certain environmental pro-tection measures and risks if the measures are considered likely as a result of legal or regulatory obligations or other past events and these measures have not to be capitalized. Provisions for required restoration obligations primarily concern the filling of wells and the removal of production facilities upon the termina-tion of production in the Oil & Gas segment. The present value of the obligation increases the cost of the respective asset when it is initially recognized. Provisions are made for expected severance payments or similar personnel expenses as well as for demolition expenses and other charges related to the closing down of operations that have been planned and publicly announced by management. Provisions for long-service and anniversary bonuses are predominantly calculated based on actuarial principles. For con-tracts signed under the early retirement programs, provisions for the supplemental payments are provided in their full amount and the wage and salary payments due during the passive phase of agreements are accrued in installments. Provisions are recorded for the expected costs that are anticipated to be con-tracted during the term of the collective bargaining agree-ments.
For more information on provisions for the BASF long-term incentive program, see Note 25 from page 185 onward
147BASF Report 2010 Consolidated Financial Statements
Notes
The probable amount required to settle long-term obligations is discounted if the effect of discounting is material. In this case, the provision is recognized at present value. Related financing costs are shown in other financial results. Deferred tax liabilities: Deferred tax liabilities are recorded for temporary differences between the carrying amount of assets and liabilities in the financial statements and the carrying amounts for tax purposes to the extent that there is a surplus of taxable temporary differences relating to a fiscal unit. Deferred tax liabilities resulted, in particular, from the reval-uation of assets at fair value as part of the purchase price allo-cation of recent years.
Other accounting policiesRevenue recognition: Revenues from the sale of goods or the rendering of services are recognized upon the transfer of owner-ship and risk to the buyer. They are valued at the fair value of the consideration received and are reported without sales taxes. Expected rebates and other trade discounts are either accrued or deducted. Provisions are made to cover the return of prod-ucts, estimated future warranty obligations and other claims. Revenues from the sale of precious metals to industrial cus-tomers as well as some revenues from natural gas trading are recognized at the time of shipment and the corresponding pur-chase price is recorded at cost of sales. Revenues from the trad-ing of precious metals and their derivatives with broker-traders, where as a rule there is no physical delivery, are recorded on a net basis. Revenues from natural gas trading activities of a project company consolidated by BASF are also recorded on a net basis. In certain cases, customer acceptance is required on delivery. In these cases, revenue is recognized after customer acceptance occurs. Payments relating to the sale or licensing of technologies or technological expertise are recognized in income according to the contractually agreed transfer of the rights and obligations associated with those technologies. Foreign currency transactions: The cost of assets acquired in foreign currencies and revenue from sales in foreign currencies are recorded at the exchange rate on the date of the transaction. Foreign currency receivables and liabilities are val-ued at the exchange rates on the balance sheet date. Foreign exchange gains or losses resulting from the conversion of assets and liabilities are reported as other operating expenses or other operating income.
Oil and gas exploration: Exploration and production costs are accounted for using the successful efforts method. Under this method, costs of successful exploratory drilling as well as suc-cessful and dry development wells are capitalized as property, plant and equipment. An exploration well is a well located outside of an area with proven oil and gas deposits. A development well is a well which is sunk to the depth of a deposit of oil or gas within an area with proved reserves. Production costs include all costs incurred to operate, repair and maintain the wells as well as the associated plant and ancillary production equipment, including the associated depre-ciation. Exploration expenses relate exclusively to the Oil & Gas segment. Included here are costs for the exploration of areas with possible oil or gas reserves. Costs for geological and geo-physical investigations are, as a matter of principle, reported under exploration expenses. In addition, this item includes depreciation on exploration wells for which no reserves could be proven. Scheduled depreciation of successful exploratory drilling is reported under cost of sales. Exploratory drilling is reported under construction in prog-ress until its success can be determined. When the presence of hydrocarbons is proved such that the economic development of the field is probable, the costs remain capitalized as sus-pended well costs. Once a year, all suspended wells are assessed from an economic, technical and strategic viewpoint to see if development is still intended. If this is not the case, the well concerned is written off. When reserves are proven and the development of the field begins, the exploration wells are reclas-sified as machinery and technical equipment. An Exploration and Production Sharing Agreement (EPSA) is a type of contract in crude oil and gas concessions whereby the expenses and profits from the exploration, development and production phases are divided between the state and one or more exploration and production companies using defined keys. The revenue BASF is entitled to under such contracts is reported as sales. The existing Libyan concessions are currently being renegotiated. They are to be replaced with Exploration and Production Sharing Agreements according to the EPSA-IV stan-dard. Provisions for required restoration obligations associated with oil and gas operations concern the filling of wells and the removal of production facilities upon the termination of produc-tion. Initial measurement is conducted when the obligation arises at the present value of the future restoration costs. An asset of the same value is capitalized as part of the carrying amount of the plant concerned and together they are depreciated. Inter-est on the provision is accrued annually until the time of the planned restoration.
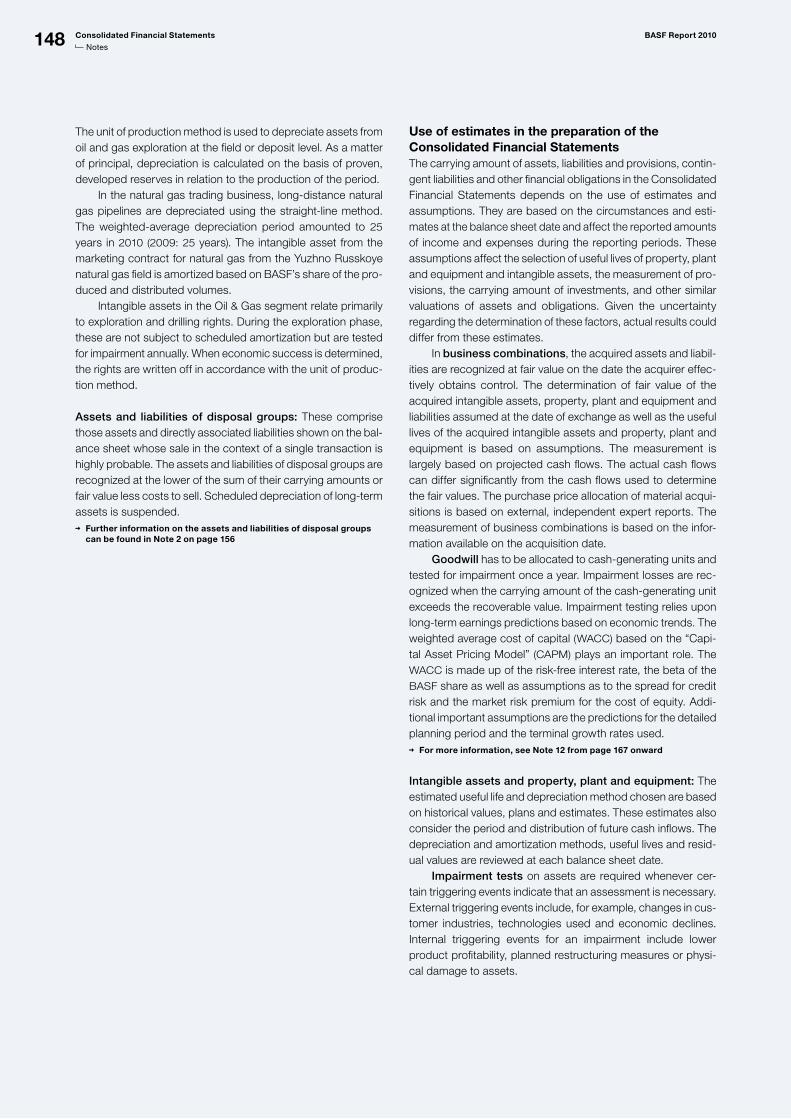
148 Consolidated Financial Statements BASF Report 2010
Notes
The unit of production method is used to depreciate assets from oil and gas exploration at the field or deposit level. As a matter of principal, depreciation is calculated on the basis of proven, developed reserves in relation to the production of the period. In the natural gas trading business, long-distance natural gas pipelines are depreciated using the straight-line method. The weighted-average depreciation period amounted to 25 years in 2010 (2009: 25 years). The intangible asset from the marketing contract for natural gas from the Yuzhno Russkoye natural gas field is amortized based on BASF’s share of the pro-duced and distributed volumes. Intangible assets in the Oil & Gas segment relate primarily to exploration and drilling rights. During the exploration phase, these are not subject to scheduled amortization but are tested for impairment annually. When economic success is determined, the rights are written off in accordance with the unit of produc-tion method.
Assets and liabilities of disposal groups: These comprise those assets and directly associated liabilities shown on the bal-ance sheet whose sale in the context of a single transaction is highly probable. The assets and liabilities of disposal groups are recognized at the lower of the sum of their carrying amounts or fair value less costs to sell. Scheduled depreciation of long-term assets is suspended.
Further information on the assets and liabilities of disposal groups can be found in Note 2 on page 156
Use of estimates in the preparation of the Consolidated Financial Statements The carrying amount of assets, liabilities and provisions, contin-gent liabilities and other financial obligations in the Consolidated Financial Statements depends on the use of estimates and assumptions. They are based on the circumstances and esti-mates at the balance sheet date and affect the reported amounts of income and expenses during the reporting periods. These assumptions affect the selection of useful lives of property, plant and equipment and intangible assets, the measurement of pro-visions, the carrying amount of investments, and other similar valuations of assets and obligations. Given the uncertainty regarding the determination of these factors, actual results could differ from these estimates. In business combinations, the acquired assets and liabil-ities are recognized at fair value on the date the acquirer effec-tively obtains control. The determination of fair value of the acquired intangible assets, property, plant and equipment and liabilities assumed at the date of exchange as well as the useful lives of the acquired intangible assets and property, plant and equipment is based on assumptions. The measurement is largely based on projected cash flows. The actual cash flows can differ significantly from the cash flows used to determine the fair values. The purchase price allocation of material acqui-sitions is based on external, independent expert reports. The measurement of business combinations is based on the infor-mation available on the acquisition date. Goodwill has to be allocated to cash-generating units and tested for impairment once a year. Impairment losses are rec-ognized when the carrying amount of the cash-generating unit exceeds the recoverable value. Impairment testing relies upon long-term earnings predictions based on economic trends. The weighted average cost of capital (WACC) based on the “Capi-tal Asset Pricing Model” (CAPM) plays an important role. The WACC is made up of the risk-free interest rate, the beta of the BASF share as well as assumptions as to the spread for credit risk and the market risk premium for the cost of equity. Addi-tional important assumptions are the predictions for the detailed planning period and the terminal growth rates used.
For more information, see Note 12 from page 167 onward
Intangible assets and property, plant and equipment: The estimated useful life and depreciation method chosen are based on historical values, plans and estimates. These estimates also consider the period and distribution of future cash inflows. The depreciation and amortization methods, useful lives and resid-ual values are reviewed at each balance sheet date. Impairment tests on assets are required whenever cer-tain triggering events indicate that an assessment is necessary. External triggering events include, for example, changes in cus-tomer industries, technologies used and economic declines. Internal triggering events for an impairment include lower product profitability, planned restructuring measures or physi-cal damage to assets.
149BASF Report 2010 Consolidated Financial Statements
Notes
Impairment tests are based on a comparison of the carrying amount and the recoverable amount. The recoverable amount is the higher of net realizable value and value-in-use. The deter-mination of value-in-use requires the estimation and discount-ing of cash flows. The estimation of cash flows and assump-tions used consider all information available on the respective balance sheet date on the future development of the operating business and may deviate from actual future developments. An impairment charge is taken for the difference between the recoverable amount and the carrying amounts. Should the reasons for the impairment no longer be valid, then reversals are taken up to, but not exceeding, the value of the amortized cost. Intangible assets with indefinite useful lives are subject to an annual impairment test. Deferred tax assets/liabilities: The realization of deferred tax assets depends on the future taxable profits of the respec-tive Group companies. Corresponding allowances are recorded when it is uncertain if future earnings will be sufficient to take advantage of the tax loss carryforwards. The continued valua-tion of deferred tax assets is based on internal projections of the future earnings of the Group company.
For more information, see Note 8 from page 163 onward
Receivables and loans are valued at amortized cost using the effective interest method. Valuation adjustments for receivables and loans are recognized in income. Evidence for a valuation adjustment could be, for example, when the financial difficulties of a debtor become known or payment delays occur. When assessing the need for a valuation adjustment, regional and sector-specific conditions are considered. In addition, use is made of internal and external ratings as well as the assess-ments of debt collection agencies and credit insurers, when available. A substantial proportion of receivables is covered by credit insurance. Bank guarantees and letters of credit are used to a limited extent. Only those receivables which are not cov-ered by insurance or other collateral are written down. Receiv-ables whose insurance includes a deductible are written down to the value of the deductible. Valuation adjustments are based on historical values on customer solvency and the age, period overdue, insurance policies and customer-specific risks. If, in a subsequent period, the amount of the valuation adjustment decreases and the decrease can be related objectively to an event occurring after the valuation adjustment was recognized, the previously recognized valuation adjustment loss is to be reversed through profit or loss. Write-ups may not exceed the valuation adjustment.
Pension provisions and defined benefit assets are measured using actuarial methods, applying the following valuation parameters, among others: future developments in compensa-tion and pensions, the expected performance of plan assets, employee turnover and the life expectancy of beneficiaries. The resulting obligations are discounted by reference to market yields at the balance sheet date on high quality corporate fixed-rate bonds with an AA rating. Actuarial gains and losses are rec-ognized directly in retained earnings. They result from the vari-ance between the actual development in pension obligations and pension assets and the assumptions made at the begin-ning of the year as well as the updating of actuarial assump-tions.
For more information on provisions for pensions and similar obliga-tions, see Note 20 from page 176 onwards
Other provisions also cover risks resulting from legal disputes and proceedings. In order to determine the amount of the pro-visions, the facts related to each case, the size of the claim, claims awarded in similar cases and independent expert advice are considered along with assumptions regarding the probabil-ity of a successful claim and the range of possible claims. The actual costs can deviate from these estimates.
For more information, see Note 24 on page 184
Other provisions also include expected charges for the rehabilitation of contaminated sites, the recultivation of land-fills, the removal of environmental contamination at existing production or storage facilities and other similar measures. If BASF is the only responsible party that can be identified, the provision covers the entire expected claim. At sites operated together with one or more parties, the provision covers only BASF’s share of the expected claim. The determination of the amount of the provision is based on the available technical information on the site, the technology used, legal regulations and processes used as well as current regulations and official obligations. The estimation of future costs is subject to uncertainties. This refers in particular to rehabilitation measures that involve several parties and longer time periods. Assumptions have to be made in determining the discount rate to be used in calculating long-term provisions.
150 Consolidated Financial Statements BASF Report 2010
Notes
IFRSs and IFRICs which do not yet have to be con-sidered in the preparation of these statementsThe effects on the BASF Group of the IFRSs and IFRICs not yet in force or not yet endorsed by the European Union in the reporting year 2010 were reviewed:
IFRS – 9 “Financial Instruments” was published on Novem-ber 12, 2009, as the first step in the project to replace IAS 39 Financial Instruments: Recognition and Measurement. The standard introduces new categories and new requirements for classifying and measuring financial instruments that must be applied for periods starting January 1, 2013. The potential impact on BASF is currently being investigated. In addition, on October 28, 2010, new requirements from IFRS 9 were published on the accounting for financial liabili-ties and the derecognition of financial instruments. These changes relate in particular to entities choosing to measure financial liabilities at fair value. The amendment does not have an effect on BASF.
The revision to – IAS 24 “Related Party Disclosures” simpli-fies the disclosure requirements for government-related enti-ties and clarifies the definition of a related party. The revised standard is effective for periods beginning on or after Janu-ary 1, 2011. The amendment will not have a material effect on BASF.
2 – Scope of consolidation
The amendment to – IAS 32 “Financial Instruments: Presen-tation” requires that rights, options, or warrants to acquire a fixed number of an entity’s own equity instruments for a fixed amount are equity instruments. This is regardless of the cur-rency in which the exercise price is denominated. The amend-ment is effective for annual periods beginning on or after February 1, 2010. The amendment will not have an effect on BASF.
The amendment to – IFRIC 14 “Prepayments of a Minimum Funding Requirement” applies in those cases where a com-pany is obliged to and makes minimum funding payments to external plan assets to fulfill minimum funding requirements. The amendment is effective from January 1, 2011, and has no impact on BASF.
IFRIC – 19 “Extinguishing Financial Liabilities with Equity Instruments” addresses the accounting by an entity that issues equity instruments in order to settle, in full or in part, a financial liability. The interpretation is mandatory for periods beginning on or after July 1, 2010 and has no impact on BASF.
Other amendments of the standards will have no material impact on BASF.
A – Changes in scope of consolidation
In 2010, the scope of consolidation for the Consolidated Finan-cial Statements encompassed 339 companies (2009: 345). Of this number, 46 companies were first-time consolidations (2009: 75). From the beginning of 2010, 52 companies were deconsol-idated due to merger, sale or immateriality (2009: 23).
Scope of consolidation
2010 2009
Consolidated companies as of January 1 345 293
Thereof proportionally consolidated 19 19
Firsttime consolidations 46 75
Thereof proportionally consolidated 2 –
Deconsolidations 52 23
Thereof proportionally consolidated – –
Consolidated as of December 31 339 345
Thereof proportionally consolidated 21 19
First-time consolidations in 2010 comprised:
a total of – 40 companies in conjunction with the acquisition of Cognis Holding GmbH;an additional six companies due to their increased impor- –tance, which had previously not been consolidated, registered in Germany, China, Japan and Algeria.
First-time consolidations in 2009 comprised:
a total of – 68 companies in conjunction with the acquisition of Ciba Holding AG, Basel, Switzerland;an additional seven companies due to their increased impor- –tance, which had previously not been consolidated, registered in Germany, Switzerland, Colombia, Argentina and Hungary.
A list of companies included in the Consolidated Financial State-ments and a list of all companies in which BASF SE has a par-ticipation as required by Section 313 (2) of the German Com-mercial Code is provided in the List of Shares Held.
For more information, see Note 31 on page 194
151BASF Report 2010 Consolidated Financial Statements
Notes
Overview of impact of changes to the scope of consolidation (excluding acquisitions and divestitures)
2010 2009
Million € % Million € %
Sales 149 0.2 2 .
Longterm assets (146) (0.4) 8 .
Thereof property, plant and equipment 46 0.3 7 .
Shortterm assets 111 0.4 31 0.2
Thereof cash and cash equivalents 72 4.8 . .
Total assets (35) (0.1) 39 0.1
Stockholders’ equity (126) (0.6) (4) .
Longterm liabilities 25 0.1 . .
Thereof financial indebtedness . . . .
Shortterm liabilities 66 0.4 43 0.4
Thereof financial indebtedness 1 . 1 .
Total stockholders’ equity and liabilities (35) (0.1) 39 0.1
Contingent liabilities and other financial obligations 28 0.4 . .
B – Proportionally and at equity consolidated companies
Proportionally consolidated joint ventures of major significance are as follows:
Wintershall Erdgas Handelshaus GmbH – & Co. KG, Berlin, Germany; Wintershall Erdgas Handelshaus Zug AG, Zug, Switzerland as well as ZAO Achimgaz, Novy Urengoy, the Russian Federation, joint ventures with Gazprom through which gas trading activities and the production of natural gas and condensate in Siberia are operated; ELLBA – C.V., Rotterdam, the Netherlands and ELLBA Eastern Private Ltd., Singapore, which are operated jointly with Shell and produce propylene oxide and styrene monomers; BASF – DOW HPPO Production B.V.B.A., Antwerp, Belgium, which is operated jointly with The Dow Chemical Company to produce propylene oxide; BASF-YPC – Company Ltd., a joint venture between BASF and Sinopec, which operates the Verbund site in Nanjing, China;N.E. – Chemcat Corporation1, Tokyo, Japan, which is operated jointly with Sumitomo Metal Mining. In 2010, the stake in the company was increased from 49% to 50%. Therefore, the company is now proportionally consolidated and is no longer consolidated using the equity method.
1 In 2010, the stock was delisted.
In total, 14 companies were accounted for using the equity method in 2010 (2009: 17).
Companies consolidated using the equity method
2010 2009
Subsidiaries 5 7
Joint ventures 4 5
Other associated companies 5 5
14 17
The following associated companies of major significance have been accounted for using the equity method:
Solvin Group – (BASF stake: 25%); CIMO – Compagnie industrielle de Monthey S.A., Monthey, Switzerland (BASF stake: 50%); Heesung Catalysts Corporation, Seoul, South Korea –(BASF stake: 49%); Nord Stream – AG, Zug, Switzerland (BASF stake: 15.5%); OAO – Severneftegazprom, Krasnoselkup, the Russian Feder-ation (BASF stake: 25%; share of economic rewards: 35%); and Shanghai Lianheng Isocyanate Co. Ltd. – , Shanghai, China (BASF stake: 35%).
A complete listing of all proportionally consolidated companies and companies consolidated using the equity method is avail-able in the List of Shares Held.
For more information, see Note 31 on page 194
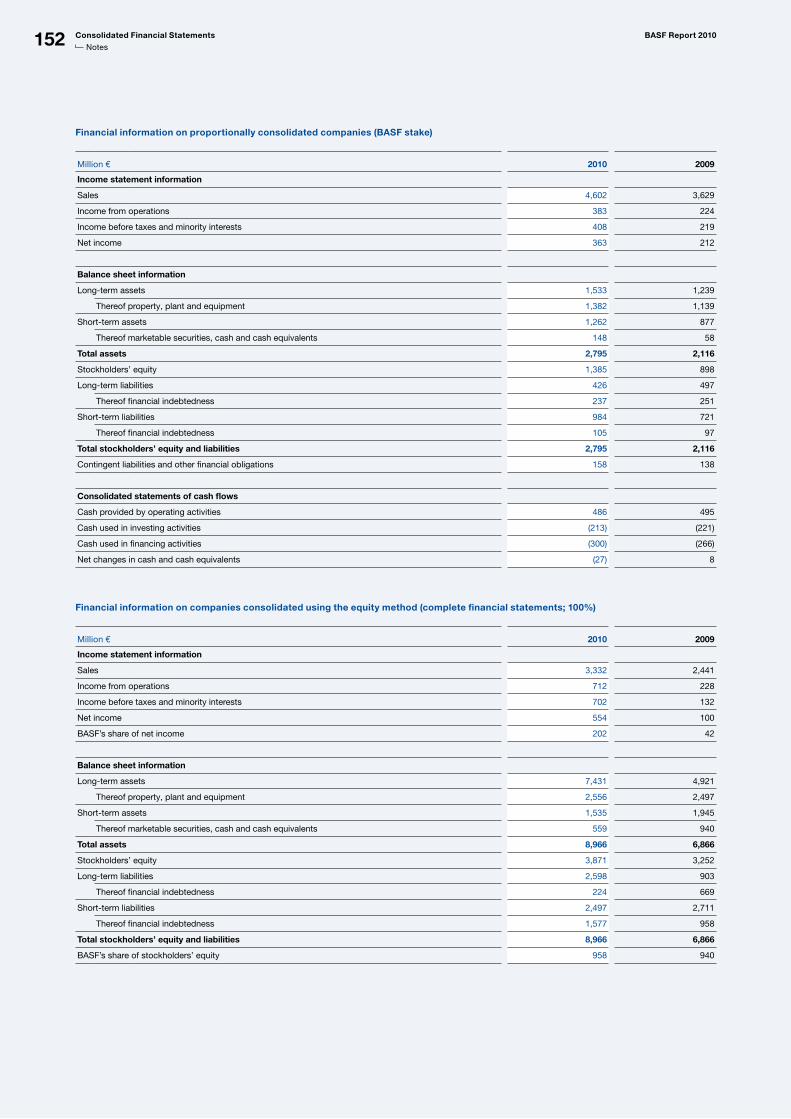
152 Consolidated Financial Statements BASF Report 2010
Notes
Financial information on proportionally consolidated companies (BASF stake)
Million € 2010 2009
Income statement information
Sales 4,602 3,629
Income from operations 383 224
Income before taxes and minority interests 408 219
Net income 363 212
Balance sheet information
Longterm assets 1,533 1,239
Thereof property, plant and equipment 1,382 1,139
Shortterm assets 1,262 877
Thereof marketable securities, cash and cash equivalents 148 58
Total assets 2,795 2,116
Stockholders’ equity 1,385 898
Longterm liabilities 426 497
Thereof financial indebtedness 237 251
Shortterm liabilities 984 721
Thereof financial indebtedness 105 97
Total stockholders’ equity and liabilities 2,795 2,116
Contingent liabilities and other financial obligations 158 138
Consolidated statements of cash flows
Cash provided by operating activities 486 495
Cash used in investing activities (213) (221)
Cash used in financing activities (300) (266)
Net changes in cash and cash equivalents (27) 8
Financial information on companies consolidated using the equity method (complete financial statements; 100%)
Million € 2010 2009
Income statement information
Sales 3,332 2,441
Income from operations 712 228
Income before taxes and minority interests 702 132
Net income 554 100
BASF’s share of net income 202 42
Balance sheet information
Longterm assets 7,431 4,921
Thereof property, plant and equipment 2,556 2,497
Shortterm assets 1,535 1,945
Thereof marketable securities, cash and cash equivalents 559 940
Total assets 8,966 6,866
Stockholders’ equity 3,871 3,252
Longterm liabilities 2,598 903
Thereof financial indebtedness 224 669
Shortterm liabilities 2,497 2,711
Thereof financial indebtedness 1,577 958
Total stockholders’ equity and liabilities 8,966 6,866
BASF’s share of stockholders’ equity 958 940
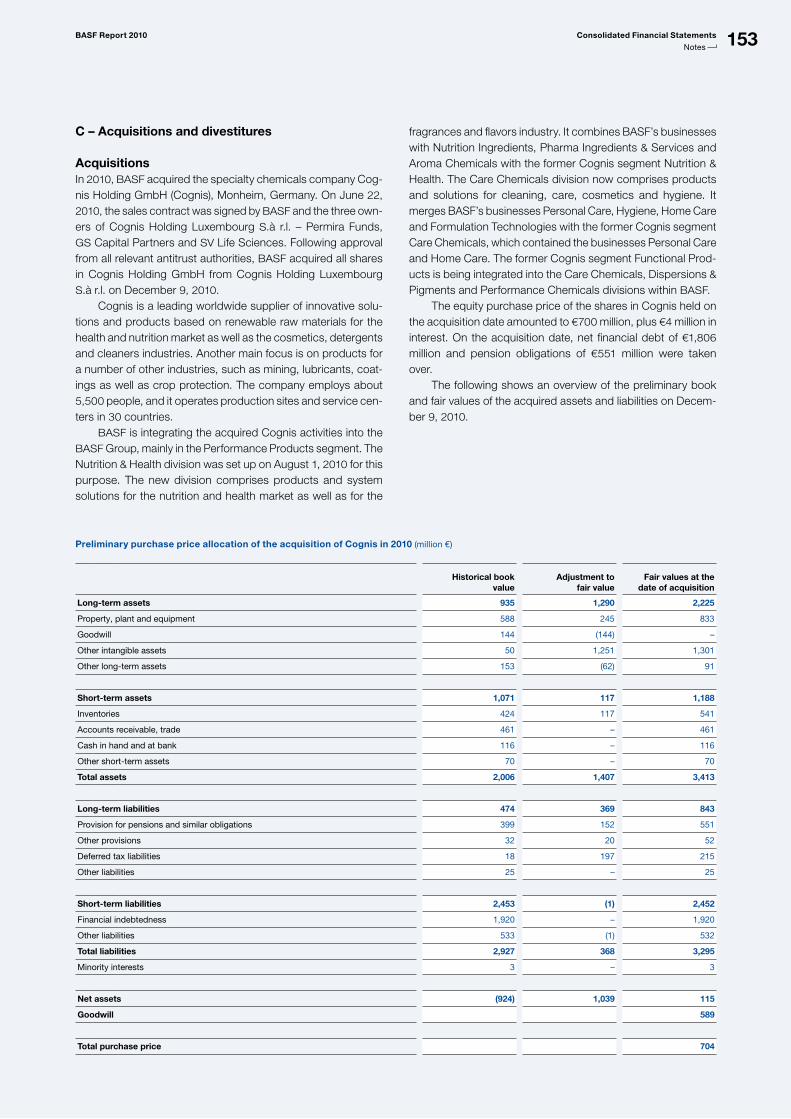
153BASF Report 2010 Consolidated Financial Statements
Notes
Preliminary purchase price allocation of the acquisition of Cognis in 2010 (million €)
Historical book value
Adjustment to fair value
Fair values at the date of acquisition
Long-term assets 935 1,290 2,225
Property, plant and equipment 588 245 833
Goodwill 144 (144) –
Other intangible assets 50 1,251 1,301
Other longterm assets 153 (62) 91
Short-term assets 1,071 117 1,188
Inventories 424 117 541
Accounts receivable, trade 461 – 461
Cash in hand and at bank 116 – 116
Other shortterm assets 70 – 70
Total assets 2,006 1,407 3,413
Long-term liabilities 474 369 843
Provision for pensions and similar obligations 399 152 551
Other provisions 32 20 52
Deferred tax liabilities 18 197 215
Other liabilities 25 – 25
Short-term liabilities 2,453 (1) 2,452
Financial indebtedness 1,920 – 1,920
Other liabilities 533 (1) 532
Total liabilities 2,927 368 3,295
Minority interests 3 – 3
Net assets (924) 1,039 115
Goodwill 589
Total purchase price 704
C – Acquisitions and divestitures
AcquisitionsIn 2010, BASF acquired the specialty chemicals company Cog-nis Holding GmbH (Cognis), Monheim, Germany. On June 22, 2010, the sales contract was signed by BASF and the three own-ers of Cognis Holding Luxembourg S.à r.l. – Permira Funds, GS Capital Partners and SV Life Sciences. Following approval from all relevant antitrust authorities, BASF acquired all shares in Cognis Holding GmbH from Cognis Holding Luxembourg S.à r.l. on December 9, 2010.
Cognis is a leading worldwide supplier of innovative solu-tions and products based on renewable raw materials for the health and nutrition market as well as the cosmetics, detergents and cleaners industries. Another main focus is on products for a number of other industries, such as mining, lubricants, coat-ings as well as crop protection. The company employs about 5,500 people, and it operates production sites and service cen-ters in 30 countries. BASF is integrating the acquired Cognis activities into the BASF Group, mainly in the Performance Products segment. The Nutrition & Health division was set up on August 1, 2010 for this purpose. The new division comprises products and system solutions for the nutrition and health market as well as for the
fragrances and flavors industry. It combines BASF’s businesses with Nutrition Ingredients, Pharma Ingredients & Services and Aroma Chemicals with the former Cognis segment Nutrition & Health. The Care Chemicals division now comprises products and solutions for cleaning, care, cosmetics and hygiene. It merges BASF’s businesses Personal Care, Hygiene, Home Care and Formulation Technologies with the former Cognis segment Care Chemicals, which contained the businesses Personal Care and Home Care. The former Cognis segment Functional Prod-ucts is being integrated into the Care Chemicals, Dispersions & Pigments and Performance Chemicals divisions within BASF.
The equity purchase price of the shares in Cognis held on the acquisition date amounted to €700 million, plus €4 million in interest. On the acquisition date, net financial debt of €1,806 million and pension obligations of €551 million were taken over. The following shows an overview of the preliminary book and fair values of the acquired assets and liabilities on Decem-ber 9, 2010.
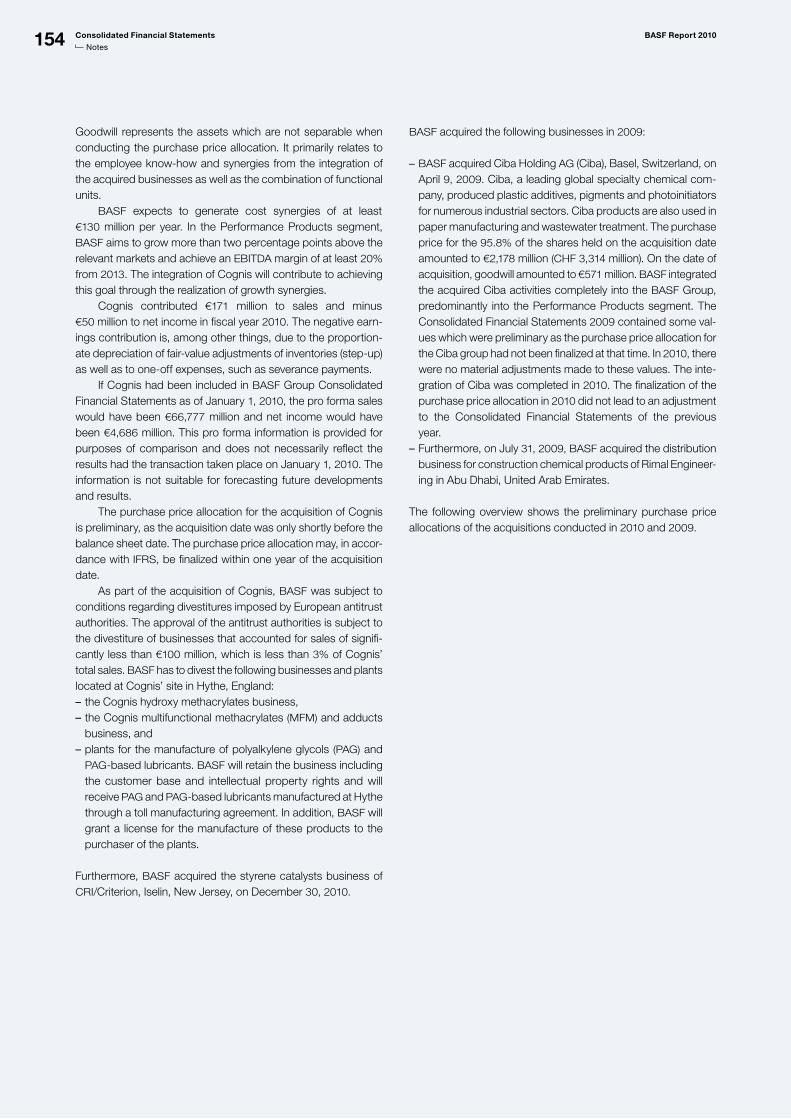
154 Consolidated Financial Statements BASF Report 2010
Notes
Goodwill represents the assets which are not separable when conducting the purchase price allocation. It primarily relates to the employee know-how and synergies from the integration of the acquired businesses as well as the combination of functional units. BASF expects to generate cost synergies of at least €130 million per year. In the Performance Products segment, BASF aims to grow more than two percentage points above the relevant markets and achieve an EBITDA margin of at least 20% from 2013. The integration of Cognis will contribute to achieving this goal through the realization of growth synergies. Cognis contributed €171 million to sales and minus €50 million to net income in fiscal year 2010. The negative earn-ings contribution is, among other things, due to the proportion-ate depreciation of fair-value adjustments of inventories (step-up) as well as to one-off expenses, such as severance payments. If Cognis had been included in BASF Group Consolidated Financial Statements as of January 1, 2010, the pro forma sales would have been €66,777 million and net income would have been €4,686 million. This pro forma information is provided for purposes of comparison and does not necessarily reflect the results had the transaction taken place on January 1, 2010. The information is not suitable for forecasting future developments and results. The purchase price allocation for the acquisition of Cognis is preliminary, as the acquisition date was only shortly before the balance sheet date. The purchase price allocation may, in accor-dance with IFRS, be finalized within one year of the acquisition date. As part of the acquisition of Cognis, BASF was subject to conditions regarding divestitures imposed by European antitrust authorities. The approval of the antitrust authorities is subject to the divestiture of businesses that accounted for sales of signifi-cantly less than €100 million, which is less than 3% of Cognis’ total sales. BASF has to divest the following businesses and plants located at Cognis’ site in Hythe, England:
the Cognis hydroxy methacrylates business, –the Cognis multifunctional methacrylates – (MFM) and adducts business, andplants for the manufacture of polyalkylene glycols – (PAG) and PAG-based lubricants. BASF will retain the business including the customer base and intellectual property rights and will receive PAG and PAG-based lubricants manufactured at Hythe through a toll manufacturing agreement. In addition, BASF will grant a license for the manufacture of these products to the purchaser of the plants.
Furthermore, BASF acquired the styrene catalysts business of CRI/Criterion, Iselin, New Jersey, on December 30, 2010.
BASF acquired the following businesses in 2009:
BASF – acquired Ciba Holding AG (Ciba), Basel, Switzerland, on April 9, 2009. Ciba, a leading global specialty chemical com-pany, produced plastic additives, pigments and photoinitiators for numerous industrial sectors. Ciba products are also used in paper manufacturing and wastewater treatment. The purchase price for the 95.8% of the shares held on the acquisition date amounted to €2,178 million (CHF 3,314 million). On the date of acquisition, goodwill amounted to €571 million. BASF integrated the acquired Ciba activities completely into the BASF Group, predominantly into the Performance Products segment. The Consolidated Financial Statements 2009 contained some val-ues which were preliminary as the purchase price allocation for the Ciba group had not been finalized at that time. In 2010, there were no material adjustments made to these values. The inte-gration of Ciba was completed in 2010. The finalization of the purchase price allocation in 2010 did not lead to an adjustment to the Consolidated Financial Statements of the previous year. Furthermore, on July – 31, 2009, BASF acquired the distribution business for construction chemical products of Rimal Engineer-ing in Abu Dhabi, United Arab Emirates.
The following overview shows the preliminary purchase price allocations of the acquisitions conducted in 2010 and 2009.
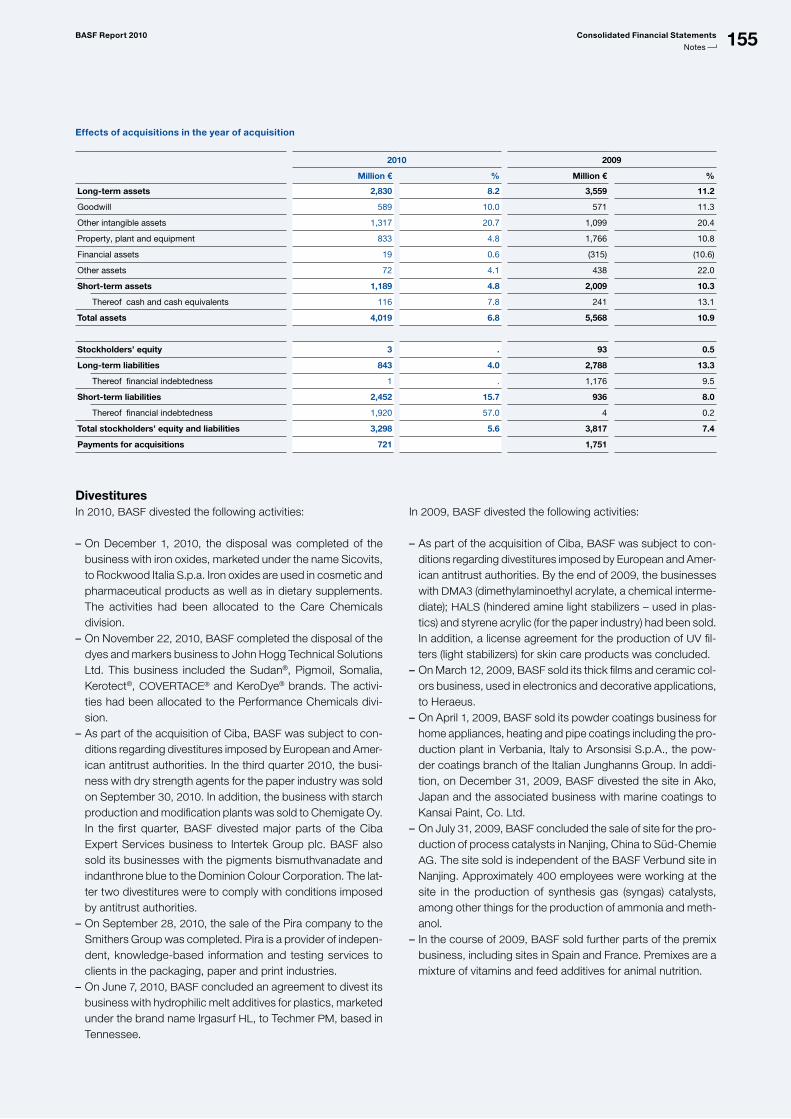
155BASF Report 2010 Consolidated Financial Statements
Notes
Effects of acquisitions in the year of acquisition
2010 2009
Million € % Million € %
Long-term assets 2,830 8.2 3,559 11.2
Goodwill 589 10.0 571 11.3
Other intangible assets 1,317 20.7 1,099 20.4
Property, plant and equipment 833 4.8 1,766 10.8
Financial assets 19 0.6 (315) (10.6)
Other assets 72 4.1 438 22.0
Short-term assets 1,189 4.8 2,009 10.3
Thereof cash and cash equivalents 116 7.8 241 13.1
Total assets 4,019 6.8 5,568 10.9
Stockholders’ equity 3 . 93 0.5
Long-term liabilities 843 4.0 2,788 13.3
Thereof financial indebtedness 1 . 1,176 9.5
Short-term liabilities 2,452 15.7 936 8.0
Thereof financial indebtedness 1,920 57.0 4 0.2
Total stockholders’ equity and liabilities 3,298 5.6 3,817 7.4
Payments for acquisitions 721 1,751
Divestitures In 2010, BASF divested the following activities:
On December – 1, 2010, the disposal was completed of the business with iron oxides, marketed under the name Sicovits, to Rockwood Italia S.p.a. Iron oxides are used in cosmetic and pharmaceutical products as well as in dietary supplements. The activities had been allocated to the Care Chemicals division.On November – 22, 2010, BASF completed the disposal of the dyes and markers business to John Hogg Technical Solutions Ltd. This business included the Sudan®, Pigmoil, Somalia, Kerotect®, COVERTACE® and KeroDye® brands. The activi-ties had been allocated to the Performance Chemicals divi-sion.As part of the acquisition of Ciba, – BASF was subject to con-ditions regarding divestitures imposed by European and Amer-ican antitrust authorities. In the third quarter 2010, the busi-ness with dry strength agents for the paper industry was sold on September 30, 2010. In addition, the business with starch production and modification plants was sold to Chemigate Oy. In the first quarter, BASF divested major parts of the Ciba Expert Services business to Intertek Group plc. BASF also sold its businesses with the pigments bismuthvanadate and indanthrone blue to the Dominion Colour Corporation. The lat-ter two divestitures were to comply with conditions imposed by antitrust authorities.On September – 28, 2010, the sale of the Pira company to the Smithers Group was completed. Pira is a provider of indepen-dent, knowledge-based information and testing services to clients in the packaging, paper and print industries. On June – 7, 2010, BASF concluded an agreement to divest its business with hydrophilic melt additives for plastics, marketed under the brand name Irgasurf HL, to Techmer PM, based in Tennessee.
In 2009, BASF divested the following activities:
As part of the acquisition of Ciba, – BASF was subject to con-ditions regarding divestitures imposed by European and Amer-ican antitrust authorities. By the end of 2009, the businesses with DMA3 (dimethylaminoethyl acrylate, a chemical interme-diate); HALS (hindered amine light stabilizers – used in plas-tics) and styrene acrylic (for the paper industry) had been sold. In addition, a license agreement for the production of UV fil-ters (light stabilizers) for skin care products was concluded.On March – 12, 2009, BASF sold its thick films and ceramic col-ors business, used in electronics and decorative applications, to Heraeus.On April – 1, 2009, BASF sold its powder coatings business for home appliances, heating and pipe coatings including the pro-duction plant in Verbania, Italy to Arsonsisi S.p.A., the pow-der coatings branch of the Italian Junghanns Group. In addi-tion, on December 31, 2009, BASF divested the site in Ako, Japan and the associated business with marine coatings to Kansai Paint, Co. Ltd. On July – 31, 2009, BASF concluded the sale of site for the pro-duction of process catalysts in Nanjing, China to Süd-Chemie AG. The site sold is independent of the BASF Verbund site in Nanjing. Approximately 400 employees were working at the site in the production of synthesis gas (syngas) catalysts, among other things for the production of ammonia and meth-anol.In the course of – 2009, BASF sold further parts of the premix business, including sites in Spain and France. Premixes are a mixture of vitamins and feed additives for animal nutrition.
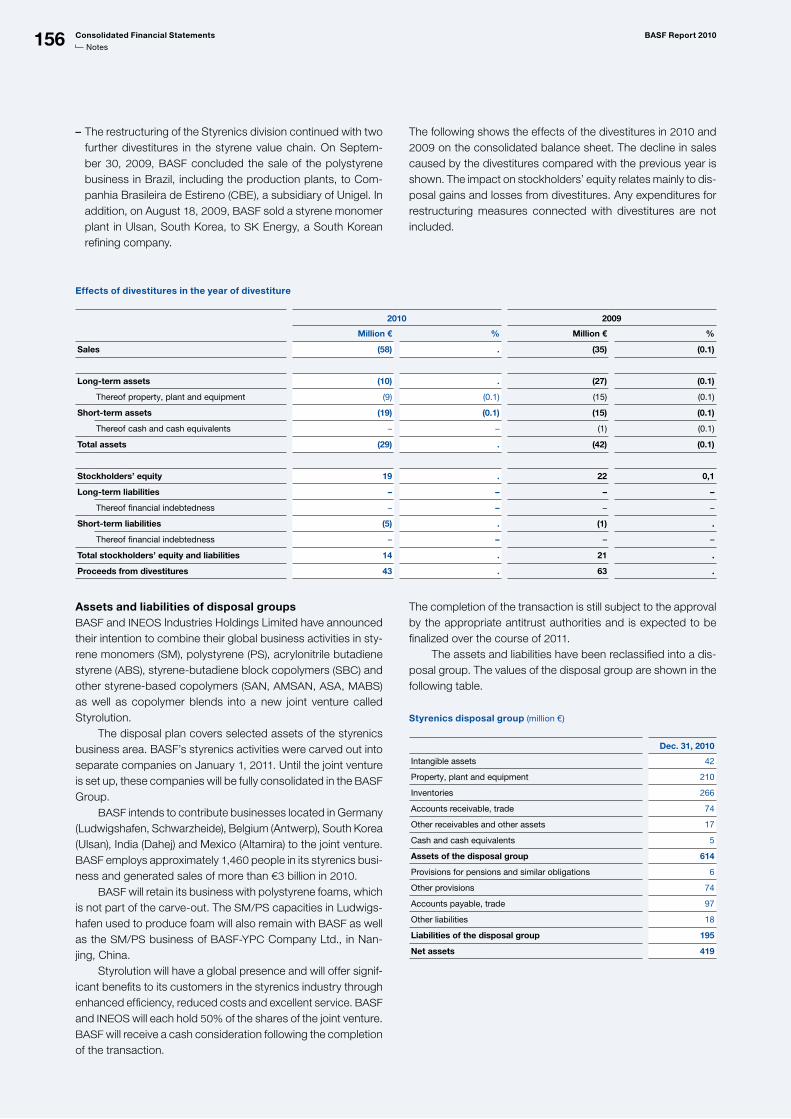
156 Consolidated Financial Statements BASF Report 2010
Notes
Effects of divestitures in the year of divestiture
2010 2009
Million € % Million € %
Sales (58) . (35) (0.1)
Long-term assets (10) . (27) (0.1)
Thereof property, plant and equipment (9) (0.1) (15) (0.1)
Short-term assets (19) (0.1) (15) (0.1)
Thereof cash and cash equivalents – – (1) (0.1)
Total assets (29) . (42) (0.1)
Stockholders’ equity 19 . 22 0,1
Long-term liabilities – – – –
Thereof financial indebtedness – – – –
Short-term liabilities (5) . (1) .
Thereof financial indebtedness – – – –
Total stockholders’ equity and liabilities 14 . 21 .
Proceeds from divestitures 43 . 63 .
Assets and liabilities of disposal groupsBASF and INEOS Industries Holdings Limited have announced their intention to combine their global business activities in sty-rene monomers (SM), polystyrene (PS), acrylonitrile butadiene styrene (ABS), styrene-butadiene block copolymers (SBC) and other styrene-based copolymers (SAN, AMSAN, ASA, MABS) as well as copolymer blends into a new joint venture called Styrolution. The disposal plan covers selected assets of the styrenics business area. BASF’s styrenics activities were carved out into separate companies on January 1, 2011. Until the joint venture is set up, these companies will be fully consolidated in the BASF Group. BASF intends to contribute businesses located in Germany (Ludwigshafen, Schwarzheide), Belgium (Antwerp), South Korea (Ulsan), India (Dahej) and Mexico (Altamira) to the joint venture. BASF employs approximately 1,460 people in its styrenics busi-ness and generated sales of more than €3 billion in 2010.
BASF will retain its business with polystyrene foams, which is not part of the carve-out. The SM/PS capacities in Ludwigs-hafen used to produce foam will also remain with BASF as well as the SM/PS business of BASF-YPC Company Ltd., in Nan-jing, China. Styrolution will have a global presence and will offer signif-icant benefits to its customers in the styrenics industry through enhanced efficiency, reduced costs and excellent service. BASF
and INEOS will each hold 50% of the shares of the joint venture. BASF will receive a cash consideration following the completion of the transaction.
The completion of the transaction is still subject to the approval by the appropriate antitrust authorities and is expected to be finalized over the course of 2011.
The assets and liabilities have been reclassified into a dis-posal group. The values of the disposal group are shown in the following table.
Styrenics disposal group (million €)
Dec. 31, 2010
Intangible assets 42
Property, plant and equipment 210
Inventories 266
Accounts receivable, trade 74
Other receivables and other assets 17
Cash and cash equivalents 5
Assets of the disposal group 614
Provisions for pensions and similar obligations 6
Other provisions 74
Accounts payable, trade 97
Other liabilities 18
Liabilities of the disposal group 195
Net assets 419
The restructuring of the Styrenics division continued with two –further divestitures in the styrene value chain. On Septem- ber 30, 2009, BASF concluded the sale of the polystyrene business in Brazil, including the production plants, to Com-panhia Brasileira de Estireno (CBE), a subsidiary of Unigel. In addition, on August 18, 2009, BASF sold a styrene monomer plant in Ulsan, South Korea, to SK Energy, a South Korean refining company.
The following shows the effects of the divestitures in 2010 and 2009 on the consolidated balance sheet. The decline in sales caused by the divestitures compared with the previous year is shown. The impact on stockholders’ equity relates mainly to dis-posal gains and losses from divestitures. Any expenditures for restructuring measures connected with divestitures are not included.
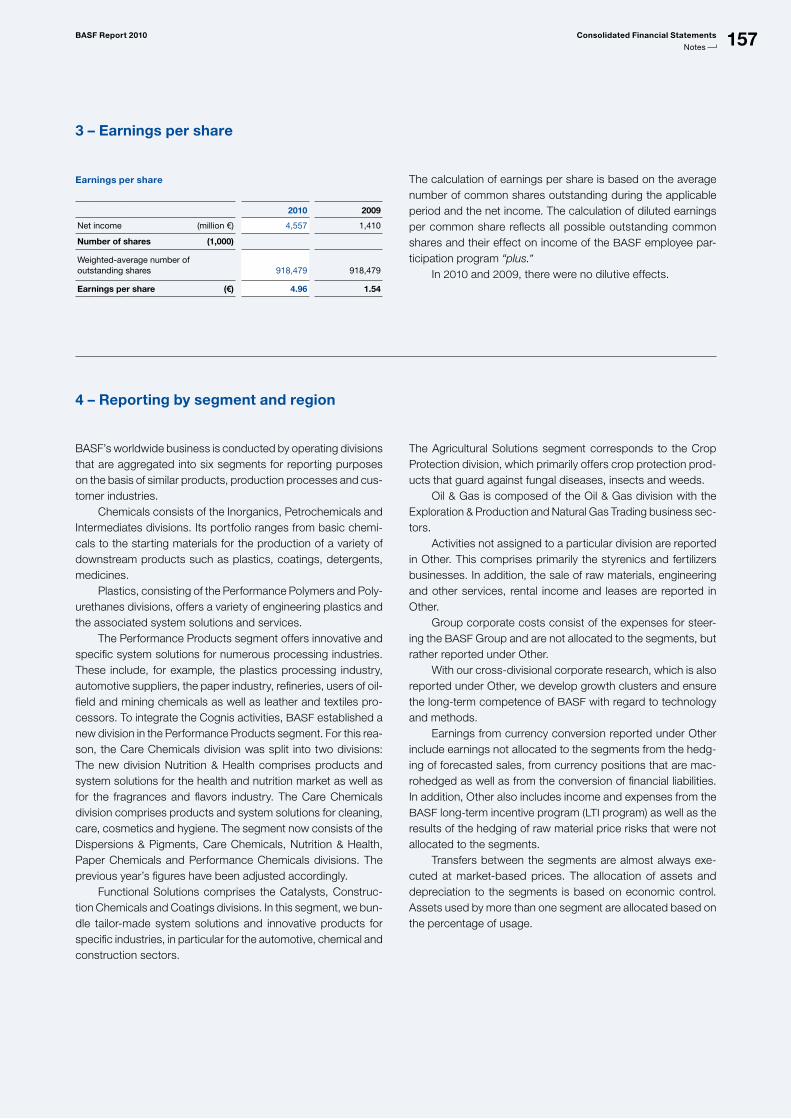
157BASF Report 2010 Consolidated Financial Statements
Notes
Earnings per share
2010 2009
Net income (million €) 4,557 1,410
Number of shares (1,000)
Weightedaverage number of outstanding shares 918,479 918,479
Earnings per share (€) 4.96 1.54
3 – Earnings per share
The calculation of earnings per share is based on the average number of common shares outstanding during the applicable period and the net income. The calculation of diluted earnings per common share reflects all possible outstanding common shares and their effect on income of the BASF employee par-ticipation program “plus.” In 2010 and 2009, there were no dilutive effects.
4 – Reporting by segment and region
The Agricultural Solutions segment corresponds to the Crop Protection division, which primarily offers crop protection prod-ucts that guard against fungal diseases, insects and weeds. Oil & Gas is composed of the Oil & Gas division with the Exploration & Production and Natural Gas Trading business sec-tors. Activities not assigned to a particular division are reported in Other. This comprises primarily the styrenics and fertilizers businesses. In addition, the sale of raw materials, engineering and other services, rental income and leases are reported in Other. Group corporate costs consist of the expenses for steer-ing the BASF Group and are not allocated to the segments, but rather reported under Other. With our cross-divisional corporate research, which is also reported under Other, we develop growth clusters and ensure the long-term competence of BASF with regard to technology and methods. Earnings from currency conversion reported under Other include earnings not allocated to the segments from the hedg-ing of forecasted sales, from currency positions that are mac-rohedged as well as from the conversion of financial liabilities. In addition, Other also includes income and expenses from the BASF long-term incentive program (LTI program) as well as the results of the hedging of raw material price risks that were not allocated to the segments. Transfers between the segments are almost always exe-cuted at market-based prices. The allocation of assets and depreciation to the segments is based on economic control. Assets used by more than one segment are allocated based on the percentage of usage.
BASF’s worldwide business is conducted by operating divisions that are aggregated into six segments for reporting purposes on the basis of similar products, production processes and cus-tomer industries. Chemicals consists of the Inorganics, Petrochemicals and Intermediates divisions. Its portfolio ranges from basic chemi-cals to the starting materials for the production of a variety of downstream products such as plastics, coatings, detergents, medicines. Plastics, consisting of the Performance Polymers and Poly-urethanes divisions, offers a variety of engineering plastics and the associated system solutions and services. The Performance Products segment offers innovative and specific system solutions for numerous processing industries. These include, for example, the plastics processing industry, automotive suppliers, the paper industry, refineries, users of oil-field and mining chemicals as well as leather and textiles pro-cessors. To integrate the Cognis activities, BASF established a new division in the Performance Products segment. For this rea-son, the Care Chemicals division was split into two divisions: The new division Nutrition & Health comprises products and system solutions for the health and nutrition market as well as for the fragrances and flavors industry. The Care Chemicals division comprises products and system solutions for cleaning, care, cosmetics and hygiene. The segment now consists of the Dispersions & Pigments, Care Chemicals, Nutrition & Health, Paper Chemicals and Performance Chemicals divisions. The previous year’s figures have been adjusted accordingly. Functional Solutions comprises the Catalysts, Construc-tion Chemicals and Coatings divisions. In this segment, we bun-dle tailor-made system solutions and innovative products for specific industries, in particular for the automotive, chemical and construction sectors.
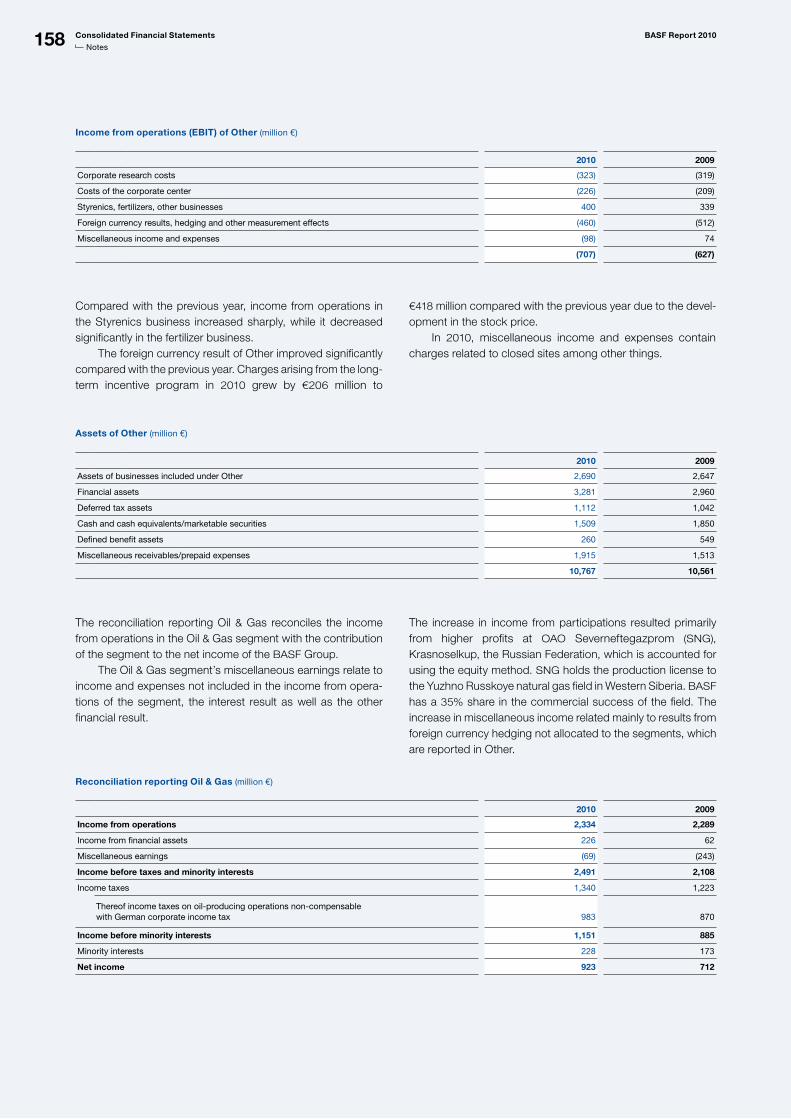
158 Consolidated Financial Statements BASF Report 2010
Notes
Income from operations (EBIT) of Other (million €)
2010 2009
Corporate research costs (323) (319)
Costs of the corporate center (226) (209)
Styrenics, fertilizers, other businesses 400 339
Foreign currency results, hedging and other measurement effects (460) (512)
Miscellaneous income and expenses (98) 74
(707) (627)
Assets of Other (million €)
2010 2009
Assets of businesses included under Other 2,690 2,647
Financial assets 3,281 2,960
Deferred tax assets 1,112 1,042
Cash and cash equivalents/marketable securities 1,509 1,850
Defined benefit assets 260 549
Miscellaneous receivables/prepaid expenses 1,915 1,513
10,767 10,561
Reconciliation reporting Oil & Gas (million €)
2010 2009
Income from operations 2,334 2,289
Income from financial assets 226 62
Miscellaneous earnings (69) (243)
Income before taxes and minority interests 2,491 2,108
Income taxes 1,340 1,223
Thereof income taxes on oilproducing operations noncompensable with German corporate income tax
983
870
Income before minority interests 1,151 885
Minority interests 228 173
Net income 923 712
The reconciliation reporting Oil & Gas reconciles the income from operations in the Oil & Gas segment with the contribution of the segment to the net income of the BASF Group. The Oil & Gas segment’s miscellaneous earnings relate to income and expenses not included in the income from opera-tions of the segment, the interest result as well as the other financial result.
Compared with the previous year, income from operations in the Styrenics business increased sharply, while it decreased significantly in the fertilizer business. The foreign currency result of Other improved significantly compared with the previous year. Charges arising from the long-term incentive program in 2010 grew by €206 million to
The increase in income from participations resulted primarily from higher profits at OAO Severneftegazprom (SNG), Krasnoselkup, the Russian Federation, which is accounted for using the equity method. SNG holds the production license to the Yuzhno Russkoye natural gas field in Western Siberia. BASF has a 35% share in the commercial success of the field. The increase in miscellaneous income related mainly to results from foreign currency hedging not allocated to the segments, which are reported in Other.
€418 million compared with the previous year due to the devel-opment in the stock price. In 2010, miscellaneous income and expenses contain charges related to closed sites among other things.
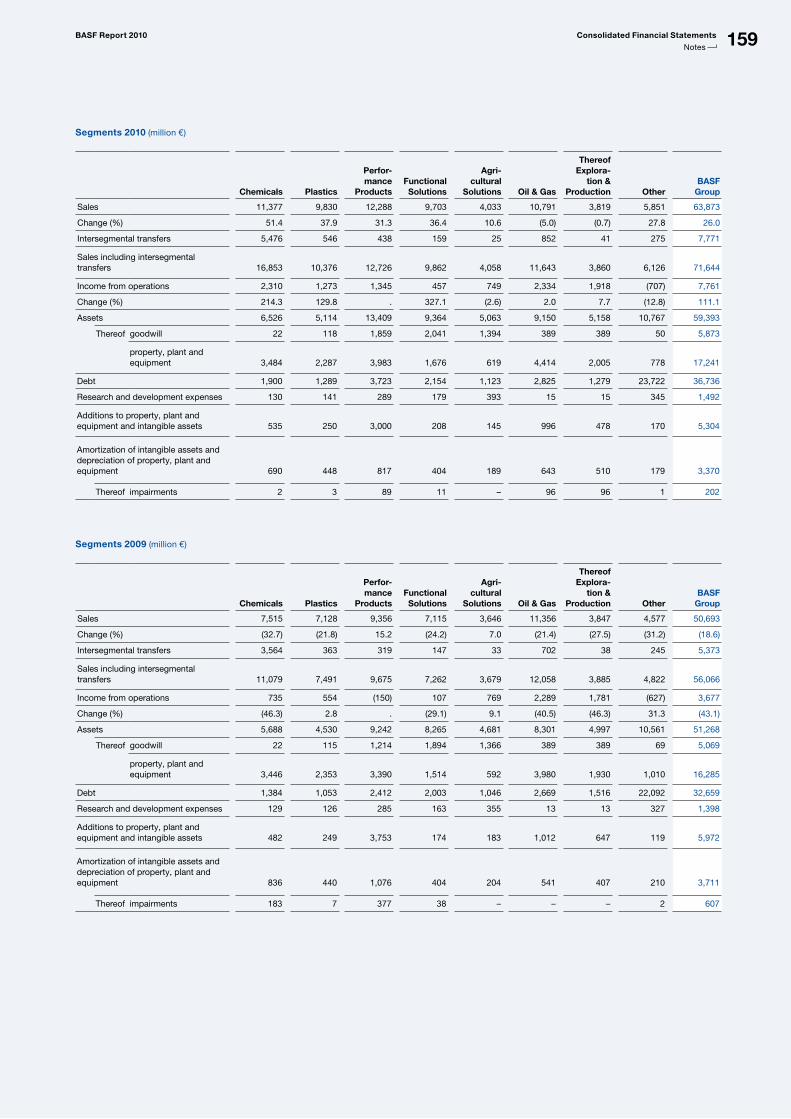
159BASF Report 2010 Consolidated Financial Statements
Notes
Segments 2010 (million €)
Chemicals Plastics
Perfor-mance
Products Functional Solutions
Agri-cultural
Solutions Oil & Gas
Thereof Explora-
tion & Production Other
BASF Group
Sales 11,377 9,830 12,288 9,703 4,033 10,791 3,819 5,851 63,873
Change (%) 51.4 37.9 31.3 36.4 10.6 (5.0) (0.7) 27.8 26.0
Intersegmental transfers 5,476 546 438 159 25 852 41 275 7,771
Sales including intersegmental transfers
16,853
10,376
12,726
9,862
4,058
11,643
3,860
6,126
71,644
Income from operations 2,310 1,273 1,345 457 749 2,334 1,918 (707) 7,761
Change (%) 214.3 129.8 . 327.1 (2.6) 2.0 7.7 (12.8) 111.1
Assets 6,526 5,114 13,409 9,364 5,063 9,150 5,158 10,767 59,393
Thereof goodwill 22 118 1,859 2,041 1,394 389 389 50 5,873
property, plant and equipment
3,484
2,287
3,983
1,676
619
4,414
2,005
778
17,241
Debt 1,900 1,289 3,723 2,154 1,123 2,825 1,279 23,722 36,736
Research and development expenses 130 141 289 179 393 15 15 345 1,492
Additions to property, plant and equipment and intangible assets
535
250
3,000
208
145
996
478
170
5,304
Amortization of intangible assets and depreciation of property, plant and equipment
690
448
817
404
189
643
510
179
3,370
Thereof impairments 2 3 89 11 – 96 96 1 202
Segments 2009 (million €)
Chemicals Plastics
Perfor-mance
Products Functional Solutions
Agri-cultural
Solutions Oil & Gas
Thereof Explora-
tion & Production Other
BASF Group
Sales 7,515 7,128 9,356 7,115 3,646 11,356 3,847 4,577 50,693
Change (%) (32.7) (21.8) 15.2 (24.2) 7.0 (21.4) (27.5) (31.2) (18.6)
Intersegmental transfers 3,564 363 319 147 33 702 38 245 5,373
Sales including intersegmental transfers
11,079
7,491
9,675
7,262
3,679
12,058
3,885
4,822
56,066
Income from operations 735 554 (150) 107 769 2,289 1,781 (627) 3,677
Change (%) (46.3) 2.8 . (29.1) 9.1 (40.5) (46.3) 31.3 (43.1)
Assets 5,688 4,530 9,242 8,265 4,681 8,301 4,997 10,561 51,268
Thereof goodwill 22 115 1,214 1,894 1,366 389 389 69 5,069
property, plant and equipment
3,446
2,353
3,390
1,514
592
3,980
1,930
1,010
16,285
Debt 1,384 1,053 2,412 2,003 1,046 2,669 1,516 22,092 32,659
Research and development expenses 129 126 285 163 355 13 13 327 1,398
Additions to property, plant and equipment and intangible assets 482 249 3,753 174 183 1,012
647
119
5,972
Amortization of intangible assets and depreciation of property, plant and equipment
836
440
1,076
404
204
541
407
210
3,711
Thereof impairments 183 7 377 38 – – – 2 607
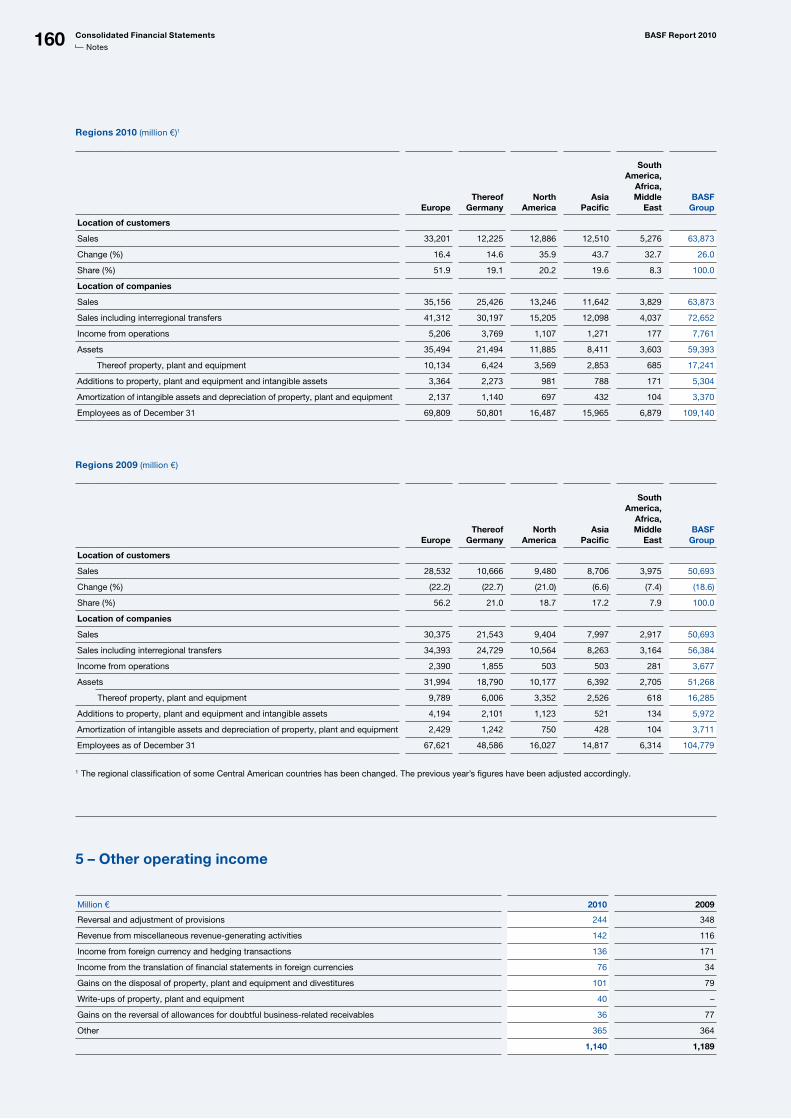
160 Consolidated Financial Statements BASF Report 2010
Notes
Regions 2010 (million €)1
EuropeThereof
GermanyNorth
AmericaAsia
Pacific
South America,
Africa, Middle
EastBASF
Group
Location of customers
Sales 33,201 12,225 12,886 12,510 5,276 63,873
Change (%) 16.4 14.6 35.9 43.7 32.7 26.0
Share (%) 51.9 19.1 20.2 19.6 8.3 100.0
Location of companies
Sales 35,156 25,426 13,246 11,642 3,829 63,873
Sales including interregional transfers 41,312 30,197 15,205 12,098 4,037 72,652
Income from operations 5,206 3,769 1,107 1,271 177 7,761
Assets 35,494 21,494 11,885 8,411 3,603 59,393
Thereof property, plant and equipment 10,134 6,424 3,569 2,853 685 17,241
Additions to property, plant and equipment and intangible assets 3,364 2,273 981 788 171 5,304
Amortization of intangible assets and depreciation of property, plant and equipment 2,137 1,140 697 432 104 3,370
Employees as of December 31 69,809 50,801 16,487 15,965 6,879 109,140
Regions 2009 (million €)
EuropeThereof
GermanyNorth
AmericaAsia
Pacific
South America,
Africa, Middle
EastBASF
Group
Location of customers
Sales 28,532 10,666 9,480 8,706 3,975 50,693
Change (%) (22.2) (22.7) (21.0) (6.6) (7.4) (18.6)
Share (%) 56.2 21.0 18.7 17.2 7.9 100.0
Location of companies
Sales 30,375 21,543 9,404 7,997 2,917 50,693
Sales including interregional transfers 34,393 24,729 10,564 8,263 3,164 56,384
Income from operations 2,390 1,855 503 503 281 3,677
Assets 31,994 18,790 10,177 6,392 2,705 51,268
Thereof property, plant and equipment 9,789 6,006 3,352 2,526 618 16,285
Additions to property, plant and equipment and intangible assets 4,194 2,101 1,123 521 134 5,972
Amortization of intangible assets and depreciation of property, plant and equipment 2,429 1,242 750 428 104 3,711
Employees as of December 31 67,621 48,586 16,027 14,817 6,314 104,779
1 The regional classification of some Central American countries has been changed. The previous year’s figures have been adjusted accordingly.
5 – Other operating income
Million € 2010 2009
Reversal and adjustment of provisions 244 348
Revenue from miscellaneous revenuegenerating activities 142 116
Income from foreign currency and hedging transactions 136 171
Income from the translation of financial statements in foreign currencies 76 34
Gains on the disposal of property, plant and equipment and divestitures 101 79
Writeups of property, plant and equipment 40 –
Gains on the reversal of allowances for doubtful businessrelated receivables 36 77
Other 365 364
1,140 1,189
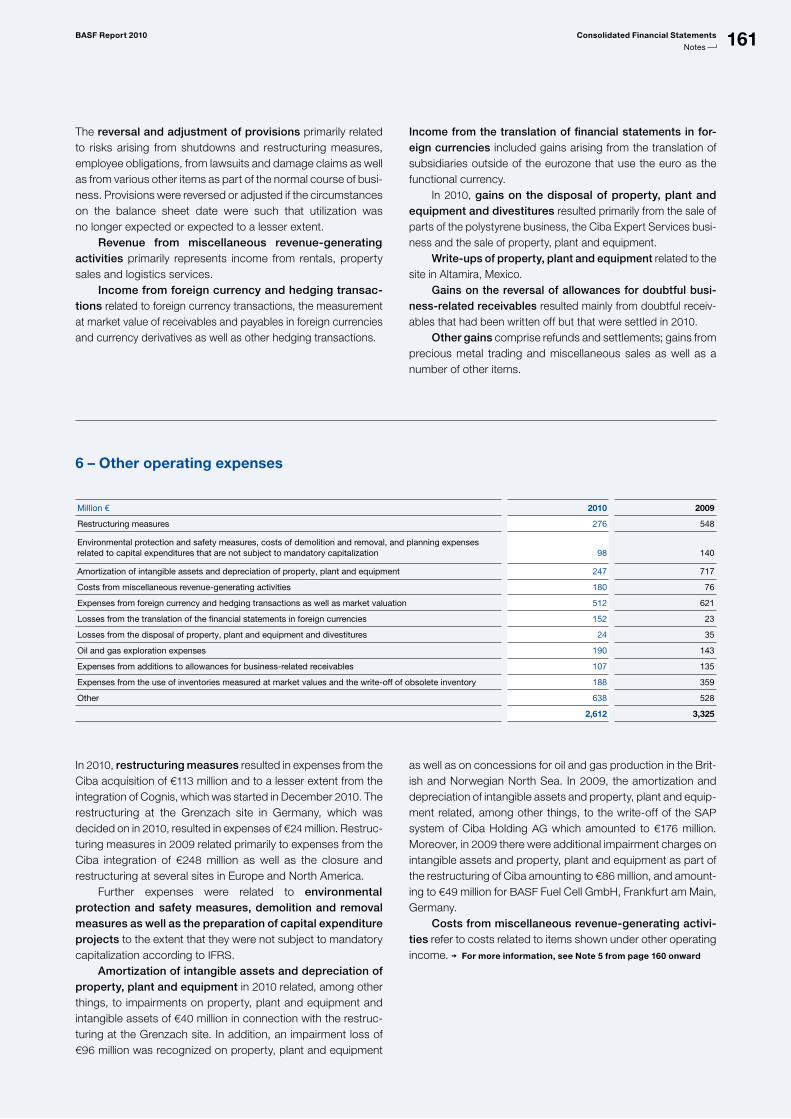
161BASF Report 2010 Consolidated Financial Statements
Notes
The reversal and adjustment of provisions primarily related to risks arising from shutdowns and restructuring measures, employee obligations, from lawsuits and damage claims as well as from various other items as part of the normal course of busi-ness. Provisions were reversed or adjusted if the circumstances on the balance sheet date were such that utilization was no longer expected or expected to a lesser extent. Revenue from miscellaneous revenue-generating activities primarily represents income from rentals, property sales and logistics services. Income from foreign currency and hedging transac-tions related to foreign currency transactions, the measurement at market value of receivables and payables in foreign currencies and currency derivatives as well as other hedging transactions.
Income from the translation of financial statements in for-eign currencies included gains arising from the translation of subsidiaries outside of the eurozone that use the euro as the functional currency. In 2010, gains on the disposal of property, plant and equipment and divestitures resulted primarily from the sale of parts of the polystyrene business, the Ciba Expert Services busi-ness and the sale of property, plant and equipment. Write-ups of property, plant and equipment related to the site in Altamira, Mexico. Gains on the reversal of allowances for doubtful busi-ness-related receivables resulted mainly from doubtful receiv-ables that had been written off but that were settled in 2010.
Other gains comprise refunds and settlements; gains from precious metal trading and miscellaneous sales as well as a number of other items.
6 – Other operating expenses
Million € 2010 2009
Restructuring measures 276 548
Environmental protection and safety measures, costs of demolition and removal, and planning expenses related to capital expenditures that are not subject to mandatory capitalization
98 140
Amortization of intangible assets and depreciation of property, plant and equipment 247 717
Costs from miscellaneous revenuegenerating activities 180 76
Expenses from foreign currency and hedging transactions as well as market valuation 512 621
Losses from the translation of the financial statements in foreign currencies 152 23
Losses from the disposal of property, plant and equipment and divestitures 24 35
Oil and gas exploration expenses 190 143
Expenses from additions to allowances for businessrelated receivables 107 135
Expenses from the use of inventories measured at market values and the writeoff of obsolete inventory 188 359
Other 638 528
2,612 3,325
In 2010, restructuring measures resulted in expenses from the Ciba acquisition of €113 million and to a lesser extent from the integration of Cognis, which was started in December 2010. The restructuring at the Grenzach site in Germany, which was decided on in 2010, resulted in expenses of €24 million. Restruc-turing measures in 2009 related primarily to expenses from the Ciba integration of €248 million as well as the closure and restructuring at several sites in Europe and North America. Further expenses were related to environmental protection and safety measures, demolition and removal meas ures as well as the preparation of capital expenditure projects to the extent that they were not subject to mandatory capitalization according to IFRS. Amortization of intangible assets and depreciation of property, plant and equipment in 2010 related, among other things, to impairments on property, plant and equipment and intangible assets of €40 million in connection with the restruc-turing at the Grenzach site. In addition, an impairment loss of €96 million was recognized on property, plant and equipment
as well as on concessions for oil and gas production in the Brit-ish and Norwegian North Sea. In 2009, the amortization and depreciation of intangible assets and property, plant and equip-ment related, among other things, to the write-off of the SAP system of Ciba Holding AG which amounted to €176 million. Moreover, in 2009 there were additional impairment charges on intangible assets and property, plant and equipment as part of the restructuring of Ciba amounting to €86 million, and amount-ing to €49 million for BASF Fuel Cell GmbH, Frankfurt am Main, Germany. Costs from miscellaneous revenue-generating activi-ties refer to costs related to items shown under other operating income. For more information, see Note 5 from page 160 onward
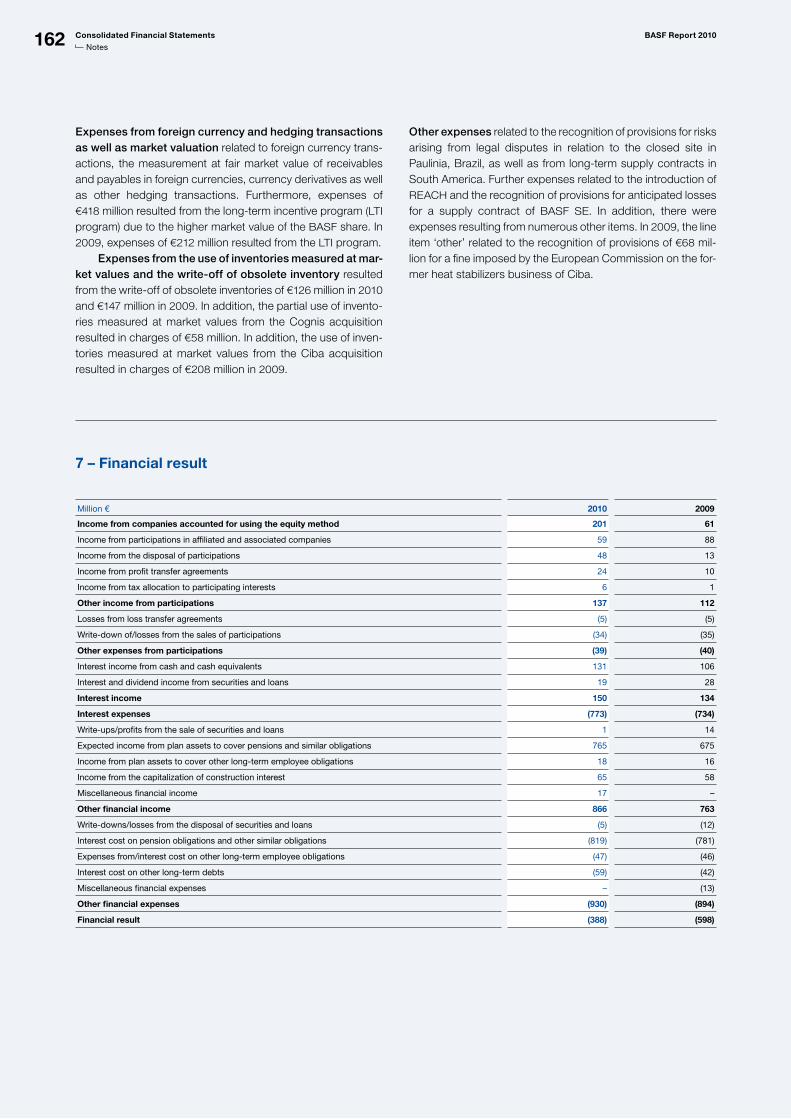
162 Consolidated Financial Statements BASF Report 2010
Notes
7 – Financial result
Million € 2010 2009
Income from companies accounted for using the equity method 201 61
Income from participations in affiliated and associated companies 59 88
Income from the disposal of participations 48 13
Income from profit transfer agreements 24 10
Income from tax allocation to participating interests 6 1
Other income from participations 137 112
Losses from loss transfer agreements (5) (5)
Writedown of/losses from the sales of participations (34) (35)
Other expenses from participations (39) (40)
Interest income from cash and cash equivalents 131 106
Interest and dividend income from securities and loans 19 28
Interest income 150 134
Interest expenses (773) (734)
Writeups/profits from the sale of securities and loans 1 14
Expected income from plan assets to cover pensions and similar obligations 765 675
Income from plan assets to cover other longterm employee obligations 18 16
Income from the capitalization of construction interest 65 58
Miscellaneous financial income 17 –
Other financial income 866 763
Writedowns/losses from the disposal of securities and loans (5) (12)
Interest cost on pension obligations and other similar obligations (819) (781)
Expenses from/interest cost on other longterm employee obligations (47) (46)
Interest cost on other longterm debts (59) (42)
Miscellaneous financial expenses – (13)
Other financial expenses (930) (894)
Financial result (388) (598)
Expenses from foreign currency and hedging transactions as well as market valuation related to foreign currency trans-actions, the measurement at fair market value of receivables and payables in foreign currencies, currency derivatives as well as other hedging transactions. Furthermore, expenses of €418 million resulted from the long-term incentive program (LTI program) due to the higher market value of the BASF share. In 2009, expenses of €212 million resulted from the LTI program. Expenses from the use of inventories measured at mar-ket values and the write-off of obsolete inventory resulted from the write-off of obsolete inventories of €126 million in 2010 and €147 million in 2009. In addition, the partial use of invento-ries measured at market values from the Cognis acquisition resulted in charges of €58 million. In addition, the use of inven-tories measured at market values from the Ciba acquisition resulted in charges of €208 million in 2009.
Other expenses related to the recognition of provisions for risks arising from legal disputes in relation to the closed site in Paulinia, Brazil, as well as from long-term supply contracts in South America. Further expenses related to the introduction of REACH and the recognition of provisions for anticipated losses for a supply contract of BASF SE. In addition, there were expenses resulting from numerous other items. In 2009, the line item ‘other’ related to the recognition of provisions of €68 mil-lion for a fine imposed by the European Commission on the for-mer heat stabilizers business of Ciba.
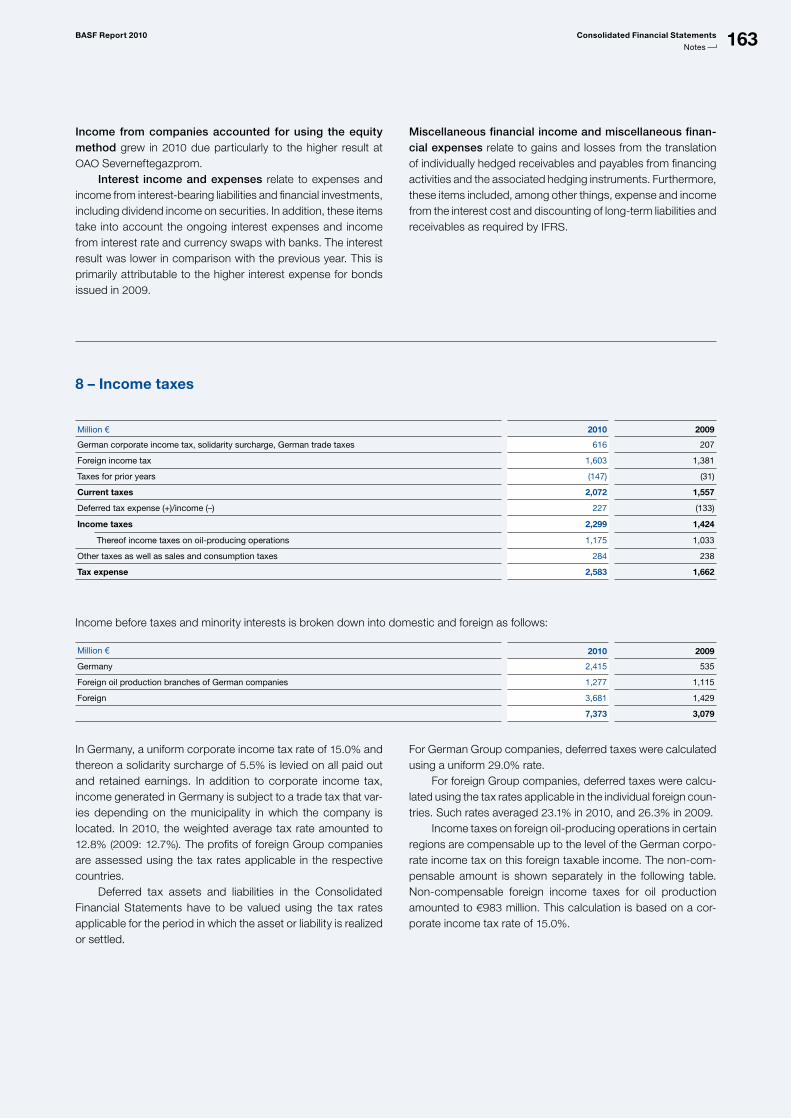
163BASF Report 2010 Consolidated Financial Statements
Notes
Income from companies accounted for using the equity method grew in 2010 due particularly to the higher result at OAO Severneftegazprom. Interest income and expenses relate to expenses and income from interest-bearing liabilities and financial investments, including dividend income on securities. In addition, these items take into account the ongoing interest expenses and income from interest rate and currency swaps with banks. The interest result was lower in comparison with the previous year. This is primarily attributable to the higher interest expense for bonds issued in 2009.
Miscellaneous financial income and miscellaneous finan-cial expenses relate to gains and losses from the translation of individually hedged receivables and payables from financing activities and the associated hedging instruments. Furthermore, these items included, among other things, expense and income from the interest cost and discounting of long-term liabilities and receivables as required by IFRS.
8 – Income taxes
Million € 2010 2009
German corporate income tax, solidarity surcharge, German trade taxes 616 207
Foreign income tax 1,603 1,381
Taxes for prior years (147) (31)
Current taxes 2,072 1,557
Deferred tax expense (+)/income (–) 227 (133)
Income taxes 2,299 1,424
Thereof income taxes on oilproducing operations 1,175 1,033
Other taxes as well as sales and consumption taxes 284 238
Tax expense 2,583 1,662
Income before taxes and minority interests is broken down into domestic and foreign as follows:
Million € 2010 2009
Germany 2,415 535
Foreign oil production branches of German companies 1,277 1,115
Foreign 3,681 1,429
7,373 3,079
In Germany, a uniform corporate income tax rate of 15.0% and thereon a solidarity surcharge of 5.5% is levied on all paid out and retained earnings. In addition to corporate income tax, income generated in Germany is subject to a trade tax that var-ies depending on the municipality in which the company is located. In 2010, the weighted average tax rate amounted to 12.8% (2009: 12.7%). The profits of foreign Group companies are assessed using the tax rates applicable in the respective countries. Deferred tax assets and liabilities in the Consolidated Financial Statements have to be valued using the tax rates applicable for the period in which the asset or liability is realized or settled.
For German Group companies, deferred taxes were calculated using a uniform 29.0% rate. For foreign Group companies, deferred taxes were calcu-lated using the tax rates applicable in the individual foreign coun-tries. Such rates averaged 23.1% in 2010, and 26.3% in 2009. Income taxes on foreign oil-producing operations in certain regions are compensable up to the level of the German corpo-rate income tax on this foreign taxable income. The non-com-pensable amount is shown separately in the following table. Non-compensable foreign income taxes for oil production amounted to €983 million. This calculation is based on a cor-porate income tax rate of 15.0%.
164 Consolidated Financial Statements BASF Report 2010
Notes
Reconciliation from the statutory tax rate in Germany to the effective tax rate
2010 2009
Million € % Million € %
Income before taxes and minority interests 7,373 – 3,079 –
Expected tax based on German corporate income tax (15%) 1,106 15.0 462 15.0
Solidarity surcharge 15 0.2 4 0.1
German trade income tax 347 4.7 119 3.9
Foreign taxrate differential 299 4.1 146 4.7
Tax exempt income (137) (1.9) (90) (2.9)
Nondeductible expenses 71 1.0 75 2.4
Income after taxes of companies accounted for using the equity method (30) (0.4) (9) (0.3)
Taxes for prior years (147) (2.0) (31) (1.0)
Income taxes on oilproducing operations noncompensable with German corporate income tax
983
13.3
870
28.2
Deferred tax liabilities for planned dividend distributions of Group companies 77 1.1 (19) (0.6)
Other (285) (3.9) (103) (3.3)
Income taxes/effective tax rates 2,299 31.2 1,424 46.2
Deferred tax assets and liabilities (million €)
Deferred tax assets Deferred tax liabilities
2010 2009 2010 2009
Intangible assets 209 88 1,710 1,405
Property, plant and equipment 250 245 2,163 1,743
Financial assets 13 9 116 86
Inventories and accounts receivable 301 256 504 433
Provisions for pensions 1,278 902 529 368
Other provisions and liabilities 939 622 38 52
Tax loss carryforwards 794 927 – –
Other 293 260 246 133
Netting (2,839) (2,127) (2,839) (2,127)
Valuation allowances for deferred tax assets (126) (140) – –
Thereof for tax loss carryforwards (86) (90) – –
Total 1,112 1,042 2,467 2,093
Thereof shortterm 507 367 370 314
Other taxes include real estate taxes and other comparable taxes in the amount of €99 million in 2010 and €103 million in 2009; they are allocated to the appropriate functional costs.
For planned dividend distributions of Group companies, the resulting future income and withholding taxes are treated as deferred tax liabilities. An increase in the planned dividend dis-tributions led to a deferred tax expense of €77 million in 2010.
Changes in valuation allowances on deferred tax assets for tax loss carryforwards resulted in a gain of €4 million in 2010 and €22 million in 2009.
The final tax assessment in the North American region led to a tax income for prior years of €100 million.
Deferred taxes result primarily from temporary differences between tax balances and the valuation of assets and liabilities according to IFRS as well as from tax loss carryforwards. The revaluation of all the assets and liabilities associated with acqui-sitions according to IFRS 3 has resulted in significant deviations between fair values and the values in the tax accounts. This has primarily led to deferred tax liabilities.
Deferred tax assets were offset against deferred tax liabilities of the same maturity if they were related to the same taxation authority.
165BASF Report 2010 Consolidated Financial Statements
Notes
Minority interests in profits resulted primarily from natural gas trading companies as well as Gazprom’s stake in the Winters-hall subsidiary that holds production and exploration rights in Libya. Minority interests in profits were higher compared with 2009, in particular at BASF PETRONAS Chemicals Sdn. Bhd., based in Malaysia, and BASF FINA Petrochemicals Ltd. Part-nership, based in the United States.
For more information on minority interests in consolidated compa-nies, see Note 19 on page 176
9 – Minority interests
Million € 2010 2009
Minority interests in profits 517 259
Minority interests in losses – 14
517 245
Declaration of conformity in accordance with Sec-tion 161 of the German Stock Corporation ActThe annual declaration of conformity with the German Corpo-rate Governance Code according to Section 161 of the German Stock Corporation Act was signed by the Board of Executive Directors and the Supervisory Board of BASF SE on Decem-ber 16, 2010, and is published on the Internet at:
basf.com/governance_e
Number of employeesOn December 31, 2010, the number of employees was 109,140 (December 31, 2009: 104,779). This increase compared with 2009 resulted primarily from the acquisition of Cognis.
The number of employees in proportionally consolidated com-panies is included in full in the table below. Considered pro-rata, the average number of employees in the BASF Group was 104,043 in 2010 and 103,612 in 2009.
Personnel expensesPersonnel expenses increased by 15.8%, from €7,107 million in 2009 to €8,228 million in 2010. This resulted in particular from higher provisions for the stock price-based compensation pro-gram (long-term incentive program) and for salary components related to the success of the BASF Group as well as from the acquisition of Ciba Holding AG.
10 – Other information
Deferred tax liabilities for undistributed earnings of subsidiaries in the amount of €3,576 million in 2010 and €6,561 million in 2009 were not recognized, as they are either not subject to tax-ation on payout or they are expected to be reinvested for indef-inite periods of time. The regional distribution of tax loss carryforwards is as follows:
Tax loss carryforwards (million €)
Tax loss carryforwards Deferred tax assets
2010 2009 2010 2009
Germany 19 14 3 9
Foreign 3,004 3,161 705 828
3,023 3,175 708 837
German tax losses may be carried forward indefinitely. Foreign tax loss carryforwards exist primarily in North America. These expire starting in 2021. Tax loss carryforwards in North America were reduced in 2010 as a result of high earnings.
Valuation allowances were reversed for tax loss carryforwards of €78 million (2009: €74 million). Tax obligations are comprised of both tax liabilities and short-term tax provisions. Tax liabilities primarily concern the assessed income taxes and other taxes. Tax provisions con-cern estimated income taxes not yet assessed for the current and previous years.
Tax liabilities (million €)
2010 2009
Tax provisions 499 431
Tax liabilities 641 572
1,140 1,003
166 Consolidated Financial Statements BASF Report 2010
Notes
Personnel expenses (million €)
2010 2009
Wages and salaries 6,731 5,942
Social security contributions and expenses for pensions and assistance 1,497 1,165
Thereof for pension benefits 408 178
8,228 7,107
Average number of employees1
Consolidated companiesProportionally consolidated
companies BASF Group
2010 2009 2010 2009 2010 2009
Europe 66,772 66,310 431 431 67,203 66,741
Thereof Germany 48,620 48,180 16 19 48,636 48,199
North America 15,517 15,822 476 460 15,993 16,282
Asia Pacific 13,776 13,788 2,137 1,993 15,913 15,781
South America, Africa, Middle East 6,456 6,250 – – 6,456 6,250
BASF Group 102,521 102,170 3,044 2,884 105,565 105,054
Thereof with trainee contracts 2,113 2,097 3 1 2,116 2,098
employees with limitedterm contracts
2,214
2,129
105
37
2,319
2,166
1 The regional classification of some Central American countries has been changed. The previous year’s figures have been adjusted accordingly.
Additional information on cash flowsIn 2010, changes were made to the presentation of cash flows from financing and operating activities. In connection with hedg-ing activities for the financing of our North American business, euro are exchanged for U.S. dollars at banks. The regular renewal of these hedging transactions results in inflows or out-flows in euro depending on the development of the U.S. dollar exchange rate. Until 2009, these payments were reported under cash from operating activities. Now, they are reported as changes in financial liabilities under cash from financing activi-ties. This change in presentation was made due to the lasting increase in volatility on the currency markets. The presentation of currency effects related to financial liabilities under cash from financing activities increases the transparency of the consoli-dated statements of cash flows. In line with this change in presentation, the figures from the previous year have been adjusted accordingly. The change in presentation resulted in a decline in cash from operating activ-ities of €577 million in favor of cash from financing activities. In 2010, this effect amounted to €382 million. This is the value by which the cash flow from operating activities improved com-pared with the previous classification.
Cash provided by operating activities includes the following cash flows:
Million € 2010 2009
Income tax payments 2,051 1,650
Interest payments 639 522
Dividends received 75 93
Interest payments comprise interest received of €106 million (2009: €98 million) and interest paid out of €745 million (2009: €620 million).
Capital structure managementThe goal of capital structure management is to maintain the financial flexibility needed to continually develop our business portfolio and take advantage of strategic opportunities. The objectives of our financing policy are to ensure liquidity, limit financial risks and optimize the cost of capital by means of an appropriate capital structure. The capital structure is orientated to the needs of the operational business and the company’s strategic direction.
11 – Consolidated statements of cash flows and capital structure management
167BASF Report 2010 Consolidated Financial Statements
Notes
The goodwill of BASF is allocated to 31 cash-generating units which are defined either on the basis of business units or on a higher level. The goodwill of €589 million arising from the acqui-sition of Cognis in 2010 was allocated to cash-generating units in the Care Chemicals, Nutrition & Health and Performance Chemicals divisions. The annual impairment testing took place in the fourth quar-ter of the year on the basis of the cash-generating units. The recoverable amount was determined using the value-in-use. In doing this, the plans approved by corporate management for the next five years were used. The cash flows after the planning period are based on the last business year and extrapolated with the help of long-term growth trends. The planning is based on the experience, current performance and best possible cor-porate management estimates on the future development of the individual parameters such as raw material prices and profit mar-gins. Market assumptions regarding, for example, economic development and market growth are included based on exter-nal macroeconomic sources as well as sources specific to the industry. The weighted average cost of capital percentage after tax required for the impairment tests is determined using the Cap-ital Asset Pricing Model. It comprises a risk-free rate, the mar-ket risk premium and the spread for the credit risk. The calcu-lation also takes into account the volatility of the BASF share in comparison to the capital market (beta), the capital structure of the BASF Group and the average tax rate of each cash-gener-ating unit.
The major part of goodwill amounting to €5,873 million in total (2009: €5,069 million) is allocated to the following cash-gener-ating units: The goodwill of the Crop Protection division in the Agricultural Solutions segment amounts to €1,394 million (2009: €1,366 million). Goodwill of €1,342 million (2009: €1,253 million) and €685 million (2009: €627 million) relate to the Catalysts and Construction Chemicals divisions in the Functional Solutions segment. Goodwill of €389 million (2009: €389 million) is allo-cated to the Oil & Gas segment. The impairment tests were conducted using the following assumptions: a weighted average cost of capital between 6.96% and 7.28% (2009: 7.15% to 7.64%) and a long-term growth rate between 0.0% and 2.0% (2009: 0.0% to 2.0%). In determining the value-in-use of the cash-generating units, BASF assumes that changes in those material assumptions classified as pos-sible will not lead to the book values of the units exceeding the recoverable amount. In 2010, the impairment tests resulted in no impairment losses on goodwill. In 2009, impairment losses of €220 million were recognized.
12 – Intangible assets
Capital structure management at BASF is in line with the defini-tion of stockholders’ equity. The capital structure of BASF is planned and controlled using selected financial ratios, within the framework of our financial management. Stockholders’ equity as reported on the balance sheet amounted to €22,657 million as of December 31, 2010 (December 31, 2009: €18,609 million). The equity ratio amounted to 38.1% on December 31, 2010 (December 31, 2009: 36.3%).
BASF prefers to access external financing via the capital markets. A commercial paper program is used for short-term financing, while corporate bonds are used for financing in the mid- and long-term. These are issued in euro and other curren-cies with different maturities. This ensures a balanced maturity profile and a diverse range of investors.
Currently, BASF has the following ratings:
December 31, 2010 December 31, 2009
Moody’sStandard & Poor’s Moody’s
Standard & Poor’s
Longterm financial indebtedness A1 A A1 A+
Shortterm financial indebtedness P1 A1 P1 A1
Outlook negative stable stable negative
In November 2010, Moody’s confirmed BASF’s A1 long-term rating, however with a negative outlook. Following the June 2010 announcement of the acquisition of Cognis, Standard & Poor’s lowered its long-term rating for BASF by one notch to “A” and the outlook to stable. BASF’s short-term ratings were confirmed by both agencies. BASF continues to aim for a solid A rating, which allows unrestricted access to capital markets.
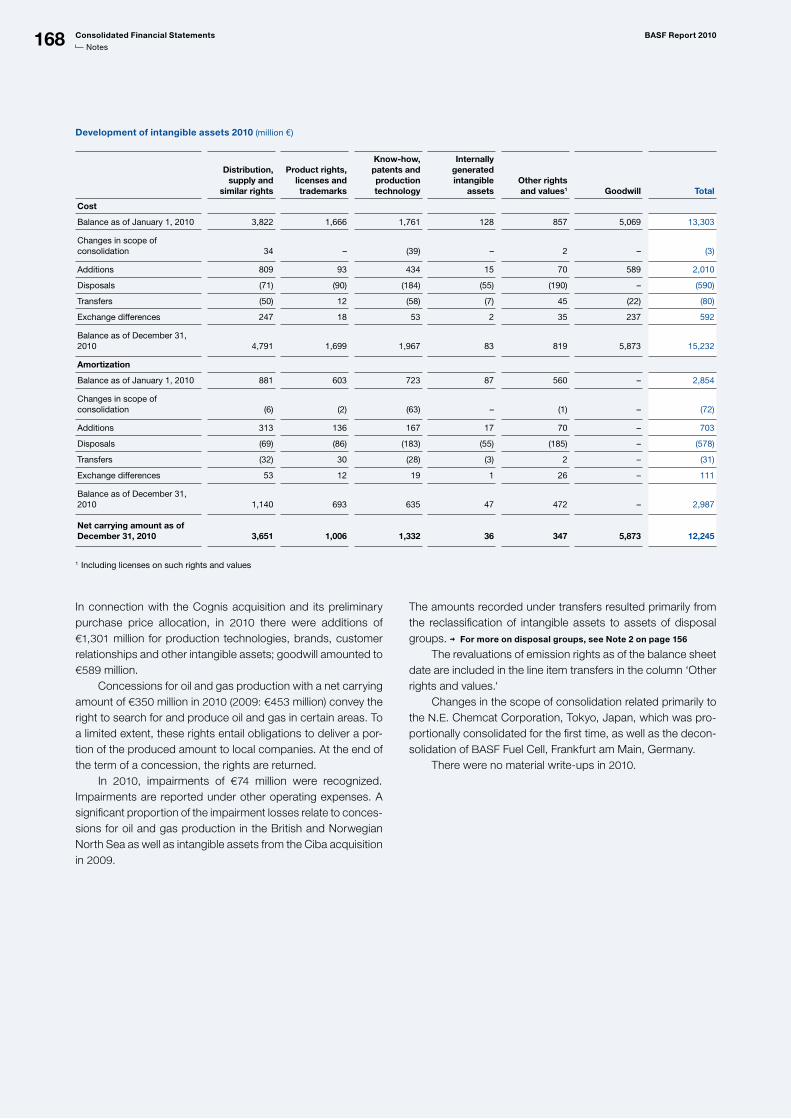
168 Consolidated Financial Statements BASF Report 2010
Notes
Development of intangible assets 2010 (million €)
Distribution, supply and
similar rights
Product rights, licenses and trademarks
Know-how, patents and production technology
Internally generated intangible
assetsOther rights and values1 Goodwill Total
Cost
Balance as of January 1, 2010 3,822 1,666 1,761 128 857 5,069 13,303
Changes in scope of consolidation
34
–
(39)
–
2
–
(3)
Additions 809 93 434 15 70 589 2,010
Disposals (71) (90) (184) (55) (190) – (590)
Transfers (50) 12 (58) (7) 45 (22) (80)
Exchange differences 247 18 53 2 35 237 592
Balance as of December 31, 2010
4,791
1,699
1,967
83
819
5,873
15,232
Amortization
Balance as of January 1, 2010 881 603 723 87 560 – 2,854
Changes in scope of consolidation
(6)
(2)
(63)
–
(1) –
(72)
Additions 313 136 167 17 70 – 703
Disposals (69) (86) (183) (55) (185) – (578)
Transfers (32) 30 (28) (3) 2 – (31)
Exchange differences 53 12 19 1 26 – 111
Balance as of December 31, 2010
1,140
693
635
47
472
–
2,987
Net carrying amount as of December 31, 2010
3,651
1,006
1,332
36
347
5,873
12,245
1 Including licenses on such rights and values
In connection with the Cognis acquisition and its preliminary purchase price allocation, in 2010 there were additions of €1,301 million for production technologies, brands, customer relationships and other intangible assets; goodwill amounted to €589 million. Concessions for oil and gas production with a net carrying amount of €350 million in 2010 (2009: €453 million) convey the right to search for and produce oil and gas in certain areas. To a limited extent, these rights entail obligations to deliver a por-tion of the produced amount to local companies. At the end of the term of a concession, the rights are returned. In 2010, impairments of €74 million were recognized. Impairments are reported under other operating expenses. A significant proportion of the impairment losses relate to conces-sions for oil and gas production in the British and Norwegian North Sea as well as intangible assets from the Ciba acquisition in 2009.
The amounts recorded under transfers resulted primarily from the reclassification of intangible assets to assets of disposal groups. For more on disposal groups, see Note 2 on page 156
The revaluations of emission rights as of the balance sheet date are included in the line item transfers in the column ‘Other rights and values.’ Changes in the scope of consolidation related primarily to the N.E. Chemcat Corporation, Tokyo, Japan, which was pro-portionally consolidated for the first time, as well as the decon-solidation of BASF Fuel Cell, Frankfurt am Main, Germany. There were no material write-ups in 2010.
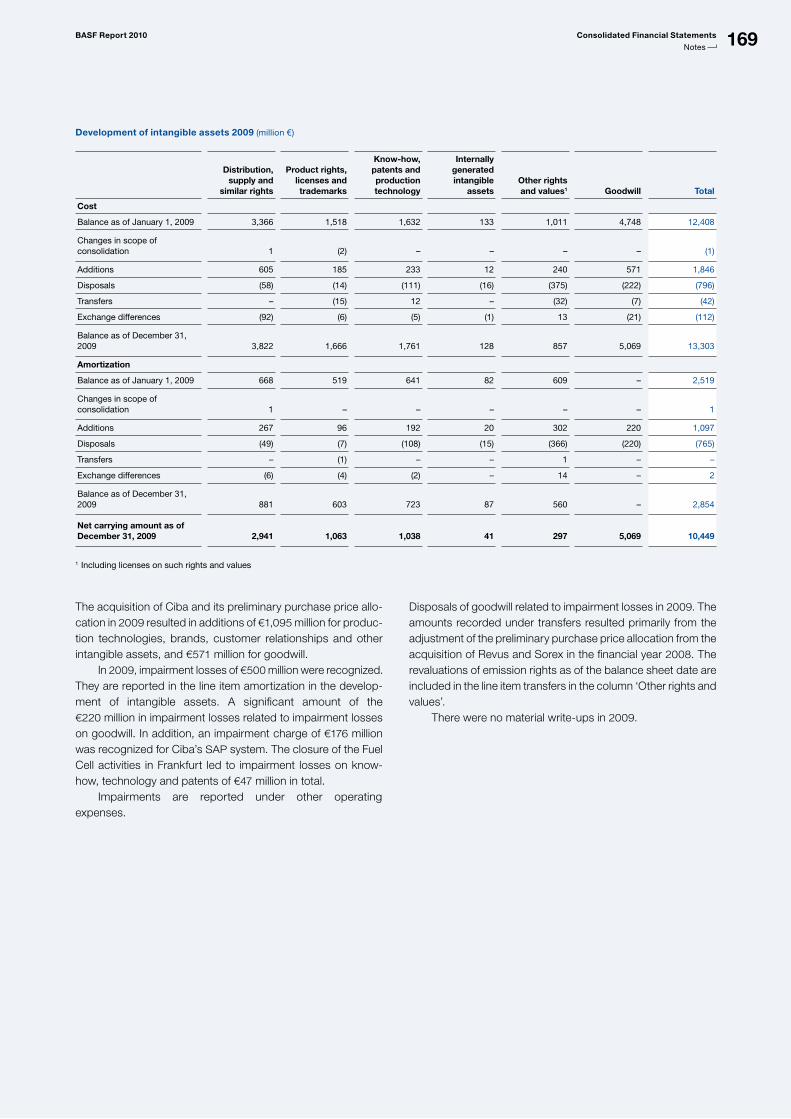
169BASF Report 2010 Consolidated Financial Statements
Notes
The acquisition of Ciba and its preliminary purchase price allo-cation in 2009 resulted in additions of €1,095 million for produc-tion technologies, brands, customer relationships and other intangible assets, and €571 million for goodwill. In 2009, impairment losses of €500 million were recognized. They are reported in the line item amortization in the develop-ment of intangible assets. A significant amount of the €220 million in impairment losses related to impairment losses on goodwill. In addition, an impairment charge of €176 million was recognized for Ciba’s SAP system. The closure of the Fuel Cell activities in Frankfurt led to impairment losses on know-how, technology and patents of €47 million in total. Impairments are reported under other operating expenses.
Disposals of goodwill related to impairment losses in 2009. The amounts recorded under transfers resulted primarily from the adjustment of the preliminary purchase price allocation from the acquisition of Revus and Sorex in the financial year 2008. The revaluations of emission rights as of the balance sheet date are included in the line item transfers in the column ‘Other rights and values’. There were no material write-ups in 2009.
Development of intangible assets 2009 (million €)
Distribution, supply and
similar rights
Product rights, licenses and trademarks
Know-how, patents and production technology
Internally generated intangible
assetsOther rights and values1 Goodwill Total
Cost
Balance as of January 1, 2009 3,366 1,518 1,632 133 1,011 4,748 12,408
Changes in scope of consolidation
1
(2)
–
–
–
–
(1)
Additions 605 185 233 12 240 571 1,846
Disposals (58) (14) (111) (16) (375) (222) (796)
Transfers – (15) 12 – (32) (7) (42)
Exchange differences (92) (6) (5) (1) 13 (21) (112)
Balance as of December 31, 2009
3,822
1,666
1,761 128
857
5,069
13,303
Amortization
Balance as of January 1, 2009 668 519 641 82 609 – 2,519
Changes in scope of consolidation
1
–
–
–
–
–
1
Additions 267 96 192 20 302 220 1,097
Disposals (49) (7) (108) (15) (366) (220) (765)
Transfers – (1) – – 1 – –
Exchange differences (6) (4) (2) – 14 – 2
Balance as of December 31, 2009
881
603
723
87
560
–
2,854
Net carrying amount as of December 31, 2009
2,941
1,063
1,038
41
297
5,069
10,449
1 Including licenses on such rights and values
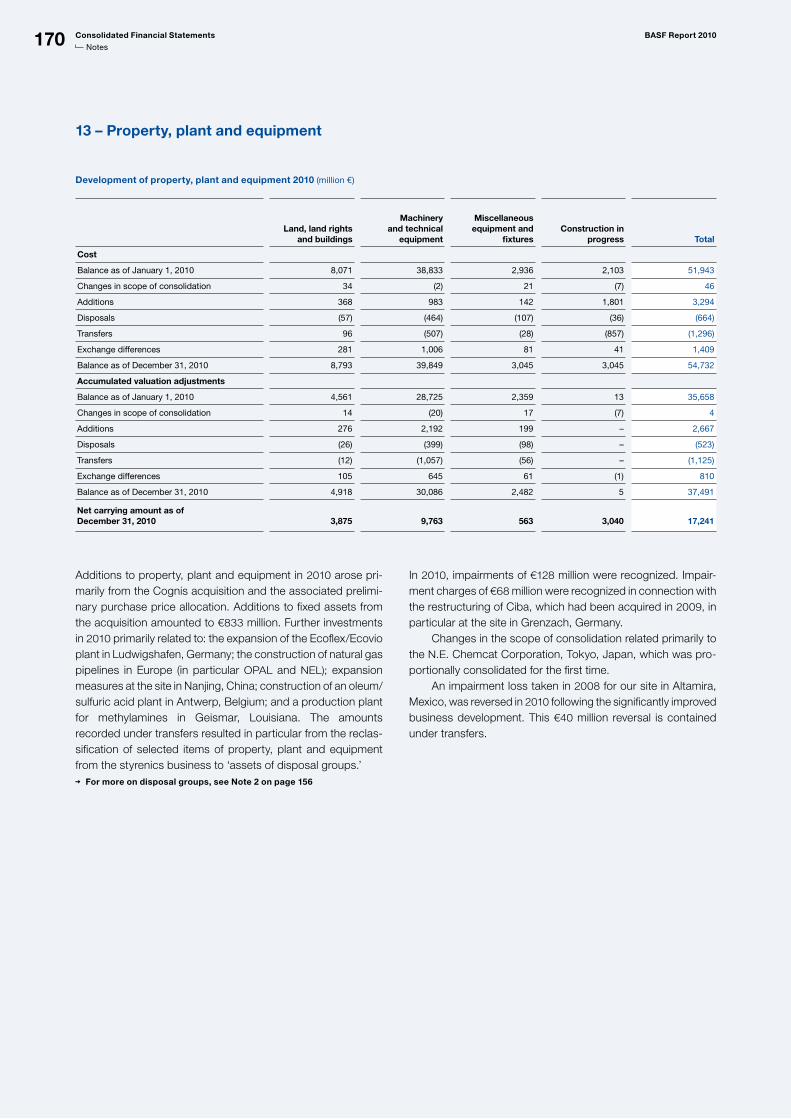
170 Consolidated Financial Statements BASF Report 2010
Notes
Additions to property, plant and equipment in 2010 arose pri-marily from the Cognis acquisition and the associated prelimi-nary purchase price allocation. Additions to fixed assets from the acquisition amounted to €833 million. Further investments in 2010 primarily related to: the expansion of the Ecoflex/Ecovio plant in Ludwigshafen, Germany; the construction of natural gas pipelines in Europe (in particular OPAL and NEL); expansion measures at the site in Nanjing, China; construction of an oleum/sulfuric acid plant in Antwerp, Belgium; and a production plant for methylamines in Geismar, Louisiana. The amounts recorded under transfers resulted in particular from the reclas-sification of selected items of property, plant and equipment from the styrenics business to ‘assets of disposal groups.’
For more on disposal groups, see Note 2 on page 156
In 2010, impairments of €128 million were recognized. Impair-ment charges of €68 million were recognized in connection with the restructuring of Ciba, which had been acquired in 2009, in particular at the site in Grenzach, Germany. Changes in the scope of consolidation related primarily to the N.E. Chemcat Corporation, Tokyo, Japan, which was pro-portionally consolidated for the first time. An impairment loss taken in 2008 for our site in Altamira, Mexico, was reversed in 2010 following the significantly improved business development. This €40 million reversal is contained under transfers.
13 – Property, plant and equipment
Development of property, plant and equipment 2010 (million €)
Land, land rights and buildings
Machinery and technical
equipment
Miscellaneous equipment and
fixturesConstruction in
progress Total
Cost
Balance as of January 1, 2010 8,071 38,833 2,936 2,103 51,943
Changes in scope of consolidation 34 (2) 21 (7) 46
Additions 368 983 142 1,801 3,294
Disposals (57) (464) (107) (36) (664)
Transfers 96 (507) (28) (857) (1,296)
Exchange differences 281 1,006 81 41 1,409
Balance as of December 31, 2010 8,793 39,849 3,045 3,045 54,732
Accumulated valuation adjustments
Balance as of January 1, 2010 4,561 28,725 2,359 13 35,658
Changes in scope of consolidation 14 (20) 17 (7) 4
Additions 276 2,192 199 – 2,667
Disposals (26) (399) (98) – (523)
Transfers (12) (1,057) (56) – (1,125)
Exchange differences 105 645 61 (1) 810
Balance as of December 31, 2010 4,918 30,086 2,482 5 37,491
Net carrying amount as of December 31, 2010
3,875
9,763
563
3,040
17,241
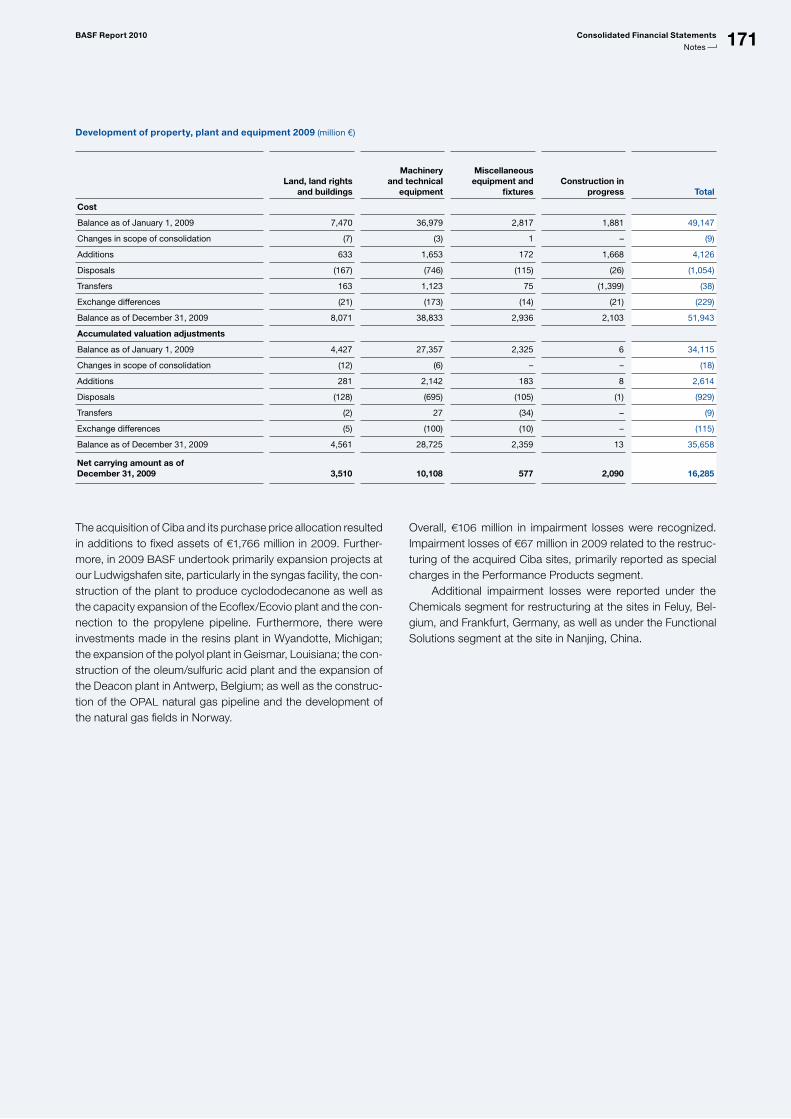
171BASF Report 2010 Consolidated Financial Statements
Notes
The acquisition of Ciba and its purchase price allocation resulted in additions to fixed assets of €1,766 million in 2009. Further-more, in 2009 BASF undertook primarily expansion projects at our Ludwigshafen site, particularly in the syngas facility, the con-struction of the plant to produce cyclododecanone as well as the capacity expansion of the Ecoflex/Ecovio plant and the con-nection to the propylene pipeline. Furthermore, there were investments made in the resins plant in Wyandotte, Michigan; the expansion of the polyol plant in Geismar, Louisiana; the con-struction of the oleum/sulfuric acid plant and the expansion of the Deacon plant in Antwerp, Belgium; as well as the construc-tion of the OPAL natural gas pipeline and the development of the natural gas fields in Norway.
Overall, €106 million in impairment losses were recognized. Impairment losses of €67 million in 2009 related to the restruc-turing of the acquired Ciba sites, primarily reported as special charges in the Performance Products segment. Additional impairment losses were reported under the Chemicals segment for restructuring at the sites in Feluy, Bel-gium, and Frankfurt, Germany, as well as under the Functional Solutions segment at the site in Nanjing, China.
Development of property, plant and equipment 2009 (million €)
Land, land rights and buildings
Machinery and technical
equipment
Miscellaneous equipment and
fixturesConstruction in
progress Total
Cost
Balance as of January 1, 2009 7,470 36,979 2,817 1,881 49,147
Changes in scope of consolidation (7) (3) 1 – (9)
Additions 633 1,653 172 1,668 4,126
Disposals (167) (746) (115) (26) (1,054)
Transfers 163 1,123 75 (1,399) (38)
Exchange differences (21) (173) (14) (21) (229)
Balance as of December 31, 2009 8,071 38,833 2,936 2,103 51,943
Accumulated valuation adjustments
Balance as of January 1, 2009 4,427 27,357 2,325 6 34,115
Changes in scope of consolidation (12) (6) – – (18)
Additions 281 2,142 183 8 2,614
Disposals (128) (695) (105) (1) (929)
Transfers (2) 27 (34) – (9)
Exchange differences (5) (100) (10) – (115)
Balance as of December 31, 2009 4,561 28,725 2,359 13 35,658
Net carrying amount as of December 31, 2009
3,510
10,108
577
2,090
16,285
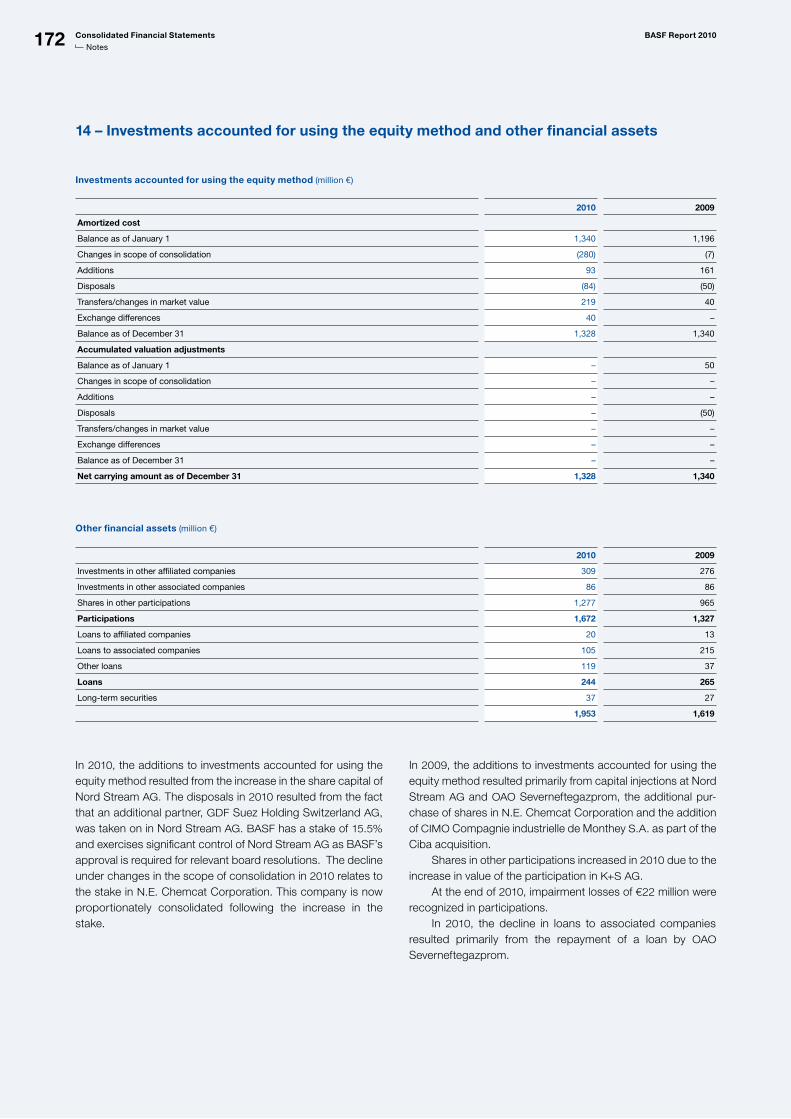
Consolidated Financial Statements BASF Report 2010
Notes172
14 – Investments accounted for using the equity method and other financial assets
Investments accounted for using the equity method (million €)
2010 2009
Amortized cost
Balance as of January 1 1,340 1,196
Changes in scope of consolidation (280) (7)
Additions 93 161
Disposals (84) (50)
Transfers/changes in market value 219 40
Exchange differences 40 –
Balance as of December 31 1,328 1,340
Accumulated valuation adjustments
Balance as of January 1 – 50
Changes in scope of consolidation – –
Additions – –
Disposals – (50)
Transfers/changes in market value – –
Exchange differences – –
Balance as of December 31 – –
Net carrying amount as of December 31 1,328 1,340
Other financial assets (million €)
2010 2009
Investments in other affiliated companies 309 276
Investments in other associated companies 86 86
Shares in other participations 1,277 965
Participations 1,672 1,327
Loans to affiliated companies 20 13
Loans to associated companies 105 215
Other loans 119 37
Loans 244 265
Longterm securities 37 27
1,953 1,619
In 2010, the additions to investments accounted for using the equity method resulted from the increase in the share capital of Nord Stream AG. The disposals in 2010 resulted from the fact that an additional partner, GDF Suez Holding Switzerland AG, was taken on in Nord Stream AG. BASF has a stake of 15.5% and exercises significant control of Nord Stream AG as BASF’s approval is required for relevant board resolutions. The decline under changes in the scope of consolidation in 2010 relates to the stake in N.E. Chemcat Corporation. This company is now proportionately consolidated following the increase in the stake.
In 2009, the additions to investments accounted for using the equity method resulted primarily from capital injections at Nord Stream AG and OAO Severneftegazprom, the additional pur-chase of shares in N.E. Chemcat Corporation and the addition of CIMO Compagnie industrielle de Monthey S.A. as part of the Ciba acquisition. Shares in other participations increased in 2010 due to the increase in value of the participation in K+S AG.
At the end of 2010, impairment losses of €22 million were recognized in participations. In 2010, the decline in loans to associated companies resulted primarily from the repayment of a loan by OAO Severneftegazprom.
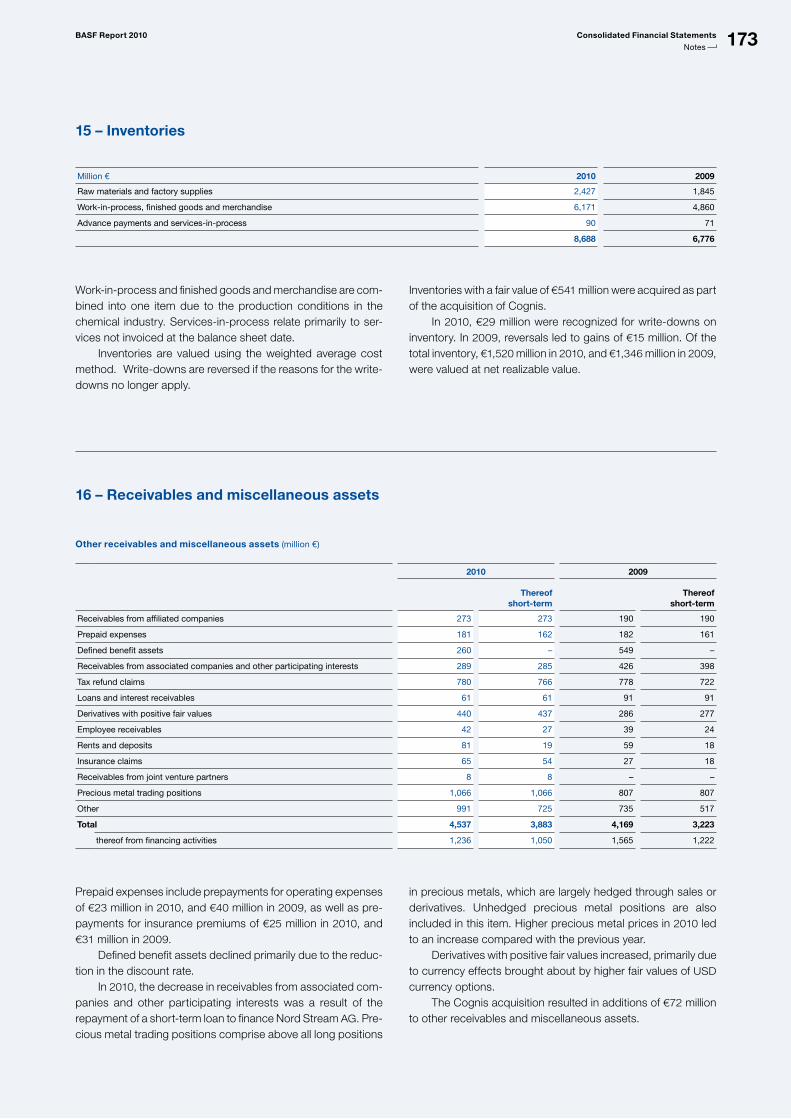
BASF Report 2010 Consolidated Financial Statements
Notes 173
16 – Receivables and miscellaneous assets
Other receivables and miscellaneous assets (million €)
2010 2009
Thereof
short-term Thereof
short-term
Receivables from affiliated companies 273 273 190 190
Prepaid expenses 181 162 182 161
Defined benefit assets 260 – 549 –
Receivables from associated companies and other participating interests 289 285 426 398
Tax refund claims 780 766 778 722
Loans and interest receivables 61 61 91 91
Derivatives with positive fair values 440 437 286 277
Employee receivables 42 27 39 24
Rents and deposits 81 19 59 18
Insurance claims 65 54 27 18
Receivables from joint venture partners 8 8 – –
Precious metal trading positions 1,066 1,066 807 807
Other 991 725 735 517
Total 4,537 3,883 4,169 3,223
thereof from financing activities 1,236 1,050 1,565 1,222
15 – Inventories
Million € 2010 2009
Raw materials and factory supplies 2,427 1,845
Workinprocess, finished goods and merchandise 6,171 4,860
Advance payments and servicesinprocess 90 71
8,688 6,776
Work-in-process and finished goods and merchandise are com-bined into one item due to the production conditions in the chemical industry. Services-in-process relate primarily to ser-vices not invoiced at the balance sheet date. Inventories are valued using the weighted average cost method. Write-downs are reversed if the reasons for the write-downs no longer apply.
Inventories with a fair value of €541 million were acquired as part of the acquisition of Cognis. In 2010, €29 million were recognized for write-downs on inventory. In 2009, reversals led to gains of €15 million. Of the total inventory, €1,520 million in 2010, and €1,346 million in 2009, were valued at net realizable value.
Prepaid expenses include prepayments for operating expenses of €23 million in 2010, and €40 million in 2009, as well as pre-payments for insurance premiums of €25 million in 2010, and €31 million in 2009.
Defined benefit assets declined primarily due to the reduc-tion in the discount rate. In 2010, the decrease in receivables from associated com-panies and other participating interests was a result of the repayment of a short-term loan to finance Nord Stream AG. Pre-cious metal trading positions comprise above all long positions
in precious metals, which are largely hedged through sales or derivatives. Unhedged precious metal positions are also included in this item. Higher precious metal prices in 2010 led to an increase compared with the previous year. Derivatives with positive fair values increased, primarily due to currency effects brought about by higher fair values of USD currency options. The Cognis acquisition resulted in additions of €72 million to other receivables and miscellaneous assets.
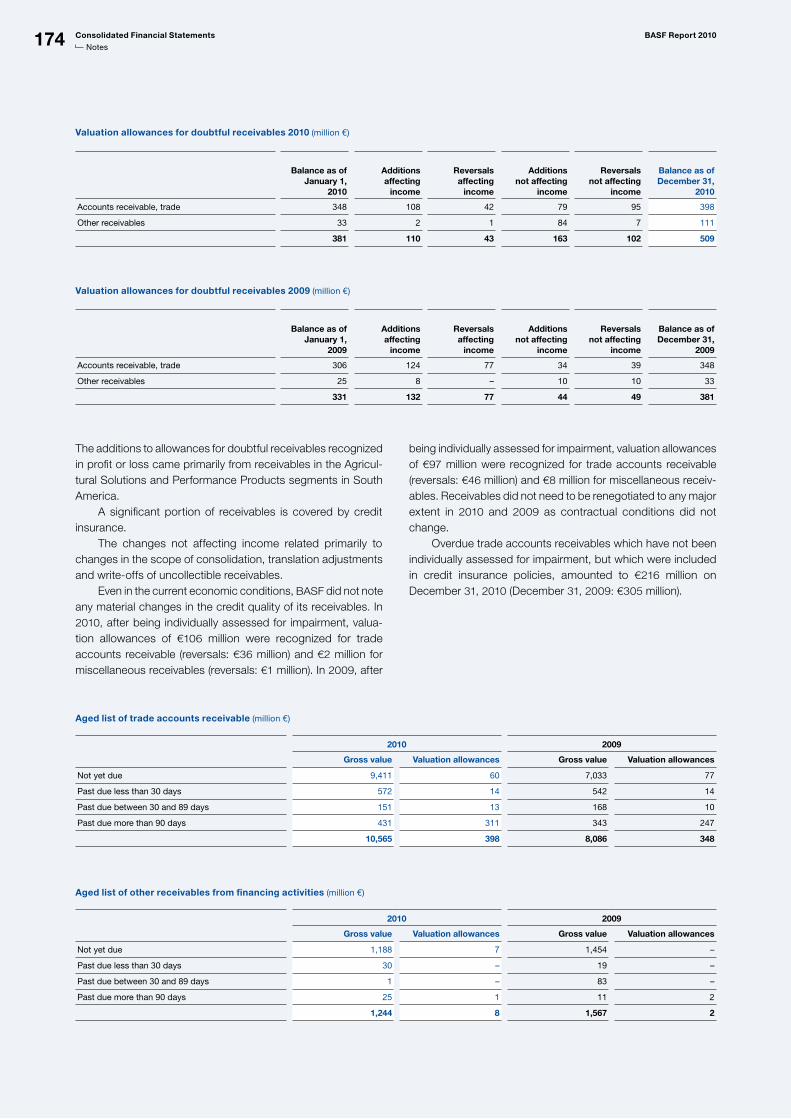
174 Consolidated Financial Statements BASF Report 2010
Notes
Valuation allowances for doubtful receivables 2010 (million €)
Balance as of January 1,
2010
Additions affecting
income
Reversals affecting
income
Additions not affecting
income
Reversals not affecting
income
Balance as of December 31,
2010
Accounts receivable, trade 348 108 42 79 95 398
Other receivables 33 2 1 84 7 111
381 110 43 163 102 509
Valuation allowances for doubtful receivables 2009 (million €)
Balance as of January 1,
2009
Additions affecting
income
Reversals affecting
income
Additions not affecting
income
Reversals not affecting
income
Balance as of December 31,
2009
Accounts receivable, trade 306 124 77 34 39 348
Other receivables 25 8 – 10 10 33
331 132 77 44 49 381
The additions to allowances for doubtful receivables recognized in profit or loss came primarily from receivables in the Agricul-tural Solutions and Performance Products segments in South America. A significant portion of receivables is covered by credit insurance. The changes not affecting income related primarily to changes in the scope of consolidation, translation adjustments and write-offs of uncollectible receivables. Even in the current economic conditions, BASF did not note any material changes in the credit quality of its receivables. In 2010, after being individually assessed for impairment, valua-tion allowances of €106 million were recognized for trade accounts receivable (reversals: €36 million) and €2 million for miscellaneous receivables (reversals: €1 million). In 2009, after
being individually assessed for impairment, valuation allowances of €97 million were recognized for trade accounts receivable (reversals: €46 million) and €8 million for miscellaneous receiv-ables. Receivables did not need to be renegotiated to any major extent in 2010 and 2009 as contractual conditions did not change. Overdue trade accounts receivables which have not been individually assessed for impairment, but which were included in credit insurance policies, amounted to €216 million on December 31, 2010 (December 31, 2009: €305 million).
Aged list of trade accounts receivable (million €)
2010 2009
Gross value Valuation allowances Gross value Valuation allowances
Not yet due 9,411 60 7,033 77
Past due less than 30 days 572 14 542 14
Past due between 30 and 89 days 151 13 168 10
Past due more than 90 days 431 311 343 247
10,565 398 8,086 348
Aged list of other receivables from financing activities (million €)
2010 2009
Gross value Valuation allowances Gross value Valuation allowances
Not yet due 1,188 7 1,454 –
Past due less than 30 days 30 – 19 –
Past due between 30 and 89 days 1 – 83 –
Past due more than 90 days 25 1 11 2
1,244 8 1,567 2
174
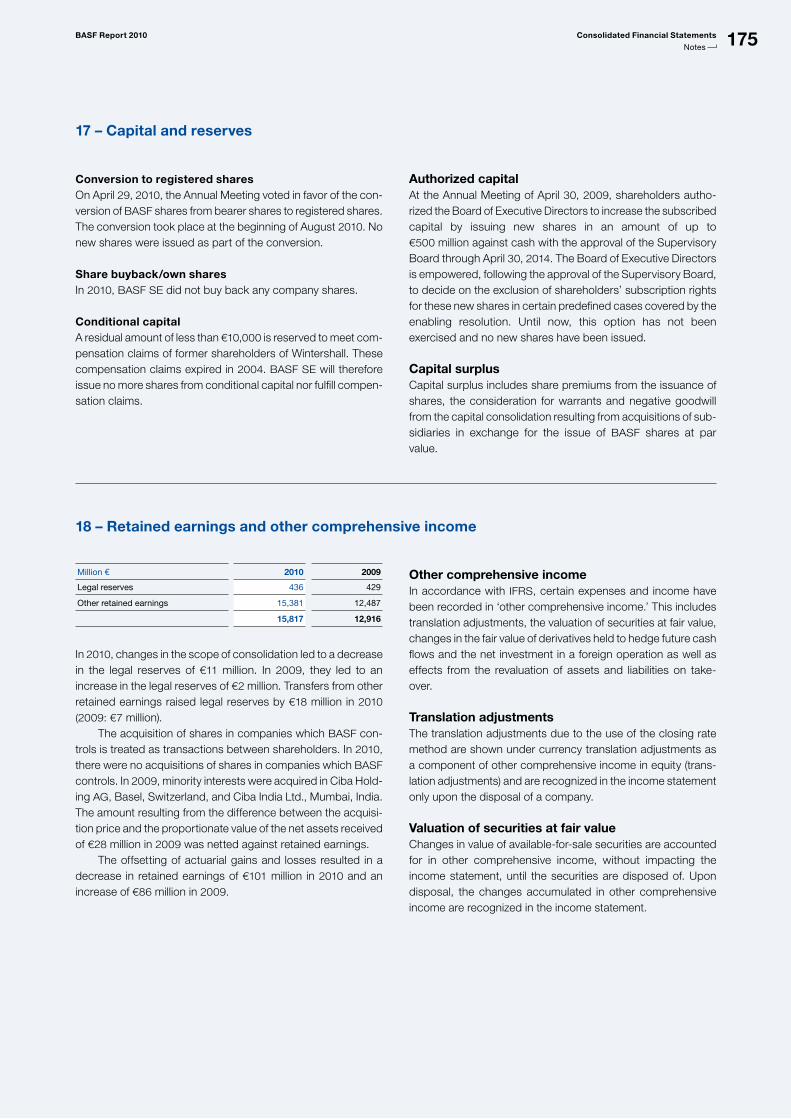
175BASF Report 2010 Consolidated Financial Statements
Notes
17 – Capital and reserves
Conversion to registered sharesOn April 29, 2010, the Annual Meeting voted in favor of the con-version of BASF shares from bearer shares to registered shares. The conversion took place at the beginning of August 2010. No new shares were issued as part of the conversion.
Share buyback/own sharesIn 2010, BASF SE did not buy back any company shares.
Conditional capitalA residual amount of less than €10,000 is reserved to meet com-pensation claims of former shareholders of Wintershall. These compensation claims expired in 2004. BASF SE will therefore issue no more shares from conditional capital nor fulfill compen-sation claims.
Authorized capitalAt the Annual Meeting of April 30, 2009, shareholders autho-rized the Board of Executive Directors to increase the subscribed capital by issuing new shares in an amount of up to €500 million against cash with the approval of the Supervisory Board through April 30, 2014. The Board of Executive Directors is empowered, following the approval of the Supervisory Board, to decide on the exclusion of shareholders’ subscription rights for these new shares in certain predefined cases covered by the enabling resolution. Until now, this option has not been exercised and no new shares have been issued.
Capital surplusCapital surplus includes share premiums from the issuance of shares, the consideration for warrants and negative goodwill from the capital consolidation resulting from acquisitions of sub-sidiaries in exchange for the issue of BASF shares at par value.
18 – Retained earnings and other comprehensive income
Million € 2010 2009
Legal reserves 436 429
Other retained earnings 15,381 12,487
15,817 12,916
In 2010, changes in the scope of consolidation led to a decrease in the legal reserves of €11 million. In 2009, they led to an increase in the legal reserves of €2 million. Transfers from other retained earnings raised legal reserves by €18 million in 2010 (2009: €7 million). The acquisition of shares in companies which BASF con-trols is treated as transactions between shareholders. In 2010, there were no acquisitions of shares in companies which BASF controls. In 2009, minority interests were acquired in Ciba Hold-ing AG, Basel, Switzerland, and Ciba India Ltd., Mumbai, India. The amount resulting from the difference between the acquisi-tion price and the proportionate value of the net assets received of €28 million in 2009 was netted against retained earnings. The offsetting of actuarial gains and losses resulted in a decrease in retained earnings of €101 million in 2010 and an increase of €86 million in 2009.
Other comprehensive incomeIn accordance with IFRS, certain expenses and income have been recorded in ‘other comprehensive income.’ This includes translation adjustments, the valuation of securities at fair value, changes in the fair value of derivatives held to hedge future cash flows and the net investment in a foreign operation as well as effects from the revaluation of assets and liabilities on take-over.
Translation adjustmentsThe translation adjustments due to the use of the closing rate method are shown under currency translation adjustments as a component of other comprehensive income in equity (trans-lation adjustments) and are recognized in the income statement only upon the disposal of a company.
Valuation of securities at fair valueChanges in value of available-for-sale securities are accounted for in other comprehensive income, without impacting the income statement, until the securities are disposed of. Upon disposal, the changes accumulated in other comprehensive income are recognized in the income statement.
175
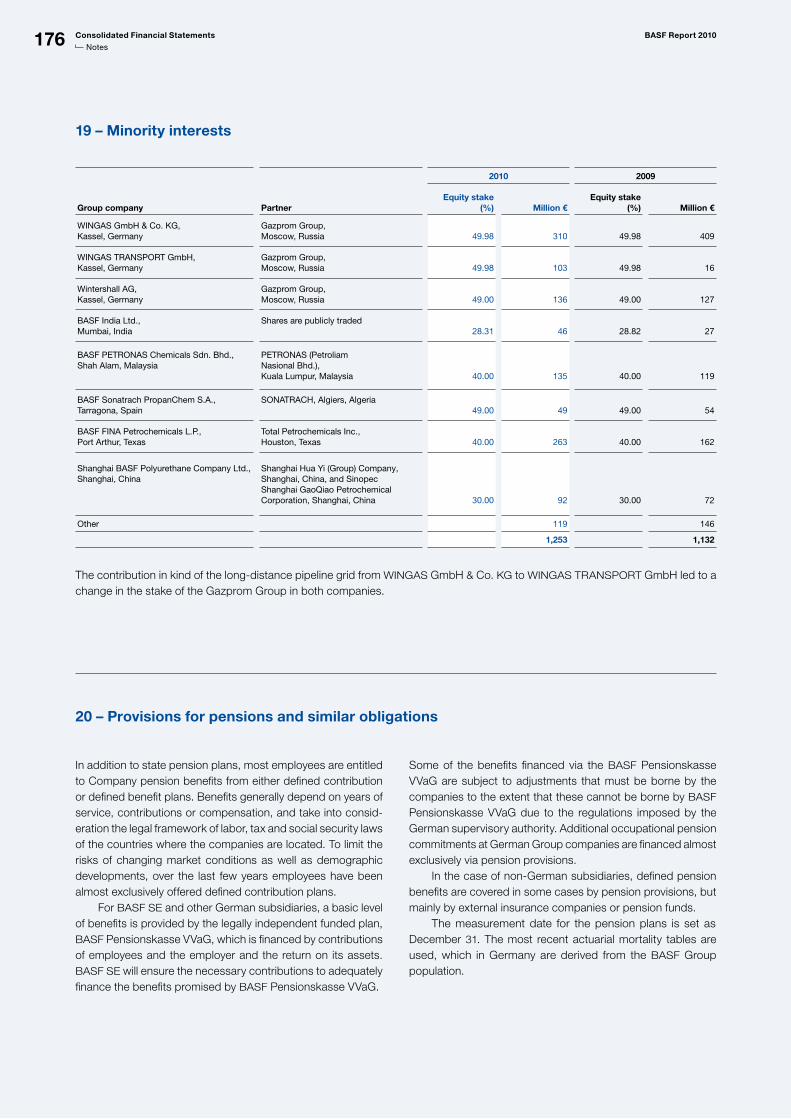
176 Consolidated Financial Statements BASF Report 2010
Notes
19 – Minority interests
2010 2009
Group company Partner
Equity stake (%) Million €
Equity stake (%) Million €
WINGAS GmbH & Co. KG, Kassel, Germany
Gazprom Group, Moscow, Russia
49.98
310
49.98
409
WINGAS TRANSPORT GmbH, Kassel, Germany
Gazprom Group, Moscow, Russia
49.98
103
49.98
16
Wintershall AG, Kassel, Germany
Gazprom Group, Moscow, Russia
49.00
136
49.00
127
BASF India Ltd., Mumbai, India
Shares are publicly traded 28.31
46
28.82
27
BASF PETRONAS Chemicals Sdn. Bhd., Shah Alam, Malaysia
PETRONAS (Petroliam Nasional Bhd.), Kuala Lumpur, Malaysia
40.00
135
40.00
119
BASF Sonatrach PropanChem S.A., Tarragona, Spain
SONATRACH, Algiers, Algeria 49.00
49
49.00
54
BASF FINA Petrochemicals L.P., Port Arthur, Texas
Total Petrochemicals Inc., Houston, Texas
40.00
263
40.00
162
Shanghai BASF Polyurethane Company Ltd., Shanghai, China
Shanghai Hua Yi (Group) Company, Shanghai, China, and Sinopec Shanghai GaoQiao Petrochemical Corporation, Shanghai, China
30.00
92
30.00
72
Other 119 146
1,253 1,132
The contribution in kind of the long-distance pipeline grid from WINGAS GmbH & Co. KG to WINGAS TRANSPORT GmbH led to a change in the stake of the Gazprom Group in both companies.
In addition to state pension plans, most employees are entitled to Company pension benefits from either defined contribution or defined benefit plans. Benefits generally depend on years of service, contributions or compensation, and take into consid-eration the legal framework of labor, tax and social security laws of the countries where the companies are located. To limit the risks of changing market conditions as well as demographic developments, over the last few years employees have been almost exclusively offered defined contribution plans. For BASF SE and other German subsidiaries, a basic level of benefits is provided by the legally independent funded plan, BASF Pensionskasse VVaG, which is financed by contributions of employees and the employer and the return on its assets. BASF SE will ensure the necessary contributions to adequately finance the benefits promised by BASF Pensionskasse VVaG.
Some of the benefits financed via the BASF Pensionskasse VVaG are subject to adjustments that must be borne by the companies to the extent that these cannot be borne by BASF Pensionskasse VVaG due to the regulations imposed by the German supervisory authority. Additional occupational pension commitments at German Group companies are financed almost exclusively via pension provisions. In the case of non-German subsidiaries, defined pension benefits are covered in some cases by pension provisions, but mainly by external insurance companies or pension funds. The measurement date for the pension plans is set as December 31. The most recent actuarial mortality tables are used, which in Germany are derived from the BASF Group population.
20 – Provisions for pensions and similar obligations
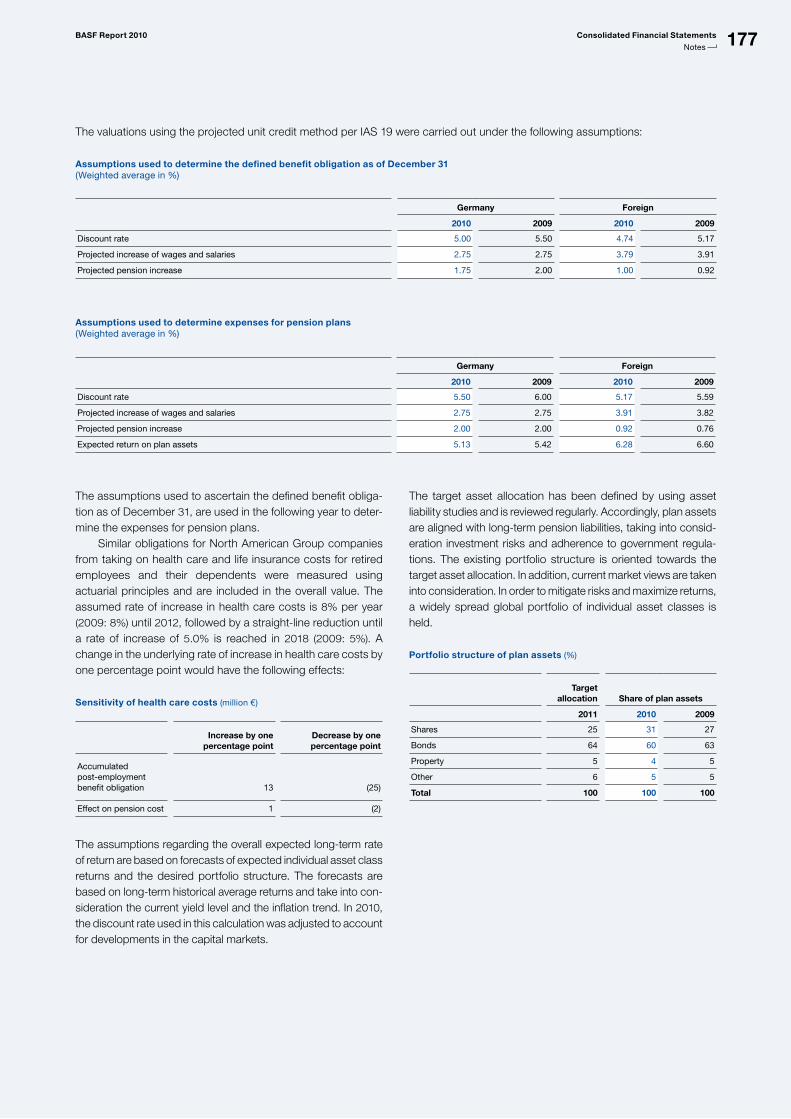
177BASF Report 2010 Consolidated Financial Statements
Notes
The valuations using the projected unit credit method per IAS 19 were carried out under the following assumptions:
Assumptions used to determine the defined benefit obligation as of December 31(Weighted average in %)
Germany Foreign
2010 2009 2010 2009
Discount rate 5.00 5.50 4.74 5.17
Projected increase of wages and salaries 2.75 2.75 3.79 3.91
Projected pension increase 1.75 2.00 1.00 0.92
Assumptions used to determine expenses for pension plans(Weighted average in %)
Germany Foreign
2010 2009 2010 2009
Discount rate 5.50 6.00 5.17 5.59
Projected increase of wages and salaries 2.75 2.75 3.91 3.82
Projected pension increase 2.00 2.00 0.92 0.76
Expected return on plan assets 5.13 5.42 6.28 6.60
The assumptions used to ascertain the defined benefit obliga-tion as of December 31, are used in the following year to deter-mine the expenses for pension plans. Similar obligations for North American Group companies from taking on health care and life insurance costs for retired employees and their dependents were measured using actuarial principles and are included in the overall value. The assumed rate of increase in health care costs is 8% per year (2009: 8%) until 2012, followed by a straight-line reduction until a rate of increase of 5.0% is reached in 2018 (2009: 5%). A change in the underlying rate of increase in health care costs by one percentage point would have the following effects:
Sensitivity of health care costs (million €)
Increase by one percentage point
Decrease by one percentage point
Accumulated postemployment benefit obligation
13
(25)
Effect on pension cost 1 (2)
The assumptions regarding the overall expected long-term rate of return are based on forecasts of expected individual asset class returns and the desired portfolio structure. The forecasts are based on long-term historical average returns and take into con-sideration the current yield level and the inflation trend. In 2010, the discount rate used in this calculation was adjusted to account for developments in the capital markets.
The target asset allocation has been defined by using asset liability studies and is reviewed regularly. Accordingly, plan assets are aligned with long-term pension liabilities, taking into consid-eration investment risks and adherence to government regula-tions. The existing portfolio structure is oriented towards the target asset allocation. In addition, current market views are taken into consideration. In order to mitigate risks and maximize returns, a widely spread global portfolio of individual asset classes is held.
Portfolio structure of plan assets (%)
Target allocation Share of plan assets
2011 2010 2009
Shares 25 31 27
Bonds 64 60 63
Property 5 4 5
Other 6 5 5
Total 100 100 100
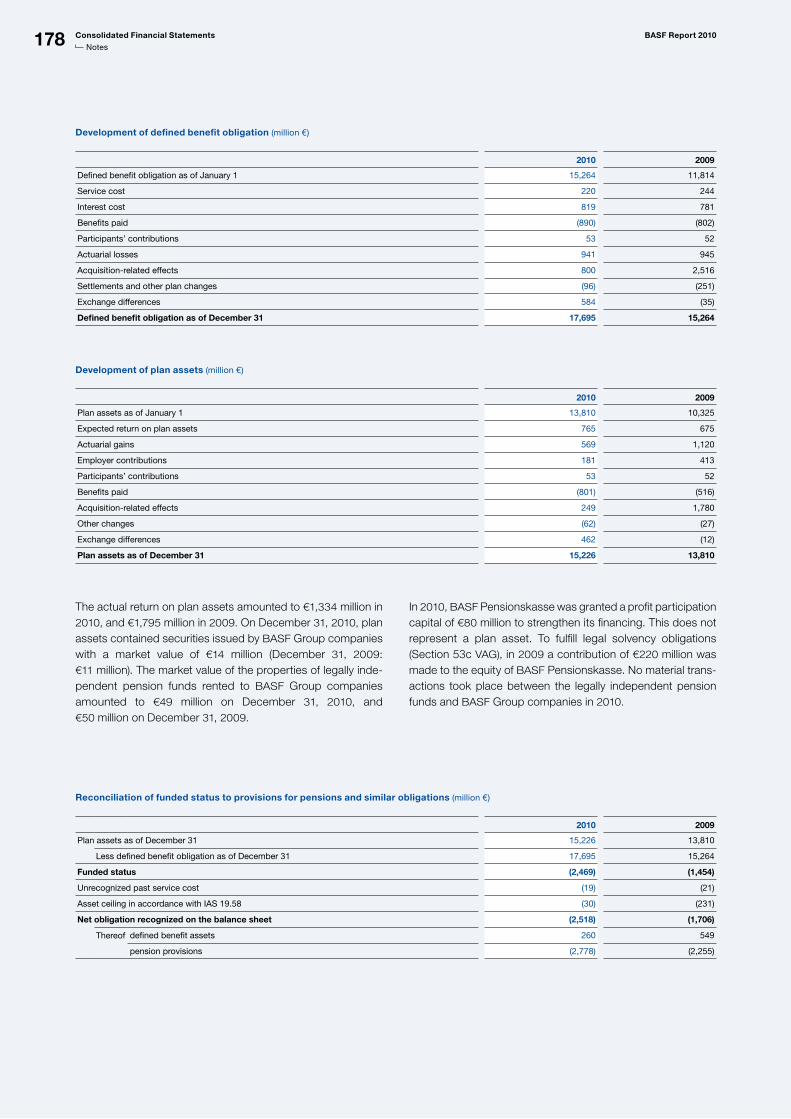
178 Consolidated Financial Statements BASF Report 2010
Notes
Development of defined benefit obligation (million €)
2010 2009
Defined benefit obligation as of January 1 15,264 11,814
Service cost 220 244
Interest cost 819 781
Benefits paid (890) (802)
Participants’ contributions 53 52
Actuarial losses 941 945
Acquisitionrelated effects 800 2,516
Settlements and other plan changes (96) (251)
Exchange differences 584 (35)
Defined benefit obligation as of December 31 17,695 15,264
Development of plan assets (million €)
2010 2009
Plan assets as of January 1 13,810 10,325
Expected return on plan assets 765 675
Actuarial gains 569 1,120
Employer contributions 181 413
Participants’ contributions 53 52
Benefits paid (801) (516)
Acquisitionrelated effects 249 1,780
Other changes (62) (27)
Exchange differences 462 (12)
Plan assets as of December 31 15,226 13,810
The actual return on plan assets amounted to €1,334 million in 2010, and €1,795 million in 2009. On December 31, 2010, plan assets contained securities issued by BASF Group companies with a market value of €14 million (December 31, 2009: €11 million). The market value of the properties of legally inde-pendent pension funds rented to BASF Group companies amounted to €49 million on December 31, 2010, and €50 million on December 31, 2009.
In 2010, BASF Pensionskasse was granted a profit participation capital of €80 million to strengthen its financing. This does not represent a plan asset. To fulfill legal solvency obligations (Section 53c VAG), in 2009 a contribution of €220 million was made to the equity of BASF Pensionskasse. No material trans-actions took place between the legally independent pension funds and BASF Group companies in 2010.
Reconciliation of funded status to provisions for pensions and similar obligations (million €)
2010 2009
Plan assets as of December 31 15,226 13,810
Less defined benefit obligation as of December 31 17,695 15,264
Funded status (2,469) (1,454)
Unrecognized past service cost (19) (21)
Asset ceiling in accordance with IAS 19.58 (30) (231)
Net obligation recognized on the balance sheet (2,518) (1,706)
Thereof defined benefit assets 260 549
pension provisions (2,778) (2,255)
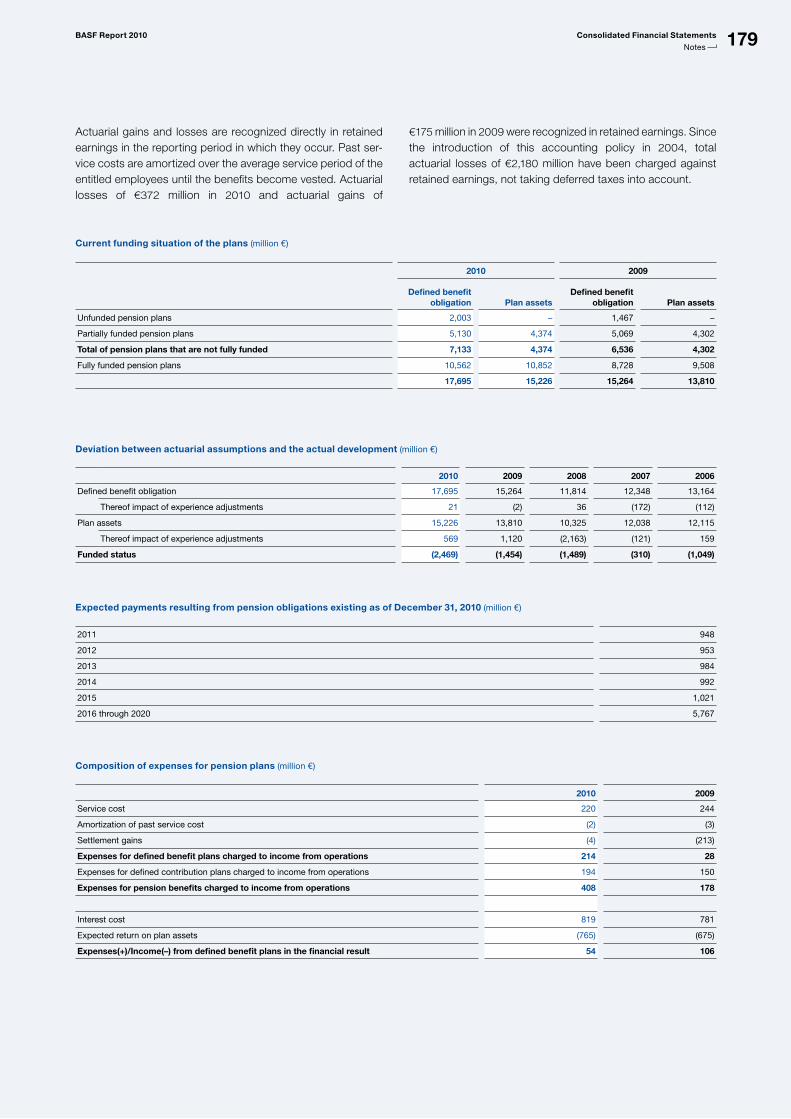
179BASF Report 2010 Consolidated Financial Statements
Notes
Actuarial gains and losses are recognized directly in retained earnings in the reporting period in which they occur. Past ser-vice costs are amortized over the average service period of the entitled employees until the benefits become vested. Actuarial losses of €372 million in 2010 and actuarial gains of
€175 million in 2009 were recognized in retained earnings. Since the introduction of this accounting policy in 2004, total actuarial losses of €2,180 million have been charged against retained earnings, not taking deferred taxes into account.
Current funding situation of the plans (million €)
2010 2009
Defined benefit obligation Plan assets
Defined benefit obligation Plan assets
Unfunded pension plans 2,003 – 1,467 –
Partially funded pension plans 5,130 4,374 5,069 4,302
Total of pension plans that are not fully funded 7,133 4,374 6,536 4,302
Fully funded pension plans 10,562 10,852 8,728 9,508
17,695 15,226 15,264 13,810
Deviation between actuarial assumptions and the actual development (million €)
2010 2009 2008 2007 2006
Defined benefit obligation 17,695 15,264 11,814 12,348 13,164
Thereof impact of experience adjustments 21 (2) 36 (172) (112)
Plan assets 15,226 13,810 10,325 12,038 12,115
Thereof impact of experience adjustments 569 1,120 (2,163) (121) 159
Funded status (2,469) (1,454) (1,489) (310) (1,049)
Expected payments resulting from pension obligations existing as of December 31, 2010 (million €)
2011 948
2012 953
2013 984
2014 992
2015 1,021
2016 through 2020 5,767
Composition of expenses for pension plans (million €)
2010 2009
Service cost 220 244
Amortization of past service cost (2) (3)
Settlement gains (4) (213)
Expenses for defined benefit plans charged to income from operations 214 28
Expenses for defined contribution plans charged to income from operations 194 150
Expenses for pension benefits charged to income from operations 408 178
Interest cost 819 781
Expected return on plan assets (765) (675)
Expenses(+)/Income(–) from defined benefit plans in the financial result 54 106
180 Consolidated Financial Statements BASF Report 2010
Notes
In 2010, contributions to public pension plans were €473 million (2009: €412 million).
The estimated contribution payments for defined benefit plans for 2011 are €190 million.
21 – Other provisions
2010 2009
Million € Thereof short-term Thereof short-term
Restoration obligations 869 5 846 2
Environmental protection and remediation costs 665 192 598 146
Employee obligations 2,043 1,380 1,442 873
Sales and purchase risks 865 828 1,088 1,050
Restructuring measures 234 214 407 392
Legal, damage claims, guarantees and related commitments 249 125 257 144
Other 1,751 580 1,927 669
6,676 3,324 6,565 3,276
Restoration obligations relate to the estimated costs for the filling of wells and the removal of production equipment after the end of production. Provisions for environmental protection and remedia-tion costs concern expected costs for rehabilitating contami-nated sites, recultivating landfills, removal of environmental contamination at existing production or storage sites and similar measures. In addition, provisions are recognized in connection with the allocation of emissions certificates from the German Emissions Trading Authority or other similar bodies in the European Union. The rise in provisions for environmental protection and remediation costs resulted from, among other things, the acquisition of Cognis. Provisions for employee obligations include obligations for the granting of long-service bonuses and anniversary pay-ments, variable compensation including related social security contributions, and other accruals as well as provisions for early retirement programs for employees nearing retirement. BASF’s German Group companies have various programs that entitle employees who are at least 55 years old to reduce their work-ing hours to 50% for up to eight years. Under such arrangements, employees generally work full time during the first half of the transition period and leave the Company at the start of the second half. Employees receive a minimum 85% of their net salary throughout the transition period. The rise in short-term employee obligations was primarily due to higher provisions for variable compensation. The increase in the long-term employee obligation provisions resulted from the rise in the provision for the BASF stock price-based com-pensation program (long-term incentive program).
For more information on provisions for the long-term incentive pro-gram, see Note 25 from page 185 onward
The sales and purchase risks provisions include warranties, product liability, customer rebates, payment discounts and other price reductions, sales commissions and provisions for expected losses on committed purchases as well as provisions for onerous contracts. The restructuring measures provisions include severance payments to employees as well as expected costs for site closures, including the costs for demolition and similar measures. As a result of restructuring measures, particularly those car-ried out in 2010 as part of the Ciba integration, the associated provisions decreased. Provisions for legal, damage claims, guarantees and related commitments include the expected costs of litigation, obligations under damage claims, other guarantees and anti-trust proceedings. Other includes long-term tax provisions, further present obligations and accruals. Other changes relate to changes in the scope of consoli-dation, currency effects and the transfer to liabilities of obliga-tions that have become more concrete as to amount and timing. In particular, the acquisition of Cognis led to an increase in provisions.
181BASF Report 2010 Consolidated Financial Statements
Notes
Development of other provisions in 2010 (million €)
January 1, 2010 AdditionsInterest
compounding Utilization Reversals Other changesDecember 31,
2010
Restoration obligations 846 20 37 (9) (38) 13 869
Environmental protection and remediation costs
598
139
3
(134)
(10)
69
665
Employee obligations 1,442 1,774 15 (1,002) (52) (134) 2,043
Sales and purchase risks 1,088 748 5 (906) (97) 27 865
Restructuring measures 407 78 – (234) (45) 28 234
Legal, damage claims, guarantees and related commitments
257
138
6
(121)
(44)
13
249
Other 1,927 764 – (738) (230) 28 1,751
6,565 3,661 66 (3,144) (516) 44 6,676
22 – Liabilities
Financial indebtedness (million €)
Carrying amounts based on effective interest method
Nominal volume(million
currency of issuance)
Effective interest rate 2010 2009
3.5% Euro Bond 2003/2010 of BASF SE 1,000 3.63% – 999
4% Euro Bond 2006/2011 of BASF SE 1,000 4.05% 1,000 999
3.375% Euro Bond 2005/2012 of BASF SE 1,400 3.42% 1,399 1,399
3.75% Euro Bond 2009/2012 of BASF SE 1,350 3.97% 1,345 1,343
4.5% Euro Bond 2006/2016 of BASF SE 500 4.62% 497 497
4.25% Euro Bond 2009/2016 of BASF SE 200 4.40% 199 198
5.875% GBP Bond 2009/2017 of BASF SE 400 6.04% 461 446
4.625% Euro Bond 2009/2017 of BASF SE 300 4.69% 299 299
3.25% CHF Bond 2008/2011 of BASF Finance Europe N.V. 300 3.39% 240 202
6% Euro Bond 2008/2013 of BASF Finance Europe N.V. 1,250 6.15% 1,245 1,244
5% Euro Bond 2007/2014 of BASF Finance Europe N.V. 1,000 5.09% 997 996
5% Euro Bond 2007/2014 of BASF Finance Europe N.V. 250 4.83% 251 252
3.625% CHF Bond 2008/2015 of BASF Finance Europe N.V. 200 3.77% 159 134
5.125% Euro Bond 2009/2015 of BASF Finance Europe N.V. 1,500 5.30% 1,489 1,488
5.125% Euro Bond 2009/2015 of BASF Finance Europe N.V. 500 4.38% 515 517
4.5% Euro Medium Term Note 2009/2016 of BASF Finance Europe N.V. 150 4.56% 150 149
USD Extendible Floating Rate Notes of BASF Finance Europe N.V. 0.33% – 3
3.25% CHF Bond 2006/2012 of Ciba Spezialitätenchemie Finanz AG 225 3.32% 177 147
4.875% Euro Bond 2003/2018 of Ciba Spec. Chem. Finance Luxemb. S.A. 477 4.88% 401 393
USD commercial paper 1,850 1,384 487
Other bonds 696 650
Bonds and other liabilities to the capital markets 12,904 12,842
Liabilities to credit institutions 2,135 1,977
15,039 14,819
182 Consolidated Financial Statements BASF Report 2010
Notes
Breakdown of financial indebtedness by currency (million €)
2010 2009
Euro 10,980 12,063
U.S. dollar 2,177 1,254
Swiss franc 576 483
British pound 543 560
Chinese renminbi 391 336
Brazilian real 205 –
Argentinean peso 30 41
South African rand 28 –
Japanese yen 25 15
Other 84 67
15,039 14,819
Maturities of financial indebtedness (million €)
2010 2009
Following year 1 3,369 2,375
Following year 2 3,112 1,363
Following year 3 2,100 3,067
Following year 4 1,321 2,075
Following year 5 2,539 1,329
Following year 6 and thereafter 2,598 4,610
15,039 14,819
Bonds and other liabilities to the capital marketsOther bonds consist primarily of industrial revenue and pollu-tion control bonds of the BASF Corporation group that are used to finance investments in the United States. The weighted- average interest rate was 2.2% in 2010 (2009: 2.3%). The weighted-average effective interest rate was 2.2% in 2010 (2009: 2.3%). The average residual term amounted to 222 months as of December 31, 2010, and 234 months as of December 31, 2009.
Liabilities to credit institutionsThe weighted-average interest rate on borrowings was 3.6% in 2010 (2009: 3.0%). To finance the investment in the expansion of the OPAL natural gas pipeline, €342 million was borrowed at an interest rate of 3.1% by WINGAS GmbH & Co. KG. BASF SE had committed and unused credit lines with vari-able interest rates of €4,490 million as of December 31, 2010, and €4,165 million as of December 31, 2009.
Other liabilitiesThe increase in other liabilities in 2010 related, among other things, to the negative fair value of derivatives concluded to hedge against currency fluctuations and rising raw material prices. Liabilities to companies in which participations are held include the proportionate amount of liabilities to joint venture companies accounted for using the proportional consolidation method of €195 million in 2010, and €313 million in 2009, thereof miscellaneous liabilities of €57 million in 2010, and €145 million in 2009. Further miscellaneous liabilities relating to participa-tions accounted for using the equity or cost method were €261 million in 2010, and €188 million in 2009. In addition, mis-cellaneous liabilities contained precious metal derivatives with a negative fair value of €74 million as of the balance sheet date 2010 compared with €52 million in 2009.
For more information on financial risks and derivative financial instruments, see Note 26 from page 187 onward
For more information on finance lease payables, see Note 27 on page 192
183BASF Report 2010 Consolidated Financial Statements
Notes
Other liabilities (million €)
2010 2009
Short-term Long-term Short-term Long-term
Advances received on orders 283 – 116 –
Liabilities on bills 73 2 52 23
Liabilities related to social security 166 26 156 30
Nontrade liabilities to joint venture partners 314 433 271 437
Derivative instruments 369 7 279 –
Liabilities arising from finance leases 10 49 18 62
Employee liabilities 328 94 211 40
Accrued interest on bonds and other loans 247 – 237 –
Miscellaneous liabilities 858 87 785 124
Deferred income 154 203 115 182
2,802 901 2,240 898
Secured liabilities (million €)
2010 2009
Liabilities to credit institutions 14 8
Miscellaneous liabilities 26 37
40 45
Liabilities to credit institutions are secured primarily with registered land charges. There are no secured contingent liabilities.
23 – Contingent liabilities and other financial obligations
The contingencies listed below are stated at nominal value:
Contingent liabilities (million €)
2010 2009
Bills of exchange 7 3
Thereof to affiliated companies – –
Guarantees 510 625
Thereof to affiliated companies 8 8
Warranties 96 73
Granting collateral on behalf of thirdparty liabilities 14 17
627 718
Liabilities from guarantees were primarily due to the financial guarantee given in 2008 for the financing of OAO Severnefte-gazprom. BASF has a stake of 15.5% in the project company Nord Stream AG, Zug, Switzerland, which aims to construct a natu-ral gas pipeline through the Baltic Sea from Vyborg, the Russian Federation, to Greifswald, Germany. To finance the first of two lines, project financing was arranged in 2010. As is nor-mal in such financing, the stockholders issued guarantees in favor of the banks giving the loans. The risk from the guaran-tees issued by BASF is limited to a proportionate share of the project volume. The shares in Nord Stream AG and the
subordinated loan receivables of €99 million granted to Nord Stream AG were given as collateral to the banks extending the loans. As of December 31, 2010, it is assumed that no claims
will be made against these guarantees issued by BASF. After the completion of the approval process and the lay-ing of the first pipeline, operations will start in 2011. By 2012, a second line will be built, parallel to the first line. Upon completion of the second line in 2012, the full capacity of 55 billion cubic meters of natural gas per year will be reached.
184 Consolidated Financial Statements BASF Report 2010
Notes
Other financial obligations (million €)
2010 2009
Construction in progress 4,642 3,888
Thereof purchase commitments 752 556
for the purchase of intangible assets 8 57
Obligation arising from longterm leases (excluding finance leases) 1,679 1,357
Payment and loan commitments and other financial obligations 3 5
6,324 5,250
Assets used under long-term leasesAssets used under long-term leases primarily concern buildings and IT infrastructure.
For more information on leasing liabilities, see Note 27 on page 192
Obligations arising from long-term leases (Excluding finance leases) (million €)
2011 521
2012 304
2013 242
2014 145
2015 116
2016 and thereafter 351
1,679
Purchase obligations from long-term natural gas and raw material supply contractsThe Company has entered into long-term purchase contracts for natural gas in the Natural Gas Trading business sector, which are subject to continual price adjustments. These purchase obligations relate to long-term supply contracts with customers with terms between one and twenty years. The increase in pur-chase obligations compared with the previous year resulted in particular from higher purchase prices. The Company purchases raw materials both on the basis of long-term contracts and on spot markets. The fixed purchase obligations of long-term purchase contracts with a remaining term of more than one year as of December 31, 2010, are as follows:
Purchase obligations from natural gas and raw material supply contracts (million €)
2011 10,433
2012 8,771
2013 7,817
2014 6,798
2015 6,636
2016 and thereafter 95,836
136,292
24 – Risks from litigation and claims
Since 2005, a total of 38 class action lawsuits, among others, against BASF SE and BASF Corporation have been filed in U.S. courts. It was alleged that sales of TDI, MDI and polyether poly-ols had violated antitrust laws on price fixing. The class certifi-cation for the class action suits has been granted and the dis-covery process is currently underway. In addition, two plaintiffs are pursuing their claim outside of the class action process in parallel suits. BASF is defending itself against these lawsuits. At
the end of 2007, the U.S. Department of Justice ceased an inquiry on alleged price fixing. In addition, BASF SE and its affiliated companies are defendants in or parties to further judicial and arbitrational pro-ceedings. Based on the current state of knowledge these pro-ceedings will have no material influence on the economic situ-ation of BASF.
In accordance with the provisions of Section 17 of the Republic of Ireland Companies (Amendments) Act 1986, BASF SE gives irrevocable guarantees with respect to the liabil-
ities, as referred to in Section 5 (c) (ii) of that Act, of the subsidiary company Cognis Ireland Limited, Dublin. As of December 31, 2010, the liabilities of Cognis Ireland totaled €11.2 million.
185BASF Report 2010 Consolidated Financial Statements
Notes
25 – Stock price-based compensation program and BASF incentive share program
Stock price-based compensation programIn 2010, BASF continued its stock price-based compensation program (the long-term incentive program, or LTI program) for senior executives of the BASF Group. This program has existed since 1999. Approximately 1,100 senior executives, including the Board of Executive Directors, are currently entitled to par-ticipate in this program. This program provides for the grant of virtual options. The options are settled in cash when exer-cised. Participation in the LTI program is voluntary. The condition for taking part in the program is the participant’s own invest-ment: A participant must hold BASF shares in the amount of 10% to 30% of his or her individual variable compensation for a two-year period from the granting of the option (holding period). The number of shares to be held is determined by the amount of variable compensation and the weighted-average market price for BASF shares on the first business day after the Annual Meeting, which was €44.37 on April 30, 2010. The participant receives four option rights per invested share. Each option consists of two parts, right A and right B, which may be exercised if defined thresholds have been met: The threshold of right A is met if the price of the BASF share has increased by more than 30% in comparison to the base price (absolute thresh-old). The value of right A will be the difference between the mar-ket price of BASF shares at the exercise date and the base price; it is limited to 100% of the base price. Right B may be exercised if the cumulative percentage performance of BASF shares exceeds (relative threshold) the percentage performance of the MSCI World Chemicals IndexSM (MSCI Chemicals). The value of right B will be the base price of the option multiplied by twice the percentage outperformance of BASF shares compared to the MSCI Chemicals Index on the exercise date. It is limited to the closing price on the date of exercise minus computed nominal value of BASF shares. The options were granted on July 1, 2010, and may be exercised following a two-year vesting period, between July 1, 2012, and June 30, 2018. During the exercise period, it is not possible to exercise options during certain
periods (closed periods). Each option right may only be exercised if the performance targets are achieved and may only be exer-cised once, meaning that if only one performance target is met and that option is exercised, the other option right lapses. The maximum gain for a participant is limited to 10 times the original individual investment. Option rights are non-transferable and are forfeited if the option holders no longer work for BASF or have sold part of their individual investment before the expiry of the two-year holding period. They remain valid in the case of retire-ment. For the members of the Board of Executive Directors, the long-term direction of the program is significantly strengthened vis-à-vis the conditions applying to the other participants. The members of the Board of Executive Directors are required to par-ticipate in the LTI program with at least 10% of their gross bonus. In view of this binding own investment (in the form of BASF shares), an extended holding period of four years applies. Under the LTI program, members of the Board of Executive Directors may only exercise their options at least four years after they have been granted (vesting period). The 2003 to 2009 programs were structured in a similar way to the LTI program 2010.
The benchmark index used to determine the value of right B for the programs 2003 and 2004 is the Dow Jones Chemi-cals Total Return Index (DJ Chemicals). This index was replaced by the MSCI Chemicals starting with the program 2005. The MSCI Chemicals is a global industry index for the chemical industry that measures the performance of the companies con-tained within it in their respective local currencies, which signif-icantly reduces currency effects. The models used in the valuation of the option plans are based on the arbitrage-free valuation model according to Black- Scholes. Due to the complexity of the programs, a numerical solu-tion method was used (Monte Carlo simulation).
Fair value of options and parameters used as of December 31, 2010 1
LTI program of the year
2010 2009
Fair value € 29.15 51.44
Dividend yield % 2.85 2.85
Riskfree interest rate % 2.71 2.46
Volatility BASF share % 25.76 26.45
Volatility MSCI Chemicals % 18.71 19.30
Correlation BASF share price: MSCI Chemicals % 80.80 80.18
1 It is assumed that the options will be exercised based upon the potential gains.
186 Consolidated Financial Statements BASF Report 2010
Notes
On December 31, 2010, the fair values and the valuation param-eters relate to the LTI programs 2010 and 2009. For the pro-grams from preceding years, corresponding fair values were computed and valuation parameters were used. The number of options granted amounted to 1,833,760 in 2010 (2009: 3,669,668). Volatility was determined on the basis of the monthly clos-ing prices over a historical period corresponding to the remain-ing term of the options. As a result of a resolution by the Board of Executive Direc-tors in 2002 to settle options in cash, options outstanding from the programs 2003 to 2010 were valued with the fair value as of the balance sheet date December 31, 2010. This amount is accrued proportionally as a provision over the respective vest-ing period. This provision increased due to higher fair values of the options from €256 million as of December 31, 2009, to €411 million as of December 31, 2010. This resulted in person-nel expenses of €418 million in 2010 (2009: €212 million). The utilization of provisions amounted to €263 million in 2010 (2009: €36 million). The total intrinsic value of exercisable options amounted to €266 million as of December 31, 2010, and €165 million as of December 31, 2009.
BASF incentive share programIn 1999, BASF started an incentive share program called “plus” for all eligible employees except the senior executives entitled to participate in the LTI program. Currently, employees of Ger-man and of various European and Mexican subsidiaries are entitled to participate in the program. Each participant must make an individual investment in BASF shares from his or her variable compensation. For every ten BASF shares purchased in the program, a participant receives one BASF share at no cost after one, three, five, seven and ten years of holding the BASF shares. As a rule, the first and second block of ten shares entitle the participant to receive one BASF share at no extra cost in each of the next ten years. The right to receive free BASF shares lapses if a participant sells the individual investment in BASF shares, if the participant stops working for the Company or one year after retirement. The number of free shares to be granted developed as follows:
Number of free shares to be granted
2010 2009
As of January 1 3,296,361 3,054,104
Newly acquired entitlements 485,080 790,820
Bonus shares issued (557,001) (460,151)
Lapsed entitlements (139,365) (88,412)
As of December 31 3,085,075 3,296,361
The free shares to be provided by the company are valued at the fair value on the grant date. Fair value is determined on the basis of the stock price of BASF shares, taking into account the present value of dividends which are not paid during the term of the program. The weighted-average fair value at grant date amounted to €32.93 for the 2010 program, and €18.11 for the 2009 program. The fair value of the free shares to be granted is booked through the income statement against capital surplus over the period until the shares are issued.
Provisions for the costs for the 2001 to 2002 programs continue to be accrued proportionally on the basis of the BASF closing stock price. Personnel expenses of €16 million were recorded in 2010 for the BASF incentive share program (2009: €20 million).
187BASF Report 2010 Consolidated Financial Statements
Notes
26 – Financial risks and derivative financial instruments
Market risks Foreign currency risks: Changes in exchange rates could lead to negative changes in the value of financial instruments and adverse changes in future cash flows from planned transac-tions. Foreign currency risks from financial instruments result from the conversion at the closing rate of financial receivables, loans, securities, cash, as well as financial liabilities into the func-tional currency of the respective Group company. Foreign cur-rency contracts in a variety of currencies are used to hedge for-eign exchange risks from primary financial instruments and planned transactions. The foreign currency risk exposure corresponds to the net amount of the nominal volume of the primary and the derivative financial instruments which are exposed to currency risks. In addition, all planned purchase and sales transactions of the respective following year are included, if they fall under the cur-rency risk management system. Opposite positions in the same currency are offset against each other. The sensitivity analysis is conducted by simulating a 10% depreciation in all currencies against the respective functional currency. The effect on BASF’s income before taxes and minor-ity interests would have been minus €157 million as of Decem-ber 31, 2010, and minus €116 million as of December 31, 2009. The effect from the items designated under hedge accounting would have increased stockholders’ equity before income taxes
by €11 million on December 31, 2010 (December 31, 2009: minus €15 million). The currency exposure amounted to €1,058 million on December 31, 2010 (December 31, 2009: €902 million). Due to the use of options to hedge currency risks, the sen-sitivity analysis is not a linear function of the assumed changes in exchange rates. Interest rate risks: Interest rate risks result from changes in prevailing market interest rates, which can cause a change in the present value of fixed-rate instruments, and changes in the interest payments of variable-rate instruments. To hedge these risks, interest rate swaps and combined interest rate and cur-rency derivatives are used. These risks are relevant to the financ-ing activities of BASF, however, they are not of material signifi-cance for BASF’s operating activities. An increase in all relevant interest rates by one percentage point would have lowered earnings by €23 million as of Decem-ber 31, 2010, and would have lowered earnings by €40 million as of December 31, 2009. The sensitivity of stockholders’ equity to changes in interest rates is not material.
Carrying amount of non-derivative interest-bearing financial instruments (million €)
2010 2009
Fixed interest rate
Variable interest rate
Fixed interest rate
Variable interest rate
Loans 169 75 85 180
Securities 28 5 6 24
Financial indebtedness 13,309 1,730 12,976 1,843
Nominal and fair value of interest rate and combined interest and cross currency swaps (million €)
2010 2009
Nominal value Fair value Nominal value Fair value
Interest rate swaps 1,061 52 426 33
Thereof payer swaps 1,061 52 426 33
Combined interest and cross currency swaps 928 60 948 (1)
Thereof fixed rate 920 61 934 (1)
variable rate 8 (1) 14 .
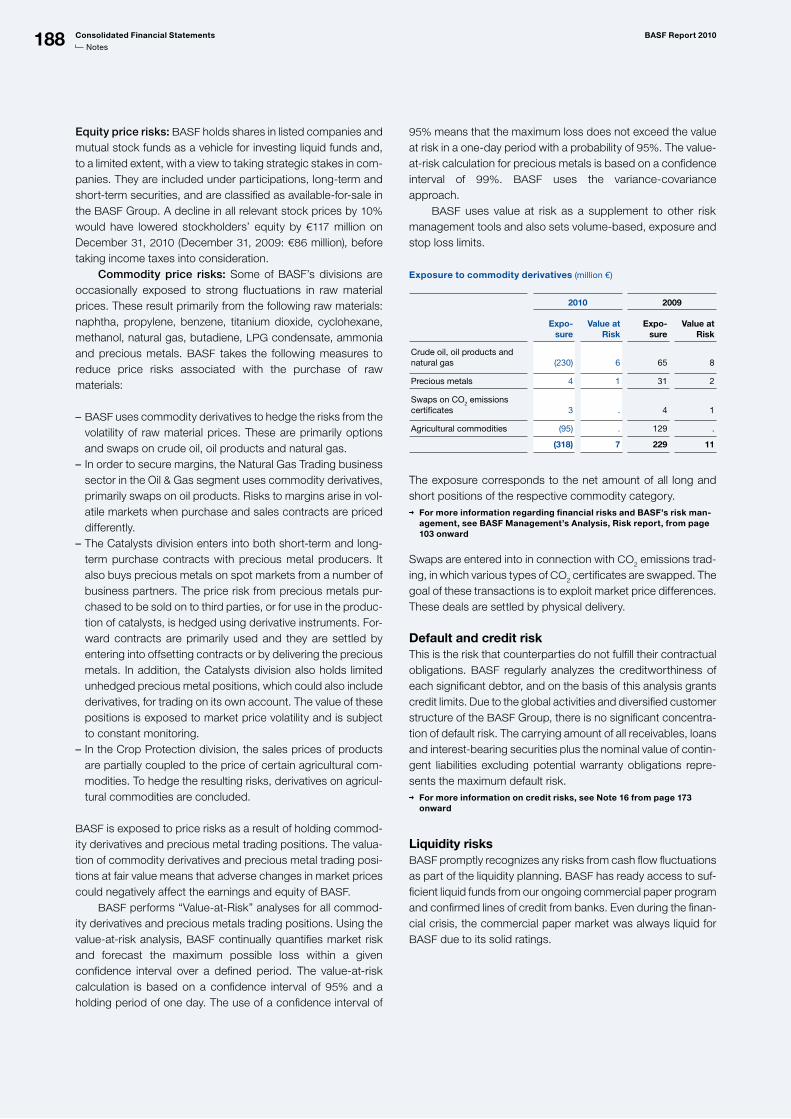
188 Consolidated Financial Statements BASF Report 2010
Notes
Equity price risks: BASF holds shares in listed companies and mutual stock funds as a vehicle for investing liquid funds and, to a limited extent, with a view to taking strategic stakes in com-panies. They are included under participations, long-term and short-term securities, and are classified as available-for-sale in the BASF Group. A decline in all relevant stock prices by 10% would have lowered stockholders’ equity by €117 million on December 31, 2010 (December 31, 2009: €86 million), before taking income taxes into consideration. Commodity price risks: Some of BASF’s divisions are occasionally exposed to strong fluctuations in raw material prices. These result primarily from the following raw materials: naphtha, propylene, benzene, titanium dioxide, cyclohexane, methanol, natural gas, butadiene, LPG condensate, ammonia and precious metals. BASF takes the following measures to reduce price risks associated with the purchase of raw materials:
BASF – uses commodity derivatives to hedge the risks from the volatility of raw material prices. These are primarily options and swaps on crude oil, oil products and natural gas. In order to secure margins, the Natural Gas Trading business –sector in the Oil & Gas segment uses commodity derivatives, primarily swaps on oil products. Risks to margins arise in vol-atile markets when purchase and sales contracts are priced differently. The Catalysts division enters into both short-term and long- –term purchase contracts with precious metal producers. It also buys precious metals on spot markets from a number of business partners. The price risk from precious metals pur-chased to be sold on to third parties, or for use in the produc-tion of catalysts, is hedged using derivative instruments. For-ward contracts are primarily used and they are settled by entering into offsetting contracts or by delivering the precious metals. In addition, the Catalysts division also holds limited unhedged precious metal positions, which could also include derivatives, for trading on its own account. The value of these positions is exposed to market price volatility and is subject to constant monitoring.In the Crop Protection division, the sales prices of products –are partially coupled to the price of certain agricultural com-modities. To hedge the resulting risks, derivatives on agricul-tural commodities are concluded.
BASF is exposed to price risks as a result of holding commod-ity derivatives and precious metal trading positions. The valua-tion of commodity derivatives and precious metal trading posi-tions at fair value means that adverse changes in market prices could negatively affect the earnings and equity of BASF. BASF performs “Value-at-Risk” analyses for all commod-ity derivatives and precious metals trading positions. Using the value-at-risk analysis, BASF continually quantifies market risk and forecast the maximum possible loss within a given confidence interval over a defined period. The value-at-risk calculation is based on a confidence interval of 95% and a holding period of one day. The use of a confidence interval of
95% means that the maximum loss does not exceed the value at risk in a one-day period with a probability of 95%. The value-at-risk calculation for precious metals is based on a confidence interval of 99%. BASF uses the variance-covariance approach. BASF uses value at risk as a supplement to other risk management tools and also sets volume-based, exposure and stop loss limits.
Exposure to commodity derivatives (million €)
2010 2009
Expo-sure
Value at Risk
Expo-sure
Value at Risk
Crude oil, oil products and natural gas
(230)
6
65
8
Precious metals 4 1 31 2
Swaps on CO2 emissions certificates
3
.
4
1
Agricultural commodities (95) . 129 .
(318) 7 229 11
The exposure corresponds to the net amount of all long and short positions of the respective commodity category.
For more information regarding financial risks and BASF’s risk man-agement, see BASF Management’s Analysis, Risk report, from page 103 onward
Swaps are entered into in connection with CO2 emissions trad-ing, in which various types of CO2 certificates are swapped. The goal of these transactions is to exploit market price differences. These deals are settled by physical delivery.
Default and credit riskThis is the risk that counterparties do not fulfill their contractual obligations. BASF regularly analyzes the creditworthiness of each significant debtor, and on the basis of this analysis grants credit limits. Due to the global activities and diversified customer structure of the BASF Group, there is no significant concentra-tion of default risk. The carrying amount of all receivables, loans and interest-bearing securities plus the nominal value of contin-gent liabilities excluding potential warranty obligations repre-sents the maximum default risk.
For more information on credit risks, see Note 16 from page 173 onward
Liquidity risksBASF promptly recognizes any risks from cash flow fluctuations as part of the liquidity planning. BASF has ready access to suf-ficient liquid funds from our ongoing commercial paper program and confirmed lines of credit from banks. Even during the finan-cial crisis, the commercial paper market was always liquid for BASF due to its solid ratings.
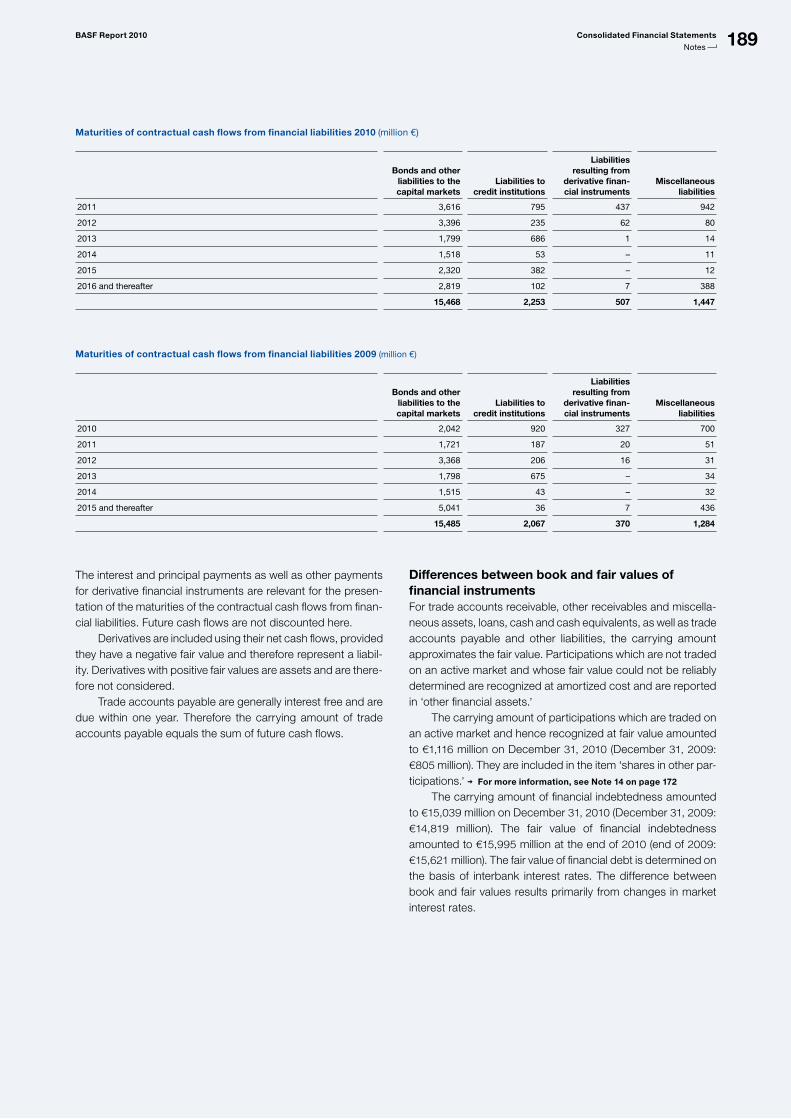
189BASF Report 2010 Consolidated Financial Statements
Notes
Maturities of contractual cash flows from financial liabilities 2010 (million €)
Bonds and other liabilities to the capital markets
Liabilities to credit institutions
Liabilities resulting from
derivative finan-cial instruments
Miscellaneous liabilities
2011 3,616 795 437 942
2012 3,396 235 62 80
2013 1,799 686 1 14
2014 1,518 53 – 11
2015 2,320 382 – 12
2016 and thereafter 2,819 102 7 388
15,468 2,253 507 1,447
Maturities of contractual cash flows from financial liabilities 2009 (million €)
Bonds and other liabilities to the capital markets
Liabilities to credit institutions
Liabilities resulting from
derivative finan-cial instruments
Miscellaneous liabilities
2010 2,042 920 327 700
2011 1,721 187 20 51
2012 3,368 206 16 31
2013 1,798 675 – 34
2014 1,515 43 – 32
2015 and thereafter 5,041 36 7 436
15,485 2,067 370 1,284
The interest and principal payments as well as other payments for derivative financial instruments are relevant for the presen-tation of the maturities of the contractual cash flows from finan-cial liabilities. Future cash flows are not discounted here. Derivatives are included using their net cash flows, provided they have a negative fair value and therefore represent a liabil-ity. Derivatives with positive fair values are assets and are there-fore not considered. Trade accounts payable are generally interest free and are due within one year. Therefore the carrying amount of trade accounts payable equals the sum of future cash flows.
Differences between book and fair values of financial instrumentsFor trade accounts receivable, other receivables and miscella-neous assets, loans, cash and cash equivalents, as well as trade accounts payable and other liabilities, the carrying amount approximates the fair value. Participations which are not traded on an active market and whose fair value could not be reliably determined are recognized at amortized cost and are reported in ‘other financial assets.’ The carrying amount of participations which are traded on an active market and hence recognized at fair value amounted to €1,116 million on December 31, 2010 (December 31, 2009: €805 million). They are included in the item ‘shares in other par-ticipations.’ For more information, see Note 14 on page 172
The carrying amount of financial indebtedness amounted to €15,039 million on December 31, 2010 (December 31, 2009: €14,819 million). The fair value of financial indebtedness amounted to €15,995 million at the end of 2010 (end of 2009: €15,621 million). The fair value of financial debt is determined on the basis of interbank interest rates. The difference between book and fair values results primarily from changes in market interest rates.
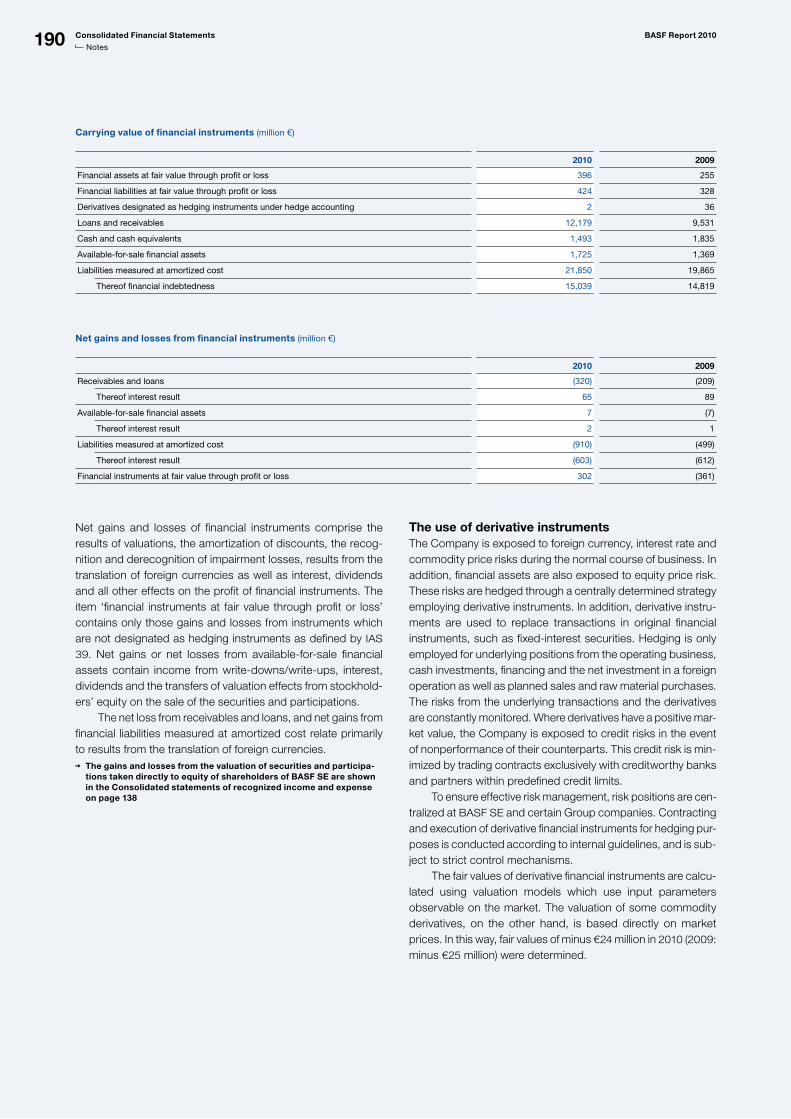
190 Consolidated Financial Statements BASF Report 2010
Notes
Net gains and losses of financial instruments comprise the results of valuations, the amortization of discounts, the recog-nition and derecognition of impairment losses, results from the translation of foreign currencies as well as interest, dividends and all other effects on the profit of financial instruments. The item ‘financial instruments at fair value through profit or loss’ contains only those gains and losses from instruments which are not designated as hedging instruments as defined by IAS 39. Net gains or net losses from available-for-sale financial assets contain income from write-downs/write-ups, interest, dividends and the transfers of valuation effects from stockhold-ers’ equity on the sale of the securities and participations. The net loss from receivables and loans, and net gains from financial liabilities measured at amortized cost relate primarily to results from the translation of foreign currencies.
The gains and losses from the valuation of securities and participa-tions taken directly to equity of shareholders of BASF SE are shown in the Consolidated statements of recognized income and expense on page 138
The use of derivative instrumentsThe Company is exposed to foreign currency, interest rate and commodity price risks during the normal course of business. In addition, financial assets are also exposed to equity price risk. These risks are hedged through a centrally determined strategy employing derivative instruments. In addition, derivative instru-ments are used to replace transactions in original financial instruments, such as fixed-interest securities. Hedging is only employed for underlying positions from the operating business, cash investments, financing and the net investment in a foreign operation as well as planned sales and raw material purchases. The risks from the underlying transactions and the derivatives are constantly monitored. Where derivatives have a positive mar-ket value, the Company is exposed to credit risks in the event of nonperformance of their counterparts. This credit risk is min-imized by trading contracts exclusively with creditworthy banks and partners within predefined credit limits. To ensure effective risk management, risk positions are cen-tralized at BASF SE and certain Group companies. Contracting and execution of derivative financial instruments for hedging pur-poses is conducted according to internal guidelines, and is sub-ject to strict control mechanisms. The fair values of derivative financial instruments are calcu-lated using valuation models which use input parameters observable on the market. The valuation of some commodity derivatives, on the other hand, is based directly on market prices. In this way, fair values of minus €24 million in 2010 (2009: minus €25 million) were determined.
Carrying value of financial instruments (million €)
2010 2009
Financial assets at fair value through profit or loss 396 255
Financial liabilities at fair value through profit or loss 424 328
Derivatives designated as hedging instruments under hedge accounting 2 36
Loans and receivables 12,179 9,531
Cash and cash equivalents 1,493 1,835
Availableforsale financial assets 1,725 1,369
Liabilities measured at amortized cost 21,850 19,865
Thereof financial indebtedness 15,039 14,819
Net gains and losses from financial instruments (million €)
2010 2009
Receivables and loans (320) (209)
Thereof interest result 65 89
Availableforsale financial assets 7 (7)
Thereof interest result 2 1
Liabilities measured at amortized cost (910) (499)
Thereof interest result (603) (612)
Financial instruments at fair value through profit or loss 302 (361)
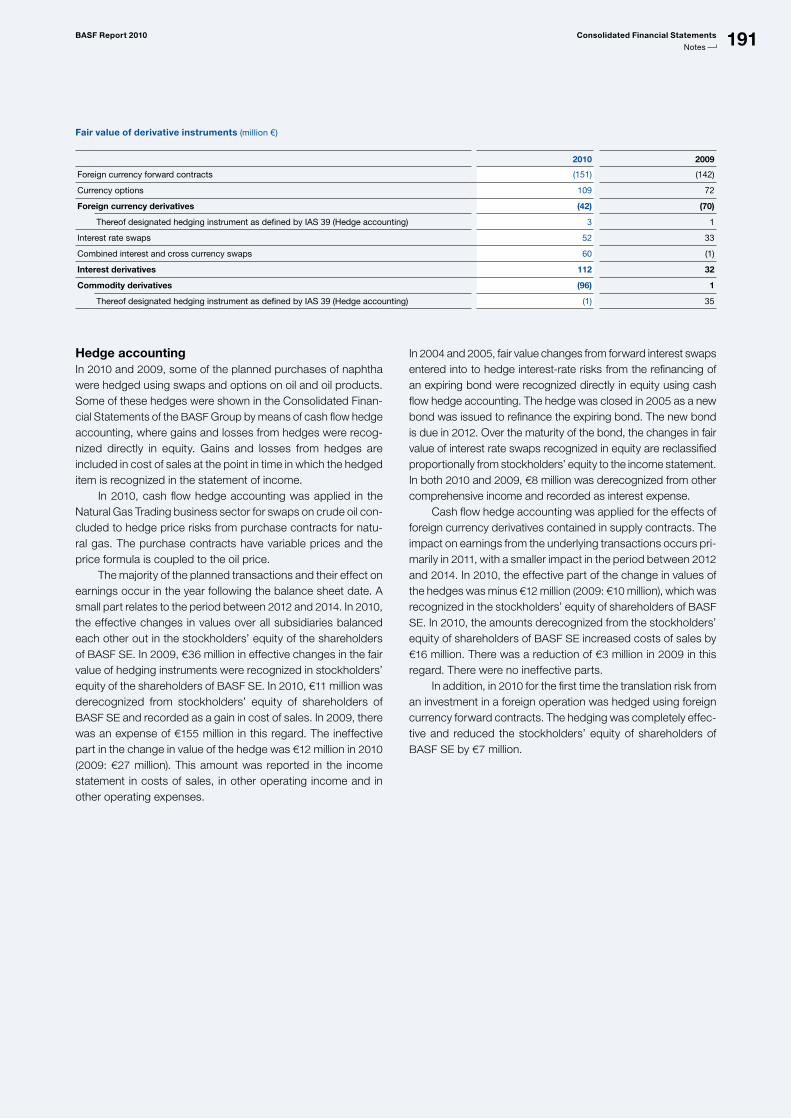
191BASF Report 2010 Consolidated Financial Statements
Notes
Fair value of derivative instruments (million €)
2010 2009
Foreign currency forward contracts (151) (142)
Currency options 109 72
Foreign currency derivatives (42) (70)
Thereof designated hedging instrument as defined by IAS 39 (Hedge accounting) 3 1
Interest rate swaps 52 33
Combined interest and cross currency swaps 60 (1)
Interest derivatives 112 32
Commodity derivatives (96) 1
Thereof designated hedging instrument as defined by IAS 39 (Hedge accounting) (1) 35
Hedge accountingIn 2010 and 2009, some of the planned purchases of naphtha were hedged using swaps and options on oil and oil products. Some of these hedges were shown in the Consolidated Finan-cial Statements of the BASF Group by means of cash flow hedge accounting, where gains and losses from hedges were recog-nized directly in equity. Gains and losses from hedges are included in cost of sales at the point in time in which the hedged item is recognized in the statement of income. In 2010, cash flow hedge accounting was applied in the Natural Gas Trading business sector for swaps on crude oil con-cluded to hedge price risks from purchase contracts for natu-ral gas. The purchase contracts have variable prices and the price formula is coupled to the oil price. The majority of the planned transactions and their effect on earnings occur in the year following the balance sheet date. A small part relates to the period between 2012 and 2014. In 2010, the effective changes in values over all subsidiaries balanced each other out in the stockholders’ equity of the shareholders of BASF SE. In 2009, €36 million in effective changes in the fair value of hedging instruments were recognized in stockholders’ equity of the shareholders of BASF SE. In 2010, €11 million was derecognized from stockholders’ equity of shareholders of BASF SE and recorded as a gain in cost of sales. In 2009, there was an expense of €155 million in this regard. The ineffective part in the change in value of the hedge was €12 million in 2010 (2009: €27 million). This amount was reported in the income statement in costs of sales, in other operating income and in other operating expenses.
In 2004 and 2005, fair value changes from forward interest swaps entered into to hedge interest-rate risks from the refinancing of an expiring bond were recognized directly in equity using cash flow hedge accounting. The hedge was closed in 2005 as a new bond was issued to refinance the expiring bond. The new bond is due in 2012. Over the maturity of the bond, the changes in fair value of interest rate swaps recognized in equity are reclassified proportionally from stockholders’ equity to the income statement. In both 2010 and 2009, €8 million was derecognized from other comprehensive income and recorded as interest expense. Cash flow hedge accounting was applied for the effects of foreign currency derivatives contained in supply contracts. The impact on earnings from the underlying transactions occurs pri-marily in 2011, with a smaller impact in the period between 2012 and 2014. In 2010, the effective part of the change in values of the hedges was minus €12 million (2009: €10 million), which was recognized in the stockholders’ equity of shareholders of BASF SE. In 2010, the amounts derecognized from the stockholders’ equity of shareholders of BASF SE increased costs of sales by €16 million. There was a reduction of €3 million in 2009 in this regard. There were no ineffective parts. In addition, in 2010 for the first time the translation risk from an investment in a foreign operation was hedged using foreign currency forward contracts. The hedging was completely effec-tive and reduced the stockholders’ equity of shareholders of BASF SE by €7 million.
192 Consolidated Financial Statements BASF Report 2010
Notes
Liabilities from finance leases (million €)
2010 2009
Minimum lease payments
Interest portion Leasing liability
Minimum lease payments
Interest portion Leasing liability
Following year 1 35 8 27 23 5 17
Following year 2 25 6 19 27 4 21
Following year 3 15 3 12 16 5 14
Following year 4 12 4 8 7 2 6
Following year 5 10 2 8 6 2 3
Over 5 years 27 5 22 27 9 19
124 28 96 106 27 80
In the current business year and in 2009, no additional lease payments arising from contractual obligations for finance leases were recognized in income above the minimum lease payments for finance leases. In 2010, leasing liabilities were not offset by any expected minimum lease payments from sub-leases. In addition, BASF is a lessee under operating lease con-tracts. The resulting lease obligations totaling €1,679 million in 2010, and €1,357 million in 2009, are due in the following years:
Commitments due to operating lease contracts (million €)
Nominal value of the future minimum payments
December 31, 2010
December 31, 2009
Less than 1 year 521 376
1–5 years 807 632
Over 5 years 351 349
1,679 1,357
In 2010, commitments due to operating lease contracts of less than one year included leases of precious metals of €203 million (2009: €133 million). These metals were immedi-ately leased to third parties. Offsetting the other leasing com-mitments were expected minimum lease payments from sub-leases of €16 million in 2010 (2009: €13 million).
Minimum lease payments of €311 million (2009: €279 million), conditional lease payments of €1 million (2009: €2 million), and payments received from subleases of €4 million (2009: €4 million), were included in income from operations in 2010.
BASF as lessorBASF acts as both a lessee and a lessor under finance leases. BASF acts as a lessor for finance leases in a minor capacity only. Receivables on finance leases were €18 million in 2010 and €17 million in 2009. In 2010, nominal minimum payments arising from operat-ing leases amounted to €222 million within one year, and €72 million for more than one year. For 2009, these figures amounted to €143 million within one year, and €40 million for more than one year. In 2010, precious metal accounts of €706 million (2009: €578 million), were held for customers where the metals are stored physically at BASF.
27 – Leasing
Leased assetsProperty, plant and equipment include those assets which are considered to be economically owned through a finance lease. They primarily concern the following items:
Leased assets (million €)
2010 2009
Acquisition cost Net book value Acquisition cost Net book value
Land, land rights and buildings 46 29 24 12
Machinery and technical equipment 275 79 235 78
Miscellaneous equipment and fixtures 69 13 67 13
390 121 326 103
193BASF Report 2010 Consolidated Financial Statements
Notes
28 – Compensation for the Board of Executive Directors and Supervisory Board of BASF SE
Million € 2010 2009
Performancerelated and fixed payments to the Board of Executive Directors 22.2 14.8
Market value of options granted to the Board of Executive Directors in the fiscal year on date of grant 3.5 2.8
Total compensation for the Board of Executive Directors 25.7 17.6
Service costs of the Board of Executive Directors 2.9 1.6
Compensation for the Supervisory Board 2.9 1.3
Total compensation for former members of the Board of Executive Directors and their surviving dependents 13.2 12.3
Pension provisions for former members of the Board of Executive Directors and their surviving dependents 95.4 87.9
Loans to members of the Board of Executive Directors and the Supervisory Board – –
Guarantees to members of the Board of Executive Directors and the Supervisory Board – –
Performance-related compensation for the Board of Executive Directors is based on the return on assets, as well as the per-formance of the entire Board. Return on assets corresponds to earnings before taxes plus borrowing costs as a percentage of average assets. Moreover, in 2010, the members of the Board of Executive Directors were granted 185,584 options under the long-term incentive program (LTI program).
The options of active and former members of the Board resulted in personnel expenses of €46.4 million in 2010. In 2009, options resulted in expenses of €20.9 million.
For more information on the compensation of members of the Board of Executive Directors, see the Compensation report from page 125 onward
For more information on the members of the Supervisory Board and Board of Executive Directors, including their memberships on other boards, see page 122 onward
29 – Related party transactions
Million € 2010 2009
SalesAccounts
receivable, tradeAccounts
payable, trade SalesAccounts
receivable, tradeAccounts
payable, trade
Nonconsolidated subsidiaries
1,056
266
48
860
213
45
Joint ventures 536 82 145 334 67 172
Associated and affiliated companies
1,391
189
17
1,332
103
30
IAS 24 “Related Party Disclosures” requires the disclosure of transactions with related parties. A related party is a person or entity where the BASF Group can exercise influence, has control or alternatively it is a related party that can exercise significant influence over the BASF Group. In particular, this relates to non-consolidated subsidiar-ies, joint ventures as well as affiliated and associated compa-nies.
The following table shows the volume of business with related parties that are consolidated at amortized cost, using the equity method or proportionally consolidated.
194 Consolidated Financial Statements BASF Report 2010
Notes
Sales from joint ventures related primarily to sales with Ellba C.V., Rotterdam, the Netherlands; Ellba Eastern Private Ltd., Singa-pore; Polioles S.A. de C.V., Lerma, Estado de Mexico, Mexico; BASF-YPC Company Ltd., Nanjing, China; Wintershall Erdgas Handelshaus Zug AG, Zug, Switzerland; and Wintershall Erd-gas Handelshaus GmbH & Co. KG, Berlin, Germany. The unconsolidated portion of the sales with these companies amounted to €391 million in 2010, and €253 million in 2009.
Sales with associated and affiliated companies resulted primarily from the business with Erdgas Münster GmbH, Münster, Germany, and VNG – Verbundnetz Gas Aktiengesell-schaft, Leipzig, Germany. The unconsolidated portion of the sales with these companies amounted to €1,291 million in 2010, and €1,272 million in 2009.
There were no reportable related party transactions with mem-bers of the Board of Executive Directors or the Super visory Board and their related parties. BASF has not issued loans to members of the Board of Executive Directors or the Supervisory Board and their related parties.
For more information on subsidiaries, joint ventures, associated and affiliated companies, see the List of Shares Held of the BASF Group 2010 on page 194 below
For more information on the Board of Executive Directors and the Supervisory Board, see Management and Supervisory Boards and Compensation Report from page 125 onward
30 – Services provided by the external auditor
BASF Group companies have used the following services from KPMG:
Million € 2010 2009
Annual audit 24.5 22.7
Thereof domestic 7.6 6.6
Auditrelated services 0.4 0.4
Thereof domestic 0.1 0.1
Tax consultation services . .
Thereof domestic – –
Other services 0.3 0.3
Thereof domestic 0.3 0.3
25.2 23.4
31 – List of Shares Held of the BASF Group in accordance with Section 313 (2) of the German Commercial Code
Of this amount, €11.4 million in 2010 (2009: €10.3 million), related to fees for annual audits paid to KPMG AG Wirtschaftsprüfungsgesellschaft and its affiliated companies (which together form KPMG Europe LLP).
The annual audit related to the audit of the annual financial state-ments of the BASF Group as well as the legally required audit of the financial statements of BASF SE and the consolidated subsidiary companies and joint ventures.
List of Shares Held The list of consolidated companies and the complete list of all companies in which BASF SE has a participation as required by Section 313 (2) of the German Commercial Code is an integral
component of the audited Consolidated Financial Statements submitted to the electronic Federal Gazette. It is also published on the internet at: basf.com/en/investor/cg
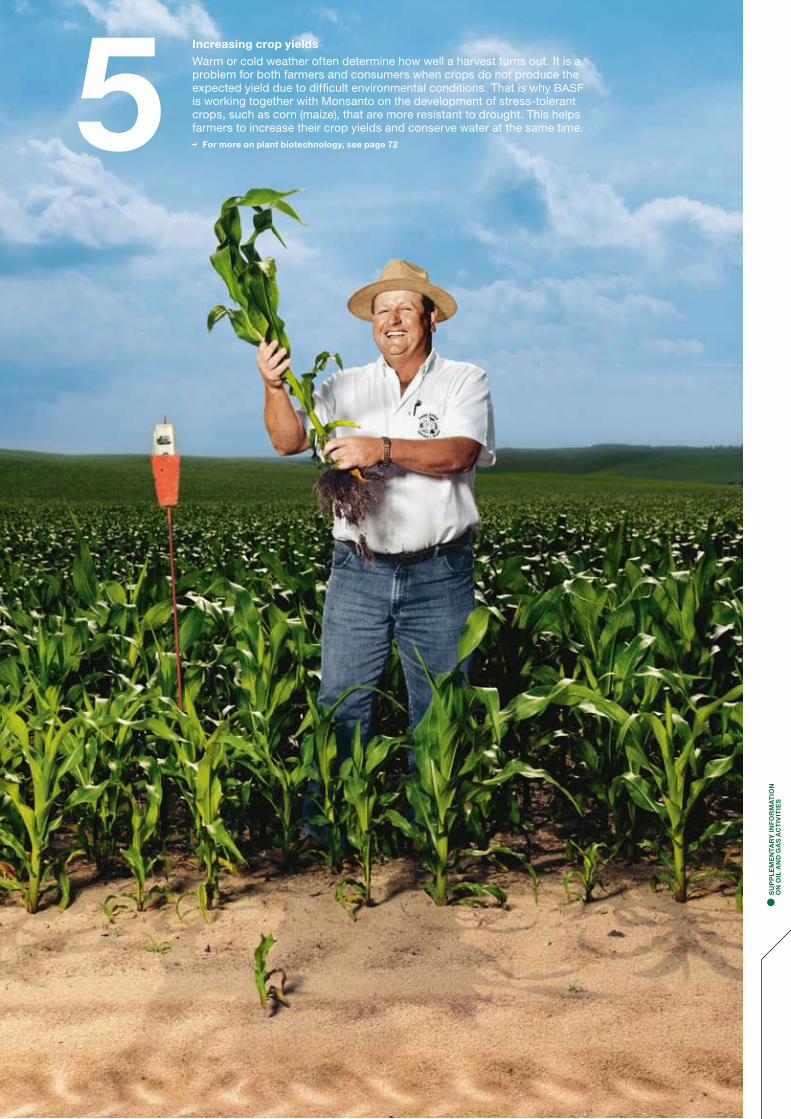
5Increasing crop yields
Warm or cold weather often determine how well a harvest turns out. It is a problem for both farmers and consumers when crops do not produce the expected yield due to difficult environmental conditions. That is why BASF is working together with Monsanto on the development of stresstolerant crops, such as corn (maize), that are more resistant to drought. This helps farmers to increase their crop yields and conserve water at the same time.
For more on plant biotechnology, see page 72
• S
UP
PL
EM
EN
TAR
Y I
NF
OR
MA
TIO
N
O
N O
IL A
ND
GA
S A
CT
IVIT
IES
195 Supplementary information on oil and gas producing activities
Supplementary information on oil and gas producing activities
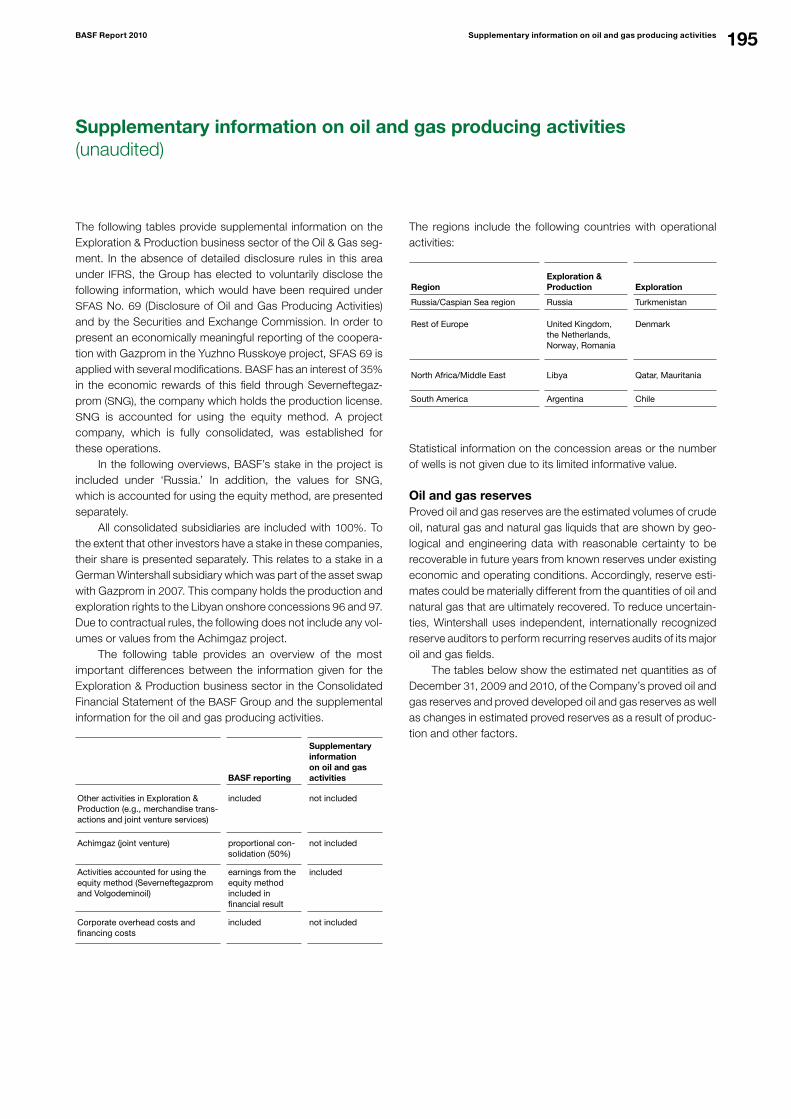
195BASF Report 2010 Supplementary information on oil and gas producing activities
The following tables provide supplemental information on the Exploration & Production business sector of the Oil & Gas seg-ment. In the absence of detailed disclosure rules in this area under IFRS, the Group has elected to voluntarily disclose the following information, which would have been required under SFAS No. 69 (Disclosure of Oil and Gas Producing Activities) and by the Securities and Exchange Commission. In order to present an economically meaningful reporting of the coopera-tion with Gazprom in the Yuzhno Russkoye project, SFAS 69 is applied with several modifications. BASF has an interest of 35% in the economic rewards of this field through Severneftegaz-prom (SNG), the company which holds the production license. SNG is accounted for using the equity method. A project company, which is fully consolidated, was established for these operations. In the following overviews, BASF’s stake in the project is included under ‘Russia.’ In addition, the values for SNG, which is accounted for using the equity method, are presented separately. All consolidated subsidiaries are included with 100%. To the extent that other investors have a stake in these companies, their share is presented separately. This relates to a stake in a German Wintershall subsidiary which was part of the asset swap with Gazprom in 2007. This company holds the production and exploration rights to the Libyan onshore concessions 96 and 97. Due to contractual rules, the following does not include any vol-umes or values from the Achimgaz project. The following table provides an overview of the most important differences between the information given for the Exploration & Production business sector in the Consolidated Financial Statement of the BASF Group and the supplemental information for the oil and gas producing activities.
BASF reporting
Supplementary information on oil and gas activities
Other activities in Exploration & Production (e.g., merchandise transactions and joint venture services)
included
not included
Achimgaz (joint venture) proportional consolidation (50%)
not included
Activities accounted for using the equity method (Severneftegazprom and Volgodeminoil)
earnings from the equity method included in financial result
included
Corporate overhead costs and financing costs
included not included
The regions include the following countries with operational activities:
RegionExploration & Production Exploration
Russia/Caspian Sea region Russia Turkmenistan
Rest of Europe United Kingdom, the Netherlands, Norway, Romania
Denmark
North Africa/Middle East Libya Qatar, Mauritania
South America Argentina Chile
Statistical information on the concession areas or the number of wells is not given due to its limited informative value.
Oil and gas reservesProved oil and gas reserves are the estimated volumes of crude oil, natural gas and natural gas liquids that are shown by geo-logical and engineering data with reasonable certainty to be recoverable in future years from known reserves under existing economic and operating conditions. Accordingly, reserve esti-mates could be materially different from the quantities of oil and natural gas that are ultimately recovered. To reduce uncertain-ties, Wintershall uses independent, internationally recognized reserve auditors to perform recurring reserves audits of its major oil and gas fields. The tables below show the estimated net quantities as of December 31, 2009 and 2010, of the Company’s proved oil and gas reserves and proved developed oil and gas reserves as well as changes in estimated proved reserves as a result of produc-tion and other factors.
Supplementary information on oil and gas producing activities(unaudited)
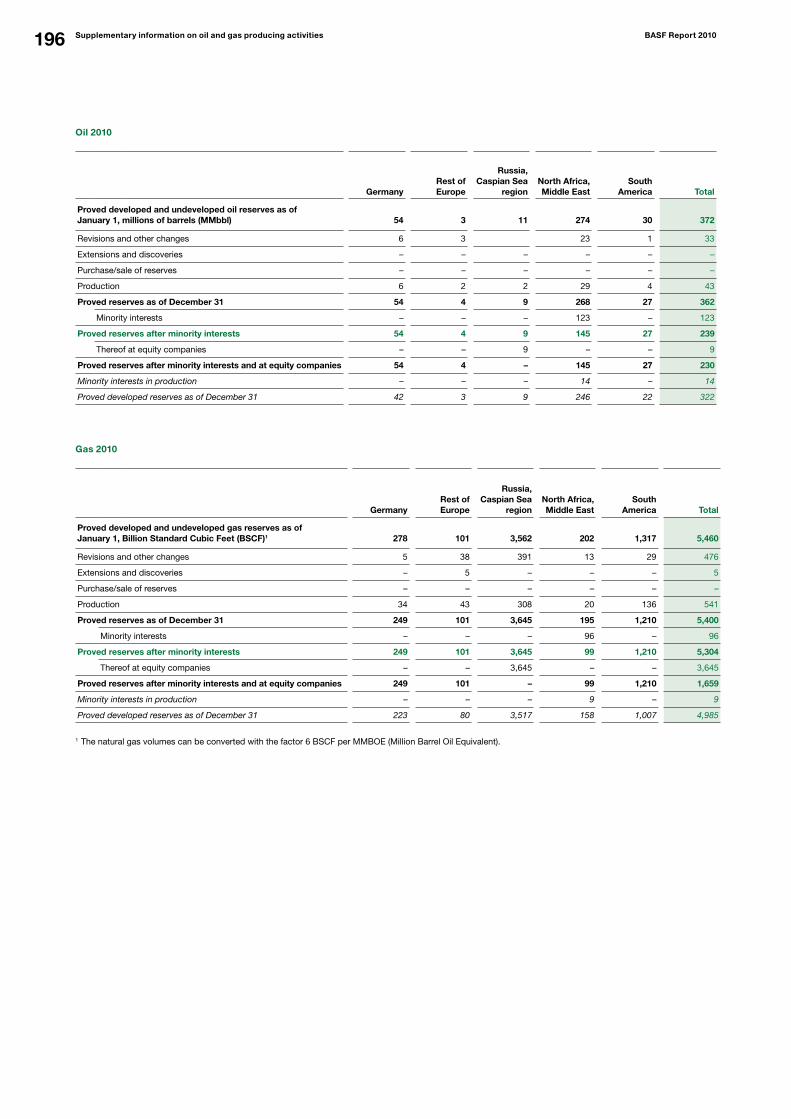
196 Supplementary information on oil and gas producing activities BASF Report 2010
Oil 2010
GermanyRest of Europe
Russia,Caspian Sea
region
North Africa,Middle East
South America Total
Proved developed and undeveloped oil reserves as of January 1, millions of barrels (MMbbl) 54 3 11 274 30 372
Revisions and other changes 6 3 23 1 33
Extensions and discoveries – – – – – –
Purchase/sale of reserves – – – – – –
Production 6 2 2 29 4 43
Proved reserves as of December 31 54 4 9 268 27 362
Minority interests – – – 123 – 123
Proved reserves after minority interests 54 4 9 145 27 239
Thereof at equity companies – – 9 – – 9
Proved reserves after minority interests and at equity companies 54 4 – 145 27 230
Minority interests in production – – – 14 – 14
Proved developed reserves as of December 31 42 3 9 246 22 322
Gas 2010
GermanyRest of Europe
Russia,Caspian Sea
region
North Africa,Middle East
South America Total
Proved developed and undeveloped gas reserves as of January 1, Billion Standard Cubic Feet (BSCF)1 278 101 3,562 202 1,317 5,460
Revisions and other changes 5 38 391 13 29 476
Extensions and discoveries – 5 – – – 5
Purchase/sale of reserves – – – – – –
Production 34 43 308 20 136 541
Proved reserves as of December 31 249 101 3,645 195 1,210 5,400
Minority interests – – – 96 – 96
Proved reserves after minority interests 249 101 3,645 99 1,210 5,304
Thereof at equity companies – – 3,645 – – 3,645
Proved reserves after minority interests and at equity companies 249 101 – 99 1,210 1,659
Minority interests in production – – – 9 – 9
Proved developed reserves as of December 31 223 80 3,517 158 1,007 4,985
1 The natural gas volumes can be converted with the factor 6 BSCF per MMBOE (Million Barrel Oil Equivalent).
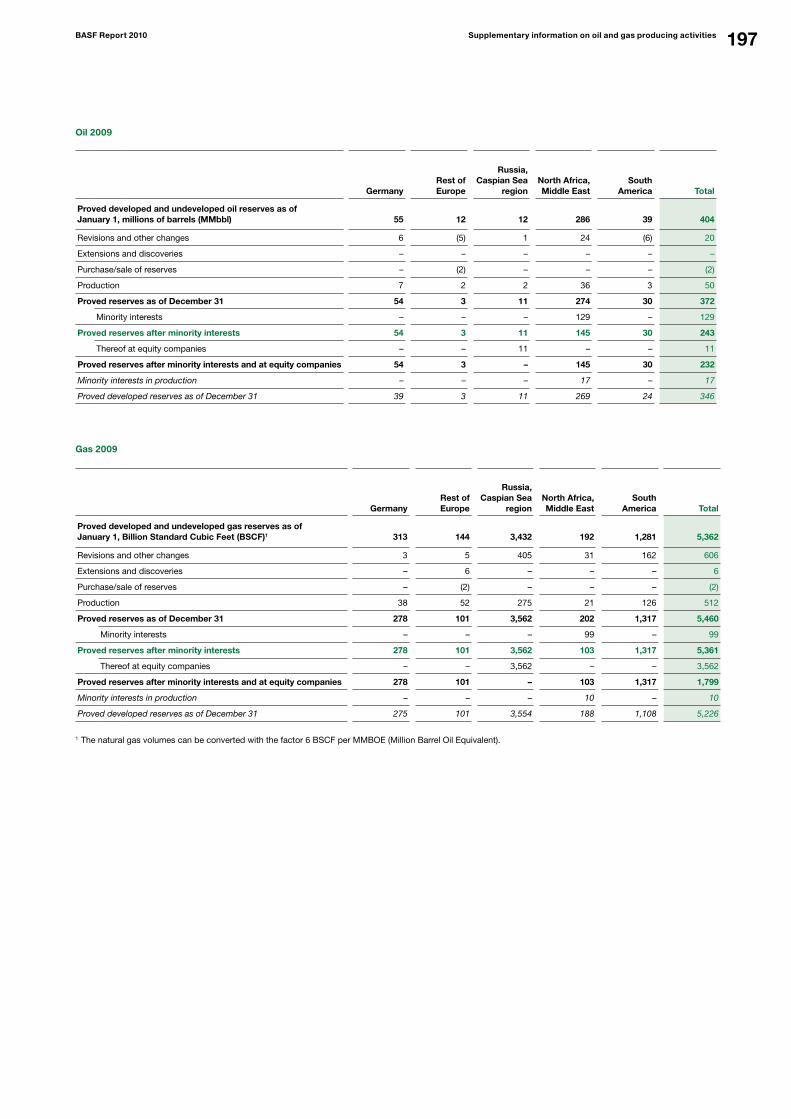
197BASF Report 2010 Supplementary information on oil and gas producing activities
Oil 2009
GermanyRest of Europe
Russia,Caspian Sea
region
North Africa,Middle East
South America Total
Proved developed and undeveloped oil reserves as of January 1, millions of barrels (MMbbl) 55 12 12 286 39 404
Revisions and other changes 6 (5) 1 24 (6) 20
Extensions and discoveries – – – – – –
Purchase/sale of reserves – (2) – – – (2)
Production 7 2 2 36 3 50
Proved reserves as of December 31 54 3 11 274 30 372
Minority interests – – – 129 – 129
Proved reserves after minority interests 54 3 11 145 30 243
Thereof at equity companies – – 11 – – 11
Proved reserves after minority interests and at equity companies 54 3 – 145 30 232
Minority interests in production – – – 17 – 17
Proved developed reserves as of December 31 39 3 11 269 24 346
Gas 2009
GermanyRest of Europe
Russia,Caspian Sea
region
North Africa,Middle East
South America Total
Proved developed and undeveloped gas reserves as of January 1, Billion Standard Cubic Feet (BSCF)1 313 144 3,432 192 1,281 5,362
Revisions and other changes 3 5 405 31 162 606
Extensions and discoveries – 6 – – – 6
Purchase/sale of reserves – (2) – – – (2)
Production 38 52 275 21 126 512
Proved reserves as of December 31 278 101 3,562 202 1,317 5,460
Minority interests – – – 99 – 99
Proved reserves after minority interests 278 101 3,562 103 1,317 5,361
Thereof at equity companies – – 3,562 – – 3,562
Proved reserves after minority interests and at equity companies 278 101 – 103 1,317 1,799
Minority interests in production – – – 10 – 10
Proved developed reserves as of December 31 275 101 3,554 188 1,108 5,226
1 The natural gas volumes can be converted with the factor 6 BSCF per MMBOE (Million Barrel Oil Equivalent).
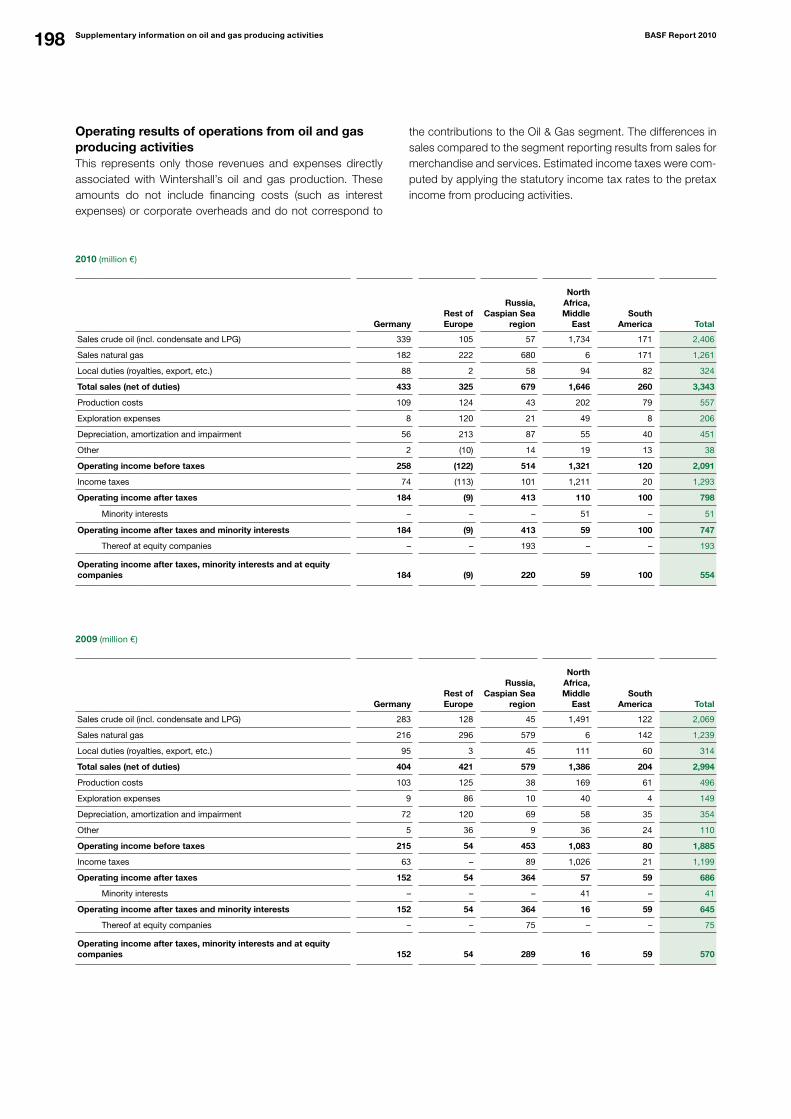
198 Supplementary information on oil and gas producing activities BASF Report 2010
2010 (million €)
GermanyRest of Europe
Russia,Caspian Sea
region
North
Africa,Middle
EastSouth
America Total
Sales crude oil (incl. condensate and LPG) 339 105 57 1,734 171 2,406
Sales natural gas 182 222 680 6 171 1,261
Local duties (royalties, export, etc.) 88 2 58 94 82 324
Total sales (net of duties) 433 325 679 1,646 260 3,343
Production costs 109 124 43 202 79 557
Exploration expenses 8 120 21 49 8 206
Depreciation, amortization and impairment 56 213 87 55 40 451
Other 2 (10) 14 19 13 38
Operating income before taxes 258 (122) 514 1,321 120 2,091
Income taxes 74 (113) 101 1,211 20 1,293
Operating income after taxes 184 (9) 413 110 100 798
Minority interests – – – 51 – 51
Operating income after taxes and minority interests 184 (9) 413 59 100 747
Thereof at equity companies – – 193 – – 193
Operating income after taxes, minority interests and at equity companies 184 (9) 220 59 100 554
2009 (million €)
GermanyRest of Europe
Russia,Caspian Sea
region
North
Africa,Middle
EastSouth
America Total
Sales crude oil (incl. condensate and LPG) 283 128 45 1,491 122 2,069
Sales natural gas 216 296 579 6 142 1,239
Local duties (royalties, export, etc.) 95 3 45 111 60 314
Total sales (net of duties) 404 421 579 1,386 204 2,994
Production costs 103 125 38 169 61 496
Exploration expenses 9 86 10 40 4 149
Depreciation, amortization and impairment 72 120 69 58 35 354
Other 5 36 9 36 24 110
Operating income before taxes 215 54 453 1,083 80 1,885
Income taxes 63 – 89 1,026 21 1,199
Operating income after taxes 152 54 364 57 59 686
Minority interests – – – 41 – 41
Operating income after taxes and minority interests 152 54 364 16 59 645
Thereof at equity companies – – 75 – – 75
Operating income after taxes, minority interests and at equity companies 152 54 289 16 59 570
Operating results of operations from oil and gas producing activities This represents only those revenues and expenses directly associated with Wintershall’s oil and gas production. These amounts do not include financing costs (such as interest expenses) or corporate overheads and do not correspond to
the contributions to the Oil & Gas segment. The differences in sales compared to the segment reporting results from sales for merchandise and services. Estimated income taxes were com-puted by applying the statutory income tax rates to the pretax income from producing activities.
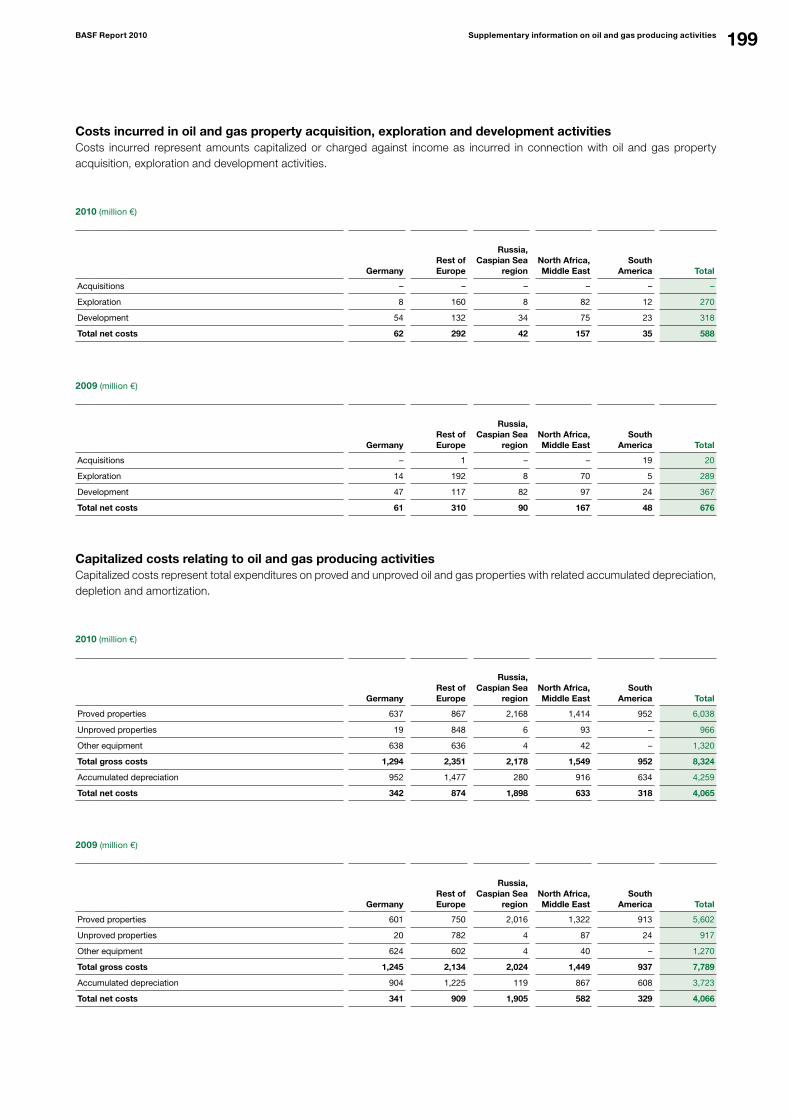
199BASF Report 2010 Supplementary information on oil and gas producing activities
Costs incurred in oil and gas property acquisition, exploration and development activitiesCosts incurred represent amounts capitalized or charged against income as incurred in connection with oil and gas property acquisition, exploration and development activities.
2010 (million €)
GermanyRest of Europe
Russia,Caspian Sea
region
North Africa,Middle East
South America Total
Acquisitions – – – – – –
Exploration 8 160 8 82 12 270
Development 54 132 34 75 23 318
Total net costs 62 292 42 157 35 588
2009 (million €)
GermanyRest of Europe
Russia,Caspian Sea
region
North Africa,Middle East
South America Total
Acquisitions – 1 – – 19 20
Exploration 14 192 8 70 5 289
Development 47 117 82 97 24 367
Total net costs 61 310 90 167 48 676
Capitalized costs relating to oil and gas producing activitiesCapitalized costs represent total expenditures on proved and unproved oil and gas properties with related accumulated depreciation, depletion and amortization.
2010 (million €)
GermanyRest of Europe
Russia,Caspian Sea
region
North Africa,Middle East
South America Total
Proved properties 637 867 2,168 1,414 952 6,038
Unproved properties 19 848 6 93 – 966
Other equipment 638 636 4 42 – 1,320
Total gross costs 1,294 2,351 2,178 1,549 952 8,324
Accumulated depreciation 952 1,477 280 916 634 4,259
Total net costs 342 874 1,898 633 318 4,065
2009 (million €)
GermanyRest of Europe
Russia,Caspian Sea
region
North Africa,Middle East
South America Total
Proved properties 601 750 2,016 1,322 913 5,602
Unproved properties 20 782 4 87 24 917
Other equipment 624 602 4 40 – 1,270
Total gross costs 1,245 2,134 2,024 1,449 937 7,789
Accumulated depreciation 904 1,225 119 867 608 3,723
Total net costs 341 909 1,905 582 329 4,066
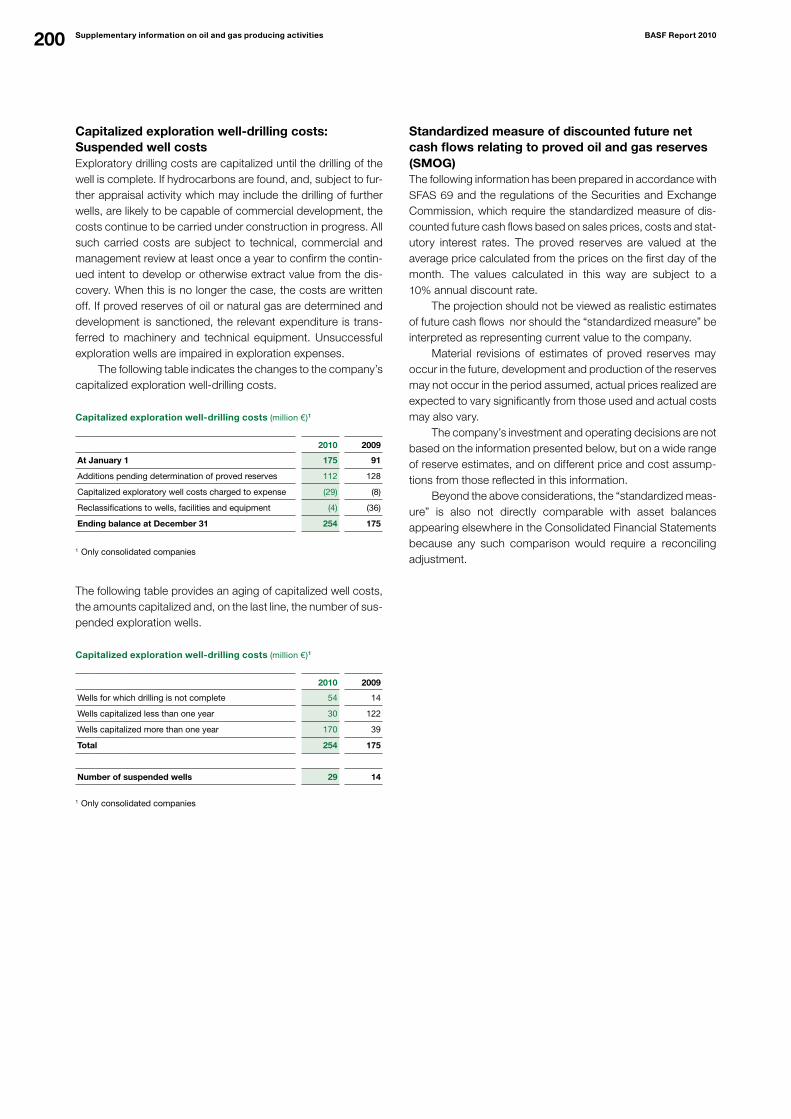
200 Supplementary information on oil and gas producing activities BASF Report 2010
Capitalized exploration well-drilling costs: Suspended well costsExploratory drilling costs are capitalized until the drilling of the well is complete. If hydrocarbons are found, and, subject to fur-ther appraisal activity which may include the drilling of further wells, are likely to be capable of commercial development, the costs continue to be carried under construction in progress. All such carried costs are subject to technical, commercial and management review at least once a year to confirm the contin-ued intent to develop or otherwise extract value from the dis-covery. When this is no longer the case, the costs are written off. If proved reserves of oil or natural gas are determined and development is sanctioned, the relevant expenditure is trans-ferred to machinery and technical equipment. Unsuccessful exploration wells are impaired in exploration expenses. The following table indicates the changes to the company’s capitalized exploration well-drilling costs.
Capitalized exploration well-drilling costs (million €)1
2010 2009
At January 1 175 91
Additions pending determination of proved reserves 112 128
Capitalized exploratory well costs charged to expense (29) (8)
Reclassifications to wells, facilities and equipment (4) (36)
Ending balance at December 31 254 175
1 Only consolidated companies
The following table provides an aging of capitalized well costs, the amounts capitalized and, on the last line, the number of sus-pended exploration wells.
Capitalized exploration well-drilling costs (million €)1
2010 2009
Wells for which drilling is not complete 54 14
Wells capitalized less than one year 30 122
Wells capitalized more than one year 170 39
Total 254 175
Number of suspended wells 29 14
1 Only consolidated companies
Standardized measure of discounted future net cash flows relating to proved oil and gas reserves (SMOG) The following information has been prepared in accordance with SFAS 69 and the regulations of the Securities and Exchange Commission, which require the standardized measure of dis-counted future cash flows based on sales prices, costs and stat-utory interest rates. The proved reserves are valued at the average price calculated from the prices on the first day of the month. The values calculated in this way are subject to a 10% annual discount rate. The projection should not be viewed as realistic estimates of future cash flows nor should the “standardized measure” be interpreted as representing current value to the company. Material revisions of estimates of proved reserves may occur in the future, development and production of the reserves may not occur in the period assumed, actual prices realized are expected to vary significantly from those used and actual costs may also vary. The company’s investment and operating decisions are not based on the information presented below, but on a wide range of reserve estimates, and on different price and cost assump-tions from those reflected in this information. Beyond the above considerations, the “standardized meas-ure” is also not directly comparable with asset balances appearing elsewhere in the Consolidated Financial Statements because any such comparison would require a reconciling adjustment.
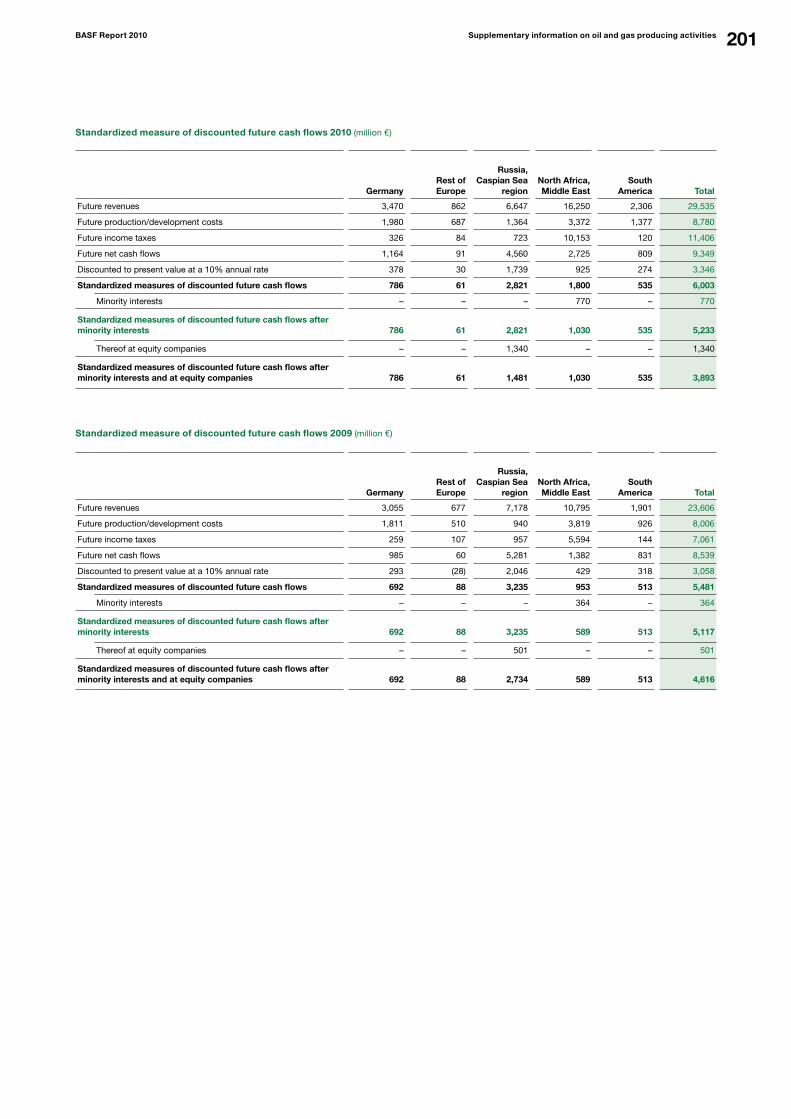
201BASF Report 2010 Supplementary information on oil and gas producing activities
Standardized measure of discounted future cash flows 2010 (million €)
GermanyRest of Europe
Russia,Caspian Sea
region
North Africa,Middle East
South America Total
Future revenues 3,470 862 6,647 16,250 2,306 29,535
Future production/development costs 1,980 687 1,364 3,372 1,377 8,780
Future income taxes 326 84 723 10,153 120 11,406
Future net cash flows 1,164 91 4,560 2,725 809 9,349
Discounted to present value at a 10% annual rate 378 30 1,739 925 274 3,346
Standardized measures of discounted future cash flows 786 61 2,821 1,800 535 6,003
Minority interests – – – 770 – 770
Standardized measures of discounted future cash flows after minority interests 786 61 2,821 1,030 535 5,233
Thereof at equity companies – – 1,340 – – 1,340
Standardized measures of discounted future cash flows after minority interests and at equity companies 786 61 1,481 1,030 535 3,893
Standardized measure of discounted future cash flows 2009 (million €)
GermanyRest of Europe
Russia,Caspian Sea
region
North Africa,Middle East
South America Total
Future revenues 3,055 677 7,178 10,795 1,901 23,606
Future production/development costs 1,811 510 940 3,819 926 8,006
Future income taxes 259 107 957 5,594 144 7,061
Future net cash flows 985 60 5,281 1,382 831 8,539
Discounted to present value at a 10% annual rate 293 (28) 2,046 429 318 3,058
Standardized measures of discounted future cash flows 692 88 3,235 953 513 5,481
Minority interests – – – 364 – 364
Standardized measures of discounted future cash flows after minority interests 692 88 3,235 589 513 5,117
Thereof at equity companies – – 501 – – 501
Standardized measures of discounted future cash flows after minority interests and at equity companies 692 88 2,734 589 513 4,616
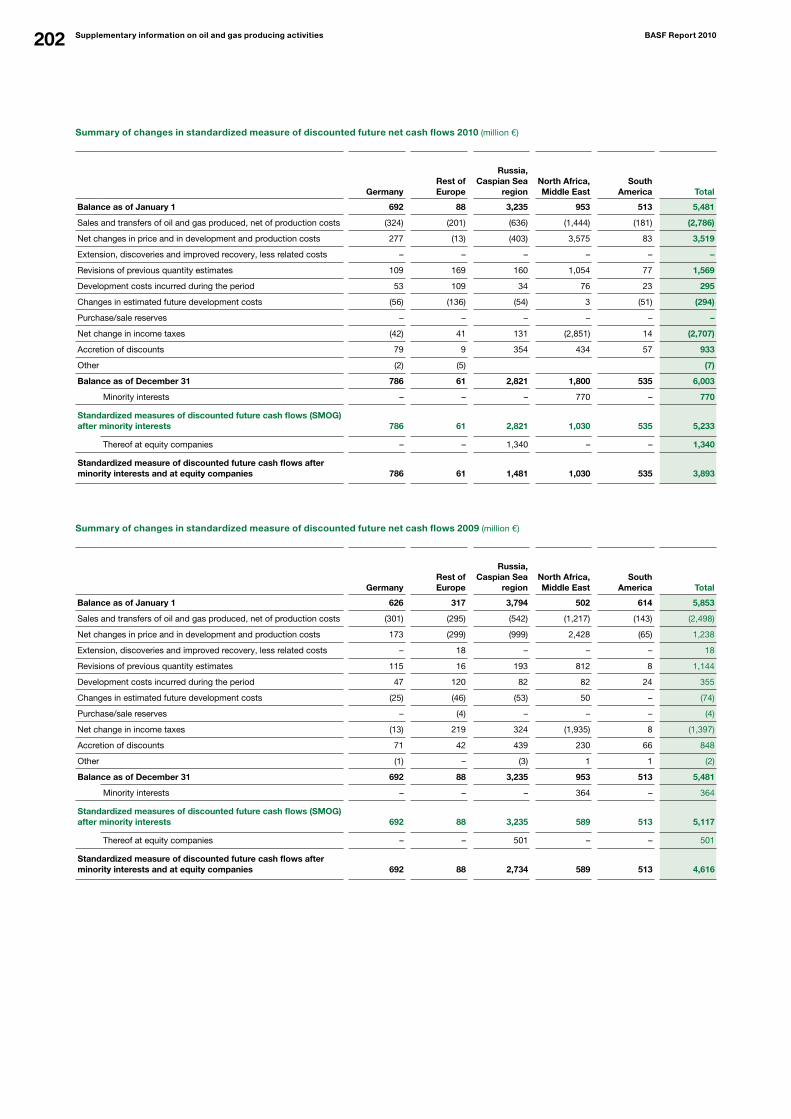
202 Supplementary information on oil and gas producing activities BASF Report 2010
Summary of changes in standardized measure of discounted future net cash flows 2010 (million €)
GermanyRest of Europe
Russia,Caspian Sea
region
North Africa,Middle East
South America Total
Balance as of January 1 692 88 3,235 953 513 5,481
Sales and transfers of oil and gas produced, net of production costs (324) (201) (636) (1,444) (181) (2,786)
Net changes in price and in development and production costs 277 (13) (403) 3,575 83 3,519
Extension, discoveries and improved recovery, less related costs – – – – – –
Revisions of previous quantity estimates 109 169 160 1,054 77 1,569
Development costs incurred during the period 53 109 34 76 23 295
Changes in estimated future development costs (56) (136) (54) 3 (51) (294)
Purchase/sale reserves – – – – – –
Net change in income taxes (42) 41 131 (2,851) 14 (2,707)
Accretion of discounts 79 9 354 434 57 933
Other (2) (5) (7)
Balance as of December 31 786 61 2,821 1,800 535 6,003
Minority interests – – – 770 – 770
Standardized measures of discounted future cash flows (SMOG) after minority interests 786 61 2,821 1,030 535 5,233
Thereof at equity companies – – 1,340 – – 1,340
Standardized measure of discounted future cash flows after minority interests and at equity companies 786 61 1,481 1,030 535 3,893
Summary of changes in standardized measure of discounted future net cash flows 2009 (million €)
GermanyRest of Europe
Russia,Caspian Sea
region
North Africa,Middle East
South America Total
Balance as of January 1 626 317 3,794 502 614 5,853
Sales and transfers of oil and gas produced, net of production costs (301) (295) (542) (1,217) (143) (2,498)
Net changes in price and in development and production costs 173 (299) (999) 2,428 (65) 1,238
Extension, discoveries and improved recovery, less related costs – 18 – – – 18
Revisions of previous quantity estimates 115 16 193 812 8 1,144
Development costs incurred during the period 47 120 82 82 24 355
Changes in estimated future development costs (25) (46) (53) 50 – (74)
Purchase/sale reserves – (4) – – – (4)
Net change in income taxes (13) 219 324 (1,935) 8 (1,397)
Accretion of discounts 71 42 439 230 66 848
Other (1) – (3) 1 1 (2)
Balance as of December 31 692 88 3,235 953 513 5,481
Minority interests – – – 364 – 364
Standardized measures of discounted future cash flows (SMOG) after minority interests 692 88 3,235 589 513 5,117
Thereof at equity companies – – 501 – – 501
Standardized measure of discounted future cash flows after minority interests and at equity companies 692 88 2,734 589 513 4,616

6The future of energy storage
Climate protection poses great challenges to future mobility. Electric cars with lithiumion batteries could be a solution. BASF already offers materials which enable these batteries to store more energy. Together with partners from the fields of business and science, BASF is also conducting research on the next generation of batteries to ensure future mobility while protecting the environment.
For more on electromobility, see page 30
• O
VE
RV
IEW
S

203 Glossary
207 Index
209 Registered Trademarks
210 Ten-year summary
213 GRI and Global Compact Index
214 Statement GRI Application Level Check
Overviews
203BASF Report 2010 Overviews
Glossary
Glossary
AAmfloraAmflora is a genetically modified starch potato developed by BASF which produces an optimized starch composition for industrial applications.
AuditsAudits are a strategic tool for managing safety and environmental protection standards. During a site or plant audit, a profile is cre-ated using clearly defined environmental, safety or health criteria.
BBack-up lineA confirmed line of credit that can be drawn upon in connection with the issue of commercial paper if market liquidity is not suffi-cient, or for the purpose of general corporate financing. It is one of the instruments BASF uses to ensure it is able to make payments at all times.
Barrel of Oil Equivalent (BOE)An international standard for comparing the thermal energy of dif-ferent fuels. A BOE is the equivalent of one barrel of crude oil or 6,000 cubic feet or 169 cubic meters of natural gas.
BiotechnologyThis term covers all processes and products that use living organ-isms, for example bacteria and yeasts, or their cellular constituents. Plant biotechnology and white biotechnology belong to the five growth clusters of BASF.
CCO2 equivalentA parameter to describe the effect of greenhouse gas emissions. A factor known as the global warming potential (GWP) shows the effect of the individual gases compared with CO2 as the reference value.
Commercial paper programA framework agreement between BASF and banks regarding the issuing of debt obligations on the financial market (commercial paper). The commercial paper is issued under a rolling program for which the terms can be determined individually. A prerequisite for this is a good rating.
ComplianceCompliance is an important element of corporate governance. It refers to the company’s behavior in accordance with laws, guide-lines and voluntary codices.
Cost of capitalThe cost of capital reflects shareholders’ expectations regarding return (in the form of dividends or share price increases) and inter-est rates payable to providers of debt. To ensure its lasting success, a company should earn at least the return on invested capital expected by shareholders and creditors on a sustained basis.
DDividend yieldThe dividend yield is the return received by a shareholder in the form of a dividend in relation to the year-end share price. It is calculated by dividing the per-share dividend by the year-end share price and multiplying by 100.
DrillingDrilling describes the creation of boreholes to explore for and develop deposits.
EEBITEarnings before Interest and Taxes. At BASF, EBIT corresponds to the income from operations.
EBIT after cost of capitalThe EBIT after cost of capital is calculated by deducting the cost of capital from the operating income earned by BASF’s operating divisions. If the EBIT after cost of capital has a positive value, BASF has earned a premium on the expected return of its providers of debt and equity. The EBIT after cost of capital is the key perfor-mance and management indicator at BASF.
EBITDAEarnings before Interest, Taxes, Depreciation and Amortization. At BASF, EBITDA corresponds to the income from operations before depreciation and amortization.
EBITDA marginThis is the margin that we earn on sales from our operating activi-ties before depreciation and amortization. It is calculated as income from operations before depreciation and amortization as a percent-age of sales.
Eco-Efficiency AnalysisMethod for the evaluation of products and processes considering economic and environmental aspects. The aim is to compare prod-ucts with regard to profitability and environmental performance.
EmollientEmollients are nurturing oil components that give skin a velvety feel. They are a common ingredient in skin and hair care products such as creams and hair masks.
EPSAAn Exploration and Production Sharing Agreement is one of the prevalent types of contract between a national oil company and an international oil company in the exploration and production of hydrocarbons.
Equity methodThe equity method is an accounting technique used to include BASF’s investments in companies in which it has significant influ-ence in the Consolidated Financial Statements. The book value of the investment changes depending on the equity of the company in question.
204 Overviews BASF Report 2010
Glossary
European Water PartnershipThe European Water Partnership was founded in 2006 as an inde-pendent non-profit organization to promote sustainable water man-agement. It serves as a discussion forum, promotes partnerships as well as the exchange of information among relevant stakehold-ers, and initiates and coordinates initiatives.
ExplorationTo investigate and explore an area in the search for mineral resources such as crude oil or natural gas. The exploration process involves using suitable geophysical processes to find structures that may contain oil and gas then proving a possible find by means of explor-atory drilling.
FFermentationFermentation is a process in which substances are broken down with the aid of microorganisms such as bacteria, fungi or cell cultures.
Field developmentTerm for the installation of production facilities and the drilling of pro-duction wells for the commercial exploitation of oil and natural gas deposits.
Free cash flow Cash provided by operating activities less payments related to prop-erty, plant and equipment and intangible assets.
GGlobal Product Strategy (GPS)The Global Product Strategy aims to establish global product stew-ardship standards and practices for companies. The program, ini-tiated by the International Council of Chemical Associations (ICCA), strives to minimize the negative impact of chemicals on human health and the environment, particularly in developing countries.
GoodwillGoodwill is a term used to describe a company’s value. It repre-sents the difference between the actual value of a company’s assets and the purchase price paid. Because goodwill takes potential earn-ings into account, it may exceed the book value.
Growth clustersBASF has brought together its research activities related to the important technology-driven issues of the future into five growth clusters: energy management, raw material change, plant biotech-nology, nanotechnology and white (industrial) biotechnology.
Greenhouse Gas Protocol (GHG Protocol)The Greenhouse Gas Protocol, used by companies from different sectors, NGOs and governments, is a globally recognized standard to quantify and manage greenhouse gas emissions. The reporting standards and recommendations for the implementation of projects to reduce emissions are jointly developed by companies, govern-ments and NGOs under the guidance of the World Resources Institute and the World Business Council for Sustainable Develop-ment.
HHPPOTechnology to produce propylene oxide (PO) from hydrogen perox-ide (HP). HPPO technology is more environmentally friendly and economically viable than conventional PO methods of production, because no by-products are produced besides water. PO is an intermediate, for example, in the production of polyurethane.
IIASInternational Accounting Standards (see also IFRS)
IFRICThe International Financial Reporting Interpretations Committee is a committee that publishes proposed guidance on IFRS and IAS.
IFRSInternational Financial Reporting Standards (until 2001: International Accounting Standards, IAS) are developed and published by the International Accounting Standards Board (IASB) headquartered in London, United Kingdom. In accordance with the IAS Regulations, IFRS are mandatory for listed companies headquartered in the European Union since 2005.
ILO Core Labor StandardsThe ILO Core Labor Standards are laid out in a declaration of the International Labor Organization (ILO). It comprises eight conven-tions which set minimum requirements for decent working condi-tions. BASF has a Group-wide system to monitor employees’ and suppliers’ adherence to these labor standards.
International Standard on Assurance Engagements 3000 (ISAE 3000)ISAE 3000 is published by the International Audit and Assurance Standards Board (IAASB). It provides guidelines for comprehensive audits, which contain non-financial data, for example for the audits of sustainability reports.
ISO 14001ISO 14001 is an international standard developed by the International Organization for Standardization (ISO) that determines the general requirements for an environmental management system for volun-tary certification.
ISO 19011ISO 19011 is an international standard developed by the Interna-tional Organization for Standardization (ISO) that determines requirements for audits of quality management and environmental management systems.
MMateriality analysisBASF uses materiality analysis to analyze and evaluate societal interest in sustainability topics as well as their potential significance for the company. The aim is to develop strategies at an early stage to address potential new risks and opportunities. In 2010, several hundred stakeholders participated in the analysis, the results of which are portrayed in a materiality matrix.
MDI MDI stands for diphenylmethane diisocyanate and is one of the most important raw materials for the production of the plastic polyure-thane. This plastic is used for applications ranging from the soles of high-tech jogging shoes, to car shock-absorbers, refrigerator insulation and even insulation for buildings.
MEA (Membrane Electrode Assembly unit)The MEA is the core of a fuel cell. This is where hydrogen and oxygen react to form water, generating electrical energy and heat in the process.
MonitoringMonitoring systems and tools serve to measure and ensure the adherence to standards. One area that is monitored is our volun-tary commitments such as the adherence to human rights and internationally recognized labor standards.
205BASF Report 2010 Overviews
Glossary
NNanotechnologyCharacterization, generation and utilization of structures and sys-tems that are smaller than one hundred nanometers.
NaphthaPetroleum that is produced during oil refining. Heavy naphtha is the starting point for gasoline production. Light naphtha is the most important feedstock for steam crackers.
OOECDThe Organization for Economic Cooperation and Development is an international body, headquartered in Paris, France.
OHSAS 18001The Occupational Health and Safety Assessment Series (OHSAS) comprises, among other things, the standard OHSAS 18001 which includes a management system for occupational safety. This sys-tem can be integrated into an existing quality and environmental protection management system and certified accordingly.
PPatent Asset IndexThe Patent Asset Index measures the strength of a company’s patent portfolio. It is made up of two factors: (1) “portfolio size” (the number of worldwide active patent families) and (2) “competitive impact,” which is the combination of technology relevance and market coverage (weighted by market size).
Payout ratioThe payout ratio shows what proportion of earnings is distributed in the form of a dividend. It is calculated by dividing the total divi-dend paid by net income and multiplying by 100.
PolyTHFTHF stands for tetrahydrofuran and is a starting compound for Poly-tetrahydrofuran (PolyTHF®), an important component for the pro-duction of elastomer fibers for textiles. Elastomer fibers are used in sports clothing, for example.
Product innovationsNew or improved products and applications, which have been on the market for less than five years.
RREACHAn E.U. regulatory framework for the registration, evaluation and authorization of chemicals.
Responsible CareA worldwide initiative by the chemical industry to continuously improve its performance in the fields of environmental protection, health and safety.
RetentionThere are two applications for generated profits: distribution to shareholders or retention in the company.
Return on assetsThis describes the return we make on the average assets employed during the year. It is calculated as income from operations (EBIT) plus interest expenses as a percentage of average assets.
SSCR technology (Selective Catalytic Reduction)This technology is used to convert harmful nitrogen oxide, which is found in the exhaust flow of heavy duty diesel engines, into water vapor and nitrogen, a natural constituent of the air.
SEEBALANCESEEBALANCE refers to the Socio-Eco-Efficiency Analysis devel-oped by BASF. This analysis considers the three dimensions of sus-tainability: economy, environment and society. This tool now allows the assessment of environmental impact and costs as well as the societal impacts of products and processes.
Seed treatment productsThese are crop protection products applied with specific technol-ogies directly on the seed and thus protect crops in the emerging stages against diseases and harmful insects.
Social BusinessThe social business BASF Grameen Ltd. serves a social purpose. It should cover its own costs and recoup the partners’ initial invest-ment. Any additional profits are reinvested fully in the social busi-ness.
Special itemsOne-time charges or one-time income that significantly affect the earnings of a segment or the BASF Group. Special items include, for example, charges arising from restructuring measures or earn-ings from divestitures.
Spot marketA market where an agreed deal including delivery, acceptance and payment occurs immediately. In contrast to forward contracts where the delivery, acceptance and payment occurs at a point in time after the conclusion of the deal.
StakeholderThe term refers to persons or groups whose interests are interlinked with those of a company in a variety of ways. BASF’s stakeholders include shareholders, business partners, employees, neighbors and society.
Steam crackerA plant in which steam is used to “crack” naphtha (petroleum) or natural gas. The resulting petrochemicals are the starting materials used to manufacture most of BASF’s products.
Styrenics The production of the precursor styrene is primarily for captive use (backward integration). Styrenics are used in many areas, for exam-ple, in the construction, packaging, automotive, electrical and leisure industries.
Sustainability The objective of sustainable development is to meet the economic, environmental and social needs of society without harming the development opportunities of future generations.
SwapAn agreement between two parties to exchange goods or payment flows in the future. In an interest swap, a fixed (variable) interest rate is exchanged for a floating (fixed) rate for an agreed nominal amount.
206 Overviews BASF Report 2010
Glossary
TTDIToluene diisocyanate is a starting material for the production of poly-urethane.
Tight GasGas trapped in extremely low-permeable (tight) formations.
Time-lag effectDelayed adjustment of natural gas prices to the movement in oil prices.
TraitsTraits are the genetically determined properties of plants, such as drought and disease resistance or higher yields.
Transport Accident Information and Emergency Response System (TUIS)TUIS is a transport accident information and emergency response system jointly operated by around 130 chemical companies. The member companies can be reached by the public authorities at any time and provide assistance over the telephone, expert on-site advice or special technical equipment.
VValue-adding chainSuccessive steps in a production process, from the raw materials through various intermediate steps to the finished product.
VerbundIn the BASF Verbund, production facilities, energy flow, logistics and infrastructure are intelligently networked with each other, in order to increase production yields, save resources and energy and reduce logistic costs. A significant factor in the Verbund concept is the Know-how Verbund. In the latter, know-how is shared among BASF employees worldwide and expert knowledge is pooled in research platforms.
Volatile organic compounds (VOC)VOCs are substances of organic origin that exist as gases in the air at low temperatures. They include certain hydrocarbons, alcohols, aldehydes and organic acids. The use of volatile organic compounds is regulated by the VOC Solvents Emissions Directive of the Euro-pean Union.
WWhite biotechnologyAn area of biotechnology, also called industrial biotechnology, that uses microorganisms and/or enzymes to produce chemical prod-ucts, utilized in many levels of the value-adding chain in the chem-ical industry. This involves, for example, the biotechnological production of chiral intermediates.
207BASF Report 2010 Overviews
Index
Index
AAcquisitions 17, 25, 40, 57 f., 131, 153 ff.Added value 15, 144Agricultural Solutions 22, 37, 44 f., 70 ff., 115, 157, coverAmflora 28, 72, 102Auditor’s report 136Audits 19, 26, 89, 91, 97Automotive Coatings 69
BBack-up line 14, 41BASF Plant Science 70, 72 f.Biotechnology 17, 28, 31, 72, 102, 131Board of Executive Directors 7 ff., 10 f., 117 ff., 122, 125 ff.
C Care Chemicals 22, 58, 62, 153, coverCash flow 38, 41 ff., 140 ffCatalysts 22, 37, 65, 67 f., 81, coverChemicals 22, 36, 44 f., 46 ff., 81 f., 157, coverCiba integration 15, 36 f., 42, 57, 61 ff., 154, 161Climate protection 3, 17, 19, 25 ff., 91 ff., 109, coverCoatings 22, 65, 69, coverCognis 3, 17, 22, 36, 40 ff., 57 ff., 61 ff., 84, 115 f., 150, 153 f.Compliance 19, 26, 110, 120Consolidated balance sheets 39 ff, 105, 133, 139 ff.Construction Chemicals 22, 37, 65, 68, coverCooperations 17, 30 f., 72Corporate Governance 117 ff. Cost of capital 7, 18, 24, 37, 41, 115 f., 166 f.Crop Protection 22, 70, 73 f., coverCustomers 17 ff., 22, 27 f., 33, 36, 47 f., 53 f., 59, 65 f., 70 ff., 91 f., 101 ff., 107 ff.
DDeclaration of conformity 136Demographic change 85, 108Derivative financial instruments 42, 145 ff., 187 ff.Dispersions 57 f., 62 f., 83Dispersions & Pigments 22, 58, 61, 153, coverDiversity 18, 85, 109, 118 f.Divestitures 36 f., 42, 57, 116, 131, 140, 155Dividend 12 ff., 29, 43, 116, 133Donations and sponsoring 29, 90, cover
EEco-Efficiency Analysis 27, 96, 99Education 86Employee representatives 26, 87 f., 131Employees 3, 13, 18 f., 21 f., 24 ff., 72, 84 ff., 89, 90 ff., 95, 109 ff., 210, cover Energy efficiency 20, 30, 52, 65 f., 97 f.Environmental protection 3, 17, 19, 25 ff., 91 ff., 109, cover
FField development 147Functional Solutions 22, 37, 44 f., 65 ff., 81 f., 157, coverFurther training 86
G Global Compact 2, 19, 120, 213 f.Global Reporting Initiative 2 f., 213 f.Goodwill 40, 111Growth clusters 17, 30 f., 98, 131
HHealth protection 25, 89, 91
IIncome, statement of 137Industrial coatings 69, 81Innovation 8 f., 17, 30 ff., 59, 66, 70, 73, 83, 85, 102, 115, 118Inorganics 22, 46, 49 f., coverIntermediates 22, 46, 51, coverInvestments 8, 17, 32, 41 ff., 48, 54, 60, 66, 72, 83 110, 116, 144, 146, 210Investor Relations 12 ff., 15, cover
LLabor and social standards 19, 25 ff., 88, 109
MMonitoring 19, 26, 88, 105 f., 109, 120
NNanotechnology 17, 28, 31, 66, 102
OOil & Gas 22, 37, 44 f., 75 ff., 115, 147, 157 f., 195 ff., cover
PPaper Chemicals 22, 58, 63 f., coverPatents 31, 110, 168 f.Performance Chemicals 22, 58, 64, 153 ff., coverPerformance Polymers 22, 36, 52, 55 f., 82, coverPerformance Products 22, 36, 44 f., 57 ff., 81 f., 107, 115, 153, 157, coverPersonnel costs 84, 127 ff, 165 f., 186, 193, coverPetrochemicals 22, 36, 46, 50, coverPlastics 22, 36, 44 f., 52 ff., 115 f., 157, coverPolyurethanes 22, 36, 52 f., 56, cover
RRating 12 ff., 41 ff., 111, 167 REACH 101 f.Regions 32, 43, 50 f., 56, 62 ff., 68 f., 74 ff., 81 ff., 99 f., 112 ff.Renewable raw materials 97Research and development 17, 30 ff., 46 f., 53, 59, 66, 71 ff., 83, 95, 108Resources 27, 30, 66, 95 f., 97 f.Responsible Care 19, 91 ff., cover
208 Overviews BASF Report 2010
Index
SSafety 3, 91 ff., 101, 109Sales 16, 22, 30, 33, 35 ff., 44 f., 48 ff., 55 ff., 60 ff., 66 ff., 73 ff., 78 ff., 81 ff., 115 ff., coverSEEBALANCE 27Segment data 49, 55, 61, 67, 73, 78Shareholders 12 ff., 27, 84 ff., 119 ff., 131 ff.Shares 12 ff., 20, 24, 35, 38, 116, 119 ff., 157, coverSignificant events subsequent to the balance sheet date 116Social benefits 29, 84Special items 37 f., 68 f., coverStakeholder 25, 27 f., 91, 102Statement by the Board of Executive Directors 135Steam cracker 46, 48Stockholders’ equity 24, 40, 141Strategy 17 ff., 24 f., 46, 52, 57, 65, 70, 72, 75, 81, 90 f., 95, 97, 99Supervisory Board 117 ff., 123 ff., 129 ff., 131 ff.Suppliers 26, 92, 101 f., 107, 120Sustainability 2 f., 8, 14 f., 18, 25 ff., 66, 85, 88, 95, 109, 129, cover
TTime-lag effect 79 f.
VValue-based management 24 f.Values 17 ff., 119 f.Verbund 22 f., 30 f., 46 f., 86, 97 f., 108, 110
WWater 20, 25 ff., 99 f.Wintershall 20, 23, 75 ff., 95 f., 151, 165Work-life balance 86
209BASF Report 2010 Overviews
Registered Trademarks
AgCelence: reg. trademark of BASFAMFLORA: reg. trademark of BASF BASOTECT: reg. trademark of BASFCELLASTO: reg. trademark of BASFCetiol: reg. trademark of BASFCOVERTACE: reg. trademark of BASFCypoSol: reg. trademark of BASFECOFLEX: reg. trademark of BASFECOVIO: reg. trademark of BASFELASTOCOAST: reg. trademark of BASFELASTOCOOL: reg. trademark of BASFELASTOPIR: reg. trademark of BASFELASTOPOR: reg. trademark of BASFE-por: reg. trademark of BASFF 500: reg. trademark of BASFFILTERPAVE: reg. trademark of Reynolds Consumer Products, Inc.GLASURIT: reg. trademark of BASFGREEN SENSE: reg. trademark of BASFINITIUM: reg. trademark of BASFINTERCEPTOR: reg. trademark of BASFKeroDye: reg. trademark of BASFKerotect: reg. trademark of BASFKIXOR: reg. trademark of BASFLUMOGEN: reg. trademark of BASFMASTERBUILDERS: reg. trademark of BASFNEOPOR: reg. trademark of BASFNORBIN: reg. trademark of BASF
Patent Asset Index: reg. trademark of PatentSight GmbHPCI: reg. trademark of BASFPOLYTHF: reg. trademark of BASFRESPONSIBLE CARE: reg. trademark of the Conseil Européen de l’Industrie ChimiqueR-M: reg. trademark of BASFSEEBALANCE: reg. trademark of BASFSELURIS: reg. trademark of BASFSOLUPLUS: reg. trademark of BASFSTANDAK: reg. trademark of BASFSTYROPOR: reg. trademark of BASFSUVINIL: reg. trademark of BASFSudan: reg. trademark of BASFTERMIDOR: reg. trademark of BASFUCRETE: reg. trademark of BASFULTRADUR: reg. trademark of BASFULTRAFORM: reg. trademark of BASFULTRAMID: reg. trademark of BASFULTRAMID Endure: reg. trademark of BASFULTRAMID Structure: reg. trademark of BASFULTRASIM: reg. trademark of BASFULTRASON: reg. trademark of BASFXEMIUM: reg. trademark of BASFX-SEED: reg. trademark of BASF
1 Trademarks are not necessarily registered in all countries.
Registered Trademarks1
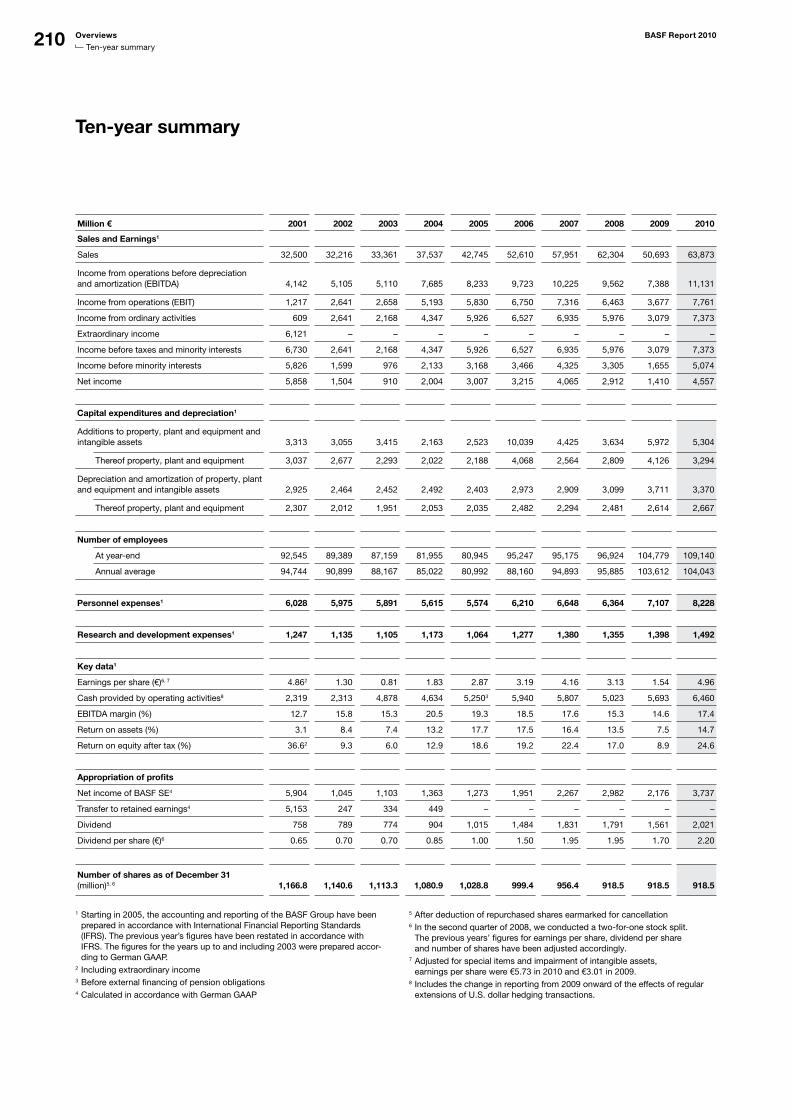
210 Overviews BASF Report 2010
Tenyear summary
Ten-year summary
Million € 2001 2002 2003 2004 2005 2006 2007 2008 2009 2010
Sales and Earnings1
Sales 32,500 32,216 33,361 37,537 42,745 52,610 57,951 62,304 50,693 63,873
Income from operations before depreciation and amortization (EBITDA)
4,142
5,105
5,110
7,685
8,233
9,723
10,225 9,562
7,388
11,131
Income from operations (EBIT) 1,217 2,641 2,658 5,193 5,830 6,750 7,316 6,463 3,677 7,761
Income from ordinary activities 609 2,641 2,168 4,347 5,926 6,527 6,935 5,976 3,079 7,373
Extraordinary income 6,121 – – – – – – – – –
Income before taxes and minority interests 6,730 2,641 2,168 4,347 5,926 6,527 6,935 5,976 3,079 7,373
Income before minority interests 5,826 1,599 976 2,133 3,168 3,466 4,325 3,305 1,655 5,074
Net income 5,858 1,504 910 2,004 3,007 3,215 4,065 2,912 1,410 4,557
Capital expenditures and depreciation1
Additions to property, plant and equipment and intangible assets
3,313
3,055
3,415
2,163
2,523
10,039
4,425 3,634
5,972
5,304
Thereof property, plant and equipment 3,037 2,677 2,293 2,022 2,188 4,068 2,564 2,809 4,126 3,294
Depreciation and amortization of property, plant and equipment and intangible assets
2,925
2,464
2,452
2,492
2,403
2,973
2,909 3,099
3,711
3,370
Thereof property, plant and equipment 2,307 2,012 1,951 2,053 2,035 2,482 2,294 2,481 2,614 2,667
Number of employees
At yearend 92,545 89,389 87,159 81,955 80,945 95,247 95,175 96,924 104,779 109,140
Annual average 94,744 90,899 88,167 85,022 80,992 88,160 94,893 95,885 103,612 104,043
Personnel expenses1 6,028 5,975 5,891 5,615 5,574 6,210 6,648 6,364 7,107 8,228
Research and development expenses1 1,247 1,135 1,105 1,173 1,064 1,277 1,380 1,355 1,398 1,492
Key data1
Earnings per share (€)6, 7 4.862 1.30 0.81 1.83 2.87 3.19 4.16 3.13 1.54 4.96
Cash provided by operating activities8 2,319 2,313 4,878 4,634 5,2503 5,940 5,807 5,023 5,693 6,460
EBITDA margin (%) 12.7 15.8 15.3 20.5 19.3 18.5 17.6 15.3 14.6 17.4
Return on assets (%) 3.1 8.4 7.4 13.2 17.7 17.5 16.4 13.5 7.5 14.7
Return on equity after tax (%) 36.62 9.3 6.0 12.9 18.6 19.2 22.4 17.0 8.9 24.6
Appropriation of profits
Net income of BASF SE4 5,904 1,045 1,103 1,363 1,273 1,951 2,267 2,982 2,176 3,737
Transfer to retained earnings4 5,153 247 334 449 – – – – – –
Dividend 758 789 774 904 1,015 1,484 1,831 1,791 1,561 2,021
Dividend per share (€)6 0.65 0.70 0.70 0.85 1.00 1.50 1.95 1.95 1.70 2.20
Number of shares as of December 31 (million)5, 6
1,166.8
1,140.6
1,113.3
1,080.9
1,028.8
999.4
956.4
918.5
918.5
918.5
1 Starting in 2005, the accounting and reporting of the BASF Group have been prepared in accordance with International Financial Reporting Standards (IFRS). The previous year’s figures have been restated in accordance with IFRS. The figures for the years up to and including 2003 were prepared according to German GAAP.
2 Including extraordinary income3 Before external financing of pension obligations4 Calculated in accordance with German GAAP
5 After deduction of repurchased shares earmarked for cancellation6 In the second quarter of 2008, we conducted a twoforone stock split.
The previous years’ figures for earnings per share, dividend per share and number of shares have been adjusted accordingly.
7 Adjusted for special items and impairment of intangible assets, earnings per share were €5.73 in 2010 and €3.01 in 2009.
8 Includes the change in reporting from 2009 onward of the effects of regular extensions of U.S. dollar hedging transactions.
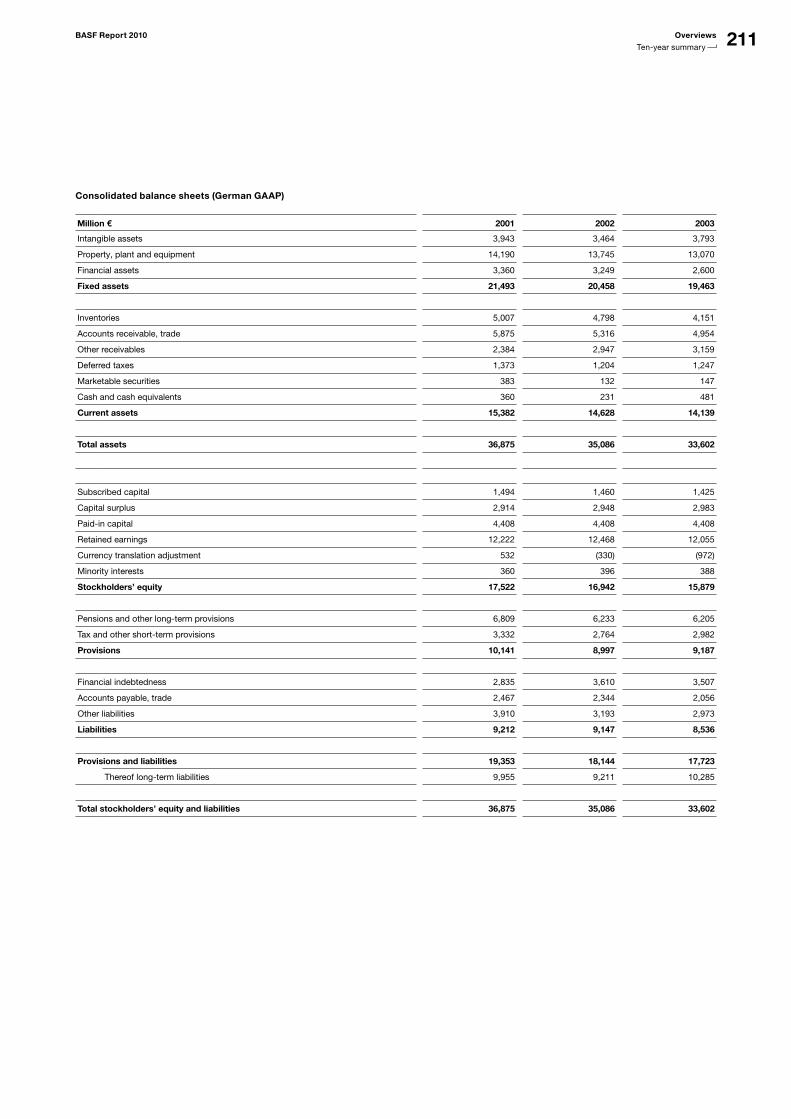
211BASF Report 2010 Overviews
Tenyear summary
Consolidated balance sheets (German GAAP)
Million € 2001 2002 2003
Intangible assets 3,943 3,464 3,793
Property, plant and equipment 14,190 13,745 13,070
Financial assets 3,360 3,249 2,600
Fixed assets 21,493 20,458 19,463
Inventories 5,007 4,798 4,151
Accounts receivable, trade 5,875 5,316 4,954
Other receivables 2,384 2,947 3,159
Deferred taxes 1,373 1,204 1,247
Marketable securities 383 132 147
Cash and cash equivalents 360 231 481
Current assets 15,382 14,628 14,139
Total assets 36,875 35,086 33,602
Subscribed capital 1,494 1,460 1,425
Capital surplus 2,914 2,948 2,983
Paidin capital 4,408 4,408 4,408
Retained earnings 12,222 12,468 12,055
Currency translation adjustment 532 (330) (972)
Minority interests 360 396 388
Stockholders’ equity 17,522 16,942 15,879
Pensions and other longterm provisions 6,809 6,233 6,205
Tax and other shortterm provisions 3,332 2,764 2,982
Provisions 10,141 8,997 9,187
Financial indebtedness 2,835 3,610 3,507
Accounts payable, trade 2,467 2,344 2,056
Other liabilities 3,910 3,193 2,973
Liabilities 9,212 9,147 8,536
Provisions and liabilities 19,353 18,144 17,723
Thereof longterm liabilities 9,955 9,211 10,285
Total stockholders’ equity and liabilities 36,875 35,086 33,602
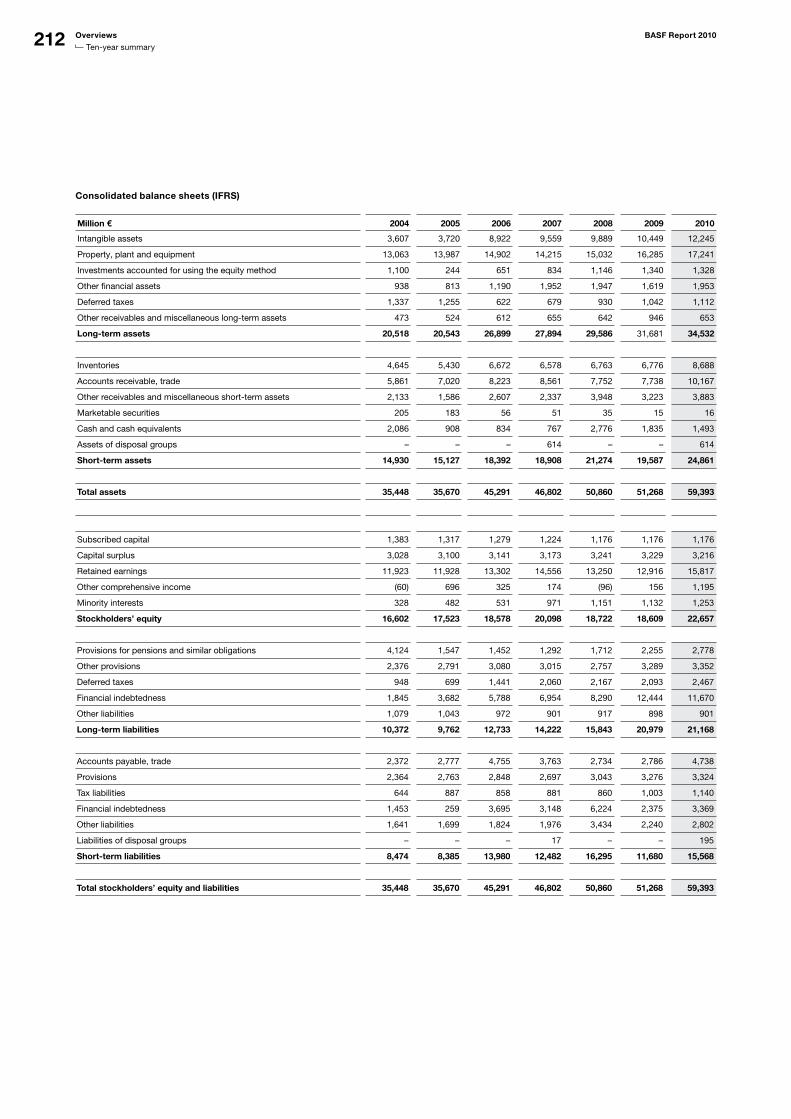
212 Overviews BASF Report 2010
Tenyear summary
Consolidated balance sheets (IFRS)
Million € 2004 2005 2006 2007 2008 2009 2010
Intangible assets 3,607 3,720 8,922 9,559 9,889 10,449 12,245
Property, plant and equipment 13,063 13,987 14,902 14,215 15,032 16,285 17,241
Investments accounted for using the equity method 1,100 244 651 834 1,146 1,340 1,328
Other financial assets 938 813 1,190 1,952 1,947 1,619 1,953
Deferred taxes 1,337 1,255 622 679 930 1,042 1,112
Other receivables and miscellaneous longterm assets 473 524 612 655 642 946 653
Long-term assets 20,518 20,543 26,899 27,894 29,586 31,681 34,532
Inventories 4,645 5,430 6,672 6,578 6,763 6,776 8,688
Accounts receivable, trade 5,861 7,020 8,223 8,561 7,752 7,738 10,167
Other receivables and miscellaneous shortterm assets 2,133 1,586 2,607 2,337 3,948 3,223 3,883
Marketable securities 205 183 56 51 35 15 16
Cash and cash equivalents 2,086 908 834 767 2,776 1,835 1,493
Assets of disposal groups – – – 614 – – 614
Short-term assets 14,930 15,127 18,392 18,908 21,274 19,587 24,861
Total assets 35,448 35,670 45,291 46,802 50,860 51,268 59,393
Subscribed capital 1,383 1,317 1,279 1,224 1,176 1,176 1,176
Capital surplus 3,028 3,100 3,141 3,173 3,241 3,229 3,216
Retained earnings 11,923 11,928 13,302 14,556 13,250 12,916 15,817
Other comprehensive income (60) 696 325 174 (96) 156 1,195
Minority interests 328 482 531 971 1,151 1,132 1,253
Stockholders’ equity 16,602 17,523 18,578 20,098 18,722 18,609 22,657
Provisions for pensions and similar obligations 4,124 1,547 1,452 1,292 1,712 2,255 2,778
Other provisions 2,376 2,791 3,080 3,015 2,757 3,289 3,352
Deferred taxes 948 699 1,441 2,060 2,167 2,093 2,467
Financial indebtedness 1,845 3,682 5,788 6,954 8,290 12,444 11,670
Other liabilities 1,079 1,043 972 901 917 898 901
Long-term liabilities 10,372 9,762 12,733 14,222 15,843 20,979 21,168
Accounts payable, trade 2,372 2,777 4,755 3,763 2,734 2,786 4,738
Provisions 2,364 2,763 2,848 2,697 3,043 3,276 3,324
Tax liabilities 644 887 858 881 860 1,003 1,140
Financial indebtedness 1,453 259 3,695 3,148 6,224 2,375 3,369
Other liabilities 1,641 1,699 1,824 1,976 3,434 2,240 2,802
Liabilities of disposal groups – – – 17 – – 195
Short-term liabilities 8,474 8,385 13,980 12,482 16,295 11,680 15,568
Total stockholders’ equity and liabilities 35,448 35,670 45,291 46,802 50,860 51,268 59,393
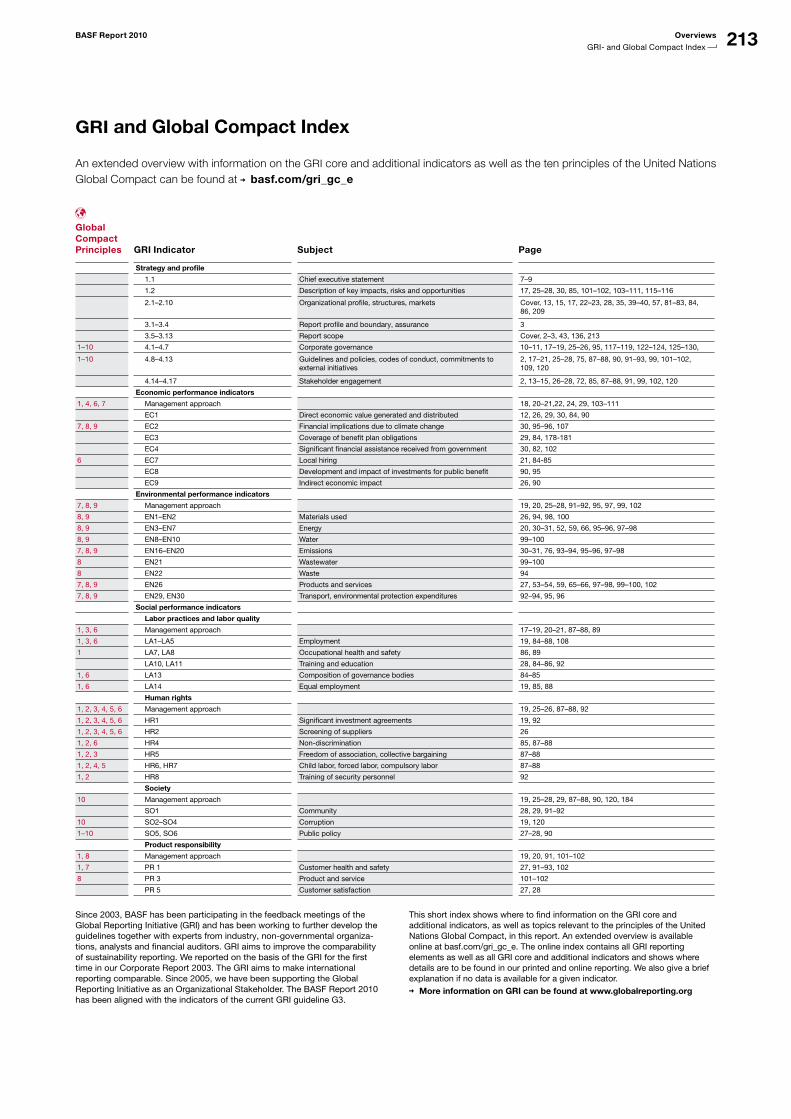
213BASF Report 2010 Overviews
GRI and Global Compact Index
GRI and Global Compact Index
An extended overview with information on the GRI core and additional indicators as well as the ten principles of the United Nations Global Compact can be found at basf.com/gri_gc_e
Global Compact Principles
GRI Indicator
Subject
Page
Strategy and profile
1.1 Chief executive statement 7–9
1.2 Description of key impacts, risks and opportunities 17, 25–28, 30, 85, 101–102, 103–111, 115–116
2.1–2.10 Organizational profile, structures, markets Cover, 13, 15, 17, 22–23, 28, 35, 39–40, 57, 81–83, 84, 86, 209
3.1–3.4 Report profile and boundary, assurance 3
3.5–3.13 Report scope Cover, 2–3, 43, 136, 213
1–10 4.1–4.7 Corporate governance 10–11, 17–19, 25–26, 95, 117–119, 122–124, 125–130,
1–10 4.8–4.13 Guidelines and policies, codes of conduct, commitments to external initiatives
2, 17–21, 25–28, 75, 87–88, 90, 91–93, 99, 101–102, 109, 120
4.14–4.17 Stakeholder engagement 2, 13–15, 26–28, 72, 85, 87–88, 91, 99, 102, 120
Economic performance indicators
1, 4, 6, 7 Management approach 18, 20–21,22, 24, 29, 103–111
EC1 Direct economic value generated and distributed 12, 26, 29, 30, 84, 90
7, 8, 9 EC2 Financial implications due to climate change 30, 95–96, 107
EC3 Coverage of benefit plan obligations 29, 84, 178181
EC4 Significant financial assistance received from government 30, 82, 102
6 EC7 Local hiring 21, 8485
EC8 Development and impact of investments for public benefit 90, 95
EC9 Indirect economic impact 26, 90
Environmental performance indicators
7, 8, 9 Management approach 19, 20, 25–28, 91–92, 95, 97, 99, 102
8, 9 EN1–EN2 Materials used 26, 94, 98, 100
8, 9 EN3–EN7 Energy 20, 30–31, 52, 59, 66, 95–96, 97–98
8, 9 EN8–EN10 Water 99–100
7, 8, 9 EN16–EN20 Emissions 30–31, 76, 93–94, 95–96, 97–98
8 EN21 Wastewater 99–100
8 EN22 Waste 94
7, 8, 9 EN26 Products and services 27, 53–54, 59, 65–66, 97–98, 99–100, 102
7, 8, 9 EN29, EN30 Transport, environmental protection expenditures 92–94, 95, 96
Social performance indicators
Labor practices and labor quality
1, 3, 6 Management approach 17–19, 20–21, 87–88, 89
1, 3, 6 LA1–LA5 Employment 19, 84–88, 108
1 LA7, LA8 Occupational health and safety 86, 89
LA10, LA11 Training and education 28, 84–86, 92
1, 6 LA13 Composition of governance bodies 84–85
1, 6 LA14 Equal employment 19, 85, 88
Human rights
1, 2, 3, 4, 5, 6 Management approach 19, 25–26, 87–88, 92
1, 2, 3, 4, 5, 6 HR1 Significant investment agreements 19, 92
1, 2, 3, 4, 5, 6 HR2 Screening of suppliers 26
1, 2, 6 HR4 Nondiscrimination 85, 87–88
1, 2, 3 HR5 Freedom of association, collective bargaining 87–88
1, 2, 4, 5 HR6, HR7 Child labor, forced labor, compulsory labor 87–88
1, 2 HR8 Training of security personnel 92
Society
10 Management approach 19, 25–28, 29, 87–88, 90, 120, 184
SO1 Community 28, 29, 91–92
10 SO2–SO4 Corruption 19, 120
1–10 SO5, SO6 Public policy 27–28, 90
Product responsibility
1, 8 Management approach 19, 20, 91, 101–102
1, 7 PR 1 Customer health and safety 27, 91–93, 102
8 PR 3 Product and service 101–102
PR 5 Customer satisfaction 27, 28
Since 2003, BASF has been participating in the feedback meetings of the Global Reporting Initiative (GRI) and has been working to further develop the guidelines together with experts from industry, nongovernmental organizations, analysts and financial auditors. GRI aims to improve the comparability of sustainability reporting. We reported on the basis of the GRI for the first time in our Corporate Report 2003. The GRI aims to make international reporting comparable. Since 2005, we have been supporting the Global Reporting Initiative as an Organizational Stakeholder. The BASF Report 2010 has been aligned with the indicators of the current GRI guideline G3.
This short index shows where to find information on the GRI core and additional indicators, as well as topics relevant to the principles of the United Nations Global Compact, in this report. An extended overview is available online at basf.com/gri_gc_e. The online index contains all GRI reporting elements as well as all GRI core and additional indicators and shows where details are to be found in our printed and online reporting. We also give a brief explanation if no data is available for a given indicator.
More information on GRI can be found at www.globalreporting.org
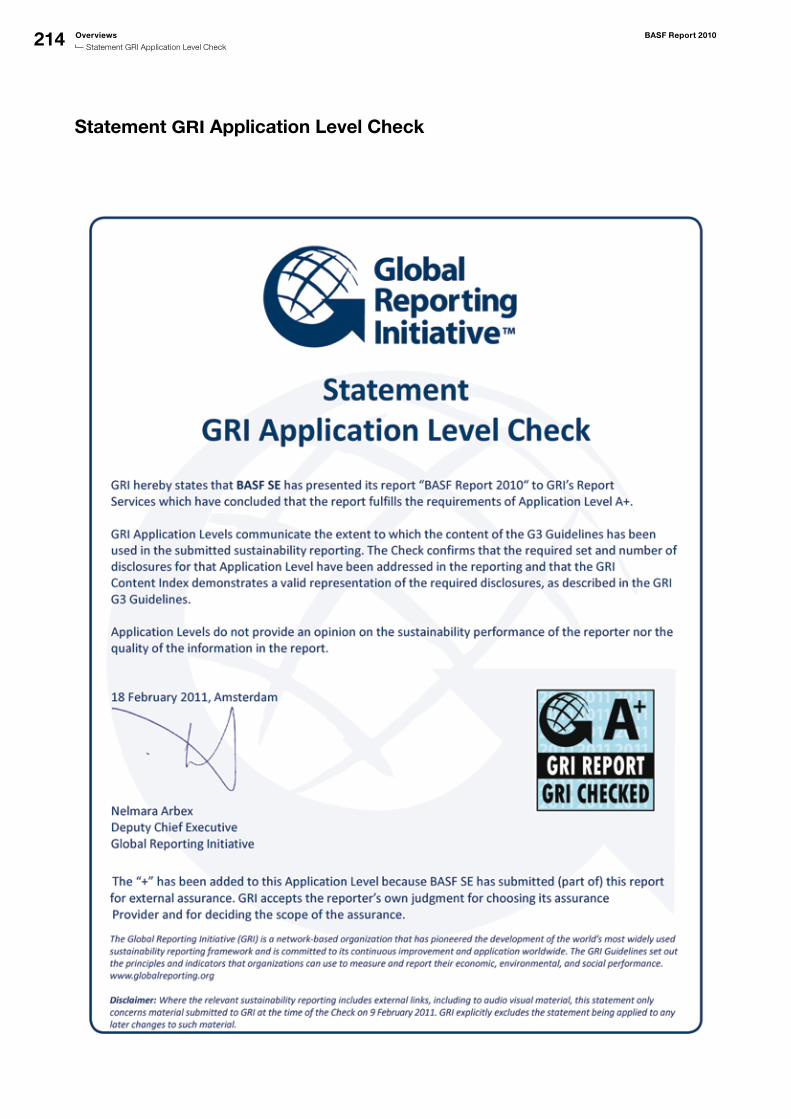
214 Overviews BASF Report 2010
Statement GRI Application Level Check
Statement GRI Application Level Check