Baseline Water Quality Survey for Rajshahi, …publications.iwmi.org/pdf/H041018.pdfBaseline Water...
44
Baseline Water Quality Survey for Rajshahi, Bangladesh Priyanka Dissanayake Md. Maksudul Amin Priyanie Amerasinghe Alexandra Clemett 2007 WASPA Asia: Project Report 7
Transcript of Baseline Water Quality Survey for Rajshahi, …publications.iwmi.org/pdf/H041018.pdfBaseline Water...
Baseline Water Quality Survey for Rajshahi, Bangladesh
Priyanka Dissanayake Md. Maksudul Amin
Priyanie Amerasinghe Alexandra Clemett
2007
WASPA Asia: Project Report 7
This report in one in a series of project reports written by the Wastewater Agriculture and
Sanitation for Poverty Alleviation in Asia (WASPA Asia) project. The WASPA Asia project
aims to develop and test solutions for sanitation and wastewater management, to reduce the
risks form wastewater use in agriculture. The approach involves the development of
stakeholder coalitions at town and national level, called Learning Alliances, which will bring
together the main stakeholders into a participatory process through which actions will be
planned and implemented in a sustainable manner.
These project reports are essentially internal documents intended to inform the future
activities of the project, particularly in relation to the development of Learning Alliances and
participatory action plans. The reports have been made publicly available as some of the
information and findings presented in them may be of use to other researchers, practitioners
or government officials.
The WASPA Asia project is funded primarily under the EU Asia Pro Eco II Programme of the
European Commission. It is being undertaken by the International Water Management
Institute (IWMI), Sri Lanka; COSI, Sri Lanka; the International Water and Sanitation Centre
(IRC), the Netherlands; NGO Forum for Drinking Water Supply and Sanitation, Bangladesh;
and the Stockholm Environment Institute (SEI), Sweden. The project pilot cities are Rajshahi
City in Bangladesh and Kurunegala City in Sri Lanka.

i
Contents
1. Introduction....................................... ....................................................................1
2. Methodology ........................................ .................................................................2
Sampling Strategy and Site Selection ............................................................................... 2
Establishing Sampling Locations and the Limitations ....................................................... 4
Sampling Methodology...................................................................................................... 4
3. Surface Water Quality Results and Discussion....... .........................................6
Flow Measurements .......................................................................................................... 6
Temperature ...................................................................................................................... 7
Hydrogen-ion concentration: pH........................................................................................ 7
Electrical Conductivity and Total Dissolved Solids............................................................ 8
Sodium Adsorption Ratio................................................................................................... 9
Nutrients .......................................................................................................................... 10
Metallic Constituents ....................................................................................................... 14
Organic Constituents ....................................................................................................... 15
Biological Characteristics ................................................................................................ 17
Pollutant Loads of Selected Parameters ......................................................................... 19
4. Ground Water Quality Results and Discussion........ ......................................21
Nitrogen ........................................................................................................................... 21
Metals .............................................................................................................................. 22
Microbiological Quality..................................................................................................... 23
5. Conclusions and Recommendations.................... ...........................................24
Surface Water.................................................................................................................. 24
Ground Water .................................................................................................................. 24
6. Limitations ........................................ ..................................................................26
Sampling Locations ......................................................................................................... 26
Oil and Grease ................................................................................................................ 26
Microbial Analysis............................................................................................................ 26

ii
Annexes
Annex I: GPS Readings of Sample Locations............................................................................ I Annex II: Photographs of Sampling Locations ........................................................................... I Annex III: Sample Type, Preservation, Holding Times and Sampling Containers ................... III Annex IV: Analysis Methodology at BUET or NGOF Laboratory ............................................. IV Annex V: Baseline Water Quality Results 25th February 2007.................................................. V Annex VI: Guidelines for Interpretation of Water Quality for Irrigation ..................................... VI Annex VII: Irrigation Water Quality Standards: WHO and FAO................................................ VII Annex VIII: Government of Bangladesh Standards for Inland Surface Water ....................... VIII Annex IX: Waste Discharge Quality Standards for Industrial Units in Bangladesh................ VIII Annex X: Fertilizer Equivalent of Human Excreta .................................................................... IX Annex XI: An Approximate Quantity and Quality Breakdown of Human Excreta .................... IX Annex XII: Drinking Water Quality Standards ........................................................................... X Annex XIII: Excreted organism concentration in wastewater ................................................... XI
List of Figures
Figure 2-1: Sample locations..................................................................................................... 3 Figure 3-1: Total dissolved solids and electrical conductivity at each sample point ................. 8 Figure 3-2: Nitrogen concentrations at each sample point...................................................... 11 Figure 3-3: Phosphorous concentrations at each sample point .............................................. 13 Figure 3-4: Concentrations of iron ....................................................................................... 14 Figure 3-5: Variation in dissolved oxygen across sample sites............................................... 16 Figure 3-6: Variation in dissolved oxygen across sample sites............................................... 16
List of Tables
Table 2-1: Water quality monitoring site codes and descriptions.............................................. 3 Table 3-1: Discharge at sample locations on 25th February, 2006............................................ 7 Table 3-2: Guidelines for interpretation of salinity for irrigation................................................. 8 Table 3-3: Calculation of sodium adsorption ratio ..................................................................... 9 Table 3-4: Guidelines for potential irrigation problems of infiltration rate of water to soil........ 10 Table 3-5: SAR and EC results for locations sampled in Rajshahi ......................................... 10 Table 3-6: Total Coliform and Faecal Coliform concentrations in water samples................... 18 Table 3-7: Results of Parasitological Analysis ....................................................................... 18 Table 3-8: Load chemical loads calculated ............................................................................. 20 Table 4-1: Summary of ground water results and standards .................................................. 21
iii
Acronyms and Abbreviations
BCSIR Bangladesh Centre for Scientific and Industrial Research
BOD Biochemical oxygen demand
BSCIC Bangladesh Small and Cottage Industry Corporation
BUET Bangladesh University of Engineering and Technology
COD Chemical oxygen demand
DO Dissolved oxygen
EC Electrical Conductivity
FAO Food and Agriculture Organization
K Potassium
MOP Muriate of potash
N Nitrogen
P Phosphorous
RCC Rajshahi City Corporation
RDA Rajshahi Development Authority
SAR Sodium Adsorption Ratio
TDS Total dissolved solids
TSP Triple super phosphate
TSS Total suspended solids
VCF Vertical at centroid-of-flow
WASPA Wastewater Agriculture and Sanitation for Poverty Alleviation
WHO World Health Organization
1
1. Introduction
This report has been produced as part of the Wastewater Agriculture and Sanitation for
Poverty Alleviation in Asia (WASPA Asia) project, funded by the European Commission under
its Asia Pro Eco II Program. The objective of the project is to improve the livelihoods of urban
and peri-urban farmers who are using wastewater in agriculture; and the communities who
are responsible for producing the wastewater or consuming the agricultural produce. To do
this a holistic approach and sustainable solutions are required along the whole chain of
wastewater production and use; from improved sanitation to contaminant reduction, waste
treatment, disposal, safe use in agriculture and promotion of hygiene behavior. At the same
time a change of practice is required to integrate wastewater planning into urban water
resource management, simultaneously applying technical solutions for wastewater treatment
and disposal, and a range of preventive measures to mitigate health risks in the short term.
Before any such changes can be proposed or implemented it is necessary to have an
understanding of the current conditions prevailing in the urban and peri-urban area of the two
project research cities, Rajshahi in Bangladesh and Kurunegala in Sri Lanka. These include:
wastewater production including its quantity and source; the quality of wastewater being
utilized for agriculture; the impact of that use on agriculture and potential risks to health; and
the sanitation conditions. To achieve this, a number of related studies have been undertaken
under the WASPA Asia project, the results of which have been presented in a series of
reports. This report presents the findings for the baseline water quality assessment
conducted in Rajshahi in February 2007. It will be followed by further reports on water quality
as a series of samples are taken over the project period. The findings of this study will also
be combined with the findings of the agriculture, sanitation and stakeholder analysis to
produce a more comprehensive report for Rajshahi City.
The main objective of the WASPA Asia project is to work with relevant stakeholders to
develop participatory action plans to address issues relating to wastewater agriculture in
Rajshahi and Kurunegala, and to learn lessons for other similar cities across Asia. This water
quality analysis report will provide important information for the development of those
participatory action plans. It will also provide a baseline against which to monitor the impacts
of project interventions or other changes that may take place in the city during the project
period.
There are three main objectives for the water quality monitoring component of the project.
These are:
• To monitor the quality of water in drainage canals from the city to facilitate
consideration of the possible health and environmental risks posed to the
communities that live around the project area;
• To investigate the suitability of the water for use in agriculture, particularly in relation
to the levels of nutrients or substances (such as heavy metals or salinity) that may
damage crops; and
• To monitor the impacts of project interventions in terms of improved water quality (this
will be assessed at the end of the project and is not covered in this report).
2
2. Methodology
Sampling Strategy and Site Selection
A number of storm water drains (10) flow from the south of Rajshahi through the city to the
north, either terminating in beels or in the Baranai River, some 15 km away. An initial
assessment of the city was conducted at the beginning of the study and two project locations
were identified where wastewater is being used in agriculture (see Clemett et al. 2006).
These sites are situated along two of the city drains: Circuit House Drain, also known as
Basuar Beel Drain because it drains through Bashuar Beel; and Dargapara Drain, also known
as the Cantonment Drain because it flows through the cantonment agricultural area. The
water survey and the observations of potential sources of pollution were undertaken along
these two drains.
The Circuit House Drain starts in Ward 7 from the place identified as Circuit House Road.
This drain flows through Ward 8, along the edge of Ward 6 and through Ward 3. It passes by
the Rajshahi Metropolitan Police, Medicine Corner, Rajshahi Medical College Hospital, Clinic
and Women’s Complex. After that the Circuit House Drain enters Bashuar Beel, in Ward 14
and emerges at the other end of the beel before flowing through agricultural land in Ward 14,
Paba Thana and Ward 17, and onto Baranai River (Figure 2.1).
The Dargapara Drain starts from Natore Road in Ward 9. It flows through Ward 10, Ward 14,
and Ward 16, passing by Rajshahi Medical College, a women’s hostel, Sadar (Main) Hospital,
the Passport Office, the Fisheries Office and the Cantonment Area, as well as some densly
populated residential areas. In Ward 16 a second drain joins the Dargapara Drain, bringing
untreated industrial effluent from the Bangladesh Small and Cottage Industry Corporation
(BSCIC) area and any residences also located there. The water from Dargapara Drain is
used in Ward 14 (before the industrial wastewater enters the system) and Ward 16 where
some areas are likely to be using wastewater containing industrial waste.
In Ward 17, in an area known as Terokhadia, the Circuit House Drain and the Dargapara
Drain meet. The drain flows on and is continuously used for agricultural purposes, finally
meeting the Baranai River approximately 11-12 Kilometers away from the place where both
the drains meet (GIS map of Institute of Water Modeling).
Nine drain water sampling points were identified along these two drains both in more
residential an in agricultural areas, where the wastewater is the only source of irrigation water.
In addition two ground water sample sites were selected near the Basuar Beel (Figure 2.1) to
investigate the effect of seepage from the unlined drains on ground water, as this is the main
source of drinking water in Bangladesh. In Rajshahi, ground water is usually obtained from
deep tube wells, which is the case near Bashuar Beel, therefore, the selected ground water
sites are deep tube wells and the possibility of leaching from the drains is low but it required
investigation never the less. The sites selected are listed in Table 2-1 and depicted in the
map in Figure 2.1.

3
Table 2-1: Water quality monitoring site codes and descriptions
Site
Code
Site Description – Baseline Survey
A Circuit House Drain within the city
B Circuit House Drain further along the system past residential areas
C Circuit House Drain inlet to Basuar Beel
D Bashuar Beel
E1 Circuit House Drain outlet from Basuar Beel and start of the agricultural area
G Dargapara Drain entry point to the city
H Dargapara Drain entry point to cantonment agriculture area
I Dargapara Drain exit point from cantonment agriculture area
J Dargapara Drain after confluence with industrial drain
X Ground water well near Basuar Beel in Basuar Village
Y Ground water well near Basuar Beel in Basuar Village
Figure 2.1: Sample locations
1 A location F was planned beyond the agricultural area but was removed before sampling
because of cost and time limitations and because it was not considered necessary for the
objectives of the project.
2
1 7
3 0
2 6
47
2 7
1
1 4 1 9
3
2 8
1 6
5
2 9
1 8
6
8
9
1 5
1 0
2 5 2 3
1 3
1 2
2 1 2 0
2 2 2 4
1 1
1 0 1 2 K i l om e te r s
N W a r d b o u n d r y M ai n r o a d sL o w - i n come a r ea sI ndu s tr y a r e a A g r i cul t u re a r easW W ca n a l s
Dargapara
Drain
Circuit House Drain
Basuar Beel Agriculture Area
Cantonment Agriculture area
A
B
C
D
E
G
H
I
J
Sopura BSCIC area
4
Establishing Sampling Locations and the Limitations
The sites were selected based on drainage maps provided by the Rajshahi City Corporation
(RCC) and Rajshahi Development Authority (RDA), and on physical observations in the site.
It was intended that points A to C would be a continuous system and show the changes from
within the city and across the low income area marked on the map (Figure 2.1), and on
through the beel to the agricultural area. Unfortunately, due to the extensive drainage system
running under the roads, the points A and B actually sampled did not connect with point C.
This is a significant problem and has since been addressed so that future samples will be
taken on a continuous drain. However, for the purpose of the baseline survey the existing
samples are adequate as they still show:
• Wastewater quality within the city (A, B, G and H);
• Wastewater quality in the agricultural areas (E, I and J); and
• Changes in water quality across the beel (C, D and E).
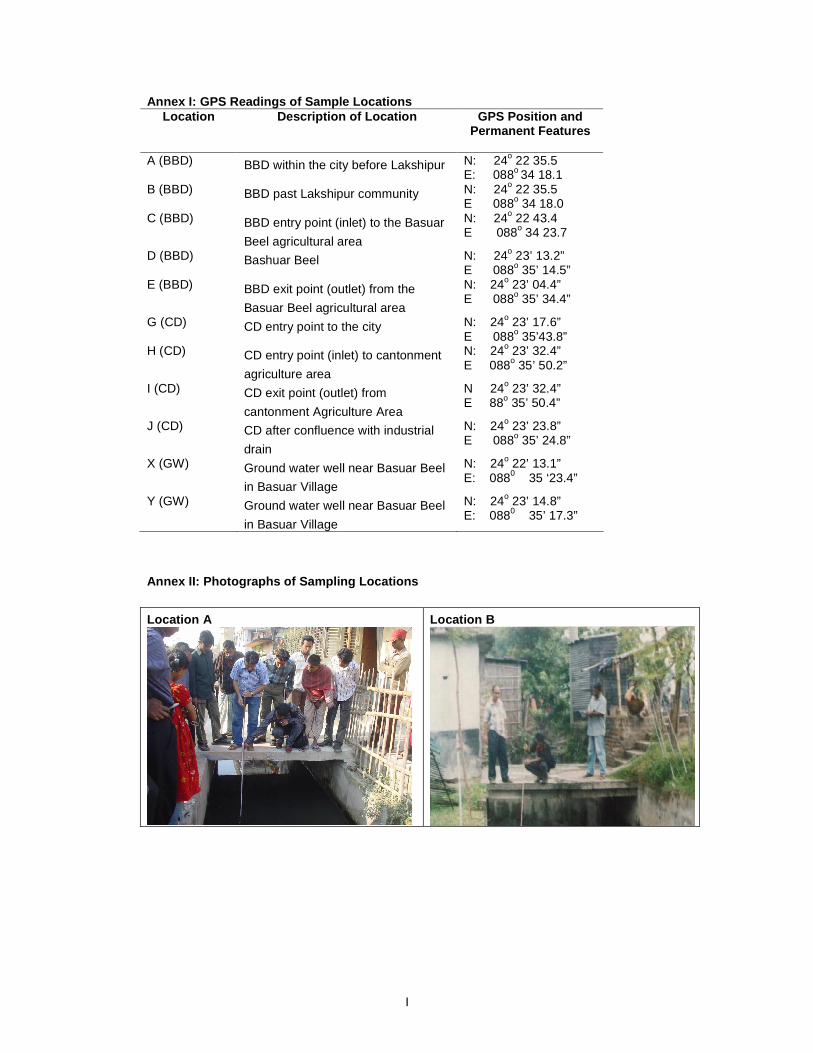
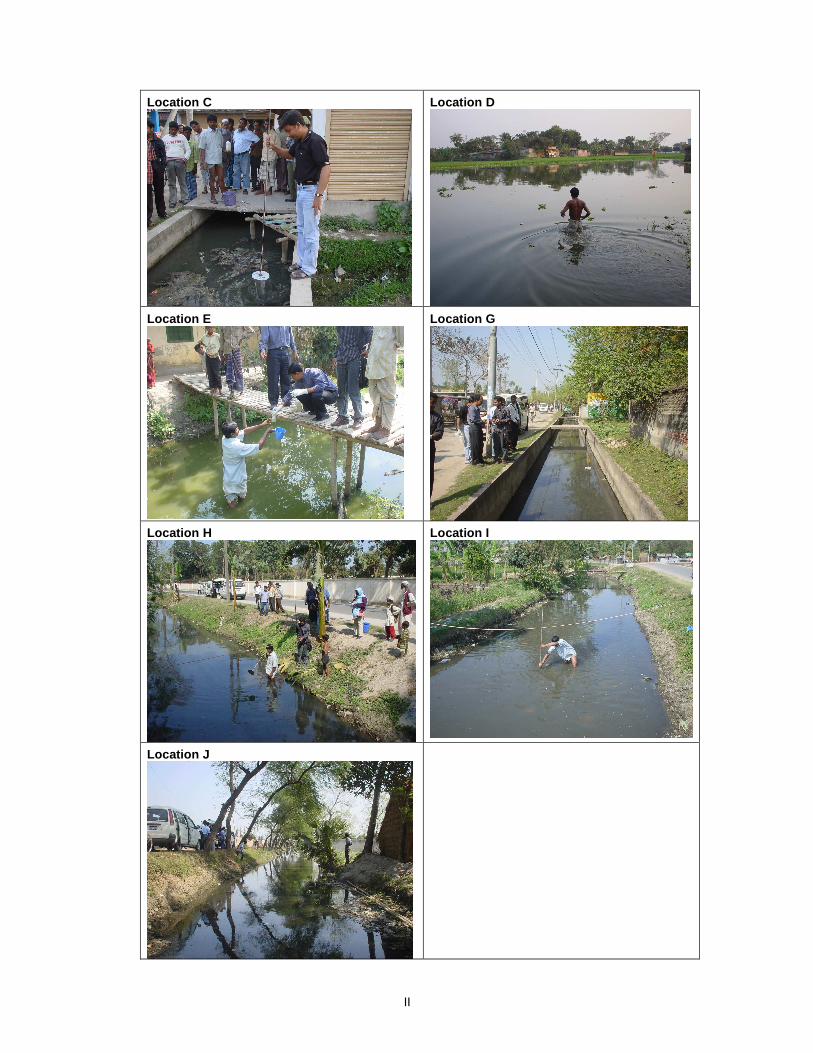
The locations where the baseline samples were taken were established with respect to GPS
(Garmin GPS III® Plus) (Annex I). The other permanent features available in the area were
also noted and photographed. The photographs are given in (Annex II).
The exact sampling sites were selected considering the point sources and the suitability for
measuring discharge: locations next to a confluence or point sources of contamination were
avoided; straight and uniform channels free of eddies, slack water and excessive turbulence
were selected.
Sampling Methodology
The single vertical at centroid-of-flow (VCF) method was used for sampling. Discrete
samples were collected from each location in the VCF for chemical and microbiological
analysis because of well mixed conditions and shallow flows. Composite samples were
collected for parasitological analysis. The parameters for which the water was sampled are
provided in Annex III along with the method of collection, preservation and holding times. The
samples were delivered to Dhaka (which is five hours by road from the sample site) on the
day of sampling. The analyses were conducted by the Bangladesh University of Engineering
Technology (BUET) and the NGO Forum laboratory in Dhaka. The analyses were performed
with strict quality control and quality assurance using the internationally accepted methods of
analysis given in Annex IV.
Measurements of temperature, pH and conductivity were conducted in-situ by the Bangladesh
Centre for Scientific and Industrial Research (BCSIR) staff. The samples collected to test for
dissolved oxygen (DO) were fixed in the field and analysed on the following day at NGO
Forum laboratory. Flow velocity measurements were also made.
Water samples from three sample locations A, B, and E were tested for nematode eggs. To
do this 10 litre samples were collected from each and the analysis was performed at the

5
Department of Parasitology, Institute of Epidemiology, Disease control and Research,
Mohakali, Dhaka. A modified method of Ayers and Mara (1996) was used. The sediment
was allowed to settle overnight and a 50 µl drop was examined after centrifugation. This was
a preliminary assessment to observe parasite positivity. The rest of the sample was
preserved for further analysis.
Drainage channel flow rates were measured using floats and a stop watch no current meter
was available. The discharge was calculated using the cross section of the canals. Efforts
will be made in the future monitoring programs to measure flow with a current meter.
6
3. Surface Water Quality Results and Discussion
This chapter presents a summary of the surface water quality analysis data and implications
for wastewater agriculture. It is divided by type of parameter and each type or individual
parameter is discussed in relation to irrigation requirements and potential health risks, as
appropriate and where possible. The full set of results and field measurements can be found
in Annex V. Standards for irrigation water quality recommendations, Bangladesh standards
for inland surface water, Bangladesh discharge standards and are given in Annex VI; Annex
VII; Annex VIII and Annex IX.
The irrigation water quality recommendations provided by Ayres and Westcot (1985) which
are quoted throughout this discussion, and given in Annex VI, require a short explanation as
they include a number of assumptions. A basic assumption is that “restricted use” does not
mean that the water is unsuitable for use but that there may be limitations on production and
therefore special management may be required. Furthermore the divisions are somewhat
arbitrary as there is not an absolute cut-off between “no restriction”, “slight restriction” and
“severe restriction”, therefore a change of up to 20% above or below a guideline value will
have little significance if considered in proper perspective with other factors affecting yield.
Guideline values also assume certain irrigation practices appropriate for the crop.
Flow Measurements
To understand the water quality results obtained for some of the locations it may be
necessary to refer to the flow rates. Low flows may for example explain high concentrations,
and increased flows at a certain point may suggest the addition of new sources of water
which may increase pollution loads or provide some dilution. The flow data is given here for
reference.
The flow increased from A to B suggesting that new sources of wastewater enter between
these locations. The flow at C was too low to measure. After point C the drain enters
Bashuar Beel. A beel is usually described as a seasonal lake but Bashuar Beel does not dry
up due to the constant supply of drainage water from the city, its extent does however
fluctuate in accordance with rainfall (Table 3-1). The flow at location E was approximately
half that within the city at B but similar to A.
On the other canal the discharge was fairly uniform between point G and H but increased by
an order of magnitude from H to I: what causes this increased flow needs to be investigated.
The discharge increased further at location J when the flow from the BSCIC area is added.

7
Table 3-1: Discharge at sample locations on 25 th February, 2006 Location
Discharge (m 3 s-1) Discharge (m 3 day -1)
A 0.0315 2.72x10³
B 0.0745 6.44 x10³
C Not flowing
D Non-flowing water body
E 0.035 3.024x10³
G 0.050 4.32 x10³
H 0.048 4.147 x10³
I 0.444 3.84 x10⁴
J 0.538 4.65 x10⁴
Temperature
Temperature is an important physical parameter of wastewater, particularly if the wastewater
enters open water bodies, because wastewater is often warmer than local water bodies,
which has a direct effect on aquatic life as well as reducing the dissolved oxygen (DO)
concentration in the water making oxygen less available for respiration. Temperature also
affects chemical reactions and reaction rates within the wastewater, thereby influencing its
suitability for irrigation (Metcalf and Eddy 2003). The temperature of the wastewater sampled
in Rajshahi ranged from 23 to 27oC. This is within the range for biological activity and is
normal for water temperature in the area. It also suggests that there is limited industrial waste
entering the system as this tends to increase the water temperature. The highest recorded
temperature (27oC) was in the beel and there was no peak observed in the industrial channel.
Hydrogen-ion concentration: pH
The hydrogen-ion concentration is an important quality parameter of both natural waters and
wastewater. The usual means of expressing this is as pH, which is defined as the negative
logarithm of the hydrogen-ion concentration. The pH range suitable for the existence of most
biological life is quite narrow and critical, and is typically 6-9 (Metcalf and Eddy 2003). The
normal range for irrigation water is pH 6.5-8.5 (Pescod 1992). High pH above 8.5 is often
caused by high bicarbonate (HCO3-) and carbonate (CO3
2-) concentrations; high carbonates
cause calcium and magnesium ions to form insoluble minerals leaving sodium as the
dominant ion in solution (Bauder et al. 2004). This alkaline water could intensify sodic soil
conditions, which is detrimental to agriculture, but this does not appear to be a problem in the
project area where the samples from all locations were within the range pH 5.5 - 7.01 (mildly
acidic to neutral) (Annex V).
8
Electrical Conductivity and Total Dissolved Solids
Electrical conductivity (EC) is a measure of the ions present in water, as the conductivity
increases with the number of ions: it is also effectively a surrogate for total dissolved solids
(TDS) (Metcalf and Eddy 2003). The EC of irrigation water is important because it is a
measure of the salinity of the water. The conductivity test does not identify the dissolved
salts, or the effects they may have on crop or soil, but it does indicate whether a salinity
problem is likely to occur. Dissolved salts increase the osmotic potential of soil water which
results in plants expending more energy to take up the water, which leads to increased
respiration and a progressive decline in plant yield as the osmotic pressure increases
(Pescod 1992). Usually, crop yield is independent of salt concentration when salinity is below
some threshold level then yield gradually decreases to zero as the salt concentration
increases to the level which cannot be tolerated by a given crop.
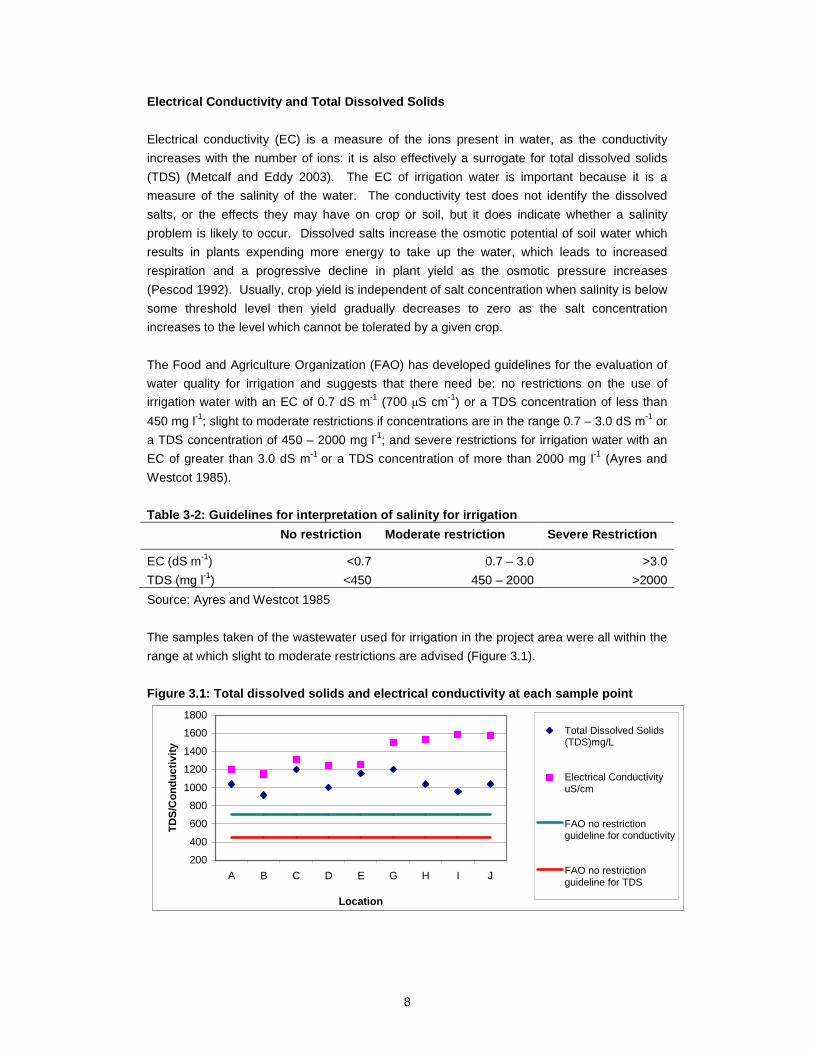
The Food and Agriculture Organization (FAO) has developed guidelines for the evaluation of
water quality for irrigation and suggests that there need be: no restrictions on the use of
irrigation water with an EC of 0.7 dS m-1 (700 µS cm-1) or a TDS concentration of less than
450 mg l-1; slight to moderate restrictions if concentrations are in the range 0.7 – 3.0 dS m-1 or
a TDS concentration of 450 – 2000 mg l-1; and severe restrictions for irrigation water with an
EC of greater than 3.0 dS m-1 or a TDS concentration of more than 2000 mg l-1 (Ayres and
Westcot 1985).
Table 3-2: Guidelines for interpretation of salinit y for irrigation
No restriction Moderate restriction Severe Restri ction
EC (dS m-1) <0.7 0.7 – 3.0 >3.0
TDS (mg l-1) <450 450 – 2000 >2000
Source: Ayres and Westcot 1985
The samples taken of the wastewater used for irrigation in the project area were all within the
range at which slight to moderate restrictions are advised (Figure 3.1).
Figure 3.1: Total dissolved solids and electrical c onductivity at each sample point
200
400
600
800
1000
1200
1400
1600
1800
A B C D E G H I J
Location
TD
S/C
ondu
ctiv
ity
Total Dissolved Solids(TDS)mg/L
Electrical Conductivity uS/cm
FAO no restrictionguideline for conductivity
FAO no restrictionguideline for TDS
9
Wastewater can also be defined as “strong”, “medium” and “weak”; in the case of TDS the
values for these are 850 mg l-1, 500 mg l-1 and 250 mg l-1, implying that the drainage water in
the canals can all be classified as strong wastewater; but they are also within the usual range
for irrigation water, which is an EC of 0-3 dS m-1 and TDS 0-2000 mg l-1 (UN Department of
Technical Cooperation for Development 1985; cited in Pescod 1992).
As the crops grown in Rajshahi vary (see Jayakody and Amin 2007) the threshold level for
each will be different and some crops may be more suitable to grow in the area than others.
Of the main crops grown wheat and papaya are moderately tolerant; rice, sugarcane,
cabbage, cauliflower, spinach and potato are moderately sensitive; and none are in the
sensitive category (Ayres and Westcot 1985).
There are also other considerations in addition to the direct effect of salinity on osmotic
pressure. These are;
• Specific ion toxicity (sodium, boron and chloride);
• Interference with up-take of essential nutrients (potassium and nitrate) due to
antagonism with sodium, chloride and sulfates; and
• It may have long term impacts on the soil structure (WHO 2006).
The last point is discussed further below.
Sodium Adsorption Ratio
Not only is the total salt concentration in irrigation water extremely important for agriculture
but so too is the relative proportion of sodium to other cations, because sodium has a unique
effect on soils. When present in its exchangeable form sodium changes the physico-chemical
properties of the soil and has the ability to disperse soil particles when above a certain
threshold value, relative to the concentration of total dissolved salts. This dispersion results in
reduced air and water infiltration to the soil and the formation of a hard crust when the soil is
dry (Pescod 1992).
The relative concentration of sodium is determined by the sodium adsorption ratio (SAR).
This index quantifies the proportion of sodium ion (Na+) to calcium ions (Ca2+) and
magnesium ions (Mg2+) in a sample using either of the equations presented in Table 3-3.
Table 3-3: Calculation of sodium adsorption ratio
Na
SAR = √ (Ca+Mg)/2
where concentrations are in meq/l
Na+ SAR =
√ Ca2++Mg2+
where ionic concentrations of each are in mmol/l
10
This ratio is important because calcium and sodium have different effects on the soil: calcium
will flocculate (hold together), while sodium disperses (pushes apart) soil particles.
Water with low salinity content (<0.5 dS m-1) leaches the soluble minerals and salts. If calcium
is leached, soil structure can be destabilized and fine soil particles become dispersed and
clog the pour spaces, leading to reduced water infiltration, soil crusting and crop emergence
problems (Ayres and Westcot 1985; cited in WHO 2006).
In summary, high salinity water will increase infiltration, whereas low salinity water or water
with a high sodium to calcium ratio will decrease infiltration: both factors may also operate at
the same time, therefore it is important to consider both EC and SAR, and for this reason
guidelines for potential irrigation problems relating to infiltration include both (Table 3-4).
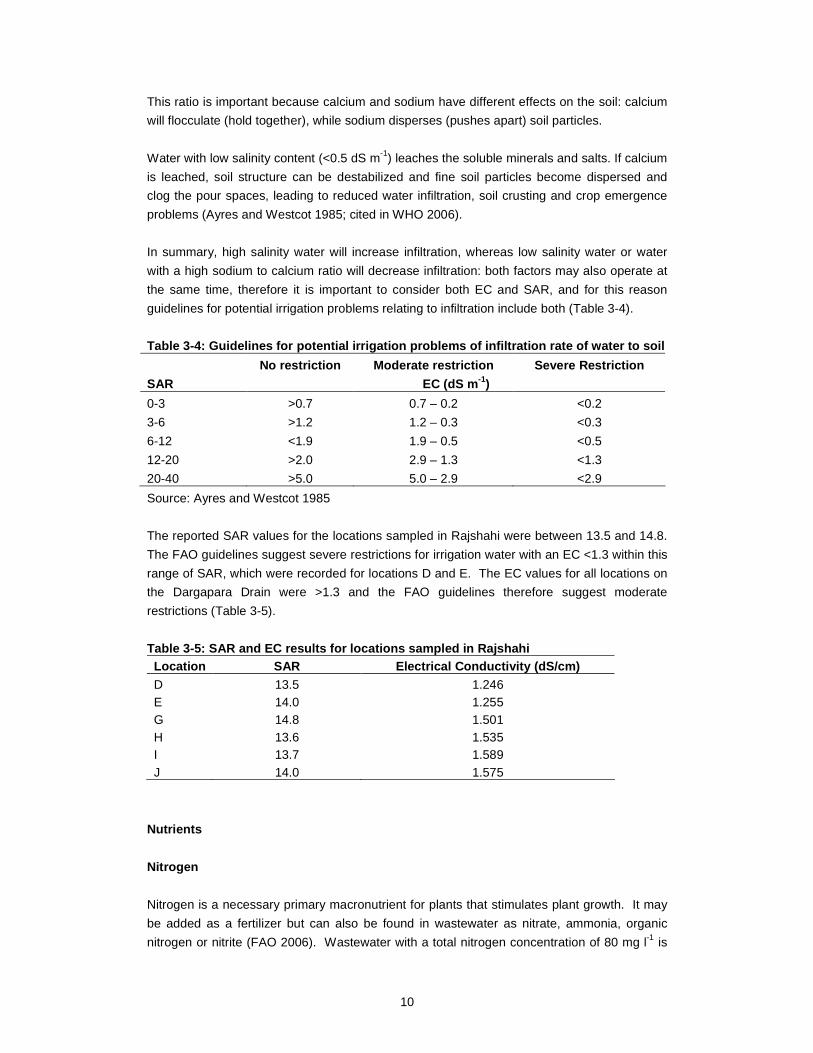
Table 3-4: Guidelines for potential irrigation prob lems of infiltration rate of water to soil
No restriction Moderate restriction Severe Restric tion
SAR EC (dS m -1)
0-3 >0.7 0.7 – 0.2 <0.2
3-6 >1.2 1.2 – 0.3 <0.3
6-12 <1.9 1.9 – 0.5 <0.5
12-20 >2.0 2.9 – 1.3 <1.3
20-40 >5.0 5.0 – 2.9 <2.9
Source: Ayres and Westcot 1985
The reported SAR values for the locations sampled in Rajshahi were between 13.5 and 14.8.
The FAO guidelines suggest severe restrictions for irrigation water with an EC <1.3 within this
range of SAR, which were recorded for locations D and E. The EC values for all locations on
the Dargapara Drain were >1.3 and the FAO guidelines therefore suggest moderate
restrictions (Table 3-5).
Table 3-5: SAR and EC results for locations sampled in Rajshahi Location SAR Electrical Conductivity (dS/cm) D 13.5 1.246 E 14.0 1.255 G 14.8 1.501 H 13.6 1.535 I 13.7 1.589 J 14.0 1.575
Nutrients
Nitrogen
Nitrogen is a necessary primary macronutrient for plants that stimulates plant growth. It may
be added as a fertilizer but can also be found in wastewater as nitrate, ammonia, organic
nitrogen or nitrite (FAO 2006). Wastewater with a total nitrogen concentration of 80 mg l-1 is

11
considered strong, 40 mg l-1 medium and 20 mg l-1 weak; and the usual total nitrogen
concentration in wastewater treated in a conventional treatment plant is 50 mg l-1 (Pescod
1992).
The most important factor for plants is the total amount of nitrogen (N) regardless of whether
it is in the form of nitrate-nitrogen (NO3-N), ammonium-nitrogen (NH4-N) or organic-nitrogen
(Org-N) and by reporting in the form of total nitrogen, comparisons can be made (Ayres and
Westcot 1985). Most plants absorb only nitrates, but normally the other forms are
transformed into nitrates in the soil. During this transformation several mechanisms such as
volatilization result in the loss of some of the nitrogen so that only 50% of the ammonia and
30% of organic nitrogen are ultimately assimilated by the plants (WHO 2006).
If excess nitrogen is applied to a crop it can result in over-stimulation and excessive growth
which increase susceptibility to pest and disease attacks, delayed maturity, failure to ripen,
reduced crop quality and yield loss (Pescod 1992). The concentration of nitrogen required
varies according to the crop with more sensitive crops being affected by nitrogen
concentrations above 5 mg l-1, whilst most other crops are relatively unaffected until nitrogen
exceeds 30 mg l-1. The sensitivity of crops also varies with the growth stage. High nitrogen
levels may be beneficial during early growth stages but may cause yield losses during the
later flowering and fruiting stages. This means that water containing high nitrogen levels,
including domestic wastewater, can be used as a fertilizer early in the season but should
ideally be reduced or blended with other sources of water later in the growth cycle (Ayres and
Westcot 1985).
The usual range for nitrate-nitrogen in irrigation water is 0 – 10 mg l-1 and for ammonium-
nitrogen is 0 – 5 mg l-1 (ibid). The total-nitrogen and ammonium-nitrogen levels were high in
all locations and were well above the usual range for irrigation water but the nitrate
concentration was very low in all samples and ammonia-N was the predominant form of
nitrogen in the wastewater (Figure 3.2). This is due to the anaerobic conditions in the
wastewater caused by the low dissolved oxygen.
Figure 3.2: Nitrogen concentrations at each sample location
0
10
20
30
40
50
60
A B C D E G H I J
Location
Con
cent
ratio
n as
N m
g/L Nitrate N
Ammonia
Total Nitrogen
DO
Crop
restrictions

12
In the Circuit House Drain the ammonia and total-N concentrations increased from A to B as
did the flow, which suggests new sources of wastewater are entering the system between
these two points, as is likely to be happening in the residential area. Point C had a high
concentration of total and ammonium-N but this may relate to the low flow (see limitations
section). The concentrations declined in the beel and are even lower in the beel effluent; this
may be due to natural treatment processes taking place or dilution. The effluent from the beel
still had substantially higher nitrogen concentrations than normal irrigation water but it was
just below the value at which most crops are negatively affected.
The concentrations of ammomium-nitrogen and total nitrogen were higher on average in the
Dargapara Drain than the Circuit House Drain. It is notable that the concentrations are fairly
stable except for a peak in total nitrogen at point H. It is not clear why this peak exists and
further analysis is required to determine this but it could be contributed by an in-flowing drain
between location G and H. What factors cause the attenuation of this peak before location J
is also not clear but since this water is used in agriculture between H and J it is possible that
this is the cause; although the unexplained increase in flow between H and J may also
contribute in some way. Notably the confluence with the industry drain did not show an
increase in nitrogen, which is supported by the study on the types of industries in the area
and that all of them have septic tanks for toilet waste (Sandoval, Ara and Clemett, 2007).
Phosphorous
Phosphorus is also a primary macronutrient essential to the growth of plants and other
biological organisms; however, excess phosphorus can lead to noxious algal blooms in water
bodies. Municipal wastewaters may contain between 4 and 16 mg l-1 of phosphorus as P and
a typical value for wastewater treated in a conventional wastewater treatment plants is
10 mg l-1 (Metcalf and Eddy 2003; Pescod 1992). The usual range for phosphate-phosphorus
(PO4-P) in irrigation water is 0 – 2 mg l-1 (Ayres and Westcot 1985).
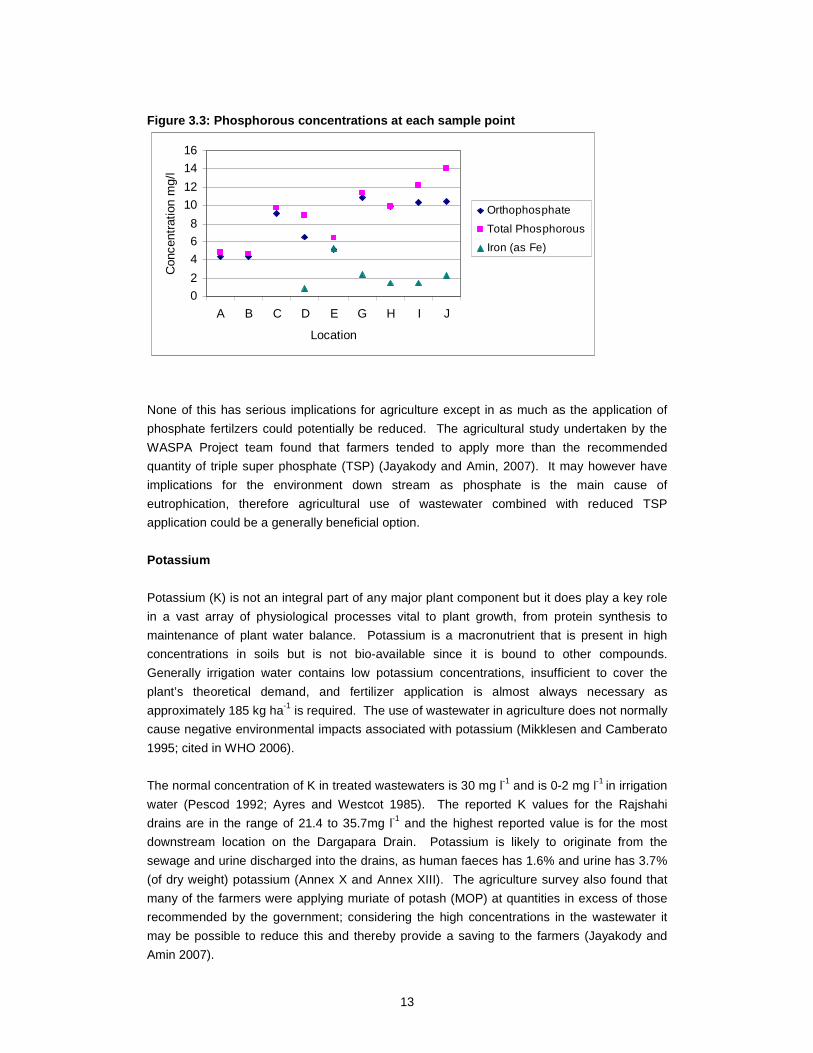
The orthophosphate concentrations were high compared to the total P, which indicates that
the particulate phosphorous is low and the phosphorous is readily available for plants. In the
Circuit House Drain both the total-P and PO4-P concentrations decreased from C to D,
possibly due to dilution but the further decline from D to E suggests that natural processes
taking place in Bashuar Beel maybe contributing to its attenuation (Figure 3.3).
In the Dargapara Drain the total-P levels increase from H to J, the opposite of the observed
trend for nitrogen (Figure 3.3 and Figure 3.2). The new sources of phosphorus entering the
drain may be: more domestic waste; detergents from the industrial area (contributing to the
concentration at J); and leaching of phosphorous from the agricultural area, especially if
phosphate fertilizer is over applied (see Jayakody and Amin 2007 for a discussion of fertilizer
application rates).
13
Figure 3.3: Phosphorous concentrations at each samp le point
0
2
4
6
8
10
12
14
16
A B C D E G H I J
Location
Con
cent
ratio
n m
g/l
Orthophosphate
Total Phosphorous
Iron (as Fe)
None of this has serious implications for agriculture except in as much as the application of
phosphate fertilzers could potentially be reduced. The agricultural study undertaken by the
WASPA Project team found that farmers tended to apply more than the recommended
quantity of triple super phosphate (TSP) (Jayakody and Amin, 2007). It may however have
implications for the environment down stream as phosphate is the main cause of
eutrophication, therefore agricultural use of wastewater combined with reduced TSP
application could be a generally beneficial option.
Potassium
Potassium (K) is not an integral part of any major plant component but it does play a key role
in a vast array of physiological processes vital to plant growth, from protein synthesis to
maintenance of plant water balance. Potassium is a macronutrient that is present in high
concentrations in soils but is not bio-available since it is bound to other compounds.
Generally irrigation water contains low potassium concentrations, insufficient to cover the
plant’s theoretical demand, and fertilizer application is almost always necessary as
approximately 185 kg ha-1 is required. The use of wastewater in agriculture does not normally
cause negative environmental impacts associated with potassium (Mikklesen and Camberato
1995; cited in WHO 2006).
The normal concentration of K in treated wastewaters is 30 mg l-1 and is 0-2 mg l-1 in irrigation
water (Pescod 1992; Ayres and Westcot 1985). The reported K values for the Rajshahi
drains are in the range of 21.4 to 35.7mg l-1 and the highest reported value is for the most
downstream location on the Dargapara Drain. Potassium is likely to originate from the
sewage and urine discharged into the drains, as human faeces has 1.6% and urine has 3.7%
(of dry weight) potassium (Annex X and Annex XIII). The agriculture survey also found that
many of the farmers were applying muriate of potash (MOP) at quantities in excess of those
recommended by the government; considering the high concentrations in the wastewater it
may be possible to reduce this and thereby provide a saving to the farmers (Jayakody and
Amin 2007).

14
Metallic Constituents
Trace quantities of many metals can be found in wastewaters, particularly industrial waste but
also arising from domestic waste, for example form household cleaning products. Many of
these metals are necessary for growth of biological life but only in trace concentrations; if the
required concentrations are exceeded they can become toxic and thus interfere with the
potential beneficial uses of wastewater (Metcalf and Eddy 2003). It is important to note
however, that metals will only be absorbed by plants once a threshold concentration has been
reached in the soil and the metal is in a mobile phase, hence the concentration in irrigation
water is not a direct reflection of the uptake of crops. Metals are bound to soils with pH above
6.5 or with high organic matter content. Below this pH, adsorption sites are saturated and
metals become mobile (WHO 2006).
All the samples except A, B and C were analyzed for a selection of metals that were either
likely to cause damage to crops or impact on human health, these included: calcium (as
Ca2+); magnesium (as Mg2+); potassium (as K+); sodium (as Na+); iron (as Fe); nickel (as Ni);
copper (as Cu); cadmium (as Cd); chromium (as Cr); arsenic (as As); lead (as Pb); mercury
(as Hg); and boron (as B). Of these, potassium is a primary macronutrient; and calcium and
magnesium are secondary macronutrients (see preceding discussion). Iron, boron and
copper are micronutrients which help plant growth and development but can be detrimental if
threshold levels are exceeded. The others variously affect plant growth and development.
Excessive iron can reduce the phosphorous component in water by precipitating the dissolved
phosphate. Therefore, phosphorous might not be readily available for plant uptake in the
presence of excessive iron. The concentration of iron ranged from just 0.8 mg l-1 to 5.27 mg l-1
in the drainage water (Figure 3.4). The recommended maximum concentration of iron for
crop production is 5 mg l-1 and sample E has exceeded this level (Figure 3.4). Location E
also exhibits the lowest orthophosphate concentration but in general iron appears not to be of
concern in these samples (Figure 3.3).
Figure 3.4: Concentrations of iron
0
1
2
3
4
5
6
D E G H I J
Location
Con
cent
ratio
n m
g/l Iron (as Fe) mg/l
WHO recommendedmaximumconcentration forcrop production(mg/l)
15
Boron is an essential element for plant growth but in relatively small amounts. For example,
for some plants 0.2 mg l-1 in irrigation water is essential but 1-2 mg l-1 may be toxic. There is
however a wide range of tolerance between crops and most crop toxicity symptoms occur
after concentrations in leaf blades exceed 250 mg kg-1 dry weight. Typical symptoms are a
yellowing of leaves, spotting or drying of leaf tissue (Ayres and Westcot 1985). There is no
guideline value for B in Bangladesh but FAO recommend slight restriction from 0.7-3.0 mg l-1
and severe restrictions for concentrations exceeding 3.0 mg l-1 (ibid). The concentrations in
the samples ranged from 0.1 to 0.3 mg l-1.
The WHO (2006) recommended maximum concentration of Cr for crop production is 0.1mg/l
and sample J has exceed this value. Location J is after the industrial wastewater drain that
discharges into the cantonment drain, so the Cr could originate from the industrial area,
although no specific industry has been identified as being the source of this contamination.
Further investigations into the possible contamination of soil and plant material, and
identification of the potential source of the metal are advisable. The Ni, Cu and Hg levels are
below the recommended maximum concentration of WHO for crop production (WHO 2006).
Given the low values and the very limited evidence for direct health impacts from chemical
exposure associated with the use of wastewater in agriculture, chemicals are unlikely to be
the main cause for concern in the project site. It has been shown that for most chemicals
their concentrations in wastewater and wastewater produce will never be enough to result in
acute health effects, and chronic health effects, such as cancer, are only likely after many
years of exposure (ibid).
Organic Constituents
Dissolved Oxygen
The DO values ranged from 0 to 2 mg l-1. Dissolved oxygen is important for aquatic life, and
whilst aquatic life is not expected to exist in the drains it gives an indication of the likely impact
on receiving water bodies, principally Baranai River. The optimal DO concentration for fish
health is 5 mg l-1 and most species become distressed when levels drop to 4-2 mg l-1
(Francis-Floyd 2003).
Dissolved oxygen is also important for the microbial breakdown of waste in the water and for
chemical reactions. The low levels of DO in the samples indicate high levels of pollution and
are below the GoB (1997) standards for water usable for irrigation, recreation and fisheries of
5 mg l-1 or less (Annex VIII). The results also suggest some oxygenation in Bashuar Beel
(Figure 3.5). The variability along Dargapara Drain is not easily explained and needs further
observations in the field as well as more water quality analyses.

16
Figure 3.5: Variation in dissolved oxygen across sa mple locations
0.0
0.5
1.0
1.5
2.0
2.5
A B C D E G H I J
Location
Dis
solv
ed o
xyge
n co
ncen
trat
ion
mg/
L
Biochemical Oxygen Demand
The most widely used parameter to measure water quality and used in the design of effluent
treatment plants is 5-day Biochemical Oxygen Demand (BOD5). The determination of BOD5
involves the measurement of the DO used by microorganisms in the biochemical oxidation of
organic matter (Metcalf and Eddy 2003). In the Rajshahi samples the BOD5 values were
found to be in the range 22-112mg l-1 which is at the low end of the typical range for domestic
wastewater described as 110-400 mg l-1 per day by Crites and Tchobanoglous (1998). The
lowest reported value was in Basuar Beel at 22 mg l-1, while all other locations had a BOD5 of
greater than 50mg l-1 (Figure 3.6). According to WHO (2006) municipal wastewater with
BOD5 concentration in the range of 110-400 mg l-1 can increase crop productivity and
condition the soil if it is used for irrigation, and they report no negative effects until the BOD5
reaches 500 mg l-1. However the Bangladesh standard for water usable for irrigation is a
BOD of 10 mg l-1 or less GoB 1997.
Figure 3.6: Variation in BOD and COD across sample locations
0
50
100
150
200
250
300
A B C D E G H I J
Location
Con
cent
ratio
n m
g/L
BOD
COD
17
Chemical Oxygen Demand
Chemical oxygen demand (COD) is often measured in addition to or instead of BOD5 as it has
the advantage that it can be measured in a couple of hours and in many “known” waters (e.g.
fresh water or municipal wastewater) can be used to roughly calculate the BOD. The COD
test is used to measure the oxygen equivalent of the organic material in wastewater that can
be oxidized chemically using dichromate in acid solution (Metcalf and Eddy 2003).
The COD values in the samples tested ranged from 83 to 241mg l-1, which is again low, given
that Crites and Tchobanoglous (1998) quote a range of 250-1000 mg l-1 for domestic
wastewater. The COD to BOD ratio was between 2:1 and 4:1 which is typical of untreated
municipal wastewater (ibid). As with BOD, COD is substantially lower in the beel than in the
drains (Figure 3.6).
Biological Characteristics
The biological characteristics of water and wastewater are of fundamental importance to
human health, in controlling diseases caused by pathogenic organisms of human origin, and
because of the role that they play in the decomposition of waste (Metcalf and Eddy 2003).
Untreated wastewater that includes faecal waste contains a variety of excreted organisms
including pathogens at very high concentrations. Microbial evidence can therefore be used to
indicate that a hazard to human health exists in the environment. There is not however a
perfect indicator organism for wastewater as excreted organisms range from bacteria to
helminthes, protozoa and viruses (WHO 2006). The most common indicator organisms used
when monitoring water quality are Coliforms and Faecal Coliforms. The Coliform group of
bacteria comprises mainly species of the genera Citrobater, Enterobacter, Escherichia and
Klebsiella, and includes Faecal Coliforms of which Escherichia coli (E.coli) is the predominant
species (Pescod 1992). It is however recommended that E.coli, not Coliforms, is used as an
indicator for wastewater use in agriculture because the Faecal Coiform test may also include
some non-faecal organisms (ibid). Despite this, it was necessary to use total Coliforms and
Faecal Coliforms because of the availability of laboratories to perform the tests and other
constraints.
The WHO 1989 guidelines for wastewater used in agriculture had a maximum Faecal
Coliform of less than 1000 thermotolerant coli/100 ml for root crops likely to be eaten
uncooked, and 10,000 thermotolerant coli/100 ml for leaf crops likely to be eaten uncooked,
but no standard for irrigation of cereal crops (WHO 2006). The current guidelines do not have
specific values but require a pathogen reduction target to be met through treatment, die-off,
washing and irrigation method that results in similar levels to those set in the 1989 standards.
These are a 7 log unit pathogen reduction for root crops likely to be eaten uncooked and a 6
long unit pathogen reduction for leaf crops likely to be eaten uncooked (WHO 2006).
The results for Total and Faecal Coliform in all tested drain water samples did not comply with
the WHO guidelines for use of wastewater in agriculture (WHO 2006). The highest
contamination level was in sample J (Dargapara Drain after joining with the Industrial waste

18
canal) which is the most downstream location sampled in the study (Table 3-6). Therefore, it
is likely the farmers are exposed to high levels of excreted organisms.
The water in the Basuar Beel Drain also had a high level of Total and Faecal Coliform. The
people use this water for other purposes as well as agriculture, such as jute processing and
washing kitchen utensils and clothes, and they are in primary contact with the wastewater.
The water does not satisfy WHO guidelines for primary contact (Guideline for Safe
Recreational Water Environments) and Bangladesh standards for recreational waters (WHO
2006; GoB 1997; Annex VIII). Therefore, it is likely that it is not only the farmers but also the
residents around Basuar Beel who are exposed to high levels of excreted organisms, such as
those listed in Annex XIII.
Table 3-6: Total Coliform and Faecal Coliform conce ntrations in water samples
Location
Coliform
Confirmed membrane filter
(MF) colony forming units
(CFU) /100 ml
Faecal Coliform
confirmed MF (CFU)
/100 ml
A 190.0x10⁶ 23.9x10³
B 174.0x10⁶ 11.9x10³
C 19.4x10⁶ 23.5x10³
D 3.0x10⁶ 23.5x10³
E 1.6x10⁶ 3.9x10³
G 14.2x10⁶ 3.9x10³
H 18.2x10⁶ 7.8x10³
I 16.6x10⁶ 439.2x10³
J 13.4x10⁶ 6.2x10⁶
WHO Guideline 1x10³
Nematode Eggs
Sites A and B give an idea of the types of parasites present in the city area. Parasitic
protozoa, hook worms, round worms and cestodes were found in the samples, indicating
feacal contamination. The fluke eggs could be of animal origin, as they are not reported from
humans in Bangladesh. Some of the round worm and cestode species could also be of
animal origin and further examination is required for clarification (Table 3-7).
Table 3-7: Results of Parasitological Analysis
Number per 50 µl
Parasite Location A Location B Location E
Cysts of Entamoeba coli 47 30 07
Ova of Fluke spp 12 15 1500
Larval forms (parasitic and non-parasitic) 08 05 2-3
Other worm eggs (Ascaris and Cestode spp) 28 33 1200
Ova of Hook worms 01 - -

19
A high number of parasites (fluke spp. Ova, Ascaris and cestode spp.) were reported from
location E, where the beel becomes a channel once again and enters the agricultural area;
but no hook worms were reported from this site. The high number of flukes could be from
cattle as there is an animal shed adjacent to the beel. It was observed that hanging latrines
and the latrine overflow tubes were connected to the Basuar Beel as well as the Basuar Beel
Drain. The high counts of parasites in sample E could account for this. Further analysis of
the preserved samples will give a better picture of the parasite species distribution and the
host origin.
Pollutant Loads of Selected Parameters
The quantity of water available for irrigation will be a major factor for farmers in determining
the type of crops that can be grown and what type of irrigation techniques can be used. It will
also influence the level of pollutants being transferred to the soil, and potentially the crop,
during irrigation events.
The discharge data was used in conjunction with the water quality data to calculate the overall
pollutant loads for some of the key parameters and the potential load to an irrigated field. The
discharge data, which ranged from 2.72x10³ to 4.65x10⁴ m3 day-1 is presented in Table 3-1.
Ideally measurements are taken across the cross-section of a stream and the load of each
pollutant is calculated using the formula:
Where
t = time in seconds
c(t) = Concentration at time (t) in mg l-1
Load =k t∫c(t) q(t) dt
q(t) = Water discharge at time (t) in m3 s-1
However, it is common practice for a single set of field-measurement data to be used to
represent an entire stream cross-section and given the uniformity of the drains being studied
the following equation was used (www.water.usgs.gov):
Load = C.Q C = concentration of the parameter (mg l-1)
Q = water discharge (l s-1)
The nutrients nitrogen, phosphorous and potassium are available in the water in significant
amounts (Table 3-8) but how farmers utilize these incoming nutrients is yet to be understood.
To do this it is necessary to review the agricultural survey data and to calculate the load
based on the quantity of irrigation water pumped from the drain.
20
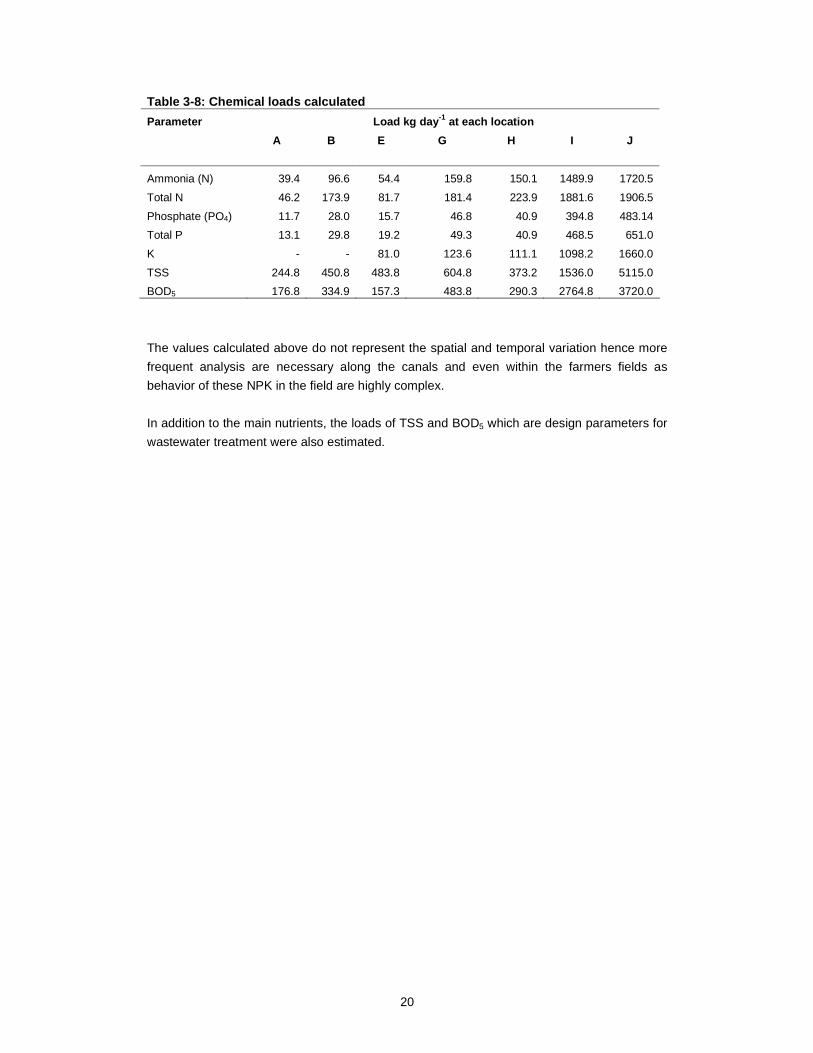
Table 3-8: Chemical loads calculated
Load kg day -1 at each location Parameter
A B E G H I J
Ammonia (N) 39.4 96.6 54.4 159.8 150.1 1489.9 1720.5
Total N 46.2 173.9 81.7 181.4 223.9 1881.6 1906.5
Phosphate (PO4) 11.7 28.0 15.7 46.8 40.9 394.8 483.14
Total P 13.1 29.8 19.2 49.3 40.9 468.5 651.0
K - - 81.0 123.6 111.1 1098.2 1660.0
TSS 244.8 450.8 483.8 604.8 373.2 1536.0 5115.0
BOD5 176.8 334.9 157.3 483.8 290.3 2764.8 3720.0
The values calculated above do not represent the spatial and temporal variation hence more
frequent analysis are necessary along the canals and even within the farmers fields as
behavior of these NPK in the field are highly complex.
In addition to the main nutrients, the loads of TSS and BOD5 which are design parameters for
wastewater treatment were also estimated.
21
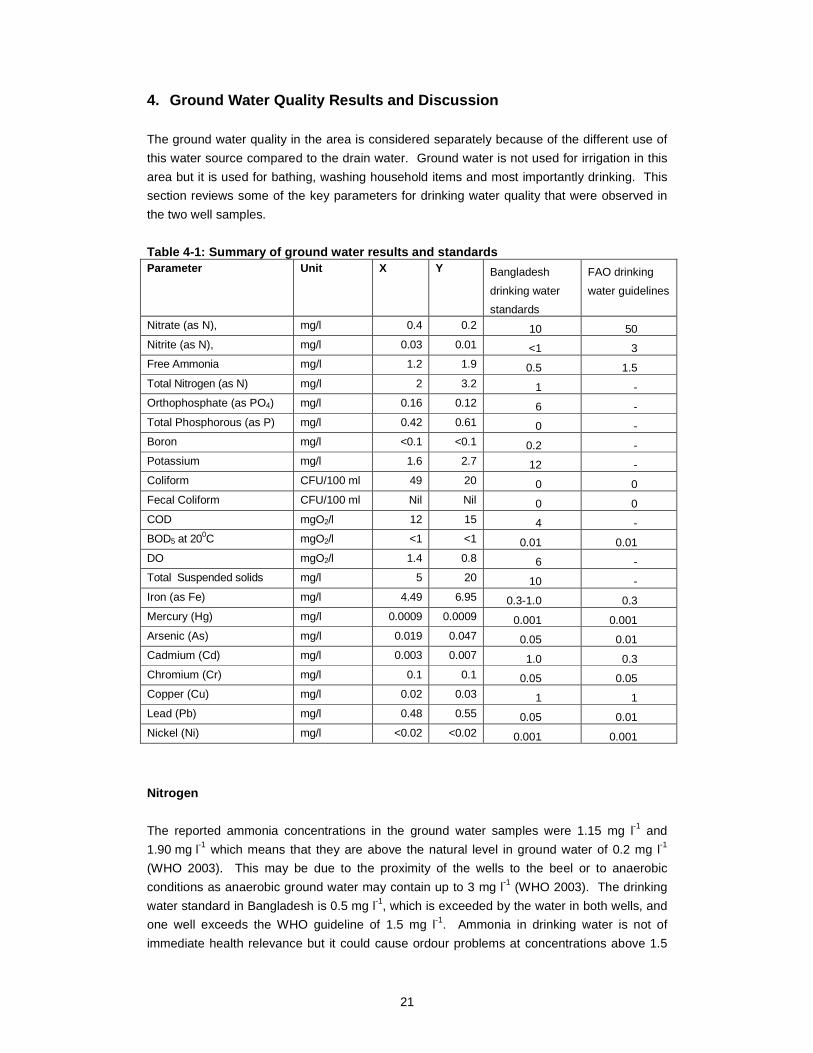
4. Ground Water Quality Results and Discussion
The ground water quality in the area is considered separately because of the different use of
this water source compared to the drain water. Ground water is not used for irrigation in this
area but it is used for bathing, washing household items and most importantly drinking. This
section reviews some of the key parameters for drinking water quality that were observed in
the two well samples.
Table 4-1: Summary of ground water results and stan dards Parameter Unit X Y Bangladesh
drinking water
standards
FAO drinking
water guidelines
Nitrate (as N), mg/l 0.4 0.2 10 50 Nitrite (as N), mg/l 0.03 0.01 <1 3 Free Ammonia mg/l 1.2 1.9 0.5 1.5 Total Nitrogen (as N) mg/l 2 3.2 1 - Orthophosphate (as PO4) mg/l 0.16 0.12 6 - Total Phosphorous (as P) mg/l 0.42 0.61 0 - Boron mg/l <0.1 <0.1 0.2 - Potassium mg/l 1.6 2.7 12 - Coliform CFU/100 ml 49 20 0 0 Fecal Coliform CFU/100 ml Nil Nil 0 0 COD mgO2/l 12 15 4 - BOD5 at 200C mgO2/l <1 <1 0.01 0.01 DO mgO2/l 1.4 0.8 6 - Total Suspended solids mg/l 5 20 10 - Iron (as Fe) mg/l 4.49 6.95 0.3-1.0 0.3 Mercury (Hg) mg/l 0.0009 0.0009 0.001 0.001 Arsenic (As) mg/l 0.019 0.047 0.05 0.01 Cadmium (Cd) mg/l 0.003 0.007 1.0 0.3 Chromium (Cr) mg/l 0.1 0.1 0.05 0.05 Copper (Cu) mg/l 0.02 0.03 1 1 Lead (Pb) mg/l 0.48 0.55 0.05 0.01 Nickel (Ni) mg/l <0.02 <0.02 0.001 0.001
Nitrogen
The reported ammonia concentrations in the ground water samples were 1.15 mg l-1 and
1.90 mg l-1 which means that they are above the natural level in ground water of 0.2 mg l-1
(WHO 2003). This may be due to the proximity of the wells to the beel or to anaerobic
conditions as anaerobic ground water may contain up to 3 mg l-1 (WHO 2003). The drinking
water standard in Bangladesh is 0.5 mg l-1, which is exceeded by the water in both wells, and
one well exceeds the WHO guideline of 1.5 mg l-1. Ammonia in drinking water is not of
immediate health relevance but it could cause ordour problems at concentrations above 1.5
22
mg l-1. The main cause for concern in drinking water is nitrate, which can interfere with the
oxygen carrying capacity of the blood and can have serious implications for infants.
Fortunately nitrogen is not present in the ground water in this form at any significant level and
at 0.4 and 0.2 mg l-1 is well below the Bangladesh and WHO standards of 10 and 50 mg l-1
respectively. The total nitrogen concentration of the ground water is however above the
Bangladesh standard of 1 mg l-1 (Table 4-1); FAO gives no guideline for this.
Metals
Of the metals analyzed, iron, arsenic, chromium, lead and nickel where near or exceeded
either the Bangladesh or WHO guideline values in one or more wells (Table 4-1). However,
the source of this contamination is not known and since only one sample has been collected it
is very important not to draw too many inferences from this data. What is most important
about these results is that they provide guidance on what should be monitored in future
sampling events and enable the team to consider whether there are any possible sources of
contamination if future sampling shows that there really is a problem.
The arsenic levels in the wells were close to the permissible limits for drinking water but did
not exceed them. Arsenic has been a major problem in ground water in Bangladesh and
Rajshahi is no exception (see Clemett et al. 2006).
The cadmium concentration in sample X was at the guideline level for WHO but did not
exceed the Bangladesh guidelines; the sample from location Y exceeded both. In the short-
term Cd can cause: nausea, vomiting, diarrhea, muscle cramps, liver injury and renal failure;
and can in the long-term lead to kidney, liver, bone and blood damage, therefore it is
important to monitor the level of Cd in the drinking water. It occurs naturally in many ores and
is very often contributed to drinking water through the corrosion of galvanized pipes. There
are also industrial sources of Cd including metal refineries, paints and waste batteries, which
means that leaching from landfills or rubbish dumps may contribute
(USEPA 2007). None of these sources have as yet been identified in Rajshahi but they
should be considered by the project team and Learning Alliance members.
The chromium levels in the ground water sampled were double both the Bangladesh and
WHO drinking water quality guidelines. Chromium can cause skin irritation and liver and
kidney damage in the long-term. The main sources of Cr are usually steel and pulp mills or
erosion of natural deposits; Cr is widely found in soils and plants. There is no obvious
industrial source of Cr in the project area, therefore the soils may be the source, especially as
Cr compounds bind to soil and are not likely to migrate from the surface to ground water
(ibid).
Lead levels were very high at 10 times the Bangladesh guidelines and 50 times the WHO
guidelines (Annex XII). Lead is known to impair the mental development of children and can
cause kidney problems in adults. The most common source of Pb in many countries is
corrosion of household plumbing, although erosion of natural deposits is also common (ibid).
23
The iron concentrations in the ground water samples were much higher than the Bangladesh
drinking water standards at 4.49 and 6.95 mg l-1 (Table 4-1). This is typical of ground water
across Bangladesh where iron concentrations are much higher than the WHO and national
recommended limits, but there are no known human health implications (UNEP 2001). Iron is
therefore more of a nuisance than a health problem as it causes the water to taste unpleasant
and stains laundry at levels above 0.3 mg l-1; but concentrations of 1–3 mg l-1 can be
acceptable for people drinking anaerobic well water (WHO 2003). At the levels recorded there
may be a risk of iron being stored in the body (WHO 2003).
Microbiological Quality
The groundwater samples showed Coliform contamination, which means that they do not
conform to the Bangladesh and WHO guidelines of 0 CFU/100 ml; however they did not show
any faecal contamination despite the fact that across Bangladesh 54 per cent of hand
pumped tube wells were found to have fecal contamination, due to poor wellhead design,
faulty construction and management, even though the aquifers themselves were not polluted
(Hoque, 1998; cited in UNEP 2001). The tube wells analyzed under the WASPA project are
both deep tube wells and are unlikely to be contaminated with Coliforms leaching from the
Basuar Beel, the drains or even septic tanks.

24
5. Conclusions and Recommendations
Surface Water
The results show that the main potential health risk to farmers using wastewater in agriculture
is microbial and parasitalogical contamination. This is also of concern for people residing
near the drains and the beel as they have been observed to use the water for other activities
such as bathing, washing household items and even rinsing meat and vegetables.
No other parameters are shown in the baselines survey to be a major risk to health from
wastewater irrigation but chromium was above the WHO (2006) recommendations at location
J and this should be monitored.
In terms of impacts on crops EC, TDS and SAR are of concern and based on the FAO (1985)
guidelines, slight to moderate restrictions are advised in all locations, with severe restrictions
advised for crops irrigated with wastewater from locations D and E.
Nutrients, N, P and K, were all high and the N levels could impact on crop yield or increase
pest attacks. However, if correctly managed these nutrients could reduce the quantity of
fertilizer applied and reduce costs for farmers.
The water quality in the beel appears to be better than in other locations possibly due to
dilution or natural treatment processes such as sedimentation and microbial breakdown.
Ground Water
The water sampled in the tube wells exceeds WHO and Bangladesh drinking water standards
for many parameters including both metals and Coliforms. The metals may be of long-term
concern but the Coliforms may be of more immediate health significance. More tests are
needed to confirm the observed levels of pollutants and further research is required to
determine the sources of contamination.
Recommendations
As this is the first sampling event, further tests need to be undertaken. These results should
be used to guide certain Learning Alliance members to monitor water quality, for example the
Department of Public Health Engineering (DPHE) who are responsible for drinking water
quality, and the Department of Environment who are mandated to monitor industrial effluent.
The results should be combined with the other studies and further research in order to identify
sources of contamination and possible remediation strategies.

25
The nutrient values should be discussed with the Department of Agriculture Extension and the
farmers. This could lead to recommendations to reduce fertilizer inputs, thereby reducing the
costs to farmers and downstream pollution.
The effect of Bashuar Beel on water quality should be investigated further and the possible
means of enhancing the processes discussed with Learning Alliance members.

26
6. Limitations
Sampling Locations
As discussed in the methodology the sampling locations were not ideal and will be relocated
for subsequent sampling events. Locations A and C will be on the Circuit House Drain and
will capture the quality of water from within the city and at the exit from the city.
Consequently, although the new sample points can not be compared absolutely with the
baseline points A and C, it is expected that the results should be similar. Ideally a new
baseline survey should have been undertaken but given the financial limitations for water
quality sampling in the project and the need to sample during the agricultural season, when
the water quality is more relevant for the purposes of this study, it was decided that the next
sampling event would be postponed until this time. Sample point B will be excluded in future
events as it is felt that locations A and C are sufficient to capture the wastewater quality in the
city.
Oil and Grease
In Bangladesh there are standards for the concentration of oil and grease that can be
discharged to inland surface waters (10 mg l-1), public sewers with secondary treatment plant
(20 mg l-1) and irrigated land (10 mg l-1) (Annex IX). Unfortunately this was not tested in
Rajshahi because the team could not find suitable testing facilities.
The term oil and grease is commonly used and often included in environmental or wastewater
quality standards and includes fats, oils, waxes and other related constituents of wastewater.
Oils and greases are compounds (esters) of alcohol or glycerol (glycerin) with fatty acids
(Metcalf and Eddy 2003). They can arise from many sources including meats and meat
processing, butter, margarine, cooking oil and vehicle oils. They can interfere with biological
life at the water surface and also cause unsightly films. It is intended that, provided facilities
can be identified, oil and grease will be analyzed in the next sampling event as it was
identified by farmers as a problem.
Microbial Analysis
The microbiological analysis was carried out with strict quality control but samples were
incubated within 24 hours of sample collection because of the distance between the project
site and the NGO Forum laboratory. As a result the 6 hour holding time specified by the
American Public Health Association (2001) was not satisfied. Fortunately, more recent
guidelines published by the Environment Protection Authority (2006) have made provisions
for a 24 hour holding time for microbiological analysis where a 6 hour holding time is not
possible; therefore, it is assumed that the errors are minimal as the samples were preserved
by refrigeration (cooling to a temperature <4oC) immediately after collection and kept
refrigerated until tested.
27
References
American Public Health Association, American Water Works Association, Water Environment
Federation. 2001. Standard Methods for the Examination of Water and Wastewater, 20th
Edition. Washington, D.C.: APHA/AWWA/WEF.
Ayres, R. S. and D. W. Westcot. 1985. Water Quality for Agriculture. FAO Irrigation and
Drainage Paper 29 Rev 1. Rome, Italy: FAO.
Bauder, T. A., Cardon, G. E., Waskom, R. M. and Davis, J. G. 2004. Irrigation Water Quality
Criteria. http://www.ext.colostate.edu/pubs/crops/00506.html
Clemett, A. E. V., Ara, S., Amin. M. MD. and Ahmed, R. 2006. Background Report: Rajshahi,
Bangladesh. WASPA Asia Project Report 2. Colombo, Sri Lanka: IWMI.
Crites, R. and Tchobanoglous, G. 1998. Small and Decentralized Wastewater Management
Systems. Singapore: McGraw-Hill.
Environment Protection Authority (EPA). 2006. Draft EPA Guidelines: Regulatory Monitoring
and Testing: Water and Wastewater Sampling. Adelaide,South Australia: EPA.
Francis-Floyd, R. 2003. Dissolved Oxygen for Fish Production. Fact Sheet FA 27. Florida:
Department of Fisheries and Aquaculture, Florida Cooperative Extension Service, Institute of
Food and Agricultural Sciences, University of Florida.
Government of Bangladesh (GoB). 1997. The Environment Conservation Rules, 1997.
Bangladesh: The Peoples Republic of Bangladesh.
Gunawardhana, H. D. 2005. Will Water be a Looming Crisis in Sri Lanka by 2025? World
Water Day (2005) Lecture Organized by Environment Committee and Section E2. Colombo,
Sri Lanka: Sri Lanka Association for Advancement in Science (SLAAS).
Jayakody, P. and Amin, M. MD. 2007. Wastewater Agriculture in Rajshahi City, Bangladesh.
WASPA Asia Project Report 9. IWMI: Colombo, Sri Lanka.
Metcalf and Eddie. 2003. Wastewater Engineering Treatment and Reuse, Forth Edition. ,
New York, USA: McGraw Hill. Mikkelsen, R. and Camberato, J. 1995. Potassium, Sulfur, Lime and micronutrient fertilizers.
In: Rechcigl, J. ed. 1995, Soil amendments and environment quality. Chelesa, England: M
Lewis Publishers. National Water Supply and Drainage Board (NWSDB). 2005. Initial Environmental
Examination Report: In Respect of Greater Kurunegala Sewerage Project. Kurunegala, Sri
Lanka: Ministry of Urban Development and Water Supply.
28
Pescod, M. B. 1992. Wastewater Treatment and Use in Agriculture. Rome, Italy: FAO.
Sandoval, N., Ara, S. and A. E. V. Clemett. 2007. Rajshahi City Industrial Survey Report.
WASPA Asia Project Report 12. Colombo, Sri Lanka: IWMI.
Strauss, M. 2000. Human Waste (Excreta and Wastewater) Reuse. Switzerland:
EAWAG/SANDEC.
United Nations Environment Programme (UNEP). 2001. Bangladesh State of the
Environment 2001.
U.S.Geological Survey TWRI Book 9. Generral Information and Guidelines (Version 1.1.7/03)
http://water.usgs.gov/owq/FieldManual/Chapter6/Archive/6.0/Section6.0.pdf
World Health Organization. 2006. WHO Guidelines for the Safe Use of Wastewater, Excreta
and Greywater: Volume II Wastewater use in Agriculture. Geneva, Switzerland: WHO.
WHO .1993. Guidelines for Drinking-water Quality, 2nd Edition Volume 1: Recommendations.
Geneva, Switzerland: WHO.
WHO .1998. Guidelines for Drinking-water Quality, 2nd Edition, Addendum to Volume 1:
Recommendations. Geneva, Switzerland: WHO.
Yoon, C.G., Soon, K.K. and Jong, H.H.2001. Effects of Treated Sewage Irrigation on Paddy
Rice Culture and its Soil. Irrigation and Drainage 50:227-236
I
Annex I: GPS Readings of Sample Locations Location Description of Location GPS Position and
Permanent Features
A (BBD) BBD within the city before Lakshipur N: 24o 22 35.5 E: 088o 34 18.1
B (BBD) BBD past Lakshipur community N: 24o 22 35.5 E 088o 34 18.0
C (BBD) BBD entry point (inlet) to the Basuar
Beel agricultural area
N: 24o 22 43.4 E 088o 34 23.7
D (BBD) Bashuar Beel N: 24o 23’ 13.2” E 088o 35’ 14.5”
E (BBD) BBD exit point (outlet) from the
Basuar Beel agricultural area
N: 24o 23’ 04.4” E 088o 35’ 34.4”
G (CD) CD entry point to the city N: 24o 23’ 17.6” E 088o 35’43.8”
H (CD) CD entry point (inlet) to cantonment
agriculture area
N: 24o 23’ 32.4” E 088o 35’ 50.2”
I (CD) CD exit point (outlet) from
cantonment Agriculture Area
N 24o 23’ 32.4” E 88o 35’ 50.4”
J (CD) CD after confluence with industrial
drain
N: 24o 23’ 23.8” E 088o 35’ 24.8”
X (GW) Ground water well near Basuar Beel
in Basuar Village
N: 24o 22’ 13.1” E: 0880 35 ‘23.4”
Y (GW)
Ground water well near Basuar Beel
in Basuar Village
N: 24o 23’ 14.8” E: 0880 35’ 17.3”
Annex II: Photographs of Sampling Locations
Location A
Location B
II
Location C
Location D
Location E
Location G
Location H
Location I
Location J
III
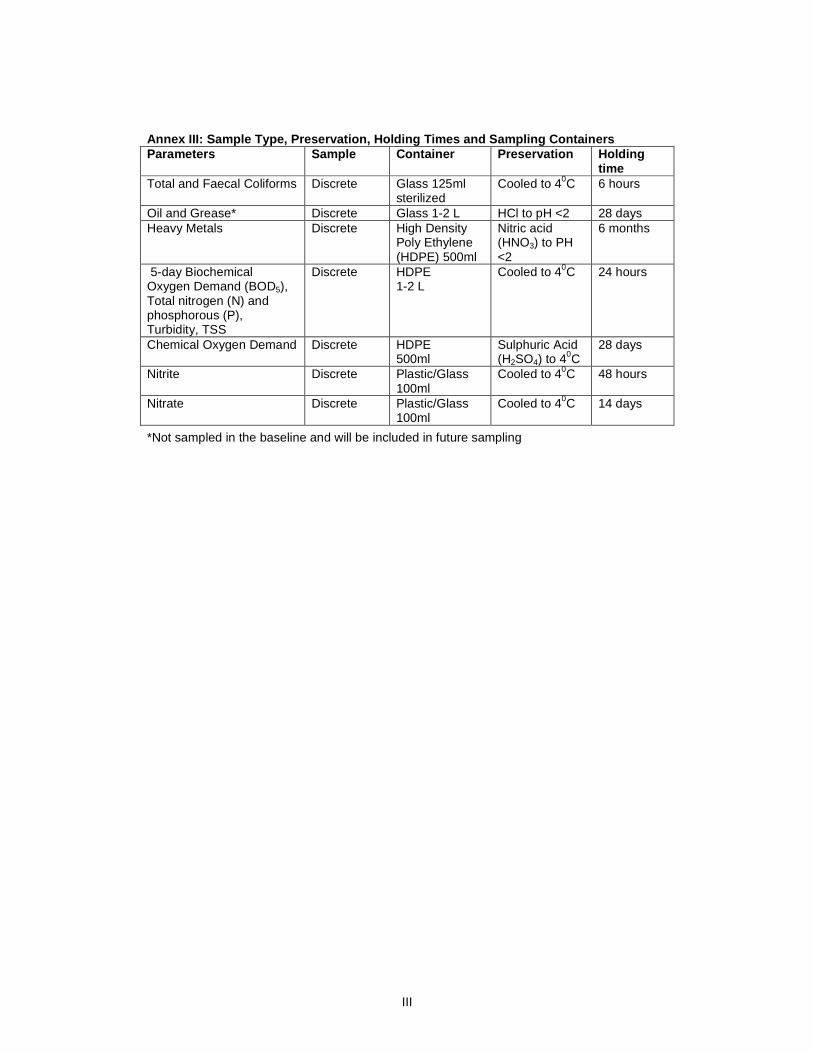
Annex III: Sample Type, Preservation, Holding Times and Sampling Containers Parameters Sample Container Preservation Holding
time Total and Faecal Coliforms Discrete Glass 125ml
sterilized Cooled to 40C 6 hours
Oil and Grease* Discrete Glass 1-2 L HCl to pH <2 28 days Heavy Metals Discrete High Density
Poly Ethylene (HDPE) 500ml
Nitric acid (HNO3) to PH <2
6 months
5-day Biochemical Oxygen Demand (BOD5), Total nitrogen (N) and phosphorous (P), Turbidity, TSS
Discrete HDPE 1-2 L
Cooled to 40C 24 hours
Chemical Oxygen Demand Discrete HDPE 500ml
Sulphuric Acid (H2SO4) to 40C
28 days
Nitrite Discrete Plastic/Glass 100ml
Cooled to 40C 48 hours
Nitrate Discrete Plastic/Glass 100ml
Cooled to 40C 14 days
*Not sampled in the baseline and will be included in future sampling
IV
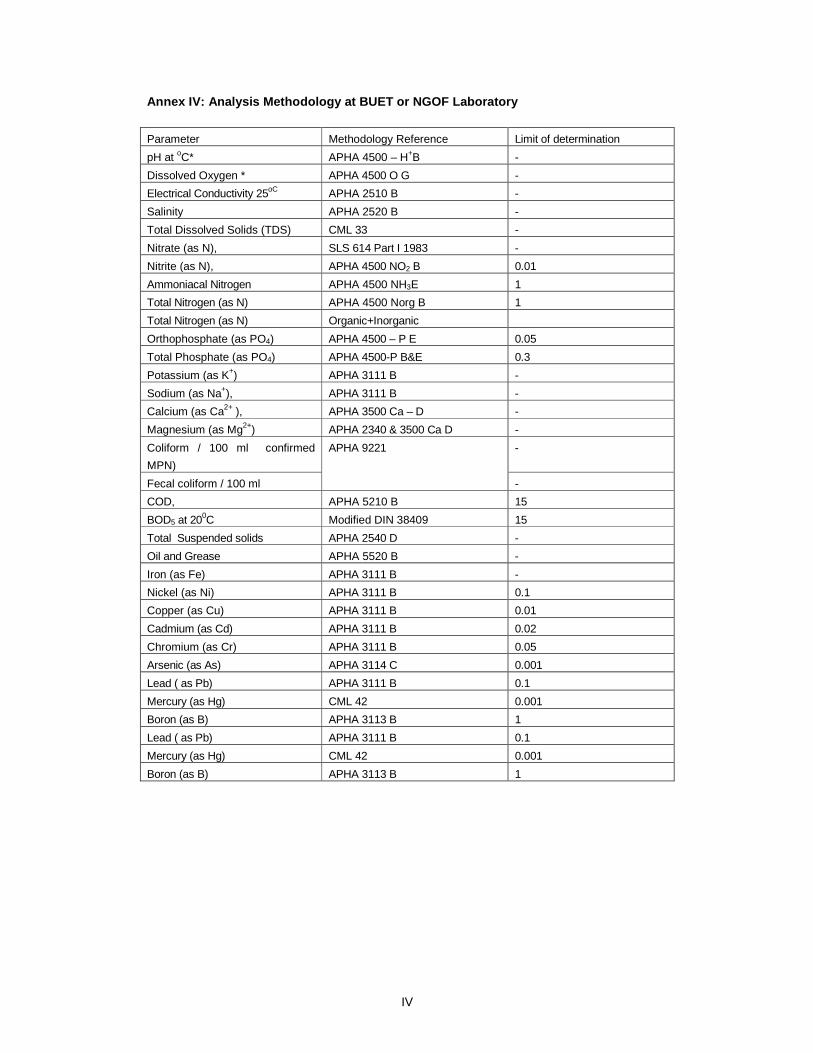
Annex IV: Analysis Methodology at BUET or NGOF Labo ratory
Parameter Methodology Reference Limit of determination
pH at oC* APHA 4500 – H+B -
Dissolved Oxygen * APHA 4500 O G -
Electrical Conductivity 25oC APHA 2510 B -
Salinity APHA 2520 B -
Total Dissolved Solids (TDS) CML 33 -
Nitrate (as N), SLS 614 Part I 1983 -
Nitrite (as N), APHA 4500 NO2 B 0.01
Ammoniacal Nitrogen APHA 4500 NH3E 1
Total Nitrogen (as N) APHA 4500 Norg B 1
Total Nitrogen (as N) Organic+Inorganic
Orthophosphate (as PO4) APHA 4500 – P E 0.05
Total Phosphate (as PO4) APHA 4500-P B&E 0.3
Potassium (as K+) APHA 3111 B -
Sodium (as Na+), APHA 3111 B -
Calcium (as Ca2+ ), APHA 3500 Ca – D -
Magnesium (as Mg2+) APHA 2340 & 3500 Ca D -
Coliform / 100 ml confirmed
MPN)
-
Fecal coliform / 100 ml
APHA 9221
-
COD, APHA 5210 B 15
BOD5 at 200C Modified DIN 38409 15
Total Suspended solids APHA 2540 D -
Oil and Grease APHA 5520 B -
Iron (as Fe) APHA 3111 B -
Nickel (as Ni) APHA 3111 B 0.1
Copper (as Cu) APHA 3111 B 0.01
Cadmium (as Cd) APHA 3111 B 0.02
Chromium (as Cr) APHA 3111 B 0.05
Arsenic (as As) APHA 3114 C 0.001
Lead ( as Pb) APHA 3111 B 0.1
Mercury (as Hg) CML 42 0.001
Boron (as B) APHA 3113 B 1
Lead ( as Pb) APHA 3111 B 0.1
Mercury (as Hg) CML 42 0.001
Boron (as B) APHA 3113 B 1

V
Annex V: Baseline Water Quality Results 25 th February 2007 Parameter Unit A B C D E G H I J X Y
pH at ambient temperature 6.85 6.70 5.45 6 6.67 6.75 6.85 7.01 7.01 7 7
Temperature 0C 21 21 22 27 25 23 24 24 25 25 23
Total Dissolved Solids (TDS) mg/L 1040 920 1200 1000 1160 1200 1040 960 1040 * *
Electrical Conductivity at 25oC µS/cm 1200 1152 1315 1246 1255 1501 1535 1589 1575 * *
Nitrate (as N), mg/L 0.2 0.2 0.2 0.3 1.8 0.3 0.3 0.2 0.2 0.4 0.2
Nitrite (as N), mg/L 0.006 0.006 0.004 0.146 0.796 0.008 0.006 0.005 0.005 0.032 0.012
Free Ammonia mg/L 14.5 15.0 30.4 24.5 18 37 36.2 38.8 37 1.15 1.9
Total Nitrogen (as N) mg/L 17.0 27.0 37.0 28 27 42 54 43 41 2 3.2
Orthophosphate (as PO4) mg/L 4.30 4.35 9.05 6.48 5.18 10.83 9.87 10.28 10.39 0.16 0.12
Total Phosphorous (as P) mg/L 4.85 4.62 9.72 8.9 6.35 11.4 9.87 12.2 14 0.42 0.61
Boron mg/l 0.5 0.1 <0.1 0.1 0.2 0.2 0.1 0.3 0.3 <0.1 <0.1
Potassium mg/l * * * 21.4 26.8 28.6 26.8 28.6 35.7 1.6 2.7
Sodium (as Na), mg/L * * * 88.9 106.7 111.1 111.1 115.6 120 48.9 71.7
Calcium (as Ca ), mg/L * * * 67.71 88.85 88.31 108.45 113.02 115.95 47.99 104.46
Magnesium (as Mg) mg/L * * * 18.9 27.56 24.08 25.61 28.69 30.63 9.25 26.71
Sodium Absorption Ratio (SAR)1 calculated mmol/l 13.51 13.99 14.82 13.57 13.73 14.02
Coliform 190.0x10⁶ 174.0 x10⁶ 19.4 x10⁶ 3.0X10⁶ 1.6 X10⁶ 14.2 X10⁶ 18.2 X10⁶ 16.6 X10⁶ 13.4 X10⁶ 49 20
Fecal coliform
CFU/
100 ml 23.9 x10⁶ 11.9 x10⁶ 23.5 x10⁶ 23.5X10³ 3.9X10³ 3.9X10³ 7.8X10³ 439.2X10³ 6.2 X10⁶ Nil Nil
COD, mgO2/L 200 124 261 83 151 241 185 153 189 12 15
BOD5 at 200C mgO2/L 65 52 112 22 52 112 70 72 80 <1 <1
DO mgO2/L 0.9 0.9 0.0 2 2 1.4 0.0 1.8 0.2 1.4 0.8
Total Suspended solids mg/l 90 70 180 80 160 140 90 40 110 5 20
Iron (as Fe) mg/l * * * 0.8 5.27 2.4 1.48 1.45 2.28 4.49 6.95
Mercury (Hg) µg/l 2.0 1.97 1.10 1.44 1.29 0.96 1.16 2.5 1.81 0.9 0.90
Arsenic (As) mg/l * * * 0.005 0.007 <0.003 <0.003 <0.003 0.005 0.019 0.047
Cadmium (Cd) mg/l * * * 0.003 0.007 0.004 0.008 0.006 0.006 0.003 0.007
Chromium (Cr) mg/l * * * <0.02 0.04 0.05 0.08 0.09 0.12 0.11 0.1
Copper (Cu) mg/l * * * 0.04 0.06 0.02 0.03 0.04 0.04 0.02 0.03
Lead (Pb) mg/l * * * 0.31 0.4 0.4 0.36 1.03 0.44 0.48 0.55
Nickel (Ni) mg/l * * * <0.02 <0.02 <0.02 0.03 ,0.02 <0.04 <0.02 <0.02
Some samples not tested for certain parameters (due to budgetary constraints). Note: SAR was calculated only for the drain water where the Ca, Mg and Na were tested.
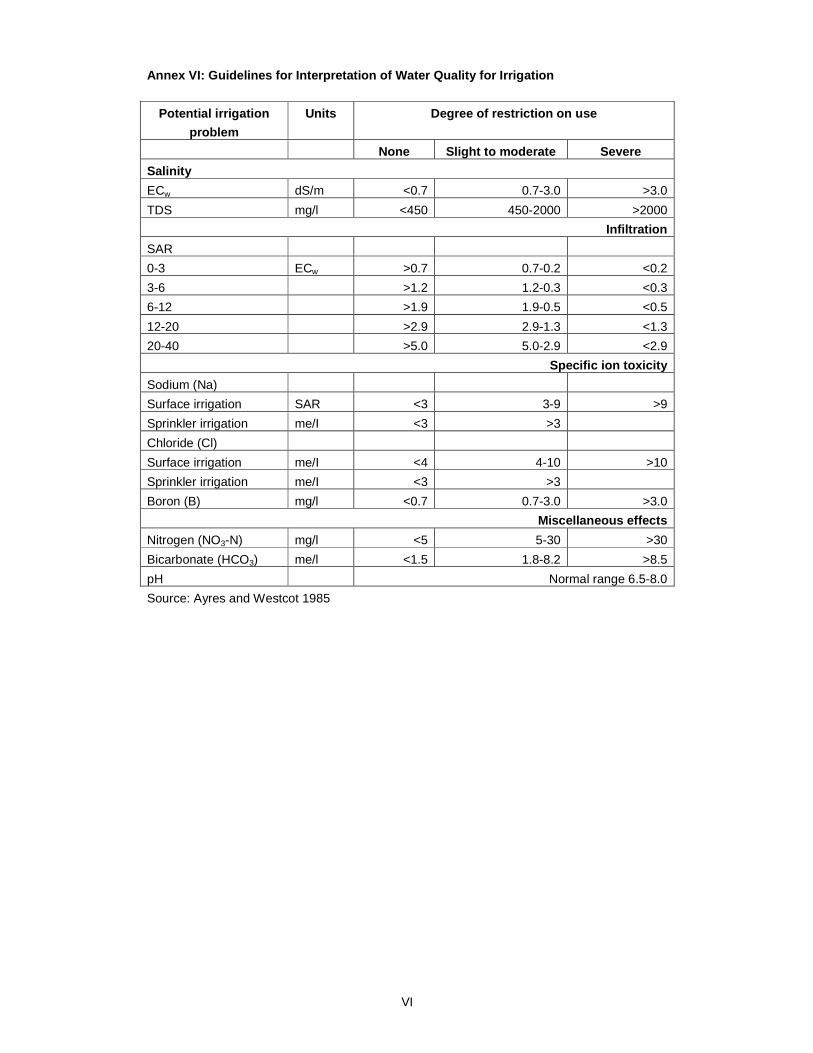
VI
Annex VI: Guidelines for Interpretation of Water Qu ality for Irrigation
Potential irrigation
problem
Units Degree of restriction on use
None Slight to moderate Severe
Salinity
ECw dS/m <0.7 0.7-3.0 >3.0
TDS mg/l <450 450-2000 >2000
Infiltration
SAR
0-3 ECw >0.7 0.7-0.2 <0.2
3-6 >1.2 1.2-0.3 <0.3
6-12 >1.9 1.9-0.5 <0.5
12-20 >2.9 2.9-1.3 <1.3
20-40 >5.0 5.0-2.9 <2.9
Specific ion toxicity
Sodium (Na)
Surface irrigation SAR <3 3-9 >9
Sprinkler irrigation me/I <3 >3
Chloride (Cl)
Surface irrigation me/I <4 4-10 >10
Sprinkler irrigation me/I <3 >3
Boron (B) mg/l <0.7 0.7-3.0 >3.0
Miscellaneous effects
Nitrogen (NO3-N) mg/l <5 5-30 >30
Bicarbonate (HCO3) me/l <1.5 1.8-8.2 >8.5
pH Normal range 6.5-8.0
Source: Ayres and Westcot 1985
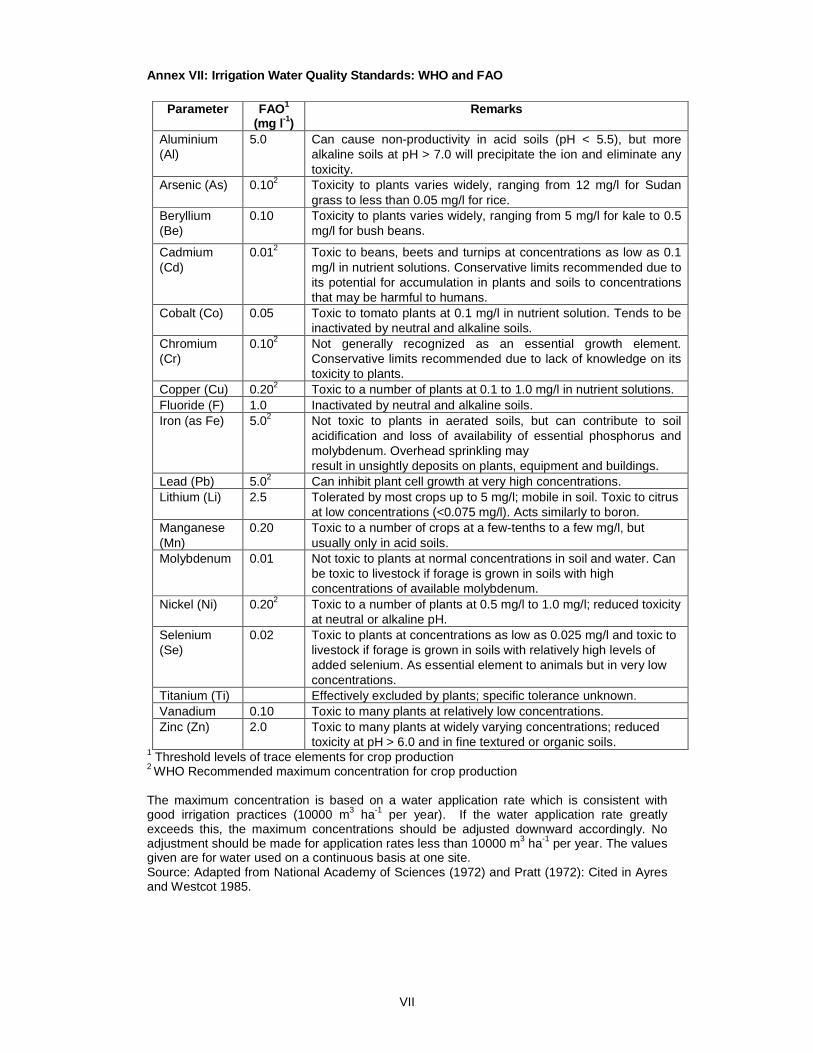
VII
Annex VII: Irrigation Water Quality Standards: WHO and FAO
Parameter
FAO1
(mg l -1) Remarks
Aluminium (Al)
5.0 Can cause non-productivity in acid soils (pH < 5.5), but more alkaline soils at pH > 7.0 will precipitate the ion and eliminate any toxicity.
Arsenic (As) 0.102 Toxicity to plants varies widely, ranging from 12 mg/l for Sudan grass to less than 0.05 mg/l for rice.
Beryllium (Be)
0.10 Toxicity to plants varies widely, ranging from 5 mg/l for kale to 0.5 mg/l for bush beans.
Cadmium (Cd)
0.012 Toxic to beans, beets and turnips at concentrations as low as 0.1 mg/l in nutrient solutions. Conservative limits recommended due to its potential for accumulation in plants and soils to concentrations that may be harmful to humans.
Cobalt (Co) 0.05 Toxic to tomato plants at 0.1 mg/l in nutrient solution. Tends to be inactivated by neutral and alkaline soils.
Chromium (Cr)
0.102 Not generally recognized as an essential growth element. Conservative limits recommended due to lack of knowledge on its toxicity to plants.
Copper (Cu) 0.202 Toxic to a number of plants at 0.1 to 1.0 mg/l in nutrient solutions. Fluoride (F) 1.0 Inactivated by neutral and alkaline soils. Iron (as Fe) 5.02 Not toxic to plants in aerated soils, but can contribute to soil
acidification and loss of availability of essential phosphorus and molybdenum. Overhead sprinkling may result in unsightly deposits on plants, equipment and buildings.
Lead (Pb) 5.02 Can inhibit plant cell growth at very high concentrations. Lithium (Li) 2.5 Tolerated by most crops up to 5 mg/l; mobile in soil. Toxic to citrus
at low concentrations (<0.075 mg/l). Acts similarly to boron. Manganese (Mn)
0.20 Toxic to a number of crops at a few-tenths to a few mg/l, but usually only in acid soils.
Molybdenum 0.01 Not toxic to plants at normal concentrations in soil and water. Can be toxic to livestock if forage is grown in soils with high concentrations of available molybdenum.
Nickel (Ni) 0.202 Toxic to a number of plants at 0.5 mg/l to 1.0 mg/l; reduced toxicity at neutral or alkaline pH.
Selenium (Se)
0.02 Toxic to plants at concentrations as low as 0.025 mg/l and toxic to livestock if forage is grown in soils with relatively high levels of added selenium. As essential element to animals but in very low concentrations.
Titanium (Ti) Effectively excluded by plants; specific tolerance unknown. Vanadium 0.10 Toxic to many plants at relatively low concentrations. Zinc (Zn) 2.0 Toxic to many plants at widely varying concentrations; reduced
toxicity at pH > 6.0 and in fine textured or organic soils. 1 Threshold levels of trace elements for crop production 2 WHO Recommended maximum concentration for crop production The maximum concentration is based on a water application rate which is consistent with good irrigation practices (10000 m3 ha-1 per year). If the water application rate greatly exceeds this, the maximum concentrations should be adjusted downward accordingly. No adjustment should be made for application rates less than 10000 m3 ha-1 per year. The values given are for water used on a continuous basis at one site. Source: Adapted from National Academy of Sciences (1972) and Pratt (1972): Cited in Ayres and Westcot 1985.
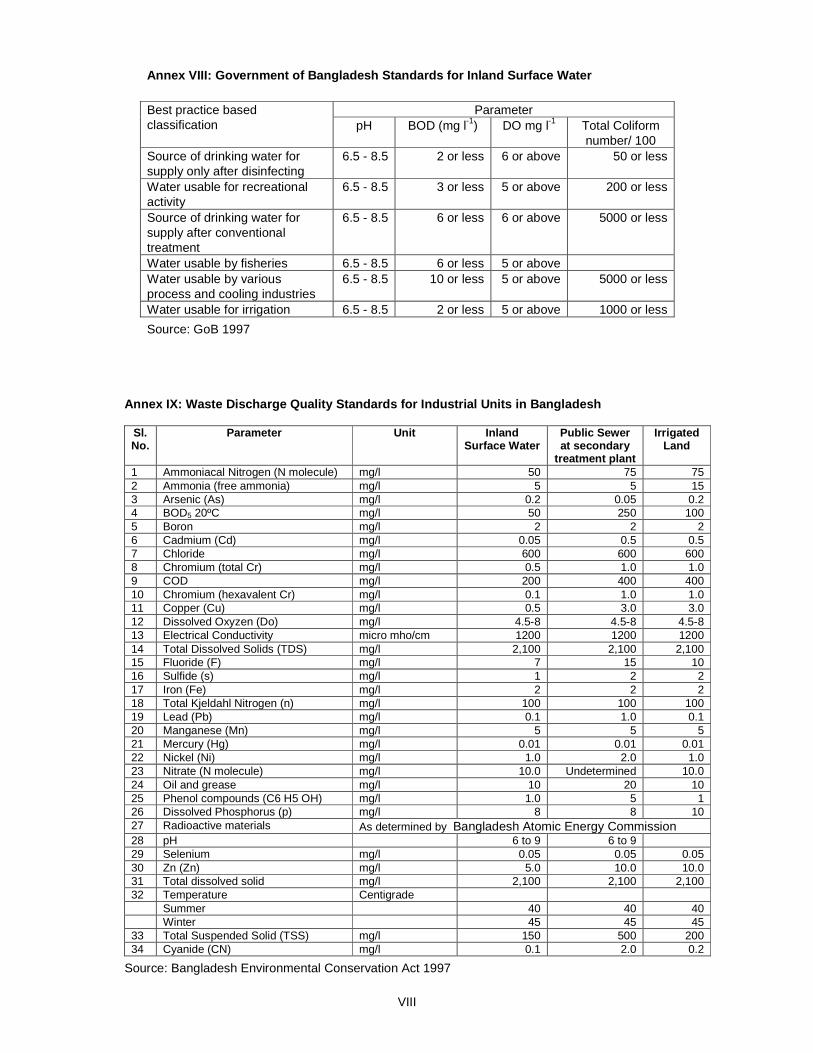
VIII
Annex VIII: Government of Bangladesh Standards for Inland Surface Water
Parameter Best practice based
classification pH BOD (mg l-1) DO mg l-1 Total Coliform number/ 100
Source of drinking water for supply only after disinfecting
6.5 - 8.5 2 or less 6 or above 50 or less
Water usable for recreational activity
6.5 - 8.5 3 or less 5 or above 200 or less
Source of drinking water for supply after conventional treatment
6.5 - 8.5 6 or less 6 or above 5000 or less
Water usable by fisheries 6.5 - 8.5 6 or less 5 or above Water usable by various process and cooling industries
6.5 - 8.5 10 or less 5 or above 5000 or less
Water usable for irrigation 6.5 - 8.5 2 or less 5 or above 1000 or less
Source: GoB 1997
Annex IX: Waste Discharge Quality Standards for Ind ustrial Units in Bangladesh
Sl. No.
Parameter Unit Inland Surface Water
Public Sewer at secondary
treatment plant
Irrigated Land
1 Ammoniacal Nitrogen (N molecule) mg/l 50 75 75 2 Ammonia (free ammonia) mg/l 5 5 15 3 Arsenic (As) mg/l 0.2 0.05 0.2 4 BOD5 20ºC mg/l 50 250 100 5 Boron mg/l 2 2 2 6 Cadmium (Cd) mg/l 0.05 0.5 0.5 7 Chloride mg/l 600 600 600 8 Chromium (total Cr) mg/l 0.5 1.0 1.0 9 COD mg/l 200 400 400 10 Chromium (hexavalent Cr) mg/l 0.1 1.0 1.0 11 Copper (Cu) mg/l 0.5 3.0 3.0 12 Dissolved Oxyzen (Do) mg/l 4.5-8 4.5-8 4.5-8 13 Electrical Conductivity micro mho/cm 1200 1200 1200 14 Total Dissolved Solids (TDS) mg/l 2,100 2,100 2,100 15 Fluoride (F) mg/l 7 15 10 16 Sulfide (s) mg/l 1 2 2 17 Iron (Fe) mg/l 2 2 2 18 Total Kjeldahl Nitrogen (n) mg/l 100 100 100 19 Lead (Pb) mg/l 0.1 1.0 0.1 20 Manganese (Mn) mg/l 5 5 5 21 Mercury (Hg) mg/l 0.01 0.01 0.01 22 Nickel (Ni) mg/l 1.0 2.0 1.0 23 Nitrate (N molecule) mg/l 10.0 Undetermined 10.0 24 Oil and grease mg/l 10 20 10 25 Phenol compounds (C6 H5 OH) mg/l 1.0 5 1 26 Dissolved Phosphorus (p) mg/l 8 8 10 27 Radioactive materials As determined by Bangladesh Atomic Energy Commission 28 pH 6 to 9 6 to 9 29 Selenium mg/l 0.05 0.05 0.05 30 Zn (Zn) mg/l 5.0 10.0 10.0 31 Total dissolved solid mg/l 2,100 2,100 2,100 32 Temperature Centigrade Summer 40 40 40 Winter 45 45 45 33 Total Suspended Solid (TSS) mg/l 150 500 200 34 Cyanide (CN) mg/l 0.1 2.0 0.2
Source: Bangladesh Environmental Conservation Act 1997

IX
Annex X: Fertilizer Equivalent of Human Excreta
Nutrient in Kg
Element Nutrient in urine
(500 l/year)
Nutrient in faeces
(50 l/year)
Total Required for 250 kg
of cereal crops
N Nitrogen 4.0 0.5 4.5 5.6
P Phosphorus 0.4 0.2 0.6 0.7
K Potassium 0.9 0.3 1.2 1.2
Source: Strauss, 2000
Annex XI: An Approximate Quantity and Quality Break down of Human Excreta
Quality and consistency Faeces Urine Combined
Gram/capia/day (wet) 250 1200 1450
Gram/capia/day (dry) 50 60 110
Chemical composition (% of dry solids)
Organic matter 92 75 83
Carbon 48 13 29
Nitrogen 4-7 14-18 9-12
Phosphorus 4 3.7 3.8
Potassium 1.6 3.7 2.7
Comparison with other wastes (% of dry solids)
Human excreta 9-12 3.8 2.7
Plant matter 1-11 0.5-2.8 1.1-11
Pig manure 4-6 3-4 2.5-3
Cow manure 2.5 1.8 1.4
Source: www.water.usgs.gov

X
Annex XII: Drinking Water Quality Standards Water quality parameters Unit Bangladesh
standards WHO guideline values
1993 Aluminum mg/l 0.2 0.2 Ammonia (NH3) mg/l 0.5 1.5 Arsenic mg/l 0.05 0.01 Barium mg/l 0.01 0.7 Benzene mg/l 0.01 0.01 BOD5 20ºC mg/l 0.2 Boron mg/l 1.0 0.3 Cadmium mg/l 0.005 0.003 Calcium mg/l 75 Chloride mg/l 150-600* 250 Chlorinated alkenes Carbon tetrachloride mg/l 0.01 0.002 1,1 Dichloroethylene mg/l 0.001 1,2 Dichloroethane mg/l 0.03 0.03 Tetrachloroehylene mg/l 0.03 Trichlosoethylene mg/l 0.09 Chlorinated phenols Pentachlorophenol mg/l 0.03 2,4,6 Trichlorophenol mg/l 0.03 0.02 Chlorine (residual) mg/l 0.2 0.6 to 1.0 Chloroform mg/l 0.09 0.2 Chromium (hexavalent) mg/l 0.05 Chromium (total) mg/l 0.05 0.05 Chemical oxygen demand mg/l 4 Coliform (faecal) N/100ml 0 0 Coliform (total) N/100ml 0 0 Colour Hazen Unit 15 15 Copper mg/l 1 1 Cyanide mg/l 0.1 0.07 Detergents mg/l 0.2 Dissolved oxygen mg/l 6 Flouried mg/l 1 1.5 Hardness (as CaCO3) mg/l 200 to 500 Iron mg/l 0.3 to 1.0 0.3 Kjehldal nitrogen (total) mg/l 1 Lead mg/l 0.05 0.01 Magesium mg/l 30 to 35 Manganese mg/l 0.1 0.1 Mercury mg/l 0.001 0.001 Nickel mg/l 0.1 0.02 Nitrate mg/l 10 50 Nitrite mg/l <1 3 Odour mg/l Odourless Oil and grease mg/l 0.01 pH 6.5 to 8.5 Phenolic compounds mg/l 0.002 Phosphate mg/l 6 Phosphours mg/l 0 Potassium mg/l 12 Radioactive substances: Alfa radiation Bq/l 0.01 Beta radiation Bq/l 0.1 Selenium mg/l 0.01 0.01 Silver mg/l 0.02 Sodium mg/l 200 200 Suspended solids mg/l 10 Sulphide mg/l 0 Sulphate mg/l 400 250 Total dissolved solids mg/l 1000 1000 Temperature ºC 20 to 30 Tin mg/l 2 Turbidity JTU 10 5 Zinc mg/l 5 3

XI
Annex XIII: Excreted organism concentration in wast ewater
Organism Numbers in wastewater (per litre)
Bacteria
Thermotolerant coliforms 108 - 1010
Campylobacter jejuni 10 – 104
Salmonella spp. 1 - 105
Shigella spp. 10 - 104
Vibrio cholerae 102 - 105
Helminths
Ascaris lumbricoides 1 - 103
Ancylostoma duodenale/
Necator americanus
1 - 103
Trichuris trichiura 1 - 102
Schistosoma mansoni ND
Protozoa
Cryptosporidium parvum 1 - 104
Entamoeba Histolytica 1 - 102
Giardia intestinalis 102 - 105
Viruses
Enteric viruses 105 - 106
Rotavirus 102 - 105
Source: WHO 2006