Baseline Technical Report prepared by EDOREN on behalf of ... · and providing information on the...
426
Evaluation of the Girl’s Education Project 3 Baseline Technical Report prepared by EDOREN on behalf of UNICEF GEP3 Tom Pellens, Rachel Outhred, Zara Majeed, Andrej Kveder, Michele Binci, Johanna Wallin, Fatimah Kelleher, Adrian Beavis and Shefali Rai September 2016
Transcript of Baseline Technical Report prepared by EDOREN on behalf of ... · and providing information on the...
Evaluation of the Girl’s Education Project 3
Baseline Technical Report prepared by EDOREN
on behalf of UNICEF GEP3
Tom Pellens, Rachel Outhred, Zara Majeed, Andrej Kveder, Michele Binci, Johanna
Wallin, Fatimah Kelleher, Adrian Beavis and Shefali Rai
September 2016

Acknowledgements
We are very grateful to the government departments and staff in the five project states, as well as at the
national level, who facilitated the baseline research and shared their perspectives with the evaluation team; in particular, State Ministries of Education (SMoEs), State Universal Basic Education Boards (SUBEBS), State Agencies for Mass Education (SAMEs), Colleges of Education, and the Gender Unit of the Federal Ministry of Education (FME).
We would like to thank the UK Department for International Development (DFID), which commissioned this
independent evaluation – particularly DFID Education Adviser Ms Laura Brannelly and the DFID Evaluation Advisers for Nigeria, Ms Kristen Hopkins and Mr Laurie Thompson, for useful discussions and advice on the evaluation design and implementation.
Our thanks also go to the implementing organisation, the United Nations Children’s Fund (UNICEF): Terry
Durnnian (Senior Education Specialist), Charles Avelino (Education Specialist) and Alassane Ouedraogo (Monitoring and Evaluation Officer) gave much of their time to the evaluation team in order to participate in the evaluation design and to share information on the Girls Education Project Phase 3 (GEP3)
programme. Special thanks are due to the GEP3 state teams – in particular, the state project coordinators, and UNICEF staff in the GEP3 states, for assistance in accessing information and arranging meetings with
key informants. In addition, we thank the Reading and Numeracy Activity (RANA) implementation team and monitoring and evaluation (M&E) support staff for coordinating the RANA roll-out with the evaluation team and providing information on the RANA project.
For advice on the development of the Hausa pupil learning assessment we are grateful to Professor Malami
Buba, from Sokoto State University. We are also grateful to Dr David Johnson of the Department of Education at University of Oxford, who designed the original Teacher Development Needs Assessments
(TDNAs) for GEP, which served as a basis for the development of the teacher competency and skills assessment, as well as to Adrian Beavis, for his work on pre-literacy item development and teacher motivation instrument development.
This evaluation is being carried out with full independence by the EDOREN (Education Data, Research and Evaluation in Nigeria) project. The EDOREN team responsible for the design of the evaluation and the
implementation and analysis of the baseline data consisted of: Tom Pellens (Team Leader and Evaluation Specialist); Rachel Outhred (Project Manager, Senior Education Specialist, Qualitative Design Lead and Lead for Instrument Development); Zara Majeed (Instrument Development and Quantitative Analysis Support); Andrej Kveder (Survey Technical Lead); Michele Binci (Econometrician); Fatimah Kelleher (Qualitative Lead); Johanna Wallin (Qualitative Researcher); Victor Steenbergen (Qualitative Researcher); and Shefali Rai
(Researcher). The core team was supported by a group of specialist advisers: Adrian Beavis, David Megill, Juste Nitiema, Oladele Akogun, Stuart Cameron and Sourovi De. Quality assurance of the technical report
was carried out by Monazza Aslam. The key informant interviews (KIIs) for the baseline theory of change assessment were conducted with the assistance of Dr Hafsat Lawal Kontagora.
The quantitative baseline fieldwork was conducted by the Oxford Policy Management (OPM) Nigeria office survey team, which included: Femi Adegoke (Survey Manager); Arogendade Ekundayo (Field Manager);
Evaluation of the Girl’s Education Project 3
Disclaimer EDOREN is a consortium of leading organisations in international development and education: Oxford Policy Management (OPM), and the Institute of Development Studies (IDS) at the University of Sussex, and is supported by UK Aid. EDOREN cannot be held responsible for errors or any consequences arising from the use of information contained in this report. Any views and opinions expressed do not necessarily reflect those of OPM, IDS and EDOREN or any other contributing organisation.
EDOREN No 2, 16 Mafemi Crescent Tel +234 810 727 8718 Education Data, Research & Evaluation in Nigeria Utako Tel +234 817 667 8243 Abuja, Nigeria Email [email protected] Website www.edoren.org
© EDOREN 3
Babatunde Akano (Data Manager); and Bukola Adekolu (Survey Administrator). The fieldwork was completed successfully thanks to the hard work of the field enumerators. Our special thanks therefore go
to: Godwin Adams, Kogent Dauda, Fahad Lawal, Muhammad Kassim, Ladidi Lilian Bulus, Gloria Olisenekwu, Racheal Linus Avindia, Matthew Omaye, Daniel Omokagbo Ayala, Armayau Sallau, Miriam Ukemenam, Mercy Abalaku, Gabriel Panshak Pandukur, Eunice Atajiri, Mohammed Lawan Kagu, Musa Ahmed Mutallab, Sandra Wilson, Celestine Aninna, Abdulhamid Abubakar, Oluwaseyi Moses, Lukman Abubakar Abdullahi, Danlami Useni Nakoto, Precious Chrysanctus, Josephine Malum, Gloria Obiageli Utti, Iyabo Abulganiyu,
Elizabeth Bello, Hajara Nakkudu, Mariam Bako, Abubakar Shehu, Raliya Suliaman, Jummai Chabo, Annah Joseph, Veronic Michael, Grace Bala, Ruth Abbah Jonah, Agatha Tobias, Bridget Bakar, Oluwaseun Temtope Balogun, Henrietta Habu, Janet Jammai Julius, Mercy Musa, Lilian Nakoto, Ruth Vincent, Charity Andrew,
Tabitha Chaamba, Fatima Hamza, Ruth Agono, Blessing Davo, Aisha Musa, Falalu Ma’sud Muhammed, Salome Sanda, Marleeyah Suleiman, Agatha Leo, Zainab Lawal, Aisha Abu, Paul Susan Galadima, Hassana Garba, Saratu Tebu, Saraya Dauda Loya, Nazeer Muhamman, Habiba Muhammed, Hassanu Hashim, Laraba
Iliya and Rotmwa Ishaya Bangson.
The qualitative fieldwork was conducted by a team of national qualitative researchers working with the
EDOREN qualitative research team, and was completed due to their dedication and great efforts. In this regard we would like to thank Yusuf Ibrahim, Dr Adamu Babikkoi, Jiddere Musa Kaibo, Halima Sanni, Dr Amminu Dukku, Nafinatu Abdullahi, Felicia Yakubu and Madara Adamu.
Needless to say, during the field work state education officers, local government officers, community leaders, integrated Qur’anic school (IQS) proprietors, head teachers, teachers, pupils and parents played a
crucial role by giving their time so as to allow the impact evaluation baseline research to be conducted. We would like to extend a big thank you to them all.
For further information, contact the GEP3 Evaluation Project Manager, Dr Rachel Outhred ([email protected]), or the EDOREN Country office ([email protected]). The contact person at UNICEF is Terry Durnnian ([email protected]), and the responsible DFID adviser is Laura Brannelly (L-
Evaluation of the Girl’s Education Project 3
Disclaimer EDOREN is a consortium of leading organisations in international development and education: Oxford Policy Management (OPM), and the Institute of Development Studies (IDS) at the University of Sussex, and is supported by UK Aid. EDOREN cannot be held responsible for errors or any consequences arising from the use of information contained in this report. Any views and opinions expressed do not necessarily reflect those of OPM, IDS and EDOREN or any other contributing organisation.
EDOREN No 2, 16 Mafemi Crescent Tel +234 810 727 8718 Education Data, Research & Evaluation in Nigeria Utako Tel +234 817 667 8243 Abuja, Nigeria Email [email protected] Website www.edoren.org
© EDOREN 5
Executive summary
This report presents the findings of quantitative and qualitative baseline data collection undertaken by
Education Data, Research and Evaluation in Nigeria (EDOREN) as part of a multi-year evaluation of the Girls Education Project Phase 3 (GEP3). This is the full technical report of the baseline evaluation, which describes the methodology for the evaluation and the full set of quantitative and qualitative findings in detail. It is complemented by a synthesis document that summarises and collates the baseline evidence for a larger audience.
GEP3 is an eight-year project (2012–20) that seeks to improve school access, retention and learning outcomes for girls in five northern Nigerian states. It is managed by the UN Children’s Fund (UNICEF) and funded by the UK Department for International Development (DFID). Between 2014 and 2017 the project is
piloting a series of interventions in primary schools and Integrated Qur’anic schools (IQS). Those most effective in improving education outcomes for girls will be scaled up. A key focus of the evaluation is to inform decisions related to the scale-up of GEP3’s interventions.
The scope of the evaluation involves:
1. a high-level explication and examination of GEP3’s theory of change (ToC); 2. an impact evaluation of GEP3’s early learning intervention; and
3. a performance evaluation of GEP3’s support to IQSs.
The baseline evaluation has three core goals: first, to capture the education situation, and perceptions of this situation, at the start of the re-designed GEP3, so that changes can be measured during follow-up data
collection rounds, and project attribution or contribution can be assessed; second, to answer evaluation
questions about the relevance of the project; and third, to provide evidence to inform GEP3’s ToC and project implementation.
Examination of GEP3’s ToC
Methodology
The baseline assessment of GEP3’s ToC focuses on two evaluation questions:
• How plausible is GEP3’s ToC in the context of the GEP3 states?
• How appropriate are GEP3’s interventions in terms of the implementation strategy?
Evaluation of the Girl’s Education Project 3
Disclaimer EDOREN is a consortium of leading organisations in international development and education: Oxford Policy Management (OPM), and the Institute of Development Studies (IDS) at the University of Sussex, and is supported by UK Aid. EDOREN cannot be held responsible for errors or any consequences arising from the use of information contained in this report. Any views and opinions expressed do not necessarily reflect those of OPM, IDS and EDOREN or any other contributing organisation.
EDOREN No 2, 16 Mafemi Crescent Tel +234 810 727 8718 Education Data, Research & Evaluation in Nigeria Utako Tel +234 817 667 8243 Abuja, Nigeria Email [email protected] Website www.edoren.org
© EDOREN 6
The plausibility of the ToC is examined by reviewing stakeholders’ understanding of intended outcomes, interrogating the logic of the outcome chain, and identifying factors that have a key bearing on the
achievement of the stated outcomes. GEP3’s implementation strategy is assessed on three dimensions: stakeholder involvement, implementation capacity and the extent to which the project focuses on under-served groups. This assessment is based on key informant interviews (KIIs) conducted largely with GEP3 state-level stakeholders in August 2015. KIs were purposively selected, with the support of the GEP3 state teams, based on their knowledge of the project.
Key findings
The plausibility of GEP3’s ToC is supported by its coherent logic, synergies across interventions, and stakeholders’ common understanding of its main objectives – although there are caveats here. Synergies between the project’s interventions could enhance its impact, but also present risks, in that
implementation difficulties on one dimension of the project could undermine its performance on other
fronts. A second key caveat is that while stakeholders understand GEP3’s main objectives, the project’s operational design is not always understood. For instance, at the time of the interviews government stakeholders involved in teacher training did not yet understand what capacities need to be developed, in
what ways, and when. This could make it difficult for them to assess GEP3’s performance or be held to account for the results achieved.
Stakeholders noted that the project’s objective of increasing girls’ enrolment is feasible, particularly in primary education, but that improvements in retention and learning outcomes will be harder to achieve. Stakeholders were of the view that enrolment drives and cash transfers are both effective strategies that
address important barriers to girls’ access to education, and that they complement one another. Retention
is held to be more challenging as it is shaped by supply-side factors, such as the presence of sufficient
teachers, the quality of teaching, and the quality of the school environment. Stakeholders were less likely to recognise learning as a key expected project outcome. When they did, they noted that learning
outcomes are more difficult to improve than access, owing to the low quality of teaching, particularly in rural areas, and insufficient investment in the supply of quality education. There was wide consensus amongst KIs that tackling the quality of teaching and teachers is central to improving learning outcomes. This is consistent with the focus on this variable in GEP3’s ToC.
A wide range of stakeholders endorsed the importance of the early learning intervention. Stakeholders support the emphasis on literacy during early grades as a foundational skill. However, there is no consensus among stakeholders about the extent to which the use of a mother tongue is a necessary condition to improve learning outcomes. The baseline findings of the early learning evaluation confirm that Hausa is the
Evaluation of the Girl’s Education Project 3
Disclaimer EDOREN is a consortium of leading organisations in international development and education: Oxford Policy Management (OPM), and the Institute of Development Studies (IDS) at the University of Sussex, and is supported by UK Aid. EDOREN cannot be held responsible for errors or any consequences arising from the use of information contained in this report. Any views and opinions expressed do not necessarily reflect those of OPM, IDS and EDOREN or any other contributing organisation.
EDOREN No 2, 16 Mafemi Crescent Tel +234 810 727 8718 Education Data, Research & Evaluation in Nigeria Utako Tel +234 817 667 8243 Abuja, Nigeria Email [email protected] Website www.edoren.org
© EDOREN 7
language of the immediate environment in Katsina and Zamfara, but they also highlight that Hausa knowledge among teachers is low. This needs to be taken into account in the design of the early learning
intervention.
GEP3’s interventions to support school governance are considered to be largely promising, although there are some risks related to the targeted empowerment of School-Based Management Committees (SBMCs). SBMC empowerment is both a pivotal intermediary outcome in GEP3’s ToC, as well as one of its most precarious links. The expectations placed on SBMCs in terms of roles and responsibilities are very high
even though these organisations are often starting from a very low base, particularly in IQSs. At the state level, High-Level Women Advocate (HiLWA) members engage with decision-makers and school
communities and have the potential for indirect influence. The Girls Education Steering Committee (GESC) also has the potential to support governance, to the extent that it is active, sufficiently locally owned and addresses key challenges. GEP3’s support to the education management information system (EMIS) and Annual School Census (ASC) will plausibly improve data reliability, although this will not necessarily lead to
data being used in the policy-making process.
The findings point to some specific risks to the scale-up process. The scale-up process is reliant on
government funding. However, there is significant uncertainty about the extent to which this funding will be forthcoming. This is despite certain supportive measures being introduced as part of the recent design of GEP3, notably an increased emphasis on high-level advocacy and a focus on a more manageable set of
outcomes. The scale-up of GEP3’s support to IQSs is particularly uncertain because the institutional mandate over IQSs is unclear, the number of well-established IQSs available for scale-up is limited, and
there are supply-side constraints, particularly with regards to facilitators. One further constraint is that stakeholders do not have a clear understanding of how scale-up is expected to take place.
Overall, the baseline findings point to a number of risks to the causal links in the ToC. Critical assumptions related to the management and resourcing of the education system are highly uncertain, in particular the release of government funding, school investment and human resource capacity remaining on a par with
increased enrolment, effective monitoring at the school and intervention levels, and SBMCs’ ability to play the wide-ranging role that is being sought as part of the project.
Baseline findings on implementation capacity are mixed. The project makes an appreciable effort to involve a variety of stakeholders. However, their involvement in operational planning is uneven across interventions. Government capacity building is embedded in project design, but an effective system is
needed to identify and address the most important capacity development needs. Monitoring capacity is rightly emphasised in GEP3’s re-design but its operationalisation has yet to advance. With regards to
Evaluation of the Girl’s Education Project 3
Disclaimer EDOREN is a consortium of leading organisations in international development and education: Oxford Policy Management (OPM), and the Institute of Development Studies (IDS) at the University of Sussex, and is supported by UK Aid. EDOREN cannot be held responsible for errors or any consequences arising from the use of information contained in this report. Any views and opinions expressed do not necessarily reflect those of OPM, IDS and EDOREN or any other contributing organisation.
EDOREN No 2, 16 Mafemi Crescent Tel +234 810 727 8718 Education Data, Research & Evaluation in Nigeria Utako Tel +234 817 667 8243 Abuja, Nigeria Email [email protected] Website www.edoren.org
© EDOREN 8
equity, several GEP3 interventions are designed to be equity enhancing, but it is unclear whether the most vulnerable households and groups are able to benefit from and actively participate in GEP3 interventions.
Notably, GEP3 is no longer operating in Local Government Areas (LGAs) with the highest gender gap in all states.
Impact evaluation of GEP3’s early learning intervention
GEP3’s early learning intervention aims to improve the early learning skills of children in primary Grades 1 to 3 (Primary 1 (P1)– Primary 3 (P3)) in the mother tongue, while also preparing children to learn with
English as a language of instruction by the time they transition to Grade 4. A key measure of the intervention’s success will be improved literacy skills. The intervention will be implemented over a three-year period (2016–2018) in six LGAs in Zamfara and Katsina (three per state). The intervention has three key components at school and community level: the provision of a package of Hausa-medium teaching and
learning materials to schools; early grade professional development for teachers and head teachers (including monthly school visits); and a set of community awareness and engagement activities to support
early grade literacy.
Methodology
The evaluation of the early learning intervention uses a theory-based approach and is designed as a
clustered randomised controlled trial (RCT), stratified by LGA and type of school (primary school vs. IQS), and randomised at the school level. The intervention’s ToC was used as a framework to formulate the evaluation questions. The RCT design allows the evaluation team to measure the attributable impact of the
early learning intervention on learning outcomes by comparing outcome changes in a treatment group of
schools with those in a control group that is statistically similar on average. The RCT design is combined with the overarching theory-based evaluation approach to measure not only changes in final outcome variables but also net changes in intermediary outcome variables along the assumed causal chain. This will
allow the evaluation team to unpack how change takes place.
In order to measure changes in outcomes a panel survey was designed for data collection at baseline, midline and endline. Data will be collected at each of these three stages in a sample of 120 public primary
schools and 120 IQSs drawn from the six intervention LGAs across Katsina and Zamfara. Half of the public primary schools and IQSs form part of the treatment group, while the other half serves as the control group. Baseline data collection was conducted in October–November 2015 during the first term of the 2015–2016 school year before the start of implementation of the early learning intervention. Within the sample schools, male and female pupils and teachers were randomly sampled to form part of a panel
Evaluation of the Girl’s Education Project 3
Disclaimer EDOREN is a consortium of leading organisations in international development and education: Oxford Policy Management (OPM), and the Institute of Development Studies (IDS) at the University of Sussex, and is supported by UK Aid. EDOREN cannot be held responsible for errors or any consequences arising from the use of information contained in this report. Any views and opinions expressed do not necessarily reflect those of OPM, IDS and EDOREN or any other contributing organisation.
EDOREN No 2, 16 Mafemi Crescent Tel +234 810 727 8718 Education Data, Research & Evaluation in Nigeria Utako Tel +234 817 667 8243 Abuja, Nigeria Email [email protected] Website www.edoren.org
© EDOREN 9
survey. Seven data collection instruments were administered within each school: pupil English and Hausa literacy assessments, pupil and teacher questionnaires, a teacher knowledge and skills assessment, a
teacher classroom observation and a head teacher questionnaire. The literacy assessments were carefully designed and piloted to ensure that item difficulty matched pupils’ ability.
Analysis of the baseline data indicated that randomisation had worked to create comparable treatment and control groups. We assessed whether the randomisation had achieved its intended purpose by checking whether key outcome variables and school-, teacher- and pupil-level characteristics differed
between the treatment and control groups at baseline. The great majority of variables investigated did not show any statistically significant difference between the two groups.
Key findings
The baseline findings highlight that the early learning intervention will be implemented in a challenging context. The vast majority of schools are located in rural areas and have poor infrastructure. While a larger
share of IQSs than public primary schools have access to drinking water and electricity, they have less rooms on average and have less access to books and functional toilets for girls. Teachers in IQSs are predominantly male. The baseline also found that 40% of IQSs only have one teacher who teaches the
integrated curriculum subjects, which raises questions about the applicability of the school-level peer mentoring approach in these IQSs.
Head teachers make some effort to address teacher attendance, but are less likely to take action to improve the quality of instruction. Almost 90% of head teachers in public primary schools reported taking
action on teacher attendance. The corresponding figure for IQSs was just over 50%. Over half of the head
teachers interviewed had not observed a single lesson during the previous school term. Similarly, half of
head teachers do not have meetings with teachers or meet them less than once a month.
A notable share of early grade teachers do not teach languages. Roughly half of teachers reported that
they teach only one subject, of which just over 40% teach a subject other than Hausa or English. Given that the Reading and Numeracy Activity (RANA) will emphasise early grade reading, this pool of teachers may not be suitable candidates for the intervention. This needs to be taken into account when selecting
teachers for training.
The teachers surveyed demonstrated very limited knowledge and skills in respect of most of the domains
covered by the teacher assessments. Less than 3% of teachers were able to display competence in identifying low performers, evidencing judgements and diagnosing pupil performance, interpreting words and phrases, and writing skills. Although all teachers reported that they speak Hausa, less than 40% were
Evaluation of the Girl’s Education Project 3
Disclaimer EDOREN is a consortium of leading organisations in international development and education: Oxford Policy Management (OPM), and the Institute of Development Studies (IDS) at the University of Sussex, and is supported by UK Aid. EDOREN cannot be held responsible for errors or any consequences arising from the use of information contained in this report. Any views and opinions expressed do not necessarily reflect those of OPM, IDS and EDOREN or any other contributing organisation.
EDOREN No 2, 16 Mafemi Crescent Tel +234 810 727 8718 Education Data, Research & Evaluation in Nigeria Utako Tel +234 817 667 8243 Abuja, Nigeria Email [email protected] Website www.edoren.org
© EDOREN 10
able to display competence in primary Grade 1 and 2-level Hausa. This is significant for an intervention that
focuses on teaching in Hausa as teachers’ subject knowledge has important implications for the quality of teaching. Teachers’ very poor skills in identifying low performers and diagnosing pupils’ performance are likely to present key hurdles to improving teaching quality given the wide recognition in the education literature that children learn best when teaching is targeted to what the child is ready to learn. There are some minor variations in performance across different groups of teachers, but knowledge and skills levels
are consistently low within all groups.
These findings regarding teachers’ knowledge and skills have a few key implications for the early learning intervention. The very low levels of knowledge and skills amongst teachers at baseline indicates that there is substantial scope for improvement in this area. However, it also presents challenges, in that there is often a lack of basic foundational skills that the project can build on. The findings should serve as a useful input to the RANA implementation team as they highlight some of the key areas of weakness that the intervention would need to address. They also provide an indication of the scale of the challenges confronting the project, which will have implications for implementation decisions – for instance related to the frequency and content of training, and the focus of the school visits.
Classroom observations indicate that the quality of early grade instruction is low across all groups of teachers. The extent of pupil-centred learning observed at baseline was low, as was the extent to which teachers link the lesson to previous learning and learning objectives. In contrast, time on task was high, at an average of 96% of a total lesson. However, this finding should be interpreted with caution as it is likely that the presence of observers in the classroom led to an increase in time on task. The baseline also sought to measure gender-sensitive teaching practices using classroom observation data, but extreme compliance effects were observed across all items, raising questions about the validity and reliability of the measure. Teachers’ responses to the assessments indicate that teachers are aware of objectives to target girls in class, as they state that it is important to focus on girls, but their responses also point to the persistence of deeply ingrained gender biases.
The availability and use of teaching and learning materials was observed to be very low. This suggests that the distribution of learning materials by the RANA intervention could fill an important gap. However, it will be vital for materials to be pitched at an appropriate level, taking into account the very low levels of knowledge amongst both teachers and pupils.
Hausa-based teaching is prevalent in the early grades. Hausa was used in all classes observed at baseline. In roughly half of classes, a second language was used in addition to Hausa. However, as noted above, many teachers lack competence in basic Hausa.
Evaluation of the Girl’s Education Project 3
Disclaimer EDOREN is a consortium of leading organisations in international development and education: Oxford Policy Management (OPM), and the Institute of Development Studies (IDS) at the University of Sussex, and is supported by UK Aid. EDOREN cannot be held responsible for errors or any consequences arising from the use of information contained in this report. Any views and opinions expressed do not necessarily reflect those of OPM, IDS and EDOREN or any other contributing organisation.
EDOREN No 2, 16 Mafemi Crescent Tel +234 810 727 8718 Education Data, Research & Evaluation in Nigeria Utako Tel +234 817 667 8243 Abuja, Nigeria Email [email protected] Website www.edoren.org
© EDOREN 11
The baseline sought to assess teacher motivation and attendance as these variables are likely to influence the extent to which improved knowledge and skills amongst teachers translate into better teaching. Teacher motivation was relatively high on three dimensions: the effort put into, and perceived importance, of teachers’ work; their enjoyment of teaching; and interaction between teachers. Scores related to pressure and work-related tension and teachers’ perceived self-efficacy were low. There was limited variation across teachers. Absenteeism was higher in IQSs than in public primary schools, with facilitators reporting that they were absent for an average of eight days over the previous 60 days. The corresponding figure for public schools was three days.
The baseline findings indicate that in both English and Hausa, very few pupils have levels of knowledge that are appropriate for their grade. In both subjects, the vast majority of P2 pupils assessed have knowledge and skills expected of pre-school children (pre-literacy skills). Furthermore, in both cases, the peak of the distribution of performance falls well below the cut-off point between pre-literacy and emerging literacy. This suggests that substantial effort would be needed to achieve a significant increase in the share of pupils moving from pre-literacy to emerging literacy.
Pupils’ knowledge of phonic is particularly low. The psychometric analysis found that items that require knowledge of phonics rank as the most difficult items in both the Hausa and English assessments. Correctly sounding out letters and identifying similar sounds was more difficult for pupils than writing or reading full passages.
Learning outcomes differ by age and gender. Older pupils in P2 perform better than younger ones and boys perform better than girls. Gender differences in performance are small in the younger years, but increase once girls reach puberty (around 12 years of age).
Regression analysis indicates that pupil characteristics, socio-economic background and school type are associated with learning outcomes, but teacher characteristics are not. The latter finding may reflect the fact that competency levels are very low across all teachers. It is likely that a stronger correlation would be detected if there were greater variation in competency levels across teachers, and if their ability to influence pupils’ learning outcomes was higher. This also implies that if the early learning intervention leads to substantial improvements in teachers’ knowledge and skills we should see a more significant link between teacher characteristics and learning outcomes at endline.
Evaluation of GEP3’s support to IQSs
GEP3’s support to IQSs (IQSS) seeks to improve education outcomes at these schools, with the aim of providing an acceptable alternative form of quality basic education for girls. The intervention seeks to raise
Evaluation of the Girl’s Education Project 3
Disclaimer EDOREN is a consortium of leading organisations in international development and education: Oxford Policy Management (OPM), and the Institute of Development Studies (IDS) at the University of Sussex, and is supported by UK Aid. EDOREN cannot be held responsible for errors or any consequences arising from the use of information contained in this report. Any views and opinions expressed do not necessarily reflect those of OPM, IDS and EDOREN or any other contributing organisation.
EDOREN No 2, 16 Mafemi Crescent Tel +234 810 727 8718 Education Data, Research & Evaluation in Nigeria Utako Tel +234 817 667 8243 Abuja, Nigeria Email [email protected] Website www.edoren.org
© EDOREN 12
learning outcomes in basic literacy and numeracy for pupils at IQSs (especially girls), improve retention
among girls, and (to a lesser extent) increase girls’ enrolment. The project targets registered Islamiyya, Qur’anic Tsangaya Education (IQTE) centres that offer an integrated curriculum and in which at least 40% of pupils are girls. These IQSs largely operate as community-based initiatives, but are willing to build links with government for the purposes of monitoring and technical support. GEP3’s IQSS involves the provision of training and mentoring of IQS facilitators, training for head teachers, the distribution of classroom
teaching and learning materials, capacity building for Centre-Based Management Committees (CBMCs) and the provision of mini-grants.
Methodology
The evaluation approach draws on the principles of contribution analysis and relies on a strong mix of
quantitative and qualitative methods. It does not make use of a comparison group to make causal inferences but rather seeks to make credible causal claims about the intervention’s contribution to
education outcomes by verifying the chain of expected results and assumptions as per a credible ToC, as well as assessing alternative explanations for the outcomes observed. The evaluation will assess three contribution claims:
• GEP3’s IQSS contributes to more effective teaching of formal subjects in IQSs;
• GEP3’s IQSS contributes to an improved, girl-friendly environment within the schools; and
• more effective teaching of formal subjects and an improved, girl-friendly environment contribute to improved learning levels, particularly among girls.
The quantitative component of the evaluation consists of representative sample surveys among GEP3 IQSs in the 12 GEP3 LGAs in Bauchi and Niger. The baseline survey took place in a sample of 60 IQSs, stratified by LGA. It involved the administration of the same seven instruments used for the early learning intervention
evaluation, as well as a pupil numeracy assessment and CBMC questionnaire. The baseline qualitative research took place in six IQSs that were purposively sampled using typical and extreme case sampling and
that were also included in the quantitative survey. The same set of IQSs will be visited at midline and endline.
Key findings
Evaluation of the Girl’s Education Project 3
Disclaimer EDOREN is a consortium of leading organisations in international development and education: Oxford Policy Management (OPM), and the Institute of Development Studies (IDS) at the University of Sussex, and is supported by UK Aid. EDOREN cannot be held responsible for errors or any consequences arising from the use of information contained in this report. Any views and opinions expressed do not necessarily reflect those of OPM, IDS and EDOREN or any other contributing organisation.
EDOREN No 2, 16 Mafemi Crescent Tel +234 810 727 8718 Education Data, Research & Evaluation in Nigeria Utako Tel +234 817 667 8243 Abuja, Nigeria Email [email protected] Website www.edoren.org
© EDOREN 13
Contribution Claim 1: GEP3’s IQSS contributes to more effective teaching of formal subjects in IQSs
The landscape of IQSs is complex. Variations in school structures, pupil–teacher ratios, facilitators’ qualifications, school leadership and management, and the number and hours for which integrated subjects
are taught per school suggest that the outcomes of intervening in these schools are likely to differ from one another. Some IQSs may be mobile, which would have implications for continued teaching and learning, particularly for girls who are unlikely to move with the Mallam.1 The extent of integration varies across IQSs, and is lower on average in Bauchi than in Niger. Across the two states, head teachers reported that an average of three hours per week is spent on teaching the integrated curriculum, which is well below the
eight hours recommended by official guidelines. A quarter of IQSs only have one facilitator, which will
constrain a mentoring process based on school-based peer interaction. One crucial supportive factor is that
integration does appear to have gained acceptance among parents and the community.
Facilitators’ knowledge and skills in key domains associated with effective teaching are very low. Only 2% of facilitators were able to display competence in identifying low performers. Less than 1% had competence in writing skills and none of the facilitators assessed were competent in evidencing
judgements and diagnosing pupil performance. Only 34% of facilitators were able to display competence in Grade 1 and 2-level Hausa. Most facilitators display a lack of understanding of what steps they can take to
improve pupils’ performance. As with the early learning intervention, these findings indicate that there is tremendous scope for improvement in teachers’ performance, but also that it will be crucial for the intervention to be carefully targeted to the very low levels of skills and knowledge amongst facilitators.
Facilitators scored very poorly on a composite index of effective classroom practices. In particular, the depth of pupil-centred learning was found to be low and there was little effort among facilitators to link the
lesson to previous learning and learning objectives. Time on task was generally high: in 65% of lessons observed pupils spent 100% of the lesson on task. However, this may have been influenced by the presence
of observers.
There is mixed evidence on facilitators’ attitudes and classroom practices towards girls. The facilitators in the six case study schools expressed positive attitudes towards girls’ education, although these responses are prone to social desirability bias. Indeed, both qualitative and quantitative data point to the persistence
of gender biases – for instance related to girls’ abilities. The findings indicate that facilitators are aware of and sometimes practice gender-sensitive techniques, such as actively engaging both girls and boys.
1 The term Mallam can have different interpretations. We consider the Mallam to be the head of the religious school, responsible for religious education.
Evaluation of the Girl’s Education Project 3
Disclaimer EDOREN is a consortium of leading organisations in international development and education: Oxford Policy Management (OPM), and the Institute of Development Studies (IDS) at the University of Sussex, and is supported by UK Aid. EDOREN cannot be held responsible for errors or any consequences arising from the use of information contained in this report. Any views and opinions expressed do not necessarily reflect those of OPM, IDS and EDOREN or any other contributing organisation.
EDOREN No 2, 16 Mafemi Crescent Tel +234 810 727 8718 Education Data, Research & Evaluation in Nigeria Utako Tel +234 817 667 8243 Abuja, Nigeria Email [email protected] Website www.edoren.org
© EDOREN 14
However, these practices seem to be performed in a tokenistic way—in line with development projects’ sensitisation efforts—and gender-biased classroom practices continue to take place in IQSs.
As with the early learning intervention, the baseline evaluation sought to assess facilitators’ motivation and attendance. On average, facilitators think that their role is important and they enjoy working as teachers, but they have poor perceptions of their teaching efficacy. The qualitative research found that facilitators feel intrinsically motivated by what they do, and that school stakeholders, including pupils, think that facilitators as generally dedicated. However, it also indicates that the fact that most facilitators are not
paid makes it difficult to attract qualified facilitators and hold them accountable. The quantitative findings confirm that a very small share of facilitators are paid a salary or a stipend (3% in Bauchi, 33% in Niger) and
point to a positive link between receiving remuneration and teacher motivation. Roughly 75% of facilitators reported that they had been absent at least once in the previous three months. Furthermore, the case study findings indicate that few IQSs have set timetables, and formal subjects are taught as and when a facilitator is available.
The availability and use of teaching and learning materials is very limited. Almost no Hausa materials are available, although it is important to note that Hausa is not the mother tongue of all pupils. In Bauchi, 93%
of sampled children reported speaking Hausa at home but the corresponding figure in Niger is just 54%, with 43% speaking Nupe.
School leadership in IQSs is complex, which raises some challenging questions about who precisely should
be targeted by the pedagogical leadership component of the IQS intervention. IQSs have a variety of different leadership roles (Mallam, head teachers, proprietor). These may be held by one person or
different people and the way in which responsibilities are split across these individuals varies across IQSs.
The professional and academic qualifications of head teachers in IQSs are generally low, and, on average,
below those of facilitators. This raises questions about head teachers’ technical capacity to exercise pedagogical leadership over facilitators. The appointment of a head teacher is not necessarily based on ability and qualifications but has to do with social status within the community and perceptions around
leadership more generally.
Contribution Claim 2: GEP3’s IQSS contributes to an improved, girl-friendly school environment in IQSs
CBMCs have some potential to bring about improvements in the learning environment in IQSs. The management of IQSs is seen as collective, without clearly defined and delegated roles, which provides opportunities for community-based management structures like CBMCs. The baseline findings also indicate that most CBMCs are established and active, as indicated by regular meetings and monitoring activities. CBMCs have considerable community representation, although women are under-represented and very
Evaluation of the Girl’s Education Project 3
Disclaimer EDOREN is a consortium of leading organisations in international development and education: Oxford Policy Management (OPM), and the Institute of Development Studies (IDS) at the University of Sussex, and is supported by UK Aid. EDOREN cannot be held responsible for errors or any consequences arising from the use of information contained in this report. Any views and opinions expressed do not necessarily reflect those of OPM, IDS and EDOREN or any other contributing organisation.
EDOREN No 2, 16 Mafemi Crescent Tel +234 810 727 8718 Education Data, Research & Evaluation in Nigeria Utako Tel +234 817 667 8243 Abuja, Nigeria Email [email protected] Website www.edoren.org
© EDOREN 15
few members are children. This indicates that at present CBMCs are unlikely to provide a forum in which girls’ voices and needs can be heard. In all IQSs included in the qualitative study the Mallam holds a key
position in the CBMC, such as chairperson. This raises questions about the extent to which CBMCs can play an effective role in holding school leaders to account.
CBMCs do make an effort to raise resources from the community, but this appears to offer limited scope in regard to bridging resource gaps in IQSs. The qualitative research indicates that CBMCs feel that a lack of funds hinders their ability to ‘solve’ problems at IQSs. They also note that while parents are willing to
contribute resources, they often have limited capacity to do so. These findings highlight the case for CBMC training to go beyond a narrow focus on community resource mobilisation to encompass the mobilisation
of resources from alternative sources.
CBMC members seem to largely understand their roles and responsibilities but often lack the capacity to enact them. Key areas in which CBMCs are under-performing are school planning and financial management. CBMC members do make an effort to monitor the quality of the teaching and learning, in
particular pupils’ and facilitators’ attendance. CBMC members assert that the main constraint that undermines their performance is a lack of funds, particularly to improve infrastructure and pay facilitators.
Most IQSs do not offer a girl-friendly school environment at present. The vast majority face major deficiencies in physical infrastructure. Only 3% of the schools have access to a water source, 20% of the IQSs do not have a physical classroom structure for the students, and less than 25% have functioning toilets
for pupils, with only 8% having functioning toilets for girls. Only 3% of IQSs have a mothers’ group, teacher–student association or pupil group where students can discuss their concerns. Gender-biased classroom
practices and attitudes prevail, which can affect girls’ learning opportunities and self-confidence. However,
there appears to be an openness among school leaders to try and address these issues. Resources
mobilised by CBMCs are invested in schools and girl-friendly investments are considered, but the amounts raised appear insufficient given the poor condition of the school environment.
The extent of government engagement with IQSs is limited. The majority of IQSs in the sample had not
been visited by a government official during the previous term. Government officials say that they face challenges in reaching all the schools on a regular basis. Communities generally view support from the
government negatively, considering government actors to be unreliable.
Evaluation of the Girl’s Education Project 3
Disclaimer EDOREN is a consortium of leading organisations in international development and education: Oxford Policy Management (OPM), and the Institute of Development Studies (IDS) at the University of Sussex, and is supported by UK Aid. EDOREN cannot be held responsible for errors or any consequences arising from the use of information contained in this report. Any views and opinions expressed do not necessarily reflect those of OPM, IDS and EDOREN or any other contributing organisation.
EDOREN No 2, 16 Mafemi Crescent Tel +234 810 727 8718 Education Data, Research & Evaluation in Nigeria Utako Tel +234 817 667 8243 Abuja, Nigeria Email [email protected] Website www.edoren.org
© EDOREN 16
Contribution Claim 3: More effective teaching of formal subjects and an improved, girl-friendly school environment contribute to improved learning levels, particularly among girls
The baseline evaluation identifies some key findings that are relevant to this contribution claim. Girls and boys are both equally likely to attend IQSs. However, both face challenges in regard to attending and
remaining fully engaged with the learning process because of out-of-school responsibilities, which are linked to household poverty. A large share of children who study in IQSs attend another school as well. There were significant cross-state differences, with 72% of pupils in Bauchi reporting attending other schools, as compared to only 13% pupils in Niger. In Bauchi, most of these children were attending a public primary school (94%), as compared to 55% in Niger. This indicates that interventions at local primary
schools may constitute an alternative explanation for any improvements in learning outcomes at IQSs.
Pupils’ learning outcomes are very low. In both Hausa and English over 90% of Grade 2 pupils assessed
displayed literacy levels associated with pre-school pupils. Furthermore, most of these pupils are a long way from the cut-off for emerging literacy skills (those associated with the P1 curriculum). Numeracy
outcomes were better, with 69% of pupils displaying emerging numeracy skills, compared to 21% with pre-numeracy skills. However, only 11% of pupils had numeracy skills associated with the P2 curriculum. Boys
and girls both perform poorly, although girls’ performance declines, compared to that of boys, at around puberty (roughly 12 years of age).
Continued barriers to girls’ access to, and retention in, schooling exist. Attitudes towards girls’ education
are not always supportive, although this appears to be changing. Changing attitudes alone, however, may not be sufficient to bring about change in behaviour as poverty is often cited as a critical reason why
parents do not send their child to any school, public primary or IQS. Both boys and girls often engage in
some form of income-generating activity, which parents tend to view as a financial and practical necessity.
This adversely affects school attendance. Early marriage is also cited as a key reason for low enrolment and retention among girls.
Recommendations
The baseline findings point to certain key recommendations for GEP3. The baseline assessment of GEP3’s ToC highlights that continued political engagement is required to ensure that government funds are
mobilised for project scale-up. The project should specify and communicate its operational objectives and strategies to government and other implementing partners, strengthen its monitoring of assumptions in the ToC, and ensure that monitoring information is used to facilitate learning and accountability. In
Evaluation of the Girl’s Education Project 3
Disclaimer EDOREN is a consortium of leading organisations in international development and education: Oxford Policy Management (OPM), and the Institute of Development Studies (IDS) at the University of Sussex, and is supported by UK Aid. EDOREN cannot be held responsible for errors or any consequences arising from the use of information contained in this report. Any views and opinions expressed do not necessarily reflect those of OPM, IDS and EDOREN or any other contributing organisation.
EDOREN No 2, 16 Mafemi Crescent Tel +234 810 727 8718 Education Data, Research & Evaluation in Nigeria Utako Tel +234 817 667 8243 Abuja, Nigeria Email [email protected] Website www.edoren.org
© EDOREN 17
particular, emphasis should be placed on monitoring GEP3’s support to SBMCs/CBMCs, given their pivotal role in the project’s ToC.
Baseline findings on the early learning intervention highlight that the RANA intervention will need to be carefully tailored to the very low levels of knowledge and skills amongst teachers to ensure that training content and materials are pitched at the right level, and that training is sufficiently intensive to fill the large gaps in teachers’ subject, pedagogical and curriculum knowledge. Teacher capacity development also needs to incorporate actions to change teachers’ awareness of their own potential for influencing learning
outcomes, and their understanding of how best to support pupils’ learning. The peer mentoring approach needs to be adapted for the large number of IQSs that only have one teacher who is eligible for support
under the intervention. RANA also needs to sufficiently strengthen the capacity of IQS government stakeholders to ensure that they effectively monitor and provide support supervision. Finally, the complexity of the IQS leadership model indicates that special attention needs to be given to ensuring that appropriate individuals at IQSs are targeted for the programme’s pedagogical leadership training.
The findings on the IQSS intervention highlight the need for the project to strengthen its monitoring of the intervention. The IQS context is diverse, flexible and evolving. In order to adapt the intervention to this
context, quick learning and feedback based on monitoring data is needed. The selection of facilitators, head teachers and CBMC members for training requires close attention, verification and monitoring. Facilitator training and mentoring needs to be carefully adapted to the very low levels of facilitator competency and
the IQS context. Similarly, learning and teaching materials need to be tailored to the very low levels of skills and knowledge amongst both facilitators and pupils, and to the language of the users (particularly in Niger,
where Nupe is widely spoken). Training and mentoring on gender-sensitive class practices needs to go beyond a focus on gender-sensitive teaching practices to try and tackle entrenched gender biases, for
instance related to girls’ ability to learn. Women and girls’ participation in shaping education and the school environment needs further investigation: at present, both are under-represented on CBMCs, which limits the scope for these bodies to act as forums for women and girls’ participation in the sector. Finally, the
baseline findings highlight the need for GEP3 to promote the mobilisation of resources beyond the community and to advocate for facilitators to be adequately remunerated by the government.
Evaluation of the Girl’s Education Project 3
Disclaimer EDOREN is a consortium of leading organisations in international development and education: Oxford Policy Management (OPM), and the Institute of Development Studies (IDS) at the University of Sussex, and is supported by UK Aid. EDOREN cannot be held responsible for errors or any consequences arising from the use of information contained in this report. Any views and opinions expressed do not necessarily reflect those of OPM, IDS and EDOREN or any other contributing organisation.
EDOREN No 2, 16 Mafemi Crescent Tel +234 810 727 8718 Education Data, Research & Evaluation in Nigeria Utako Tel +234 817 667 8243 Abuja, Nigeria Email [email protected] Website www.edoren.org
© EDOREN 18
Table of contents
Acknowledgements i
Executive summary iii
Examination of GEP3’s ToC iii
Impact evaluation of GEP3’s early learning intervention v
Evaluation of GEP3’s support to IQSs vii
Recommendations xi
List of figures, tables and boxes xiv
List of abbreviations xvi
1Introduction 1
1.1Background 1
1.2Objectives of the baseline 1
1.3Organisation of the report 2
2Baseline assessment of GEP3’s Theory of Change 3
2.1Objective of this report 3
2.2Methodology 3
2.3Plausibility of GEP3’s ToC 4
2.4Appropriateness of GEP3’s implementation strategy 35
3Baseline evaluation – Early learning intervention 43
3.1GEP3’s early learning intervention 43
3.2Methodology 5
3.3Comparison of baseline characteristics between intervention and control schools 47
3.4Analysis of the data 49
4Baseline of the IQSS evaluation 97
4.1GEP3’s IQSS 97
4.2Methodology 101
4.3Presentation of the updated ToC 127
Evaluation of the Girl’s Education Project 3
Disclaimer EDOREN is a consortium of leading organisations in international development and education: Oxford Policy Management (OPM), and the Institute of Development Studies (IDS) at the University of Sussex, and is supported by UK Aid. EDOREN cannot be held responsible for errors or any consequences arising from the use of information contained in this report. Any views and opinions expressed do not necessarily reflect those of OPM, IDS and EDOREN or any other contributing organisation.
EDOREN No 2, 16 Mafemi Crescent Tel +234 810 727 8718 Education Data, Research & Evaluation in Nigeria Utako Tel +234 817 667 8243 Abuja, Nigeria Email [email protected] Website www.edoren.org
© EDOREN 19
4.4Analysis of the data – Contribution Claim 1: GEP3’s support to IQSs contributes to more effective teaching of formal subjects in IQSs 138
4.5Analysis of the data – Contribution Claim 2: GEP3’s IQSS contributes to an improved, girl-friendly learning environment 183
4.6Analysis of the data - Contribution Claim 3: More effective teaching of formal subjects and an improved, girl-friendly school environment contribute to improved learning levels, particularly among girls 210
Bibliography 232
Annex AGEP3 Theory of Change Diagram 235
Annex BBaseline Theory of Change assessment 236
B.1Focus of key informant interviews per state 236
B.2Overview of key informants interviewed for the baseline Theory of Change assessment 237
Annex CMaps of sampled schools 242
Annex DCalculation of Weights and Finite Population Correction Factors for GEP3 School, Teacher and Pupil Data 246
D.1Calculation of GEP3 Weights 246
D.2Finite Population Correction Factors for the GEP3 Analysis 248
Annex EEthical Review 250
Annex FTeacher motivation subscales for GEP3 252
F.1Distribution of the five teacher motivation subscales 252
Annex GRandomisation checks of treatment and control group 254
G.1School Level Balance 254
G.2Pupil Level Balance 259
Annex HQualitative Evaluation Matrix for Support for IQS 265
Annex IEvaluation governance, management and independence 267
I.1Governance and management 267
I.2Stakeholder involvement in framework development 268
Annex JRobustness Checks on Age for Main Regression Model 269
Exclusion of Age Variable 270
Evaluation of the Girl’s Education Project 3
Disclaimer EDOREN is a consortium of leading organisations in international development and education: Oxford Policy Management (OPM), and the Institute of Development Studies (IDS) at the University of Sussex, and is supported by UK Aid. EDOREN cannot be held responsible for errors or any consequences arising from the use of information contained in this report. Any views and opinions expressed do not necessarily reflect those of OPM, IDS and EDOREN or any other contributing organisation.
EDOREN No 2, 16 Mafemi Crescent Tel +234 810 727 8718 Education Data, Research & Evaluation in Nigeria Utako Tel +234 817 667 8243 Abuja, Nigeria Email [email protected] Website www.edoren.org
© EDOREN 20
Annex KGEP3 Asset Index 273
Annex LEarly Learning Descriptive Statistics 279
Annex MIQ School Support (IQSS) Descriptive Statistics 291
Annex NCBMC IQSS Descriptive Statistics 307
Evaluation of the Girl’s Education Project 3
Disclaimer EDOREN is a consortium of leading organisations in international development and education: Oxford Policy Management (OPM), and the Institute of Development Studies (IDS) at the University of Sussex, and is supported by UK Aid. EDOREN cannot be held responsible for errors or any consequences arising from the use of information contained in this report. Any views and opinions expressed do not necessarily reflect those of OPM, IDS and EDOREN or any other contributing organisation.
EDOREN No 2, 16 Mafemi Crescent Tel +234 810 727 8718 Education Data, Research & Evaluation in Nigeria Utako Tel +234 817 667 8243 Abuja, Nigeria Email [email protected] Website www.edoren.org
© EDOREN 21

Evaluation of the Girl’s Education Project 3
Disclaimer EDOREN is a consortium of leading organisations in international development and education: Oxford Policy Management (OPM), and the Institute of Development Studies (IDS) at the University of Sussex, and is supported by UK Aid. EDOREN cannot be held responsible for errors or any consequences arising from the use of information contained in this report. Any views and opinions expressed do not necessarily reflect those of OPM, IDS and EDOREN or any other contributing organisation.
EDOREN No 2, 16 Mafemi Crescent Tel +234 810 727 8718 Education Data, Research & Evaluation in Nigeria Utako Tel +234 817 667 8243 Abuja, Nigeria Email [email protected] Website www.edoren.org
© EDOREN 22
List of figures, tables and boxes
Figure 1: Diagram depicting ToC for the early learning intervention ........................................................ 2 Figure 2: Timeline of data collection and the RANA intervention ............................................................. 8 Figure 3: School entry protocol ............................................................................................................... 14 Figure 4: Teacher sampling ...................................................................................................................... 15 Figure 5: Pupil selection – Head teacher’s office..................................................................................... 16 Figure 6: Pupil selection – classroom ...................................................................................................... 17 Figure 7: Instrument development process ............................................................................................ 18 Figure 8: GEP3 survey team structure ..................................................................................................... 23 Figure 9: Teacher knowledge model ....................................................................................................... 34 Figure 10: Theorised causal pathway (taken from the TDP) ..................................................................... 41 Figure 11: School size based on average number of teachers, by school type ......................................... 51 Figure 12: Prevalence of head teacher management actions ................................................................... 52 Figure 13: Actions taken and age groups .................................................................................................. 53 Figure 14: School structure in IQSs ............................................................................................................ 55 Figure 15: Infrastructure in Katsina and Zamfara ...................................................................................... 56 Figure 16: Teacher qualification and education by school type ................................................................ 59 Figure 17: Percentage of teachers achieving within the lower, middle and upper bands of competence
across the teacher knowledge and skills subscales .................................................................. 62 Figure 18: Percentage of observed teachers engaging in different kinds of teacher talk ......................... 67 Figure 19: Percentage of observed teachers engaging in different types of teacher action .................... 67 Figure 20: Percentage of classrooms where pupils engaged in different types of pupil action ............... 68 Figure 21: Percentage of teachers scoring zero in pedagogical, curriculum and subject knowledge ....... 70 Figure 22: Mean pupil-centred teaching score by years of experience as a teacher ................................ 72 Figure 23: Percentage of time on task ....................................................................................................... 72 Figure 24: Percentage of classrooms using English, Hausa and Arabic ..................................................... 74 Figure 25: Frequency of Hausa use in class ............................................................................................... 74 Figure 26: Comparison of motivation subscales ........................................................................................ 76 Figure 27: Motivation by age groups ......................................................................................................... 76 Figure 28: Distribution of age groups in IQSs and public primary schools ............................................... 79 Figure 29: HWI tertile categorisation by state ........................................................................................... 80 Figure 30: Categories of factors that influence learning outcomes .......................................................... 81 Figure 31: Distribution of Hausa literacy proficiency ................................................................................ 83 Figure 32: Distribution of English literacy proficiency ............................................................................... 85 Figure 33: Hausa literacy by gender and school type ................................................................................ 87 Figure 34: Hausa mean scale score by age (95% confidence interval) ...................................................... 88
Evaluation of the Girl’s Education Project 3
Disclaimer EDOREN is a consortium of leading organisations in international development and education: Oxford Policy Management (OPM), and the Institute of Development Studies (IDS) at the University of Sussex, and is supported by UK Aid. EDOREN cannot be held responsible for errors or any consequences arising from the use of information contained in this report. Any views and opinions expressed do not necessarily reflect those of OPM, IDS and EDOREN or any other contributing organisation.
EDOREN No 2, 16 Mafemi Crescent Tel +234 810 727 8718 Education Data, Research & Evaluation in Nigeria Utako Tel +234 817 667 8243 Abuja, Nigeria Email [email protected] Website www.edoren.org
© EDOREN 23
Figure 35: Mean Hausa scale score by age and gender (95% confidence interval) .................................. 88 Figure 36: Hausa by wealth ....................................................................................................................... 89 Figure 37: Intervention logic diagram of the IQSS ................................................................................... 101 Figure 38: Timeline for IQSS activities and data collection in GEP3 pilot IQSs ........................................ 106 Figure 39: Teacher sampling .................................................................................................................... 112 Figure 40: Flow chart of data collection relating to facilitators .............................................................. 116 Figure 41: Diagram depicting ToC of the IQSS ......................................................................................... 130 Figure 42: Causal package and underlying assumptions of ‘more effective teaching’ ........................... 133 Figure 43: Causal package and underlying assumptions of ‘improved, girl-friendly school environment’...
............................................................................................................................................. 135 Figure 44: Causal package and underlying assumptions of ‘improved learning outcomes’ ................... 137 Figure 45: Number of integrated subjects taught per facilitator ............................................................ 142 Figure 46: Facilitator training content, by state ...................................................................................... 143 Figure 47: Religious subjects taught in schools, by state ........................................................................ 145 Figure 48: Percentage of facilitators achieving within the lower, middle and upper bands of competence
across the teacher knowledge and skills subscales ................................................................ 146 Figure 49: Percentage of observed facilitators engaging in different teacher talk activities .................. 150 Figure 50: Percentage of observed classrooms where pupils engaged in various types of pupil action 151 Figure 51: Number of languages used by the facilitator during one lesson ............................................ 152 Figure 52: Percentage of facilitators using Hausa, Arabic, English and other languages in class ........... 152 Figure 53: Percentage of facilitators scoring zero in pedagogical, curriculum and subject knowledge . 154 Figure 54: Depth of pupil-centred teaching, by state .............................................................................. 155 Figure 55: Percentage of time on task in observed lessons .................................................................... 156 Figure 56: Length of lessons observed, by state ..................................................................................... 156 Figure 57: Motivation subscales for IQS facilitators ................................................................................ 157 Figure 58: Availability and use of resources in observed lessons............................................................ 161 Figure 59: Content of head teacher training, by state ............................................................................ 162 Figure 60: Frequency of head teacher meetings with teachers, by training status of head teacher ...... 163 Figure 61: Frequency of head teacher meetings with teachers, by state ............................................... 164 Figure 62: Availability of school records, by state ................................................................................... 165 Figure 63: Average number of members in CBMCs ................................................................................ 185 Figure 64: Content of CBMC training ....................................................................................................... 186 Figure 65: Action taken by CBMCs to address pupil dropout, by state ................................................... 188 Figure 66: Amount mobilised by CBMCs ................................................................................................. 189 Figure 67: Receipt of GEP school grant, by state ..................................................................................... 189 Figure 68: Infrastructure repair needs, by state ...................................................................................... 192 Figure 69: Investment categories, by state ............................................................................................. 193
Evaluation of the Girl’s Education Project 3
Disclaimer EDOREN is a consortium of leading organisations in international development and education: Oxford Policy Management (OPM), and the Institute of Development Studies (IDS) at the University of Sussex, and is supported by UK Aid. EDOREN cannot be held responsible for errors or any consequences arising from the use of information contained in this report. Any views and opinions expressed do not necessarily reflect those of OPM, IDS and EDOREN or any other contributing organisation.
EDOREN No 2, 16 Mafemi Crescent Tel +234 810 727 8718 Education Data, Research & Evaluation in Nigeria Utako Tel +234 817 667 8243 Abuja, Nigeria Email [email protected] Website www.edoren.org
© EDOREN 24
Figure 70: Sources of monitoring visits to schools, by state ................................................................... 194 Figure 71: Age of pupils by gender .......................................................................................................... 212 Figure 72: Languages spoken at home, by state ..................................................................................... 213 Figure 73: Language of instruction, by state ........................................................................................... 214 Figure 74: Distribution of Hausa literacy proficiency .............................................................................. 216 Figure 75: English literacy proficiency distribution ................................................................................. 217 Figure 76: Distribution of numeracy proficiency ..................................................................................... 219 Figure 77: Mean Hausa scale score by age and gender (95% confidence interval) ................................ 220 Figure 78: Mean English scale score by age and gender (95% confidence interval) ............................... 220 Figure 79: Mean numeracy scale score by age and gender (95% confidence interval) .......................... 221 Figure 80: Mean English scale scores, by state........................................................................................ 221 Figure 81: Mean Hausa scale scores, by state ......................................................................................... 222 Figure 82: Mean numeracy scale scores, by state ................................................................................... 222 Figure 83: GEP3 evaluation governance arrangements .......................................................................... 267 Table 1: GPI – averages and quintile distribution, per LGA ....................................................................... 41 Table 2: Number of RANA pilot schools per GEP3 LGA and type of school ............................................... 44 Table 3: Sample parameters for the early learning intervention .............................................................. 11 Table 4: Overview of the data collection instruments .............................................................................. 20 Table 5: Summary of the survey achievement .......................................................................................... 24 Table 6: Observations from early learning intervention ........................................................................... 27 Table 7: Teacher knowledge and skills proficiency bands ......................................................................... 36 Table 8: Summary of results of the factor analysis ................................................................................... 43 Table 9: Limitations of, and risks to, the evaluation methodology of the early learning intervention ..... 43 Table 10: Balance check of school-level characteristics, public primary schools and IQSs .................. 48 Table 11: Balance check of teacher-level outcomes and characteristics, public primary schools and IQSs 48 Table 12: Balance check of pupil-level outcomes and characteristics, public primary schools and IQSs .... 49 Table 13: Correlation between subscales of teachers’ knowledge and skills ....................................... 62 Table 14: Hausa proficiency level descriptions ..................................................................................... 82 Table 15: English proficiency level descriptions .................................................................................... 84 Table 16: Main factors influencing Hausa scaled scores ....................................................................... 91 Table 17: Main factors influencing English scale scores ....................................................................... 91 Table 18: Hausa school fixed effects model .......................................................................................... 93 Table 19: English school fixed effects model ........................................................................................ 94 Table 20: GEP3 target results for IQSS ................................................................................................ 100 Table 21: Sample parameters for the IQSS intervention .................................................................... 109 Table 22: Overview of the instruments ............................................................................................... 113
Evaluation of the Girl’s Education Project 3
Disclaimer EDOREN is a consortium of leading organisations in international development and education: Oxford Policy Management (OPM), and the Institute of Development Studies (IDS) at the University of Sussex, and is supported by UK Aid. EDOREN cannot be held responsible for errors or any consequences arising from the use of information contained in this report. Any views and opinions expressed do not necessarily reflect those of OPM, IDS and EDOREN or any other contributing organisation.
EDOREN No 2, 16 Mafemi Crescent Tel +234 810 727 8718 Education Data, Research & Evaluation in Nigeria Utako Tel +234 817 667 8243 Abuja, Nigeria Email [email protected] Website www.edoren.org
© EDOREN 25
Table 23: Summary of survey achievement ........................................................................................ 115 Table 24: Instruments by participant group ....................................................................................... 120 Table 25: Limitations of and risks to the evaluation methodology for the IQSS ................................ 125 Table 26: Mapping IQS structures to primary school classes ............................................................. 139 Table 27: Facilitators in IQSs, by state ................................................................................................ 140 Table 28: Correlations between subscales of facilitators’ knowledge and skills ................................ 147 Table 29: Numeracy proficiency level descriptions ............................................................................ 218 Table 30: Learning outcomes by gender ............................................................................................. 219 Table 31: All Head Teachers ................................................................................................................ 254 Table 32: IQS Head Teachers ............................................................................................................... 255 Table 33: Public School Head Teachers ............................................................................................... 256 Table 34: All Teachers ......................................................................................................................... 257 Table 35: IQS Teachers ........................................................................................................................ 258 Table 36: Public Schools Teachers....................................................................................................... 259 Table 37: All Pupils .............................................................................................................................. 260 Table 38: IQS Pupils ............................................................................................................................. 261 Table 39: Public School Pupils ............................................................................................................. 262 Table 40: All Female Pupils.................................................................................................................. 263 Table 41: All Male Pupils ..................................................................................................................... 264 Table 42: Hausa- Main Model with Age Imputed for Pupils with Missing Age Data .......................... 269 Table 43: English- Main Model with Age Imputed for Pupils with Missing Age Data ......................... 269 Table 44: Hausa- Fixed-Effects Model with Age Imputed for Pupils with Missing Age Data .............. 270 Table 45: English- Fixed-Effects Model with Age Imputed for Pupils with Missing Age Data ............ 270 Table 46: Hausa- Main Model with Boarding Variable and No Age Variable ..................................... 270 Table 47: English- Main Model with Boarding Variable and No Age Variable .................................... 271 Table 48: Hausa- Fixed-Effects Model with Boarding Variable and No Age Variable ......................... 271 Table 49: English- Fixed-Effects Model with Boarding Variable and No Age Variable ........................ 272 Table 50: Coefficients of the Variables included in the asset index, using PCA on HNLSS data ......... 273 Table 51: X-tile divisions with the asset index .................................................................................... 274 Table 52: Ownership of gas cooker and washing machine ................................................................. 274 Table 53: Coefficients of the Variables included in the asset index, using PCA on GEP3 data ........... 275 Table 54: Division Into Tertiles, By Model........................................................................................... 276 Table 55: Division Into Quartiles, By Model ........................................................................................ 276 Table 56: Division Into Quintiles, By Model ........................................................................................ 276 Table 57: Division Into Deciles, By Model ........................................................................................... 276 Table 58: X-tile divisions with the asset index (Model 1) on HNLSS data ........................................... 277 Table 59: Comparison of Model 1 using GEP and HNLSS coefficients ................................................ 278
Evaluation of the Girl’s Education Project 3
Disclaimer EDOREN is a consortium of leading organisations in international development and education: Oxford Policy Management (OPM), and the Institute of Development Studies (IDS) at the University of Sussex, and is supported by UK Aid. EDOREN cannot be held responsible for errors or any consequences arising from the use of information contained in this report. Any views and opinions expressed do not necessarily reflect those of OPM, IDS and EDOREN or any other contributing organisation.
EDOREN No 2, 16 Mafemi Crescent Tel +234 810 727 8718 Education Data, Research & Evaluation in Nigeria Utako Tel +234 817 667 8243 Abuja, Nigeria Email [email protected] Website www.edoren.org
© EDOREN 26
Table 60: Ownership of assets in IQS support sample ........................................................................ 278 Table 61: School Level Descriptive Statistics ....................................................................................... 279 Table 62: Teacher Level Descriptive Statistics .................................................................................... 285 Table 63: Pupil Level Descriptive Statistics ......................................................................................... 290 Table 64: School Level Descriptive Statistics ....................................................................................... 291 Table 65: Teacher Level Descriptive Statistics .................................................................................... 299 Table 66: Pupil Level Descriptive Statistics ......................................................................................... 303 Box 1: RANA’s intermediate results and sub-components ................................................................. 43 Box 2: RANA monitoring tools ............................................................................................................... 4 Box 3: Evaluation questions for evaluation of GEP3’s early learning intervention ............................... 5 Box 4: P2 or the equivalent level ......................................................................................................... 10 Box 5: P1–P3 or equivalent level ......................................................................................................... 10 Box 6: Estimation of MDEs .................................................................................................................. 12 Box 7: Explanatory factors included in the pupils correlation model ................................................. 90 Box 8: Evaluation questions for evaluation of GEP3’s support to IQSs ............................................. 102 Box 9: Key steps in contribution analysis applied to the evaluation of GEP3’s IQSS ........................ 105 Box 10: Estimation of MDEs ................................................................................................................ 109

Evaluation of the Girl’s Education Project 3
Disclaimer EDOREN is a consortium of leading organisations in international development and education: Oxford Policy Management (OPM), and the Institute of Development Studies (IDS) at the University of Sussex, and is supported by UK Aid. EDOREN cannot be held responsible for errors or any consequences arising from the use of information contained in this report. Any views and opinions expressed do not necessarily reflect those of OPM, IDS and EDOREN or any other contributing organisation.
EDOREN No 2, 16 Mafemi Crescent Tel +234 810 727 8718 Education Data, Research & Evaluation in Nigeria Utako Tel +234 817 667 8243 Abuja, Nigeria Email [email protected] Website www.edoren.org
© EDOREN 27
Evaluation of the Girl’s Education Project 3
Disclaimer EDOREN is a consortium of leading organisations in international development and education: Oxford Policy Management (OPM), and the Institute of Development Studies (IDS) at the University of Sussex, and is supported by UK Aid. EDOREN cannot be held responsible for errors or any consequences arising from the use of information contained in this report. Any views and opinions expressed do not necessarily reflect those of OPM, IDS and EDOREN or any other contributing organisation.
EDOREN No 2, 16 Mafemi Crescent Tel +234 810 727 8718 Education Data, Research & Evaluation in Nigeria Utako Tel +234 817 667 8243 Abuja, Nigeria Email [email protected] Website www.edoren.org
© EDOREN 28
List of abbreviations
ASC Annual School Census
BSAME Bauchi SAME
CAPI Computer-assisted personal interview
CBMC Centre-Based Management Committee
CS Composite Survey
CSO Civil society organisation
DAC Development Assistance Committee
DFID Department of International Development (UK)
ECCDE Early child care development and education
EDOREN Education, Data, Research and Evaluation in Nigeria
EGRA/EGMA Early Grade Reading Assessment/ Early Grade Maths Assessment
EMIS Education management information system
ERC Ethics Review Committee
ESSPIN Education Sector Support Programme in Nigeria
FGD Focus group discussion
FME Federal Ministry of Education
FOMWAN Federation of Muslim Women’s Associations of Nigeria
FTTSS Female Teacher Trainee Scholarship Scheme
G4G Girls for Girls
GEP3 Girl’s Education Project Phase 3
GESCs Girls’ Education Steering Committees
GPE Global Partnership for Education
GPI Gender Parity Index
HiLWA High-Level Women’s Advocates
Evaluation of the Girl’s Education Project 3
Disclaimer EDOREN is a consortium of leading organisations in international development and education: Oxford Policy Management (OPM), and the Institute of Development Studies (IDS) at the University of Sussex, and is supported by UK Aid. EDOREN cannot be held responsible for errors or any consequences arising from the use of information contained in this report. Any views and opinions expressed do not necessarily reflect those of OPM, IDS and EDOREN or any other contributing organisation.
EDOREN No 2, 16 Mafemi Crescent Tel +234 810 727 8718 Education Data, Research & Evaluation in Nigeria Utako Tel +234 817 667 8243 Abuja, Nigeria Email [email protected] Website www.edoren.org
© EDOREN 29
HWI Household Wealth Index
ICC Intra-cluster correlation
IQQS IQS support
IQS Integrated Qur’anic school
IQTEs Islamiyya, Qur’anic Tsangaya Education Centres
ITC Inter-temporal correlation
JSS Junior secondary School
KI Key informant
KII Key informant interview
LGA Local Government Area
LGEA Local Government Education Area
M&E Monitoring and evaluation
MA Mothers’ Association
MDAs Ministries, departments and agencies
MDE Minimum detectable effect
MTSS Medium-Term Sector Strategy
NCE National Certificate in Education
NGN Nigerian Naira
NHREC National Health Research Ethics Committee (of Nigeria)
NIPEP Nigeria Partnership for Education Project
OECD Organisation for Economic Co-operation and Development
OPM Oxford Policy Management
P2 Primary grade 2
PEA Political economy analysis
PIU Programme Implementation Unit
QCO Qualitative classroom observation
Evaluation of the Girl’s Education Project 3
Disclaimer EDOREN is a consortium of leading organisations in international development and education: Oxford Policy Management (OPM), and the Institute of Development Studies (IDS) at the University of Sussex, and is supported by UK Aid. EDOREN cannot be held responsible for errors or any consequences arising from the use of information contained in this report. Any views and opinions expressed do not necessarily reflect those of OPM, IDS and EDOREN or any other contributing organisation.
EDOREN No 2, 16 Mafemi Crescent Tel +234 810 727 8718 Education Data, Research & Evaluation in Nigeria Utako Tel +234 817 667 8243 Abuja, Nigeria Email [email protected] Website www.edoren.org
© EDOREN 30
RANA Reading and Numeracy Activity
RARA Reading and Access Research Activity
RCT Randomised control trial
RLP RANA Literacy Package
SAME State Agency for Mass Education
SAVI State Accountability and Voice Initiative
SBMC School-Based Management Committee
SESOP State Education Sector Operational Plan
SMoE State Ministry of Education
SUBEB State Universal Basic Education Board
SPARC State Partnership for Accountability, Responsiveness and Capability
SSCE Senior Secondary Certificate Examination
SWAGS Strengthening Women and Girls’ Spaces
TDNA Teacher Development Needs Assessment
TDP Teacher Development Programme
TEGIN Transforming Education for Girls in Nigeria
ToC Theory of change
TPD Teacher practice discussion
UBEC Universal Basic Education Commission
UNICEF United Nations Children’s Fund
WCDP Whole Centre Development Plan
WSDP Whole School Development Plan

1 Introduction
1.1 Background
This report has been prepared by Education Data, Research and Evaluation in Nigeria (EDOREN). EDOREN is contracted by the UK Department for International Development in Nigeria (DFID Nigeria) to evaluate the Girls Education Project Phase 3 (GEP3), in line with the GEP3 Evaluation Framework (EDOREN 2015).
GEP3 is an eight-year project (2012–20) that seeks to ensure that more girls complete basic education and acquire skills for life and livelihood in five northern Nigerian states: Katsina, Sokoto, Bauchi, Niger and Zamfara. It is managed by UNICEF, in partnership with federal and state
governments, and is funded by UK Aid DFID. The project aims to improve access, retention and
learning outcomes for girls. Between 2014 and 2017, a series of interventions are being piloted in public primary schools and integrated Qur’anic schools (IQSs). Those most effective in improving education outcomes for girls will be scaled up. During 2014–2015, EDOREN, in collaboration with
UNICEF and DFID Nigeria, developed an evaluation framework, in parallel with GEP3’s redesign. The evaluation framework defined the objectives, scope, questions, design and partner responsibilities of
the evaluation activities, with a focus on the period 2014–2017, to inform decision-making regarding scale-up.
The scope of EDOREN’s evaluation work consists of three sets of evaluation questions and pieces
of analysis:
1. a high-level explication and examination of GEP3’s theory of change (ToC);
2. an impact evaluation of GEP3’s early learning intervention; and
3. a performance evaluation of GEP3’s support to IQSs.
1.2 Objectives of the baseline
The objectives of the baseline analysis are:
• to capture the education situation, and perceptions of this situation, at the start of the redesigned GEP3 project, with a focus on specific interventions, so that changes can be
measured during follow-up data collection rounds, and project attribution or contribution can be
assessed;
• to answer specific evaluation questions about the relevance of the project; and
• to provide evidence to inform the GEP3 ToC and project implementation.
In line with the scope of EDOREN’s evaluation work the baseline analysis is organised into three parts: i) a baseline assessment of GEP3’s ToC, drawing mainly on KIIs with state-level stakeholders of
Evaluation of the Girl’s Education Project 3
Disclaimer EDOREN is a consortium of leading organisations in international development and education: Oxford Policy Management (OPM), and the Institute of Development Studies (IDS) at the University of Sussex, and is supported by UK Aid. EDOREN cannot be held responsible for errors or any consequences arising from the use of information contained in this report. Any views and opinions expressed do not necessarily reflect those of OPM, IDS and EDOREN or any other contributing organisation.
EDOREN No 2, 16 Mafemi Crescent Tel +234 810 727 8718 Education Data, Research & Evaluation in Nigeria Utako Tel +234 817 667 8243 Abuja, Nigeria Email [email protected] Website www.edoren.org
© EDOREN 32
GEP3; (ii) analysis of the quantitative baseline results of intervention and control schools in Local Government Areas (LGAs) in which GEP3’s early learning intervention is being implemented; and (iii)
analysis of the quantitative and qualitative baseline results for IQSs that are eligible for GEP3 support.
1.3 Organisation of the report
The baseline report is organised into two volumes: a synthesis evaluation report and a technical report. The synthesis evaluation report consolidates the main findings and supporting evidence
collected through various evaluation methods. It is designed to be accessible to all readers. The
present technical report of the GEP3’s baseline analysis, which complements the synthesis baseline report, covers the methodology and technical analysis in detail. It is intended for those interested in the design, methods, detailed statistical results, and detailed qualitative analysis of the evaluation. It is structured according to the three components of EDOREN’s evaluation activities:
Chapter 2 presents the baseline assessment of the GEP3 ToC. After a summary of the methodology used, it examines the plausibility of GEP3’s ToC. Next it assesses the appropriateness of GEP3’s
implementation strategy.
Chapter 3 describes the methodology and baseline results of GEP3’s early learning intervention evaluation. It starts with an overview of the GEP3 early learning intervention. Next, the evaluation
and baseline data collection methodology is presented. This is followed by a comparison of baseline characteristics between intervention and control schools, to check for balance as part of the
randomised control trial (RCT) design. The following section details the analysis of the baseline data.
Chapter 4 provides a presentation of the methodology and baseline results of the evaluation of
GEP3’s support to IQSs. An overview of GEP3’s support to IQSs is first provided, after which the evaluation design and data collection methods are discussed. Next, the analysis of the quantitative
and qualitative data collection is presented according to the contribution claims that are formulated based on the interventions’ ToC.
The annexes of this report provide additional detailed methodological and analytical information.
Evaluation of the Girl’s Education Project 3
Disclaimer EDOREN is a consortium of leading organisations in international development and education: Oxford Policy Management (OPM), and the Institute of Development Studies (IDS) at the University of Sussex, and is supported by UK Aid. EDOREN cannot be held responsible for errors or any consequences arising from the use of information contained in this report. Any views and opinions expressed do not necessarily reflect those of OPM, IDS and EDOREN or any other contributing organisation.
EDOREN No 2, 16 Mafemi Crescent Tel +234 810 727 8718 Education Data, Research & Evaluation in Nigeria Utako Tel +234 817 667 8243 Abuja, Nigeria Email [email protected] Website www.edoren.org
© EDOREN 33
2 Baseline assessment of GEP3’s Theory of Change
2.1 Objective of this report
This report presents the baseline assessment of the GEP3 ToC, in line with the GEP3 evaluation framework. The report focuses on two main evaluation questions as part of the evaluation of GEP3’s relevance:2
• How plausible is GEP3’s ToC in the context of the GEP3 states?
• How appropriate are GEP3’s interventions, in terms of implementation strategy, given the
context of the GEP3 states?
As discussed in the GEP3 evaluation framework, a first step in the evaluation process is to further
explicate and examine the ToC – in particular by interrogating causal pathways and influencing factors that enable GEP3 interventions to bring about intended outcomes. GEP3’s ToC diagram is
included in Annex A.3
The assessment pays particular attention to identifying factors that are likely to influence whether GEP3 achieves its outputs and outcomes. This allows implementing partners to pay attention to
these factors during project implementation, in order to improve the project’s likelihood for success and for M&E to assess and account for how GEP3 is achieving its outcomes.
2.2 Methodology
The assessment of GEP3’s ToC is based on KIIs that were undertaken mostly with state-level
stakeholders of GEP3. A number of national-level stakeholders or actors working in sectors relevant to GEP3 interventions were also interviewed. Furthermore, the assessment makes use of a document review, although an extensive review of secondary data sources or literature has not been carried out.
2 The evaluation framework identified a number guiding sub-questions. See Annex A. 3 The diagram is part of UNICEF’s (2015a) ToC document for the project.
Evaluation of the Girl’s Education Project 3
Disclaimer EDOREN is a consortium of leading organisations in international development and education: Oxford Policy Management (OPM), and the Institute of Development Studies (IDS) at the University of Sussex, and is supported by UK Aid. EDOREN cannot be held responsible for errors or any consequences arising from the use of information contained in this report. Any views and opinions expressed do not necessarily reflect those of OPM, IDS and EDOREN or any other contributing organisation.
EDOREN No 2, 16 Mafemi Crescent Tel +234 810 727 8718 Education Data, Research & Evaluation in Nigeria Utako Tel +234 817 667 8243 Abuja, Nigeria Email [email protected] Website www.edoren.org
© EDOREN 34
KIs were purposively selected to cover government staff in management positions in the education ministries, departments and agencies (MDAs) that constitute GEP3’s partnership, as well
representatives of government or non-government agencies involved in GEP3 implementation. Furthermore, some non-government informants that could provide further insights about specific interventions were selected.4 KIIs were spread across GEP3 interventions, putting an emphasis on different interventions in different GEP3 states. Annex B provides an overview of the focus that was placed on the interventions in each state. To identify the potential KIs, a long list of KIs was drafted in
collaboration with GEP3 state teams, which were subsequently discussed with each of the State Project Coordinators during a call. Based on this discussion and KI availability, a final list was selected by the evaluation team.
Fieldwork took place from 10 August until 27 August 2015, with two researchers spending approximately two days in each of the GEP3 state capitals (Katsina, Gusau, Sokoto, Minna and Bauchi). The research team conducted, on average, 11 face-to-face KIIs per state. KIIs with national-
level experts were conducted in Abuja or by phone. The list of people interviewed as part of the KIIs is presented in Annex B. The research team conducted a two-day participatory methods review
before the start of the interview period. The team met with DFID and UNICEF for a debrief after the interview period (in Abuja on 28 August).
Interviews followed semi-structured interview guides that were adapted to the interviewed
stakeholder and the interventions to be covered in each state. While the interview guides ensured that pre-set basic lines of inquiry were pursued, the semi-structured nature of the interviews allowed
for particular subjects to be further explored and expanded, in line with the exploratory nature of the baseline ToC assessment.
Following the methodology presented in the evaluation framework, the main lines of inquiry concerned:
• the education context of the state;
4 Non-government informants were selected based on the rich and concrete knowledge it was assumed they could provide about a specific intervention. They were selected by the research team in coordination with, and sometimes at the proposal of, GEP3 state teams and DFID.
Evaluation of the Girl’s Education Project 3
Disclaimer EDOREN is a consortium of leading organisations in international development and education: Oxford Policy Management (OPM), and the Institute of Development Studies (IDS) at the University of Sussex, and is supported by UK Aid. EDOREN cannot be held responsible for errors or any consequences arising from the use of information contained in this report. Any views and opinions expressed do not necessarily reflect those of OPM, IDS and EDOREN or any other contributing organisation.
EDOREN No 2, 16 Mafemi Crescent Tel +234 810 727 8718 Education Data, Research & Evaluation in Nigeria Utako Tel +234 817 667 8243 Abuja, Nigeria Email [email protected] Website www.edoren.org
© EDOREN 35
• the stakeholders’ understanding of project and/or intervention objectives and pathways to
change;
• factors influencing the outcomes of the project and/or its specific interventions;
• the stakeholders’ understanding of implementation strategies, and inputs and processes used as
part of this implementation.
Interviews were audio recorded after receiving consent from the interviewees and interview notes were transcribed with the support of the audio recordings. Data were organised and analysed by the research team using Nvivo qualitative data management software.
The methodology had certain limitations:
• Because of the exploratory nature of the inquiry, a priority was given to breadth over depth, by
interviewing a large number of stakeholders in order to allow the input of multiple perspectives. Furthermore, stakeholder meetings were also used to discuss the evaluation plans. This has
limited in-depth examination of specific interventions and causal pathways.
• Due to the GEP3 redesign and the 2015 elections, some KIs were new to GEP3’s redesigned
interventions and their implementation in specific states.5 Furthermore, some interventions, such as the early learning intervention and Girls for Girls (G4G) groups, had yet to be operationalised. This also limited the depth of the data collection.
• Due to time constraints, the interviews targeted state-level or national-level stakeholders.
Therefore, it was not possible to complete and triangulate the information obtained with stakeholders at local government level, although these individuals are important stakeholders in
the implementation of the GEP3 interventions.
5 Three out of five of the GEP3 state coordinators had recently started working in their specific state, although all of them had experience of working as part of GEP3 in other states. The Director of Planning, Research and Statistics in Katsina had only been in his position for two months. He was assisted in the interview by the GEP3 desk officer. The KI for the College of Education in Zamfara had only been the GEP3 focal person for one month.
Evaluation of the Girl’s Education Project 3
Disclaimer EDOREN is a consortium of leading organisations in international development and education: Oxford Policy Management (OPM), and the Institute of Development Studies (IDS) at the University of Sussex, and is supported by UK Aid. EDOREN cannot be held responsible for errors or any consequences arising from the use of information contained in this report. Any views and opinions expressed do not necessarily reflect those of OPM, IDS and EDOREN or any other contributing organisation.
EDOREN No 2, 16 Mafemi Crescent Tel +234 810 727 8718 Education Data, Research & Evaluation in Nigeria Utako Tel +234 817 667 8243 Abuja, Nigeria Email [email protected] Website www.edoren.org
© EDOREN 36
2.3 Plausibility of GEP3’s ToC
This chapter examines the plausibility of GEP3’s ToC by reviewing stakeholders’ common understanding of its intended outcomes, by interrogating the logic of its outcome chain, and by making more explicit factors that are necessary for, or may hinder, the achievement of the outcomes. The chapter first provides a bird’s-eye assessment of GEP3’s ultimate outcomes, its logic
and main proposed influencing factors. Next, a detailed discussion of different interventions per GEP3 output is presented. The chapter ends with an assessment of the plausibility of GEP3’s pilot-to-scale approach.
2.3.1 General assessment
The key project stakeholders are generally well aware of the envisioned ultimate outcome of GEP3,
in terms of improving girls’ education. Higher level government partners6, UNICEF field officers and
GEP3 state teams were asked about what the main results are that GEP3 intends to achieve by the end of the project. Increased girls’ school enrolment was well recognised as a main intended outcome, and was commonly linked to the target of getting 1 million additional girls into school. The
KIs recognise that GEP3’s ultimate success is also dependent on girls’ retention and improved learning. These outcomes were mentioned less frequently, particularly among government KIs,
which suggests that GEP3 is foremost associated with improving girls’ access to school, represented by its target of getting 1 million additional girls into school.
The UNICEF KIs in the field offices expect that increased girls’ enrolment will be easier to achieve
compared to retention or learning because the latter rely on education supply-side factors, such as
supply of qualified teachers, which is recognised as a key challenge (also by government KIs, see below). Consequently, teacher capacity development is widely supported as a key area of intervention, not only because of the recognition of current teacher capacity being an important
challenge but also because teaching quality is considered central to improving learning outcomes. Furthermore, community ownership through the work of the School-Based Management Committees (SBMCs) is commonly heralded as the solution to demand-side and supply-side
constraints and to governance problems. GEP3’s emphasis, since the redesign, on teaching quality
6 The question was asked at director and higher levels (permanent secretary or secretary) in the State Ministries of Education (SMoEs) and State Universal Basic Education Boards (SUBEBs).
Evaluation of the Girl’s Education Project 3
Disclaimer EDOREN is a consortium of leading organisations in international development and education: Oxford Policy Management (OPM), and the Institute of Development Studies (IDS) at the University of Sussex, and is supported by UK Aid. EDOREN cannot be held responsible for errors or any consequences arising from the use of information contained in this report. Any views and opinions expressed do not necessarily reflect those of OPM, IDS and EDOREN or any other contributing organisation.
EDOREN No 2, 16 Mafemi Crescent Tel +234 810 727 8718 Education Data, Research & Evaluation in Nigeria Utako Tel +234 817 667 8243 Abuja, Nigeria Email [email protected] Website www.edoren.org
© EDOREN 37
and community empowerment through SBMCs is therefore well aligned with stakeholders’ priorities and their understanding of how the quality of education can be improved. As will be
discussed in the next sections, the effectiveness of this strategy is dependent on a wide range of assumptions.
While gender-sensitive teaching practices, the involvement of Mothers’ Associations (MAs) and investment in the girl-friendliness of school environments are recognised by KIs as ways to improve the quality of education, particularly for girls, the KIIs provide little evidence about how this will be
operationalised, which in the end will determine how plausible it is that this outcome will occur.
While KIs have a relatively good knowledge of GEP3’s overall strategy, and appreciate the fact that
the redesign has improved the project’s focus, its operational design is less commonly understood. Attributes of intervention-specific outputs and outcomes—such as the priority target groups, the timing, and the nature of the outcome—are often not clear to KIs. This may be partly due to the redesign and the fact that some interventions still need to be operationally defined and
communicated. When output and outcome attributes are not clear, performance will be difficult to measure and assess.
The intermediate outcomes of GEP3’s different interventions are highly interlinked and synergetic, which supports the assumption in GEP3’s ToC that combined interventions will support the most vulnerable girls more effectively. For example, the cash transfer programme builds on the
sensitisation conducted by the enrolment drives and the capacity of the SBMCs to support the cash transfer enrolment and monitoring. The outcomes of teacher capacity building depend on the
supportive supervision by the head teacher and the school environment being improved via mini-
grants and community involvement. These synergies potentially reinforce the results of the
interventions, although they also constitute a risk of intervention problems spreading across the programme. In this regard, the SBMC empowerment intervention is key since most of GEP3’s school-level interventions assume functioning SBMCs. The fact that support to SBMCs was maintained in all
GEP3 focus schools as part of the project redesign is therefore important.7 As recognised in the GEP3 ToC document, the ToC also includes a potentially ‘negative’ relationship between increased access
and deteriorating teaching and learning quality. To the extent that supply-side investment does not keep up with increased enrolment, teaching and learning quality may be negatively affected. KIs
7 According to the GEP3 workplan refresher SBMC training is planned in all five GEP3 states.
Evaluation of the Girl’s Education Project 3
Disclaimer EDOREN is a consortium of leading organisations in international development and education: Oxford Policy Management (OPM), and the Institute of Development Studies (IDS) at the University of Sussex, and is supported by UK Aid. EDOREN cannot be held responsible for errors or any consequences arising from the use of information contained in this report. Any views and opinions expressed do not necessarily reflect those of OPM, IDS and EDOREN or any other contributing organisation.
EDOREN No 2, 16 Mafemi Crescent Tel +234 810 727 8718 Education Data, Research & Evaluation in Nigeria Utako Tel +234 817 667 8243 Abuja, Nigeria Email [email protected] Website www.edoren.org
© EDOREN 38
indicate that this risk is materialising (see below). Finally, it is worth noting that the complete package of interventions is not implemented in all GEP3 states. Therefore, combined interventions
can strengthen results in those contexts for which the different interventions are planned.
With regards to GEP3’s support to IQSs, KIs are supportive of integration and GEP3’s contribution to this. The KIs working with IQSs expect GEP3 to contribute to girls’ enrolment, retention and mainstreaming in the formal education system. Improved learning outcomes are mentioned by some KIs. It will be useful to clarify to what extent mainstreaming is an impact that GEP3 considers as
part of its scope. If mainstreaming is considered to fall within the scope of GEP3, this would require paying attention to barriers to mainstreaming. Poverty is mentioned as one such barrier.
‘There are many parents that have the interest at heart to send children to school, but they may not be able to cater for sending their children to secondary school. Poverty is one of the factors that motivates parents to send their children to Qur’anic school because it is free. These parents may still be too poor to facilitate mainstreaming once the children have passed
through Basic or Post-Basic.’ (Government KI, Bauchi)
To the extent that public education, in particular secondary education, is not fully free of charge,
poverty may inhibit a transition from IQSs to the public education system8. Some KIs claim there are no institutional barriers to mainstreaming, and suggest that IQS pupils are able to transition to a formal school without administrative hindrance. Nonetheless, it requires further investigation to
determine how easy it is for pupils to do so in practice.
The factors that influence GEP3’s ToC are discussed in more detail in the next sections. In this
section, we highlight the main factors:
• KIs confirm the findings of EDOREN’s political economy analysis (PEA) that a central factor affecting the success of the project is state governments fulfilling their commitment in terms of financial contributions to the project, especially the release of funds by the state executive governor. While the GEP3 ToC acknowledges this and has included interventions to mitigate this
risk factor, the KIs indicate this remains an important concern. A review by the State Partnership
8 While public basic education is officially free in Nigeria, parent–teacher association levies, the cost of school uniforms, writing materials and other ad hoc costs are major causes of non-enrolment, absenteeism and dropout (Humphreys and Crawfurd, 2014)

Evaluation of the Girl’s Education Project 3
Disclaimer EDOREN is a consortium of leading organisations in international development and education: Oxford Policy Management (OPM), and the Institute of Development Studies (IDS) at the University of Sussex, and is supported by UK Aid. EDOREN cannot be held responsible for errors or any consequences arising from the use of information contained in this report. Any views and opinions expressed do not necessarily reflect those of OPM, IDS and EDOREN or any other contributing organisation.
EDOREN No 2, 16 Mafemi Crescent Tel +234 810 727 8718 Education Data, Research & Evaluation in Nigeria Utako Tel +234 817 667 8243 Abuja, Nigeria Email [email protected] Website www.edoren.org
© EDOREN 39
for Accountability, Responsiveness and Capability (SPARC) and the State Accountability and Voice Initiative SAVI (2015) confirms that the public financial management situation in two out of three
GEP3 states examined is still poor.9 Furthermore, some of the recommendations of EDOREN’s PEA (2014) remain unaddressed. State government expenditure on GEP3 interventions can still not be systematically accessed, and it is necessary to rely on ad hoc requests to government counterparts to provide information on expenditures on GEP3 activities. The level of resource provision is not explicitly linked to the achievement of specific targets. However, positive
elements are that the newly elected governors seem to prioritise education in their discourse and have undertaken some steps to support education policy-making. GEP3’s focus on a narrower set of interventions following its redesign has allowed for more effective management
and follow-up of state commitments. Furthermore, UNICEF, together with state partners, has conducted high-level advocacy in relation to the state governors, which is mentioned by KIs as important in order to improve the likelihood of funding release.
• KIs agree that teaching quality is central to improving learning outcomes. Therefore, teacher-
related supporting factors, such as number of teachers, deployment and transfers of teachers, and motivation of teachers are considered key to the success of the programme. Monitoring of teachers is highlighted as being especially important.
• As mentioned above, the role of the community in the demand, supply and governance side of the school system is another factor emphasised by a large number of KIs. The community is
expected to directly contribute to school inputs and to the school environment in line with the slogan of the Universal Basic Education Commission (UBEC) ‘Education for all is the responsibility
of all’. Through the SBMCs, the community is also assumed to take ownership of school
development and oversight. Hence, the KIs confirm the key assumption in GEP3’s ToC that the
effectiveness of the SBMC/Centre-Based Management Committees (CBMCs) has an impact on GEP3’s outcomes. As will be discussed below, this presents two main risks. First, the high
expectations with regard to SBMCs may not match their capacity, as the capacity building process is expected to be gradual and SBMCs often start from a low initial capacity level. Second, community ownership and resource mobilisation may be promoted as a substitute for, rather
than a complement to, a state government that is accountable for providing and resourcing a quality education system.
9 SPARC and SAVI (2015), ‘State of the States – Political Economy, Prospects for Reform and Fiscal Conditions’, unpublished PowerPoint presentation, 13 July 2015.
Evaluation of the Girl’s Education Project 3
Disclaimer EDOREN is a consortium of leading organisations in international development and education: Oxford Policy Management (OPM), and the Institute of Development Studies (IDS) at the University of Sussex, and is supported by UK Aid. EDOREN cannot be held responsible for errors or any consequences arising from the use of information contained in this report. Any views and opinions expressed do not necessarily reflect those of OPM, IDS and EDOREN or any other contributing organisation.
EDOREN No 2, 16 Mafemi Crescent Tel +234 810 727 8718 Education Data, Research & Evaluation in Nigeria Utako Tel +234 817 667 8243 Abuja, Nigeria Email [email protected] Website www.edoren.org
© EDOREN 40
• Effective monitoring is highlighted by several KIs as key to the success of the project. This
corresponds to both monitoring and oversight of school activities by the SBMC, head teacher or local/state government officers, as well as monitoring of GEP3 project implementation. Some KIs link this to a need for interventions to have a stronger result orientation: holding people to account for results. KIs acknowledge that the monitoring systems are weak, although investments have been made in the past to strengthen monitoring and quality control.10
Therefore, GEP3 rightly emphasises monitoring in its ToC. However, effective monitoring requires a common understanding of the objectives, roles and responsibilities, and approach of the monitoring, and sufficient resources for implementation.
• In the case of IQSs, additional key influencing factors apply. KIs working in the field of integrated Qur’anic education argue that the buy-in of the proprietor for integration and project intervention is vital in order for interventions to lead to results. However, the baseline findings of
the IQS support (IQSS) evaluation indicate that school leadership in IQSs is complex. The management of the IQS is not an individual responsibility with clearly defined and delegated
responsibilities. Therefore, it will be important to take into account the voices of key community figures, given the influence they may have on the success of integration. Furthermore, the
selection of IQSs that actually and continuously offer formal education to girls is a prerequisite in order to improve girls’ education. While this is foreseen in the eligibility criteria used by GEP3,11 the baseline data collection indicates that in practice not all GEP3 IQSs are integrated or
have girls enrolled. The qualitative research also highlights that some IQSs may still be mobile (which needs confirmation at midline). Given that girls are unlikely to follow the Mallam when
the school moves, their education will potentially be interrupted.12
Furthermore, the project outcomes may be influenced by a wide variety of contextual, non-project-
related factors specific to each state. The presence of other projects contributing to the same outcomes is one such factor. These projects vary from state to state. For example, the Nigerian
10 In Sokoto, school quality assurance officers have been screened and trained with support of the Northern Education Initiative project. In Zamfara, according to a KI, the SUBEB recently supplied quality assurance officers with new motorcycles and fuel allowances. In Bauchi, the SUBEB expanded its zonal offices from three to 10 to ensure there are more quality assurance units closer to the schools. 11 IQSs are eligible for GEP3 support during the pilot phase when 40% of pupils are girls. 12 The term Mallam can have different interpretations. We consider the Mallam being the head of the religious school, responsible for the religious education.
Evaluation of the Girl’s Education Project 3
Disclaimer EDOREN is a consortium of leading organisations in international development and education: Oxford Policy Management (OPM), and the Institute of Development Studies (IDS) at the University of Sussex, and is supported by UK Aid. EDOREN cannot be held responsible for errors or any consequences arising from the use of information contained in this report. Any views and opinions expressed do not necessarily reflect those of OPM, IDS and EDOREN or any other contributing organisation.
EDOREN No 2, 16 Mafemi Crescent Tel +234 810 727 8718 Education Data, Research & Evaluation in Nigeria Utako Tel +234 817 667 8243 Abuja, Nigeria Email [email protected] Website www.edoren.org
© EDOREN 41
Partnership for Education Project (NIPEP) aims to support similar interventions as GEP3 in Katsina and Sokoto. This can create synergies between projects, but may also conflate outcomes. Similarly,
the Teacher Development Programme (TDP) is supporting in-service teacher training in Katsina, Zamfara and Niger.13 To the extent that TDP provides support to teachers from GEP3 focus schools synergies can be created, while at the same time it will be difficult to attribute changes in education outcomes to GEP3 alone.
Government policies and structures may also lead to variation in GEP3 outcomes from state to state.
For example, Niger State has had a policy of implementing Ward Development Projects, to decentralise investment in basic social services – including, among other things, in education.14 In
terms of government structures, states may have specific MDAs to support girls’ education or the integration of basic education in the Qur’anic schools. For example, the Zamfara government has established the Female Education Board, which is managing boarding schools targeted at girls. The previous government in Bauchi created the Directorate of Tsangaya Education, which provided
allowances to proprietors. Such institutional differences may influence GEP3’s results in different ways. Such institutions may complement GEP3 intervention and support GEP3 achieving its results.
The payment of proprietor allowances is one such example. On the other hand, to the extent that these institutions compete for the same state resources they may influence the capacity of GEP3’s direct government partners to implement interventions. The national and state elections that were
held in March and April 2015 respectively may alter government policies and structures. At the time of the interviews, it was yet to be seen which GEP3 states would change their education policy,
structures or budget prioritisation as a result of the elections.
Finally, GEP3’s outcomes will be affected by a broader set of socioeconomic, demographic, cultural
and political factors. Insecurity and conflict were mentioned in Bauchi, Zamfara and Katsina as having affected schooling. In Bauchi, this has resulted in the state education system having to cope with an inflow of internally displaced people. In Zamfara and Katsina, truancy among both pupils and
female teachers occurs due to fears regarding security, especially in the outskirts of the two states.
13 In its first phase, from 2014, TDP operates in Jigawa, Zamfara and Katsina. There are plans to extend it to Kano, Kaduna and Niger states in late 2016. 14 The policy awards 100,000 Nigerian Naira (NGN) per month for education development at ward level.

Evaluation of the Girl’s Education Project 3
Disclaimer EDOREN is a consortium of leading organisations in international development and education: Oxford Policy Management (OPM), and the Institute of Development Studies (IDS) at the University of Sussex, and is supported by UK Aid. EDOREN cannot be held responsible for errors or any consequences arising from the use of information contained in this report. Any views and opinions expressed do not necessarily reflect those of OPM, IDS and EDOREN or any other contributing organisation.
EDOREN No 2, 16 Mafemi Crescent Tel +234 810 727 8718 Education Data, Research & Evaluation in Nigeria Utako Tel +234 817 667 8243 Abuja, Nigeria Email [email protected] Website www.edoren.org
© EDOREN 42
KIs in Niger pointed out that, given the size of Niger State,15 improving school infrastructure and accessibility is proportionally more difficult compared to smaller states.
2.3.2 Output 1: Increased enrolment and retention of girls in basic education
Under Output 1 GEP3 seeks to increase girls’ enrolment and retention in basic education by addressing barriers which affect demand. Three interventions that contribute to this result are
supported (see details below):
• enrolment drives: annual campaigns to identify out-of-school girls and to encourage school
enrolment and retention;
• a cash transfer programme: unconditional cash transfers provided to female caregivers of all girls between the ages of six and 15 living in selected primary school catchment communities;
• G4G groups: girls’ groups established in primary schools and IQSs under the guidance of a
matron selected from the school’s MA or from among the female teachers.
In addition, the project intends to influence supply in order to meet increased demand, with the support of high-level political engagement.
While this output is formulated to cover basic education, the emphasis of the interventions has shifted to primary school education after the GEP3 redesign. Enrolment drives do cover the whole
range of basic education, including early child care development and education (ECCDE) and junior
secondary school (JSS) education, but the cash transfer programme—even though it covers girls
beyond primary school age—is organised around a selection of primary schools. The G4G groups will similarly be operationalised in primary schools. Hence, results are more likely to be achieved in primary education rather than across the entire basic education cycle.
15 Niger State is the largest state in Nigeria in terms of surface area. On average, Niger has four primary schools per 100 km2, compared to nine per 100 km2 in Katsina.
Evaluation of the Girl’s Education Project 3
Disclaimer EDOREN is a consortium of leading organisations in international development and education: Oxford Policy Management (OPM), and the Institute of Development Studies (IDS) at the University of Sussex, and is supported by UK Aid. EDOREN cannot be held responsible for errors or any consequences arising from the use of information contained in this report. Any views and opinions expressed do not necessarily reflect those of OPM, IDS and EDOREN or any other contributing organisation.
EDOREN No 2, 16 Mafemi Crescent Tel +234 810 727 8718 Education Data, Research & Evaluation in Nigeria Utako Tel +234 817 667 8243 Abuja, Nigeria Email [email protected] Website www.edoren.org
© EDOREN 43
2.3.2.1 Enrolment drives
Enrolment drive campaigns are annual events that have broad acceptance and support among stakeholders. They are meant to be led by SBMCs and MAs, with the support of community leaders and religious leaders. All KIs perceive these drives as an effective mechanism for increasing
enrolment, by raising parental awareness about education. This appreciation follows from their multidimensional nature in terms of involving a wide range of stakeholders at different levels (state, local government and community), using multiple communication strategies, and multiple messages that can speak to a diverse audience. While the campaigns cover basic education in general, the inclusion of girls and other disadvantaged groups is emphasised.16 The fact that the enrolment drives
are able to penetrate the communities, with the active involvement of the communities themselves, is highlighted as a key feature in regard to their effectiveness.
The intervention is based on the assumption that demand for education is the result of people’s
knowledge about the benefits of education, and the extent to which they have the right attitudes and interests with regards to education. The expectation is that the provision of information will influence their awareness, attitudes and behaviour. In the diverse context of the GEP3 states, the
level of awareness of, and attitudes towards, girls’ education varies. Several KIs point out that the cultural acceptance of ‘Western’ education and the appreciation of the value of education have
improved considerably. These attitudes vary regionally and between rural and urban areas.17 Therefore, as awareness and attitudes change, enrolment drives will need to become more contextualised – targeting the right message to the right people. Some KIs indicated that this is
already taking place, in the form of intensifying campaigns in areas of low enrolment.
Changes in awareness and attitudes do not necessarily result in changes in behaviour. In particular,
poverty or other constraints may inhibit actual changes in behaviour. GEP3 acknowledges this in its design by piloting a cash transfer programme to tackle the financial barrier posed by poverty. As
awareness and attitudes change, the financial barrier may become relatively more important and the need to expand an intervention targeting this barrier may increase. However, we assess that
16 KIs pointed out that last year’s enrolment drive emphasised the enrolment of children from ethnic minorities and physically disadvantaged children. 17 In Bauchi, KIs highlighted the difference between the Northern, Central and Southern region. Acceptance of, and an interest in, formal education is higher in the Southern region, which traditionally has been influenced by Christian missions, and the Central regional, which is influenced by the Bauchi urban centre.

Evaluation of the Girl’s Education Project 3
Disclaimer EDOREN is a consortium of leading organisations in international development and education: Oxford Policy Management (OPM), and the Institute of Development Studies (IDS) at the University of Sussex, and is supported by UK Aid. EDOREN cannot be held responsible for errors or any consequences arising from the use of information contained in this report. Any views and opinions expressed do not necessarily reflect those of OPM, IDS and EDOREN or any other contributing organisation.
EDOREN No 2, 16 Mafemi Crescent Tel +234 810 727 8718 Education Data, Research & Evaluation in Nigeria Utako Tel +234 817 667 8243 Abuja, Nigeria Email [email protected] Website www.edoren.org
© EDOREN 44
the implementation of a cash transfer programme across GEP3 states at scale is unlikely (see below).
KIs acknowledge that the objective of the enrolment drives is not only to increase enrolment but also to retain girls in school, which is considered to be the more difficult objective to achieve. Retention will be influenced, among other things, by parents’ and girls’ perceptions regarding the quality of education, which will depend on schools being able to meet the increased demand with adequate facilities and teachers. The GEP3 ToC has identified as a key assumption that government can supply
primary school and teachers to meet increasing demand. In all states KIs perceived that increased enrolment is not sufficiently accommodated in terms of key resources such as teachers and
classrooms, although some see this as a problem that is mainly materialising in urban areas.
‘However, a weakness of enrolment drive is that they over enrol. This is the one area where some SBMC members complain. There are more children enrolled than the facilities, infrastructures, materials or teachers provided. In some schools only one teacher, the head teacher or Arabic
teacher. There may be over 200 pupils with just two classes; the infrastructure is just not there. Parents are complaining: you asks us to send children to school but where are the teachers, where
are the classes?’ (Non-government KI, Zamfara)
‘In educationally advanced communities the schools become overstretched. (…) In Bauchi now the classes are overstretched; there is a class that has 150 pupils, 180 even 200 pupils in one class
both in the primary and junior secondary. Inside Bauchi, Toro, Azare, and others that are in the urban areas most of the schools are overstretched.’ (Government KI, Bauchi)
This may create a backlash in regard to parents’ and girls’ responses, as well as in regard to SBMCs’ efforts in relation to enrolment drives. The most serious challenge lies in sufficient teacher supply in
rural areas and infrastructure supply in urban areas. Furthermore, as the enrolment drives expand their reach on the demand side—for example, by targeting ECCDE and the enrolment of disabled children—the risk of the supply side not meeting higher demand increases.
Besides the response on the supply side, KIs highlighted the following other key factors that will influence whether enrolment drives achieve their intended results:

Evaluation of the Girl’s Education Project 3
Disclaimer EDOREN is a consortium of leading organisations in international development and education: Oxford Policy Management (OPM), and the Institute of Development Studies (IDS) at the University of Sussex, and is supported by UK Aid. EDOREN cannot be held responsible for errors or any consequences arising from the use of information contained in this report. Any views and opinions expressed do not necessarily reflect those of OPM, IDS and EDOREN or any other contributing organisation.
EDOREN No 2, 16 Mafemi Crescent Tel +234 810 727 8718 Education Data, Research & Evaluation in Nigeria Utako Tel +234 817 667 8243 Abuja, Nigeria Email [email protected] Website www.edoren.org
© EDOREN 45
• The role of the SBMCs and MAs are considered central to the success of the enrolment drives.
Their role is not only seen in terms of channelling the campaign messages directly into the communities, but also in terms of facilitating supply-side responses to the increased demand by mobilising community resources, signalling supply-side bottlenecks to local or state government education officials and/or potentially holding government to account to resolve such bottlenecks. As will be discussed below, the multiple roles that SBMCs are expected to take on
may not be in line with their emerging and gradual capacity building and empowerment process, particularly in rural areas. Hence, their functionality and capacity is a key assumption for successful enrolment drives. GEP3 has included SBMC capacity building as part of its design and ToC, which strengthens the plausibility of this assumption being met. Nonetheless, the
assumption will require close monitoring, which is foreseen in GEP3’s design, via the SBMC effectiveness monitoring.
• KIs confirm the positive contribution that traditional leaders and female role models make in regard to girls’ enrolment. Traditional leaders are considered credible opinion leaders who can
address socio-cultural norms, while female role models are assumed to emanate the benefits of girls’ education. KIs value GEP3-supported actions that strengthen this factor, such as
incorporating traditional leaders in zonal meetings, the contribution of the High-Level Women Advocates (HiLWA) group and the expansion of female SBMC/MA members in the orientation meeting of the enrolment drives.
In terms of contextual, non-GEP3-related factors that will influence the impact of the enrolment drives, the security situation is a risk factor. KIs indicate that in Bauchi, the Boko Haram insurgency
lowered school enrolment in 2014 in some areas where attacks occurred. Enrolment is also affected
by the immigration of internally displaced persons from neighbouring states. The security situation
was also identified as an influencing factor in Zamfara and Katsina. Finally, it is important to recognise that high fertility in northern Nigeria will increase the school age population and
subsequently may contribute to increased enrolment.
2.3.2.2 Cash transfer programme
The unconditional cash transfer programme that is being piloted in Niger and Sokoto aims to reduce the poverty-related barrier that is preventing girls’ enrolment and retention. KIs have a common understanding of this objective: they generally perceive the programme as an effective strategy
Evaluation of the Girl’s Education Project 3
Disclaimer EDOREN is a consortium of leading organisations in international development and education: Oxford Policy Management (OPM), and the Institute of Development Studies (IDS) at the University of Sussex, and is supported by UK Aid. EDOREN cannot be held responsible for errors or any consequences arising from the use of information contained in this report. Any views and opinions expressed do not necessarily reflect those of OPM, IDS and EDOREN or any other contributing organisation.
EDOREN No 2, 16 Mafemi Crescent Tel +234 810 727 8718 Education Data, Research & Evaluation in Nigeria Utako Tel +234 817 667 8243 Abuja, Nigeria Email [email protected] Website www.edoren.org
© EDOREN 46
and indicate that high interest in the programme in the targeted communities can be counted on
despite initial mistrust among some parents about the intervention’s intentions, which resulted in some eligible girls not being registered. The Sokoto and Niger PIUs argue that the high community interest is also demonstrated by the demand for the programme that is now coming from non-eligible communities.
The PIUs are well informed about the key features of the cash transfer programme, such as the
geographical categorical targeting of the beneficiaries and its unconditionality. They are especially supportive of the unconditional nature of the cash transfer because conditionality could undermine the income-smoothening effect by denying transfers to those who fail to satisfy conditions, such as
school attendance – potentially in those times when the transfer is needed most (for example, when the child falls ill). The effectiveness of the unconditional nature of the cash transfer is, however, contested by other KIs, who favour some form of conditionality based on the girls coming to school,
on the assumption that this will incentivise attendance as families would lose the cash transfer when a certain attendance threshold is not met. While the KIs confirm that the cash transfer focuses on
alleviating the poverty barrier to girls’ education, they also acknowledge the importance of sensitisation and the role of the SBMCs and head teachers in following up on attendance.
‘It is the sensitisation that matters, so that people understand that even though there is no
condition they send their children to school (…). The involvement of SBMC and traditional leaders in the cash transfer programme helped a lot in the sensitisation of the communities.’ (Non-
government KI, Sokoto)
Furthermore, the PIUs claim that the non-payment of several transfers during the first year of
implementation18 did not substantially affect school participation, which, if this holds true, indicates that factors other than income may be influencing the participation decision and may, therefore, influence the achievement of outcomes. However, no data were provided to support this claim and UNICEF has indicated that the PIUs have not documented enrolment and school attendance of cash
transfer beneficiaries.
18 At the time of the interview, only one payment out of four was transferred in Sokoto, while two payments were outstanding in Niger.
Evaluation of the Girl’s Education Project 3
Disclaimer EDOREN is a consortium of leading organisations in international development and education: Oxford Policy Management (OPM), and the Institute of Development Studies (IDS) at the University of Sussex, and is supported by UK Aid. EDOREN cannot be held responsible for errors or any consequences arising from the use of information contained in this report. Any views and opinions expressed do not necessarily reflect those of OPM, IDS and EDOREN or any other contributing organisation.
EDOREN No 2, 16 Mafemi Crescent Tel +234 810 727 8718 Education Data, Research & Evaluation in Nigeria Utako Tel +234 817 667 8243 Abuja, Nigeria Email [email protected] Website www.edoren.org
© EDOREN 47
KIs recognise the synergy between the cash transfer programme and the enrolment drives. The
latter reinforces the sensitisation around the cash transfer programme. In Sokoto, the cash transfer programme was launched in the week of the enrolment drive. In addition, the on-the-spot school enrolment at the time of the cash transfer payment is also mentioned as an effective feature contributing to girls’ enrolment.
The KIs highlighted the following key factors that influence the outcomes of the cash transfer
programme:
• Similar to enrolment drives, the commitment and capacity of SBMC members to support
effective sensitisation and attendance monitoring are highlighted as important contributions to the success of the cash transfer programme. In addition, SBMCs are considered to provide supply-side inputs to increased enrolment due to the cash transfer programme. In turn, the cash transfer programme may influence the role of the SBMCs by strengthening their function in the
school and community (with an associated risk of undermining it if they cannot transparently and adequately implement that role).19
• Again, similar to enrolment drives, supply-side factors like the availability and attendance of teachers are considered key to motivating parents to send their children to school.
• Community communication and sensitisation regarding the educational objective of the cash transfer is also seen as essential, given the unconditional design.20 This may change how parents
perceive education. However, this is likely to be affected by parents’ perceptions of the quality of supply-side factors and the credibility of the people involved in the sensitisation. The latter is
linked again to the involvement of SBMCs and traditional leaders.
Two interrelated, central influencing factors that GEP3 has less influence on are the broader legal and policy framework with regards to social protection in GEP3 states, as well as political
19 The roles and responsibilities of the SBMC in the GEP3 cash transfer programme include: 1) conducting mobilisation and sensitisation activities; 2) assisting households with appeals, complaints and change management procedures; 3) communicating details of the payment day to beneficiary households; 4) being present on the payment days to assist communication, identity verification and submission of appeals, complaints and change management requests; and 5) if instructed, conducting home visits of girls that are not enrolled or not attending regularly (GEP3-CTP Operational Manual). 20 Benhassine et al. (2015) found evidence, based on a randomised control trial in Morocco, that a ‘labelled’ cash transfer, which makes the education objective of the cash transfer clear, is enough to improve enrolment, with no need for explicit conditions.
Evaluation of the Girl’s Education Project 3
Disclaimer EDOREN is a consortium of leading organisations in international development and education: Oxford Policy Management (OPM), and the Institute of Development Studies (IDS) at the University of Sussex, and is supported by UK Aid. EDOREN cannot be held responsible for errors or any consequences arising from the use of information contained in this report. Any views and opinions expressed do not necessarily reflect those of OPM, IDS and EDOREN or any other contributing organisation.
EDOREN No 2, 16 Mafemi Crescent Tel +234 810 727 8718 Education Data, Research & Evaluation in Nigeria Utako Tel +234 817 667 8243 Abuja, Nigeria Email [email protected] Website www.edoren.org
© EDOREN 48
leadership changes and subsequent policy priority changes. Currently, no social protection legal
framework is in place in GEP3 states that can provide continuity and stability to a cash transfer programme. This means that the policy purpose of a cash transfer programme may shift because of changes in state-level leadership or funding priorities at federal and donor level. According to KIs, the discontinuation of the education cash transfer pilots in Bauchi and Katsina was influenced by changes in political leadership and a re-prioritisation of the purpose of cash transfers: to poverty alleviation
rather than education. In Niger and Sokoto, the first year of operations of the GEP3 cash transfer pilot has been affected by the elections and the transition in political leadership. As recognised by the GEP3 ToC and confirmed by the KIs, state funding support for cash transfers depends on the policy priorities of the new governors, the federal government mechanism and donor priorities.
2.3.2.3 G4G
According to the GEP3 ToC, G4Gs seek to empower schoolgirls and to address their retention by
providing them with a space in which to meet and address issues which affect their school participation. This is done under the guidance of female teachers/matrons who can act as role
models. The G4Gs are to be established under the umbrella of the SBMC/CBMC, to ensure sustainability, under the assumption that SBMCs/CBMCs take ownership of the groups and promote their implementation beyond the termination of external support.
It is planned that the G4G intervention will be implemented in 2016–2017, and so it is yet to be operationalised. It would strengthen the plausibility of the intervention’s ToC to clearly specify and
agree on the intervention’s objectives, its target population and the conceptualisation of girls’
empowerment. With regard to the objectives, at the time of the KIIs it was not clear whether the
intervention aims to achieve the retention of in-school girls or/and the (re) enrolment of out-of-school girls. The GEP3 ToC document (UNICEF 2015a) presents G4G as an intervention that seeks to
address girls’ retention, while the GEP3 SBMC strategy paper (UNICEF, 2015g) introduces its purpose as being to create a platform for the empowerment of girls to exercise their right to enrol and remain in school.21 Closely related is the specification of the target population. It needs to be clear
whether out-of-school girls are a direct target population of G4G (and hence invited to be members of the G4G), an indirect target population (reached through in-school G4G members), or not a target
21 As part of the review of this document, UNICEF specified that the objective of the G4G is the retention of girls enrolled in primary schools.
Evaluation of the Girl’s Education Project 3
Disclaimer EDOREN is a consortium of leading organisations in international development and education: Oxford Policy Management (OPM), and the Institute of Development Studies (IDS) at the University of Sussex, and is supported by UK Aid. EDOREN cannot be held responsible for errors or any consequences arising from the use of information contained in this report. Any views and opinions expressed do not necessarily reflect those of OPM, IDS and EDOREN or any other contributing organisation.
EDOREN No 2, 16 Mafemi Crescent Tel +234 810 727 8718 Education Data, Research & Evaluation in Nigeria Utako Tel +234 817 667 8243 Abuja, Nigeria Email [email protected] Website www.edoren.org
© EDOREN 49
group at all. The GEP3 ToC document and GEP3 SBMC strategy paper seem to suggest that out-of-
school girls are a target population, indicating that G4G will ‘develop an action plan for community sensitisation and [promote] the enrolment of out-of-school girls’ and that members of G4G groups will ‘serve as peer mobilisers, identifying their peers who are never enrolled or dropped out of school’.22 Furthermore, the age of the target population will require consideration as barriers to education vary according to the girls’ lifecycle.
Finally, girls’ empowerment is a multidimensional concept, ranging from more tangible conditions like access to resources to more intangible, subjective values, feelings and perceptions – both at the individual and the structural level. In sum, the focus, scope, conceptual foundation and strategy of
the intervention needs to be clarified to enhance the plausibility of its ToC.
Some factors that KIs mentioned as influencing the likely success of G4G are:
• The school needs to have female teachers or MA members to act as matrons and role models
for the girls. KIs confirm that the deployment of female teachers to rural schools is challenging. The Strengthening Women and Girls’ Spaces (SWAGS) project dealt with this challenge by liaising
with the Education Secretaries at the local government level in order to transfer female teachers to a limited number of pilot schools. However, it seems less feasible to implement this process at scale across all rural schools.
• Low quality teaching and unqualified teachers at the school may potentially affect girls’ retention. Empirical testing would be required to determine the extent to which a G4G could
counter the negative effect on retention of a low quality teaching environment.
• Head teachers need to be convinced about the programme so that their leadership can facilitate the functioning of the G4G. Equally, the buy-in by, and functioning of, the SBMC/MA, under the
umbrella of which the G4G will be established, is required. Parents – particularly of out-of-school
girls – should also be convinced about this approach.
• A KI questioned how girls will be motivated to participate in G4G meetings. Vocational activities are suggested as a means to motivate girls. However, to the extent that such vocational activities
22 As part of the review of this document, UNICEF indicated that out-of-school girls are not a target population of the intervention.
Evaluation of the Girl’s Education Project 3
Disclaimer EDOREN is a consortium of leading organisations in international development and education: Oxford Policy Management (OPM), and the Institute of Development Studies (IDS) at the University of Sussex, and is supported by UK Aid. EDOREN cannot be held responsible for errors or any consequences arising from the use of information contained in this report. Any views and opinions expressed do not necessarily reflect those of OPM, IDS and EDOREN or any other contributing organisation.
EDOREN No 2, 16 Mafemi Crescent Tel +234 810 727 8718 Education Data, Research & Evaluation in Nigeria Utako Tel +234 817 667 8243 Abuja, Nigeria Email [email protected] Website www.edoren.org
© EDOREN 50
require resources to operate, resource mobilisation will need to be incorporated as part of the G4G activities, to make them sustainable.23
An important contextual factor that will influence girls’ participation in G4G meetings is the accessibility and security of the school. It can be expected that the outcomes of G4G will vary between more rural and urban areas, given the differences in school accessibility.
2.3.3 Output 2: Improved capacity of teachers to deliver effective learning for girls
Interventions under GEP3’s Output 2 seek to ensure that, once girls are enrolled, improved teaching
quality and school management result in better learning outcomes. Particular emphasis is put on early grade instruction and learning, because early acquisition of literacy and numeracy skills is considered foundational for future learning. The following interventions are implemented with the aim of achieving this outcome:
• Teacher capacity development: training and mentoring of primary school and IQS teachers, with, at the core, a 1.5-year cycle of monthly cluster-level training/mentoring meetings initiated by
five-day induction workshop;
• Head teacher capacity development: cycle of three-day training sessions per term over a two-
year period for primary schools and IQS head teachers;
• Early learning interventions: early grade teacher in-service professional development in primary schools and IQSs, including cluster-level training, weekly school-based peer-mentoring, on-site
monthly monitoring, head teacher training, and teaching and learning material distribution.
The overall logic and objectives of this output are widely understood and supported by KIs. Low learning outcomes and inadequate teaching quality are commonly recognised as key problems. A
wide range of KIs argued, in line with GEP3’s ToC, that tackling the quality of teaching and teachers is central to improving learning outcomes, while acknowledging that this needs to be supported by an
improvement in the broader learning environment. The capacity of the head teacher is recognised as
23 Resource mobilisation is indicated in the Transforming Education for Girls in Nigeria (TEGIN) Girls’ Club Manual as contributing to the effective running and sustainability of a girls’ club.
Evaluation of the Girl’s Education Project 3
Disclaimer EDOREN is a consortium of leading organisations in international development and education: Oxford Policy Management (OPM), and the Institute of Development Studies (IDS) at the University of Sussex, and is supported by UK Aid. EDOREN cannot be held responsible for errors or any consequences arising from the use of information contained in this report. Any views and opinions expressed do not necessarily reflect those of OPM, IDS and EDOREN or any other contributing organisation.
EDOREN No 2, 16 Mafemi Crescent Tel +234 810 727 8718 Education Data, Research & Evaluation in Nigeria Utako Tel +234 817 667 8243 Abuja, Nigeria Email [email protected] Website www.edoren.org
© EDOREN 51
an important supporting factor. Furthermore, KIs validated the importance of early grade learning as a means of acquiring basic literacy and numeracy, and paving the way for successful learning
outcomes in later grades.
Before presenting an intervention-level discussion below, it is important to highlight that in general monitoring and supervision are considered key supporting factors to translate the capacity building of teachers and head teachers into school-level behaviour change, and ultimately improved learning outcomes. This is recognised in GEP3’s ToC, which supports its plausibility. Some
KIs expressed their appreciation for GEP3’s increased emphasis on the issue since its redesign.
‘We need better monitoring. When you train facilitators, give them support and motivate them, it
is better to supervise or monitor them to see if work is being done or not. Monitoring and supervision is very important. Sometimes monitoring happens; especially those that are paid NGN 7,500, they supervise.’ (Non-government KI, Sokoto)
‘GEP3 introduced monitoring. After training the teachers are monitored in their schools; how are
they imparting the knowledge that they acquired during training? This will help a lot to get the learning outcomes. What happens in training is different from what happens in the classroom.’
(Government KI, Katsina)
The plausibility of GEP3’s ToC with respect to monitoring can be strengthened by building a common understanding among stakeholders about the objectives of the different types of monitoring
activities. Different types of monitoring and supervision are present in GEP3’s ToC in different ways – each with their own logic and objectives. These types of monitoring and supervision are currently not
well distinguished, commonly understood or spelled out. Several KIs point out the importance of SBMC members monitoring teachers, but KIs do not have a common understanding about the focus
and scope of this monitoring. For example, it remains ambiguous whether SBMC members are mandated to monitor teaching practice and outcomes, rather than to focus on monitoring teacher attendance.24 Head teacher monitoring is commonly understood as including pedagogical
supervision and mentoring, but it is not clear how this will work for IQS proprietors who may not have a pedagogical background or interest. Trainers of teachers and head teachers are meant to
24 According to UNICEF, SBMCs are meant to only monitor teacher attendance, not pedagogical practices, which is the responsibility of head teachers and teacher trainers. However, the GEP3 ToC document (UNICEF 2015a) indicates that ‘they [SBMCs] will also exercise oversight over the performance of the school and the quality of the education provided (…)’.

Evaluation of the Girl’s Education Project 3
Disclaimer EDOREN is a consortium of leading organisations in international development and education: Oxford Policy Management (OPM), and the Institute of Development Studies (IDS) at the University of Sussex, and is supported by UK Aid. EDOREN cannot be held responsible for errors or any consequences arising from the use of information contained in this report. Any views and opinions expressed do not necessarily reflect those of OPM, IDS and EDOREN or any other contributing organisation.
EDOREN No 2, 16 Mafemi Crescent Tel +234 810 727 8718 Education Data, Research & Evaluation in Nigeria Utako Tel +234 817 667 8243 Abuja, Nigeria Email [email protected] Website www.edoren.org
© EDOREN 52
conduct follow-up monitoring that is supposed to include a mentoring element. However, how this will be operationalised remains vague. Also, local and state government education staff have a
monitoring function, which is generally under-resourced. How their monitoring function aligns with the before-mentioned monitoring roles is also unclear.
Like many interventions, monitoring and supervision can be effective when the right conditions are met. For example, KIs confirm that the monitoring potential of a CBMC is circumscribed by the willingness of the IQS proprietor to support such monitoring. The supervisory leadership of a head
teacher is conditioned by his/her own capability, credibility and power to act. Many KIs have high expectations of the monitoring role of SBMCs but also acknowledge their still emerging capacity.
Such potential constraints need greater recognition and review, in order to be able to adapt school monitoring to the actual conditions in the schools.
2.3.3.1 Teacher capacity development
As mentioned above, there is a wide consensus among the KIs that developing teacher capacity in primary schools and IQSs is highly relevant, and this is well accepted as an objective of the project. The importance of emphasising gender-sensitive teaching practices as part of GEP3, in order to
improve outcomes for girls, is acknowledged, although one KI highlighted that it is more relevant in upper primary grades, when gender stereotyping becomes more pronounced. Other elements that
several KIs emphasise as a means to improving learning outcomes particularly for girls are: 1) increasing their interest in schooling by promoting the benefits of education via female teacher role models, career talks or vocational skills training; and 2) improving the girl-friendliness of the school
environment by ensuring appropriate water and sanitation and security.
In order to fully assess how plausible it is that this teacher capacity development will lead to results, it is important to consider the attributes of its approach and intended outcomes, such as what
capacities need to be developed, whose capacities these are and how and when these will be developed. The GEP3 Strategy Paper on School-based Teacher Development (UNICEF 2015h) outlines some of these elements, such as a focus on pedagogical and content knowledge. However, KIs are generally not well aware of such attributes of the redesigned teacher capacity development approach. Even government stakeholders involved in the IQS facilitator training scheduled for early
September 2015 had only a vague understanding of the features of this training. Government KIs in
Evaluation of the Girl’s Education Project 3
Disclaimer EDOREN is a consortium of leading organisations in international development and education: Oxford Policy Management (OPM), and the Institute of Development Studies (IDS) at the University of Sussex, and is supported by UK Aid. EDOREN cannot be held responsible for errors or any consequences arising from the use of information contained in this report. Any views and opinions expressed do not necessarily reflect those of OPM, IDS and EDOREN or any other contributing organisation.
EDOREN No 2, 16 Mafemi Crescent Tel +234 810 727 8718 Education Data, Research & Evaluation in Nigeria Utako Tel +234 817 667 8243 Abuja, Nigeria Email [email protected] Website www.edoren.org
© EDOREN 53
Bauchi involved in the school-based teacher development did not know what the redesigned school-based teacher development approach would look like.
While the GEP3 school-based teacher development strategy paper and GEP3 ToC postulate as a first assumption that where teacher development is well targeted and relevant teachers’ performance will improve, what this targeting entails remains unclear in the strategy documents. Targeting specific groups of teachers rarely came up during the KIIs as critical in order to improve teaching or learning, although once probed KIs do support targeting early grade teachers. This may be due to the
fact that the capacity needs are common to most teachers, or, as one KI pointed out, that teacher training has traditionally been about all teachers ‘fairly’ benefitting from training, rather than
implementing training with a purpose and result in mind, such as training those teachers that may contribute most to improving pupils learning outcomes. Several KIs acknowledge that in the past, the selection of training participants has resulted in unqualified people being invited and such selection lacked monitoring.25 Others point out that the ‘right’ or ‘trainable’ teachers need to be trained but
what the attributes of such right and trainable teachers are remains undefined. Therefore, it would increase the plausibility of the ToC as regards achieving its outcomes if the approach to targeting was
elaborated on, in terms of which teachers it would be best to train and with what result in mind.
In general, the KIs interviewed on the topic favoured a child-centred, active learning approach to teaching, with a focus on basic literacy and numeracy. The communication and language skills of
teachers are also mentioned as an element to include in teacher training. Monitoring and supervisory follow-up visits are considered key to achieving results.
A cluster approach for follow-up teacher interaction is valued as a means for continuous learning and
sharing of experiences. However, KIs question whether resources will be available for trainees and
mentors to attend regular meetings, and whether the mentors will be sufficiently prepared to effectively facilitate the meetings. A one-off training approach is considered to be insufficient to achieve changes in teaching practices, which the GEP3 teacher development approach has taken into
account by programming follow-up mentoring.
25 This was confirmed by the IQSS baseline survey, which found that around one-fifth of trained facilitators that were found in IQSs eligible for the survey were not teaching at the school.

Evaluation of the Girl’s Education Project 3
Disclaimer EDOREN is a consortium of leading organisations in international development and education: Oxford Policy Management (OPM), and the Institute of Development Studies (IDS) at the University of Sussex, and is supported by UK Aid. EDOREN cannot be held responsible for errors or any consequences arising from the use of information contained in this report. Any views and opinions expressed do not necessarily reflect those of OPM, IDS and EDOREN or any other contributing organisation.
EDOREN No 2, 16 Mafemi Crescent Tel +234 810 727 8718 Education Data, Research & Evaluation in Nigeria Utako Tel +234 817 667 8243 Abuja, Nigeria Email [email protected] Website www.edoren.org
© EDOREN 54
The GEP3 ToC indicates that IQS facilitator capacity development will be adapted to teaching and learning in the IQS environment. There are likely to be large variations in the backgrounds of the IQS
facilitators and the IQSs in which they are teaching. Some facilitators are teachers in the formal education system while others are community members with little in the way of teaching qualifications.26 Teaching hours, availability of materials, teaching facilities, pupil characteristics,27 type of IQS28 and proprietor support are likely to vary considerably. Therefore, the capacity building approach does not only need to be adapted to the IQS context, but also needs to take into account
large variations in that context.
‘The pedagogy, approach, and the method are different in non-formal compared to formal.
UNICEF training used to join facilitator and teacher training, but in reality it is different. These facilitators would just go, hear and learn, but they cannot go to their level and use it because the strategy is different totally.’ (Government KI, Katsina)
The GEP3 IQS strategy paper justifiably emphasises the importance of mentoring in the capacity
building process. This may make it possible for the needed tailored approach to be adopted. However, KIs acknowledge that the effectiveness of such mentoring assumes adequate resources for
mentor meetings to be held, sufficient mentor capacity and facilitators being sufficiently motivated to be mentored. As mentioned above, it also needs to be clarified what such mentoring will actually entail, and who will be involved and in what respect.
Some other key factors highlighted by KIs as affecting the results of teacher capacity development on teaching and learning, are as follows:
• The initial skills and knowledge of teachers are likely to affect to what extent the teachers are
able to translate gained knowledge and skills into practice. Several KIs claim that some teachers
26 In Bauchi, KIs indicated that facilitators working in SUBEB-managed IQSs are generally selected from teachers under a LGEA contract. In Sokoto, facilitators are identified from the IQS community or neighbouring community, with SAME carrying out an examination of the facilitator presented by the proprietor. 27 Reading and Access Research Activity (RARA) research among IQSs in Bauchi and Sokoto has found that IQS pupils belong to a wide range of age categories, including adult learners. 28 Qur’anic schools vary considerably in terms of the Qur’anic education provided, the type of pupils they attract, and how the pupils relate to their traditional religious teacher, the mallam. For example, IQSs may be boarding schools that attract mostly itinerant boys and that focus on recitation of the Qur’an, while others may operate as a day school targeting boys and girls from the community.
Evaluation of the Girl’s Education Project 3
Disclaimer EDOREN is a consortium of leading organisations in international development and education: Oxford Policy Management (OPM), and the Institute of Development Studies (IDS) at the University of Sussex, and is supported by UK Aid. EDOREN cannot be held responsible for errors or any consequences arising from the use of information contained in this report. Any views and opinions expressed do not necessarily reflect those of OPM, IDS and EDOREN or any other contributing organisation.
EDOREN No 2, 16 Mafemi Crescent Tel +234 810 727 8718 Education Data, Research & Evaluation in Nigeria Utako Tel +234 817 667 8243 Abuja, Nigeria Email [email protected] Website www.edoren.org
© EDOREN 55
who are selected for training are ‘untrainable’ because they do not have the minimum understanding needed to comprehend the training. The baseline findings in both primary schools
as well as IQSs demonstrate that teachers have very limited knowledge and skills in the majority of the areas required to function effectively as a teacher. In particular, teachers display low competency in Hausa writing and comprehension. The GEP3 ToC acknowledges this to some extent, by stating that the selection of teachers will, among other things, be based on a conceptual understanding of teaching. Hence, teacher training pedagogy and materials will need
to be appropriate for very low initial teacher skills and knowledge levels.
• Teacher commitment and motivation is another influencing factor highlighted by several KIs,
which is linked to teacher attendance. Low commitment and motivation is associated with low and irregular remuneration, poor living and social amenities in rural areas, and a poor teaching environment. According to KIs, primary teachers are not always remunerated on time in all GEP3 states29 and their salary is considered too low to incentivise deployment to rural areas where
amenities and school facilities are poor. Furthermore, several KIs pointed to teacher
appointment and deployment being politicised, which also affects commitment.
• Remuneration appears to be particularly problematic for IQS facilitators. IQS facilitators are
generally paid a monthly allowance, which is not on a par with the standard of NGN 7,500 per month in any of the GEP3 states.30 The allowance seems to vary between NGN 3,000 and NGN 5,000, and the actual payment of the allowance depends on the availability of funding.
Experience from the Education Sector Support Programme in Nigeria (ESSPIN) indicates that the non-payment of allowances eventually results in facilitators stopping teaching. The baseline
findings of the IQSS evaluation confirm that a very small share of facilitators are paid, with a positive association between receiving remuneration and teacher motivation. The GEP3 ToC
assumption that government will pay teachers regularly and appropriately to support motivation in regard to effective performance is therefore unlikely to hold in the case of IQSs.
29 Information about the regularity of the payment of teachers’ pay is mixed and seemingly contradictory. In Bauchi, the payment of civil servants was not regular in 2015. In Katsina and Zamfara, a SPARC/SAVI political economy assessment dated July 2015 indicates that the government owes up to six months’ of salaries to workers. However, KIs in these states indicate that no salaries are owed to teachers. 30 It is not clear where this standard comes from. One KI indicated that this is the amount recommended in the National Benchmark, but the National Benchmark for Integrating Basic Education into Qur’anic Schools in Nigeria recommends NGN 10,000.
Evaluation of the Girl’s Education Project 3
Disclaimer EDOREN is a consortium of leading organisations in international development and education: Oxford Policy Management (OPM), and the Institute of Development Studies (IDS) at the University of Sussex, and is supported by UK Aid. EDOREN cannot be held responsible for errors or any consequences arising from the use of information contained in this report. Any views and opinions expressed do not necessarily reflect those of OPM, IDS and EDOREN or any other contributing organisation.
EDOREN No 2, 16 Mafemi Crescent Tel +234 810 727 8718 Education Data, Research & Evaluation in Nigeria Utako Tel +234 817 667 8243 Abuja, Nigeria Email [email protected] Website www.edoren.org
© EDOREN 56
• Teacher attendance and motivation is, however, also linked to supervision, monitoring and
accountability, which, according to some KIs, is a more significant factor influencing teacher behaviour than remuneration. These KIs make the comparison with private schools in GEP3 states, where teacher pay is generally lower than in public schools but teaching and learning outcomes are perceived to be better because teachers are held to account in relation to delivering effective teaching, and are adequately supervised.31 Improvement of teacher
monitoring and supervision is incorporated within GEP3’s ToC via improvement of head teacher capacity and SBMC governance. However, as discussed above, the likelihood of it acting as a strong supportive factor in GEP3’s ToC can be strengthened by clarifying its objectives and recognising it limitations when certain conditions are not in place. The qualitative research
findings of the IQSS evaluation suggests that accountability relationships are weakened in the case of IQS facilitators because of a lack of remuneration.
• Access to teaching and learning materials and the school environment are likely to affect the extent to which improved teacher knowledge and skills can translate into effective teaching and
learning outcomes. Most of these factors are incorporated into GEP3’s design through different interventions. It is not ensured, though, that these different interacting factors support each
other at the same time at the individual school level.
• Pupil attendance and motivation are influencing factors in regard to improving learning
outcomes.32 Output 1 interventions are meant to contribute to girls’ school attendance. Even though the cash transfer programme is unconditional, KIs believe that girls’ attendance is
positively influenced because of SBMCs’ follow-up on non-attendance and the sensitisation implemented as part of the programme. Girls’ motivation has already been briefly discussed above.
• In IQSs, additional factors need to be considered. The attitude of the proprietor and the
community towards integration will influence the extent to which a better skilled facilitator is able to put improved teaching skills into practice. As the quote below emphasises, this requires both continuous sensitisation of the proprietor and building his/her trust. If the proprietor
31 It should be noted that non-religious private schools are more likely to be located in urban areas, which may be another explanatory factor for differences in education outcomes between public and private schools. 32 Other factors, like the child’s health, cognitive ability and socio-economic background, can also influence learning outcomes. Such factors are not discussed here.
Evaluation of the Girl’s Education Project 3
Disclaimer EDOREN is a consortium of leading organisations in international development and education: Oxford Policy Management (OPM), and the Institute of Development Studies (IDS) at the University of Sussex, and is supported by UK Aid. EDOREN cannot be held responsible for errors or any consequences arising from the use of information contained in this report. Any views and opinions expressed do not necessarily reflect those of OPM, IDS and EDOREN or any other contributing organisation.
EDOREN No 2, 16 Mafemi Crescent Tel +234 810 727 8718 Education Data, Research & Evaluation in Nigeria Utako Tel +234 817 667 8243 Abuja, Nigeria Email [email protected] Website www.edoren.org
© EDOREN 57
decides to discontinue teaching of the integrated curriculum within the school, the opportunity to improve learning outcomes within the school will be terminated.
‘How does the proprietor affect the teaching and learning? He is the owner of the school, so if he doesn’t accept nobody will even go to school. (…) You sensitise them and create awareness and give them that support to the school. Some of them don’t have toilet or water point and it is very important for the schools. You still give them the stipend monthly. It is because of the support that is why the integration is taking place. If there is no support nothing will happen. They also
need to trust that you are not going to take their school from them.’ (Government KI, Katsina)
Furthermore, the actual availability of facilitators to train and mentor is an obvious but important
assumption of the ToC. This will vary by IQS and state. KIs in all states other than Sokoto indicate that on average one facilitator teaches formal subjects in each IQS, which is less than the number assumed in the GEP3 logframe. According to baseline data from Bauchi, Niger, Katsina and Zamfara most IQSs have one to two facilitators.33 Another IQS-specific factor is that pupils may attend both
an IQS and a public primary school. This was particularly observed in the baseline IQS sample in Bauchi, where 72% of pupils reported attending another school. This could contribute to the
differences in learning outcomes that have been observed between pupils of IQSs and public primary schools (USAID, 2013).34 However, this difference is not well understood. KIs speculate that it could be explained by the level of supervision, the degree of interaction between pupils and proprietors,
the maturity of the pupils, or pupils’ motivation.
The above factors are embedded in the institutional and political-economy context of each state,
which determine teacher recruitment, deployment and remuneration policies, funding decisions,
and institutional roles and responsibilities. For example, Katsina’s restrictive civil servant
recruitment policy in the past has affected teacher supply in the state, which is likely to influence the pool of teacher candidates to be trained and the schools’ pupil–teacher ratio. Teacher deployment may also have been affected by the 2015 elections. Given that teacher deployment has been subject
to political influence in the past, politically inspired teacher transfers may take place, which again may affect the teachers that are trained. Institutional arrangements may also affect teaching and
33 In Bauchi and Niger 25% of IQSs have only one teacher of non-religious subjects, while 37% have two. In Katsina and Zamfara, 40% of IQS only have a single teacher to teach integrated curriculum subjects. 34 RARA research in Islamiyya, Qur’anic Tsangaya Education centres (IQTEs) found that IQTE learners have relatively high learning outcomes compared to early grade primary school learners.

Evaluation of the Girl’s Education Project 3
Disclaimer EDOREN is a consortium of leading organisations in international development and education: Oxford Policy Management (OPM), and the Institute of Development Studies (IDS) at the University of Sussex, and is supported by UK Aid. EDOREN cannot be held responsible for errors or any consequences arising from the use of information contained in this report. Any views and opinions expressed do not necessarily reflect those of OPM, IDS and EDOREN or any other contributing organisation.
EDOREN No 2, 16 Mafemi Crescent Tel +234 810 727 8718 Education Data, Research & Evaluation in Nigeria Utako Tel +234 817 667 8243 Abuja, Nigeria Email [email protected] Website www.edoren.org
© EDOREN 58
learning outcomes. The GEP3 IQSs are managed mostly by SAME, except in Bauchi where most GEP3 IQSs fall under SUBEB. The capacity of both institutions differ, among other things in terms of access
to funding and trained teachers, as well as in their experience with integration and the non-formal sector. This affects the context and conditions in which trained facilitators operate and mentoring happens, which could influence results.35
2.3.3.2 Head teacher capacity development
According to GEP3’s ToC, head teacher capacity development aims to improve the capacity of head
teachers to support effective teaching and school management, contributing to improved learning in the classroom and a gender-sensitive school. At the time of the interviews, this intervention was yet to be operationalised. Therefore, the attributes of this intervention and its outcomes (what, who, how…) were yet to be defined based on an assessment of head teacher capacity needs.
An important attribute that requires clarification is the expected focus of the capacity building. KIs
emphasise the different roles expected of the head teacher, such as school management, pedagogical leadership, and supervision of curriculum delivery. Holding teachers accountable is also mentioned as important, but it remains undefined how and why this should take place, as well as
how the head teacher is incentivised to hold teachers accountable. Leaving these factors undefined lowers the plausibility as regards the intervention achieving results because the capacity
development may not sufficiently target the key mechanisms through which head teachers can contribute to effective teaching and learning. GEP3 is scheduled to conduct a participatory review of its current approach to head teacher training .
The ToC of this intervention in the context of IQSs requires further clarification. The GEP3 ToC suggests that the intervention targets head teacher training in government schools, while the IQS strategy paper sets targets for head teacher training in IQSs. KIs working in the IQS sector indicate
that a head teacher position that is separate from the proprietor or Mallam rarely exists and that the IQS proprietor takes on the role of head teacher. The role of the proprietor varies strongly from one IQS to another: focusing on school administration in some while being strongly involved in the
35 RARA research (USAID, 2014) explored the association between learning outcomes and the agencies supporting the IQTEs. Higher performance was observed in IQTEs supported by SAME compared to SUBEB. However, it was not demonstrated if such differences were significant. The causal role of this institutional factor is also uncertain.
Evaluation of the Girl’s Education Project 3
Disclaimer EDOREN is a consortium of leading organisations in international development and education: Oxford Policy Management (OPM), and the Institute of Development Studies (IDS) at the University of Sussex, and is supported by UK Aid. EDOREN cannot be held responsible for errors or any consequences arising from the use of information contained in this report. Any views and opinions expressed do not necessarily reflect those of OPM, IDS and EDOREN or any other contributing organisation.
EDOREN No 2, 16 Mafemi Crescent Tel +234 810 727 8718 Education Data, Research & Evaluation in Nigeria Utako Tel +234 817 667 8243 Abuja, Nigeria Email [email protected] Website www.edoren.org
© EDOREN 59
teaching in others. Hence, capacity development of proprietors will need to be tailored and/or flexible to the IQS context and aligned with the capabilities, interests and routine practices of the
proprietors, in order to obtain their buy-in.
Several influencing factors mentioned as part of the teacher capacity development intervention equally affect the results of the head teacher capacity development. Two factors are worth highlighting with regards to the functioning of the head teachers in the context of GEP3 states. First, KIs emphasise that head teacher appointment is not necessarily tied to qualifications and can be
subject to political allegiance. This may affect their competency and motivation to carry out the position, their likelihood of transfer at times of political transition and their credibility in regard to
holding teachers to account.
‘The appointment of head teachers is sometimes based on political demands. Politicians demand that an ally is made head teacher. You may find that the head teacher has lower qualifications than the teachers. This makes head teachers lose their capacity to lead.’ (Government KI,
Zamfara)
Second, their ability to influence teacher appointment or budget allocation to improve the learning
environment is circumscribed by the wider public service and financial management system in the state. The EDOREN literature review of basic education in Nigeria36 indicates that head teachers have very little power and few resources to affect change. Therefore, it is an uncertain assumption that
head teachers have the capability to make schools, for example, more girl-friendly (in the way that KIs mostly interpret a girl-friendly environment): that is, providing separate toilets, installing water
points and appointing female teachers. GEP3 does address this assumption by strengthening the
SBMCs’ capacity to mobilise resources which can support head teachers in regard to bringing about
change. This assumes strong coordination and alignment of interests between head teachers and SBMCs.
36 Humphreys and Crawfurd (2014).
Evaluation of the Girl’s Education Project 3
Disclaimer EDOREN is a consortium of leading organisations in international development and education: Oxford Policy Management (OPM), and the Institute of Development Studies (IDS) at the University of Sussex, and is supported by UK Aid. EDOREN cannot be held responsible for errors or any consequences arising from the use of information contained in this report. Any views and opinions expressed do not necessarily reflect those of OPM, IDS and EDOREN or any other contributing organisation.
EDOREN No 2, 16 Mafemi Crescent Tel +234 810 727 8718 Education Data, Research & Evaluation in Nigeria Utako Tel +234 817 667 8243 Abuja, Nigeria Email [email protected] Website www.edoren.org
© EDOREN 60
2.3.3.3 Early learning intervention
The early learning intervention has set as its main outcome the improvement of Hausa literacy in Grades 1 to 3.37 The main causal assumption underlying its ToC is that literacy learning outcomes, particularly in the mother tongue (which is assumed to be Hausa for most pupils), will improve in
early grades if teaching improves in terms of: a) a teaching process that emphasises literacy as a foundational skill and has a focus on active learning and time on task; and b) the use of the pupils’ mother tongue as the primary medium of instruction.
As mentioned above, a wide range of KIs endorse the importance of early grade learning, which
provides support for the weight that this intervention has received in the redesigned GEP3 programme. Furthermore, KIs support the emphasis on literacy during early grades as a foundational skill. As was stated by one of the KIs: ‘once pupils are able to read and speak learning will go easily’.
This was also confirmed in an IQS setting. One KI involved in IQS teaching stated that ‘the first step
we are offering is to show them how to read, how to write’.
With regards to the use of the mother tongue as the primary medium of instruction in early grades, there is no overall consensus among KIs to what extent this is a necessary condition for improving
learning outcomes. Several KIs argue in favour – that is, to strengthen the use of the mother tongue in early grades based on the following arguments: the pupil will better understand concepts when
they are explained in the mother tongue; communication in the class is enhanced; the transition between home and school is smoothened; and the exposure to phonetics and phonology in the mother tongue facilitates their understanding in other languages like English. Other KIs see the use of
the mother tongue as potentially useful but do not attribute low learning outcomes to language or
consider it a necessary condition to improve learning outcomes, emphasising that other elements in
the learning environment are more influential, such as teacher competencies. Comparison is made with private schools, where English is used throughout and learning outcomes are perceived to be
better.
Questions are also raised about the desirability and acceptance of using the mother tongue in early grades. Some KIs doubt that the use of the mother tongue will be accepted in metropolitan areas or areas with higher literacy levels. They also refer to the potential unintended outcome that when
37 Hausa is the main language spoken in northern Nigeria.
Evaluation of the Girl’s Education Project 3
Disclaimer EDOREN is a consortium of leading organisations in international development and education: Oxford Policy Management (OPM), and the Institute of Development Studies (IDS) at the University of Sussex, and is supported by UK Aid. EDOREN cannot be held responsible for errors or any consequences arising from the use of information contained in this report. Any views and opinions expressed do not necessarily reflect those of OPM, IDS and EDOREN or any other contributing organisation.
EDOREN No 2, 16 Mafemi Crescent Tel +234 810 727 8718 Education Data, Research & Evaluation in Nigeria Utako Tel +234 817 667 8243 Abuja, Nigeria Email [email protected] Website www.edoren.org
© EDOREN 61
mother tongue instruction is more strongly enforced, more educated, wealthy parents may send their children to private schools, reinforcing the dichotomy between private and public schools. Also,
parents may not support the use of the mother tongue since they may perceive the use of English as a proxy for the quality of education. Furthermore, some KIs suggest that the use of the mother tongue in early grades may result in it continuing to be used in upper primary grades. Finally, some KIs argue that Hausa is not the mother tongue of all pupils, and Hausa dialects vary from state to state. However, the baseline data in Katsina and Zamfara, where the early learning intervention is
piloted, confirm that Hausa is the language of the immediate environment, which validates the ToC assumption for this intervention. Also, merely because they speak a language does not mean that teachers are literate in it, or that they are able to use teaching and learning materials in that
language, even if they are available. The baseline data point to this reality. While all teachers surveyed report being able to speak Hausa, Hausa literacy levels among teachers are low.
‘The impediment is that some teachers are not versed in using the language for instruction. There
is a difference in speaking a language and using it. There are different terms in Hausa from state to state. Teaching in Hausa is difficult.’ (Non-government KI, Katsina)
Implementing the early learning in IQSs will require careful design. As mentioned before, the capacity building approach needs to be adapted to the IQS context and should take into account large variations in that context. What constitutes early grades from the perspective of the RANA
teaching and learning methodology needs to be assessed against how grade progression is organised in IQSs. Other variations of the organisation of these levels are likely to exist. Furthermore, the
mother tongue or language of immediate community is the recommended medium of instruction in Basic, while English and the language of the immediate environment is recommended in Post-Basic.
To the extent that the RANA approach includes grade-specific features that are not well adapted to the IQS context the results of the intervention may be affected. Also, the RANA school-based peer-mentoring will need to be adapted to the context of a high percentage of IQSs only having a single
facilitator, as the baseline demonstrates. Finally, the design of the intervention will need to suit the way the proprietor has organised the delivery of the curriculum in the IQS.
Evaluation of the Girl’s Education Project 3
Disclaimer EDOREN is a consortium of leading organisations in international development and education: Oxford Policy Management (OPM), and the Institute of Development Studies (IDS) at the University of Sussex, and is supported by UK Aid. EDOREN cannot be held responsible for errors or any consequences arising from the use of information contained in this report. Any views and opinions expressed do not necessarily reflect those of OPM, IDS and EDOREN or any other contributing organisation.
EDOREN No 2, 16 Mafemi Crescent Tel +234 810 727 8718 Education Data, Research & Evaluation in Nigeria Utako Tel +234 817 667 8243 Abuja, Nigeria Email [email protected] Website www.edoren.org
© EDOREN 62
2.3.4 Output 3: Improved governance to strengthen girls’ education
According to GEP3’s ToC, interventions under this output aim to influence key areas of governance in state basic education systems which affect girls’ basic education in the long term. The output addresses both school-level governance through the empowerment of SBMCs/CBMCs as well as mostly state-level governance by supporting interventions that influence planning, programming and
funding for girls’ education. The main interventions under Output 3 are:38
• capacity building SBMCs/CBMCs: training and follow-up monitoring of SBMC/CBMC members
from public primary schools and IQSs, including the provision of school grants managed by SBMC/CBMC;
• support to the Annual School Census (ASC) and the education management information system
(EMIS): training and technical support to state-level EMIS staff in ASC planning, data entry, data verification/cleaning, database management and data analysis;
• support to the Girls’ Education Steering Committees (GESCs): coordination support for continuation of the GESCs in each state and at national level; and
• support to HiLWA: support to the advocacy group HiLWA at the state level to engage with
decision-makers to influence actions to improve women’s and girls’ participation in the education sector.
2.3.4.1 Empowerment of SBMCs/CBMCs
High expectations regarding SBMCs. Government KIs consider SBMCs a key instrument to promote community ownership of schools, with the expectation that strengthened community ownership will alleviate demand, supply and governance problems at the school level. Government KIs highlighted that communities should not rely solely on the government to ensure school
development. They see SBMCs as a means to share responsibility for education with the community. Non-government KIs also see SBMCs ‘in the limelight’, as one interviewee put it. They appreciate SBMCs as being a way to strengthen community ownership of the school, highlighting their role in
38 Output 3 also includes advocacy for the Female Teacher Trainee Scholarship Scheme (FTTSS). This intervention has not been the focus of this assessment because it is being phased out.
Evaluation of the Girl’s Education Project 3
Disclaimer EDOREN is a consortium of leading organisations in international development and education: Oxford Policy Management (OPM), and the Institute of Development Studies (IDS) at the University of Sussex, and is supported by UK Aid. EDOREN cannot be held responsible for errors or any consequences arising from the use of information contained in this report. Any views and opinions expressed do not necessarily reflect those of OPM, IDS and EDOREN or any other contributing organisation.
EDOREN No 2, 16 Mafemi Crescent Tel +234 810 727 8718 Education Data, Research & Evaluation in Nigeria Utako Tel +234 817 667 8243 Abuja, Nigeria Email [email protected] Website www.edoren.org
© EDOREN 63
school monitoring, sensitising parents and school management, observing that SBMCs are ‘in the
driver’s seat when it comes to what the school really needs’, ‘do more than government to maintain schools’, and ‘do the monitoring that people from the ministry are unable to do’.
Given the pivotal role that SBMCs are assigned in the school system in GEP3 states, and the fact that almost all GEP3-supported interventions rely strongly on their contribution, it is highly relevant to continue strengthening their capacity and support their empowerment as a means to improve school governance as part of the redesigned GEP3.
While the role of SBMCs in school-level governance is broadly supported by KIs, their role in the
governance of the wider state education system remains to be clarified: in particular, their role in
regard to holding state and local governments to account for service delivery. This remained largely unaddressed by government KIs, although some appreciated SBMCs as being an efficient, direct channel of the information needed for state-level planning and action. Non-government KIs perceive SBMCs as a grassroots voice that can put pressure on the government to fulfil its commitments.
GEP3 does not expect or aim to support a governance role for SBMCs beyond the school level.39 This assumes that by holding actors at the school level (e.g. head teachers and teachers) to account
SBMCs can improve the performance of the school. However, this is likely to have its limitations because several aspects of schools’ performance (such as human resource management, provision of learning materials, school infrastructure) depend on state and local government action. The
remuneration of the IQS facilitators is a case in point. The IQSS baseline data indicate that local stakeholders consider it difficult to hold unpaid facilitators to account. Hence, the CBMCs’
effectiveness in regard to improving facilitator performance depends on government action that the CBMC may or may not be able to influence.
The empowerment of SBMCs is both a pivotal intermediary outcome in GEP3’s ToC as well as one of its most precarious links. There is a gap between the high expectations with regard to SBMCs, in terms of their many roles and responsibilities,40 and the capacity building and empowerment
39 This was confirmed by UNICEF as part of their review of a first draft of this report. 40 Some of the SBMC responsibilities mentioned by KIs are: supporting enrolment drives; supporting cash transfer intervention processes (registration, payment, attendance follow up); support G4G; supporting school maintenance/repair; resource mobilisation for school investment; mobilising additional resources to motivate and support teachers; school grant management; developing and implementing Whole School Development Plans (WSDPs); keeping records on WSDPs and resources mobilised/spent; teacher and pupil attendance monitoring; curriculum implementation monitoring; holding
Evaluation of the Girl’s Education Project 3
Disclaimer EDOREN is a consortium of leading organisations in international development and education: Oxford Policy Management (OPM), and the Institute of Development Studies (IDS) at the University of Sussex, and is supported by UK Aid. EDOREN cannot be held responsible for errors or any consequences arising from the use of information contained in this report. Any views and opinions expressed do not necessarily reflect those of OPM, IDS and EDOREN or any other contributing organisation.
EDOREN No 2, 16 Mafemi Crescent Tel +234 810 727 8718 Education Data, Research & Evaluation in Nigeria Utako Tel +234 817 667 8243 Abuja, Nigeria Email [email protected] Website www.edoren.org
© EDOREN 64
process that will be gradual and that starts from an often low initial capacity level, particularly in rural areas. KIs point out that, particularly in rural areas, many SBMC members have little education
and still lack an understanding of their roles and responsibilities. The planned training and mentoring is meant to address this but KIs underline that such training and mentoring needs to be regular and continuous in order for it to build the necessary SBMC capacity. They also indicate that only a limited number of SBMC members receive training and that the capacity built is not necessarily cascaded down to all members. Monitoring is again highlighted as important, which GEP3 is rightly
emphasising via its SBMC Effectiveness Monitoring process. Given the importance of mentoring and supportive supervision, it would be valuable to pay attention to this aspect in the SBMC Effectiveness Monitoring.
‘The SBMCs have been doing a lot of jobs. They are well motivated. The problem is, especially in the rural areas, getting the SBMCs to fully grasp their jobs. Some of them when they get the initial training, they get the SBMC support, that will be the end of it. They hardly think of motivating to
get some internal support. They are there waiting for the next support to come. There is need for more training because most of the SBMCs are not fully aware, especially in the rural areas. But in
the urban/semi-urban areas you find SBMCs doing some wonderful jobs. People coming in giving moral and financial support, even building some blocks in some schools. Gradually, it is moving towards some of the rural areas.’ (Non-government KI, Zamfara)
Ownership is generated through participation and action that addresses the needs of the community. It is facilitated through networks that transfer knowledge and ideas, and that generate
social capital.41 Therefore, the active participation of SBMCs in interventions such as enrolment drives, the cash transfer scheme and grant management can contribute to ownership building to
the extent that its builds on and nurtures bottom-up enthusiasm for action, targets issues that communities want to see addressed, and takes into account local capacity constraints. State SBMC structures, training and participation in coordination meetings (e.g. for enrolment drives) offer
opportunities for SBMC to build social capital.
teachers accountable for performance; follow-up on pupil absenteeism; overall school oversight; maintaining the relationship between the community and the school; and holding government to account for service delivery. 41 Burns and Worsley (2015).
Evaluation of the Girl’s Education Project 3
Disclaimer EDOREN is a consortium of leading organisations in international development and education: Oxford Policy Management (OPM), and the Institute of Development Studies (IDS) at the University of Sussex, and is supported by UK Aid. EDOREN cannot be held responsible for errors or any consequences arising from the use of information contained in this report. Any views and opinions expressed do not necessarily reflect those of OPM, IDS and EDOREN or any other contributing organisation.
EDOREN No 2, 16 Mafemi Crescent Tel +234 810 727 8718 Education Data, Research & Evaluation in Nigeria Utako Tel +234 817 667 8243 Abuja, Nigeria Email [email protected] Website www.edoren.org
© EDOREN 65
The establishment of MAs as part of the SBMC is appreciated by the KIs. They emphasise the effective role of MAs at the household level in regard to sensitising individuals about girls’
enrolment during enrolment drives and following up on truancy. While the interviews did not specifically inquire about the role of women in SBMCs, the fact that KIs mainly situate MAs’ and women’s roles in terms of sensitising at household and community level signals a need for further inquiry regarding their role at school level – and in particular regarding their ability to influence a girl-friendly learning environment, through whole school development planning and/or holding head
teachers and teachers accountable for implementing gender-sensitive school practices.
Channelling financial school support, such as the provision of the GEP3 grants, through the SBMCs is
considered by several KIs as an important factor contributing to SBMC empowerment. They see it as a way to make SBMCs feel responsible and accountable for their actions, and they expect it to trigger additional resource mobilisation within the community.
‘The financial support encourages schools especially in the rural areas, because if you ask them to
use their own money they will start asking questions. But if you give them that initial support (the grant) it will prop them up. Unfortunately some communities when you give them the grants they
just sit down if there is no mentoring follow-up to find out what they have done with the grants. Since the grant came in, what contribution of their own have they made in their own time to the schools because the grant is supposed to encourage them to contribute to the school. To build up
school–community relations and participation of the community in running the school, financial support in combination with training and mentoring need to work together.’ (Non-government KI,
Zamfara)
However, this depends on: the SBMCs effectively accessing and using the financial support for the
school; communities being aware of the support provided; SBMCs having the ability to manage the financial support; and the financial support, its use and results being transparently monitored. Furthermore, the baseline findings of the IQSS evaluation indicate that while CBMCs in IQSs
undertake the effort of mobilising additional resources, poverty limits their ability to do so. GEP3 grants seem to have been the main source of financial support channelled through SBMCs, although
federal government self-help grants (provided via UBEC) are mentioned as a potential alternative source. These are currently channelled through the Local Government Education Area (LGEA). To the extent that channelling financial support through SBMCs is indeed an important contributory factor
Evaluation of the Girl’s Education Project 3
Disclaimer EDOREN is a consortium of leading organisations in international development and education: Oxford Policy Management (OPM), and the Institute of Development Studies (IDS) at the University of Sussex, and is supported by UK Aid. EDOREN cannot be held responsible for errors or any consequences arising from the use of information contained in this report. Any views and opinions expressed do not necessarily reflect those of OPM, IDS and EDOREN or any other contributing organisation.
EDOREN No 2, 16 Mafemi Crescent Tel +234 810 727 8718 Education Data, Research & Evaluation in Nigeria Utako Tel +234 817 667 8243 Abuja, Nigeria Email [email protected] Website www.edoren.org
© EDOREN 66
in regard to their effectiveness, it will be important to clearly define the roles and responsibilities of SBMCs and LGEAs in regard to school finance.
Other key factors highlighted by KIs that affect the results of SBMC capacity development and empowerment, are as follows:
• The composition of the SBMCs. SBMC members need to be properly selected from within the community so that they can adequately engender community ownership. It is argued that the
inclusion of well-respected community members increases an SBMC’s credibility and power to influence both school and community. The presence of well-educated members who are aware
of the education system contributes to the SBMCs effectively taking on their multiple roles. This is more plausible in urban than in rural areas. Effective representation of women can be a problem due to socio-cultural norms inhibiting joint male-female meetings. To the extent that MAs are involved in all SBMC functions, female voice could be channelled via this structure. GEP3
intends to bring girls’ voices into school governance by linking G4G groups to SBMCs. However, this objective needs to be made explicit in the intervention design because this objective was not
included in past experiences like SWAGS. Finally, the assignment of positions within the SBMC needs to support keeping teachers and head teachers at arm’s length. KIs mentioned that it is best that teachers or head teachers, who form part of the SBMCs, not take on the role of
chairman or treasurer as this could undermine the SBMC’s school monitoring function and community ownership of investment in the school.
• SBMC acceptance and support in the school and community. KIs indicate that head teachers and teachers generally accept the role that the SBMC plays in the school since it is meant to be a
partner in school development. However, to the extent that SBMCs take an authoritative approach to school monitoring and lack credibility, this acceptance may fade. As mentioned
above, acceptance by the community depends on the way SBMC members are selected and how far they uphold transparency. One KI pointed out that the political affiliation of some of the
SBMC members can affect the support for, and functioning of, the SBMC.
• Access to the school. The distance between the school and its communities, and accessibility by road, influences how active SBMC members can be in the school. KIs confirm that it is likely that
harder-to-reach communities may be less represented in the SBMC. This points to a trade-off between the effectiveness of an SBMC and equitable representation on the SBMC. In addition, the security situation affects the functioning of SBMCs.

Evaluation of the Girl’s Education Project 3
Disclaimer EDOREN is a consortium of leading organisations in international development and education: Oxford Policy Management (OPM), and the Institute of Development Studies (IDS) at the University of Sussex, and is supported by UK Aid. EDOREN cannot be held responsible for errors or any consequences arising from the use of information contained in this report. Any views and opinions expressed do not necessarily reflect those of OPM, IDS and EDOREN or any other contributing organisation.
EDOREN No 2, 16 Mafemi Crescent Tel +234 810 727 8718 Education Data, Research & Evaluation in Nigeria Utako Tel +234 817 667 8243 Abuja, Nigeria Email [email protected] Website www.edoren.org
© EDOREN 67
• Institutionalisation of government support. The establishment of SBMCs is a national policy,
which has been domesticated to different degrees at state level. For example, according to one KI, Niger has legalised the establishment of a state SBMC association, while this is not yet the case in Sokoto. The degree that government support is institutionally embedded and ‘goes beyond paper’, as one KI put it, contributes to how credible SBMCs and their state associations are in performing their roles. However, the creation of an institutional enabling environment
may stifle ownership to the extent that it imposes actions not wanted by the school community, instead of enabling community self-organised action.
CBMCs in IQSs face a more challenging situation than their counterparts in formal schools. Their
capacity building and empowerment therefore needs to be met with even more realistic expectations in regard to gradually improving results. In general, KIs consider that CBMCs are able to take up similar roles and responsibilities as SBMCs but this is subject to more factors that need to be
accounted for. The key factors mentioned are as follows:
• The CBMC needs to be actually established. While in the case of formal schools it is plausible to
assume that SBMCs have been established, given their legal institutionalisation and relatively long track record of support, this is not the case for CBMCs. The GEP3 baseline data collection
indicates that actual integration in GEP3 cannot be assumed: hence the establishment of the CBMC can also not be assumed. The establishment of CBMCs is a prerequisite in order for their capacity to be built.
• The CBMC needs to be accepted by the proprietor. Since CBMCs operate in a private school
environment, their acceptance by the proprietor is key.
‘Sometimes the proprietors are not happy as they see the CBMCs established encroaching on
their powers and reducing their authority in the schools, though not in all cases. There is a need for real orientation because it’s a misunderstanding on the part of the proprietors. If this is well
explained to them, they will give their support.’ (Non-government KI, Sokoto)
• The proprietor’s acceptance is likely to depend on the added value that the CBMC can bring to the school, particularly in terms of resource mobilisation, the proprietor’s acceptance of integration in general, and the way that the proprietor is involved and has a voice in its
functioning. One KI was sceptical about the CBMCs’ resource mobilisation capacity beyond the term of the GEP3 grant since one of the main drivers for parents to send their children to IQSs is
Evaluation of the Girl’s Education Project 3
Disclaimer EDOREN is a consortium of leading organisations in international development and education: Oxford Policy Management (OPM), and the Institute of Development Studies (IDS) at the University of Sussex, and is supported by UK Aid. EDOREN cannot be held responsible for errors or any consequences arising from the use of information contained in this report. Any views and opinions expressed do not necessarily reflect those of OPM, IDS and EDOREN or any other contributing organisation.
EDOREN No 2, 16 Mafemi Crescent Tel +234 810 727 8718 Education Data, Research & Evaluation in Nigeria Utako Tel +234 817 667 8243 Abuja, Nigeria Email [email protected] Website www.edoren.org
© EDOREN 68
poverty. This is important because the CBMCs’ resource mobilisation function is relatively more important than is the case for SBMCs since IQSs have less access to government funding.
• The acceptance of integration by the community. The CBMC can be both an important sensitising force for integration within the community as well as being affected by low acceptance of integration by the community. If there is low acceptance of integration among parents it will be difficult to mobilise resources from them or have them participate as CBMC
members.
• Effective CBMC monitoring depends on the role of the proprietor in the CBMC and on supply-side conditions being met. Several KIs indicated that the proprietor may be the chairman of the
CBMC. This will influence the community oversight function in respect of the IQS since ‘how can you monitor yourself?’ – as one KI questioned. In addition, CBMC monitoring is unlikely to be effective when facilitators are not paid and learning inputs are not provided because it is difficult
to hold facilitators to account in such a context.
• The type of IQS involved will affect the functionality of the CBMC. If the IQS is of a nomadic nature, the link with the community in which it temporarily resides may be weak, which will
affect the establishment of the CBMC. Similarly, a high percentage of boarding pupils that come from outside of the community may affect this link. KIs did not see the latter as a problem, arguing that pupils from outside of the community are generally well accepted in, and integrated
into, the community.
2.3.4.2 State-level interventions supporting governance in the state basic education system
GEP3 supports several interventions above the school level—mostly at the state level—to influence or inform policy-making, planning, programming and budgeting around girls’ education. HiLWA seeks
to engage with decision-makers and school communities, with the aim of influencing actions to improve women’s and girls’ participation in the education sector. The GESC is promoted as a forum for coordination, supervision, advocacy and political engagement among a broad group of stakeholders of girls’ education. The capacity development of state EMIS teams is supported to
improve their ability to provide reliable ASC data for GEP3 outcome reporting and state planning. In addition, GEP3 teams and UNICEF staff provide assistance and lobby state and federal governments.
Evaluation of the Girl’s Education Project 3
Disclaimer EDOREN is a consortium of leading organisations in international development and education: Oxford Policy Management (OPM), and the Institute of Development Studies (IDS) at the University of Sussex, and is supported by UK Aid. EDOREN cannot be held responsible for errors or any consequences arising from the use of information contained in this report. Any views and opinions expressed do not necessarily reflect those of OPM, IDS and EDOREN or any other contributing organisation.
EDOREN No 2, 16 Mafemi Crescent Tel +234 810 727 8718 Education Data, Research & Evaluation in Nigeria Utako Tel +234 817 667 8243 Abuja, Nigeria Email [email protected] Website www.edoren.org
© EDOREN 69
HiLWA
A prerequisite step in HiLWA’s ToC is that HiLWA needs to be recognised and that HiLWA is able to
connect with stakeholders at the state and community level. Based on KIIs in Zamfara and Bauchi, the visibility and recognition of HiLWA seems to vary depending on when HiLWA was established and was able to become active. For example, in Zamfara stakeholders are more aware of HiLWA compared to Bauchi where HiLWA became active later on, in 2014. HiLWA’s degree of activity has been influenced by GEP3’s redesign and by the elections.
In terms of HiLWA’s ability to connect with stakeholders, its involvement in enrolment drives and
engagement with SBMC structures and initiatives42 offers an important link to the school
communities. Its engagement with SBMCs presents an important opportunity because it allows HiLWA to connect with school communities and MAs beyond the annual enrolment drives. This potentially allows it to more frequently exercise it role model function, as well as to gather community-based evidence on education issues with which it can approach state-level decision-
makers.
The KIs indicate that HiLWA members are in a position to connect with high-level decision-makers, although HiLWA members stated that getting an audience with these decision-makers is a challenge.
HiLWA members visited the governor in Sokoto and the governor’s wife in Zamfara and Bauchi. In Bauchi HiLWA met with the head of the civil service to discuss greater women’s participation in
government functions at the opportune moment when the government made the decision to recruit additional teachers. Such opportunistic actions, i.e. being on the lookout for opportune spaces for action and stakeholders to influence, is a good approach in a dynamic and complex policy
environment. Nonetheless, some important policy processes, like periodic planning and budgeting,
follow a structured cycle. It is not clear how HiLWA aims to be involved in such processes beyond indirectly liaising with stakeholders that have an influence on such processes.
Beyond the prerequisite first step of stakeholders being aware of and exposed to HiLWA, factors that
affect HiLWA’s ToC and whether it achieves its results, are as follows:
• HiLWA’s credibility in regard to being able to have influence and acting as role models. This
depends on the credibility of its members. The KIs indicate that the members have high
42 HiLWA members in Zamfara indicated that they participated in SBMC workshops.
Evaluation of the Girl’s Education Project 3
Disclaimer EDOREN is a consortium of leading organisations in international development and education: Oxford Policy Management (OPM), and the Institute of Development Studies (IDS) at the University of Sussex, and is supported by UK Aid. EDOREN cannot be held responsible for errors or any consequences arising from the use of information contained in this report. Any views and opinions expressed do not necessarily reflect those of OPM, IDS and EDOREN or any other contributing organisation.
EDOREN No 2, 16 Mafemi Crescent Tel +234 810 727 8718 Education Data, Research & Evaluation in Nigeria Utako Tel +234 817 667 8243 Abuja, Nigeria Email [email protected] Website www.edoren.org
© EDOREN 70
credibility given their former high-level positions.43 HiLWA’s credibility will also be influenced by the extent to which stakeholders understand HiLWA’s role and structure. Some KIs wondered
whether HiLWA is a non-governmental organisation (NGO) or a project. Transparency in terms of role and structure avoids potential confusion, which may damage HiLWA’s credibility.
• HiLWA’s capacity to influence. This partly depends on HiLWA’s credibility and the opportunities for influence that it seizes, but also on the extent to which HiLWA members are in a position to
directly have influence. KIs indicated that it is difficult for women that are still in high-level positions to become HiLWA members because of the time commitment required and because HiLWA does not offer a direct benefit. The cases of Bauchi and Zamfara indicate that members
who have been in high-level position are often retired or not in their position anymore. There will be a trade-off between seeking members with active engagement in HiLWA, which requires a time investment, and aiming to include members with a high influencing capacity because of their current position (but who will have limited time).
• The motivation of the HiLWA members. KIs suggest that HiLWA members are well motivated to
be part of HiLWA. Motivation will be important because, as one HiLWA member argued, results will be ‘a question of keeping [continuing] to push’. Their motivation is likely to depend on
‘something coming out of it’, and on members feeling supported and recognised.
• Available resources to support HiLWA activities. It seems that GEP3 is seizing the opportunity to
carry HiLWA members along through synergies with other interventions, such as enrolment drives or SBMC workshops. This is an efficient use of resources. However, one HiLWA member
raised resource limitations in regard to their logistics and operations (e.g. transportation) as a challenge, and indicated that they are using their personal funding.
• Political and institutional environment. The transition period in relation to the elections has affected HiLWA’s scope of work: in particular, its government advocacy activities. In addition, the
institutional environment will circumscribe HiLWA’s effectiveness in influencing women participation. For example, the Bauchi HiLWA members provided the example of the fact that Bauchi has a quota-based civil servant employment system across its regions. Hence, regions with quotas that are filled up will have fewer opportunities to increase women’s employment.
Hence, the existing institutionalised employment practices may limit HiLWA’s room for
43 For example, in Zamfara membership includes the former commissioner, a former member of parliament, and the wife of a former governor. In Bauchi, the HiLWA chair and deputy chair are former permanent secretaries.
Evaluation of the Girl’s Education Project 3
Disclaimer EDOREN is a consortium of leading organisations in international development and education: Oxford Policy Management (OPM), and the Institute of Development Studies (IDS) at the University of Sussex, and is supported by UK Aid. EDOREN cannot be held responsible for errors or any consequences arising from the use of information contained in this report. Any views and opinions expressed do not necessarily reflect those of OPM, IDS and EDOREN or any other contributing organisation.
EDOREN No 2, 16 Mafemi Crescent Tel +234 810 727 8718 Education Data, Research & Evaluation in Nigeria Utako Tel +234 817 667 8243 Abuja, Nigeria Email [email protected] Website www.edoren.org
© EDOREN 71
manoeuvre unless such institutions themselves are changed. Finally, there is a risk that HiLWA will itself be affected by political affiliation, which may undermine its credibility.
GESC
Similar to HiLWA, the prerequisites for the GESC to support education governance is for stakeholders to be aware of its existence, to be invited and, participate in the GESC meetings, and have a common understanding of its mandate. Most KIs are indeed aware of the GESC at state or federal level,44 although some non-government KIs that are supposed to be GESC members had not heard of it. The
mandate of the GESC is generally understood as exercising a GEP3 oversight function, and acting as
an advocate for, and coordinating, actions to improve girls’ education. The extent to which the GESC
is understood as having a political engagement mandate is less clear, particularly in regard to discussing and advocating about funding challenges.
In all states KIs confirm that the GESC is established in the state and has been active in the past. Due to the project redesign and elections the GESC has met infrequently in the recent past.45 In several
states, GESC seems to have been reactivated, with meetings scheduled in August and September 2015. There was no uniform understanding among KIs about whether the GESC has an annual workplan but some KIs indicated that this will be part of the reactivation of the GESC.
In Bauchi, the GESC formed a lobby subcommittee during the past government with the objective of taking up political engagement on funding issues. Such an explicit political engagement function was
less pronounced in other states. In one state, one KI argued that funding issues were not discussed in the committee, while another KI indicated that stakeholders are free to voice funding concerns.
‘The committee has the PTA chairman, the SBMC chairperson, CSOs [civil society organisations], women groups. So, there are indefinite people that are always free to voice out issues of budget. It
is not only government officials so there is no way you can deny them. Budgets are discussed at the committee meeting because members of various agencies are present and may want certain information and clarifications.’ (Non-government KI, Bauchi)
44 The KIIs did not inquire about the federal-level GESC during state-level interviews. Only one KI brought up the LGA-level GESC, but the interviews did not explicitly inquire about this. 45 The interview team was not able to verify whether GESC meetings have been taking place and members have been participating, based on meeting minutes.
Evaluation of the Girl’s Education Project 3
Disclaimer EDOREN is a consortium of leading organisations in international development and education: Oxford Policy Management (OPM), and the Institute of Development Studies (IDS) at the University of Sussex, and is supported by UK Aid. EDOREN cannot be held responsible for errors or any consequences arising from the use of information contained in this report. Any views and opinions expressed do not necessarily reflect those of OPM, IDS and EDOREN or any other contributing organisation.
EDOREN No 2, 16 Mafemi Crescent Tel +234 810 727 8718 Education Data, Research & Evaluation in Nigeria Utako Tel +234 817 667 8243 Abuja, Nigeria Email [email protected] Website www.edoren.org
© EDOREN 72
Given that release of funds by state governments has been one of the main challenges of GEP3, the
plausibility of GESC contributing to GEP3’s outcomes would be strengthened once monitoring and political engagement around this issue is more explicitly incorporated into its mandate and is planned for.
The ToC for GESC seems to be that if a wide range of stakeholders periodically meet, discuss and coordinate actions to support girls’ education, then this will influence government planning and
budgeting decisions, because stakeholders are made aware of the issues and are in a position of influence to act. The mechanism for action could be that once an issue is raised, stakeholders feel peer pressure to act (external motivation), or that stakeholders have sufficient ownership that they
feel intrinsically motivated to act. Some KIs, however, question government ownership of the GESC, indicating that it is ‘alien’ driven, or that the GEP3 team is key to making the meeting happen. Lack of government ownership is likely to affect GESC’s effectiveness. Another KI pointed out that the GESC
could trigger a demonstration effect by showcasing ideas about how to improve girls’ education that can be picked up by the wider group.
A key factor that affects the GESC ToC is who is invited to become a member of the committee. The membership should allow for influence and effective coordination of actions. Since the key centre of power for funding is the governor, the extent to which members have access to, and influence over,
the governor matters for GESC effectiveness. There is likely to be a trade-off between having a high-level political membership (like commissioners) that potentially have high influence, but whose
commitment to attending regular meetings is uncertain, versus a more technical, administrative membership that have a more certain commitment to the meetings but may have less influence. At this point, there does not seem to be a common understanding among KIs about who is supposed to
chair the GESC: the commissioner or the permanent secretary of the Ministry of Education.
Several KIs appreciated the multi-sector and multi-stakeholder character of the GESC. For example, one KI pointed out that having a director of a radio cooperation in the GESC helps to get support at
the time of enrolment drives. Finally, the influential role of traditional leaders was raised in several interviews.
Beside awareness, degree of activity, ownership and membership of the GESC, other factors that are likely to influence its ToC are:
Evaluation of the Girl’s Education Project 3
Disclaimer EDOREN is a consortium of leading organisations in international development and education: Oxford Policy Management (OPM), and the Institute of Development Studies (IDS) at the University of Sussex, and is supported by UK Aid. EDOREN cannot be held responsible for errors or any consequences arising from the use of information contained in this report. Any views and opinions expressed do not necessarily reflect those of OPM, IDS and EDOREN or any other contributing organisation.
EDOREN No 2, 16 Mafemi Crescent Tel +234 810 727 8718 Education Data, Research & Evaluation in Nigeria Utako Tel +234 817 667 8243 Abuja, Nigeria Email [email protected] Website www.edoren.org
© EDOREN 73
• The political environment. As mentioned before, the elections and transition in government has
affected the functioning of the GESC. Furthermore, political conflicts may affect the functioning of the committee, which is a particular risk when its members have a more political profile. One KI suggested that in the past political misunderstandings between the governor and the commissioner have affected GESC activities in Zamfara.
• Funding availability. The eventual translation of GESC actions into actual influence on planning and budgets assumes that funding is available. Several KIs confirmed that the governor has discretionary funding available that requires advocacy to access. However, this envelope will depend on the overall budget envelope that is available via federal transfers since most states
have little internally generated revenue.
Support to the ASC
The capacity development of state EMIS teams aims to improve their ability to provide reliable and
regular ASC data for GEP3 outcome reporting and state planning. A first step in the change pathway for EMIS capacity development is for stakeholders to have a common understanding of the capacity
needs. The KIs confirm some of the capacity needs that are presented in the GEP3 strategy paper on EMIS: in particular, related to coordination, enumeration, data verification, and access and use of database and entry software. The EMIS teams seem to have invested strongly in the data verification
systems, which is a necessary condition for the reliability of the data. It will be important for this system to be well institutionalised and resourced, to ensure sustainable data quality.
While strengthened capacity in the generation of reliable data is a necessary first step, at a later
stage capacity to better facilitate the access to and usage of data needs to be considered since the
usage of the data is required for the ASC to contribute to planning, demonstrating results or other purposes. In general, KIs take it as a given that once EMIS data reliability is adequate, data can be
accessed and will be used in policy-making processes. However, this is not necessarily the case. The interface between knowledge and policy is influenced by factors such as the political context, the
interest of the actors involved in data production and policy-making, and the implementation of intermediary functions to strengthen the knowledge-policy interface.46
Access to the ASC data is a condition for usage of data. Government-level access is facilitated by
46 Jones et al. (2013).
Evaluation of the Girl’s Education Project 3
Disclaimer EDOREN is a consortium of leading organisations in international development and education: Oxford Policy Management (OPM), and the Institute of Development Studies (IDS) at the University of Sussex, and is supported by UK Aid. EDOREN cannot be held responsible for errors or any consequences arising from the use of information contained in this report. Any views and opinions expressed do not necessarily reflect those of OPM, IDS and EDOREN or any other contributing organisation.
EDOREN No 2, 16 Mafemi Crescent Tel +234 810 727 8718 Education Data, Research & Evaluation in Nigeria Utako Tel +234 817 667 8243 Abuja, Nigeria Email [email protected] Website www.edoren.org
© EDOREN 74
having State Ministry of Education (SMoE) and SUBEB teams collaborate on the state EMIS units
and by having a variety of stakeholders represented on the state EMIS committees. The involvement of a wide range of stakeholders on the EMIS committee may contribute to the ownership, and subsequent usage, of the data. Access by non-government actors, which can contribute to sustainable demand for data and monitoring of the education sector, officially relies on formal data requests to the Permanent Secretary of the SMoE. This process does not seem to work
effectively: EDOREN sent a formal request for the 2013 ASC report and data to all GEP3 SMoEs47 at the end of September 2015 and no response was received. The GEP3 strategy paper on EMIS capacity building (UNICEF 2015c) indicates that all annual ASC reports will be published and printed and copies placed in the public domain. According to one KI, ASC data are also disseminated to the
local governments, and the media are involved in disseminating them to a wider audience.48 The extent to which ASC data are accessible at the school level is not clear, but KIs indicate that schools keep a copy of the ASC questionnaire, which gives them primary access to the data. However, this
does not allow them to compare their school’s situation with that of other schools. One of the short-
term objectives of GEP3 support to EMIS, according to the GEP3 Strategy Paper (UNICEF 2015c), is to ensure that EMIS data feed back to LGAs and schools to inform plans in support of girls’ education and monitoring progress.
KIs indicate that ASC data are used for planning purposes, such as State Education Sector Operational Plans (SESOPs). One government KI also pointed out that the data could be useful for targeting
enrolment drives to LGAs with the highest girl’s enrolment gaps. Other usages mentioned by the KIs are planning and monitoring for donor-supported projects, assessments by special committees49 or for research purposes. GEP3 directly influences the use of EMIS data by including the data in its
donor reporting.
The GEP3 Strategy Paper (UNICEF 2015c) also refers to the EMIS data being made available for inclusion in the preparation of the state Medium-Term Sector Strategy (MTSS) and Annual Sector
Performance Review. In general, no specific actions seem to be foreseen as part of GEP3’s strategy to
47 The request was addressed to the Permanent Secretary, with a copy sent to the Director of Planning Research and Statistics. Letter delivery was confirmed by DHL. 48 The Zamfara EMIS unit indicated that media announcements were aired, to introduce the ASC before and during the conducting of the ASC. Equally, during dissemination they invite the media to broadcast about the ASC. 49 The Zamfara EMIS unit provided the example of a Secondary School Assessment Committee that was assigned to look at the secondary school education in the state and to advise on how it could be improved, by requesting the ASC data.
Evaluation of the Girl’s Education Project 3
Disclaimer EDOREN is a consortium of leading organisations in international development and education: Oxford Policy Management (OPM), and the Institute of Development Studies (IDS) at the University of Sussex, and is supported by UK Aid. EDOREN cannot be held responsible for errors or any consequences arising from the use of information contained in this report. Any views and opinions expressed do not necessarily reflect those of OPM, IDS and EDOREN or any other contributing organisation.
EDOREN No 2, 16 Mafemi Crescent Tel +234 810 727 8718 Education Data, Research & Evaluation in Nigeria Utako Tel +234 817 667 8243 Abuja, Nigeria Email [email protected] Website www.edoren.org
© EDOREN 75
actively facilitate the use of EMIS data. While this is consistent with the fact that the data first need
to be improved in terms of reliability and timeliness, before emphasising use, and KIIs seem to indicate that usage is taking place, it would be worth examining whether the demand side of the EMIS needs strengthening in the GEP3 ToC in order achieve its effective use in evidence-based planning, resource allocation and policy orientation to improve girls’ education.
GEP3 seeks to improve girls’ representation in education data by including IQS data in EMIS. This is
plausible for those IQSs that are well aligned with the formal education system via SUBEBs (these IQSs are already included in the EMIS), but does not seem plausible at this moment for the more informal IQSs that generally fall under SAME’s responsibility. While UNICEF has clarified that
integrating IQS data into EMIS does not necessary mean integrating these data with formal school data, basic requirements for quality education data collection are not yet in place. A reliable IQS listing would be required as a starting point, before data collection in most IQSs can take place –
particularly those managed by SAME. The GEP3 baseline experience indicates that information on the existence of IQSs and their integration status is incomplete. There also seem to be fluctuations in
integration status, which would require continuous updating of this listing. Furthermore, if enrolment data are a desired indicator (which is likely) a census would have to capture the wide variety of enrolment situations50 across a variety of grade categorisations present in IQSs. Also, if the
data need to be used to measure additional access to formal education the data collection needs to take into account possible double counting with the formal education sector when pupils attend
both formal and non-formal schools. KIs point out that data collection forms could not be simply transferred from the formal school ASC since they would need to be adjusted to the grade classification and context of IQSs.51 Given the capacity constraints faced by SAME it is unlikely that
they can implement this rigorously at the moment.
Factors that may affect the likelihood of GEP3 support to the ASC resulting in improved production and use of reliable ASC data are as follows:
50 RARA research on IQSs encountered a wide variety of enrolment situations: pupils just enrolled in Qur’anic classes, pupils enrolled in Qur'anic classes and integrated classes, pupils enrolled in Qur’anic classes, integrated classes and formal schools, and pupils just enrolled in integrated classes in IQSs. Pupils’ attendance is also not assumed to be as regular as in formal schools, with pupils not attending for extended periods of time without being considered dropouts. 51 For example, teaching in an IQS may not take place in traditional classrooms, which would require adjusting how infrastructure is captured in the ASC form.
Evaluation of the Girl’s Education Project 3
Disclaimer EDOREN is a consortium of leading organisations in international development and education: Oxford Policy Management (OPM), and the Institute of Development Studies (IDS) at the University of Sussex, and is supported by UK Aid. EDOREN cannot be held responsible for errors or any consequences arising from the use of information contained in this report. Any views and opinions expressed do not necessarily reflect those of OPM, IDS and EDOREN or any other contributing organisation.
EDOREN No 2, 16 Mafemi Crescent Tel +234 810 727 8718 Education Data, Research & Evaluation in Nigeria Utako Tel +234 817 667 8243 Abuja, Nigeria Email [email protected] Website www.edoren.org
© EDOREN 76
• Resource availability for ASC and EMIS units for sustainable operations and continued capacity
building. Staff capacities are still being built and facilities, such as computers, are limited. KIs confirmed that release of government funds for ASC has been difficult.
• Motivation of the EMIS unit staff. Data quality depends on the meticulous implementation of data collection, verification and management protocols. Well motivated staff are important, and
this in turn depends on several factors, including appreciation of work done, the facilities available to do the work and the remuneration that they receive. During the interviews, EMIS staff voiced concerns about the lack of modern hardware/software to carry out the work and delays in payment, which they indicated discourages staff.
• Quality of the data entry and management software. EMIS staff highlighted the software used as one of the major challenges to their work in the past. The staff are positive about the software recently introduced by UNICEF, although its introduction created delays.
• An enabling school environment and system. Poor quality record-keeping at school level will translate into poor quality data being recorded in the ASC questionnaires. While trained enumerators are responsible for the ASC data collection, they rely on the head teachers and the
school records to provide some of the data, such as pupil data. Hence, one EMIS KI pointed out that those at the school level concerned with record-keeping need to be trained and sensitised
to keep quality records. The KIs also mentioned that shifts in the academic calendar can create planning problems for the ASC. Additionally, insecurity or climate incidences may inhibit access to the schools.
• Interest of government staff and policy-makers in using EMIS data in policy-making processes. EMIS data may be ignored in policy-making processes even when the data are reliable and
timely. One KI pointed out that policy-makers need to be sensitised on the use of EMIS data in
planning and decision-making.
2.3.5 Pilot-to-scale-up approach
In order to reach large numbers of girls, GEP3 follows a pilot-to-scale-up approach. GEP3’s ToC indicates that a key assumption underlying the overall project approach is that state governments are willing and able to implement large-scale changes for girls’ education, once relevant and compelling evidence of the value of new approaches is clear. The GEP3 logframe concretises the
scale-up ambition by formulating targets for primary schools and IQSs to be reached during scale-up
Evaluation of the Girl’s Education Project 3
Disclaimer EDOREN is a consortium of leading organisations in international development and education: Oxford Policy Management (OPM), and the Institute of Development Studies (IDS) at the University of Sussex, and is supported by UK Aid. EDOREN cannot be held responsible for errors or any consequences arising from the use of information contained in this report. Any views and opinions expressed do not necessarily reflect those of OPM, IDS and EDOREN or any other contributing organisation.
EDOREN No 2, 16 Mafemi Crescent Tel +234 810 727 8718 Education Data, Research & Evaluation in Nigeria Utako Tel +234 817 667 8243 Abuja, Nigeria Email [email protected] Website www.edoren.org
© EDOREN 77
and a decreasing ratio of project financing coming from donor funding compared to the state government contribution.
A basic prerequisite for the pilot-to-scale-up assumption to hold is for state governments to be aware of the expectation to scale-up. While KIs are generally aware of the scale-up objective, there was, at the time of the interviews, no clear understanding about what scale-up would look like, and only limited planning happening for it. As one KI put it, ‘the discussion of scale-up is afloat’. Government KIs could not provide information about how many schools are expected to be reached
during scale-up, despite targets being included in the logframe. Only few KIs had concrete ideas about how scale-up could best be implemented. For example, one government KI suggested that
interventions should first be expanded to more LGAs, with limited schools being targeted per LGA (as is the case during the pilot phase) because ‘other communities can witness interventions as a pilot’. Another KI argued for additional support to be result-based, making the case that additional SBMC support should be linked to results.
State GEP3 teams and UNICEF staff interviewed recognised that planning for scale-up is important and needs to start well ahead of 2017, taking into account the timelines of planning and budgeting
processes. Scale-up plans, targets and budgets need to be incorporated into state planning processes, such as SESOPs and/or MTSSs. Some KIs indicate that scale-up planning is already taking place and is being incorporated into the review of the MTSS. Similarly, scale-up needs to be taken
into account in annual state budget processes.52 One KI argued that the foundations of scale-up need to be integrated into the 2016 budget, rather than scale-up funding being included only in the 2017
budget, when scale-up is scheduled to start. For example, investments in the education supply side should be intensified in 2016, so as to be able to accommodate the scale-up of GEP3 interventions
from 2017 onwards.
‘If GEP3 would want to scale up in 2017, the project would need to engage in April 2016 when the aggregate state resource envelope start to be drafted. It is good to be ‘around’ when this
happens. At minimum GEP3 should get involved when annual budget call circular is issued to sectors. Sector budgets should be finished by September. However, budget cycle rarely happens as
52 One KI pointed out that for scale-up funding to be included in the 2017 budget, the project would need to engage with the budget process in April 2016, when the aggregate state resource envelope starts to be drafted. Another critical moment of engagement is when the annual budget call circular is issued to the sector ministries. Sector budgets are to be completed by the September before the budget year.
Evaluation of the Girl’s Education Project 3
Disclaimer EDOREN is a consortium of leading organisations in international development and education: Oxford Policy Management (OPM), and the Institute of Development Studies (IDS) at the University of Sussex, and is supported by UK Aid. EDOREN cannot be held responsible for errors or any consequences arising from the use of information contained in this report. Any views and opinions expressed do not necessarily reflect those of OPM, IDS and EDOREN or any other contributing organisation.
EDOREN No 2, 16 Mafemi Crescent Tel +234 810 727 8718 Education Data, Research & Evaluation in Nigeria Utako Tel +234 817 667 8243 Abuja, Nigeria Email [email protected] Website www.edoren.org
© EDOREN 78
planned.’ (Non-government KI, National)
In line with EDOREN’s PEA study (2014), KIs confirm, however, that incorporating scale-up
projections in planning and budget processes is not a sufficient condition for funding being available for scale-up, since the release of funds does not necessarily follow budgets. Nonetheless, while not a sufficient condition, integrating scale-up in sector plans and budgets is a supporting condition and makes scale-up more plausible.
Funding availability is considered by most KIs to be the main factor conditioning GEP3 scale-up. At
the time of the interviews, KIs had no clear understanding about how the scale-up would be
funded. Some government KIs argue that funding will be available from the state budget, and
support their claim by making reference to interventions already being scaled up or sustained with state support, such as enrolment drives or FTTSS.53 The change in government that has taken place has also made some KIs optimistic that funding for scale-up will be available, as governors have expressed an interest in education. However, other KIs expressed doubts about funding that relies
strongly on state government. They foresee that state budgets will be constrained as increasing funding needs will emerge with a growing school population, while state resources remain lean and
highly dependent on federal subvention.
‘Let me speak on an optimistic note. We may not say that it [the scale-up] is not implementable and may not be positive. It is positive because it is a good intention. However, if you look at global
projections, particularly for oil which is the mainstay of our economy in Niger, it is not too good for 2016 up to 2017. However, on another positive light, Niger state has been collaborating with other
institutions to improve agriculture value chain. If we do that at least the state’s GDP will vastly
increase and then our capacity to implement programmes will also improve.” (Government KI,
Niger)
Some potential funding from non-state sources for scale-up are proposed, such as funding from the Global Partnership for Education (GPE) in Sokoto and Katsina, or UBEC-matched grant funding. Some
KIs expect alternative non-government funding sources to be mobilised: for example, mobilisation of community resources via SBMCs, contributions by philanthropists, or special state funds, like the
53 Government partners in Katsina and Niger indicate that the FTTSS has continued with state support, despite GEP3’s financial support being stopped.
Evaluation of the Girl’s Education Project 3
Disclaimer EDOREN is a consortium of leading organisations in international development and education: Oxford Policy Management (OPM), and the Institute of Development Studies (IDS) at the University of Sussex, and is supported by UK Aid. EDOREN cannot be held responsible for errors or any consequences arising from the use of information contained in this report. Any views and opinions expressed do not necessarily reflect those of OPM, IDS and EDOREN or any other contributing organisation.
EDOREN No 2, 16 Mafemi Crescent Tel +234 810 727 8718 Education Data, Research & Evaluation in Nigeria Utako Tel +234 817 667 8243 Abuja, Nigeria Email [email protected] Website www.edoren.org
© EDOREN 79
Sokoto Education Development Fund.
Most KIs see the release of funds as being dependent on the political will of the governor. Factors
that influence this political will are (according to KIs): high-level advocacy, government ownership of and involvement in the project, alignment between the project and government policies/structures, and evidence about the results of the interventions. However, a few KIs did not buy into this argument, arguing that budget release is not caused by lack of political will but simply because resources are not available.
‘The debate about why budgets are not released is the wrong debate. You cannot implement if
you don’t have the resources in the first place. The only solution is to do proper budgeting.’ (Non-
government KI, National)
With the support of the UNICEF field office education teams, GEP3 is engaging in high-level advocacy to influence planning and budgeting for girls’ education at the state level. The recent elections require reinvesting in advocacy in relation to the governor, which also offers an
opportunity, since state executives are setting out their policy priorities. At the time of the interviews, UNICEF, together with GEP3 stakeholders, had paid courtesy visits in Sokoto, Niger and
Bauchi. KIs indicate that the role of external actors (such as donors), traditional rulers, and SBMCs can be particularly effective for advocacy. GESC and HiLWA can also act as advocacy platforms (see above). The KIs suggest that policy-makers are responsive to evidence in their decision-making. In
this regard, GEP3’s ToC is confronted with a challenge in terms of the timing of evidence becoming available versus the timing regarding when the evidence may be needed. As discussed above,
planning and budgeting for scale-up will need to start before 2017, while certain items of evidence,
like the EDOREN evaluation results, will only become available in 2017.
The plausibility of scale-up varies depending on the interventions involved and the state contextual factors related to these interventions. Scale-up of teacher and SBMC capacity building interventions are relatively more plausible because the need for these interventions is well
recognised and accepted as central to improved schooling. There is an institutional and legal framework that supports the interventions, and KIs can point to specific funding sources that could
finance scale-up – that is, UBEC funding and GPE. State contextual factors need to be taken into account as well. For example, scale-up of the GEP3 early learning intervention in Katsina will depend

Evaluation of the Girl’s Education Project 3
Disclaimer EDOREN is a consortium of leading organisations in international development and education: Oxford Policy Management (OPM), and the Institute of Development Studies (IDS) at the University of Sussex, and is supported by UK Aid. EDOREN cannot be held responsible for errors or any consequences arising from the use of information contained in this report. Any views and opinions expressed do not necessarily reflect those of OPM, IDS and EDOREN or any other contributing organisation.
EDOREN No 2, 16 Mafemi Crescent Tel +234 810 727 8718 Education Data, Research & Evaluation in Nigeria Utako Tel +234 817 667 8243 Abuja, Nigeria Email [email protected] Website www.edoren.org
© EDOREN 80
on the state’s commitment to a similar Jolly Phonics early learning intervention.54
Similarly, enrolment drives are well accepted and supported. Since enrolment drives already cover
the entire state, scale-up is likely to express itself in the way enrolment drivers are implemented, rather than expanding their reach to more school communities. Two factors may influence government continuing with state-wide enrolment drives: first, if the government cannot invest sufficiently in teachers and other school supply-side elements to meet the increased demand created through the enrolment drives, government may scale down the intensity of the enrolment drives or
focus them where supply can meet demand; second, the need for enrolment drives may decrease in areas where awareness about girls’ education is sufficiently raised and the number of out-of-school
girls is low.
To the extent that the cash transfer programme cannot be sustained by other donor projects (like the GPE), the cash transfer programme is a less plausible candidate for scale-up because it is capital intensive, is not well institutionalised, and is seen as a donor priority. Cash transfers would require
considerable capital expenditure from the state, if funded through the state budget. At its current scale, the cash transfers correspond to approximately 13 percent of the average 2009–2013 actual
annual capital expenditure in Niger,55 while the 10,700 girls currently benefitting represent around 4 percent of the female primary school population, which is only part of the cash transfer target population.56 Even a limited expansion of the target population would require a considerable
proportion of the state capital expenditures. State capital budgets are highly dependent on federal allocations, and are less likely to be released compared to recurrent expenditures.57 Since federal
allocations are dependent on oil revenues, the government-funded scale-up of the cash transfer would essentially be a function of the oil prices, as one KI put it. Low oil prices therefore make the
scale-up of the cash transfer programme less plausible.
54 Jolly Phonics is currently implementing an early learning intervention, with the support of the SUBEB, across Zamfara. It starts implementation in Katsina in the 2015–2016 academic year. 55 We estimate the capital expenditure cost of the cash transfer (i.e. the cost of the beneficiary transfer payments) at NGN 214 million per year for one state (NGN 5,000 x four quarters x 10,700 beneficiaries). The average actual annual capital expenditure in the period 2008–2013 was approximately NGN 1.7 billion (source: SPARC PFM database). 56 In the 2014–15 school year 275,359 girls were enrolled in primary school in Niger (ASC 2014–2015). The cash transfer intervention targets all girls between five and 16 years of age. 57 The SPARC PFM database demonstrates that in the period 2009–2013 the ratio between actual capital expenditure to budget fluctuated between 3% and 89%, with an average of 48%, while the ratio between actual recurrent expenditure to budget only fluctuated slightly around a 92 percent average figure.
Evaluation of the Girl’s Education Project 3
Disclaimer EDOREN is a consortium of leading organisations in international development and education: Oxford Policy Management (OPM), and the Institute of Development Studies (IDS) at the University of Sussex, and is supported by UK Aid. EDOREN cannot be held responsible for errors or any consequences arising from the use of information contained in this report. Any views and opinions expressed do not necessarily reflect those of OPM, IDS and EDOREN or any other contributing organisation.
EDOREN No 2, 16 Mafemi Crescent Tel +234 810 727 8718 Education Data, Research & Evaluation in Nigeria Utako Tel +234 817 667 8243 Abuja, Nigeria Email [email protected] Website www.edoren.org
© EDOREN 81
‘The intervention that is going to be a little bit difficult to scale up is the cash transfer programme because it is capital intensive. The state made a commitment at the commencement of the project
of counterfunding of NGN 21,000,000 to 12,500 students. Until today this money has not been released. This is because of the limited resources at the disposal of government. If government has not been able to redeem its commitment for the first phase up till now, it will be very unwise for one to talk about scale-up of that project.’ (Government KI, Niger)
In addition, compared to SBMCs and teacher capacity development, cash transfers are not based on
an established institutional or policy framework, which makes them more sensitive to ad hoc policy changes. According to KIs, a combination of these factors has contributed to the cash transfer
programmes in Katsina and Bauchi being halted. Finally, one KI also questioned whether scaling up demand-side interventions like cash transfers makes sense when supply-side investments cannot keep up.
The scale-up the IQS support is particularly uncertain. While KIs are generally supportive of the
integration of basic education in Qur’anic schools, the interviews indicate that scale-up is likely to be affected by the institutional context of integration, SAME’s access to resources, the number of well-
established IQSs available for scale-up, and supply-side constraints – particularly with regard to facilitators. With regard to the institutional context, KIs do not have a common understanding about which institution is responsible for integration. Some KIs argue that SUBEB is responsible, given
their mandate to provide universal basic education to all children, while others consider SAME to be responsible because of its mandate regarding non-formal education. This creates a dispersed
landscape of IQSs managed by different agencies58 that is characterised by lack of coordination. This will make scale-up institutionally and politically complex.
‘Different actors work in the IQS sector: SAME, Arabic and Islamic Education Board and SUBEB. All have an element of this activity going on in schools. There should be a coming together so you can scale-up within all these schools. There is a need for a collaborative partnership.’ (Government KI,
Sokoto)
Furthermore, SAME, which manages the largest number of IQSs, has relatively limited and uncertain
58 Furthermore, in some states additional agencies have been created that also play a role in integration, like the Islamic Education Board in Sokoto, and the Office of the Director General for Tsangaya in Bauchi.
Evaluation of the Girl’s Education Project 3
Disclaimer EDOREN is a consortium of leading organisations in international development and education: Oxford Policy Management (OPM), and the Institute of Development Studies (IDS) at the University of Sussex, and is supported by UK Aid. EDOREN cannot be held responsible for errors or any consequences arising from the use of information contained in this report. Any views and opinions expressed do not necessarily reflect those of OPM, IDS and EDOREN or any other contributing organisation.
EDOREN No 2, 16 Mafemi Crescent Tel +234 810 727 8718 Education Data, Research & Evaluation in Nigeria Utako Tel +234 817 667 8243 Abuja, Nigeria Email [email protected] Website www.edoren.org
© EDOREN 82
access to funding. The main federal UBEC funding source is not accessible to SAME. Furthermore, SAME KIs indicate that their state funding is uncertain from one year to another. Hence, scale-up
funding for IQS support is therefore highly unclear if scale-up is meant to rely on SAME-managed IQS.
In addition, the GEP3 logframe has set the target for IQS scale-up at 500 IQSs per state, but at the time of the interview this number of target IQSs does not seem to be in place in all states, at least when the current IQS eligibility criteria are maintained.59 Even where the numbers are available on paper, it is uncertain whether the IQSs are well integrated in practice. Selecting and sustainably
funding facilitators at scale in line with agreed standards (in particularly, a stipend of NGN 7,500) also seems unlikely. KIs indicate that it is already challenging to select qualified facilitators in agreement
with the proprietor at limited scale; and payment of facilitator stipends has been highly dependent on uncertain budget releases.
2.4 Appropriateness of GEP3’s implementation strategy
Besides the plausibility of its ToC, the relevance of a project is a function of the appropriateness of its implementation strategy for the context in which it operates. An appropriate implementation
strategy is a prerequisite for the causal pathways in the ToC to occur. As part of this assessment, we consider the following dimensions of implementation appropriateness:
• Involvement of stakeholders, particularly government staff, in the implementation process;
• Capacity to implement the project in a quality manner; and
• Equity in the reach of the target population.
This assessment has been constrained by the operational changes as part of the project redesign at the time of the KIIs. The operationalisation of some interventions, such as the early learning
interventions, had yet to be defined. The GEP3 state teams had recently been restructured, which affected their understanding of the operational details of the GEP3 strategy in their respective states.
59 In Bauchi, SUBEB supports 526 centres registered for integration, while Bauchi SAME (BASAME) manages 175 centres. Most of these centres are of the Tsangaya type, with attendance mostly by boys (source: SUBEB and BASAME). In Niger, SAME manages 450 IQSs, while SUBEB manages a limited number of model IQTEs (source: SAME and SUBEB). In Katsina SAME supports around 600 IQSs, some of which target Almajiri, which are mostly itinerant boys (source: SAME). In Sokoto, SAME has about 630 IQSs, while SUBEB manages nine centres (source: SAME)
Evaluation of the Girl’s Education Project 3
Disclaimer EDOREN is a consortium of leading organisations in international development and education: Oxford Policy Management (OPM), and the Institute of Development Studies (IDS) at the University of Sussex, and is supported by UK Aid. EDOREN cannot be held responsible for errors or any consequences arising from the use of information contained in this report. Any views and opinions expressed do not necessarily reflect those of OPM, IDS and EDOREN or any other contributing organisation.
EDOREN No 2, 16 Mafemi Crescent Tel +234 810 727 8718 Education Data, Research & Evaluation in Nigeria Utako Tel +234 817 667 8243 Abuja, Nigeria Email [email protected] Website www.edoren.org
© EDOREN 83
2.4.1 Stakeholder involvement
Stakeholder involvement in project design, decision-making, planning and implementation contributes to ownership, which in turn increases the likelihood of sound operational performance and sustainability of a project. GEP3’s operational plan supports stakeholder ownership by
emphasising implementation with and through state education partners. Furthermore, by involving state actors their capacities can be built.
Overall, KIs value the fact that GEP3 operates from within state governments, which is considered to contribute to government involvement and coordination between the GEP3 state team and
government staff.
‘GEP3 is designed in a very good form to be properly implemented with cooperation of the state
government. It is important that it is supported by government. With GEP operating under government roof you are carrying government along. You can easily get a hold of PermSec.
Government capacity in terms of planning is also built, for example, creating work plans.’ (Non-government KI, Sokoto)
Government partners were involved in the GEP3 project redesign and the GESC is designed as a
space to continue their engagement in project planning, deliberation and decision-making. Focal persons and desk officers at partner MDAs are appointed to coordinate and supervise
implementation. Furthermore, the focal person is a signatory on the project account. Hence, it is foreseen that structures and systems enable government involvement.
Project ownership and implementation, as well as the extent to which structures and systems are actually operational, are influenced not only by whether but also by how government partners are involved. Government involvement is to some extent externally rather than internally driven, with KIs qualifying GEP3’s government involvement as ‘carrying government along’, and stating that
‘involvement happens to the extent that leadership is sensitised’. Also, as mentioned above, KIs question government ownership of the GESC. Operationalisation of structures and systems that facilitate government involvement are influenced by changes in staffing and the political context. For example, the restructuring of the GEP3 state teams as part of the redesign and new government appointments as a result of the 2015 elections have influenced the activities of the GESC. The
elections also affected the operationalisation of the cash transfer programme implementation units
Evaluation of the Girl’s Education Project 3
Disclaimer EDOREN is a consortium of leading organisations in international development and education: Oxford Policy Management (OPM), and the Institute of Development Studies (IDS) at the University of Sussex, and is supported by UK Aid. EDOREN cannot be held responsible for errors or any consequences arising from the use of information contained in this report. Any views and opinions expressed do not necessarily reflect those of OPM, IDS and EDOREN or any other contributing organisation.
EDOREN No 2, 16 Mafemi Crescent Tel +234 810 727 8718 Education Data, Research & Evaluation in Nigeria Utako Tel +234 817 667 8243 Abuja, Nigeria Email [email protected] Website www.edoren.org
© EDOREN 84
as government operational support was not provided as planned due to the transition in government.
Government involvement and ownership is likely to vary across GEP3 interventions. The enrolment drives can count on broad stakeholder engagement and enthusiasm, a long track record of government implementation, and an annual process of planning and learning from past action. KIs have, overall, a good understanding of the operational processes of the enrolment drives.
‘The UNICEF approach of involving all stakeholders from grassroots level to top to partake in
enrolment drive has shown tremendous willingness of all to support this intervention.’
(Government KI, Sokoto)
Similarly, the operational processes of the ASC and cash transfer programme, supported by joint SUBEB–SMoE implementation units, are commonly understood. While external consultants have provided support during design and implementation, government staff have been closely involved both in the design and in leading the implementation.
The design and planning of other interventions is less coordinated with government partners. The operationalisation of GEP3’s support to IQSs lacks clarity and coordination. KIs working with IQSs
were not very aware of the planning of IQS facilitator training at the time of the interviews, even though this was scheduled for within one month of the interviews. The baseline survey suggests that GEP3-focus IQSs are not well identified.60 In Bauchi, stakeholders do not have a common
understanding of how many GEP3-focus IQS are managed by SUBEB and how many by the Bauchi State Agency for Mass Education (BASAME). Weak monitoring and institutional uncertainty about
the roles and responsibilities for integration are likely to be factors contributing to this situation. The provision of grants is another intervention that KIs are uncertain about, as some do not seem to
know whether grants will still be provided. Also, with regards to School-based Teacher Development, several KIs in Bauchi were not aware that a new approach is considered, or they indicated that they were waiting for DFID to provide them with a redesigned approach.
60 20% of the GEP3-focus IQSs contacted as part of the baseline survey were found to be non-integrated, non-existing or not to have girls as pupils.
Evaluation of the Girl’s Education Project 3
Disclaimer EDOREN is a consortium of leading organisations in international development and education: Oxford Policy Management (OPM), and the Institute of Development Studies (IDS) at the University of Sussex, and is supported by UK Aid. EDOREN cannot be held responsible for errors or any consequences arising from the use of information contained in this report. Any views and opinions expressed do not necessarily reflect those of OPM, IDS and EDOREN or any other contributing organisation.
EDOREN No 2, 16 Mafemi Crescent Tel +234 810 727 8718 Education Data, Research & Evaluation in Nigeria Utako Tel +234 817 667 8243 Abuja, Nigeria Email [email protected] Website www.edoren.org
© EDOREN 85
‘Last year in October we were invited to a one-day stakeholders’ meeting here in Bauchi with two consultants from DFID and talked about the redesigned GEP3 and the focus of the redesign. The
consultants told us that school-based teacher development will no longer answer to that name because of other elements of teacher training; so we are now waiting for DFID to give us the revised or the redesigned approach which is yet to be available to us.’ (Government KI, Bauchi)
At the time of the interviews, KIs in Katsina and Zamfara had little information about the implementation of the early learning intervention or G4G, beyond the fact such interventions were
planned for. Government involvement in the implementation of the early learning intervention will be particularly important because a similar intervention, Jolly Phonics, has already been rolled out
across Zamfara and is likely to be rolled out across Katsina in 2016.
KIs consider the involvement of a broad range of stakeholders at different levels (community, local, state and national level) a strength of GEP3’s implementation strategy, in particular the participation of SBMCs and MAs. The empowerment of SBMC state structures is a promising
mechanism for facilitating continuous and gradual learning, and for providing voice and a sense of self-efficacy to the SBMCs and MAs. NGOs and CSOs are also involved in GEP3 implementation – in
particular in SBMC capacity building and monitoring. However, KIIs indicate that at local and state level their involvement is project-driven, focusing mostly on service delivery and periodic representation in meetings when invited, rather than structurally strengthening the voice of civil
society in girls’ education.
Government involvement is meant to strengthen government capacity. This is particularly relevant
in the case of monitoring. Although GEP3’s monitoring function involves both government as well as
non-government partners, its reliance on government capacity is substantial. This is a risk since
government monitoring capacity is considered weak (see below). Nonetheless, government involvement in GEP3 monitoring is rightly considered important. Not only does it offer an opportunity to build monitoring capacity, it also enables government staff to directly observe the
performance of the interventions. In order for this to translate into learning and improvement, the spaces and processes need to be in place for government staff to reflect on and account for results.
It seems that for enrolment drives the annual state coordination meetings offer such a space. KIs indicate that the future head teacher and SBMC training will also be adapted based on assessments and monitoring results. This again offers an opportunity for involving government staff in monitoring,
as well as in joint reflection on results.

Evaluation of the Girl’s Education Project 3
Disclaimer EDOREN is a consortium of leading organisations in international development and education: Oxford Policy Management (OPM), and the Institute of Development Studies (IDS) at the University of Sussex, and is supported by UK Aid. EDOREN cannot be held responsible for errors or any consequences arising from the use of information contained in this report. Any views and opinions expressed do not necessarily reflect those of OPM, IDS and EDOREN or any other contributing organisation.
EDOREN No 2, 16 Mafemi Crescent Tel +234 810 727 8718 Education Data, Research & Evaluation in Nigeria Utako Tel +234 817 667 8243 Abuja, Nigeria Email [email protected] Website www.edoren.org
© EDOREN 86
2.4.2 Government capacity
Working through government systems offers the opportunity to build capacity through action, as part of GEP3’s objectives to improve governance and achieve sustainability and scale. However, it also exposes the project to operational risks related to weaknesses in institutional, organisational
and individual capacities within government.
‘A weakness for working through government might be in the bureaucratic nature where you cannot jettison bureaucracy. The strength of working through government is that you are building the institutional and human capacity, which leads to sustainability.’ (Non-government KI, Niger)
KIs indicate that individual capacity in terms of people’s skills and knowledge is weaker at community and local level compared to state level. As mentioned before, some SBMC members are
illiterate, which needs to be taken into account in the tasks required from them. KIs also signal that local-level desk officers do not have the required capacity yet to carry out all tasks required of them,
although some argue that this is not due to skill levels but rather because of the resources available. Regular follow-up as part of capacity building is highlighted by many KIs as key but this is especially affected by challenges in resource availability. An effective system of identifying where individual
capacity needs are highest is therefore essential in order to be able to prioritise limited resources. The SBMC Effectiveness Monitoring offers such a system at SBMC level, to the extent that it captures
all roles and responsibilities required of the SBMC, such as their role in the cash transfer programme. GEP3’s Operational Plan also foresees the establishment of a capacity development reporting system that aims to identify capacity development needs at LGEA level. At the time of the interviews, the
extent to which this was developed was not yet clear.
Individual capacity building is more likely to be successful at state level since GEP3 is able to more
directly provide support and mobilise specific technical expertise. For example, the interviewed
members of the state cash transfer PIU were positive about the capacity building provided by the external consultants during the intervention design. The 2015 GEP3 Annual Review points to improvement in state EMIS capacity due to more purposeful technical inputs, the involvement of the GEP3 M&E lead and external partnerships. Teacher Facilitators and Master Trainers implementing teacher development are sourced from government and the Colleges of Education. KIs indicate that
this is a strength because it ensures that they have relevant experience. However, the TDP baseline evaluation (De et al., 2015) indicates that although Teacher Facilitators have strong backgrounds in
Evaluation of the Girl’s Education Project 3
Disclaimer EDOREN is a consortium of leading organisations in international development and education: Oxford Policy Management (OPM), and the Institute of Development Studies (IDS) at the University of Sussex, and is supported by UK Aid. EDOREN cannot be held responsible for errors or any consequences arising from the use of information contained in this report. Any views and opinions expressed do not necessarily reflect those of OPM, IDS and EDOREN or any other contributing organisation.
EDOREN No 2, 16 Mafemi Crescent Tel +234 810 727 8718 Education Data, Research & Evaluation in Nigeria Utako Tel +234 817 667 8243 Abuja, Nigeria Email [email protected] Website www.edoren.org
© EDOREN 87
classroom teaching and school administration they have the same pedagogical limitations in their skills as are demonstrated by teachers themselves.
In addition to knowledge and skills, individual capacity is influenced by the motivation of the implementation staff and their retention after capacity has been built. Some KIs state that delays in payments to government staff involved in GEP3 interventions discourages their participation in intervention implementation. In addition, the transfer of government staff once their capacities have been built affects their ability to act as an effective project resource. According to one KI,
UNICEF has insisted that those that have been trained should not be transferred indiscriminately. Nonetheless, it remains a challenge, in particular at a time of leadership change.
‘Let there be motivation as staff get direct payment immediately work is done. Let there not be delay in payment. Currently there are delays of three months for people going from ASC enumerator up to data entry officers. That discourages.’ (Government KI, Niger)
‘Another problem also is that people come and go. This creates a problem when you build
capacity. (…) So the training they were given for some time to be able to deliver, at the end of the day he is posted elsewhere.’ (Non-government KI, Bauchi)
Government organisational capacity varies across interventions. The cash transfer scheme and EMIS are managed by special units, jointly staffed by SUBEB and SMoEs, which facilitates coordination. These units have received intensive external support to improve procedures and
systems.61 The KIIs indicate that these units are well aware of their roles and responsibilities. Although they are still confronted by challenges in the release of funds, which affects their
operation, their organisational capacity is likely to support effective implementation.
‘In Bauchi and Katsina they do not have operational manuals in terms of implementation of cash
transfer programme. The Sokoto Programme Implementation Unit has manuals in terms of record-keeping, payment, mobilisation and sensitisation. We have working documents that guide all activities. In Katsina, once the consultant left they did not have any document.’ (Government
KI, Sokoto)
61 KIs highlight that in contrast to cash transfer schemes introduced in Bauchi and Katsina in the past, the PIUs in Sokoto and Niger have access to manuals and procedures to support their operations. The PIUs also appreciate the user-friendly support software. Similarly, the interviewed EMIS members value the newly introduced ASC data software.

Evaluation of the Girl’s Education Project 3
Disclaimer EDOREN is a consortium of leading organisations in international development and education: Oxford Policy Management (OPM), and the Institute of Development Studies (IDS) at the University of Sussex, and is supported by UK Aid. EDOREN cannot be held responsible for errors or any consequences arising from the use of information contained in this report. Any views and opinions expressed do not necessarily reflect those of OPM, IDS and EDOREN or any other contributing organisation.
EDOREN No 2, 16 Mafemi Crescent Tel +234 810 727 8718 Education Data, Research & Evaluation in Nigeria Utako Tel +234 817 667 8243 Abuja, Nigeria Email [email protected] Website www.edoren.org
© EDOREN 88
However, organisational capacity at local government level may not be on a par with state level capacity, which poses a risk to implementation.
‘The SBMCs need more training because some are not literate. There was only one training, and you should continuously re-train them. Identifying the beneficiaries had some challenges. So, they had to fall back on the SBMCs to go from house to house in order to confirm the beneficiaries. So, they need training on technicalities of how they go about obtaining information.’ (Government KI, Sokoto)
Similarly, enrolment drives follow well-understood procedures, which are periodically reviewed and
subject to sharing of experience. A multi-tier coordination process involving a wide range of
stakeholders supports their implementation. The early learning intervention and G4G will be implemented with the support of non-government actors. This is likely to support the organisational capacity for implementation during the pilot, and is meant to strengthen government organisational capacity for scale-up. One point of attention is that their implementation takes place in the context
of similar interventions having been conducted in the past or being carried out at the same time in Katsina and Zamfara. If operational procedures differ substantially from past experience, this may
result in confusion among government staff.
Monitoring and follow-up support supervision are considered by most KIs as key operational processes as part of project implementation. It is therefore relevant that the GEP3 redesign has
emphasised the project’s monitoring function and has kept M&E officers as part of the GEP3 state teams. Given that the new GEP3 state teams had recently started operations at the time of the KIIs,
it was not yet clear how this would be operationalised. GEP3 partly relies on government capacity to
monitor GEP3 interventions. While state governments, with the support of partners, have invested in
quality assurance units at state, zonal and LGA level, KIs point to inadequate and infrequent implementation of intervention monitoring and follow-up after training. The main reason for this that was highlighted is that resources are not available or are not released for monitoring activities.
Other reasons mentioned are: the qualifications of the monitors (particularly at local government level), accessibility of the schools and political meddling. The KIIs indicate that monitoring is
particularly weak in IQSs because SAME and its local government structures have relatively limited access to resources to conduct the monitoring. The GEP3 baseline survey confirms that integration within GEP3-focus IQSs is not well monitored and that IQSs receive few external monitoring visits.
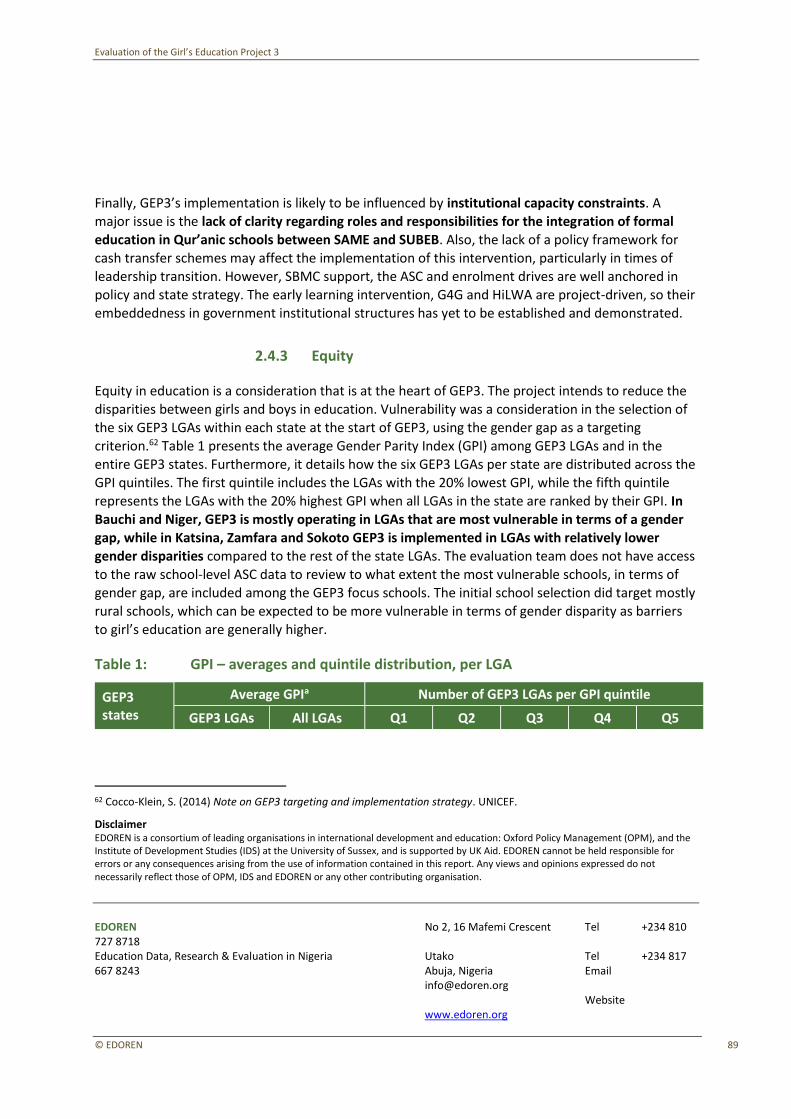
Evaluation of the Girl’s Education Project 3
Disclaimer EDOREN is a consortium of leading organisations in international development and education: Oxford Policy Management (OPM), and the Institute of Development Studies (IDS) at the University of Sussex, and is supported by UK Aid. EDOREN cannot be held responsible for errors or any consequences arising from the use of information contained in this report. Any views and opinions expressed do not necessarily reflect those of OPM, IDS and EDOREN or any other contributing organisation.
EDOREN No 2, 16 Mafemi Crescent Tel +234 810 727 8718 Education Data, Research & Evaluation in Nigeria Utako Tel +234 817 667 8243 Abuja, Nigeria Email [email protected] Website www.edoren.org
© EDOREN 89
Finally, GEP3’s implementation is likely to be influenced by institutional capacity constraints. A major issue is the lack of clarity regarding roles and responsibilities for the integration of formal
education in Qur’anic schools between SAME and SUBEB. Also, the lack of a policy framework for cash transfer schemes may affect the implementation of this intervention, particularly in times of leadership transition. However, SBMC support, the ASC and enrolment drives are well anchored in policy and state strategy. The early learning intervention, G4G and HiLWA are project-driven, so their embeddedness in government institutional structures has yet to be established and demonstrated.
2.4.3 Equity
Equity in education is a consideration that is at the heart of GEP3. The project intends to reduce the disparities between girls and boys in education. Vulnerability was a consideration in the selection of the six GEP3 LGAs within each state at the start of GEP3, using the gender gap as a targeting
criterion.62 Table 1 presents the average Gender Parity Index (GPI) among GEP3 LGAs and in the
entire GEP3 states. Furthermore, it details how the six GEP3 LGAs per state are distributed across the GPI quintiles. The first quintile includes the LGAs with the 20% lowest GPI, while the fifth quintile represents the LGAs with the 20% highest GPI when all LGAs in the state are ranked by their GPI. In
Bauchi and Niger, GEP3 is mostly operating in LGAs that are most vulnerable in terms of a gender gap, while in Katsina, Zamfara and Sokoto GEP3 is implemented in LGAs with relatively lower
gender disparities compared to the rest of the state LGAs. The evaluation team does not have access to the raw school-level ASC data to review to what extent the most vulnerable schools, in terms of gender gap, are included among the GEP3 focus schools. The initial school selection did target mostly
rural schools, which can be expected to be more vulnerable in terms of gender disparity as barriers
to girl’s education are generally higher.
Table 1: GPI – averages and quintile distribution, per LGA
GEP3 states
Average GPIa Number of GEP3 LGAs per GPI quintile
GEP3 LGAs All LGAs Q1 Q2 Q3 Q4 Q5
62 Cocco-Klein, S. (2014) Note on GEP3 targeting and implementation strategy. UNICEF.
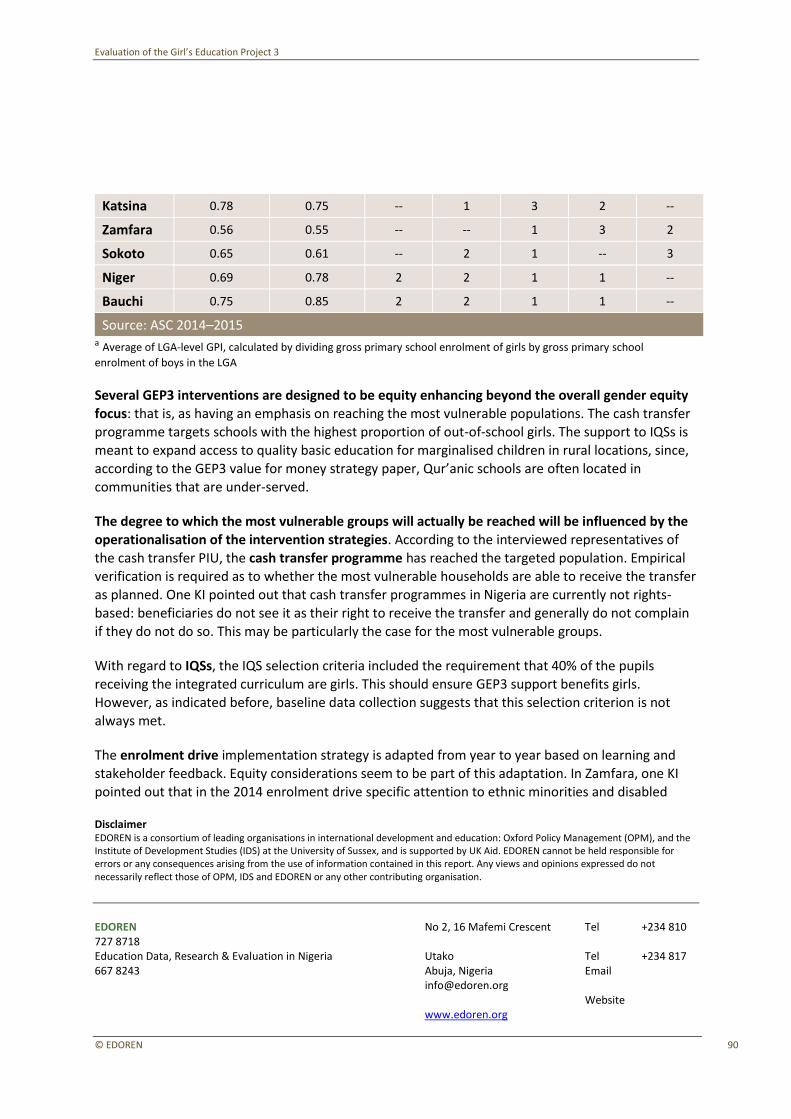
Evaluation of the Girl’s Education Project 3
Disclaimer EDOREN is a consortium of leading organisations in international development and education: Oxford Policy Management (OPM), and the Institute of Development Studies (IDS) at the University of Sussex, and is supported by UK Aid. EDOREN cannot be held responsible for errors or any consequences arising from the use of information contained in this report. Any views and opinions expressed do not necessarily reflect those of OPM, IDS and EDOREN or any other contributing organisation.
EDOREN No 2, 16 Mafemi Crescent Tel +234 810 727 8718 Education Data, Research & Evaluation in Nigeria Utako Tel +234 817 667 8243 Abuja, Nigeria Email [email protected] Website www.edoren.org
© EDOREN 90
Katsina 0.78 0.75 -- 1 3 2 --
Zamfara 0.56 0.55 -- -- 1 3 2
Sokoto 0.65 0.61 -- 2 1 -- 3
Niger 0.69 0.78 2 2 1 1 --
Bauchi 0.75 0.85 2 2 1 1 --
Source: ASC 2014–2015 a Average of LGA-level GPI, calculated by dividing gross primary school enrolment of girls by gross primary school
enrolment of boys in the LGA
Several GEP3 interventions are designed to be equity enhancing beyond the overall gender equity focus: that is, as having an emphasis on reaching the most vulnerable populations. The cash transfer
programme targets schools with the highest proportion of out-of-school girls. The support to IQSs is meant to expand access to quality basic education for marginalised children in rural locations, since,
according to the GEP3 value for money strategy paper, Qur’anic schools are often located in communities that are under-served.
The degree to which the most vulnerable groups will actually be reached will be influenced by the operationalisation of the intervention strategies. According to the interviewed representatives of the cash transfer PIU, the cash transfer programme has reached the targeted population. Empirical
verification is required as to whether the most vulnerable households are able to receive the transfer as planned. One KI pointed out that cash transfer programmes in Nigeria are currently not rights-
based: beneficiaries do not see it as their right to receive the transfer and generally do not complain
if they do not do so. This may be particularly the case for the most vulnerable groups.
With regard to IQSs, the IQS selection criteria included the requirement that 40% of the pupils receiving the integrated curriculum are girls. This should ensure GEP3 support benefits girls.
However, as indicated before, baseline data collection suggests that this selection criterion is not always met.
The enrolment drive implementation strategy is adapted from year to year based on learning and
stakeholder feedback. Equity considerations seem to be part of this adaptation. In Zamfara, one KI pointed out that in the 2014 enrolment drive specific attention to ethnic minorities and disabled
Evaluation of the Girl’s Education Project 3
Disclaimer EDOREN is a consortium of leading organisations in international development and education: Oxford Policy Management (OPM), and the Institute of Development Studies (IDS) at the University of Sussex, and is supported by UK Aid. EDOREN cannot be held responsible for errors or any consequences arising from the use of information contained in this report. Any views and opinions expressed do not necessarily reflect those of OPM, IDS and EDOREN or any other contributing organisation.
EDOREN No 2, 16 Mafemi Crescent Tel +234 810 727 8718 Education Data, Research & Evaluation in Nigeria Utako Tel +234 817 667 8243 Abuja, Nigeria Email [email protected] Website www.edoren.org
© EDOREN 91
children was included. In Bauchi, the 2014 enrolment drive targeted LGAs with the lowest enrolment. Local government coordination meetings have expanded the level of female representation. Some
KIs acknowledge the risk, though, that enrolment drives could be reaching communities close to the school, or where SBMC members reside, more than remote communities where they may be particularly needed.
The remoteness of communities and the school is likely to affect which community members are represented on the SBMC. One KI pointed out that this will particularly play a role during the rainy
season, when representatives from some communities may not be able to attend SBMC meetings. As pointed out by another KI, remote schools are disadvantaged since trainee mentors may provide
mentoring at cluster level rather than visit individual schools. This is particularly burdensome for SBMC members of schools that are located at a remote distance from the cluster point.
Humphreys and Crawfurd (2014) point out that equity considerations need to be addressed when SBMCs are empowered and expected to mobilise resources for the school. They indicate that
systems need to be put in place to make sure that poor communities that are unable to mobilise resources are not further disadvantaged by receiving no financial support.
The KIIs raised two equity considerations with regards to teacher development. First, several KIs pointed to the risk of increasing the disparities between rural and urban schools by reinforcing mother-tongue instruction. Better educated parents, mostly in urban areas, are likely to demand
instruction in English. To the extent that mother tongue instruction is reinforced in some schools—likely to be rural schools—this may exacerbate the difference between urban schools teaching in
English and attracting the children of educated parents versus rural schools teaching in the mother
tongue and attracting the children of less-educated parents. Second, KIs indicated that the teacher
training materials are mostly in English. This may disadvantage teachers with lower capacity – particularly IQS facilitators.
Evaluation of the Girl’s Education Project 3
Disclaimer EDOREN is a consortium of leading organisations in international development and education: Oxford Policy Management (OPM), and the Institute of Development Studies (IDS) at the University of Sussex, and is supported by UK Aid. EDOREN cannot be held responsible for errors or any consequences arising from the use of information contained in this report. Any views and opinions expressed do not necessarily reflect those of OPM, IDS and EDOREN or any other contributing organisation.
EDOREN No 2, 16 Mafemi Crescent Tel +234 810 727 8718 Education Data, Research & Evaluation in Nigeria Utako Tel +234 817 667 8243 Abuja, Nigeria Email [email protected] Website www.edoren.org
© EDOREN 92
3 Baseline evaluation – Early learning intervention
3.1 GEP3’s early learning intervention
3.1.1 Objectives and expected results
GEP3’s early learning intervention aims to improve the early learning skills of children in the primary grades one to three (P1–P3) in the mother tongue, while also preparing children to learn
with English as a language of instruction by the time they transition to grade four. A key measurement of success will be improved literacy skills.63
To this end, UNICEF has contracted FHI360 to implement the RANA project. The project’s primary focus is on improving reading outcomes for girls and boys in grades one to three. Improvement in
numeracy will be indirectly targeted by integrating numeracy into reading interventions.64 The RANA project has identified three intermediate results, each of which has two sub-components (see Box 1).
63 UNICEF (2015f) Strategy Paper on Early Learning (literacy and numeracy) RANA. 64 Numeracy interventions are planned to begin only after the 2016/2017 academic year (RANA Quarterly Report September – December 2015).
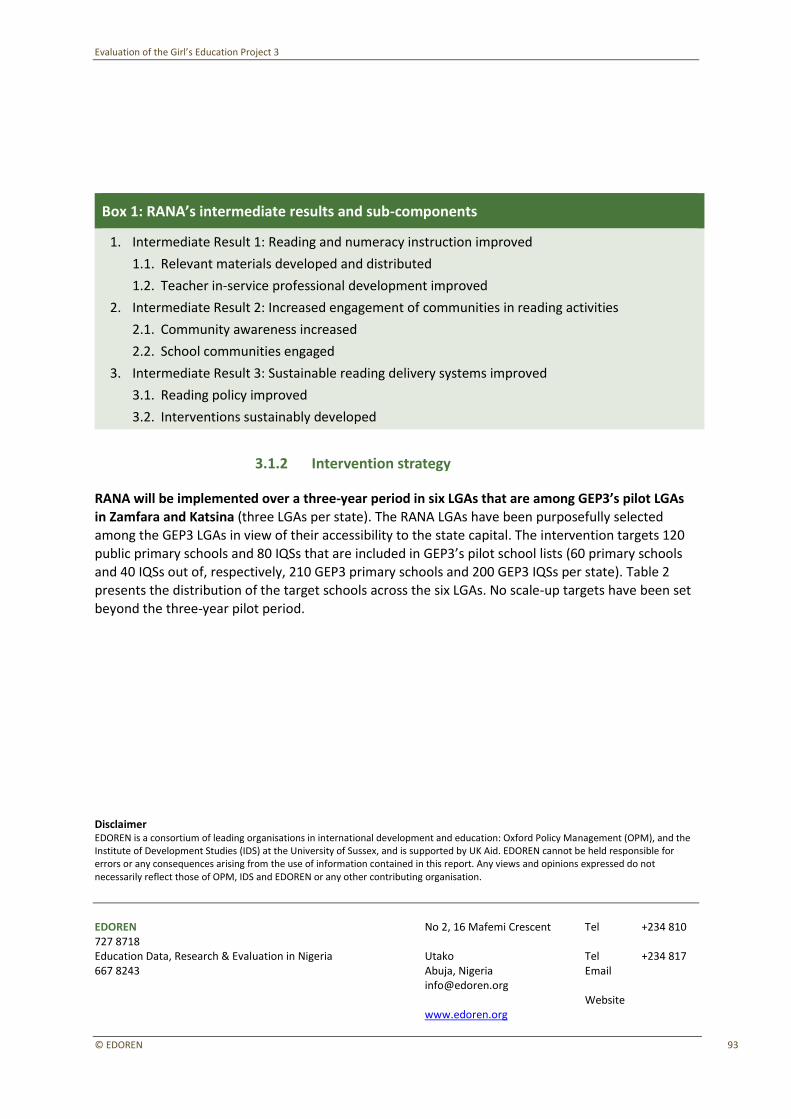
Evaluation of the Girl’s Education Project 3
Disclaimer EDOREN is a consortium of leading organisations in international development and education: Oxford Policy Management (OPM), and the Institute of Development Studies (IDS) at the University of Sussex, and is supported by UK Aid. EDOREN cannot be held responsible for errors or any consequences arising from the use of information contained in this report. Any views and opinions expressed do not necessarily reflect those of OPM, IDS and EDOREN or any other contributing organisation.
EDOREN No 2, 16 Mafemi Crescent Tel +234 810 727 8718 Education Data, Research & Evaluation in Nigeria Utako Tel +234 817 667 8243 Abuja, Nigeria Email [email protected] Website www.edoren.org
© EDOREN 93
Box 1: RANA’s intermediate results and sub-components
1. Intermediate Result 1: Reading and numeracy instruction improved
1.1. Relevant materials developed and distributed
1.2. Teacher in-service professional development improved
2. Intermediate Result 2: Increased engagement of communities in reading activities
2.1. Community awareness increased
2.2. School communities engaged
3. Intermediate Result 3: Sustainable reading delivery systems improved
3.1. Reading policy improved
3.2. Interventions sustainably developed
3.1.2 Intervention strategy
RANA will be implemented over a three-year period in six LGAs that are among GEP3’s pilot LGAs in Zamfara and Katsina (three LGAs per state). The RANA LGAs have been purposefully selected
among the GEP3 LGAs in view of their accessibility to the state capital. The intervention targets 120 public primary schools and 80 IQSs that are included in GEP3’s pilot school lists (60 primary schools and 40 IQSs out of, respectively, 210 GEP3 primary schools and 200 GEP3 IQSs per state). Table 2
presents the distribution of the target schools across the six LGAs. No scale-up targets have been set beyond the three-year pilot period.

Evaluation of the Girl’s Education Project 3
Disclaimer EDOREN is a consortium of leading organisations in international development and education: Oxford Policy Management (OPM), and the Institute of Development Studies (IDS) at the University of Sussex, and is supported by UK Aid. EDOREN cannot be held responsible for errors or any consequences arising from the use of information contained in this report. Any views and opinions expressed do not necessarily reflect those of OPM, IDS and EDOREN or any other contributing organisation.
EDOREN No 2, 16 Mafemi Crescent Tel +234 810 727 8718 Education Data, Research & Evaluation in Nigeria Utako Tel +234 817 667 8243 Abuja, Nigeria Email [email protected] Website www.edoren.org
© EDOREN 94
Table 2: Number of RANA pilot schools per GEP3 LGA and type of school
Type of school Katsina state Zamfara state
Batsari Kankia Rimi Bungudu K. Namoda Tsafe
Public primary schools
21 17 22 23 19 18
IQSs 14 12 14 18 12 10
Source: Own calculations, based on FHI360 reports
The RANA project will consist of the following core activities: 65
1. Provision of a package of teaching and learning materials
• RANA will develop and distribute the RANA Literacy Package (RLP): an improved Hausa-based
literacy curriculum, and teaching and learning materials for P1, P2 and P3 in Hausa (trainer’s guide, teacher’s guide, scripted lessons, pupil’s workbook and read aloud books).
• Gender66 and numeracy themes are integrated into the reading content, exercises and materials.
2. Teacher in-service professional development
• P1–P3 teachers and head teachers67 will be trained in Hausa-based literacy instruction using the RLP, and in teacher professionalisation (focusing on topics such as time on task, lesson planning,
and effective preparation and utilisation of materials).
• Training will take place at the level of a cluster of schools, led by a Master Trainer. In total, 20 clusters have been formed in each state, with each cluster consisting of three to six schools. All clusters in Katsina have a mixed composition of public primary schools and IQSs, while four clusters in Zamfara only consist of public primary schools.
65 RANA Quarterly Report October – December 2015. 66 Gender is integrated by using gender-sensitive characters, illustrations and adjectives, as well as through teacher sensitisation (source: communication with FHI360). 67 In IQSs all the teachers who teach non-religious subjects are invited for training. If the IQS does not have a specific head teacher position the proprietor will be trained (source: communication with FHI360).
Evaluation of the Girl’s Education Project 3
Disclaimer EDOREN is a consortium of leading organisations in international development and education: Oxford Policy Management (OPM), and the Institute of Development Studies (IDS) at the University of Sussex, and is supported by UK Aid. EDOREN cannot be held responsible for errors or any consequences arising from the use of information contained in this report. Any views and opinions expressed do not necessarily reflect those of OPM, IDS and EDOREN or any other contributing organisation.
EDOREN No 2, 16 Mafemi Crescent Tel +234 810 727 8718 Education Data, Research & Evaluation in Nigeria Utako Tel +234 817 667 8243 Abuja, Nigeria Email [email protected] Website www.edoren.org
© EDOREN 95
• Peer-mentoring: one Lead Teacher per school facilitates weekly meetings among teachers within
the school, to share ideas, discuss concerns about RLP materials, and review the forthcoming week’s lessons and exercises.68
• Master Trainers will conduct on-site monthly supervisory support and monitoring visits. SUBEB and/or LGEA staff will conduct twice-monthly visits.
3. Community awareness and engagement activities
• RANA state teams, assisted by Federation of Muslim Women’s Associations of Nigeria (FOMWAN), will sensitise communities and other stakeholders in regard to the project, in order
to obtain their support for early grade literacy.
• School communities will be engaged through the SBMC/CBMC, with each one appointing a Literacy Champion to coordinate literacy activities in their school and, as appropriate, within the
local cluster. Literacy Champions will be invited to annual training sessions to learn about
activities to support literacy acquisition.
• RANA will provide a Community Literacy Action Guide, a set of low-cost resources, materials and
exercises, and will promote the creation of community-led Literacy Action Plans.
4. State-level engagement and policy improvement activities
• State-level education stakeholders, like the SMoE, SUBEB and SAME, will be engaged to encourage state ownership and sustainability of the project.
• RANA will advocate for a change in policies of immediate concern to the project, such as policies
that support early grade literacy or (re-)deployment of teachers.
The RLP and teacher in-service professional development will be rolled out to grades P1 and P2
during the second and third terms of the 2015/2016 academic year. All teachers teaching in P1 and P2 will participate in the training. Teachers of 96 targeted schools were trained in February 2016 during a Phase 1 roll-out, while the teachers in the remaining 104 schools were trained in April 2016
(Phase 2 roll-out). P3 will be covered from the start of the 2016/2017 academic year, which will
68 For schools with only one or two teachers in early grades this school-based system of teacher support will need to be adjusted, possibly by creating mini-clusters of geographically proximate small schools within the larger clusters.
Evaluation of the Girl’s Education Project 3
Disclaimer EDOREN is a consortium of leading organisations in international development and education: Oxford Policy Management (OPM), and the Institute of Development Studies (IDS) at the University of Sussex, and is supported by UK Aid. EDOREN cannot be held responsible for errors or any consequences arising from the use of information contained in this report. Any views and opinions expressed do not necessarily reflect those of OPM, IDS and EDOREN or any other contributing organisation.
EDOREN No 2, 16 Mafemi Crescent Tel +234 810 727 8718 Education Data, Research & Evaluation in Nigeria Utako Tel +234 817 667 8243 Abuja, Nigeria Email [email protected] Website www.edoren.org
© EDOREN 96
involve distributing P3-tailored materials and involving P3 specific teachers in professional development. The intervention package will be similar for public primary schools and IQSs. The RANA
pilot project is scheduled to end in August 2018.
RANA is implemented by a consortium of organisations. FHI360 is responsible for programme management and technical quality. FOMWAN carries out community engagement and mobilisation. The Achieving Health Nigeria Initiative is responsible for teacher training, curriculum and materials development, and for M&E. RANA education field teams are to be embedded within the states and
local education authorities, who are meant to lead the interventions.
RANA will take place against the backdrop of the other GEP3 interventions being implemented (but
only in public primary schools69), such as annual enrolment drives, SBMC training and grant provision from 2015 onwards, head teacher training in 2016, and, potentially, the piloting of G4G in a subset of GEP3 schools.
3.1.3 Intervention ToC
69 In Katsina and Zamfara GEP3 will only intervene in the 40 RANA IQSs in each state, out of the initial 200 IQSs selected for GEP3 support.
Figure 1
visualises the ToC of the early learning intervention. The main causal assumption underlying the ToC is that literacy learning outcomes of girls and boys, particularly in the Hausa mother tongue, will improve in early grades if teaching practice improves through the use of improved teaching
and learning materials (use of RLP) and the presence of more knowledgeable, skilled and gender-sensitive teachers. Numeracy will be influenced indirectly by incorporating numeracy themes into
the reading content, exercises and materials.
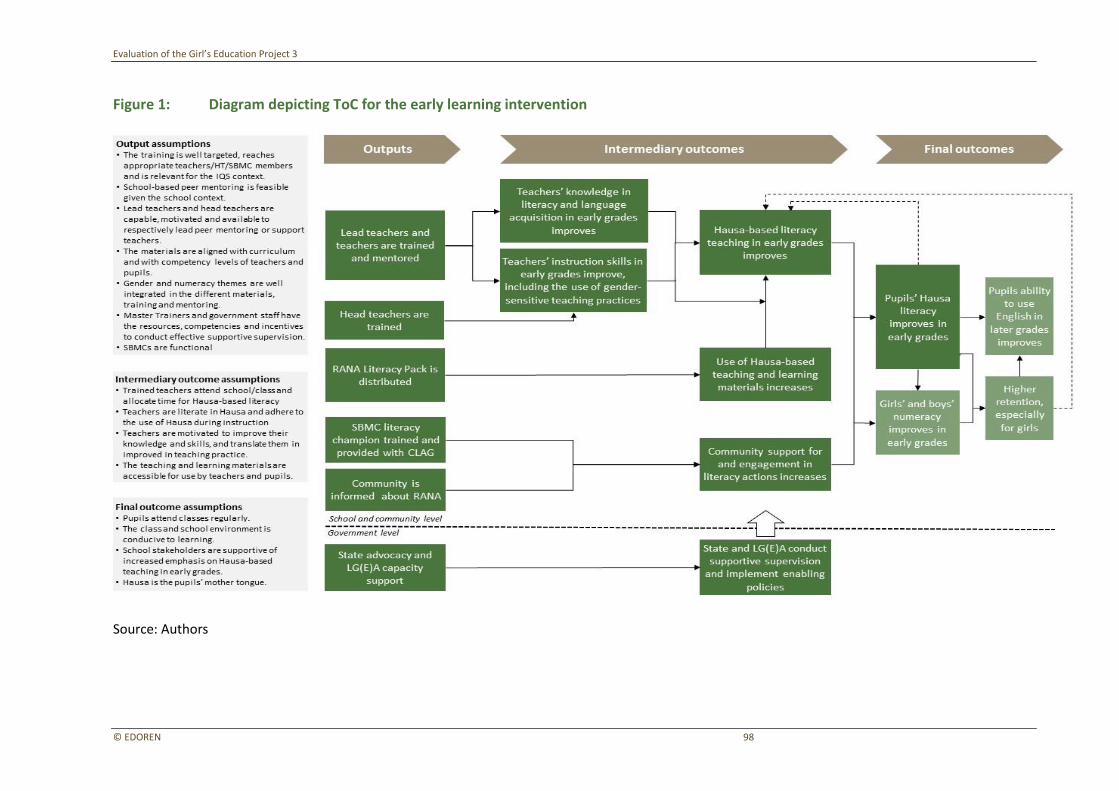
Evaluation of the Girl’s Education Project 3
© EDOREN 98
Figure 1: Diagram depicting ToC for the early learning intervention
Source: Authors
Evaluation of the Girl’s Education Project 3
© EDOREN 99
The central assumption discussed above is conditional on school stakeholders (such as parents,
community leaders, IQS proprietors, head teachers, teachers and government staff) being supportive of an increased emphasis on mother tongue instruction and literacy acquisition; and on the teachers adhering to use of the mother tongue during instruction. To this end, the project will engage the community, champion literacy in the communities, train head teachers and advocate for government
to implement enabling public policies. Other factors that will influence improved Hausa-based teaching practices are regular pupil attendance and the class and school environments being conducive for learning. The focus on Hausa assumes that it is the mother tongue and the language that pupils know and understand best.
Improvement of teacher knowledge and skills through in-service teacher development is assumed
to be central to more effective teaching in the early grades.70 This assumes that the improved Hausa literacy curriculum, the materials, the pedagogical methodology and the in-service training and mentoring approach are well targeted to the needs and capacity level of teachers, as well as to their teaching environment in public primary schools and IQSs. To optimise teacher learning, the project
envisions a teacher development approach based on progressive professional development and school-based peer-mentoring, complemented by supportive supervision and monitoring by Master Trainers and government staff. The success of this approach depends on teachers being literate in
Hausa, weekly peer meetings being feasible given the context of the school (for example, teachers being able to meet regularly with other teachers given the size of the school or its location), Lead
Teachers having the capacity, motivation and availability to lead the meetings, and Master Trainers and government staff having the resources, competencies and incentives to conduct effective
supportive supervision. Through gender-sensitive training that addresses equity in the classroom, teachers are expected to target girls more specifically in class, which is meant to increase the likelihood of girls benefiting of the education provided.
In order for teacher training to result in improved knowledge, skills and teaching practices, teachers are assumed to be motivated to learn and translate new knowledge and skills into
practice. Peer-to-peer interaction, supportive supervision and other incentives (e.g. training certificates) are meant to contribute to this. The extent to which teacher motivation translates into
improved teaching may also be influenced by teachers’ remuneration and their working conditions, among other factors. Furthermore, actual improved teacher efficacy and learning outcomes may
improve teachers’ perceived efficacy, which in turn may increase their motivation.
Improved teaching and learning is assumed to be facilitated by the distribution and usage of relevant teaching and learning materials in Hausa. This requires that the teachers have the
pedagogical knowledge and skills to effectively use the materials during teaching. Furthermore, it assumes that the materials are well aligned with the curriculum and with the competency levels of
the teachers and pupils.
While the central objective of the early learning intervention is to improve pupils’ literacy and, to a lesser degree, numeracy skills, it is assumed that this will facilitate the acquisition of English as a
second language, and the transition to English in later grades. Furthermore, improved learning in the early grades is expected to contribute to higher retention rates because children who perform well early on are assumed to be more motivated and supported by their parents to remain in school longer, a link that may be particularly important for girls, who face a higher risk of dropping out
(UNICEF, 2014d). A potential feedback loop exists between increased retention and teaching quality
70 We distinguish between three types of knowledge: subject knowledge, curriculum knowledge and pedagogical knowledge. See Section 3.2.9.2.
Evaluation of the Girl’s Education Project 3
© EDOREN 100
in early grades. This feedback loop can be negative or positive. If higher retention is not accompanied
by increased teaching and school resources, it can lead to higher pupil-to-teacher ratios, which may negatively affect teaching quality. On the other hand, teachers may be increasingly motivated by the higher retention of their students, which may positively influence teaching quality.
3.1.4 Planned research and M&E
In this section we describe research and M&E activities that are complementary to the evaluation and that could be of use for the interpretation of the evaluation findings.
• Planned M&E by RANA
RANA will conduct monitoring and formative evaluation based on the monthly school support visits that will be conducted at each school by Master Trainers, sometimes in collaboration with School Support Officers. Dimensions that will be monitored during school support visits will include fidelity
of implementation (proper use of RANA-scripted lessons), availability of learning materials, pupil learning (reading and mathematics)71, basic time use, and gender equity. Data will be collected electronically using tablets. Box 2 presents the six data collection tools that will be used by the
Master Trainers and School Support Officers.
Box 2: RANA monitoring tools
1. Head Teacher Meeting Guide: collects information on how the RANA programme is being implemented in the school, what specific challenges are being faced, and what is working well.
2. Lead Teacher Meeting Guide: collects data on and reviews weekly class observations with Lead Teacher.
3. Classroom Observation Tool: captures data on activities included in the teachers’ scripted lessons that teachers deliver in the classroom; observation of the time taken for each activity; and data on the classroom environment, including teacher confidence and preparedness, and equal participation of boys and girls.
4. Teacher Meeting Guide and Feedback Tool: facilitates discussion of observed results from classroom observation with the teacher and captures data on teacher practices that cannot easily be observed (including gender practices).
5. EGRA: pupil reading assessment covering letter sound knowledge (P1 and P2), letter writing (P1), syllable and short word reading (P1 and P2), listening comprehension (P1 and P2) and oral reading fluency (P2).
6. EGMA: pupil mathematics assessment covering number identification (P1) and quantity discrimination (P2).
The RANA project has established a results framework, which includes outcome, output and process indicators.
71 Master Trainers and School Support Officers will observe classrooms, will conduct early grade reading assessments (EGRA) and early grade mathematics assessments (EGMA) with a small number of students (three to five students randomly selected from each observed class), and will hold formative meetings with teachers, head teachers, and lead teachers.

Evaluation of the Girl’s Education Project 3
© EDOREN 101
• Planned research by UNICEF
UNICEF is planning research into parents’ attitudes regarding the language of education and learning. This research is scheduled for 2017/2018. The terms of reference for this study have yet to be specified.
3.2 Methodology
This section describes the methodology that guided the design, implementation and analysis of the baseline. It starts with a presentation of the evaluation questions and design as a framework for the baseline’s methodological choices. Subsequently, specific methodological issues are discussed: the
sampling strategy, the randomisation process, the instrument design, the survey field work and the data quality assurance. The section ends with a description of ethical and inclusion issues, and methodological limitations.
3.2.1 Evaluation questions
The evaluation of GEP3’s early learning intervention takes a theory-based approach. The intervention’s ToC was used as a framework for formulating the evaluation questions. The
evaluation questions interrogate a wide range of the cause–effect assumptions underlying different steps in the ToC, in order to better understand how change may come about. The evaluation questions subsequently guided the overall evaluation design and baseline methodology. The
evaluation questions are presented in Box 3.
Box 3: Evaluation questions for evaluation of GEP3’s early learning intervention
1. To what extent does the early learning intervention improve Hausa literacy and English language learning outcomes among girls and boys in the early grades in primary schools and IQSs?
To what extent does the early learning intervention reduce the gap between the learning outcomes of the lowest performing pupils and the expected learning outcomes, as expressed in the curriculum?
2. To what extent does teachers’ knowledge of literacy and language acquisition in early grades improve as a result of the intervention?
3. To what extent do teachers’ skills in early grade, gender-sensitive instruction improve as a result of the intervention?
4. To what extent and how do teachers adjust and change their classroom practices as a result of the intervention?
5. Are more reading and learning materials in Hausa used in the classroom due to the intervention? Do they contribute to more effective teaching and learning?
6. To what extent does the early learning intervention improve pupil retention, especially retention of girls?
In addition to the intervention’s ToC, the choice of the above questions has been based on the following additional considerations and contextual factors:
• In line with GEP3’s emphasis on quality of learning and DFID’s current focus on learning within the education sector (DFID, 2013), the GEP3 evaluation prioritises measuring changes in learning
Evaluation of the Girl’s Education Project 3
© EDOREN 102
outcomes over changes in access to education. While the RANA project emphasises reading as
one aspect of pupil’s learning outcomes, the evaluation questions adopt literacy as a more comprehensive construct to be examined, in line with the GEP3 strategy paper on the early learning intervention. Due to the fact that the intervention only indirectly targets numeracy, and because budget constraints limited the number of assessments that could be included in the
evaluation, numeracy is not prioritised in the evaluation questions.
• From an equity perspective it is important to understand if learning is taking place for all, and whether GEP3 is improving the learning outcome of the pupils who are currently falling below expected levels, as expressed in the curriculum. Hence, the evaluation questions include a focus
on examining the learning outcomes of the lowest performing pupils.
• Given the fact that the early learning intervention is of the strategic interest for the project as a whole and the limited evidence base for the intervention there is strong agreement among GEP3 management and DFID Nigeria that the evaluation should emphasise determining the effects of
the intervention on teaching and learning outcomes, and should quantify the attributable
impact of the intervention on these outcomes.
• The evaluation focuses on the linkage between teacher knowledge and skills, teacher classroom practices and learning, and the actual use of language in this teaching/learning nexus. The evaluation thereby responds to the high need for such evidence identified in Humphreys and Crawfurd (2014). Research planned under GEP3 will assess community engagement activities and
parents’ attitudes toward the language of instruction.
3.2.2 Evaluation design
To answer the questions regarding whether changes in learning, teaching and teacher knowledge and skills are attributable to the early intervention, the evaluation is designed as a clustered RCT, stratified by LGAs and type of school (primary school vs. IQS).72 For each type of school an equal sized
study sample of schools was randomly selected from among all GEP3 schools in each of the six GEP3
LGAs in which RANA is being implemented.73 Subsequently, half of the school study sample in each LGA was randomly assigned to a treatment group and the other half to a control group. The selected study treatment schools were included among the larger groups of schools targeted by FHI360 to receive the RANA intervention, while the control schools were not selected for intervention
implementation. The details of the sampling strategy, sample sizes and randomisation procedure are discussed in the next sections.
The aim of the random selection of treatment and control schools is to construct two groups of schools that are statistically equivalent on average at the start of the evaluation (i.e. at baseline), in terms of observable and unobservable factors. If the randomisation succeeds in creating such
equivalent groups, any differences observed in outcome variables at a later stage of the intervention can be attributed to the intervention (Section 3.3 presents the data on the balance between the treatment and control group). We opted to conduct the randomisation at the school level as this is also the unit at which most of RANA’s activities are implemented,74 and because schools offer
sufficient units of randomisation to achieve the desired statistical power.
72 The clustered aspect of the randomisation refers to the fact that the randomisation takes place at a cluster or group level instead of at an individual level. In this case the cluster/group is the school. 73 There are approximately 35 GEP3 primary schools and 33 IQSs per LGA. 74 Some activities will take place at the level of a cluster of schools (i.e. cluster-based training), which will require particular attention, as discussed below.
Evaluation of the Girl’s Education Project 3
© EDOREN 103
We chose a RCT design because: a) the evaluation questions emphasise the quantification of
attributable impact and focus on a relatively well-delineated causal chain between teacher development, teaching practice and learning outcomes; b) the design is strong in terms of minimising selection bias and therefore identifying attributable impact; c) sufficient sample units are available to generate statistically significant findings; d) baseline data are not strictly required to assess impact,
which provides flexibility at endline in regard to evaluating impact on outcomes for which no baseline data are available; and e) we considered it feasible to construct and maintain a valid control group. While the identification and maintenance of a valid control group is a concern and is exposed to risks75, the fact that RANA is piloted within a subset of identifiable GEP3 schools facilitated the construction of sample frames from which treatment and control schools could be selected.
Furthermore, since the control group is selected from among GEP3 schools (i.e. from among schools in which RANA would not be piloted), GEP3 should have relatively good awareness of, and control over, what takes places in such schools. This lowers the risk of the control group being contaminated.
The RCT design is combined with an overarching theory-based evaluation approach. The
intervention’s ToC is used to select the outcomes of interest for which changes will be compared between treatment and control schools. These outcomes cover intermediary and final outcomes along the assumed causal chain, which will make it possible to unpack how change takes place.
A series of quantitative methods are used within the sampled schools to collect data on outcomes and other explanatory variables – in particular the administration of pupil and teacher tests,
structured teacher classroom observations and a survey of pupils, teachers and head teachers using closed-ended, structured questionnaires. Due to budget constraints, EDOREN will not implement
school- or community-level qualitative research during the 2015–2017 evaluation period.76 The evaluators are aware that this is a limitation of the design. However, this may change in the 2017–2020 scale-up period, during which qualitative research could be implemented for in-depth
explanation of the quantitative findings at midline. The quantitative measurement along the ToC does provide a rich dataset that unpacks the ToC. Furthermore, qualitative data generated through a
new round of state-level stakeholder interviews (scheduled for the first quarter of 2017) will enrich the understanding of the context in which RANA takes place, and will provide insights about
implementation challenges and intervention performance. In addition, RANA M&E data can complement quantitative survey data.
The data collection methods are/will be applied at baseline, midline and endline. Baseline data collection took place in October–November 2015 in the first term of the 2015–2016 school year before the start of RANA implementation (see Figure 2). The details of the baseline survey
implementation are presented in the rest of section 3.2. Midline data collection is scheduled for May–June 2017, which is the fifth school term of RANA implementation. This is before the
intervention is scheduled to finish. The timing of the midline has been chosen to allow for evaluation findings to inform GEP3 scale-up decision-making in 2017. Endline data collection is not included in Figure 2 because the resources, scope and timing of endline data collection have yet to be decided,
although its timing is preliminarily set for 2019. While all evaluation questions can be answered at
midline, endline data collection would offer answers about longer-term effects.
75 School lists have been unreliable in the past and are almost completely non-existent for IQSs. Stakeholders have stressed, and past experience has demonstrated, that it is difficult to coordinate with government partners in order to prevent control schools from being affected by the intervention (‘contamination’). The security situation in northern Nigeria also increases the degree of unpredictability. 76 Initially, EDOREN had planned semi-structured, qualitative classroom observations and in-depth, unstructured teacher interviews to complement structured, quantitative classroom observations.

Evaluation of the Girl’s Education Project 3
© EDOREN 104
Figure 2: Timeline of data collection and the RANA intervention
School year 2015 – 2016
School year 2016 – 2017
School year 2017 – 2018
2018
Sep–Dec Jan–Mar Apr–Jun Sep–Dec Jan–Mar Apr–Jun Sep–Dec Jan–Mar Apr–Jun Aug
Baseline Midline
A panel approach is used to sample pupils for the evaluation. The same pupils that are randomly selected at baseline will be re-interviewed and re-assessed during the midline survey, both in
intervention and control schools. A panel approach is chosen because it is more cost-effective in terms of required sample size than a cross-section survey. It also allows us to efficiently measure and
compare the retention of pupils in the sampled cohorts in the intervention and control groups. Furthermore, it does not cause comparability problems when baseline and midline surveys take place during different terms in the school year, since both treatment and control groups will on average have gone through the same school cycle between baseline and midline, and are therefore
comparable. The disadvantage of a panel approach is that a certain degree of attrition of pupils from the sample can be expected. Since the period between baseline and midline is not very long, we
think that the attrition level will be acceptable and we have taken this into account in determining the sample size.77
At baseline, pupils are randomly sampled from among all pupils in P2 grade (or equivalent in IQSs)
when they are in the first term of the 2015–2016 school year. The panel survey approach will enable us to measure the impact of the early learning intervention on improving learning outcomes
between the start of P2 and the end of P3 for the cohort of pupils. The evaluation will not be able to
measure the impact of a pupil being exposed to the entire three years of RANA, from P1 to P3. P2
pupils were chosen as the target population at baseline for the following reasons:
• Because of resource and logistical reasons the data collection for the evaluation of the early
learning intervention is linked to the data collection for evaluation of the IQSS. Because this evaluation uses a cross-sectional survey P1 pupils in their first school term are not an appropriate
study population because they would not have been exposed to any teaching at baseline nor at midline.
• The measurement of literacy at the start of P1—before being exposed to any teaching—would
likely demonstrate strong floor effects and offer limited valuable information in regard to observing the real differences between intervention and control school pupil abilities.
• Since literacy levels at P1 would likely to be very limited in the treatment and control schools it would be impossible to verify whether the treatment and control groups are balanced on this main outcome of interest.
77 If an endline survey is conducted in 2019 in the study schools it is highly likely that a large percentage of the pupil panel may have dropped out or transferred school in the four-year period between baseline and endline. If sufficient resources are available pupils can be tracked to be surveyed outside of their former schools. If the resources to do this are not available, the size of the original panel of pupils who are still at the sampled school may not be sufficient to draw statistically significant results. In such a case, we propose to take a new cross-sectional sample at P2 and/or an upper grade.
Phase 1 Phase 2
RANA roll-out in P1–P2
RANA roll-out in 3
Evaluation of the Girl’s Education Project 3
© EDOREN 105
Due to the phased roll-out of RANA in P1–P2 in the period February–May 2016, the pupils in 96 of
the schools (Phase 1) will have around two to three months of additional exposure to RANA interventions compared to the other 104 schools (Phase 2). Given that the schools are known this information can be taken into account during analysis.
Teacher and head teacher surveys will also take a panel survey approach. The same teachers and
head teachers will be surveyed at baseline and midline. Although some attrition can be expected, we anticipate that attrition levels at midline will be low. As part of RANA implementation, agreement is sought to keep the trained teachers in the lower primary grades and for teachers not to be transferred to non-project schools.78
3.2.3 Sampling strategy and sample of the baseline survey
3.2.3.1 Universe
The study universe for the baseline of the early learning intervention evaluation is made up
entirely of public primary schools and IQSs selected for GEP3 intervention in the six LGAs in Zamfara and Katsina where RANA is implemented. Since the implementing organisation purposefully selected three RANA LGAs out of the six GEP3 LGAs in each state, the study universe does not correspond to the entire GEP3 school population.
The eligibility of schools for GEP3 support requires that a school fulfils certain criteria set by the project. This is particularly important when defining the universe for the IQSs. All IQSs included in the
GEP3 need to have started integration (that is, non-religious, formal core subjects, such as language and mathematics, are taught at the school), should teach both boys and girls79 and should be registered with a government agency.
The definition of the universe also extends to teachers and pupils. The target population of pupils
need to be enrolled in P2 and need to study non-religious subjects. In public primary schools the identification of the pupils is relatively straightforward; however, in IQS a more detailed definition of the pupil universe is warranted due to non-standard composition and organisation of the IQS. In
order to achieve coherently defined population universes across two types of schools, it was necessary to further operationalise the P2 equivalent level for IQSs (see Box 4).
78 Based on EDOREN’s experience with TDP and ESSPIN surveys in Nigeria, this issue of obtaining agreement regarding the non-transfer of trained teachers needs to be approached with caution. In practice, teacher transfer is difficult to control. Therefore, we will take into account attrition in the teacher sample when determining the sample size. 79 A minimum of 40% of pupils are girls.
Evaluation of the Girl’s Education Project 3
© EDOREN 106
Box 4: P2 or the equivalent level
In IQSs we are interested in obtaining information for pupils that are at the same level as P2 pupils in public primary schools: that is, pupils that are at the ‘equivalent level’ to P2.
For the purpose of our survey, such pupils have been defined as ‘pupils that have been learning non-religious subjects at primary school level at this school for more than one year, but for less than two years’. In addition, they must have started at the sampled IQS at the lowest primary level.
These two conditions together ensure that the children have had exposure to more than one year of formal schooling, but less than two years. This makes them comparable to P2 pupils in public primary schools. The classes that such pupils are placed in are therefore the ‘equivalent level’ classes, which are what we are interested in. These may be called Stage 1, Stage 2, Basic Literacy, Post-basic literacy, or some other name unique to the particular IQS.
Similarly to the pupils, the universe of teachers considered for the early learning intervention
consists of teachers teaching at the designated schools and teaching pupils enrolled in Grades 1 to
3 or equivalent (see Box 5).
Box 5: P1–P3 or equivalent level
In IQSs we are interested in obtaining information for teachers that teach pupils that are at the same level as P1–P3 pupils in public primary schools: that is, pupils that are at the ‘equivalent level’ as P1–P3.
For the purpose of the survey, such pupils have been defined as ‘pupils that have been learning non-religious subjects at primary school level at this school for less than four years’. In addition, they must have started at the sampled IQS at the lowest primary level.
These two conditions together ensure that the children have had exposure to less than four years of formal schooling. This makes them comparable to P1–P3 pupils in public primary schools. The classes that such pupils are placed in are therefore the ‘equivalent level’ classes, which are what we are interested in. These may be called Stage 1, Stage 2, Basic Literacy, Post-basic literacy, or some other name unique to the particular IQS.
3.2.3.2 Sampling frame
The school sampling frame consists of all GEP3 schools in the selected LGAs of the two designated
states. The sampling frame was constructed based on GEP3 school lists maintained by UNICEF. The total sampling frame for the baseline of the early learning intervention consists of 410 schools (210 public and 200 IQSs) in six LGAs in two states. All of the schools in the sampling frame were assumed to be GEP3 compliant and thus eligible for inclusion in the intervention.
However, during the fieldwork it became apparent that the quality of the sampling frame of IQSs
was poor. The Qur’anic schools were meant to have started integration – teaching non-religious
subjects. Due mainly to non-integration (schools not teaching non-religious subjects) many of the
IQSs included in the sampling frame were found to be ineligible to be surveyed. This required the sampling of replacements schools (see below).
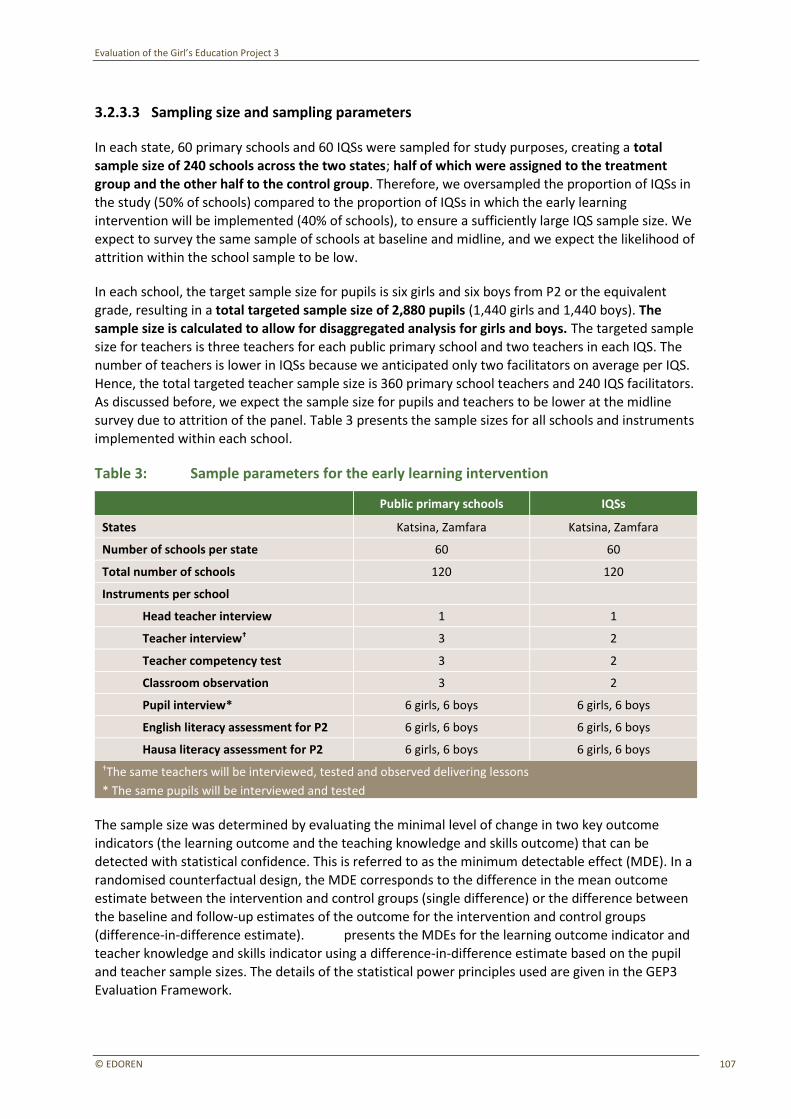
Evaluation of the Girl’s Education Project 3
© EDOREN 107
3.2.3.3 Sampling size and sampling parameters
In each state, 60 primary schools and 60 IQSs were sampled for study purposes, creating a total
sample size of 240 schools across the two states; half of which were assigned to the treatment group and the other half to the control group. Therefore, we oversampled the proportion of IQSs in the study (50% of schools) compared to the proportion of IQSs in which the early learning intervention will be implemented (40% of schools), to ensure a sufficiently large IQS sample size. We expect to survey the same sample of schools at baseline and midline, and we expect the likelihood of
attrition within the school sample to be low.
In each school, the target sample size for pupils is six girls and six boys from P2 or the equivalent grade, resulting in a total targeted sample size of 2,880 pupils (1,440 girls and 1,440 boys). The sample size is calculated to allow for disaggregated analysis for girls and boys. The targeted sample size for teachers is three teachers for each public primary school and two teachers in each IQS. The
number of teachers is lower in IQSs because we anticipated only two facilitators on average per IQS.
Hence, the total targeted teacher sample size is 360 primary school teachers and 240 IQS facilitators. As discussed before, we expect the sample size for pupils and teachers to be lower at the midline
survey due to attrition of the panel. Table 3 presents the sample sizes for all schools and instruments implemented within each school.
Table 3: Sample parameters for the early learning intervention
Public primary schools IQSs
States Katsina, Zamfara Katsina, Zamfara
Number of schools per state 60 60
Total number of schools 120 120
Instruments per school
Head teacher interview 1 1
Teacher interview† 3 2
Teacher competency test 3 2
Classroom observation 3 2
Pupil interview* 6 girls, 6 boys 6 girls, 6 boys
English literacy assessment for P2 6 girls, 6 boys 6 girls, 6 boys
Hausa literacy assessment for P2 6 girls, 6 boys 6 girls, 6 boys
†The same teachers will be interviewed, tested and observed delivering lessons * The same pupils will be interviewed and tested
The sample size was determined by evaluating the minimal level of change in two key outcome indicators (the learning outcome and the teaching knowledge and skills outcome) that can be
detected with statistical confidence. This is referred to as the minimum detectable effect (MDE). In a
randomised counterfactual design, the MDE corresponds to the difference in the mean outcome
estimate between the intervention and control groups (single difference) or the difference between the baseline and follow-up estimates of the outcome for the intervention and control groups (difference-in-difference estimate). Box 6 presents the MDEs for the learning outcome indicator and teacher knowledge and skills indicator using a difference-in-difference estimate based on the pupil and teacher sample sizes. The details of the statistical power principles used are given in the GEP3 Evaluation Framework.
Evaluation of the Girl’s Education Project 3
© EDOREN 108
Box 6: Estimation of MDEs
MDEs for pupil learning outcomes
In line with the GEP3 logframe, the main literacy indicator is defined as the percentage of girls that achieve basic literacy (specified as Hausa literacy). Used in determining the required sample size, the MDE is a function of the baseline value of the outcome indicator. At the time of sample size calculation we did not know the baseline values of the learning outcome indicators, but learning outcomes in northern Nigeria are generally very low. We therefore estimate the MDE using plausible and maximum scenarios. Furthermore, we assume an intra-cluster correlation (ICC) of 0.3, a relatively high inter-temporal correlation (ITC) of 0.8, given the panel approach, 80% power, and a 95% confidence level. We take into account 30% attrition of sampled pupils between baseline and midline.
Using a plausible scenario that the baseline percentage of pupils that achieve basic Hausa literacy is as low as 10%, we estimate that a 3.8 percentage point net increase would be statistically detectable when the data of primary schools and IQSs, girls and boys, are analysed jointly. When primary schools and IQSs are analysed separately, but combining the data of girls and boys, we estimate that this MDE would be 5.3 percentage points. The MDE estimate for disaggregated analysis of girls and boys for each type of school equals 5.9 percentage points.
The largest MDE for a given sample size would be produced under the unlikely scenario of a baseline value of 50% of pupils achieving Hausa literacy. In such a case, the MDE amounts to 6.3 percentage points for combined ‘primary school and IQS, girls and boys’ analysis, 8.9 percentage points for separate primary school/IQS analysis but combining girls and boys, and 9.8 percentage points for a fully disaggregated analysis. By controlling for some covariates that influence learning outcomes, for example the age of the pupil, we expect to reduce the variance of the estimates as part of the analysis. This will allow us to detect smaller effect sizes for a given power and sample size.
MDEs for knowledge and skills outcomes
The teacher knowledge and skills outcome indicator is the percentage of teachers demonstrating minimum teaching knowledge and skills. The 2013 TDNA assessed teacher competencies for primary schools and IQS teachers in Katsina and Zamfara.80 While results varied from state to state, a 10% baseline value seems plausible (and is potentially even on the high side). We assume an ITC of 0.8, an ICC of 0.3, 80% power, and a 95% confidence level. We take into account 25% attrition of sampled teachers between baseline and midline.
Taking into account the sample size and above parameters we estimate that we will minimally detect a net increase of 4.7 percentage points between baseline and midline, assuming a baseline value of 10% and jointly analysing primary school and IQS data. The MDE will be higher with disaggregated analysis, i.e. approximately 6.4 to 6.7 percentage points for primary schools and IQSs respectively. Assuming a 50% baseline value scenario, which returns the highest possible MDE for a given sample size, the MDE would be 7.8 percentage points in the case of aggregated analysis of primary schools and IQSs and approximately 11 percentage points in the case of disaggregated analysis. In line with the GEP3 logframe, we anticipate the increase in teacher competencies to be relatively large since teachers will be the direct beneficiaries of intense teacher training and mentoring.
80 Johnson, D. and Hsieh, P.J (2014)
Evaluation of the Girl’s Education Project 3
© EDOREN 109
3.2.3.4 Sampling design
The main sampling method for schools was a single-stage stratified systematic random draw, while
teachers and pupils were drawn through a two-stage stratified systematic sample. Measurements were performed both at school as well as at the pupil and teacher levels, as described in greater detail in the instruments section (see Section Instrument design and preparation).
Two types of schools (public and IQS) were used as explicit strata. The sampling draw was fully separate for each type of school. Secondary explicit strata were defined by the LGA. An equal
number of schools was drawn from each LGA. Within each explicit stratum an implicit stratification was based on type of location (urban, rural) and within each type of location on Euclidian distance from Abuja. The distance from Abuja was used as a proxy for the geographical dispersion of the sample within each LGA. The distance to Abuja was calculated using GPS coordinates provided within the sampling frame.81 Abuja was chosen as an arbitrary location that was far enough away to allow
for geographical dispersion of Euclidian distances within the LGAs.
The systematic random sampling used a random start and a real sampling step. Implicit stratification was achieved by sorting with each explicit stratum.
In each LGA 20 public and 20 IQSs were randomly drawn. In addition, two schools per type per LGA
were drawn as initial replacement schools, to provide a pool of schools that could be surveyed in case any of the schools in the main sample were found to be ineligible or inaccessible during the
fieldwork period. Therefore, the sampling setup had provision to select 22 schools of each type in any given LGA in Zamfara and Katsina.
The replacement schools were marked after the sample had been drawn. A uniformly distributed
random variable was used to sort the schools within each type and LGA and the last two schools in this sequence were designated as replacement schools. Similarly, the random variable was used to
designate the replacement sequence among the designated replacement schools.
During fieldwork many of the IQSs were found to be ineligible. The reason for ineligibility was mainly
non-integration or poor integration of schools. For this purpose, additional replacement schools had
to be sampled during the fieldwork. The drawing of the replacement schools mostly mirrored the main sampling approach. In some LGAs the number of eligible GEP3 IQSs became quite limited due to high proportions of ineligibility. In these cases all of the available replacements were released to the field for the survey team to select replacements in an order that corresponded to a pre-assigned random sequence of release.
Maps of the sampled schools included in the study are presented in Annex B.
School entry
The sampling of the teachers and pupils was carried out by the survey teams at the selected
schools. Therefore, school entry was important in establishing a rapport and establishing the
credibility of the data collection at schools. It also imprinted the importance of rigorous selection of all the respondents at schools and was the occasion for presenting to the head teacher the sampling
81 GPS coordinates were only available in the sample frame for the early learning intervention baseline (Katsina and Zamfara). They were not available in the sample frame for the IQSS baseline (Niger and Bauchi)
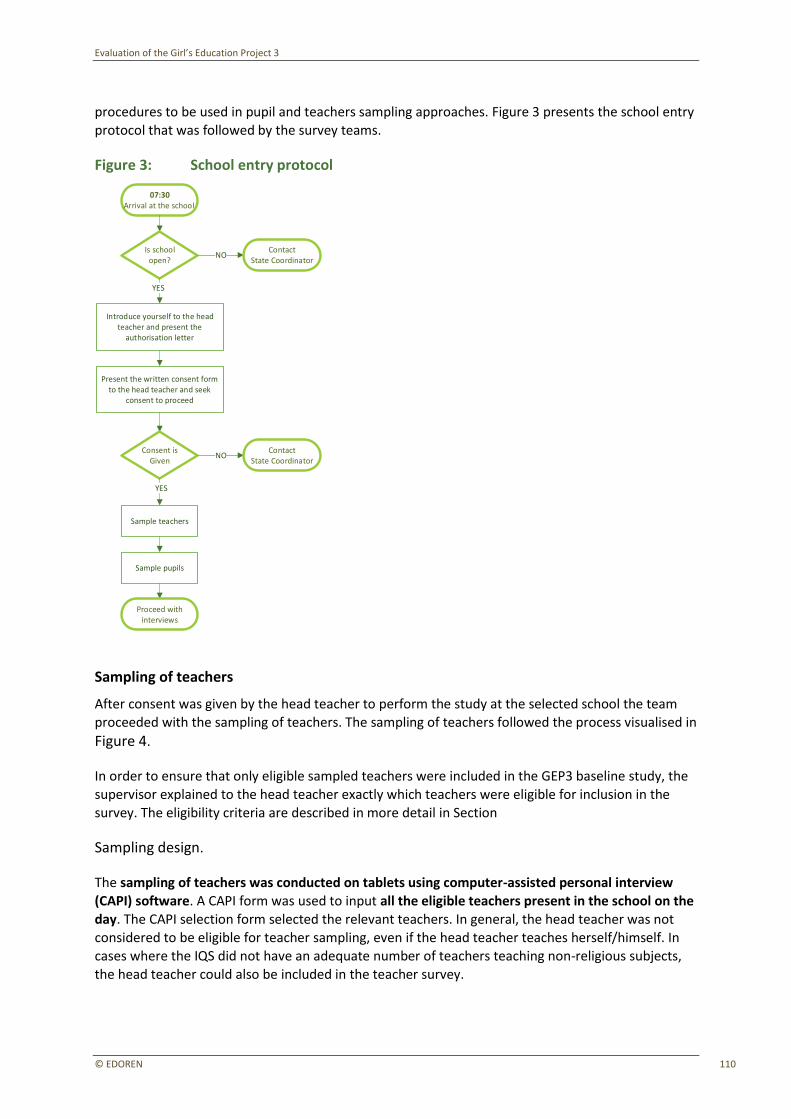
Evaluation of the Girl’s Education Project 3
© EDOREN 110
procedures to be used in pupil and teachers sampling approaches. Figure 3 presents the school entry
protocol that was followed by the survey teams.
Figure 3: School entry protocol
07:30Arrival at the school
Is school open?
Present the written consent form to the head teacher and seek
consent to proceed
NOContact
State Coordinator
Consent isGiven
NOContact
State Coordinator
YES
Sample teachers
Sample pupils
Proceed with interviews
YES
Introduce yourself to the head teacher and present the
authorisation letter
Sampling of teachers
After consent was given by the head teacher to perform the study at the selected school the team
proceeded with the sampling of teachers. The sampling of teachers followed the process visualised in
Figure 4.
In order to ensure that only eligible sampled teachers were included in the GEP3 baseline study, the supervisor explained to the head teacher exactly which teachers were eligible for inclusion in the survey. The eligibility criteria are described in more detail in Section
Sampling design.
The sampling of teachers was conducted on tablets using computer-assisted personal interview (CAPI) software. A CAPI form was used to input all the eligible teachers present in the school on the day. The CAPI selection form selected the relevant teachers. In general, the head teacher was not considered to be eligible for teacher sampling, even if the head teacher teaches herself/himself. In cases where the IQS did not have an adequate number of teachers teaching non-religious subjects,
the head teacher could also be included in the teacher survey.

Evaluation of the Girl’s Education Project 3
© EDOREN 111
Figure 4: Teacher sampling
Talk with theHead Teacher
Public
Ask for teacher attendance registers for the day of the
interview for teachers teaching in P1-P3
YES
Check:• It is for the current day• It covers teachers of the correct grade• It covers teachers teaching non-religious
subjects
Are any attendance records
available?NO
Request the Head Teacher to identify all teachers (including
volunteers) teaching grades P1-P3
Are records complete?
YES
Enter the names of all the teachers in the lists or named
by the head teacher into a sampling Form (CAPI)
NO
Identify the missing groups of teachers or missing
names of individual teachers (include any volunteer teachers)
Is the school public or IQS?
IQSAre the
classes taught in grades P1-P6?
YES
Ask for teacher attendance registers for the day of the
interview for all teachers teaching P2 or equivalent pupils
NO
Are any attendance records
available?
YES
Request the Head Teacher to identify all teachers (including
volunteers) teaching P2 or equivalent pupils
NO
For each teacher specify whether teacher teaches religious or non-
religious subjects
CAPI selects teachers randomly:• 3 teachers in public schools• 2 teachers in IQS
Invite selected teacher for the interview
Is the teacher eligible and has given
consent?
Administer the interview, classroom observation and test to
the teacher
Enter the names of all selected teachers on School Completion
Form
YESNO
Sample the replacement teachers
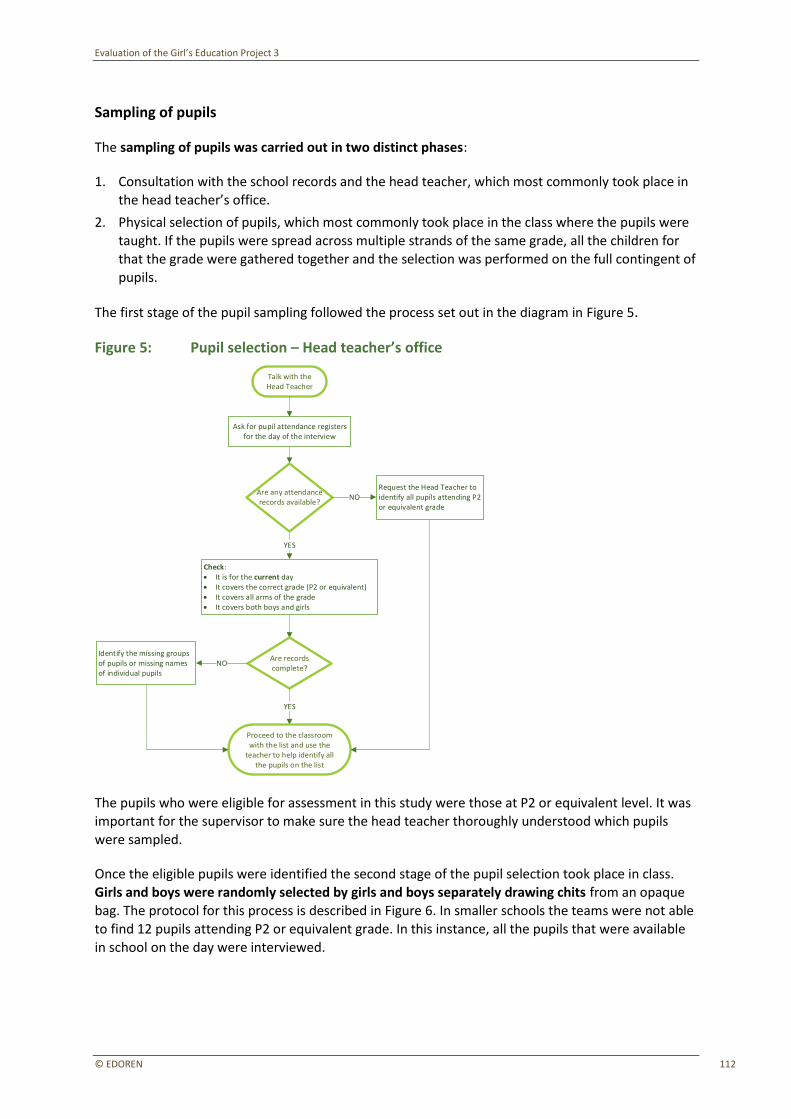
Evaluation of the Girl’s Education Project 3
© EDOREN 112
Sampling of pupils
The sampling of pupils was carried out in two distinct phases:
1. Consultation with the school records and the head teacher, which most commonly took place in the head teacher’s office.
2. Physical selection of pupils, which most commonly took place in the class where the pupils were taught. If the pupils were spread across multiple strands of the same grade, all the children for that the grade were gathered together and the selection was performed on the full contingent of
pupils.
The first stage of the pupil sampling followed the process set out in the diagram in Figure 5.
Figure 5: Pupil selection – Head teacher’s office
Talk with theHead Teacher
Ask for pupil attendance registers for the day of the interview
YES
Check:• It is for the current day• It covers the correct grade (P2 or equivalent)• It covers all arms of the grade• It covers both boys and girls
Are any attendance records available?
NORequest the Head Teacher to identify all pupils attending P2 or equivalent grade
Are records complete?
YES
Proceed to the classroom with the list and use the
teacher to help identify all the pupils on the list
NOIdentify the missing groups of pupils or missing names of individual pupils
The pupils who were eligible for assessment in this study were those at P2 or equivalent level. It was important for the supervisor to make sure the head teacher thoroughly understood which pupils were sampled.
Once the eligible pupils were identified the second stage of the pupil selection took place in class. Girls and boys were randomly selected by girls and boys separately drawing chits from an opaque
bag. The protocol for this process is described in Figure 6. In smaller schools the teams were not able to find 12 pupils attending P2 or equivalent grade. In this instance, all the pupils that were available in school on the day were interviewed.

Evaluation of the Girl’s Education Project 3
© EDOREN 113
Figure 6: Pupil selection – classroom
Line-up all eligible pupils – make sure you have all children lined-up
if more than one strand of the grade is taught.
Split them according to gender
Organize 2 opaque bags of chits, 1 for girls and 1 for boys
Each bag should contain:• 6 marked chits• (Number of boys/girls – 6) un-
marked chits
Each pupil picks up a chit from the bag
Separate selected children in one part of the classroom and alert the teacher that the pupils have been
selected
Invite selected child for the test
Is the child eligible and has
given consent?
Arrive to the classroom and explain selection process to the
teacher
YES
Administer the test to the pupil
YES
Prepare for sampling of replacement pupils.
Each bag should contain:• (Number of replaced boys/
girls) of marked chits• (Number of boys/girls not
selected – number of replacements needed) un-marked chits
Enter the names of all selected children on School Completion
Form
NO
Have you exhausted all initially
selected pupils(12)?
NO
3.2.3.5 Weighting
Sampling weights were constructed to reflect the complex sampling design. The weights were estimated for all levels of analysis and reflect the multi-level nature of the school data, with pupils and teachers nested within schools. The estimated weights are population weights, which sum up to the total population size as defined by the universe and the sampling frame. The weights of treatment and control groups were estimated separately and each sum up to the total population level. Due to the very high sampling fraction rate (i.e. the large proportion of the eligible schools sampled), finite population correction factors were also estimated to adjust the variance estimates. A detailed note on weighting can be found in Annex C.
3.2.4 Randomisation process
Randomisation was performed on the sampled schools in a double blinded fashion: neither the school nor the survey organisation were aware of the random assignment.
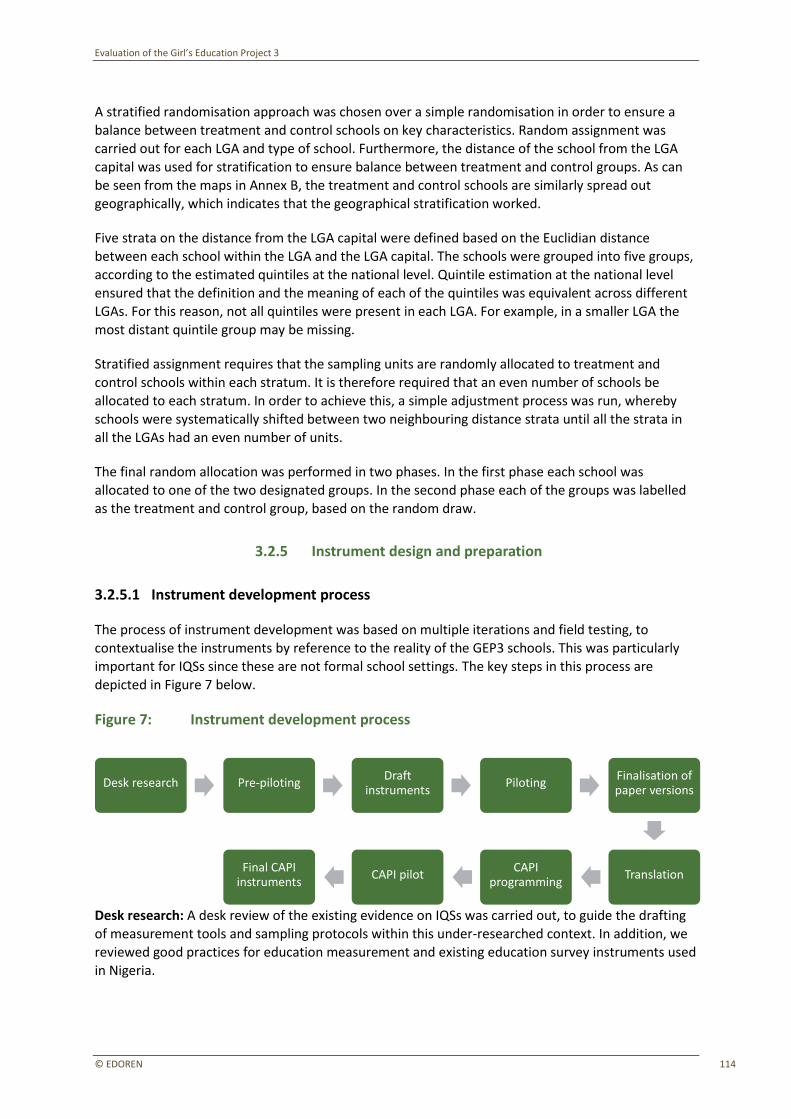
Evaluation of the Girl’s Education Project 3
© EDOREN 114
A stratified randomisation approach was chosen over a simple randomisation in order to ensure a
balance between treatment and control schools on key characteristics. Random assignment was carried out for each LGA and type of school. Furthermore, the distance of the school from the LGA capital was used for stratification to ensure balance between treatment and control groups. As can be seen from the maps in Annex B, the treatment and control schools are similarly spread out
geographically, which indicates that the geographical stratification worked.
Five strata on the distance from the LGA capital were defined based on the Euclidian distance between each school within the LGA and the LGA capital. The schools were grouped into five groups, according to the estimated quintiles at the national level. Quintile estimation at the national level ensured that the definition and the meaning of each of the quintiles was equivalent across different
LGAs. For this reason, not all quintiles were present in each LGA. For example, in a smaller LGA the most distant quintile group may be missing.
Stratified assignment requires that the sampling units are randomly allocated to treatment and
control schools within each stratum. It is therefore required that an even number of schools be allocated to each stratum. In order to achieve this, a simple adjustment process was run, whereby schools were systematically shifted between two neighbouring distance strata until all the strata in
all the LGAs had an even number of units.
The final random allocation was performed in two phases. In the first phase each school was allocated to one of the two designated groups. In the second phase each of the groups was labelled
as the treatment and control group, based on the random draw.
3.2.5 Instrument design and preparation
3.2.5.1 Instrument development process
The process of instrument development was based on multiple iterations and field testing, to contextualise the instruments by reference to the reality of the GEP3 schools. This was particularly important for IQSs since these are not formal school settings. The key steps in this process are
depicted in Figure 7 below.
Figure 7: Instrument development process
Desk research: A desk review of the existing evidence on IQSs was carried out, to guide the drafting of measurement tools and sampling protocols within this under-researched context. In addition, we reviewed good practices for education measurement and existing education survey instruments used
in Nigeria.
Desk research
Pre-piloting
Draft instruments
Piloting
Finalisation of paper versions
Translation
CAPI programming
CAPI pilot
Final CAPI instruments
Evaluation of the Girl’s Education Project 3
© EDOREN 115
Pre-piloting and field research: Based on the GEP3 Evaluation Framework, and informed by the desk
research, a set of exploratory tools was developed and trialled in the field. In December 2014 preliminary instruments for interviews with head teachers, CBMCs, pupils, and teachers were tested in six schools (IQSs and primary schools) in Niger State. Furthermore, the field visits provided a better understanding of the IQS system, the division of roles and responsibilities between multiple actors,
and the approach to be used for sensitive questions, such as those relating to school expenditure and financing. Group dynamics in SBMC/CBMC focus groups were also explored and documented.
Draft instruments: The information gathered during the pre-piloting and field research was used to develop draft instruments appropriate for the GEP3 baseline and applicable to the particular context of IQSs. The instruments developed were: (i) in line with the key indicators identified in the GEP3 ToC
and Evaluation Framework; (ii) sensitive towards the context of IQSs, including the school structure, term dates, and terminology; and (iii) sensitive towards the cultural context of Nigeria, and northern Nigeria in particular. A total of seven quantitative instruments were developed for the baseline of the early learning intervention evaluation (see Section 3.2.5.2 below).
Piloting exercise: The draft instruments were then piloted in one public primary school and three IQSs in June 2015. The piloting exercise helped highlight additional changes to improve the
instruments, such as the finalisation of response categories for closed response questions, and the language to be used to communicate with the IQS head teachers. In addition, special attention was paid to the interaction with children, to develop modules that are most likely to produce reliable
results. The feedback from the local researchers was invaluable in this phase because they had additional insights into the IQS system and the context of northern Nigeria.
The piloting exercise was also used to test sampling protocols for children and teachers. The research team trialled several sampling methods, noting the strengths and weaknesses of each method. This exercise helped develop final sampling protocols which minimised the risk of sample contamination
and respondent anxiety. The latter was especially important given the nature of the interaction with the children.
Finalisation of instruments: The instruments were finalised based on the piloting exercise and additional feedback from the local researchers.
Translation: After finalisation the instruments were translated into Hausa, the language spoken by the majority of the population in the five GEP3 states. The translation was quality checked by the
EDOREN Nigeria office to ensure its appropriateness.
CAPI programming: The translated and finalised instruments were programmed for use in CAPI on tablets in two languages, English and Hausa. The programmed questionnaires were extensively
checked for coherence with the paper versions before being taken to the field.
CAPI pilot: The final CAPI questionnaires were piloted in six schools in August 2015 in Niger state in
order to optimise the structure of the CAPI questionnaire and the interview flow. The pilot also made
it possible to further test proper school entry and field time management.
3.2.5.2 Overview of the instruments
Seven instruments were developed to collect quantitative data at each early learning intervention
school and each control school/IQS (see Table 4).
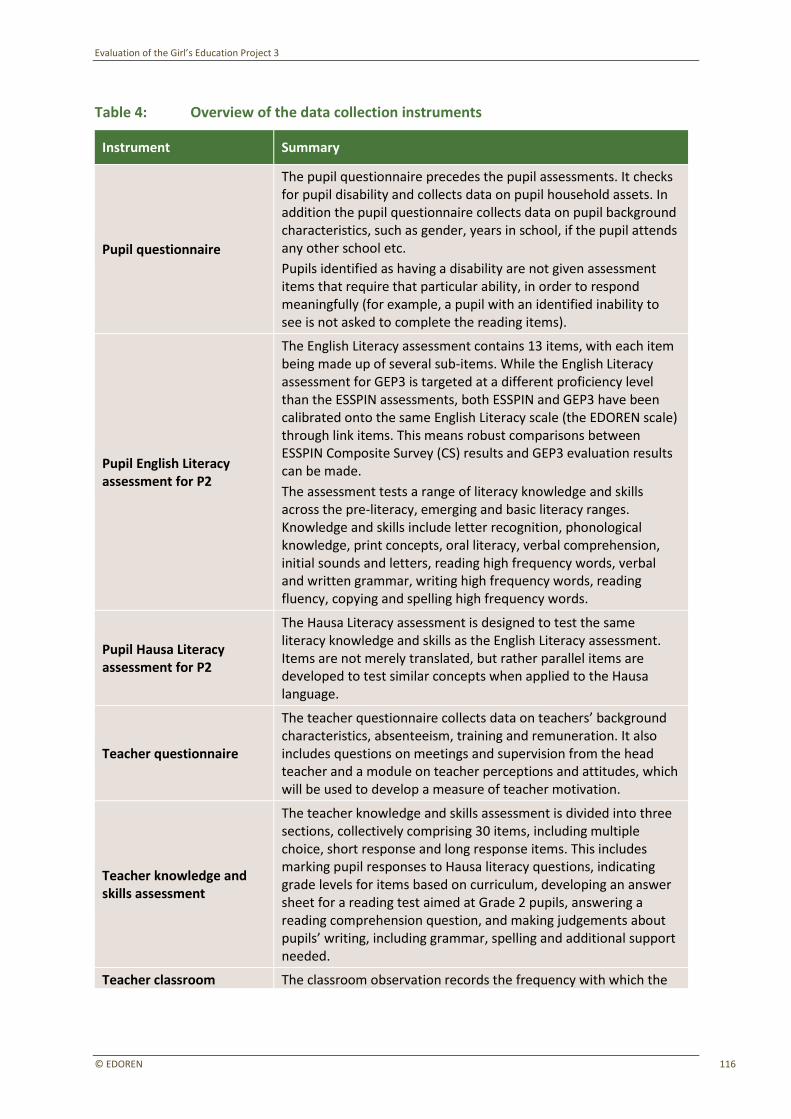
Evaluation of the Girl’s Education Project 3
© EDOREN 116
Table 4: Overview of the data collection instruments
Instrument Summary
Pupil questionnaire
The pupil questionnaire precedes the pupil assessments. It checks for pupil disability and collects data on pupil household assets. In addition the pupil questionnaire collects data on pupil background characteristics, such as gender, years in school, if the pupil attends any other school etc.
Pupils identified as having a disability are not given assessment items that require that particular ability, in order to respond meaningfully (for example, a pupil with an identified inability to see is not asked to complete the reading items).
Pupil English Literacy assessment for P2
The English Literacy assessment contains 13 items, with each item being made up of several sub-items. While the English Literacy assessment for GEP3 is targeted at a different proficiency level than the ESSPIN assessments, both ESSPIN and GEP3 have been calibrated onto the same English Literacy scale (the EDOREN scale) through link items. This means robust comparisons between ESSPIN Composite Survey (CS) results and GEP3 evaluation results can be made.
The assessment tests a range of literacy knowledge and skills across the pre-literacy, emerging and basic literacy ranges. Knowledge and skills include letter recognition, phonological knowledge, print concepts, oral literacy, verbal comprehension, initial sounds and letters, reading high frequency words, verbal and written grammar, writing high frequency words, reading fluency, copying and spelling high frequency words.
Pupil Hausa Literacy assessment for P2
The Hausa Literacy assessment is designed to test the same literacy knowledge and skills as the English Literacy assessment. Items are not merely translated, but rather parallel items are developed to test similar concepts when applied to the Hausa language.
Teacher questionnaire
The teacher questionnaire collects data on teachers’ background characteristics, absenteeism, training and remuneration. It also includes questions on meetings and supervision from the head teacher and a module on teacher perceptions and attitudes, which will be used to develop a measure of teacher motivation.
Teacher knowledge and skills assessment
The teacher knowledge and skills assessment is divided into three sections, collectively comprising 30 items, including multiple choice, short response and long response items. This includes marking pupil responses to Hausa literacy questions, indicating grade levels for items based on curriculum, developing an answer sheet for a reading test aimed at Grade 2 pupils, answering a reading comprehension question, and making judgements about pupils’ writing, including grammar, spelling and additional support needed.
Teacher classroom The classroom observation records the frequency with which the

Evaluation of the Girl’s Education Project 3
© EDOREN 117
observation enumerator observes specific teacher talk, teacher language use, teacher action and pupil action. The enumerator also records teacher action at the start of the lesson, action at the end of the lesson, the resources used and subject observed.
Head teacher questionnaire
The head teacher questionnaire includes several sections relating to background information on the school, basic information about the school, school management and monitoring, attendance and enrolment, attitudes towards integration for IQSs and school infrastructure.
3.2.6 Survey fieldwork
3.2.6.1 Survey implementation and management
The survey field work was implemented by OPM Nigeria between 19 October 2015 and 20 November 2015. It was preceded by a three-week training period for survey staff (see below).
The survey staff were recruited by OPM Nigeria. State survey coordinators and quality assurance
monitors were selected from a pool of highly experienced candidates. The selection was mainly based on their experience with other education surveys in northern Nigeria.82 Other staff were selected through competitive recruitment, which included canvassing the potential candidates’ CVs
and face-to-face interviews. Special attention was given to experience in conducting surveys in Nigeria, with additional emphasis given to any education research experience. The selection process
also took into consideration the gender balance of the teams, and especially their local language proficiency. All recruited interviewers were proficient in both spoken and read Hausa, which was the main language used for survey administration. Other local language requirements were also taken
into consideration when selecting team members as in some areas Hausa is not the main language
that is spoken. In selecting interviewers, special attention was given to the knowledge of Arabic, Fulfulde, Nupe and Gbagyi language proficiency as these languages are used in the surveyed areas.
The survey was administered using CAPI. Data were collected using ultra-portable computer tablets
and the CSPro software platform.
The survey was supervised by the EDOREN Survey Technical Lead throughout the survey
implementation and data cleaning process. The EDOREN Senior Education Specialist and Questionnaire Development Expert attended the training. The Evaluation Team Leader was involved
in any decision that affected the survey design: for example, the replacement of sampled IQSs due to challenges with the IQS sample frame.
3.2.6.2 Survey training
To ensure that all survey teams could do their work effectively whilst maintaining high quality standards all survey field staff were intensely trained between 28 September and 17 October 2015
in Abuja, including practice field visits. The survey training was divided into two parts: the first was
82 State survey coordinators and quality assurance officers were involved, among others, in data collection as part of the TDP evaluation, ESSPIN CS 2 and Child Development Grant Programme evaluation. Several of them had participated in the GEP3 instrument pre-testing.
Evaluation of the Girl’s Education Project 3
© EDOREN 118
for the state survey coordinators and quality assurance officers, which lasted from 28 to 30
September 2015, while the second was for the enumerators, from 02 to 17 October 2015. The latter was further split into two batches so as to enable the enumerators to have a deep understanding of the survey instruments and protocols. At the onset of the training there was no distinction between the role of the supervisor or that of the enumerators. All training participants were trained as equals.
Upon completion of the training, the most experienced and best performing enumerators were designated as team supervisors. Special supervisor briefing sessions were held with them in order to strengthen their understanding of their roles and responsibilities.
A detailed training manual was prepared for the training. During the training the manual was updated based on the feedback received and clarifications made during the training.
In summary, the main subjects covered by the training syllabus were the following:
• Overview of GEP3: GEP3’s objectives, implementation states, its duration, and its relationship
with EDOREN and UNICEF was presented to the participants, for them to reinforce their understanding of the programme.
• Survey protocol overview: the survey and school selection protocols were explained in detail
and included in-depth explanations of the different intervention types and school types under GEP3, in order for the field teams to thoroughly understand the context of their data collection
environment.
• Communication (reporting line and feedback): the flow of communication between state
coordinators, quality assurance officers, team supervisors, and enumerators was discussed in terms of reporting and routine feedback.
• Familiarisation with survey instruments: participants were exposed to each of the survey instruments, including the main questionnaire and CAPI.
• Mentoring and ongoing training: this was facilitated for state coordinators and quality assurance officers, for them to gain an understanding of how to provide mentoring and support to
interviewers during fieldwork, except in the case of major issues that would exceed their knowledge and authority.
• Fieldwork monitoring forms: In order to manage fieldwork effectively, as well as to monitor activities conducted, monitoring forms were shared with the field team. These included the
school completion forms, monitoring activity forms and daily report templates.
• Quality assurance principles: Information about field ethics and protocols that guarantee data quality were shared with the field team.
The training used several different training approaches to achieve the maximum training effect, such as detailed instrument review, small group work and mock interviews. Enumerators were also
exposed to real-life field experience early on in the training. The first visit was organised within the first five days of training, and was followed up by two more field visits during the training. Early exposure to real-life field situations contextualises the topics and approaches discussed in class and
helps enumerators to better grasp concepts. The training was conducted exclusively using CAPI versions of the questionnaires. Enumerators were also taught about other functionalities related to computer-assisted data collection, such as how to synchronise files containing filled questionnaires to the cloud and other IT and data management-related issues.
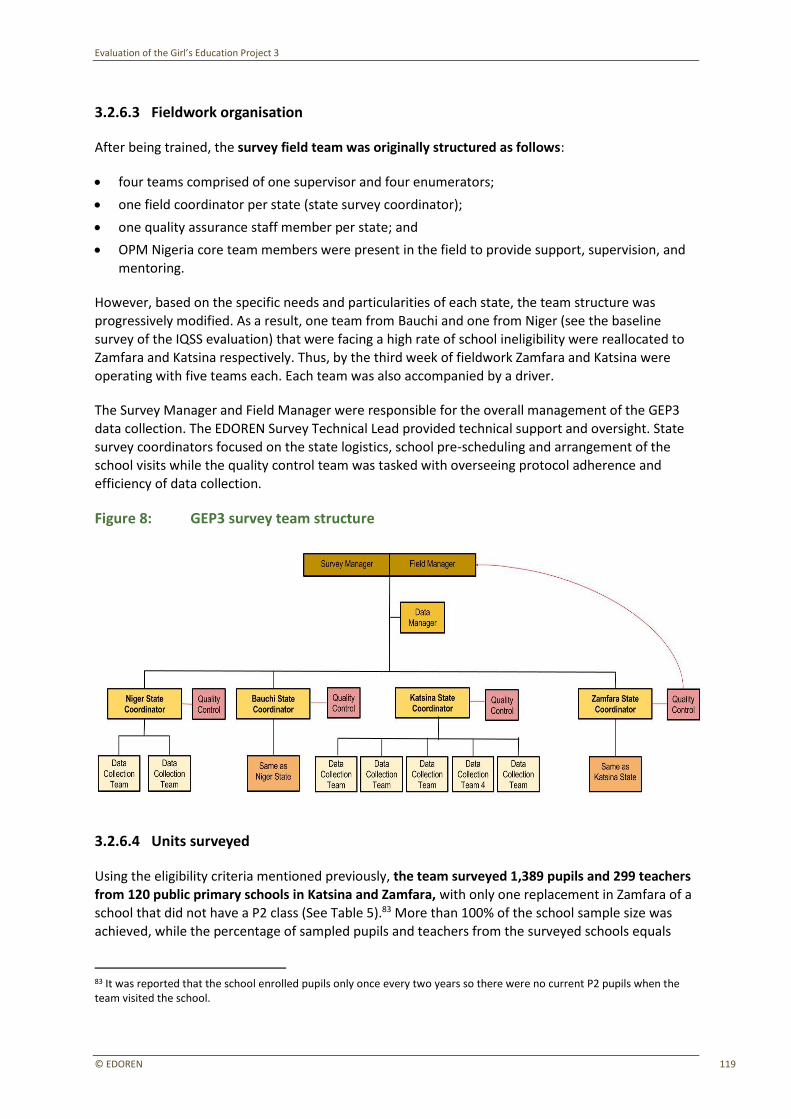
Evaluation of the Girl’s Education Project 3
© EDOREN 119
3.2.6.3 Fieldwork organisation
After being trained, the survey field team was originally structured as follows:
• four teams comprised of one supervisor and four enumerators;
• one field coordinator per state (state survey coordinator);
• one quality assurance staff member per state; and
• OPM Nigeria core team members were present in the field to provide support, supervision, and mentoring.
However, based on the specific needs and particularities of each state, the team structure was progressively modified. As a result, one team from Bauchi and one from Niger (see the baseline
survey of the IQSS evaluation) that were facing a high rate of school ineligibility were reallocated to Zamfara and Katsina respectively. Thus, by the third week of fieldwork Zamfara and Katsina were
operating with five teams each. Each team was also accompanied by a driver.
The Survey Manager and Field Manager were responsible for the overall management of the GEP3 data collection. The EDOREN Survey Technical Lead provided technical support and oversight. State survey coordinators focused on the state logistics, school pre-scheduling and arrangement of the school visits while the quality control team was tasked with overseeing protocol adherence and
efficiency of data collection.
Figure 8: GEP3 survey team structure
3.2.6.4 Units surveyed
Using the eligibility criteria mentioned previously, the team surveyed 1,389 pupils and 299 teachers
from 120 public primary schools in Katsina and Zamfara, with only one replacement in Zamfara of a school that did not have a P2 class (See Table 5).83 More than 100% of the school sample size was achieved, while the percentage of sampled pupils and teachers from the surveyed schools equals
83 It was reported that the school enrolled pupils only once every two years so there were no current P2 pupils when the team visited the school.
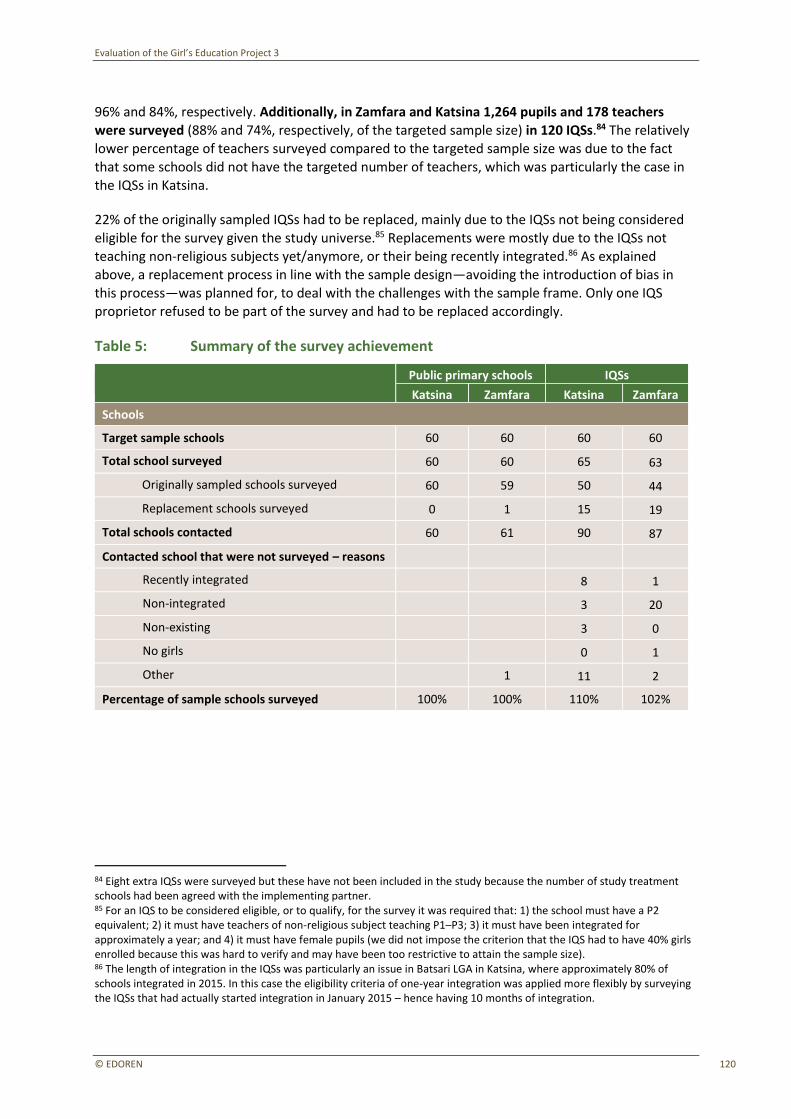
Evaluation of the Girl’s Education Project 3
© EDOREN 120
96% and 84%, respectively. Additionally, in Zamfara and Katsina 1,264 pupils and 178 teachers
were surveyed (88% and 74%, respectively, of the targeted sample size) in 120 IQSs.84 The relatively lower percentage of teachers surveyed compared to the targeted sample size was due to the fact that some schools did not have the targeted number of teachers, which was particularly the case in the IQSs in Katsina.
22% of the originally sampled IQSs had to be replaced, mainly due to the IQSs not being considered eligible for the survey given the study universe.85 Replacements were mostly due to the IQSs not teaching non-religious subjects yet/anymore, or their being recently integrated.86 As explained above, a replacement process in line with the sample design—avoiding the introduction of bias in this process—was planned for, to deal with the challenges with the sample frame. Only one IQS
proprietor refused to be part of the survey and had to be replaced accordingly.
Table 5: Summary of the survey achievement
Public primary schools IQSs
Katsina Zamfara Katsina Zamfara
Schools
Target sample schools 60 60 60 60
Total school surveyed 60 60 65 63
Originally sampled schools surveyed 60 59 50 44
Replacement schools surveyed 0 1 15 19
Total schools contacted 60 61 90 87
Contacted school that were not surveyed – reasons
Recently integrated 8 1
Non-integrated 3 20
Non-existing 3 0
No girls 0 1
Other 1 11 2
Percentage of sample schools surveyed 100% 100% 110% 102%
84 Eight extra IQSs were surveyed but these have not been included in the study because the number of study treatment schools had been agreed with the implementing partner. 85 For an IQS to be considered eligible, or to qualify, for the survey it was required that: 1) the school must have a P2 equivalent; 2) it must have teachers of non-religious subject teaching P1–P3; 3) it must have been integrated for approximately a year; and 4) it must have female pupils (we did not impose the criterion that the IQS had to have 40% girls enrolled because this was hard to verify and may have been too restrictive to attain the sample size). 86 The length of integration in the IQSs was particularly an issue in Batsari LGA in Katsina, where approximately 80% of schools integrated in 2015. In this case the eligibility criteria of one-year integration was applied more flexibly by surveying the IQSs that had actually started integration in January 2015 – hence having 10 months of integration.
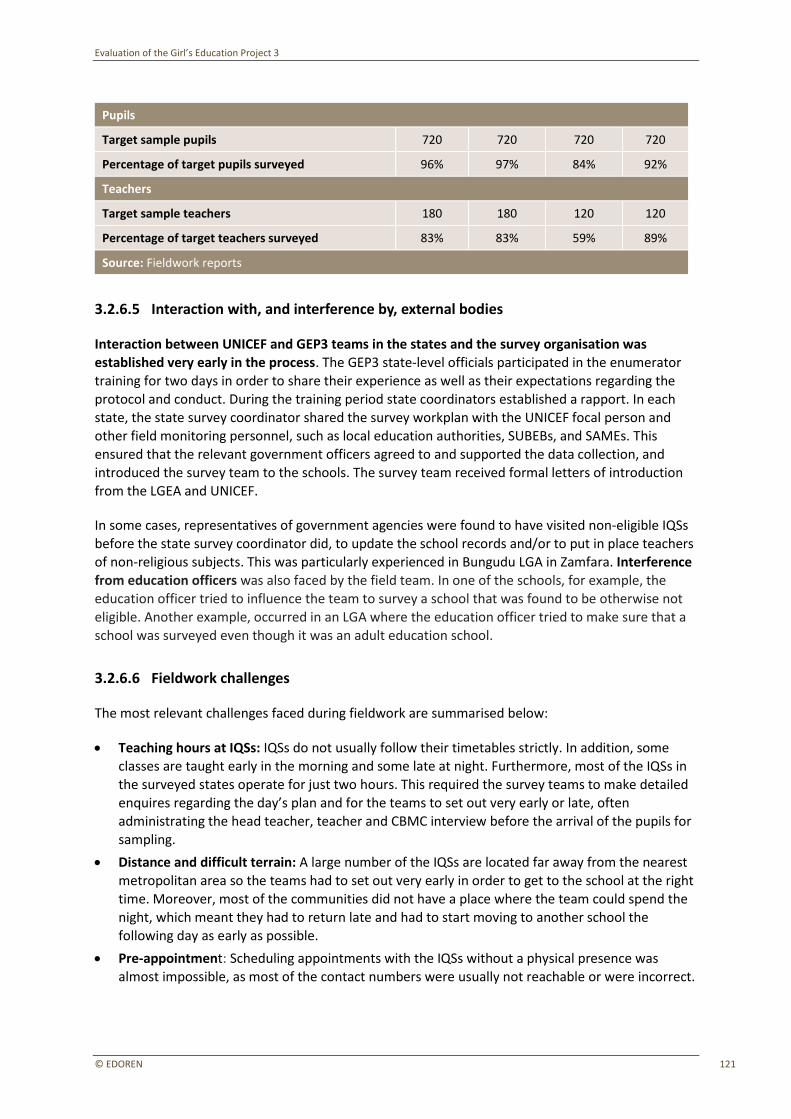
Evaluation of the Girl’s Education Project 3
© EDOREN 121
Pupils
Target sample pupils 720 720 720 720
Percentage of target pupils surveyed 96% 97% 84% 92%
Teachers
Target sample teachers 180 180 120 120
Percentage of target teachers surveyed 83% 83% 59% 89%
Source: Fieldwork reports
3.2.6.5 Interaction with, and interference by, external bodies
Interaction between UNICEF and GEP3 teams in the states and the survey organisation was established very early in the process. The GEP3 state-level officials participated in the enumerator
training for two days in order to share their experience as well as their expectations regarding the protocol and conduct. During the training period state coordinators established a rapport. In each state, the state survey coordinator shared the survey workplan with the UNICEF focal person and
other field monitoring personnel, such as local education authorities, SUBEBs, and SAMEs. This ensured that the relevant government officers agreed to and supported the data collection, and
introduced the survey team to the schools. The survey team received formal letters of introduction from the LGEA and UNICEF.
In some cases, representatives of government agencies were found to have visited non-eligible IQSs before the state survey coordinator did, to update the school records and/or to put in place teachers of non-religious subjects. This was particularly experienced in Bungudu LGA in Zamfara. Interference
from education officers was also faced by the field team. In one of the schools, for example, the education officer tried to influence the team to survey a school that was found to be otherwise not
eligible. Another example, occurred in an LGA where the education officer tried to make sure that a
school was surveyed even though it was an adult education school.
3.2.6.6 Fieldwork challenges
The most relevant challenges faced during fieldwork are summarised below:
• Teaching hours at IQSs: IQSs do not usually follow their timetables strictly. In addition, some
classes are taught early in the morning and some late at night. Furthermore, most of the IQSs in the surveyed states operate for just two hours. This required the survey teams to make detailed enquires regarding the day’s plan and for the teams to set out very early or late, often administrating the head teacher, teacher and CBMC interview before the arrival of the pupils for sampling.
• Distance and difficult terrain: A large number of the IQSs are located far away from the nearest
metropolitan area so the teams had to set out very early in order to get to the school at the right
time. Moreover, most of the communities did not have a place where the team could spend the night, which meant they had to return late and had to start moving to another school the following day as early as possible.
• Pre-appointment: Scheduling appointments with the IQSs without a physical presence was almost impossible, as most of the contact numbers were usually not reachable or were incorrect.
Evaluation of the Girl’s Education Project 3
© EDOREN 122
• Harvest season: In some communities, pupils do not attend school during harvest season
because they are engaged at their parents’ farms.
• Ineligible IQSs: As discussed, a number of IQSs were considered ineligible for the survey. The
survey team identified some cases in which proprietors were altering documents to pretend that their schools were eligible, when they were not. Sometimes, an entire community was involved in this manipulation.
• Pupil sampling: In IQSs there were instances where teachers tried to add pupils to the survey who were in other grades or who attended public primary schools for their non-religious
curriculum and were only taking religious classes at the IQS.
• Change in school name: During school visits it was observed that some schools had a name that differed from what was captured in the sample frame, either due to a change in the school name or wrongly spelt names.
3.2.7 Data quality assurance
3.2.7.1 Quality assurance within a CAPI questionnaire
Computer-assisted data collection generally improves the quality of data collected in a survey by
providing consistent data linkage, automated routing/skips, and consistency checks which can provide instant feedback to the field workers. CAPI furthermore reduces entry errors and field workers’ potential to cheat. Decreased interview time also increases the efficiency of fieldwork.
Immediate availability of data allows better organisation and closer monitoring of fieldwork, and enables data managers to provide timely feedback to the field teams, which helps to prevent future
errors.
Consistent data linkage was maintained throughout the data collection by encoding the data structure into the instruments and hardcoded lists of identifiers. This is particularly important in
complex surveys with multiple instruments, such as this one. This allows for sound mapping and
linking of different levels of observations or cases, as well as early identification of missing cases.
Automated skips and routing behaviour, as part of the CAPI questionnaire, ensured that only correct questions were administered and that no answers were missing. Interviewers were able to fully focus
on the interaction aspects of the interview and thus were able to establish a closer bond with the respondent. Automated skipping patterns increase interviewing speed and allow more complex skipping patterns that can source information from all parts of the questionnaire in order to
administer very specific sets of questions tailored to very specific cases.
Data consistency checks were built directly into the survey instruments to provide in-interview feedback to the field workers, allowing them to address inconsistencies as they arose during interviews. Consistency checks ranged from simple question specific checks, like range checks, to complex checks comparing information across different sections.
CAPI reduces survey errors and eliminates errors due to data entry. The use of an electronic version of the questionnaire in the GEP3 baseline survey means that data were entered during the interview
itself, thus making separate data entry obsolete. The CAPI questionnaire strictly enforced the prescribed questionnaire routing and data validation for all responses to survey questions. The interviewers thus only posed the questions which were meant to be asked and coded the response
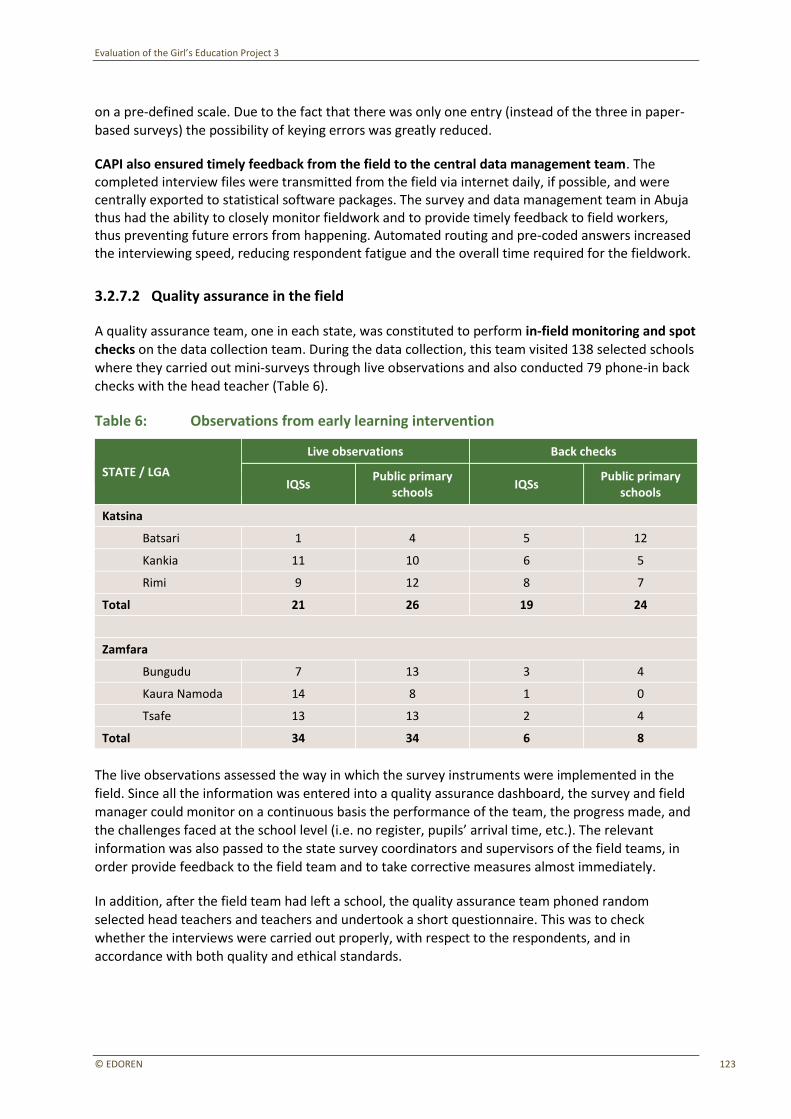
Evaluation of the Girl’s Education Project 3
© EDOREN 123
on a pre-defined scale. Due to the fact that there was only one entry (instead of the three in paper-
based surveys) the possibility of keying errors was greatly reduced.
CAPI also ensured timely feedback from the field to the central data management team. The completed interview files were transmitted from the field via internet daily, if possible, and were centrally exported to statistical software packages. The survey and data management team in Abuja thus had the ability to closely monitor fieldwork and to provide timely feedback to field workers, thus preventing future errors from happening. Automated routing and pre-coded answers increased the interviewing speed, reducing respondent fatigue and the overall time required for the fieldwork.
3.2.7.2 Quality assurance in the field
A quality assurance team, one in each state, was constituted to perform in-field monitoring and spot
checks on the data collection team. During the data collection, this team visited 138 selected schools where they carried out mini-surveys through live observations and also conducted 79 phone-in back
checks with the head teacher (Table 6).
Table 6: Observations from early learning intervention
STATE / LGA
Live observations Back checks
IQSs Public primary
schools IQSs
Public primary schools
Katsina
Batsari 1 4 5 12
Kankia 11 10 6 5
Rimi 9 12 8 7
Total 21 26 19 24
Zamfara
Bungudu 7 13 3 4
Kaura Namoda 14 8 1 0
Tsafe 13 13 2 4
Total 34 34 6 8
The live observations assessed the way in which the survey instruments were implemented in the
field. Since all the information was entered into a quality assurance dashboard, the survey and field manager could monitor on a continuous basis the performance of the team, the progress made, and
the challenges faced at the school level (i.e. no register, pupils’ arrival time, etc.). The relevant information was also passed to the state survey coordinators and supervisors of the field teams, in order provide feedback to the field team and to take corrective measures almost immediately.
In addition, after the field team had left a school, the quality assurance team phoned random selected head teachers and teachers and undertook a short questionnaire. This was to check whether the interviews were carried out properly, with respect to the respondents, and in accordance with both quality and ethical standards.
Evaluation of the Girl’s Education Project 3
© EDOREN 124
Detailed below is a summary of the oversight functions that the quality assurance officers carried
out during the field exercise:
• ensured sampling and all procedures were strictly followed;
• conducted spot checks for teams and ensured they were where they planned to be;
• observed ongoing interviews and addressed issues that required attention;
• ensured that there was a clear distinction, among the team, between the period in which the programme was introduced to the school authority and the actual time the school began to
teach non-religious subjects alongside religious subjects;
• performed random back checks visits to schools where the survey had already been completed; and
• gave continuous feedback/refresher training with state teams where challenges were
encountered.
The quality assurance team reported their findings to the state survey coordinators, as well as to the
survey and data management team in Abuja. Together with the state survey coordinators they debriefed the field teams on their findings and brought attention to their findings in order to improve the quality of the data collection.
It also needs to be stressed that some of the quality assurance functions of both the state survey
coordinators and independent monitors was hampered by the unanticipated necessity of actively and diligently screening the schools, especially IQSs, for eligibility. The screening process most often
had to be done in person and on the ground, as the poor telephone connections in the more remote areas often prevented contact.
3.2.7.3 Quality assurance post-data collection
The CAPI data collection approach requires only very minor post-data collection processing and
editing. CAPI enforced very strict validation rules at interview time, which were embedded in the electronic survey questionnaires themselves. The routing of the questionnaires was also strictly enforced, i.e. it was mandatory for all questions to be filled and the interviewer could not proceed with the interview unless the information provided corresponded to all validation rules imposed on
it.
The post-data collection processing did, however, ensure the consistency of all the identifying information for each instrument. As multiple instances of the same instrument were fielded at each school and their within-school identification was assigned manually by the interviewers, the consistency of these identification elements had to be consolidated. Fieldwork monitoring forms and
daily field reports, as well interview time data, were used to reconcile any inconsistencies. The school-level identifiers were pre-loaded and hardcoded into the questionnaires themselves in order to avoid duplication or mis-assigned IDs.
All the data were also checked for completion against secondary sources, such as survey management and sample completion forms. This process ensured that all of the collected information was contained in the finalised data compilation.
The actual compilation of separate data records was achieved during the actual data collection process. The data were transmitted from the field daily and the data managers at the OPM Nigeria
Evaluation of the Girl’s Education Project 3
© EDOREN 125
central office in Abuja compiled the records into working databases. After the completion of the data
collection, all of the collected data were collated in analysis-level data files. The database was formatted and reshaped according to the specifications for analysis.
3.2.8 Ethics and inclusion
Any evaluation must abide by relevant professional and ethical guidelines and codes of conduct for individual evaluators. Evaluators must be mindful of gender roles, ethnicity, ability, age, sexual orientation, language and other differences when designing and carrying out the evaluation
(Organisation for Economic Co-operation and Development) (OECD) Development Assistance Committee (DAC) Standards, 2010). DFID has drawn up its own principles for ensuring high standards of ethics in research and evaluations, and these were adhered to as part of the GEP3 evaluation (DFID, 2011). These include:
i. researchers and evaluators are responsible for identifying the need for and securing necessary ethical approval for the study they are undertaking;
ii. research and evaluation must be relevant and of high quality, with a clear value;
iii. researchers and evaluators should avoid harm to participants in studies;
iv. participation in research and evaluation must be voluntary and free from any external pressure;
v. the confidentiality of information, privacy and anonymity of participants must be ensured;
vi. cultural sensitivities must be respected;
vii. UK human rights law must be adhered to;
viii. all research and evaluation results must be published and communicated;
ix. research and evaluation must be independent of those implementing the programme; and
x. there should be a particular emphasis on participation by women and other socially excluded groups.
These ethical principles are important, and run through the evaluation design. One area of particular importance for this evaluation was ensuring that children were asked age-appropriate questions and that appropriate consent was sought. UNICEF guidelines on conducting research with children were followed.87 The evaluation paid particular attention to the mother-tongue language when interviewing children of a young age in order to guarantee children’s understanding of the data collection process. Furthermore, data collection was sensitive to children’s disabilities, imposing specific processes for the inclusion of disabled children while being sensitive to their disability. Survey protocols were approved by OPM’s Ethical Review Committee (ERC) (see Annex D) and a research ethics request was submitted to the National Research Ethics Committee in Nigeria (NHREC).
3.2.8.1 Permits, consent, confidentiality and datasets
No incentives were given to respondents for participation in the study. Each school that was part of the quantitative baseline survey received a small educational gift (e.g. an inflatable globe) and participants in the learning assessments received refreshments.
87 Graham et al. (2013) Ethical Research Involving Children. Florence: UNICEF Office of Research – Innocenti.
Evaluation of the Girl’s Education Project 3
© EDOREN 126
Consent was sought from both the head teacher and individuals participating in the study.
Descriptions of the study purpose, the requested involvement of the participant and the expected time for the administration of each instrument was provided to each participant prior to seeking consent.
All personal data collected as part of this survey are only available to authorised individuals for
analytical purposes and are handled using data protection best practices. Each respondent has been assigned a unique identifier, which was used in the analysis of the data. All cleaned, anonymised and documented baseline datasets will be made public (subject to DFID approval) to enable national researchers, research students and other education stakeholders to access and use the evaluation data to conduct additional analysis and research.
NHREC exemption
An application outlining the GEP3 Evaluation Ethical Standards, information on permits, consent,
confidentiality and datasets, the provision of all participant information forms, consent forms and instrument introductions, protocols for working with children and specific protocols for the
participation of children with disabilities in the survey was submitted to the NHREC on 29 September 2015. On 07 October 2015 a notice of research exemption was provided to EDOREN. The exemption letter is provided in Annex D.
OPM ethics committee approval
A partial application was submitted to the OPM ERC in May 2015 for the quantitative research
component of the evaluation. This submission was considered by the ERC on 15 May 2015. A request to re-submit with additional documentation was made to the evaluation team. After the finalised
tools were provided to the ERC, ethical approval was given on 28 September 2015. Please see Annex D for the approval letter.
3.2.8.2 Specific protocols for the participation of children with disabilities in the survey
Enumerators were instructed during the training and in the enumerator manual to make an effort to
make all the pupils feel at ease and to help them understand that this was not an exam. Enumerators were encouraged to ask questions about the pupils’ lives or day if they were very shy. Enumerators were to look for a quiet and somewhat isolated place to administer the tests, avoiding the head
teacher’s office because the pupil might be shy in such a location.
If the pupil was identified as having a disability that would not affect their ability to take the test enumerators were instructed to make sure they were able to get to the test location. For example, a pupil who cannot walk may still be perfectly able to take the test, but may have needed to be assisted – by using a wheelchair or lifting them – to reach the place where the test was administered.
Several questions were included in the pupil questionnaire to check if the child had any disabilities
that could impede their ability to undertake the assessment. These included asking if the child could
hear, speak, write and see. If a sampled child had any disability which would not affect their ability to take the test, they were not excluded. If the pupil could not hear enumerators were instructed to
end the interview. In all other cases, enumerators continued with the interview, and CAPI automatically skipped any questions that the child would have been physically unable to answer.
Evaluation of the Girl’s Education Project 3
© EDOREN 127
3.2.8.3 Sensitivity to gender and equity
Sensitivity to gender and equity within the evaluation design can be divided into five main
categories:
• evaluation focus;
• no bias in the measurement;
• detecting disaggregated outcomes by group;
• seeking explanations for observed differences in outcomes; and
• focusing on pupils at the low end of the learning distribution.
Evaluation focus: All aspects of the evaluation include a focus on gender and marginalisation. In
addition, the focus on IQSs is partly because IQSS is meant to be an inclusive strategy to reach out to marginalised children in rural locations. A large number of children in northern Nigeria, particularly
from rural areas, do not attend formal schools, but do attend a centre offering Qur’anic education. Therefore, comparisons of differences by school type are a primary focus in evaluating the extent to which GEP3 has contributed to improved teaching and learning in IQSs.
No bias in the measurement: Gender bias can affect learning assessments, and happens when an
item is interpreted differently by test-takers and, thus, ‘what we are testing’ is different for girls and
for boys. Through the use of psychometric analysis, this bias can be identified and items that are
biased in this way can be removed. It is essential for the GEP3 evaluations that a test of learning
outcomes does not discriminate between girls and boys – meaning that results between genders can
be reliably compared. In other words, through the use of psychometric techniques, we can ensure
that a boy or a girl with the same level of literacy (with all other things being equal) will receive the
same score on a scale of learning. A Rasch analysis of test items used in other EDOREN evaluations
was undertaken in 2014 (McGrane, 2014) and found that the items do not discriminate on the basis
of gender. New items underwent the same analysis.
Detecting disaggregated outcomes by group: In order to analyse outcomes by social group, data on pupil, school and community characteristics (such as gender, socioeconomic status, geographic
location, etc.) must be collected and linked to outcome data. There must then be sufficient statistical power to disaggregate outcomes by group. The GEP3 evaluation collected contextual data at the
pupil, school and district levels with sufficient statistical power to analyse learning outcomes by gender, which is of primary importance in evaluating the extent to which GEP3 has improved
learning outcomes, especially for girls.
Explaining observed differences in outcomes: Girls in northern Nigeria face a multitude of barriers to achieving literacy, language and numeracy skills. Any differences in learning outcomes were analysed using the approaches outlined above. However, the reasons for these differences cannot be observed purely based on outcome data. Some factors are easily observable, such as access to
specific resources. If identified in advance, differences in inputs to education based on gender can be
investigated through the quantitative survey and the impact on learning outcomes by group can be
analysed. However, other factors are latent or can only be observed by gaining a contextual understanding of communities and schools.
Focusing on pupils at the low end of the learning distribution: In order to ensure an equity focus is maintained the evaluation of changes in learning outcomes will be viewed through an equity lens. Purely comparing mean increases in scale scores at baseline and follow-up surveys can obscure from
Evaluation of the Girl’s Education Project 3
© EDOREN 128
view the learning of the most marginalised children. The analyses of increases in learning outcomes
will also include an analysis of the gap between the lowest performing pupils and the expectations of the curriculum. The analysis will include: (1) the percentage of pupils achieving below-curriculum expectations; and (2) the gap between the actual skills being achieved by pupils at the lower end of the distribution and the skills expected by the curriculum.
3.2.9 Outcome measurement and constructs
3.2.9.1 Pupil assessment instruments
English literacy and Hausa literacy assessments were constructed following the five steps set out below, including clarifying constructs, test targeting, administration, psychometric analysis, drawing
benchmarks and secondary data analysis.
Clarifying constructs
The first step in undertaking a learning measurement exercise is to define exactly what is to be measured. Defining exactly what it is that we expect children to know and be able to do is at the
heart of the measurement of learning. Literacy and reading are quite different constructs, as are
numeracy and mathematics. At its simplest, to be literate means to be able to observe symbols or signs from a page and to ascertain meanings that are standardised to some extent. It also means being able to produce text by writing the same symbols or signs in order to record meaning. So, even
in its most basic of forms, literacy is a lot broader than reading. International gold-standard assessment programmes, such as Trends in International Mathematics and Science Study (TIMSS)
and Progress in International Reading Literacy Study (PIRLS), go even further, incorporating an element of social context into their understandings of literacy. Similarly, the OECD’s definition of numeracy is broader than being able to operate mathematical equations – rather, it hinges on the
‘ability to access, use, interpret, and communicate mathematical information and ideas, to engage in
and manage a range of situations in life’ (OECD, 2014). This definition is broader than understanding mathematical concepts but also includes being able to apply them in a variety of known and unknown situations.
The constructs to be measured through the learning achievement tests in the GEP3 evaluation are English literacy/language, Hausa literacy/language and numeracy. The GEP3 evaluation uses the broader constructs of literacy and numeracy, rather than reading and mathematics, as discussions
with stakeholders have highlighted that the programme expects children to improve learning in areas that fit into these broader areas of literacy and numeracy – such as to understand texts, use reading to understand the world, draw inferences and communicate in writing, use money in everyday life, and read a clock.
Targeting
The flawed assumption that tested children are able to read or write already has been avoided. Test items were designed or selected from existing EDOREN tests to measure skill levels below, at and above the skills assumed to have been reached given the grade the child is attending.
The major weakness in data measuring literacy and numeracy in low and middle-income countries is
that assessments measure skills at levels that are too high for most of the children taking the tests. This was observed in the case of Mali, where over 80% of students in Grade 2 could not read a single

Evaluation of the Girl’s Education Project 3
© EDOREN 129
word in four national languages, while in the Nigerian state of Sokoto 81% of the students could not
read full words (Global Education Monitoring, 2012). These floor effects are not problematic if the goal of the assessment is to establish national learning levels. For evaluation purposes it would not be possible to detect growth in literacy or numeracy unless those children previously out of range of the tests come into the ability level measured by the test. For those children who do not come into
range, but whose literacy or numeracy levels do improve, the impact of the intervention will be underestimated. Therefore, the GEP3 assessment tools were designed to ensure item difficulty matched pupils’ ability. The level of the assessment and pupils’ abilities were assessed during the piloting and adjusted based on the results.
As the assessments used for the evaluation are administered to a panel of pupils, the assessments
need to be able to cover a wide variation in pupil knowledge (from the lowest performing pupils at baseline, to the highest performing pupils at midline – the following school year). This places a great requirement on the test to credibly measure knowledge over a large range of difficulty, without making the test too long for young pupils. This will be alleviated through the use of Rasch (item
response theory) modelling. The tests will use link items to link the difficulty of the baseline test to the midline test and to place the results onto the same scale (metric). The EDOREN metrics team has also placed this learning onto the same metric as has been used for ESSPIN English Literacy and
Numeracy.
Administration
Learning achievement tests used as part of the GEP3 evaluation use a set of assessment items or questions to assess children’s literacy and/or language and numeracy knowledge and skills, based on
a one-on-one individual oral interaction between a child and an enumerator.
Psychometric analysis
The use of Rasch modelling (IRT) increases the amount of analysis required as more sophisticated techniques are used, rather than adding up a total number of items correct in the test and converting
the number into a percentage score. In this regard the evaluation team followed the following steps: the first step was to test the psychometric properties of the items to ensure they were useful
measures of what pupils know. The second step was to remove any items that did not perform well and would bias the results if they were counted in the analysis. In a third step the team ranked the
items according to difficulty. This was done by a psychometrician, using fit-for-purpose software. The software then also ranked pupils according to their ability and placed the pupils and the items onto the same metric. This is a probability model as pupils are placed on the scale according to the
probability of a pupil answering the corresponding item correctly.
Proficiency bands
Informed decisions were then made regarding the standards of learning. For example, what skills do
we expect pupils to have to consider them ‘literate’? This defines the learning standard across the metric and creates a proficiency band. The percentage of children that fall within this range is then
calculated.
These proficiency bands were drawn through a benchmarking workshop undertaken with TDP, GEP3,
DEEPEN and ESSPIN stakeholders in November 2015 for the English literacy and numeracy assessments. For the Hausa assessment, the cut-off point was drawn to reflect the English literacy proficiency ranges as much as possible. in other words, the skills that fall within each proficiency
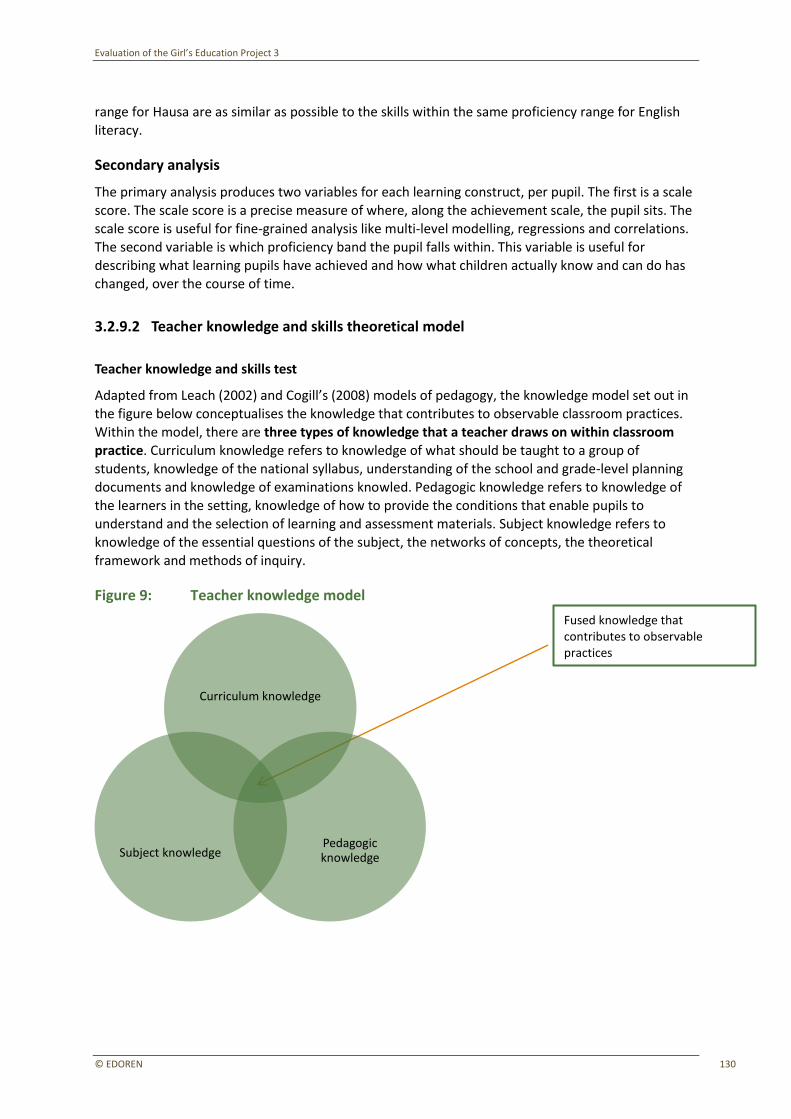
Evaluation of the Girl’s Education Project 3
© EDOREN 130
range for Hausa are as similar as possible to the skills within the same proficiency range for English
literacy.
Secondary analysis
The primary analysis produces two variables for each learning construct, per pupil. The first is a scale score. The scale score is a precise measure of where, along the achievement scale, the pupil sits. The scale score is useful for fine-grained analysis like multi-level modelling, regressions and correlations. The second variable is which proficiency band the pupil falls within. This variable is useful for
describing what learning pupils have achieved and how what children actually know and can do has changed, over the course of time.
3.2.9.2 Teacher knowledge and skills theoretical model
Teacher knowledge and skills test
Adapted from Leach (2002) and Cogill’s (2008) models of pedagogy, the knowledge model set out in the figure below conceptualises the knowledge that contributes to observable classroom practices.
Within the model, there are three types of knowledge that a teacher draws on within classroom practice. Curriculum knowledge refers to knowledge of what should be taught to a group of students, knowledge of the national syllabus, understanding of the school and grade-level planning documents and knowledge of examinations knowled. Pedagogic knowledge refers to knowledge of
the learners in the setting, knowledge of how to provide the conditions that enable pupils to understand and the selection of learning and assessment materials. Subject knowledge refers to
knowledge of the essential questions of the subject, the networks of concepts, the theoretical framework and methods of inquiry.
Figure 9: Teacher knowledge model
Fused knowledge that contributes to observable practices
Curriculum knowledge
Pedagogic knowledge
Subject knowledge

Evaluation of the Girl’s Education Project 3
© EDOREN 131
Test construction
The teacher knowledge and skills test was divided into three sections, collectively comprising 30 items, including multiple choice, short response and long response items. In section one teachers were asked to mark pupil responses to Hausa literacy questions and to indicate the grade level at which the answer should be known by pupils, as defined by the curriculum. In section two teachers were asked to fill in missing information on an answer sheet for a reading test aimed at Grade 2
pupils. In addition, teachers were provided with two newspaper articles and asked to fill in missing information, including basic comprehension questions and questions that required the interpretation of words and phrases. Section three asked teachers to identify poor and good pupil work, and to review pupil work in order to make judgements about pupils’ writing, including the organisation of the writing, the use of grammar, punctuation, spelling, the pupils’ ability to self-correct and reflect
on their writing and the pupils’ ability to form letters and use spaces between words. Teachers were then asked to describe how that might support the pupils in improving their writing.
Teacher responses to the items were marked and cross-checked using a marking matrix and scoring
guide. The marking and cross-checks were carried out by two senior education specialists. One specialist is a previous director in Nigeria’s education system and the other is an international education specialist.
Teacher responses were used to develop eight areas of teacher knowledge and skills:
1. syllabus knowledge;
2. ability to identify low performers;
3. ability to evidence judgements and diagnose;
4. ability to build on student knowledge;
5. teacher writing skills;
6. teacher Grade 2 Hausa knowledge;
7. teacher comprehension skills; and
8. interpreting words and phrases.
Data analysis and subscale analysis
The main purpose of the data quality and subscale analysis was to assess the quality of the data on
teacher knowledge and skills with regard to validity and reliability, and to establish two threshold points for each subscale.
The first, and lower, threshold point is meant to represent a rudimentary level of achievement. This means that there appears to be evidence of some ability to understand and perform some of the teaching tasks measured by the subscale. The second, and higher, threshold is meant to represent a
competent level of achievement. This means that there is evidence of ability to consistently understand and perform teaching tasks measured by the subscale.
The reliability of the scales was examined using Cronbach’s alpha.
High levels of missing data were observed. The amount of missing data is a major concern. First, because it may indicate that many of the teachers who participated in the programme were not able
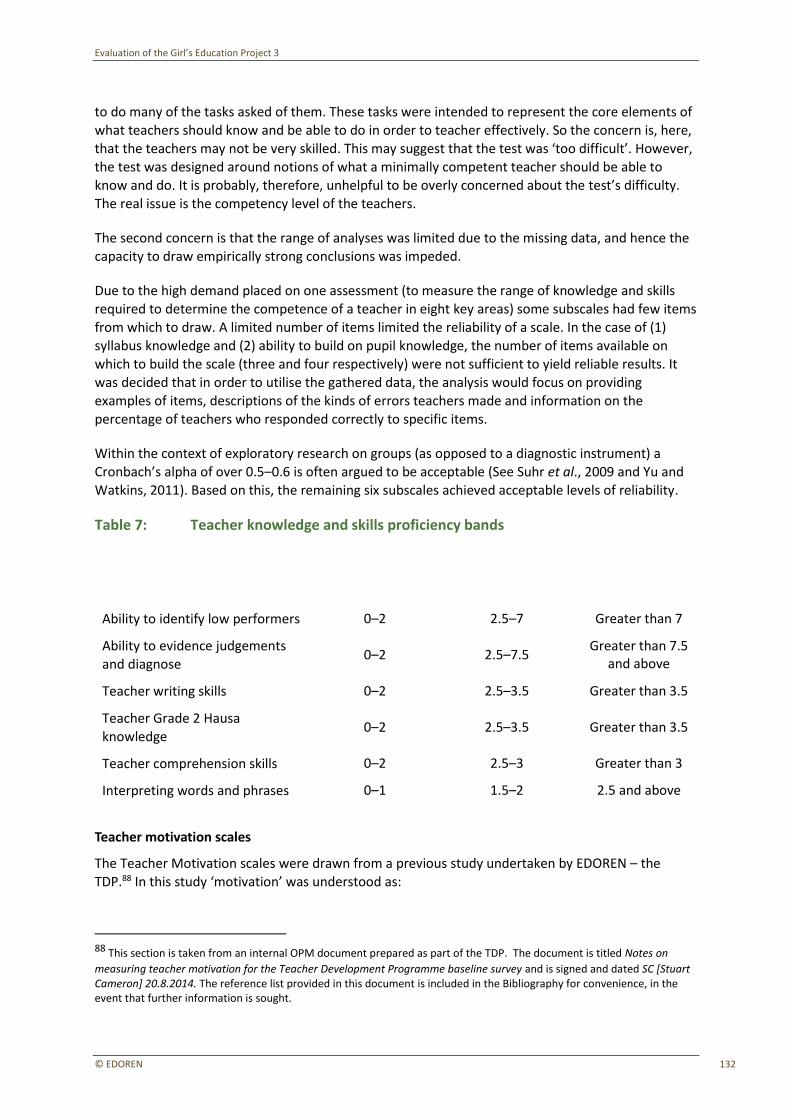
Evaluation of the Girl’s Education Project 3
© EDOREN 132
to do many of the tasks asked of them. These tasks were intended to represent the core elements of
what teachers should know and be able to do in order to teacher effectively. So the concern is, here, that the teachers may not be very skilled. This may suggest that the test was ‘too difficult’. However, the test was designed around notions of what a minimally competent teacher should be able to know and do. It is probably, therefore, unhelpful to be overly concerned about the test’s difficulty.
The real issue is the competency level of the teachers.
The second concern is that the range of analyses was limited due to the missing data, and hence the capacity to draw empirically strong conclusions was impeded.
Due to the high demand placed on one assessment (to measure the range of knowledge and skills required to determine the competence of a teacher in eight key areas) some subscales had few items
from which to draw. A limited number of items limited the reliability of a scale. In the case of (1) syllabus knowledge and (2) ability to build on pupil knowledge, the number of items available on which to build the scale (three and four respectively) were not sufficient to yield reliable results. It
was decided that in order to utilise the gathered data, the analysis would focus on providing examples of items, descriptions of the kinds of errors teachers made and information on the percentage of teachers who responded correctly to specific items.
Within the context of exploratory research on groups (as opposed to a diagnostic instrument) a Cronbach’s alpha of over 0.5–0.6 is often argued to be acceptable (See Suhr et al., 2009 and Yu and Watkins, 2011). Based on this, the remaining six subscales achieved acceptable levels of reliability.
Table 7: Teacher knowledge and skills proficiency bands
Subscales
Low band
No evidence of skill
Middle band
Evidence of rudimentary skill
Upper band
Evidence of competence
Ability to identify low performers 0–2 2.5–7 Greater than 7
Ability to evidence judgements and diagnose
0–2 2.5–7.5 Greater than 7.5
and above
Teacher writing skills 0–2 2.5–3.5 Greater than 3.5
Teacher Grade 2 Hausa knowledge
0–2 2.5–3.5 Greater than 3.5
Teacher comprehension skills 0–2 2.5–3 Greater than 3
Interpreting words and phrases 0–1 1.5–2 2.5 and above
Teacher motivation scales
The Teacher Motivation scales were drawn from a previous study undertaken by EDOREN – the
TDP.88 In this study ‘motivation’ was understood as:
88 This section is taken from an internal OPM document prepared as part of the TDP. The document is titled Notes on
measuring teacher motivation for the Teacher Development Programme baseline survey and is signed and dated SC [Stuart Cameron] 20.8.2014. The reference list provided in this document is included in the Bibliography for convenience, in the event that further information is sought.
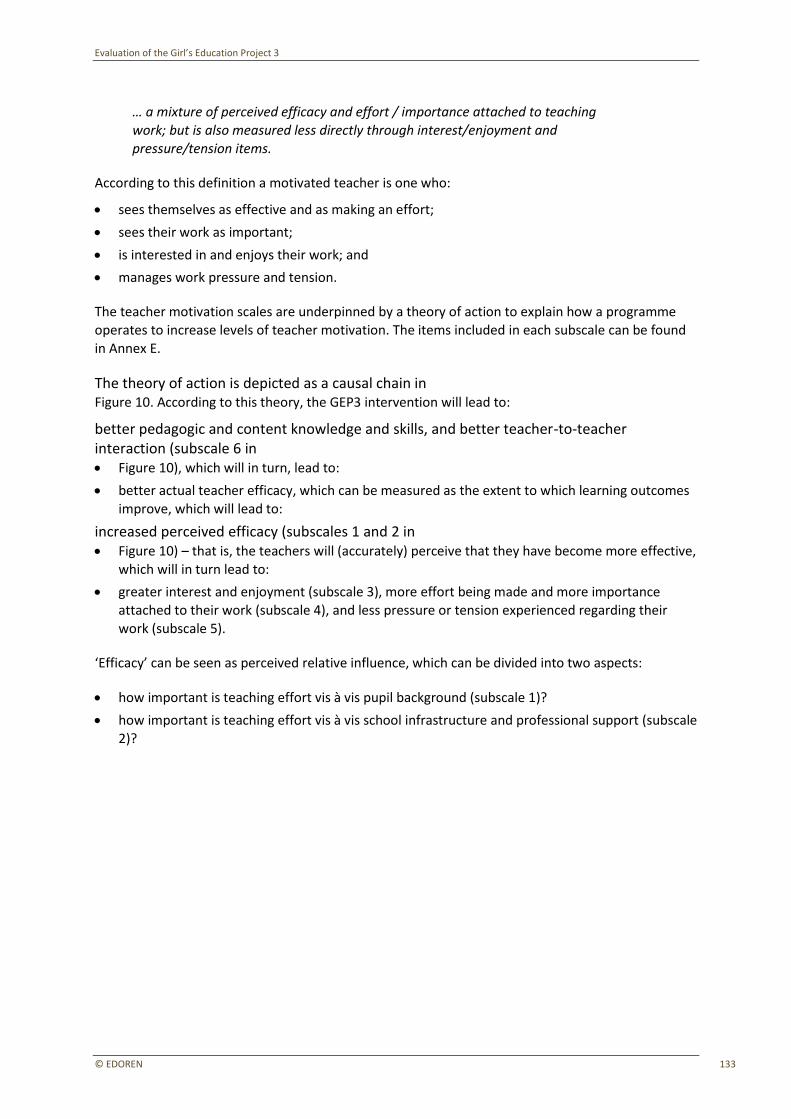
Evaluation of the Girl’s Education Project 3
© EDOREN 133
… a mixture of perceived efficacy and effort / importance attached to teaching
work; but is also measured less directly through interest/enjoyment and pressure/tension items.
According to this definition a motivated teacher is one who:
• sees themselves as effective and as making an effort;
• sees their work as important;
• is interested in and enjoys their work; and
• manages work pressure and tension.
The teacher motivation scales are underpinned by a theory of action to explain how a programme operates to increase levels of teacher motivation. The items included in each subscale can be found in Annex E.
The theory of action is depicted as a causal chain in Figure 10. According to this theory, the GEP3 intervention will lead to:
better pedagogic and content knowledge and skills, and better teacher-to-teacher interaction (subscale 6 in • Figure 10), which will in turn, lead to:
• better actual teacher efficacy, which can be measured as the extent to which learning outcomes improve, which will lead to:
increased perceived efficacy (subscales 1 and 2 in • Figure 10) – that is, the teachers will (accurately) perceive that they have become more effective,
which will in turn lead to:
• greater interest and enjoyment (subscale 3), more effort being made and more importance
attached to their work (subscale 4), and less pressure or tension experienced regarding their
work (subscale 5).
‘Efficacy’ can be seen as perceived relative influence, which can be divided into two aspects:
• how important is teaching effort vis à vis pupil background (subscale 1)?
• how important is teaching effort vis à vis school infrastructure and professional support (subscale
2)?

Evaluation of the Girl’s Education Project 3
© EDOREN 134
Figure 10: Theorised causal pathway (taken from the TDP)
Interest in
and
enjoyment
of teaching
Subscale 3
Teacher-to-
teacher
interaction
Subscale 6
> Efficacy as a
teacher >
Perceived
efficacy as a
teacher
Subscales 1
and 2
Effort and
importance
Subscale 4
Pressure
and work-
related
tension
Subscale 5
Data quality
The quality of a dataset can be influenced by the amount of missing data. There was very little
missing data: on average, only 1.2% of data on the motivation items was missing.
It is important to consider the distribution of values for each variable. Highly skewed data – data that
pile up at one end of the distribution – are not well suited to certain statistical procedures, including some of those planned to be undertaken in the analysis of the teacher motivation items. Most of the
data were found to be highly skewed. While it is impossible to know for sure, these distributions are suggestive of compliance effects in at least some of these data. Thus, caution is recommended in their use and interpretation.
Procedures were explored to transform data to improve their distribution; however, these procedures were not used as they did not improve the distribution markedly, and because such transformation can add considerable complexity to the interpretation and reporting of findings.
Analysis
The data were analysed using exploratory factor analysis in the computer application SPSS Statistics. The analysis was undertaken after reverse coding negatively worded items. Principal axis factoring, with orthogonal rotation (Varimax) was used. This is a conservative approach, and one that assists the interpretation of results. The reliability of scales was assessed using Cronbach’s alpha.
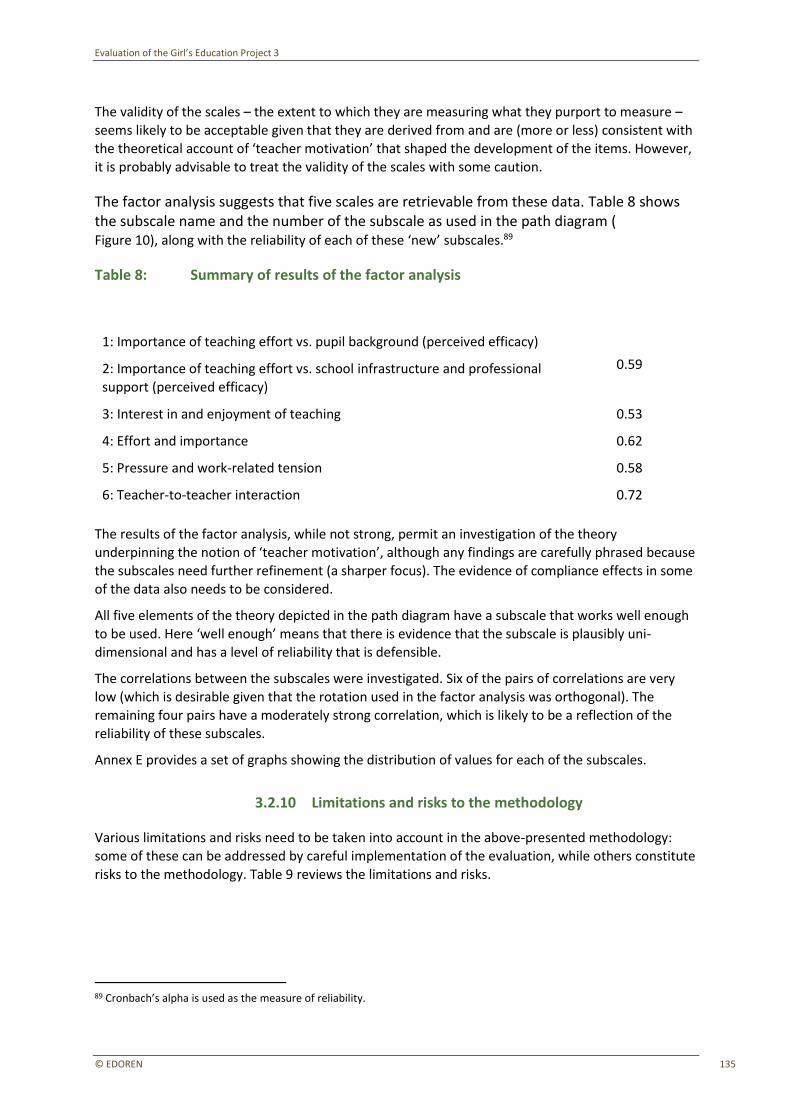
Evaluation of the Girl’s Education Project 3
© EDOREN 135
The validity of the scales – the extent to which they are measuring what they purport to measure –
seems likely to be acceptable given that they are derived from and are (more or less) consistent with the theoretical account of ‘teacher motivation’ that shaped the development of the items. However, it is probably advisable to treat the validity of the scales with some caution.
The factor analysis suggests that five scales are retrievable from these data. Table 8 shows the subscale name and the number of the subscale as used in the path diagram ( Figure 10), along with the reliability of each of these ‘new’ subscales.89
Table 8: Summary of results of the factor analysis
Subscale number and name used in the path diagram Reliability
1: Importance of teaching effort vs. pupil background (perceived efficacy)
0.59 2: Importance of teaching effort vs. school infrastructure and professional
support (perceived efficacy)
3: Interest in and enjoyment of teaching 0.53
4: Effort and importance 0.62
5: Pressure and work-related tension 0.58
6: Teacher-to-teacher interaction 0.72
The results of the factor analysis, while not strong, permit an investigation of the theory
underpinning the notion of ‘teacher motivation’, although any findings are carefully phrased because the subscales need further refinement (a sharper focus). The evidence of compliance effects in some
of the data also needs to be considered.
All five elements of the theory depicted in the path diagram have a subscale that works well enough
to be used. Here ‘well enough’ means that there is evidence that the subscale is plausibly uni-dimensional and has a level of reliability that is defensible.
The correlations between the subscales were investigated. Six of the pairs of correlations are very low (which is desirable given that the rotation used in the factor analysis was orthogonal). The remaining four pairs have a moderately strong correlation, which is likely to be a reflection of the
reliability of these subscales.
Annex E provides a set of graphs showing the distribution of values for each of the subscales.
3.2.10 Limitations and risks to the methodology
Various limitations and risks need to be taken into account in the above-presented methodology: some of these can be addressed by careful implementation of the evaluation, while others constitute
risks to the methodology. Table 9 reviews the limitations and risks.
89 Cronbach’s alpha is used as the measure of reliability.

Evaluation of the Girl’s Education Project 3
© EDOREN 136
Table 9: Limitations of, and risks to, the evaluation methodology of the early learning intervention
Limitations/risks Why this is limiting and what we have done to address this
Intervention not provided as planned
It is assumed that the sampled treatment schools will receive the RANA intervention, while the control schools will not. Furthermore, the design assumes that all primary school teachers in early grades and all IQS teachers teaching the integrated curriculum in early grades will be trained. If the intervention is not conducted as planned—for example, some treatment schools or teachers are not, or are only partially, exposed to the intervention, or control schools are included in the intervention—the ability to estimate impact and comparability between treatment and control schools may be reduced.
The mitigation of this risk of partial compliance, highlighted in the GEP3 Evaluation Framework, requires close coordination between implementers and evaluators. The implementer, FHI360, has changed the intervention roll-out to schools compared to GEP3’s strategy paper, which was initially going to invalidate the evaluation design. Through effective coordination the implementer was eventually able to align implementation roll-out with the initial plan. Nonetheless, a degree of phased roll-out is still implemented, which will result in a slight non-random variation within the treatment group. Given that schools that form part of the two phases of roll-out are clearly identified this can be taken into account in the analysis.
With regards to teacher training, RANA has confirmed that all early grade teachers in treatment schools will be trained and mentored. Nonetheless, the baseline experience has demonstrated that, particularly in IQSs, people that are not actually teaching in the school participate in training. Therefore, it will require close monitoring to train the actual target group.
Attrition
Sampled schools, teachers or pupils may drop out of the survey panel before midline, thus creating a problem of missing data. A certain degree of attrition is taken into account in the sample size calculation. Given that all study schools are GEP3 schools we assume very limited attrition at the school level. One IQS proprietor included in the treatment group has indicated that he may stop integration even before the intervention starts. Government and GEP3 staff are consulting with the proprietor to maintain his interest. Non-integration would mean that the school falls outside the target population, which would warrant replacement of the school.
Attrition may pose a risk to the comparability of the intervention and control groups if attrition is systematically different in both groups. If the competence of the teachers who drop out of the control sample differs to that of the teachers who drop out of the intervention sample, bias is introduced in the comparison between the two samples. Such attrition is hard to control for, but if the attrition rate is high a sample of teachers that have dropped out could be tracked outside of school and surveyed, if the resources to do so are available.
Contamination
Contamination refers to other interventions affecting the RANA outcomes, which may create a confounding factor in the measurement of the impact. This creates a problem to the extent that such contamination affects the intervention and control schools differently. GEP3 will implement other interventions among public primary schools in both intervention and control groups. It is important that the project does not bias intervention implementation toward one of the groups. We assume that the risk in this regard is low because this is under GEP3’s control. The TDP and the Jolly Phonics project are also providing teacher training in public primary schools in Katsina and Zamfara. While some degree of
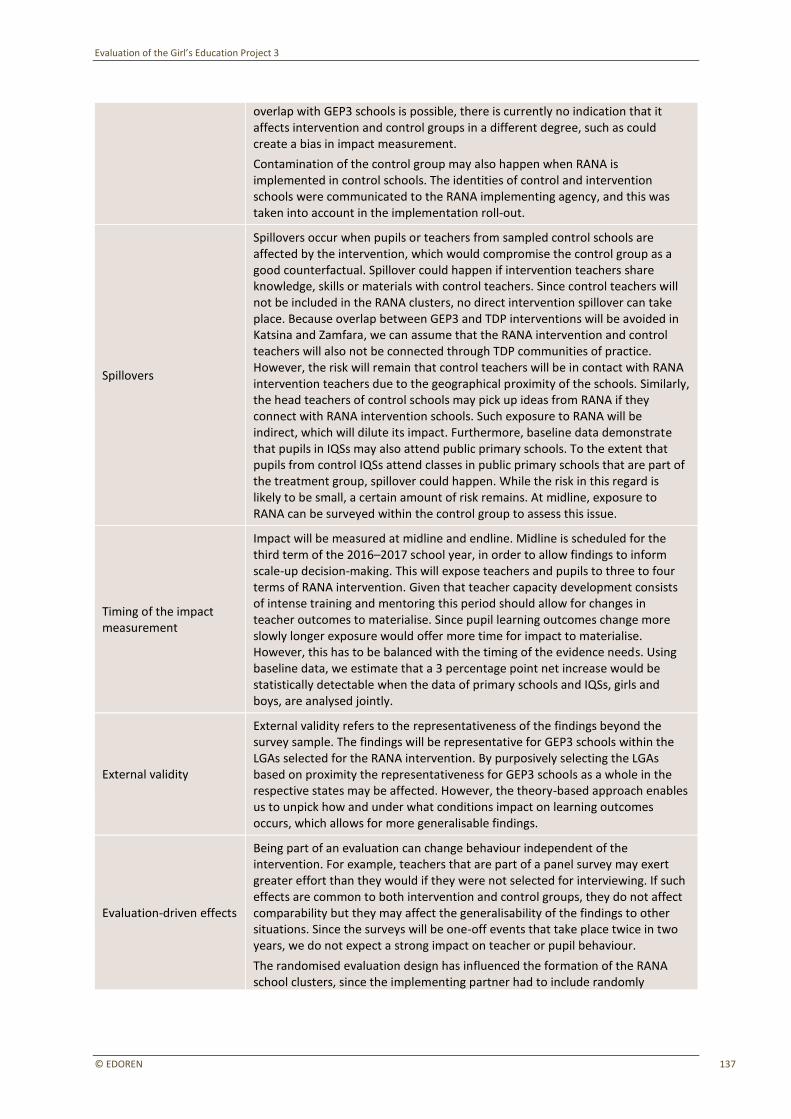
Evaluation of the Girl’s Education Project 3
© EDOREN 137
overlap with GEP3 schools is possible, there is currently no indication that it affects intervention and control groups in a different degree, such as could create a bias in impact measurement.
Contamination of the control group may also happen when RANA is implemented in control schools. The identities of control and intervention schools were communicated to the RANA implementing agency, and this was taken into account in the implementation roll-out.
Spillovers
Spillovers occur when pupils or teachers from sampled control schools are affected by the intervention, which would compromise the control group as a good counterfactual. Spillover could happen if intervention teachers share knowledge, skills or materials with control teachers. Since control teachers will not be included in the RANA clusters, no direct intervention spillover can take place. Because overlap between GEP3 and TDP interventions will be avoided in Katsina and Zamfara, we can assume that the RANA intervention and control teachers will also not be connected through TDP communities of practice. However, the risk will remain that control teachers will be in contact with RANA intervention teachers due to the geographical proximity of the schools. Similarly, the head teachers of control schools may pick up ideas from RANA if they connect with RANA intervention schools. Such exposure to RANA will be indirect, which will dilute its impact. Furthermore, baseline data demonstrate that pupils in IQSs may also attend public primary schools. To the extent that pupils from control IQSs attend classes in public primary schools that are part of the treatment group, spillover could happen. While the risk in this regard is likely to be small, a certain amount of risk remains. At midline, exposure to RANA can be surveyed within the control group to assess this issue.
Timing of the impact measurement
Impact will be measured at midline and endline. Midline is scheduled for the third term of the 2016–2017 school year, in order to allow findings to inform scale-up decision-making. This will expose teachers and pupils to three to four terms of RANA intervention. Given that teacher capacity development consists of intense training and mentoring this period should allow for changes in teacher outcomes to materialise. Since pupil learning outcomes change more slowly longer exposure would offer more time for impact to materialise. However, this has to be balanced with the timing of the evidence needs. Using baseline data, we estimate that a 3 percentage point net increase would be statistically detectable when the data of primary schools and IQSs, girls and boys, are analysed jointly.
External validity
External validity refers to the representativeness of the findings beyond the survey sample. The findings will be representative for GEP3 schools within the LGAs selected for the RANA intervention. By purposively selecting the LGAs based on proximity the representativeness for GEP3 schools as a whole in the respective states may be affected. However, the theory-based approach enables us to unpick how and under what conditions impact on learning outcomes occurs, which allows for more generalisable findings.
Evaluation-driven effects
Being part of an evaluation can change behaviour independent of the intervention. For example, teachers that are part of a panel survey may exert greater effort than they would if they were not selected for interviewing. If such effects are common to both intervention and control groups, they do not affect comparability but they may affect the generalisability of the findings to other situations. Since the surveys will be one-off events that take place twice in two years, we do not expect a strong impact on teacher or pupil behaviour.
The randomised evaluation design has influenced the formation of the RANA school clusters, since the implementing partner had to include randomly
Evaluation of the Girl’s Education Project 3
© EDOREN 138
selected treatment schools in the clusters, which may have influenced the proximity radius of the cluster. The extent of this potential effect depends on the proximity of the GEP3 schools in the RANA LGAs. By focusing the intervention on a limited number of LGAs and stratifying the sample by LGAs, the concentration of schools is enhanced.
Mixed methods
A mixed quantitative and qualitative methods approach offers strong added value in terms of defining and explaining the impact of an intervention. By using a theory-based approach and adding state-level qualitative data collection to the quantitative methods, the explanatory power of the evaluation is enhanced. However, the evaluation team is not able to complement quantitative data collection at school level with qualitative research at the same level, which will constrain the richness of the understanding of the impact. The GEP3-led qualitative research may provide an alternative source of information, and qualitative research can still be considered during the 2017–2020 evaluation period.
Survey response achievement
As discussed above, the survey team succeeded in surveying a high percentage of the intended school and pupil sample. The percentage of teachers surveyed was relatively lower – that is, around 80%. This was not due to a low response rate but rather because in some cases, particularly in IQSs, the school only had one or two teachers. While this may affect the intended MDE size, we estimate that this will not jeopardise a valid impact judgement since it is expected that the increase in teacher competencies will be relatively large (a 30% increase according to the GEP3 logframe).
Floor effects in measurement
High levels of missing data were observed in the teacher assessment. The amount of missing data is a major concern. First, because it may indicate that many of the teachers who participated in the programme were not able to do many of the tasks asked of them. These tasks were intended to represent the core basic elements of what teachers should know and be able to do in order to teach effectively at a minimum level. Thus the concern is that the teachers may not be very skilled. While this suggests that the test was ‘too difficult’, the test was designed around notions of what a minimally competent teacher should be able to know and do. It is probably, therefore, unhelpful to be overly concerned about the test’s difficulty. The issue here is the competency level of the teachers.
However, these floor effects limit the range of analyses able to be undertaken and limit the evaluation team’s capacity to draw empirically strong conclusions.
Social desirability bias
A number of items regarding attitudes towards girls’ education were included in the teacher questionnaire. While the reliability of the results was acceptable, the very high proportions of teachers responding positively to statements regarding the importance of girls’ education revealed a compliance effect. The distribution of responses across the strongly disagree, disagree, agree and strongly agree Likert scale indicates that teachers are conforming to perceived correct responses, creating a social desirability bias in the measurement. Given these compliance effects, the data on teachers’ attitudes towards girl’s education were not able to be used in the analysis. This limitation highlights the importance of observation data and qualitative methods to probe social norms and gender attitudes, particularly in an evaluation of a programme described as an intervention targeted at girls.
Bias in sampling
As part of the sampling process biases may occur when units are selected that do not form part of the target population or when some units of the target population are less likely to be selected than others. As has been discussed, in some schools, stakeholders tried to influence pupil sampling or school eligibility.
Evaluation of the Girl’s Education Project 3
© EDOREN 139
This was particularly a risk in IQSs given their non-standard organisation and the poor quality of the sample frame. To the extent possible this risk was mitigated through the definition and implementation of rigorous and systematic sampling procedures under close supervision.
3.3 Comparison of baseline characteristics between intervention and control schools
The reliability of the quantitative estimation model employed for the impact evaluation of the GEP3 early learning intervention relies on the robustness of the RCT that was designed and implemented to identify treatment and a control groups. RCT is an experimental design that ensures no systematic differences exist between treatment and control observations and thus, given randomness has truly
been achieved, addresses the issue of selection bias. A robust RCT is therefore critical to achieve
unbiased estimates of intervention (early learning) impact.
For this reason, we have run a series of checks to determine whether or not the randomisation protocol was followed correctly and if it achieved the expected results. In particular, if the sampling units of interest were assigned to treatment or control groups randomly and the sampling strategy randomisation protocol was maintained during the survey fieldwork we would expect to see no
systematic differences between the two groups. This entails that no statistically significant differences should emerge between sample treatment and control groups for a range of characteristics related to the observations on which the randomisation checks are performed.
3.3.1 Categories and variables
The randomisation checks were performed for the main RCT sample and for different sub-samples of
interest. At the same time, checks were run at school, teacher and pupil levels. Separate checks were
performed for public primary schools and IQSs. Data with which to perform the randomisation checks were derived from the head teacher, teacher and pupil datasets, which were produced with information from their respective questionnaires. The set of variables on which the checks were run is specific to each category of interest and encompasses different thematic areas of interest. Balance
checks were also performed on key outcome variables, including Hausa and English scaled scores and teacher knowledge. Whilst multiple check iterations were tested across different combinations of variables, we present in the tables below a selection of the key outcomes and related characteristics at school, teacher and pupil level. The whole set of results, including checks on samples and sub-samples of interest, is included in Annex F.
3.3.2 Balance achieved
At the school level, data derived from head teachers were used to check the balance between
treatment and control groups across a range of school characteristics, including gender-specific
factors such as the number of toilets exclusively for girls, boys’ and girls’ enrolment rates, pupil and teacher gender ratios (boys to girls and female to male teachers), as well as pupil classroom ratios
and other school-specific aspects, including the occurrence of major school repair works. As shown in the table below, the latter is the only variable for which we detect some significant difference between treatment and control groups when looking at the whole sample of IQSs and primary schools. All the other variables pertaining to the various categories of interest discussed above show
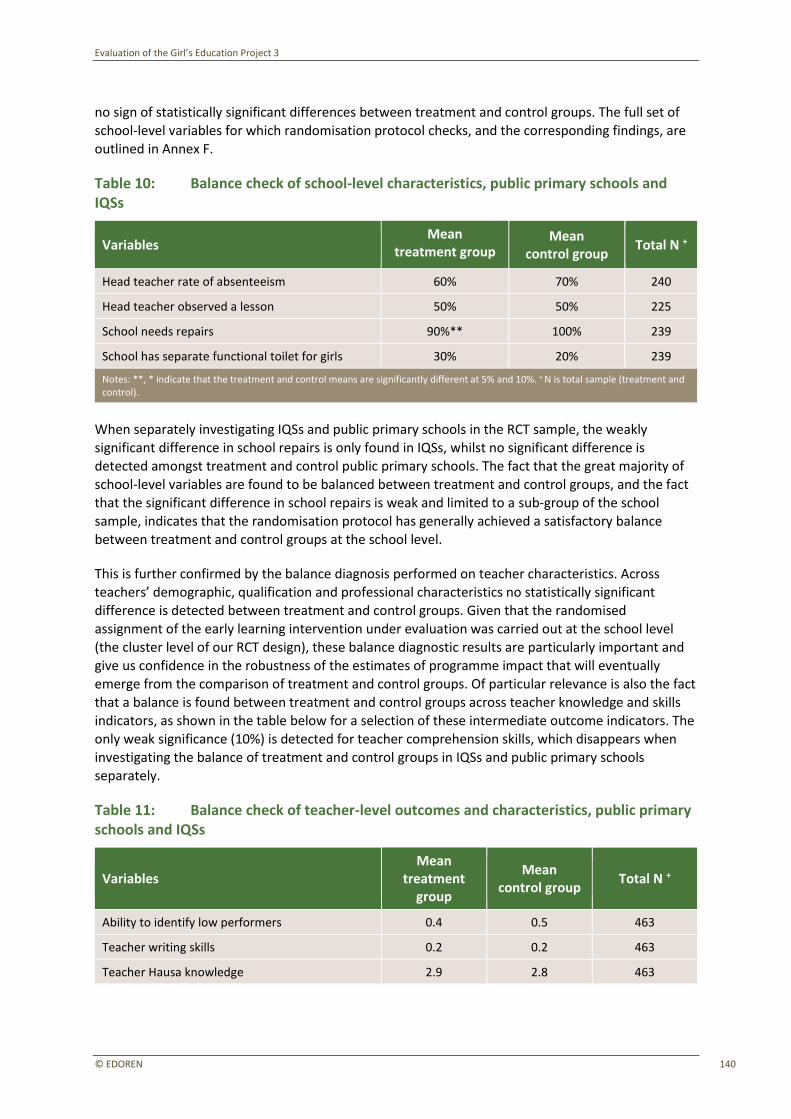
Evaluation of the Girl’s Education Project 3
© EDOREN 140
no sign of statistically significant differences between treatment and control groups. The full set of
school-level variables for which randomisation protocol checks, and the corresponding findings, are outlined in Annex F.
Table 10: Balance check of school-level characteristics, public primary schools and IQSs
Variables Mean
treatment group Mean
control group Total N +
Head teacher rate of absenteeism 60% 70% 240
Head teacher observed a lesson 50% 50% 225
School needs repairs 90%** 100% 239
School has separate functional toilet for girls 30% 20% 239
Notes: **, * indicate that the treatment and control means are significantly different at 5% and 10%. + N is total sample (treatment and control).
When separately investigating IQSs and public primary schools in the RCT sample, the weakly
significant difference in school repairs is only found in IQSs, whilst no significant difference is detected amongst treatment and control public primary schools. The fact that the great majority of
school-level variables are found to be balanced between treatment and control groups, and the fact that the significant difference in school repairs is weak and limited to a sub-group of the school sample, indicates that the randomisation protocol has generally achieved a satisfactory balance
between treatment and control groups at the school level.
This is further confirmed by the balance diagnosis performed on teacher characteristics. Across
teachers’ demographic, qualification and professional characteristics no statistically significant difference is detected between treatment and control groups. Given that the randomised
assignment of the early learning intervention under evaluation was carried out at the school level (the cluster level of our RCT design), these balance diagnostic results are particularly important and
give us confidence in the robustness of the estimates of programme impact that will eventually emerge from the comparison of treatment and control groups. Of particular relevance is also the fact
that a balance is found between treatment and control groups across teacher knowledge and skills indicators, as shown in the table below for a selection of these intermediate outcome indicators. The only weak significance (10%) is detected for teacher comprehension skills, which disappears when
investigating the balance of treatment and control groups in IQSs and public primary schools separately.
Table 11: Balance check of teacher-level outcomes and characteristics, public primary schools and IQSs
Variables Mean
treatment group
Mean control group
Total N +
Ability to identify low performers 0.4 0.5 463
Teacher writing skills 0.2 0.2 463
Teacher Hausa knowledge 2.9 2.8 463
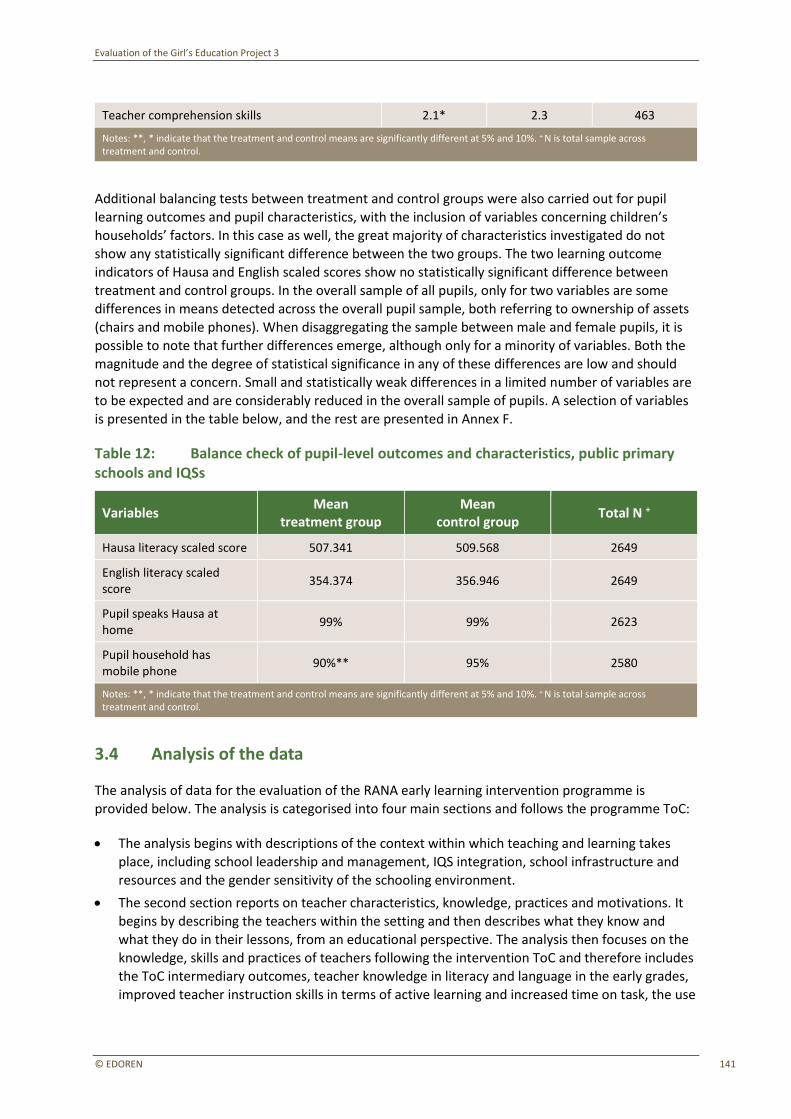
Evaluation of the Girl’s Education Project 3
© EDOREN 141
Teacher comprehension skills 2.1* 2.3 463
Notes: **, * indicate that the treatment and control means are significantly different at 5% and 10%. + N is total sample across treatment and control.
Additional balancing tests between treatment and control groups were also carried out for pupil learning outcomes and pupil characteristics, with the inclusion of variables concerning children’s
households’ factors. In this case as well, the great majority of characteristics investigated do not show any statistically significant difference between the two groups. The two learning outcome indicators of Hausa and English scaled scores show no statistically significant difference between treatment and control groups. In the overall sample of all pupils, only for two variables are some differences in means detected across the overall pupil sample, both referring to ownership of assets
(chairs and mobile phones). When disaggregating the sample between male and female pupils, it is possible to note that further differences emerge, although only for a minority of variables. Both the magnitude and the degree of statistical significance in any of these differences are low and should
not represent a concern. Small and statistically weak differences in a limited number of variables are to be expected and are considerably reduced in the overall sample of pupils. A selection of variables is presented in the table below, and the rest are presented in Annex F.
Table 12: Balance check of pupil-level outcomes and characteristics, public primary schools and IQSs
Variables Mean
treatment group Mean
control group Total N +
Hausa literacy scaled score 507.341 509.568 2649
English literacy scaled score
354.374 356.946 2649
Pupil speaks Hausa at home
99% 99% 2623
Pupil household has mobile phone
90%** 95% 2580
Notes: **, * indicate that the treatment and control means are significantly different at 5% and 10%. + N is total sample across treatment and control.
3.4 Analysis of the data
The analysis of data for the evaluation of the RANA early learning intervention programme is provided below. The analysis is categorised into four main sections and follows the programme ToC:
• The analysis begins with descriptions of the context within which teaching and learning takes
place, including school leadership and management, IQS integration, school infrastructure and
resources and the gender sensitivity of the schooling environment.
• The second section reports on teacher characteristics, knowledge, practices and motivations. It begins by describing the teachers within the setting and then describes what they know and what they do in their lessons, from an educational perspective. The analysis then focuses on the knowledge, skills and practices of teachers following the intervention ToC and therefore includes the ToC intermediary outcomes, teacher knowledge in literacy and language in the early grades, improved teacher instruction skills in terms of active learning and increased time on task, the use
Evaluation of the Girl’s Education Project 3
© EDOREN 142
of Hausa-based teaching and learning materials, and improved Hausa-based teaching in the early
grades. In addition, we discuss teacher motivation and attitudes as important assumptions underlying the causal chain.
• The third section relates to pupils and describes the pupils within the setting and their current
levels of learning.
• The analysis concludes with an investigation into the relationships between the characteristics within the school setting, the characteristics of teachers and teaching and learning, and the observed Hausa literacy skills of pupils.
The baseline analysis of quantitative data provides a benchmark that is a useful comparison for midline and eventually endline data, and will be used for assessing the impact of the programme under evaluation, in this case the GEP3 early learning intervention. At the same time, the baseline also offers the possibility of undertaking a descriptive analysis of associations of baseline indicators across categories of interests. This section provides a summary analysis of the most relevant and
interesting descriptive associations between indicators and categories of interest that emerged from the analysis of baseline data. It is important to bear in mind that these associations should not be used for making statistical claims regarding causal inference, especially given the fact that the
relatively small sample sizes used in our analysis (e.g. teacher- and school-level samples), and the further analysis of sub-samples across categories (e.g. female pupils in primary schools) is bound to yield mean estimates with large confidence intervals. The descriptive differences discussed in this section should therefore only be treated as a summary picture of our baseline sample (weighted for
the extrapolation of the results to the populations of schools, teachers and pupils from which it is drawn). The visual analysis in the form of bar charts and line graphs presented alongside the text
serve a descriptive purpose, to facilitate the narrative on the results. A larger set of descriptive statistics, including mean estimates, standard errors and number of observations for each variable is included in Annex K. At the end of this section we also present a regression model that focuses on
correlations between our main learning outcome variables and their main influencing factors. This correlation analysis allows us to make more statistically robust claims regarding the relationship
between the selected explanatory and outcome variables, as is explained in more detail in the relevant paragraph. These baseline findings can be used to shed light on the robustness of GEP3’s
ToC assumptions, with a focus on the DAC criteria of the ‘relevance’ of the programme’s design. In particular, the descriptive and regression results presented in this section can help to investigate
whether assumptions regarding teachers’ knowledge and practices, school environment and pupils’ characteristics are confirmed by the data. However, this still does not amount to a causal analysis of
impact, which will be carried out in the next stages of the evaluation through the proposed RCT approach.
3.4.1 Teaching context
Teaching context includes the school leadership and management of the school, IQS integration, school infrastructure and resources, and the gender sensitivity of the schooling environment.
3.4.1.1 School location and size
The great majority of schools in our early learning sample are located in rural areas, with only around 14% of schools located in urban areas. The proportions are similar when we look separately at IQSs and primary schools, with the latter slightly more represented in rural areas.
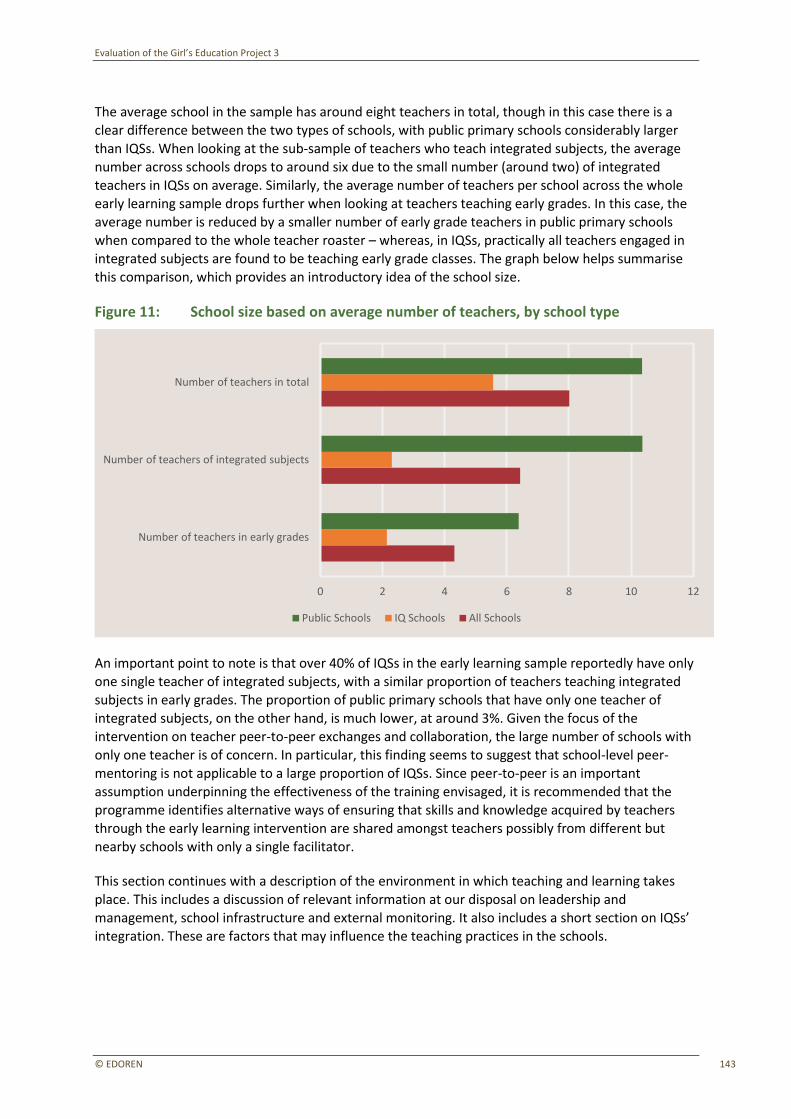
Evaluation of the Girl’s Education Project 3
© EDOREN 143
The average school in the sample has around eight teachers in total, though in this case there is a
clear difference between the two types of schools, with public primary schools considerably larger than IQSs. When looking at the sub-sample of teachers who teach integrated subjects, the average number across schools drops to around six due to the small number (around two) of integrated teachers in IQSs on average. Similarly, the average number of teachers per school across the whole
early learning sample drops further when looking at teachers teaching early grades. In this case, the average number is reduced by a smaller number of early grade teachers in public primary schools when compared to the whole teacher roaster – whereas, in IQSs, practically all teachers engaged in integrated subjects are found to be teaching early grade classes. The graph below helps summarise this comparison, which provides an introductory idea of the school size.
Figure 11: School size based on average number of teachers, by school type
An important point to note is that over 40% of IQSs in the early learning sample reportedly have only
one single teacher of integrated subjects, with a similar proportion of teachers teaching integrated subjects in early grades. The proportion of public primary schools that have only one teacher of
integrated subjects, on the other hand, is much lower, at around 3%. Given the focus of the intervention on teacher peer-to-peer exchanges and collaboration, the large number of schools with only one teacher is of concern. In particular, this finding seems to suggest that school-level peer-mentoring is not applicable to a large proportion of IQSs. Since peer-to-peer is an important assumption underpinning the effectiveness of the training envisaged, it is recommended that the
programme identifies alternative ways of ensuring that skills and knowledge acquired by teachers through the early learning intervention are shared amongst teachers possibly from different but nearby schools with only a single facilitator.
This section continues with a description of the environment in which teaching and learning takes place. This includes a discussion of relevant information at our disposal on leadership and management, school infrastructure and external monitoring. It also includes a short section on IQSs’ integration. These are factors that may influence the teaching practices in the schools.
Number of teachers in early grades
Number of teachers of integrated subjects
Number of teachers in total
0 2 4 6 8 10 12
Public Schools IQ Schools All Schools
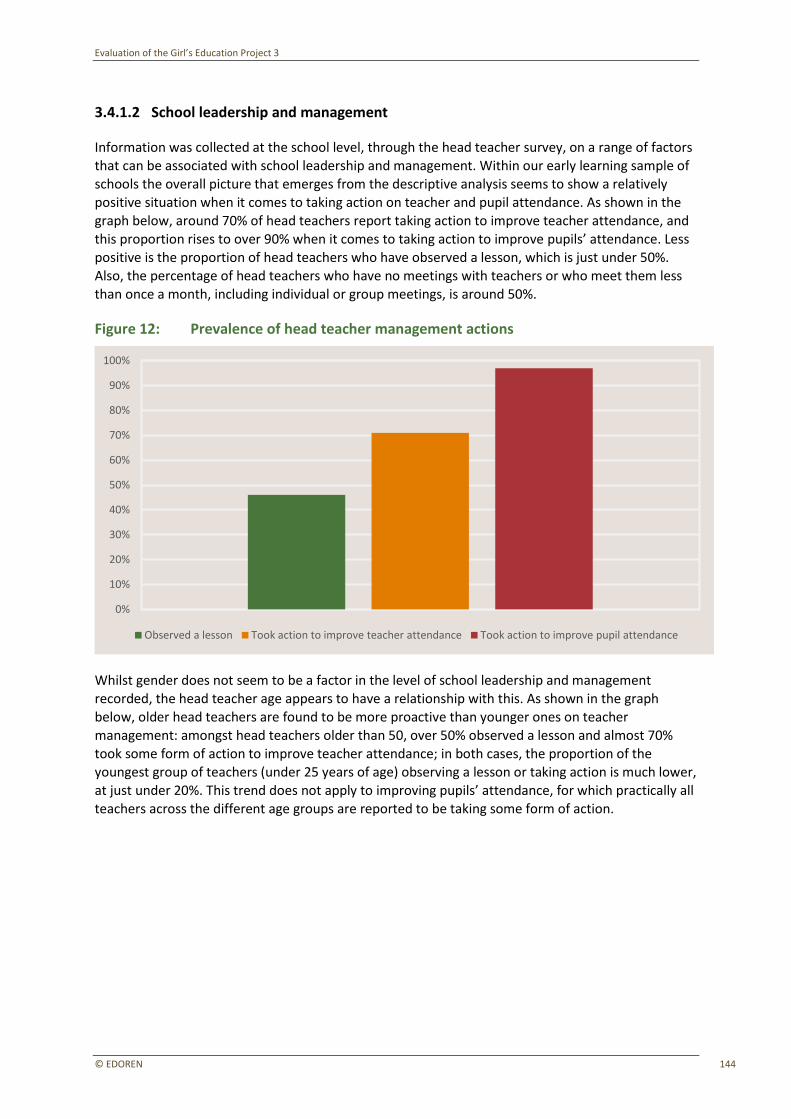
Evaluation of the Girl’s Education Project 3
© EDOREN 144
3.4.1.2 School leadership and management
Information was collected at the school level, through the head teacher survey, on a range of factors
that can be associated with school leadership and management. Within our early learning sample of schools the overall picture that emerges from the descriptive analysis seems to show a relatively positive situation when it comes to taking action on teacher and pupil attendance. As shown in the graph below, around 70% of head teachers report taking action to improve teacher attendance, and this proportion rises to over 90% when it comes to taking action to improve pupils’ attendance. Less
positive is the proportion of head teachers who have observed a lesson, which is just under 50%. Also, the percentage of head teachers who have no meetings with teachers or who meet them less than once a month, including individual or group meetings, is around 50%.
Figure 12: Prevalence of head teacher management actions
Whilst gender does not seem to be a factor in the level of school leadership and management
recorded, the head teacher age appears to have a relationship with this. As shown in the graph below, older head teachers are found to be more proactive than younger ones on teacher management: amongst head teachers older than 50, over 50% observed a lesson and almost 70%
took some form of action to improve teacher attendance; in both cases, the proportion of the youngest group of teachers (under 25 years of age) observing a lesson or taking action is much lower,
at just under 20%. This trend does not apply to improving pupils’ attendance, for which practically all teachers across the different age groups are reported to be taking some form of action.
0%
10%
20%
30%
40%
50%
60%
70%
80%
90%
100%
Observed a lesson Took action to improve teacher attendance Took action to improve pupil attendance

Evaluation of the Girl’s Education Project 3
© EDOREN 145
Figure 13: Actions taken and age groups
Clear differences with regard to observing teachers and taking action to improve teacher attendance are also noticeable when comparing states and school types, with again no noticeable difference
detected regarding action taken to improve pupils’ attendance. Whilst almost 60% of head teachers observed a lesson and 75% took action to improve teacher attendance in Zamfara, the equivalent proportions in Katsina are 34% and 67%. Even more accentuated is the difference between public
primary schools and IQSs: only 53% of head teachers in IQSs take action to improve teacher attendance, which compares to almost 90% of head teachers taking action in public primary schools.
It seems therefore that the willingness and ability of head teachers to lead and improve on teaching in their schools, which is an assumption of the programme’s ToC, might be an issue in Qur’anic
schools. This may also be due to the different type of leadership structure in IQSs, where head teachers are not always the same person as the school’s private proprietor. Although the size for the
sub-sample of head teachers in IQSs is too small to provide statistical robustness, the indication that seems to emerge is that when the head teachers are not also the proprietor they are less likely to
take action to improve teacher attendance90. It will be particularly important for the early learning intervention to ensure that the relevant chain of teaching responsibility within each school is clearly understood and its influence maximised when running the training.
Interestingly, the personal characteristics of the head teacher also seem to play a role in the action taken to improve the attendance of teachers. Having some form of qualification, or at least a Senior
Secondary Certificate Examination (SSCE) academic degree, is associated with a higher probability of taking action to improve teacher attendance. At the same time, and even more importantly in the context of GEP3, head teachers who have attended some form of training are reportedly more likely to take action to improve teacher attendance: the proportion of non-trained teachers who take
action is 63%, whilst the proportion of trained teachers who take action is 74%.
90 Amongst the 26 IQS head teachers observed who were reportedly also school proprietors, 18 (69%) declared that they took action to improve teacher attendance, whilst the proportion is approximately 50% for the non-proprietor head teachers.
Observed a lesson Take action to improve teacher attendance
0%
10%
20%
30%
40%
50%
60%
70%
80%
90%
100%
Under 25 25 to 34 35 to 49 Over 50
Evaluation of the Girl’s Education Project 3
© EDOREN 146
3.4.1.3 External monitoring
As part of the early learning intervention, regular monitoring visits by master trainers and
government staff are planned for. It is therefore interesting to examine at baseline whether the schools received any monitoring visits from government officials or other external agents during the last school year. According to head teacher accounts, almost 80% of schools received a monitoring visit. Amongst the schools that received the visits, the average number of visit per school is around eight. Visits were performed by a range of government agencies and schools were visited by multiple
visiting officers. Around two-thirds of schools were visited by an LGEA officer, with the two other most prevelant categories of visitors being SUBEB officers and representatives from NGOs and other donor agencies.
There appears to be a clear difference between IQSs and publicprimary schools in the level of external monitoring that they receive. Practically all public primary schools were found to receive
some monitoring visits, while only 58% of IQSs reported having received (any type of) monitoring
visit during the last school year. Moreover, amongst those schools that have received a visit, the number of visits again varies considerably between public primary schools and IQSs. The latter
reported having received just over three visits on average, whilst for the former the figure is over 11 visits. Over 50% of the IQSs received one or two monitoring visits. It will therefore be important to pay particular attention to monitoring patterns in IQSs so as to ensure that visits by GEP3 trainers
and other stakeholders occur as frequently as for public primary schools.
3.4.1.4 IQS integration
The early learning intervention will be implemented in 80 IQSs in Katsina and Zamfara. The teaching
conditions in IQSs differ significantly from those in public primary schools. As mentioned above, the number of teachers teaching integrated subjects at all levels in the IQSs included in our early learning
sample is just over two on average, which is considerably (but not surprisingly) lower than the
number in public primary schools, at just over 10 per school. The fraction of female teachers
amongst those teaching integrated subjects is much lower in IQSs, where only 4% of non-religious subject teachers are women (compared to 14% in public primary schools).
Across all 120 IQSs in our early learning sample, we found that 72% of schools are structured like a public primary school, 16% are structured into stages and 12% have a different structure. A stage
refers to a grouping in which pupils are taught the public primary school syllabus corresponding to their relevant grade. Amongst the group of IQSs that are structured into stages, the great majority report having three stages, which correspond to three levels – as compared to the public primary school structure, which has six levels. The graph below shows the distribution of these two school structure types (i.e. public primary schools structure vs. other stage composition) in IQSs.
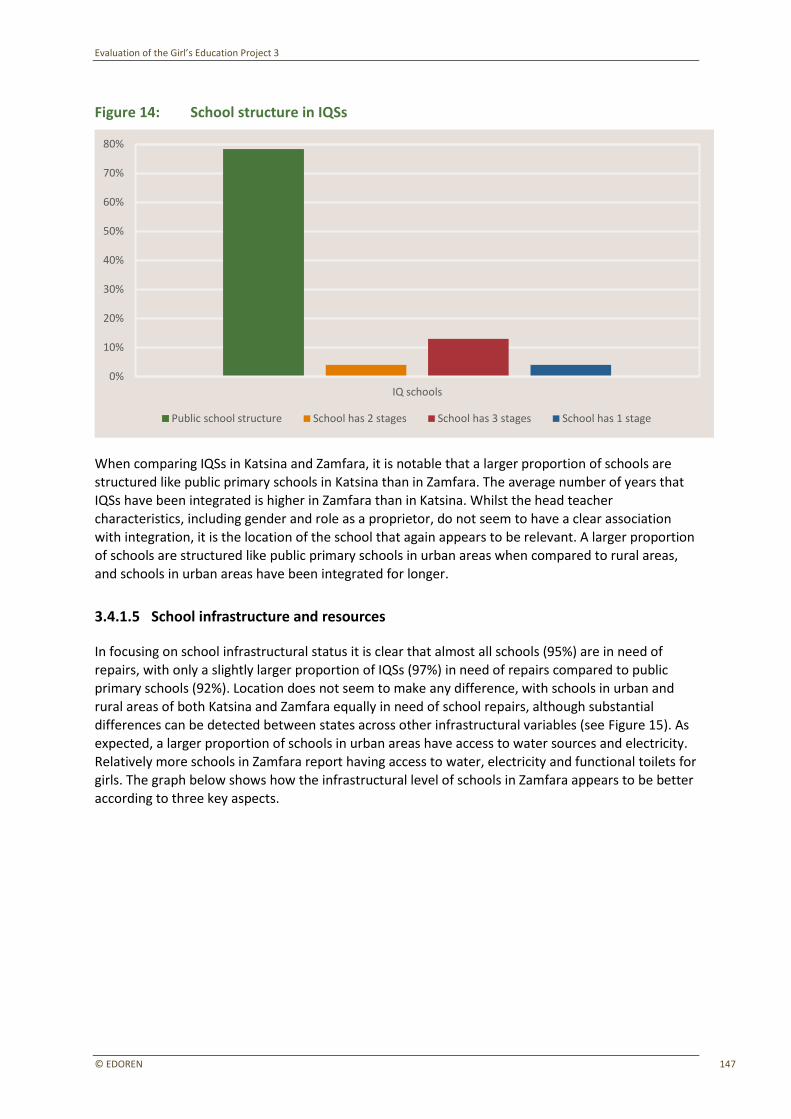
Evaluation of the Girl’s Education Project 3
© EDOREN 147
Figure 14: School structure in IQSs
When comparing IQSs in Katsina and Zamfara, it is notable that a larger proportion of schools are structured like public primary schools in Katsina than in Zamfara. The average number of years that
IQSs have been integrated is higher in Zamfara than in Katsina. Whilst the head teacher characteristics, including gender and role as a proprietor, do not seem to have a clear association with integration, it is the location of the school that again appears to be relevant. A larger proportion
of schools are structured like public primary schools in urban areas when compared to rural areas, and schools in urban areas have been integrated for longer.
3.4.1.5 School infrastructure and resources
In focusing on school infrastructural status it is clear that almost all schools (95%) are in need of repairs, with only a slightly larger proportion of IQSs (97%) in need of repairs compared to public primary schools (92%). Location does not seem to make any difference, with schools in urban and
rural areas of both Katsina and Zamfara equally in need of school repairs, although substantial differences can be detected between states across other infrastructural variables (see Figure 15). As expected, a larger proportion of schools in urban areas have access to water sources and electricity.
Relatively more schools in Zamfara report having access to water, electricity and functional toilets for girls. The graph below shows how the infrastructural level of schools in Zamfara appears to be better according to three key aspects.
IQ schools
0%
10%
20%
30%
40%
50%
60%
70%
80%
Public school structure School has 2 stages School has 3 stages School has 1 stage
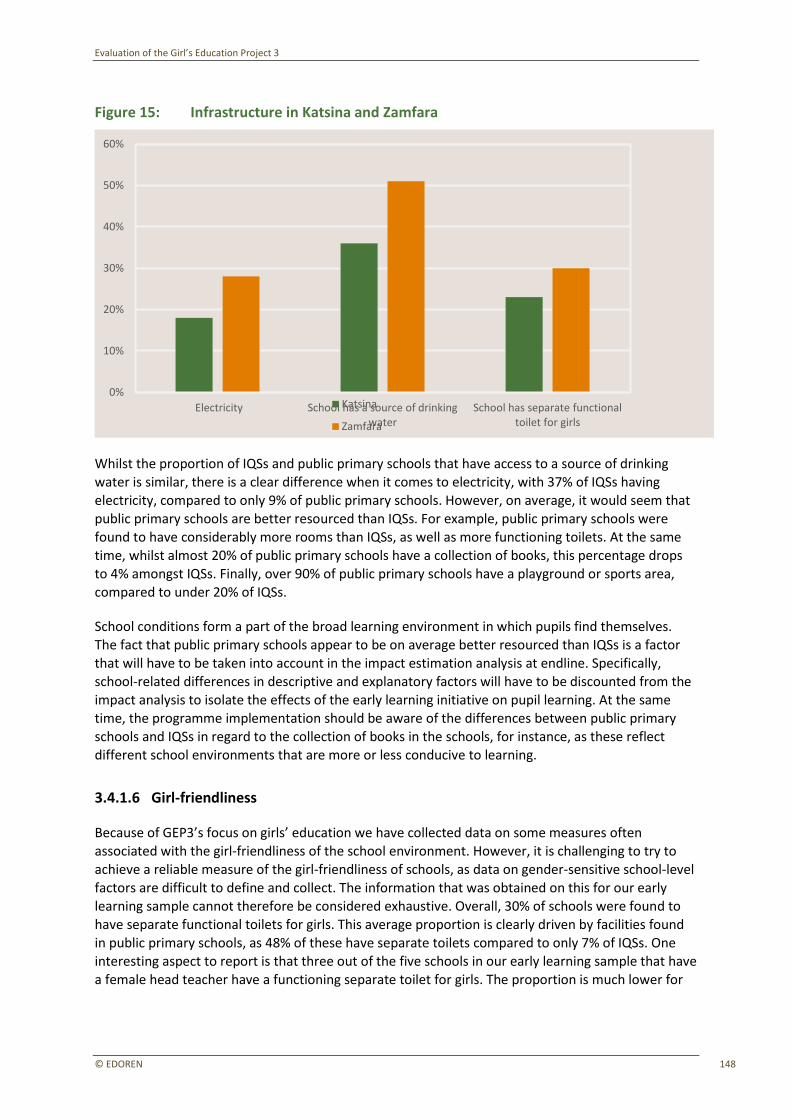
Evaluation of the Girl’s Education Project 3
© EDOREN 148
Figure 15: Infrastructure in Katsina and Zamfara
Whilst the proportion of IQSs and public primary schools that have access to a source of drinking water is similar, there is a clear difference when it comes to electricity, with 37% of IQSs having
electricity, compared to only 9% of public primary schools. However, on average, it would seem that public primary schools are better resourced than IQSs. For example, public primary schools were found to have considerably more rooms than IQSs, as well as more functioning toilets. At the same
time, whilst almost 20% of public primary schools have a collection of books, this percentage drops to 4% amongst IQSs. Finally, over 90% of public primary schools have a playground or sports area,
compared to under 20% of IQSs.
School conditions form a part of the broad learning environment in which pupils find themselves.
The fact that public primary schools appear to be on average better resourced than IQSs is a factor that will have to be taken into account in the impact estimation analysis at endline. Specifically,
school-related differences in descriptive and explanatory factors will have to be discounted from the impact analysis to isolate the effects of the early learning initiative on pupil learning. At the same
time, the programme implementation should be aware of the differences between public primary schools and IQSs in regard to the collection of books in the schools, for instance, as these reflect different school environments that are more or less conducive to learning.
3.4.1.6 Girl-friendliness
Because of GEP3’s focus on girls’ education we have collected data on some measures often associated with the girl-friendliness of the school environment. However, it is challenging to try to
achieve a reliable measure of the girl-friendliness of schools, as data on gender-sensitive school-level
factors are difficult to define and collect. The information that was obtained on this for our early
learning sample cannot therefore be considered exhaustive. Overall, 30% of schools were found to have separate functional toilets for girls. This average proportion is clearly driven by facilities found
in public primary schools, as 48% of these have separate toilets compared to only 7% of IQSs. One interesting aspect to report is that three out of the five schools in our early learning sample that have a female head teacher have a functioning separate toilet for girls. The proportion is much lower for
Electricity School has a source of drinking water
School has separate functional toilet for girls
0%
10%
20%
30%
40%
50%
60%
Katsina
Zamfara
Evaluation of the Girl’s Education Project 3
© EDOREN 149
the rest of the schools, which have a male head teacher (29%). Although of interest as anecdotal
evidence, the very small and unbalanced sample does not allow for any robust descriptive analysis of this trend.
Some differences are also observed when comparing Katsina with Zamfara, with schools in Katsina showing a higher ratio of girls to boys in P1 to P3 and overall (around 0.8) than Zamfara (around
0.6)91. Interestingly, whilst the average ratio of girls to boys in P1 to P3 was recorded as 0.73, the gender ratio reflecting those present on the day of the survey team’s visit to P2 classes was 1.8 on average. This may point towards a bias due to knowledge of the anticipated presence of surveyors in the school. Whilst the proportion of female pupils is relatively high, as already discussed the proportion of female teachers in our sampled schools was found to be low and this is corroborated
by the sub-sample of teachers specifically teaching integrated subjects, for which the proportion of female teachers is around 10%.
3.4.2 Teacher characteristics, knowledge, practice and motivations
This section reports on teacher characteristics, knowledge, practices and motivations. It begins by describing the teachers within the setting and then describes what they know and what they do in
their lessons. The baseline findings related to the knowledge, skills and practices of teachers are reported on. Findings related to the following key intermediary outcomes in the ToC are discussed -
teacher knowledge in literacy and language in the early grades, improved instruction skills in active learning and increased time on task, the use of Hausa-based teaching and learning materials, and Hausa-based teaching in the early grades. Teacher motivation and attitudes are also discussed as
these have an influence on the quality of teaching.
3.4.2.1 Teacher characteristics
Age, sex and language
The typical teacher teaching in the early grades is a 36-year-old male who speaks Hausa and English. More specifically, the great majority of teachers (85%) in the early learning sample are male. The ratio changes depending on the type of school: IQS facilitators are nearly all male, with only 3%
of facilitators being female, while across public primary schools about 20% of teachers are female. Interestingly, there also seems to be a difference between the two states, with a larger proportion of female teachers in Katsina than in Zamfara.92 Not surprisingly, a larger proportion of female teachers are also found in urban areas as compared to rural areas.
The average age of male teachers is slightly higher than female teachers, which is also detectable
when looking at the age group differentiation. Whilst 13% of male teachers are above 50 years of age, only 1% of female teachers belong to that older age group. Across all teachers, over 80% belongs to the age group spanning from 25 to 50 years, with only 6% younger than 25. When
comparing IQSs and public primary schools though, the proportion of young (below 25) teachers is
91 The ASC data confirm the higher ratio of girls to boys in Katsina compared to Zamfara. The ratio in P1–3 equals 0.78 in Katsina and 0.54 in Zamfara. 92 This is in line with the 2014–2015 ASC data, which report that 23% of primary school teachers in Katsina are female, compared to 15% in Zamfara.
Evaluation of the Girl’s Education Project 3
© EDOREN 150
considerably higher in IQSs (11%) than in public primary schools (4%). Conversely, there is a higher
proportion of older (above 50) teachers in public primary schools (13%) than in IQSs (9%).
When it comes to language, all teachers indicate that they speak Hausa, the great majority (85%) also state that they speak English, whilst only around one-fifth of teachers speak Arabic93. Not surprisingly, a relatively larger proportion of teachers speak Arabic in IQSs than in public primary
schools, as Arabic can be associated with the study of the Qur’an. At the same time, whilst around 90% of teachers claim to speak English in public primary schools, the percentage drops to around 70% in IQSs. There is no sizeable difference between teachers in Katsina and Zamfara when it comes to languages spoken.
Classes taught
All surveyed teachers (excluding head teachers) were teaching P1 to P3 or equivalent early level at the time of the baseline study. This is a feature of the sampling approach taken and is not
representative of teaching responsibilities in GEP3 schools. The following analysis provides
descriptions of early years teachers within our sample. A minority of them (around 30%) also taught P4 to P6 classes, thus being involved in both upper and lower levels of teaching. This was particularly prominent in Katsina, where 55% of teachers taught from P4 to P6, compared to only 17% in Zamfara. At the same time, whilst 41% of teachers in public primary schools were found to be
teaching at both upper and lower levels, this proportion drops to 5% in IQSs.
On average across public primary schools just under 50% of teachers are found to be teaching only one non-religious subject and around 20% of teachers teach more than two non-religious subjects.
There is a clear difference with IQSs, where the proportion of teachers that only teach one non-religious subject is almost 60% and only 10% teach more than two non-religious subjects.
Interestingly, the proportion of teachers teaching multiple non-religious subjects is considerably higher in Katsina than in Zamfara, where almost 60% of teachers only teach one non-religious subject, compared to just over 30% in Katsina. Finally, when specifically looking at IQSs, the data
show that amongst the integrated subjects, Hausa and Maths are taught by 50% of teachers, English
by just over 40%, whilst Social Studies and Basic Science are only taught by 5% and 2% of IQS teachers, respectively. This compares negatively to public primary schools, where 30% of teachers are found to teach Social Studies and around 25 percent teach Basic Science.
It is important to note that this information is derived from the teacher questionnaire which was
administered to our sample of public primary school and IQS teachers. However, information collected from head teachers on subjects taught in their schools shows a different picture at the school level, with over 90% of schools reportedly teaching Maths and Hausa, over 90% of schools teaching English and just over 50% of schools teaching Social Studies and Basic Science. The difference between the two types of schools is also marked in this case, with most public primary
schools reportedly teaching every core subject and only around 10% of IQSs teaching Social Studies and Basic Science. The proportion of IQSs teaching Maths and Hausa is over 90% and over 70% are reportedly teaching English. The divergent trend between public primary schools and IQSs is
consistent across the two sources of information.
93 Information on language was collected from teachers only but not from head teachers who also perform teaching duties. Similarly, information on teaching in early grades was collected from the same sample of teachers but not teaching head teachers.
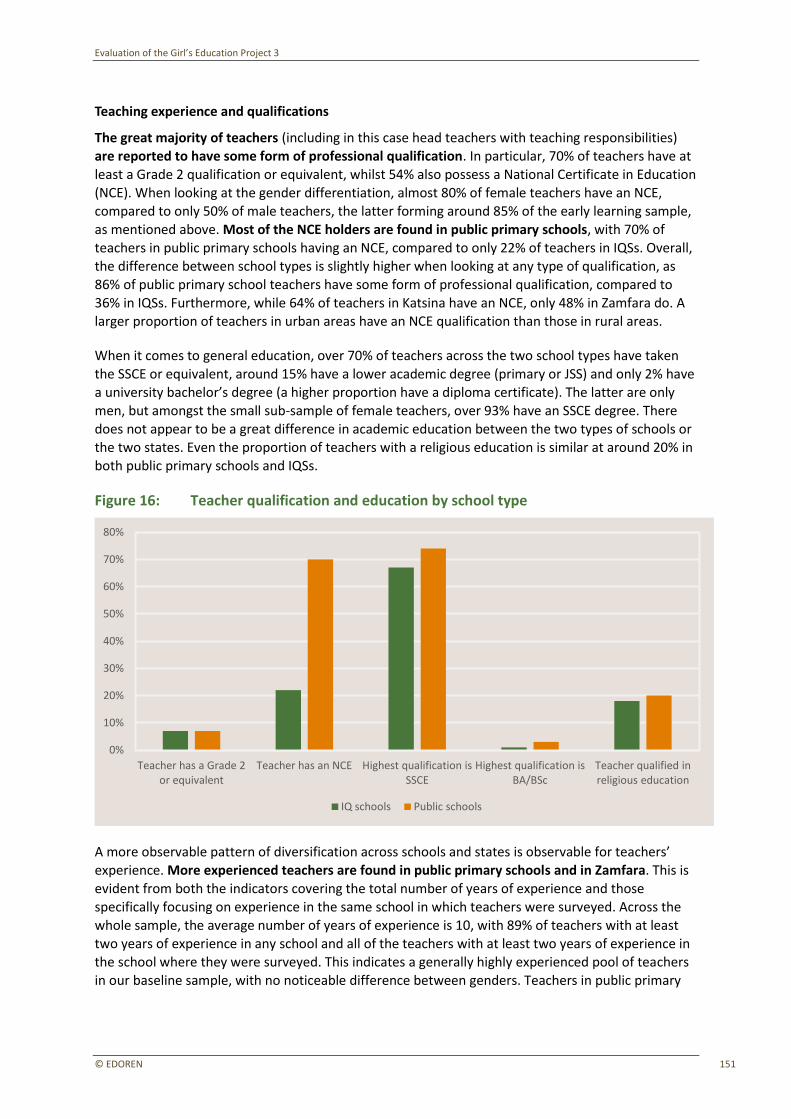
Evaluation of the Girl’s Education Project 3
© EDOREN 151
Teaching experience and qualifications
The great majority of teachers (including in this case head teachers with teaching responsibilities) are reported to have some form of professional qualification. In particular, 70% of teachers have at least a Grade 2 qualification or equivalent, whilst 54% also possess a National Certificate in Education (NCE). When looking at the gender differentiation, almost 80% of female teachers have an NCE, compared to only 50% of male teachers, the latter forming around 85% of the early learning sample,
as mentioned above. Most of the NCE holders are found in public primary schools, with 70% of teachers in public primary schools having an NCE, compared to only 22% of teachers in IQSs. Overall, the difference between school types is slightly higher when looking at any type of qualification, as 86% of public primary school teachers have some form of professional qualification, compared to 36% in IQSs. Furthermore, while 64% of teachers in Katsina have an NCE, only 48% in Zamfara do. A
larger proportion of teachers in urban areas have an NCE qualification than those in rural areas.
When it comes to general education, over 70% of teachers across the two school types have taken
the SSCE or equivalent, around 15% have a lower academic degree (primary or JSS) and only 2% have
a university bachelor’s degree (a higher proportion have a diploma certificate). The latter are only men, but amongst the small sub-sample of female teachers, over 93% have an SSCE degree. There does not appear to be a great difference in academic education between the two types of schools or
the two states. Even the proportion of teachers with a religious education is similar at around 20% in both public primary schools and IQSs.
Figure 16: Teacher qualification and education by school type
A more observable pattern of diversification across schools and states is observable for teachers’ experience. More experienced teachers are found in public primary schools and in Zamfara. This is
evident from both the indicators covering the total number of years of experience and those
specifically focusing on experience in the same school in which teachers were surveyed. Across the whole sample, the average number of years of experience is 10, with 89% of teachers with at least two years of experience in any school and all of the teachers with at least two years of experience in the school where they were surveyed. This indicates a generally highly experienced pool of teachers
in our baseline sample, with no noticeable difference between genders. Teachers in public primary
Teacher has a Grade 2 or equivalent
Teacher has an NCE Highest qualification is SSCE
Highest qualification is BA/BSc
Teacher qualified in religious education
0%
10%
20%
30%
40%
50%
60%
70%
80%
IQ schools Public schools

Evaluation of the Girl’s Education Project 3
© EDOREN 152
schools are more experienced than those in IQSs, with the average number of years as a teacher in
any school (including the school where they were surveyed) being over 11 years in public primary schools and under eight years in IQSs.
Just over 40% of teachers were found to have attended some form of training in the last two years. The proportion is slightly higher for men (43%) than women (37%), for teachers in Katsina (44%)
compared to those in Zamfara (41%), and is higher in IQSs (46%) than in public primary schools (41%). Interestingly, teachers who have undertaken training are also disproportionately represented amongst those teachers who receive some form of payment: 41% compared to 35%. Interestingly, a larger proportion of teachers are trained in rural areas, yet although this figure is a relative one it may also reflect the disproportionately large sub-sample of rural schools in our early learning
sample. What emerges clearly from the data is that teachers with some professional qualification are more likely to have received training, as almost half of teachers with a professional qualification have attended training, compared to just over 30% of non-qualified teachers. When the type of training received amongst the sub-sample of trained teachers was investigated the majority of the training
was reported to be on curriculum subjects and literacy and numeracy, with around 30% of teachers reportedly trained on school leadership and management and planning. Only around 20% of teachers were trained specifically on Hausa. Almost half of the training (47%) was conducted by UNICEF as
part of GEP, with the other organisers being government partner associations (e.g. SUBEBs and LGEAs). The assumption that training is relevant and targeted is a critical one and the fact that only
20% of teachers trained in the past attended Hausa courses may be an indication that there is more interest in other teaching and management-related subjects. However, it could also indicate that
Hausa courses were not offered. In any case, given the focus of the early learning intervention on Hausa literacy teaching and learning outcomes it will be important to ensure a strong focus on training specifically on Hausa for early learning training.
3.4.2.2 What teachers know and do
This section of the report describes teachers’ knowledge and skills and practices, as collected through three primary sources: a teacher assessment, a classroom observation and a teacher
questionnaire. Teachers’ knowledge and skills refers to teachers’ proficiencies as per the subscales drawn from the teacher assessment and a qualitative review of teachers’ responses to open ended questions within the assessment. Teacher practices refers to the practices of teachers in the classroom, as observed through classroom observation. Teacher practices were categorised into
three categories: teacher talk, teacher action and pupil action. The section then reports on the baseline values of related intermediary outcomes in the early learning intervention ToC.
What do teachers know?
The teacher knowledge and skills test was divided into three sections, collectively comprising 30 items, including multiple choice, short response and long response items. In section one teachers were asked to mark pupils’ responses to Hausa literacy questions and to indicate the grade level at
which the answer should be known by pupils, as defined by the curriculum. In section two teachers were asked to fill in missing information in order to prepare an answer sheet for a reading test aimed at Grade 2 pupils. Teachers were provided with two newspaper articles and asked to fill in missing
information, including basic comprehension questions and questions that require the interpretation of words and phrases. Section three asked teachers to identify poor and good pupils’ work and to review pupils’ work in order to make judgements about pupils’ writing, including the organisation of the writing, the use of grammar, punctuation, spelling, the pupils’ ability to self-correct and reflect
Evaluation of the Girl’s Education Project 3
© EDOREN 153
on their writing and the pupils’ ability to form letters and use spaces between words. Teachers were
then asked to describe how they might support the pupils in improving their writing.
Defining teacher competence
The percentage of teachers who demonstrate minimum teaching knowledge in literacy and language is made up of the six subscales developed from the teacher assessment.
Thresholds were defined for each subscale to differentiate between teacher proficiency levels.
Two cut-off points were defined for each scale to create three proficiency levels per scale. The proficiency levels include low band – no evidence of skill, middle band – evidence of rudimentary skill, and upper band – evidence of competence.
As can be seen in Figure 17, in the majority of areas there was no evidence that teachers have the
knowledge and skills required to teach effectively. Rudimentary levels of skills were observed in a small proportion of the assessed teachers in identifying low performers, evidencing judgements and diagnosing writing skills and interpreting words and phrases. Less than 3% of teachers were found to
be competent in identifying low performers and interpreting words and phrases. A greater proportion of teachers were able to display knowledge and skills in Grade 2 Hausa and in
comprehension than in other areas of teacher knowledge and skills. However, in absolute terms, the share of teachers who were able to display competence in this area was fairly low, at just 40%.
Furthermore, it is important to stress that the levels of Hausa assessed were benchmarked to Grade 1- and 2-level Hausa knowledge. Items tested included basic grammar and the initial letters of everyday objects and animals.
The finding that over 60% of teachers were unable to display competence in Grade 1- and 2-level Hausa is highly significant for an early learning intervention that focuses on teaching in Hausa. This
is recognised in the early learning ToC: one of the assumptions in the ToC is that teachers are literate in Hausa. The education literature indicates that two key determinants of teachers’ ability to raise
pupil learning are their behavioural skills (teaching style and behavioural skills) and their own
competence (Dundar et al. 2014). This implies that teachers who lack competence in early grade-level Hausa are unlikely to be able to teach this subject to pupils. In line with this finding, the baseline findings highlight that the RANA intervention will need to focus not just on pedagogical and curriculum knowledge, but also on subject knowledge, including of P1 and P2-level Hausa.
Another notable finding is that no teachers in the early learning schools are competent in
evidencing judgements and diagnosing pupils’ work or writing. There is a very strong and long-standing perspective in educational research that a student learns best when teaching is targeted to what s/he is ready to learn. Psychologist Lev Vygotsky proposed this 90 years ago (known as the ‘zone of proximal development’, Vygotsky 1997). This concept has been mainstreamed in educational theory and practice since the 1970s and it is widely recognised that teachers should
target teaching based on reliable evidence of what students know and are ready to learn (Griffin 2014; Masters 2013 p.15; Anderson and Scamporlino 2013; Centre for Education Statistics and
Evaluation 2015).
The American psychologist David Paul Ausubel has stated: ‘If I had to reduce all of educational psychology to just one principle, I would say this: the most important single factor influencing
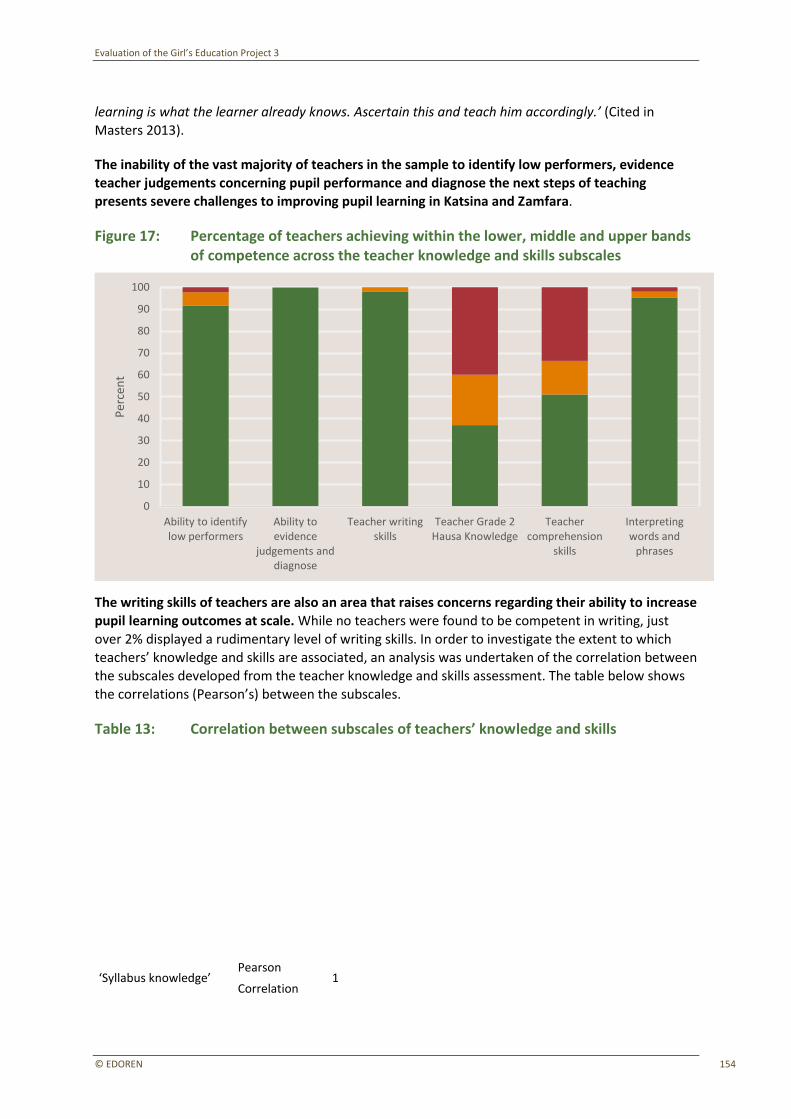
Evaluation of the Girl’s Education Project 3
© EDOREN 154
learning is what the learner already knows. Ascertain this and teach him accordingly.’ (Cited in
Masters 2013).
The inability of the vast majority of teachers in the sample to identify low performers, evidence teacher judgements concerning pupil performance and diagnose the next steps of teaching presents severe challenges to improving pupil learning in Katsina and Zamfara.
Figure 17: Percentage of teachers achieving within the lower, middle and upper bands of competence across the teacher knowledge and skills subscales
The writing skills of teachers are also an area that raises concerns regarding their ability to increase pupil learning outcomes at scale. While no teachers were found to be competent in writing, just
over 2% displayed a rudimentary level of writing skills. In order to investigate the extent to which teachers’ knowledge and skills are associated, an analysis was undertaken of the correlation between the subscales developed from the teacher knowledge and skills assessment. The table below shows
the correlations (Pearson’s) between the subscales.
Table 13: Correlation between subscales of teachers’ knowledge and skills
Sylla
bu
s K
no
wle
dge
Ab
ility
to
ide
nti
fy lo
w p
erf
orm
ers
Ab
ility
to
evi
de
nce
jud
gem
en
ts a
nd
dia
gno
se
Teac
he
r w
riti
ng
skill
s
Teac
he
r H
ausa
kn
ow
led
ge
Teac
he
r co
mp
reh
en
sio
n s
kills
Inte
rpre
tin
g w
ord
s an
d p
hra
ses
‘Syllabus knowledge’ Pearson
Correlation 1
Ability to identify low performers
Ability to evidence
judgements and diagnose
Teacher writing skills
Teacher Grade 2 Hausa Knowledge
Teacher comprehension
skills
Interpreting words and
phrases
0
10
20
30
40
50
60
70
80
90
100
Per
cen
t
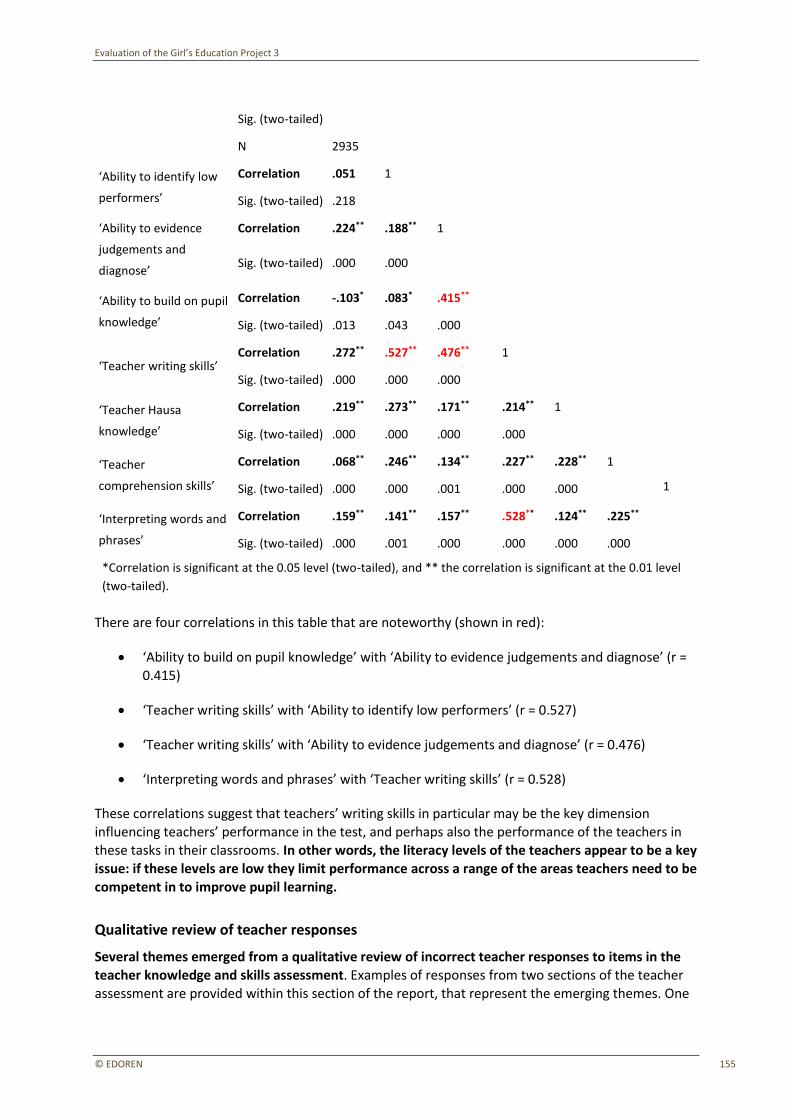
Evaluation of the Girl’s Education Project 3
© EDOREN 155
Sig. (two-tailed)
N 2935
‘Ability to identify low
performers’
Correlation .051 1
Sig. (two-tailed) .218
‘Ability to evidence
judgements and
diagnose’
Correlation .224** .188** 1
Sig. (two-tailed) .000 .000
‘Ability to build on pupil
knowledge’
Correlation -.103* .083* .415**
Sig. (two-tailed) .013 .043 .000
‘Teacher writing skills’ Correlation .272** .527** .476** 1
Sig. (two-tailed) .000 .000 .000
‘Teacher Hausa
knowledge’
Correlation .219** .273** .171** .214** 1
Sig. (two-tailed) .000 .000 .000 .000
‘Teacher
comprehension skills’
Correlation .068** .246** .134** .227** .228** 1
Sig. (two-tailed) .000 .000 .001 .000 .000 1
‘Interpreting words and
phrases’
Correlation .159** .141** .157** .528** .124** .225**
Sig. (two-tailed) .000 .001 .000 .000 .000 .000
*Correlation is significant at the 0.05 level (two-tailed), and ** the correlation is significant at the 0.01 level
(two-tailed).
There are four correlations in this table that are noteworthy (shown in red):
• ‘Ability to build on pupil knowledge’ with ‘Ability to evidence judgements and diagnose’ (r = 0.415)
• ‘Teacher writing skills’ with ‘Ability to identify low performers’ (r = 0.527)
• ‘Teacher writing skills’ with ‘Ability to evidence judgements and diagnose’ (r = 0.476)
• ‘Interpreting words and phrases’ with ‘Teacher writing skills’ (r = 0.528)
These correlations suggest that teachers’ writing skills in particular may be the key dimension influencing teachers’ performance in the test, and perhaps also the performance of the teachers in these tasks in their classrooms. In other words, the literacy levels of the teachers appear to be a key issue: if these levels are low they limit performance across a range of the areas teachers need to be
competent in to improve pupil learning.
Qualitative review of teacher responses
Several themes emerged from a qualitative review of incorrect teacher responses to items in the teacher knowledge and skills assessment. Examples of responses from two sections of the teacher assessment are provided within this section of the report, that represent the emerging themes. One
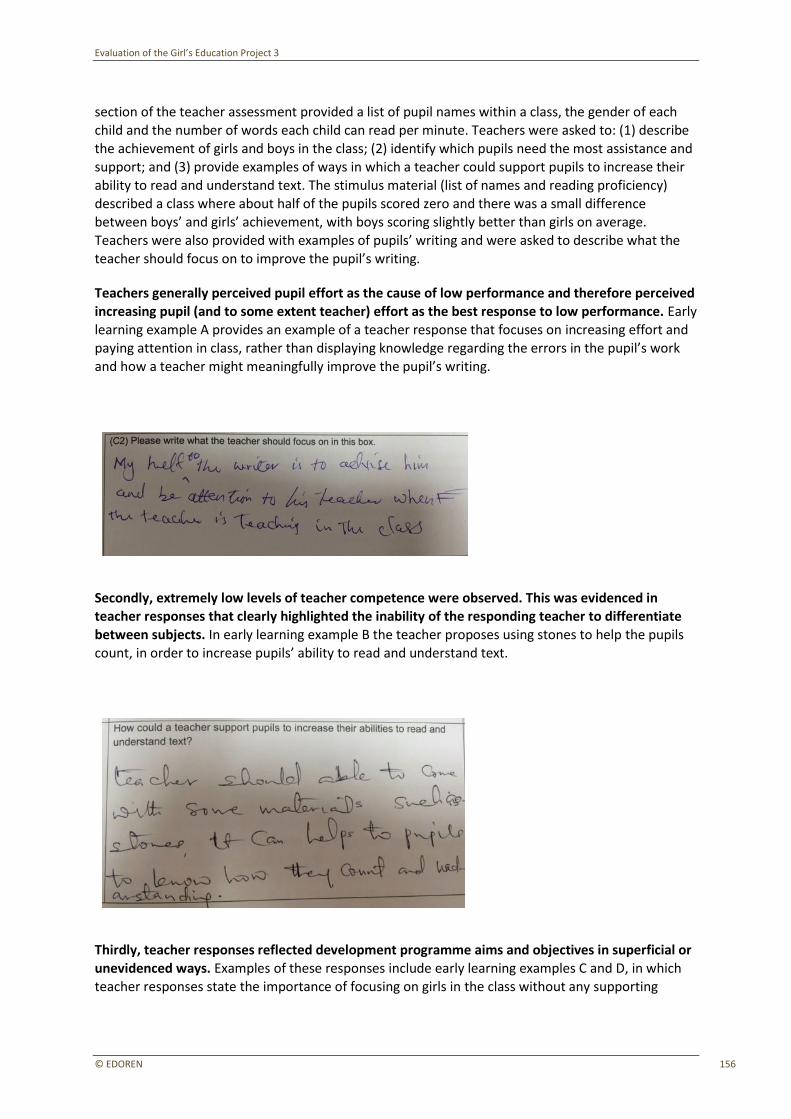
Evaluation of the Girl’s Education Project 3
© EDOREN 156
section of the teacher assessment provided a list of pupil names within a class, the gender of each
child and the number of words each child can read per minute. Teachers were asked to: (1) describe the achievement of girls and boys in the class; (2) identify which pupils need the most assistance and support; and (3) provide examples of ways in which a teacher could support pupils to increase their ability to read and understand text. The stimulus material (list of names and reading proficiency)
described a class where about half of the pupils scored zero and there was a small difference between boys’ and girls’ achievement, with boys scoring slightly better than girls on average. Teachers were also provided with examples of pupils’ writing and were asked to describe what the teacher should focus on to improve the pupil’s writing.
Teachers generally perceived pupil effort as the cause of low performance and therefore perceived
increasing pupil (and to some extent teacher) effort as the best response to low performance. Early learning example A provides an example of a teacher response that focuses on increasing effort and paying attention in class, rather than displaying knowledge regarding the errors in the pupil’s work and how a teacher might meaningfully improve the pupil’s writing.
Early learning example A: Student effort
Secondly, extremely low levels of teacher competence were observed. This was evidenced in
teacher responses that clearly highlighted the inability of the responding teacher to differentiate
between subjects. In early learning example B the teacher proposes using stones to help the pupils count, in order to increase pupils’ ability to read and understand text.
Early learning example B: Differentiating between subjects
Thirdly, teacher responses reflected development programme aims and objectives in superficial or unevidenced ways. Examples of these responses include early learning examples C and D, in which teacher responses state the importance of focusing on girls in the class without any supporting
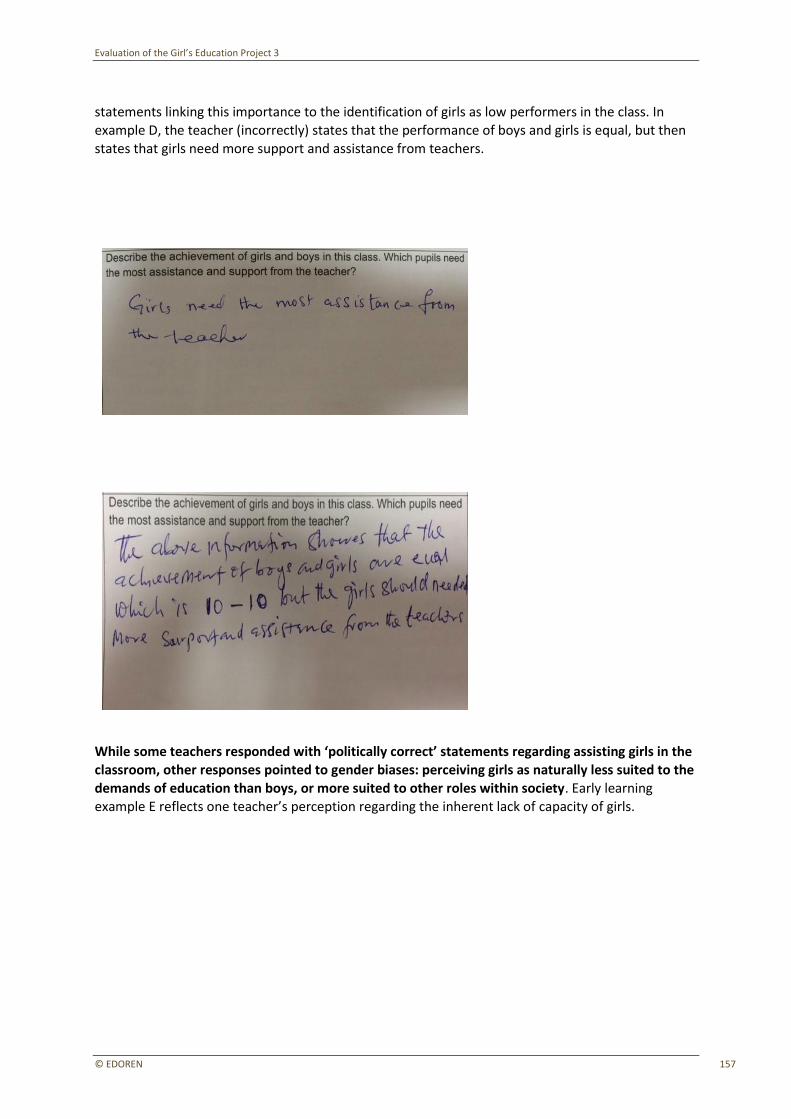
Evaluation of the Girl’s Education Project 3
© EDOREN 157
statements linking this importance to the identification of girls as low performers in the class. In
example D, the teacher (incorrectly) states that the performance of boys and girls is equal, but then states that girls need more support and assistance from teachers.
Early learning example C: Assisting girls
Early learning example D: Assisting girls
While some teachers responded with ‘politically correct’ statements regarding assisting girls in the
classroom, other responses pointed to gender biases: perceiving girls as naturally less suited to the demands of education than boys, or more suited to other roles within society. Early learning example E reflects one teacher’s perception regarding the inherent lack of capacity of girls.
Early learning example E: Girls’ education and Gender roles
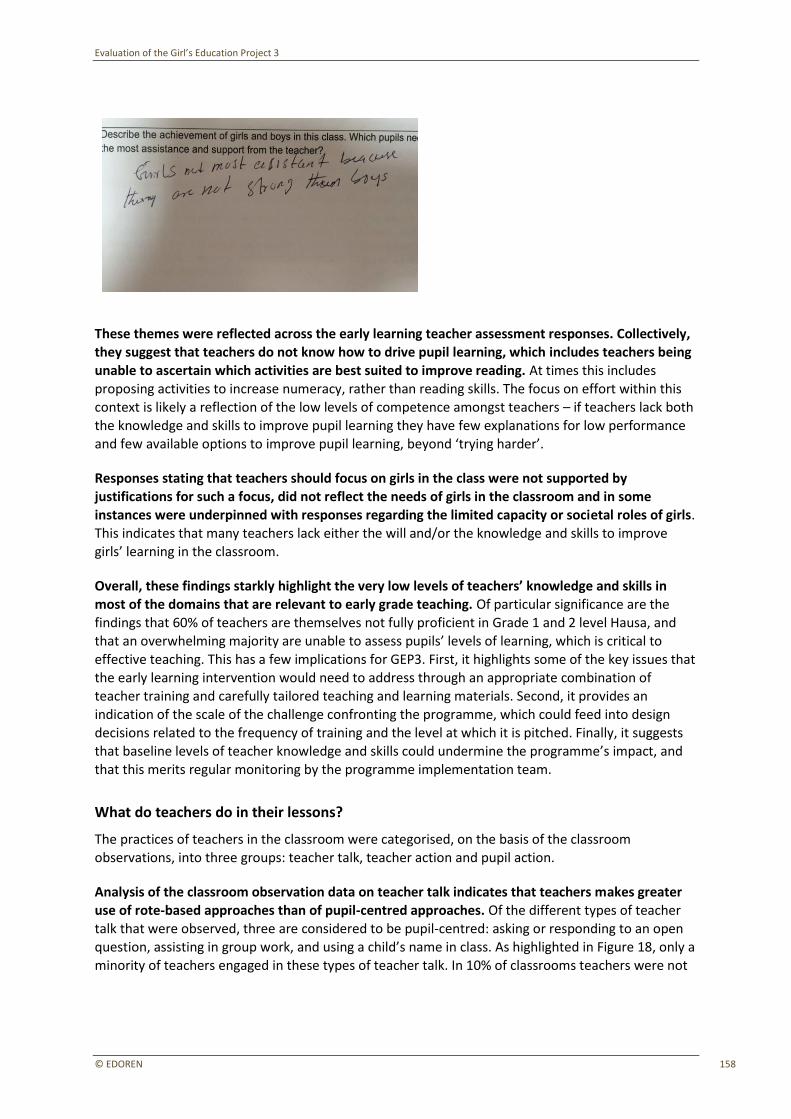
Evaluation of the Girl’s Education Project 3
© EDOREN 158
These themes were reflected across the early learning teacher assessment responses. Collectively, they suggest that teachers do not know how to drive pupil learning, which includes teachers being
unable to ascertain which activities are best suited to improve reading. At times this includes proposing activities to increase numeracy, rather than reading skills. The focus on effort within this context is likely a reflection of the low levels of competence amongst teachers – if teachers lack both the knowledge and skills to improve pupil learning they have few explanations for low performance
and few available options to improve pupil learning, beyond ‘trying harder’.
Responses stating that teachers should focus on girls in the class were not supported by
justifications for such a focus, did not reflect the needs of girls in the classroom and in some instances were underpinned with responses regarding the limited capacity or societal roles of girls.
This indicates that many teachers lack either the will and/or the knowledge and skills to improve girls’ learning in the classroom.
Overall, these findings starkly highlight the very low levels of teachers’ knowledge and skills in
most of the domains that are relevant to early grade teaching. Of particular significance are the
findings that 60% of teachers are themselves not fully proficient in Grade 1 and 2 level Hausa, and that an overwhelming majority are unable to assess pupils’ levels of learning, which is critical to effective teaching. This has a few implications for GEP3. First, it highlights some of the key issues that
the early learning intervention would need to address through an appropriate combination of teacher training and carefully tailored teaching and learning materials. Second, it provides an
indication of the scale of the challenge confronting the programme, which could feed into design decisions related to the frequency of training and the level at which it is pitched. Finally, it suggests that baseline levels of teacher knowledge and skills could undermine the programme’s impact, and
that this merits regular monitoring by the programme implementation team.
What do teachers do in their lessons?
The practices of teachers in the classroom were categorised, on the basis of the classroom
observations, into three groups: teacher talk, teacher action and pupil action.
Analysis of the classroom observation data on teacher talk indicates that teachers makes greater
use of rote-based approaches than of pupil-centred approaches. Of the different types of teacher talk that were observed, three are considered to be pupil-centred: asking or responding to an open question, assisting in group work, and using a child’s name in class. As highlighted in Figure 18, only a minority of teachers engaged in these types of teacher talk. In 10% of classrooms teachers were not
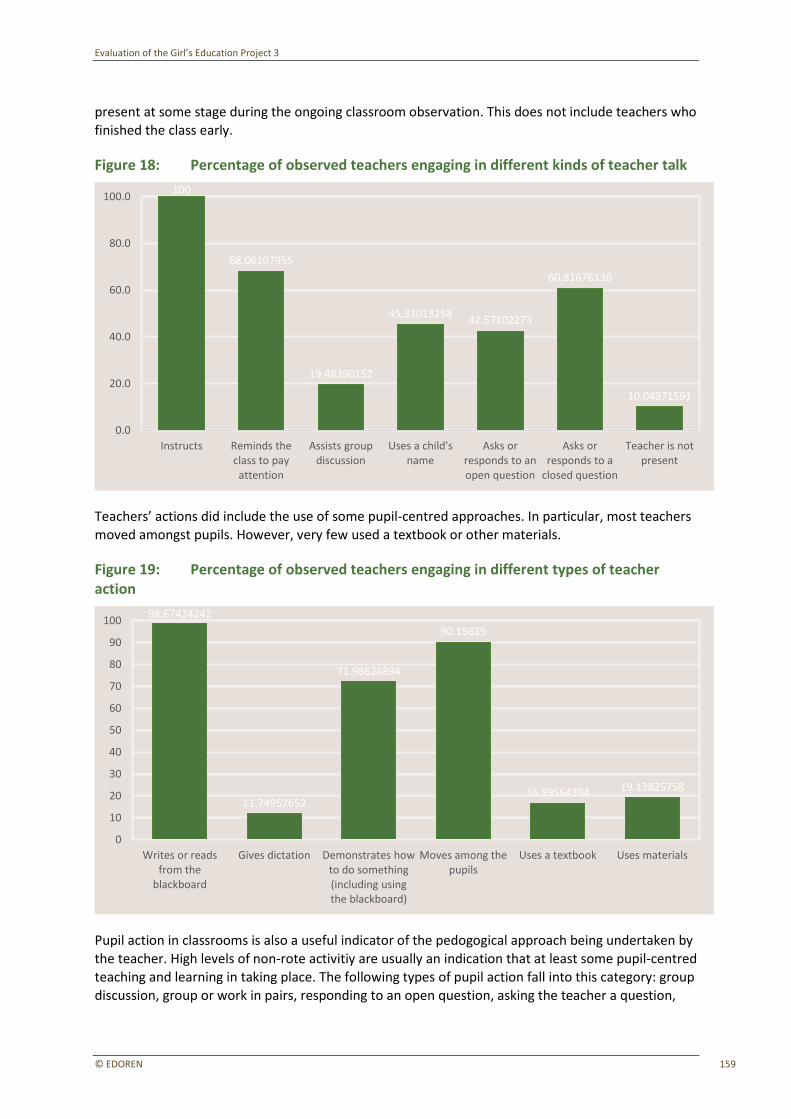
Evaluation of the Girl’s Education Project 3
© EDOREN 159
present at some stage during the ongoing classroom observation. This does not include teachers who
finished the class early.
Figure 18: Percentage of observed teachers engaging in different kinds of teacher talk
Teachers’ actions did include the use of some pupil-centred approaches. In particular, most teachers moved amongst pupils. However, very few used a textbook or other materials.
Figure 19: Percentage of observed teachers engaging in different types of teacher action
Pupil action in classrooms is also a useful indicator of the pedogogical approach being undertaken by
the teacher. High levels of non-rote activitiy are usually an indication that at least some pupil-centred teaching and learning in taking place. The following types of pupil action fall into this category: group discussion, group or work in pairs, responding to an open question, asking the teacher a question,
100
68.06107955
19.48390152
45.3101325842.57102273
60.81676136
10.04971591
Instructs Reminds the class to pay
attention
Assists group discussion
Uses a child's name
Asks or responds to an open question
Asks or responds to a
closed question
Teacher is not present
0.0
20.0
40.0
60.0
80.0
100.0
98.67424242
11.74952652
71.98626894
90.15625
16.59564394 19.13825758
Writes or reads from the
blackboard
Gives dictation Demonstrates how to do something (including using the blackboard)
Moves among the pupils
Uses a textbook Uses materials
0
10
20
30
40
50
60
70
80
90
100

Evaluation of the Girl’s Education Project 3
© EDOREN 160
using a textbook, reading aloud, and doing individual work. This is in contrast to chanting, listening,
and responding to closed questions. As shown in Figure 20, the use of rote-based approaches was more prevalent than the use of non-rote activities. In particular, group discussion, group work and instances of children asking the teacher a question were observed in a very small minority of classrooms.
Figure 20: Percentage of classrooms where pupils engaged in different types of pupil action
3.4.2.3 Teachers’ knowledge, skills and practices as per the ToC
The main causal assumption underlying the ToC for the RANA intervention is that literacy learning
outcomes, particularly in the Hausa mother tongue, will improve in early grades if teaching practices improve through the use of improved teaching and learning materials and the presence of more knowledgeable and skilled teachers. As represented in the ToC diagram in Section Intervention logic, the first causal chain states that the training and mentoring of lead teachers and head teachers will
lead to an increase in teachers’ knowledge in literacy and language acquisition in the early grades and an improvement in teachers’ instruction skills, including the use of gender-sensitive teaching practices. This will, in turn, lead to an improvement in Hausa-based literacy teaching in the early grades. The second causal chain states that the distribution of the RANA Literacy Pack will lead to an increased use of Hausa-based teaching and learning materials, which will also improve the Hausa-
based literacy teaching in the early grades. This subsection reports on the intermediary outcomes for these two causal chains.
Teacher knowledge in literacy and language acquisition in the early grades
As discussed in Section Outcome measurement and constructs, teachers draw on three types of
knowledge within classroom practice. Subject knowledge refers to knowledge of the essential questions of the subject, the networks of concepts, theoretical framework and methods of inquiry. Pedagogical knowledge refers to knowledge of the learners in the setting, knowledge of how to provide the conditions that enable pupils to understand content, and the selection of learning and assessment materials. Curriculum knowledge refers to knowledge about what should be taught to a
56.69507576
18.9962121220.19886364
43.21969697
61.14820076
8.2694128792.788825758
60.17282197
38.23153409
60.17282197
89.37026515
0
10
20
30
40
50
60
70
80
90
100

Evaluation of the Girl’s Education Project 3
© EDOREN 161
group of students, knowledge of the national syllabus, understanding of the school and grade-level
planning documents and knowledge of the content of examinations.
Based on this model, three composite indices were created from the data – one for each of these knowledge types. The subject knowledge of teachers is measured through a composite index of teachers’ writing skills, teachers’ Hausa skills, teachers’ comprehension skills and teachers’ ability to
interpret words and phrases. The pedagogical knowledge of teachers is measured through a composite index of teachers’ ability to identify low performers and evidence judgements and diagnose learning gaps. The curriculum knowledge of teachers is measured through the syllabus knowledge subscale developed from the teacher knowledge and skills assessment. The absolute values of teachers’ scores on these indices are not inherently informative, but rather provide
baseline values to assess improvements over time. However, differences in scores between groups are of interest at baseline. The share of teachers who scored zero on these indices is also worth noting.
Levels of pedagogical knowledge at baseline were extremely low, with over 90% of teachers scoring zero on the relevant composite index (see Figure 21). This indicates that the vast majority of teachers were unable to demonstrate proficiency in knowledge of the learners in the setting,
knowledge of how to provide the conditions that enable pupils to understand, and in the selection of appropriate learning and teaching materials (pedagogical knowledge). There were very few differences in levels of pedagogical knowledge across different groups of teachers. Teachers with a
professional education qualification demonstrated slightly higher levels of pedagogical knowledge than those without one, although the difference was small. There were no clear patterns by school
type or state, and teachers who had previously attended GEP3/UNICEF training demonstrated similar levels of knowledge to those who had not.
Levels of subject knowledge were also low, with some variation across groups of teachers. Overall,
just over one-fifth of teachers were unable to demonstrate any proficiency in the essential questions, concepts and methods of enquiry in literacy and language (subject knowledge). Teachers in public
primary schools demonstrated slightly better subject knowledge than those in IQSs. Teachers in Katsina did slightly better than those in Zamfara, and teachers with a professional education
qualification performed slightly better than those without one. There were no clear differences in the subject knowledge of teachers by state or by attendance at GEP/UNICEF training.
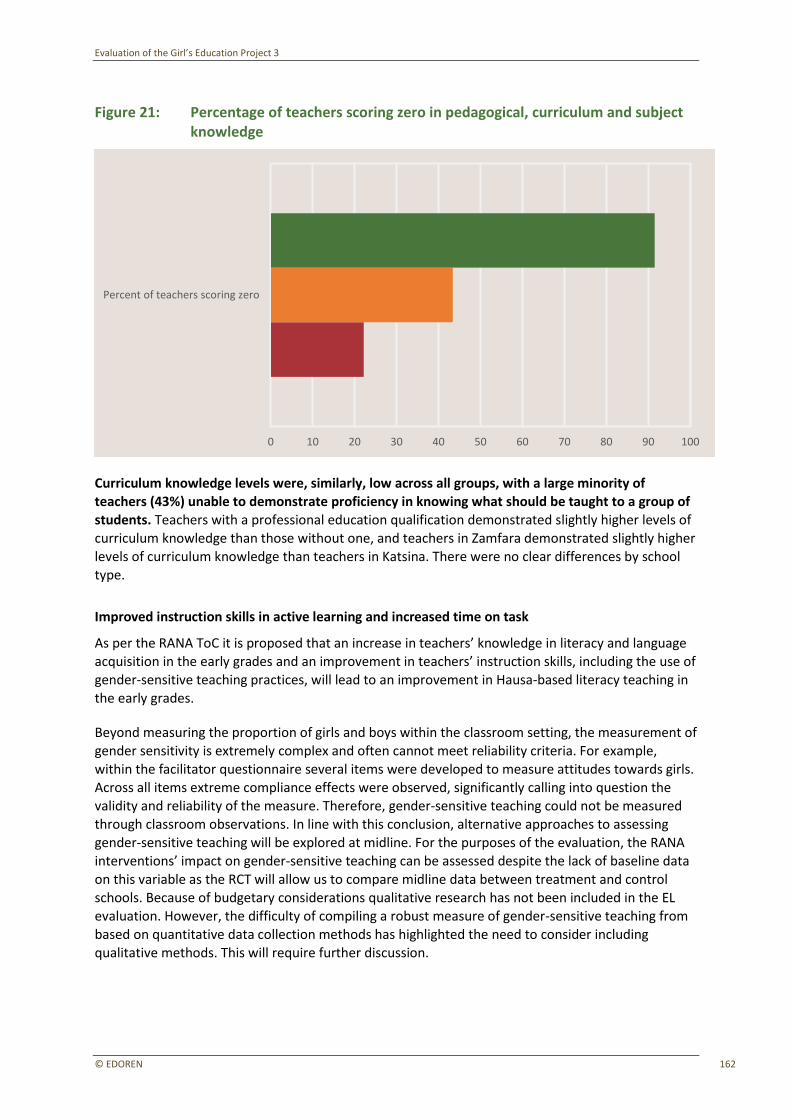
Evaluation of the Girl’s Education Project 3
© EDOREN 162
Figure 21: Percentage of teachers scoring zero in pedagogical, curriculum and subject knowledge
Curriculum knowledge levels were, similarly, low across all groups, with a large minority of
teachers (43%) unable to demonstrate proficiency in knowing what should be taught to a group of students. Teachers with a professional education qualification demonstrated slightly higher levels of
curriculum knowledge than those without one, and teachers in Zamfara demonstrated slightly higher levels of curriculum knowledge than teachers in Katsina. There were no clear differences by school type.
Improved instruction skills in active learning and increased time on task
As per the RANA ToC it is proposed that an increase in teachers’ knowledge in literacy and language acquisition in the early grades and an improvement in teachers’ instruction skills, including the use of gender-sensitive teaching practices, will lead to an improvement in Hausa-based literacy teaching in
the early grades.
Beyond measuring the proportion of girls and boys within the classroom setting, the measurement of gender sensitivity is extremely complex and often cannot meet reliability criteria. For example, within the facilitator questionnaire several items were developed to measure attitudes towards girls. Across all items extreme compliance effects were observed, significantly calling into question the
validity and reliability of the measure. Therefore, gender-sensitive teaching could not be measured through classroom observations. In line with this conclusion, alternative approaches to assessing gender-sensitive teaching will be explored at midline. For the purposes of the evaluation, the RANA interventions’ impact on gender-sensitive teaching can be assessed despite the lack of baseline data
on this variable as the RCT will allow us to compare midline data between treatment and control schools. Because of budgetary considerations qualitative research has not been included in the EL evaluation. However, the difficulty of compiling a robust measure of gender-sensitive teaching from
based on quantitative data collection methods has highlighted the need to consider including qualitative methods. This will require further discussion.
Percent of teachers scoring zero
0 10 20 30 40 50 60 70 80 90 100
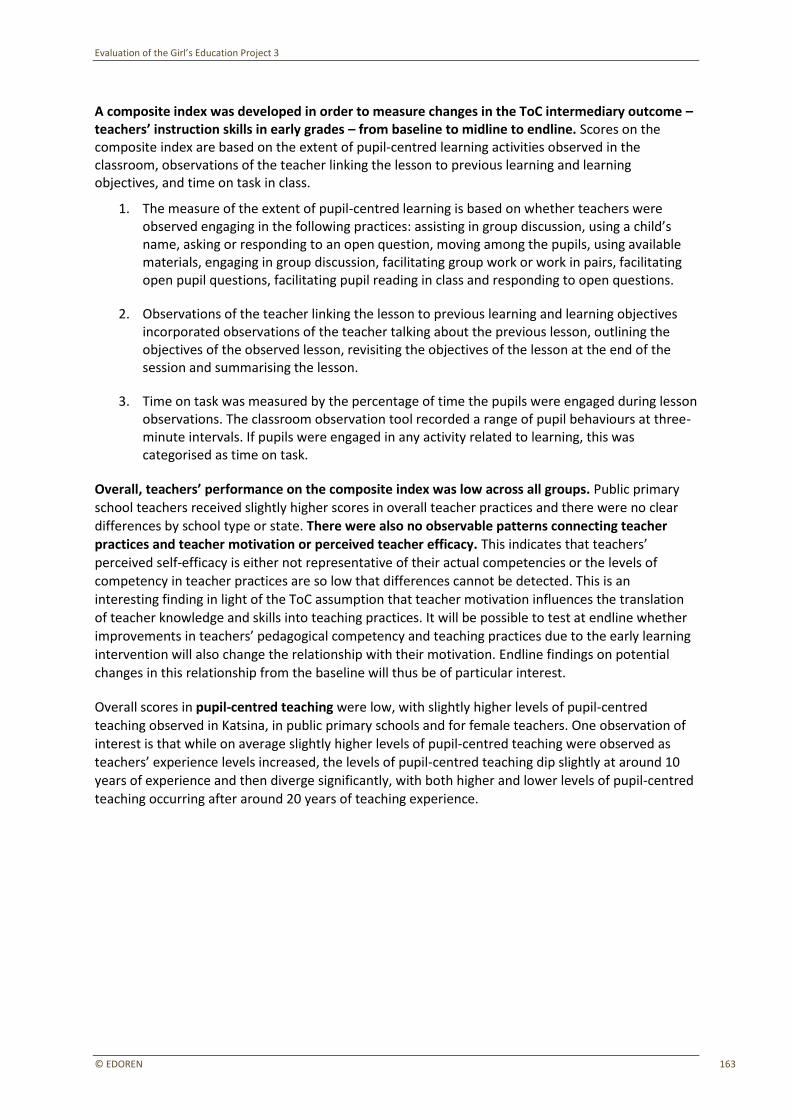
Evaluation of the Girl’s Education Project 3
© EDOREN 163
A composite index was developed in order to measure changes in the ToC intermediary outcome – teachers’ instruction skills in early grades – from baseline to midline to endline. Scores on the composite index are based on the extent of pupil-centred learning activities observed in the classroom, observations of the teacher linking the lesson to previous learning and learning objectives, and time on task in class.
1. The measure of the extent of pupil-centred learning is based on whether teachers were observed engaging in the following practices: assisting in group discussion, using a child’s name, asking or responding to an open question, moving among the pupils, using available materials, engaging in group discussion, facilitating group work or work in pairs, facilitating open pupil questions, facilitating pupil reading in class and responding to open questions.
2. Observations of the teacher linking the lesson to previous learning and learning objectives incorporated observations of the teacher talking about the previous lesson, outlining the objectives of the observed lesson, revisiting the objectives of the lesson at the end of the session and summarising the lesson.
3. Time on task was measured by the percentage of time the pupils were engaged during lesson observations. The classroom observation tool recorded a range of pupil behaviours at three-minute intervals. If pupils were engaged in any activity related to learning, this was categorised as time on task.
Overall, teachers’ performance on the composite index was low across all groups. Public primary
school teachers received slightly higher scores in overall teacher practices and there were no clear differences by school type or state. There were also no observable patterns connecting teacher
practices and teacher motivation or perceived teacher efficacy. This indicates that teachers’ perceived self-efficacy is either not representative of their actual competencies or the levels of competency in teacher practices are so low that differences cannot be detected. This is an
interesting finding in light of the ToC assumption that teacher motivation influences the translation of teacher knowledge and skills into teaching practices. It will be possible to test at endline whether
improvements in teachers’ pedagogical competency and teaching practices due to the early learning intervention will also change the relationship with their motivation. Endline findings on potential
changes in this relationship from the baseline will thus be of particular interest.
Overall scores in pupil-centred teaching were low, with slightly higher levels of pupil-centred
teaching observed in Katsina, in public primary schools and for female teachers. One observation of interest is that while on average slightly higher levels of pupil-centred teaching were observed as
teachers’ experience levels increased, the levels of pupil-centred teaching dip slightly at around 10 years of experience and then diverge significantly, with both higher and lower levels of pupil-centred teaching occurring after around 20 years of teaching experience.
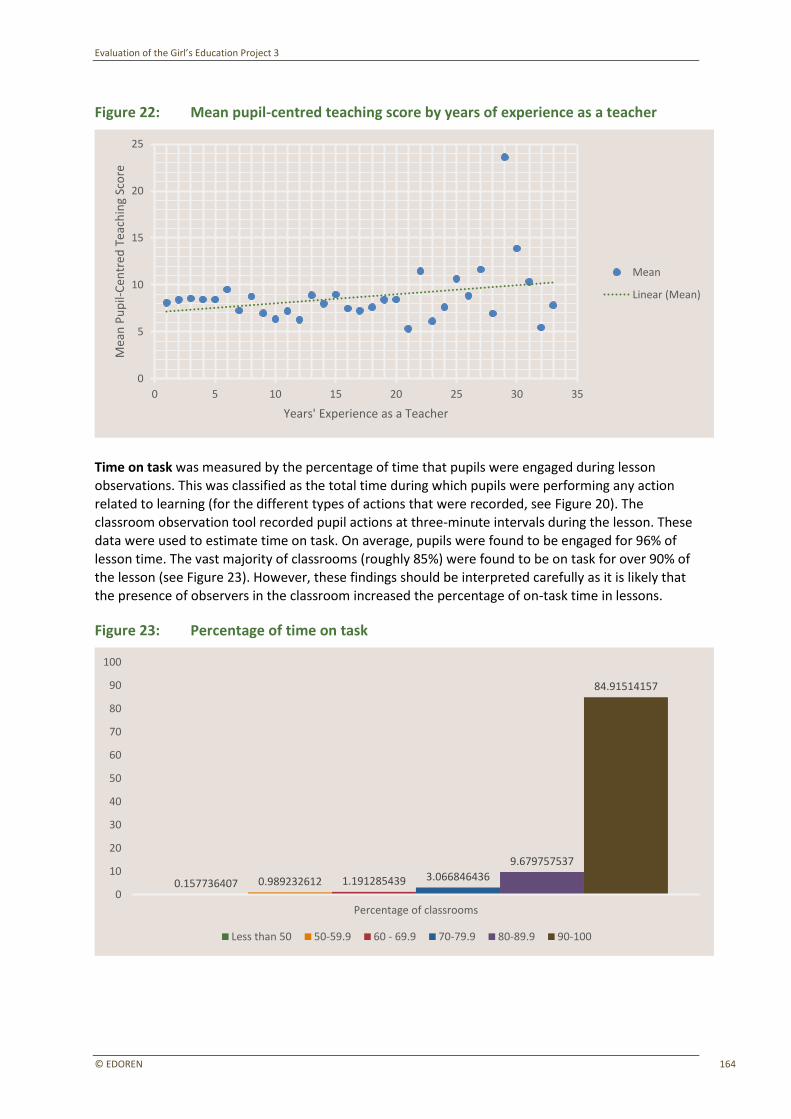
Evaluation of the Girl’s Education Project 3
© EDOREN 164
Figure 22: Mean pupil-centred teaching score by years of experience as a teacher
Time on task was measured by the percentage of time that pupils were engaged during lesson
observations. This was classified as the total time during which pupils were performing any action related to learning (for the different types of actions that were recorded, see Figure 20). The
classroom observation tool recorded pupil actions at three-minute intervals during the lesson. These data were used to estimate time on task. On average, pupils were found to be engaged for 96% of lesson time. The vast majority of classrooms (roughly 85%) were found to be on task for over 90% of
the lesson (see Figure 23). However, these findings should be interpreted carefully as it is likely that the presence of observers in the classroom increased the percentage of on-task time in lessons.
Figure 23: Percentage of time on task
0 5 10 15 20 25 30 35
0
5
10
15
20
25
Years' Experience as a Teacher
Mea
n P
up
il-C
entr
ed T
each
ing
Sco
re
Mean
Linear (Mean)
0.157736407 0.989232612 1.191285439 3.066846436
9.679757537
84.91514157
Percentage of classrooms
0
10
20
30
40
50
60
70
80
90
100
Less than 50 50-59.9 60 - 69.9 70-79.9 80-89.9 90-100
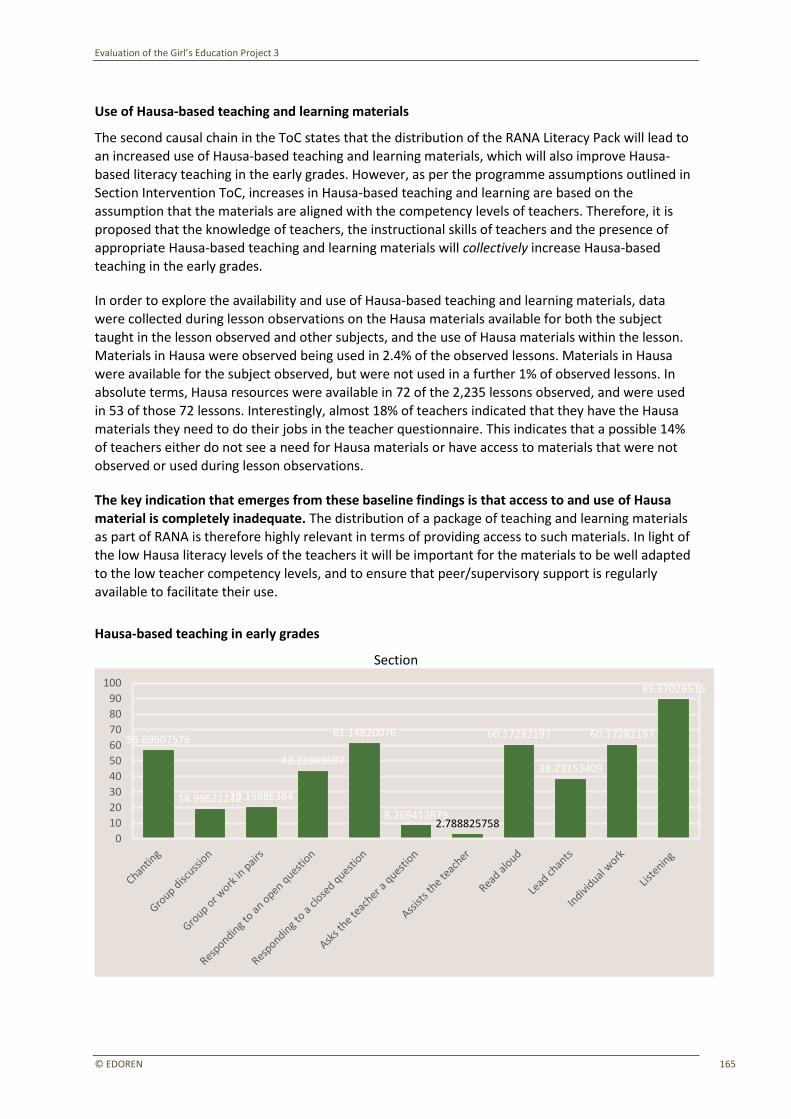
Evaluation of the Girl’s Education Project 3
© EDOREN 165
Use of Hausa-based teaching and learning materials
The second causal chain in the ToC states that the distribution of the RANA Literacy Pack will lead to an increased use of Hausa-based teaching and learning materials, which will also improve Hausa-based literacy teaching in the early grades. However, as per the programme assumptions outlined in Section Intervention ToC, increases in Hausa-based teaching and learning are based on the assumption that the materials are aligned with the competency levels of teachers. Therefore, it is
proposed that the knowledge of teachers, the instructional skills of teachers and the presence of appropriate Hausa-based teaching and learning materials will collectively increase Hausa-based teaching in the early grades.
In order to explore the availability and use of Hausa-based teaching and learning materials, data were collected during lesson observations on the Hausa materials available for both the subject
taught in the lesson observed and other subjects, and the use of Hausa materials within the lesson. Materials in Hausa were observed being used in 2.4% of the observed lessons. Materials in Hausa
were available for the subject observed, but were not used in a further 1% of observed lessons. In
absolute terms, Hausa resources were available in 72 of the 2,235 lessons observed, and were used in 53 of those 72 lessons. Interestingly, almost 18% of teachers indicated that they have the Hausa materials they need to do their jobs in the teacher questionnaire. This indicates that a possible 14%
of teachers either do not see a need for Hausa materials or have access to materials that were not observed or used during lesson observations.
The key indication that emerges from these baseline findings is that access to and use of Hausa
material is completely inadequate. The distribution of a package of teaching and learning materials as part of RANA is therefore highly relevant in terms of providing access to such materials. In light of
the low Hausa literacy levels of the teachers it will be important for the materials to be well adapted to the low teacher competency levels, and to ensure that peer/supervisory support is regularly available to facilitate their use.
Hausa-based teaching in early grades
Section
56.69507576
18.9962121220.19886364
43.21969697
61.14820076
8.2694128792.788825758
60.17282197
38.23153409
60.17282197
89.37026515
0
10
20
30
40
50
60
70
80
90
100
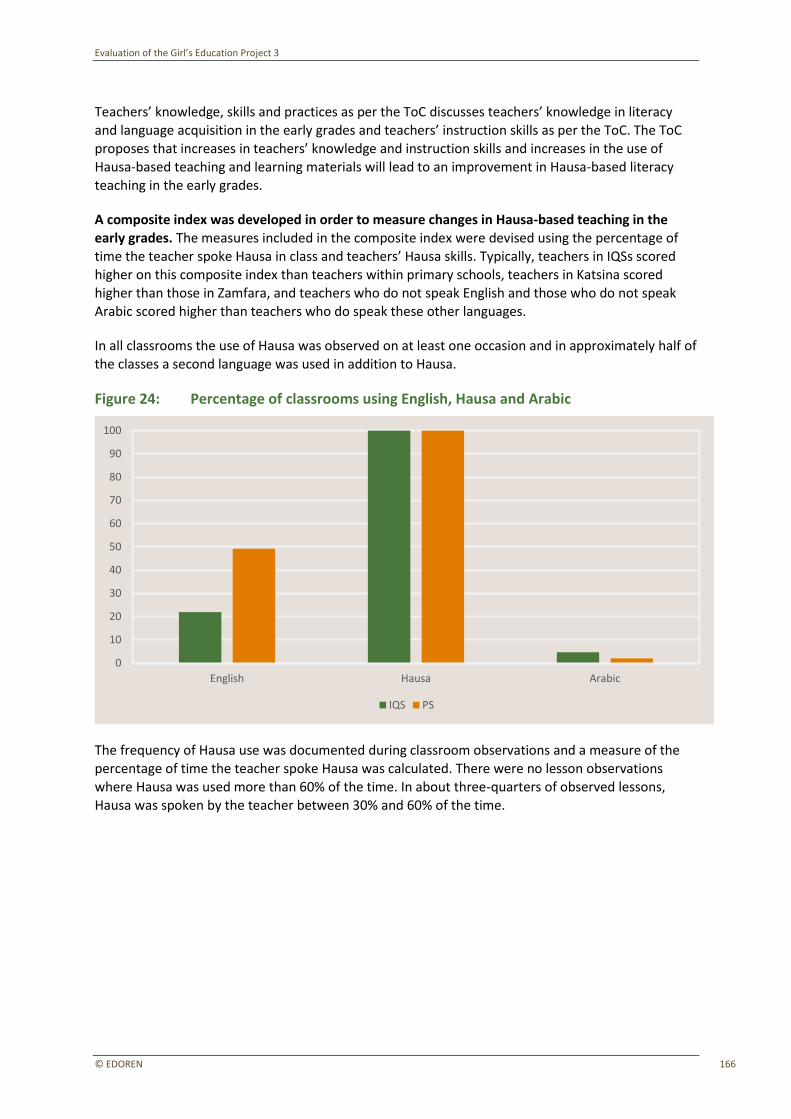
Evaluation of the Girl’s Education Project 3
© EDOREN 166
Teachers’ knowledge, skills and practices as per the ToC discusses teachers’ knowledge in literacy
and language acquisition in the early grades and teachers’ instruction skills as per the ToC. The ToC proposes that increases in teachers’ knowledge and instruction skills and increases in the use of Hausa-based teaching and learning materials will lead to an improvement in Hausa-based literacy teaching in the early grades.
A composite index was developed in order to measure changes in Hausa-based teaching in the early grades. The measures included in the composite index were devised using the percentage of time the teacher spoke Hausa in class and teachers’ Hausa skills. Typically, teachers in IQSs scored higher on this composite index than teachers within primary schools, teachers in Katsina scored higher than those in Zamfara, and teachers who do not speak English and those who do not speak
Arabic scored higher than teachers who do speak these other languages.
In all classrooms the use of Hausa was observed on at least one occasion and in approximately half of the classes a second language was used in addition to Hausa.
Figure 24: Percentage of classrooms using English, Hausa and Arabic
The frequency of Hausa use was documented during classroom observations and a measure of the percentage of time the teacher spoke Hausa was calculated. There were no lesson observations where Hausa was used more than 60% of the time. In about three-quarters of observed lessons, Hausa was spoken by the teacher between 30% and 60% of the time.
English Hausa Arabic
0
10
20
30
40
50
60
70
80
90
100
IQS PS
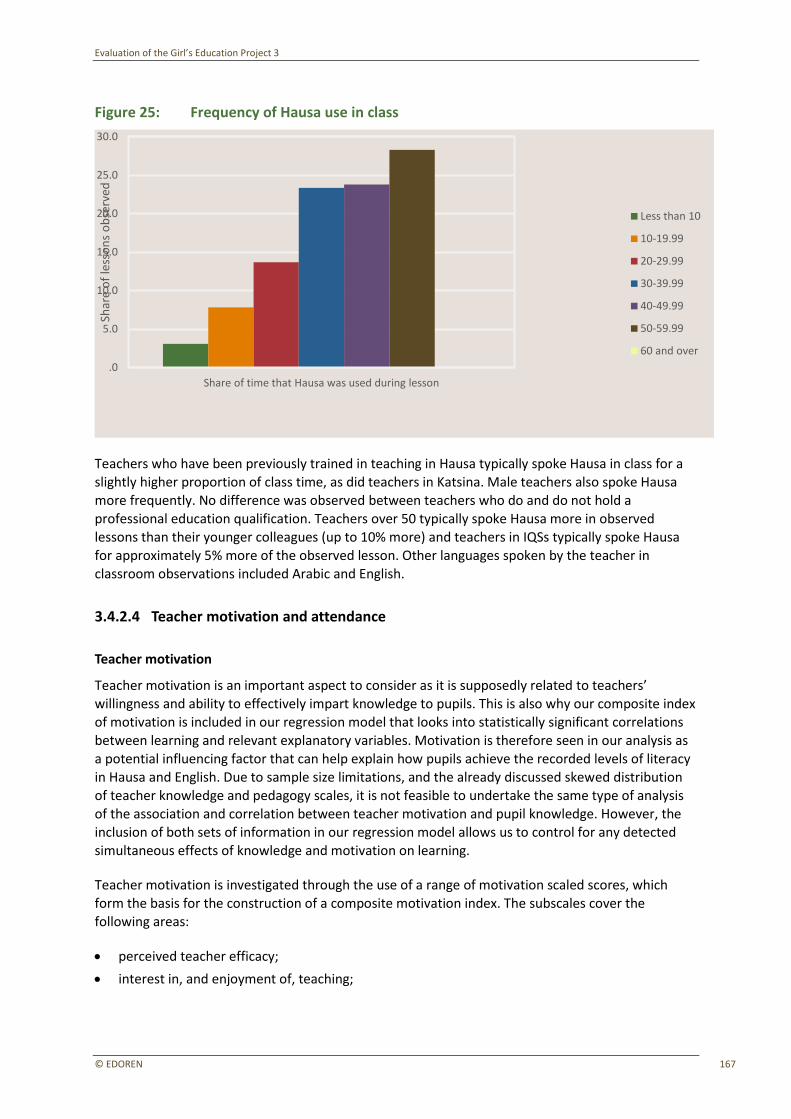
Evaluation of the Girl’s Education Project 3
© EDOREN 167
Figure 25: Frequency of Hausa use in class
Teachers who have been previously trained in teaching in Hausa typically spoke Hausa in class for a slightly higher proportion of class time, as did teachers in Katsina. Male teachers also spoke Hausa
more frequently. No difference was observed between teachers who do and do not hold a professional education qualification. Teachers over 50 typically spoke Hausa more in observed lessons than their younger colleagues (up to 10% more) and teachers in IQSs typically spoke Hausa
for approximately 5% more of the observed lesson. Other languages spoken by the teacher in classroom observations included Arabic and English.
3.4.2.4 Teacher motivation and attendance
Teacher motivation
Teacher motivation is an important aspect to consider as it is supposedly related to teachers’ willingness and ability to effectively impart knowledge to pupils. This is also why our composite index
of motivation is included in our regression model that looks into statistically significant correlations between learning and relevant explanatory variables. Motivation is therefore seen in our analysis as a potential influencing factor that can help explain how pupils achieve the recorded levels of literacy in Hausa and English. Due to sample size limitations, and the already discussed skewed distribution of teacher knowledge and pedagogy scales, it is not feasible to undertake the same type of analysis
of the association and correlation between teacher motivation and pupil knowledge. However, the inclusion of both sets of information in our regression model allows us to control for any detected simultaneous effects of knowledge and motivation on learning.
Teacher motivation is investigated through the use of a range of motivation scaled scores, which form the basis for the construction of a composite motivation index. The subscales cover the following areas:
• perceived teacher efficacy;
• interest in, and enjoyment of, teaching;
Share of time that Hausa was used during lesson
.0
5.0
10.0
15.0
20.0
25.0
30.0
Shar
e o
f le
sso
ns
ob
serv
ed
Less than 10
10-19.99
20-29.99
30-39.99
40-49.99
50-59.99
60 and over
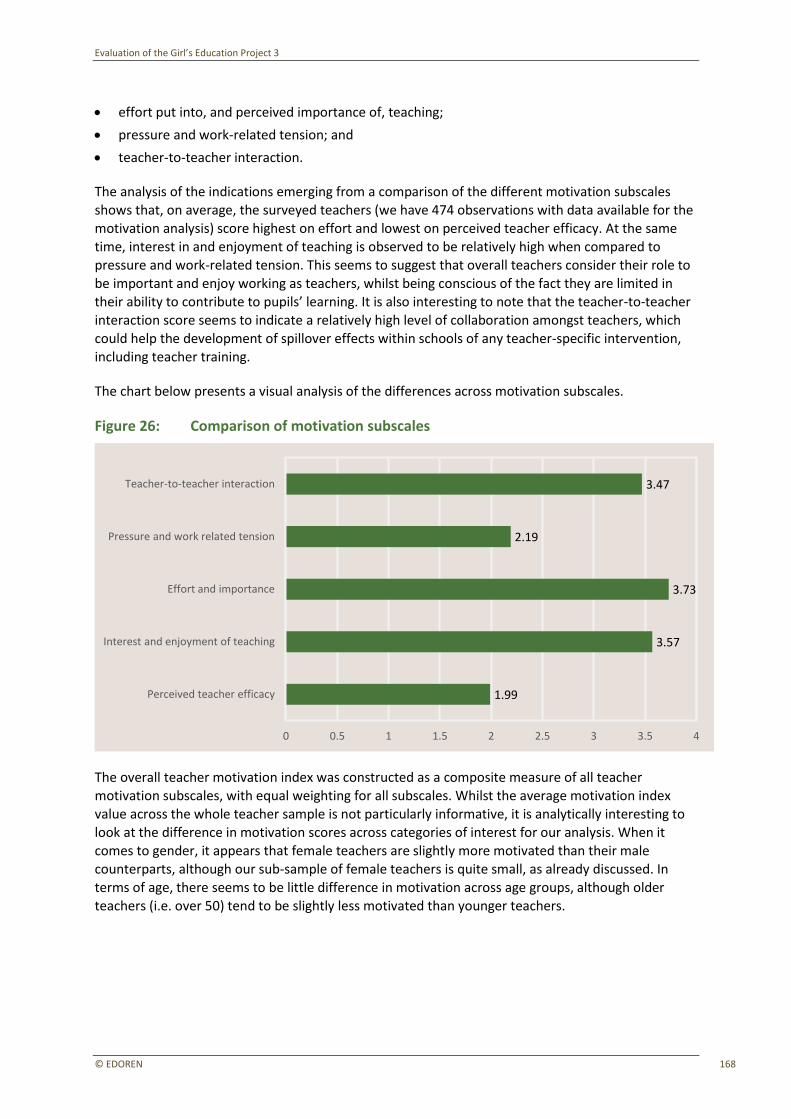
Evaluation of the Girl’s Education Project 3
© EDOREN 168
• effort put into, and perceived importance of, teaching;
• pressure and work-related tension; and
• teacher-to-teacher interaction.
The analysis of the indications emerging from a comparison of the different motivation subscales shows that, on average, the surveyed teachers (we have 474 observations with data available for the motivation analysis) score highest on effort and lowest on perceived teacher efficacy. At the same time, interest in and enjoyment of teaching is observed to be relatively high when compared to pressure and work-related tension. This seems to suggest that overall teachers consider their role to
be important and enjoy working as teachers, whilst being conscious of the fact they are limited in their ability to contribute to pupils’ learning. It is also interesting to note that the teacher-to-teacher interaction score seems to indicate a relatively high level of collaboration amongst teachers, which could help the development of spillover effects within schools of any teacher-specific intervention, including teacher training.
The chart below presents a visual analysis of the differences across motivation subscales.
Figure 26: Comparison of motivation subscales
The overall teacher motivation index was constructed as a composite measure of all teacher motivation subscales, with equal weighting for all subscales. Whilst the average motivation index
value across the whole teacher sample is not particularly informative, it is analytically interesting to look at the difference in motivation scores across categories of interest for our analysis. When it comes to gender, it appears that female teachers are slightly more motivated than their male counterparts, although our sub-sample of female teachers is quite small, as already discussed. In
terms of age, there seems to be little difference in motivation across age groups, although older teachers (i.e. over 50) tend to be slightly less motivated than younger teachers.
1.99
3.57
3.73
2.19
3.47
Perceived teacher efficacy
Interest and enjoyment of teaching
Effort and importance
Pressure and work related tension
Teacher-to-teacher interaction
0 0.5 1 1.5 2 2.5 3 3.5 4
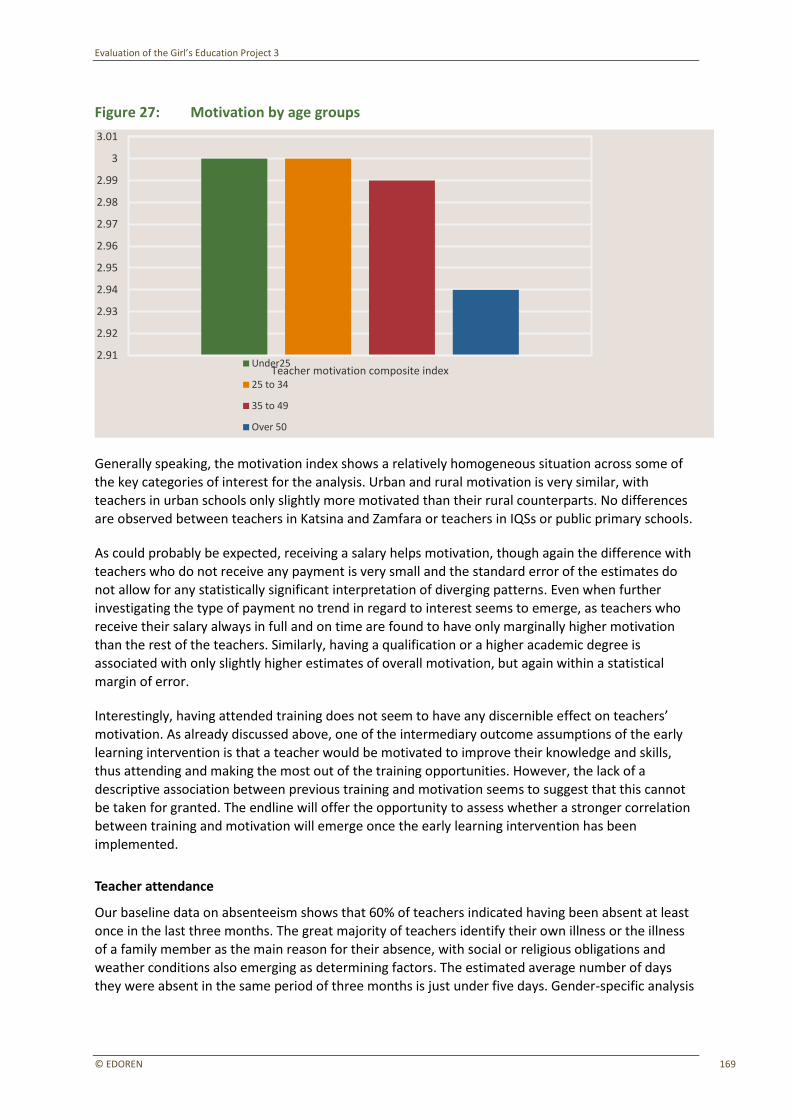
Evaluation of the Girl’s Education Project 3
© EDOREN 169
Figure 27: Motivation by age groups
Generally speaking, the motivation index shows a relatively homogeneous situation across some of the key categories of interest for the analysis. Urban and rural motivation is very similar, with
teachers in urban schools only slightly more motivated than their rural counterparts. No differences are observed between teachers in Katsina and Zamfara or teachers in IQSs or public primary schools.
As could probably be expected, receiving a salary helps motivation, though again the difference with
teachers who do not receive any payment is very small and the standard error of the estimates do not allow for any statistically significant interpretation of diverging patterns. Even when further
investigating the type of payment no trend in regard to interest seems to emerge, as teachers who
receive their salary always in full and on time are found to have only marginally higher motivation
than the rest of the teachers. Similarly, having a qualification or a higher academic degree is associated with only slightly higher estimates of overall motivation, but again within a statistical
margin of error.
Interestingly, having attended training does not seem to have any discernible effect on teachers’
motivation. As already discussed above, one of the intermediary outcome assumptions of the early learning intervention is that a teacher would be motivated to improve their knowledge and skills, thus attending and making the most out of the training opportunities. However, the lack of a descriptive association between previous training and motivation seems to suggest that this cannot be taken for granted. The endline will offer the opportunity to assess whether a stronger correlation
between training and motivation will emerge once the early learning intervention has been implemented.
Teacher attendance
Our baseline data on absenteeism shows that 60% of teachers indicated having been absent at least
once in the last three months. The great majority of teachers identify their own illness or the illness of a family member as the main reason for their absence, with social or religious obligations and weather conditions also emerging as determining factors. The estimated average number of days they were absent in the same period of three months is just under five days. Gender-specific analysis
Teacher motivation composite index
2.91
2.92
2.93
2.94
2.95
2.96
2.97
2.98
2.99
3
3.01
Under25
25 to 34
35 to 49
Over 50
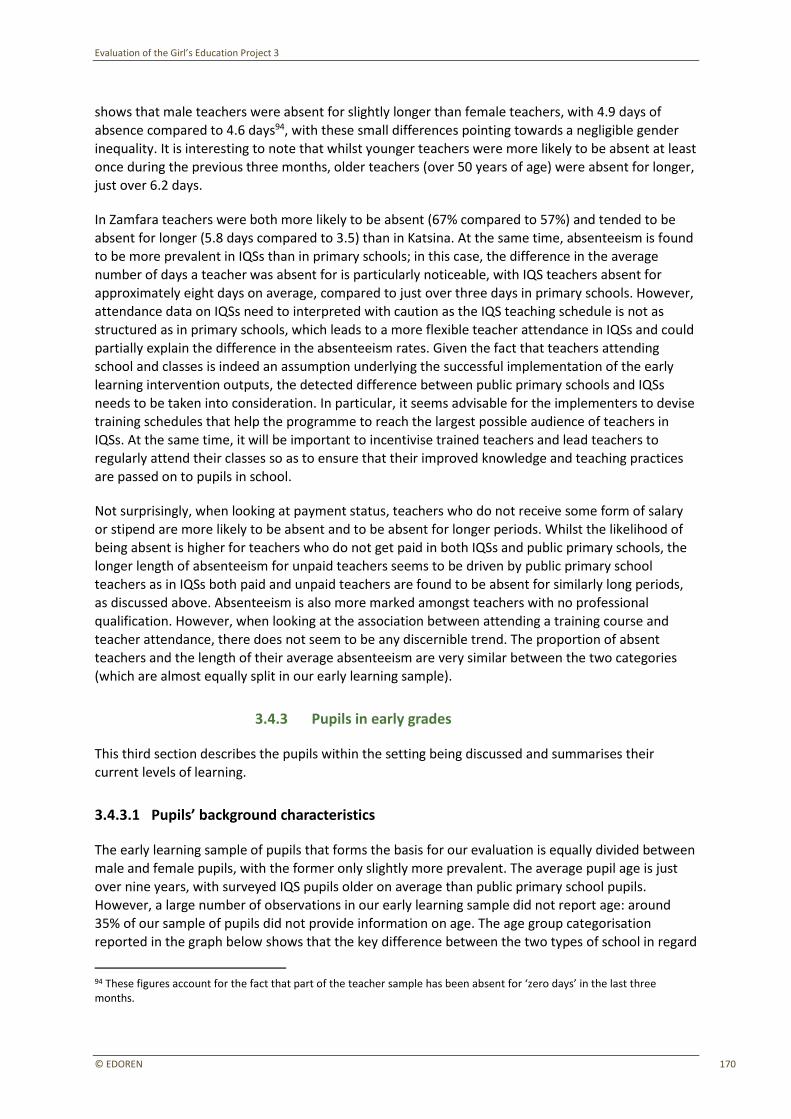
Evaluation of the Girl’s Education Project 3
© EDOREN 170
shows that male teachers were absent for slightly longer than female teachers, with 4.9 days of
absence compared to 4.6 days94, with these small differences pointing towards a negligible gender inequality. It is interesting to note that whilst younger teachers were more likely to be absent at least once during the previous three months, older teachers (over 50 years of age) were absent for longer, just over 6.2 days.
In Zamfara teachers were both more likely to be absent (67% compared to 57%) and tended to be absent for longer (5.8 days compared to 3.5) than in Katsina. At the same time, absenteeism is found to be more prevalent in IQSs than in primary schools; in this case, the difference in the average number of days a teacher was absent for is particularly noticeable, with IQS teachers absent for approximately eight days on average, compared to just over three days in primary schools. However,
attendance data on IQSs need to interpreted with caution as the IQS teaching schedule is not as structured as in primary schools, which leads to a more flexible teacher attendance in IQSs and could partially explain the difference in the absenteeism rates. Given the fact that teachers attending school and classes is indeed an assumption underlying the successful implementation of the early
learning intervention outputs, the detected difference between public primary schools and IQSs needs to be taken into consideration. In particular, it seems advisable for the implementers to devise training schedules that help the programme to reach the largest possible audience of teachers in
IQSs. At the same time, it will be important to incentivise trained teachers and lead teachers to regularly attend their classes so as to ensure that their improved knowledge and teaching practices
are passed on to pupils in school.
Not surprisingly, when looking at payment status, teachers who do not receive some form of salary
or stipend are more likely to be absent and to be absent for longer periods. Whilst the likelihood of being absent is higher for teachers who do not get paid in both IQSs and public primary schools, the longer length of absenteeism for unpaid teachers seems to be driven by public primary school
teachers as in IQSs both paid and unpaid teachers are found to be absent for similarly long periods, as discussed above. Absenteeism is also more marked amongst teachers with no professional
qualification. However, when looking at the association between attending a training course and teacher attendance, there does not seem to be any discernible trend. The proportion of absent
teachers and the length of their average absenteeism are very similar between the two categories (which are almost equally split in our early learning sample).
3.4.3 Pupils in early grades
This third section describes the pupils within the setting being discussed and summarises their current levels of learning.
3.4.3.1 Pupils’ background characteristics
The early learning sample of pupils that forms the basis for our evaluation is equally divided between male and female pupils, with the former only slightly more prevalent. The average pupil age is just
over nine years, with surveyed IQS pupils older on average than public primary school pupils. However, a large number of observations in our early learning sample did not report age: around 35% of our sample of pupils did not provide information on age. The age group categorisation reported in the graph below shows that the key difference between the two types of school in regard
94 These figures account for the fact that part of the teacher sample has been absent for ‘zero days’ in the last three months.
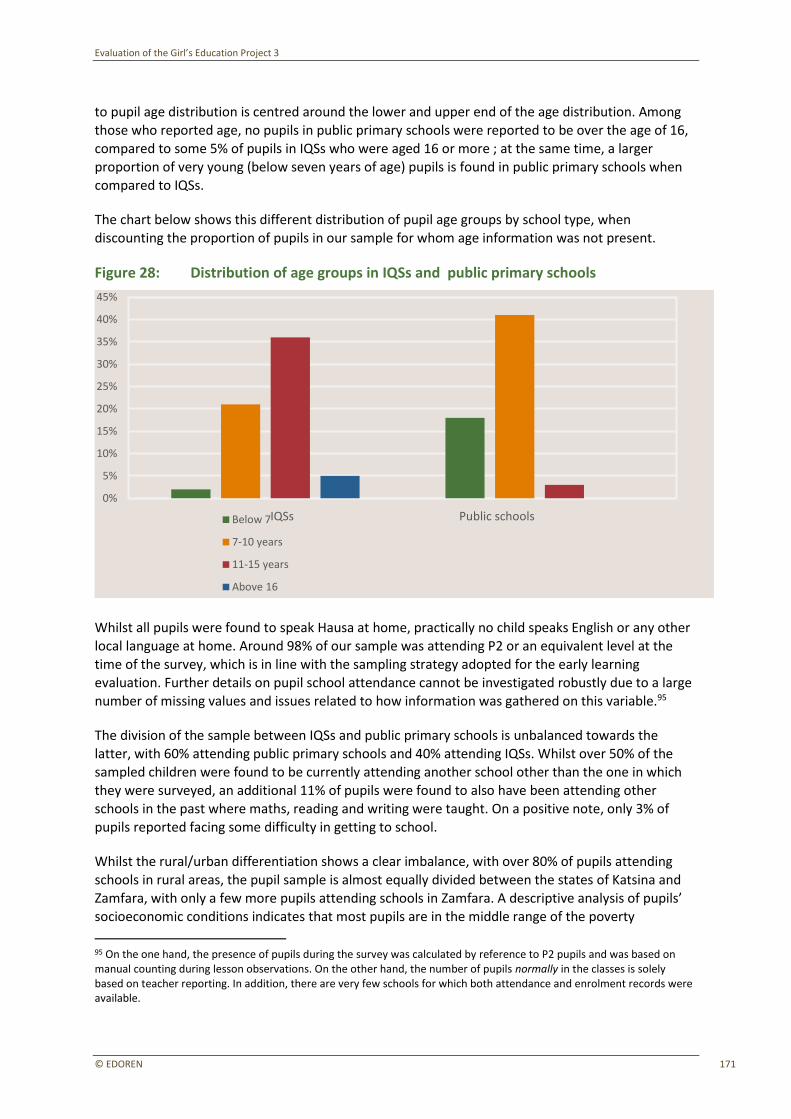
Evaluation of the Girl’s Education Project 3
© EDOREN 171
to pupil age distribution is centred around the lower and upper end of the age distribution. Among
those who reported age, no pupils in public primary schools were reported to be over the age of 16, compared to some 5% of pupils in IQSs who were aged 16 or more ; at the same time, a larger proportion of very young (below seven years of age) pupils is found in public primary schools when compared to IQSs.
The chart below shows this different distribution of pupil age groups by school type, when discounting the proportion of pupils in our sample for whom age information was not present.
Figure 28: Distribution of age groups in IQSs and public primary schools
Whilst all pupils were found to speak Hausa at home, practically no child speaks English or any other local language at home. Around 98% of our sample was attending P2 or an equivalent level at the time of the survey, which is in line with the sampling strategy adopted for the early learning
evaluation. Further details on pupil school attendance cannot be investigated robustly due to a large number of missing values and issues related to how information was gathered on this variable.95
The division of the sample between IQSs and public primary schools is unbalanced towards the
latter, with 60% attending public primary schools and 40% attending IQSs. Whilst over 50% of the sampled children were found to be currently attending another school other than the one in which
they were surveyed, an additional 11% of pupils were found to also have been attending other schools in the past where maths, reading and writing were taught. On a positive note, only 3% of pupils reported facing some difficulty in getting to school.
Whilst the rural/urban differentiation shows a clear imbalance, with over 80% of pupils attending
schools in rural areas, the pupil sample is almost equally divided between the states of Katsina and
Zamfara, with only a few more pupils attending schools in Zamfara. A descriptive analysis of pupils’ socioeconomic conditions indicates that most pupils are in the middle range of the poverty
95 On the one hand, the presence of pupils during the survey was calculated by reference to P2 pupils and was based on manual counting during lesson observations. On the other hand, the number of pupils normally in the classes is solely based on teacher reporting. In addition, there are very few schools for which both attendance and enrolment records were available.
0%
5%
10%
15%
20%
25%
30%
35%
40%
45%
IQSs Public schoolsBelow 7
7-10 years
11-15 years
Above 16
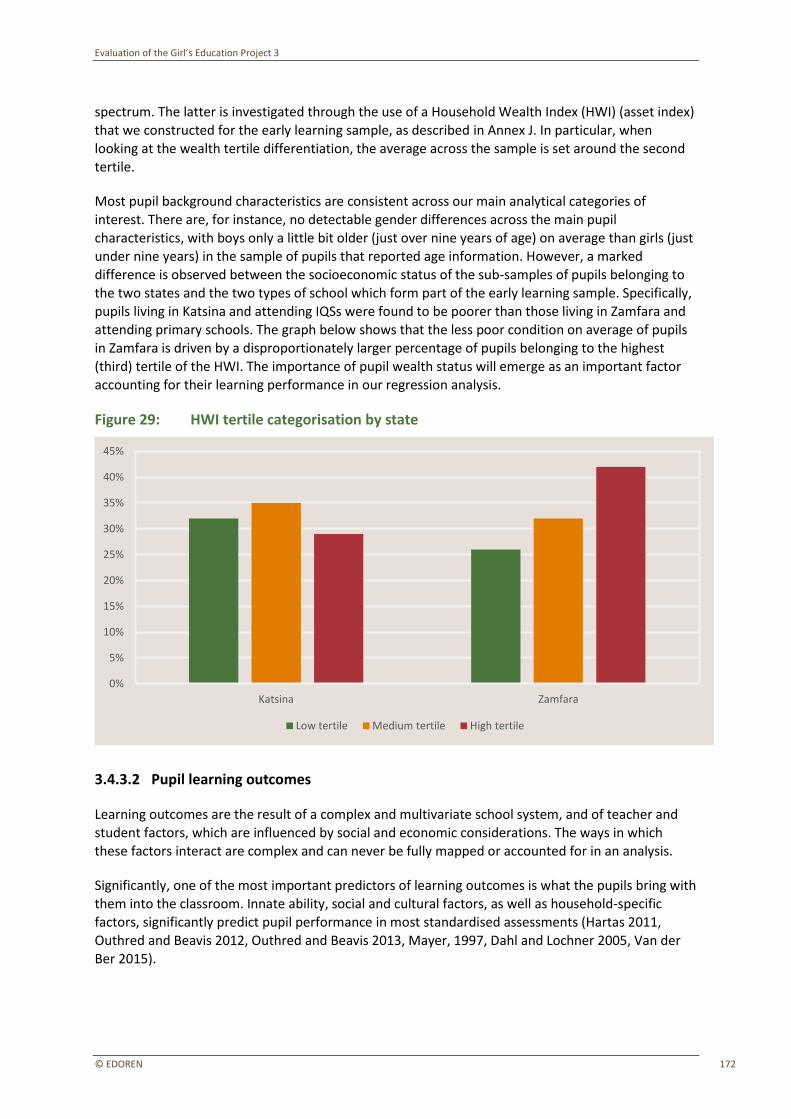
Evaluation of the Girl’s Education Project 3
© EDOREN 172
spectrum. The latter is investigated through the use of a Household Wealth Index (HWI) (asset index)
that we constructed for the early learning sample, as described in Annex J. In particular, when looking at the wealth tertile differentiation, the average across the sample is set around the second tertile.
Most pupil background characteristics are consistent across our main analytical categories of
interest. There are, for instance, no detectable gender differences across the main pupil characteristics, with boys only a little bit older (just over nine years of age) on average than girls (just under nine years) in the sample of pupils that reported age information. However, a marked difference is observed between the socioeconomic status of the sub-samples of pupils belonging to the two states and the two types of school which form part of the early learning sample. Specifically,
pupils living in Katsina and attending IQSs were found to be poorer than those living in Zamfara and attending primary schools. The graph below shows that the less poor condition on average of pupils in Zamfara is driven by a disproportionately larger percentage of pupils belonging to the highest (third) tertile of the HWI. The importance of pupil wealth status will emerge as an important factor
accounting for their learning performance in our regression analysis.
Figure 29: HWI tertile categorisation by state
3.4.3.2 Pupil learning outcomes
Learning outcomes are the result of a complex and multivariate school system, and of teacher and student factors, which are influenced by social and economic considerations. The ways in which these factors interact are complex and can never be fully mapped or accounted for in an analysis.
Significantly, one of the most important predictors of learning outcomes is what the pupils bring with them into the classroom. Innate ability, social and cultural factors, as well as household-specific
factors, significantly predict pupil performance in most standardised assessments (Hartas 2011, Outhred and Beavis 2012, Outhred and Beavis 2013, Mayer, 1997, Dahl and Lochner 2005, Van der
Ber 2015).
Katsina Zamfara
0%
5%
10%
15%
20%
25%
30%
35%
40%
45%
Low tertile Medium tertile High tertile
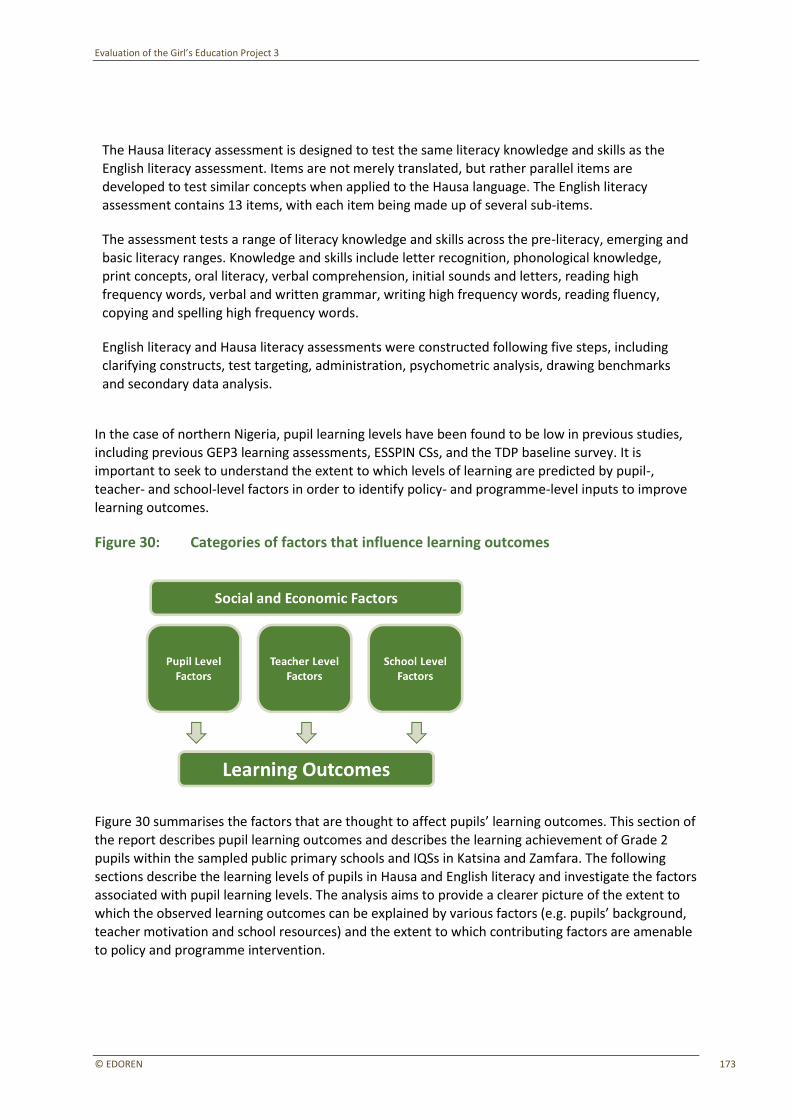
Evaluation of the Girl’s Education Project 3
© EDOREN 173
Learning outcome measurement
The Hausa literacy assessment is designed to test the same literacy knowledge and skills as the English literacy assessment. Items are not merely translated, but rather parallel items are developed to test similar concepts when applied to the Hausa language. The English literacy assessment contains 13 items, with each item being made up of several sub-items.
The assessment tests a range of literacy knowledge and skills across the pre-literacy, emerging and basic literacy ranges. Knowledge and skills include letter recognition, phonological knowledge, print concepts, oral literacy, verbal comprehension, initial sounds and letters, reading high frequency words, verbal and written grammar, writing high frequency words, reading fluency, copying and spelling high frequency words.
English literacy and Hausa literacy assessments were constructed following five steps, including clarifying constructs, test targeting, administration, psychometric analysis, drawing benchmarks
and secondary data analysis.
In the case of northern Nigeria, pupil learning levels have been found to be low in previous studies,
including previous GEP3 learning assessments, ESSPIN CSs, and the TDP baseline survey. It is important to seek to understand the extent to which levels of learning are predicted by pupil-, teacher- and school-level factors in order to identify policy- and programme-level inputs to improve
learning outcomes.
Figure 30: Categories of factors that influence learning outcomes
Figure 30 summarises the factors that are thought to affect pupils’ learning outcomes. This section of the report describes pupil learning outcomes and describes the learning achievement of Grade 2 pupils within the sampled public primary schools and IQSs in Katsina and Zamfara. The following
sections describe the learning levels of pupils in Hausa and English literacy and investigate the factors
associated with pupil learning levels. The analysis aims to provide a clearer picture of the extent to which the observed learning outcomes can be explained by various factors (e.g. pupils’ background, teacher motivation and school resources) and the extent to which contributing factors are amenable to policy and programme intervention.
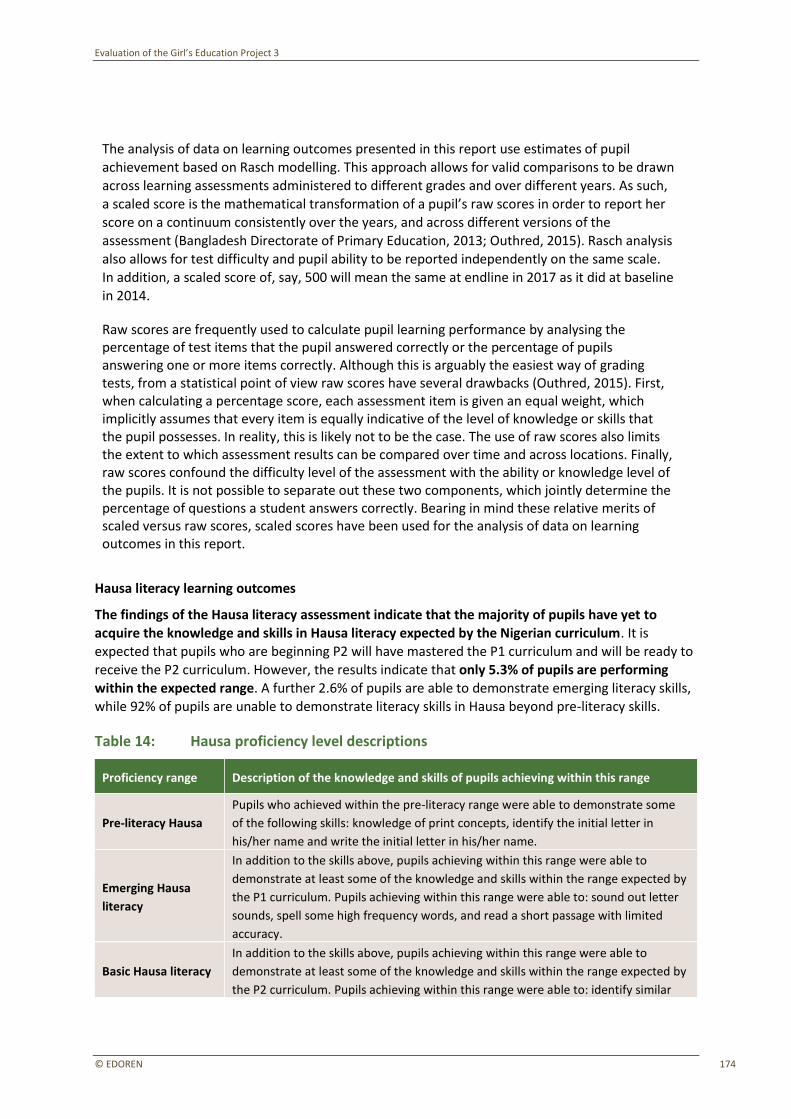
Evaluation of the Girl’s Education Project 3
© EDOREN 174
Approach to analysing data on learning outcomes
The analysis of data on learning outcomes presented in this report use estimates of pupil achievement based on Rasch modelling. This approach allows for valid comparisons to be drawn
across learning assessments administered to different grades and over different years. As such, a scaled score is the mathematical transformation of a pupil’s raw scores in order to report her score on a continuum consistently over the years, and across different versions of the assessment (Bangladesh Directorate of Primary Education, 2013; Outhred, 2015). Rasch analysis also allows for test difficulty and pupil ability to be reported independently on the same scale.
In addition, a scaled score of, say, 500 will mean the same at endline in 2017 as it did at baseline in 2014.
Raw scores are frequently used to calculate pupil learning performance by analysing the percentage of test items that the pupil answered correctly or the percentage of pupils answering one or more items correctly. Although this is arguably the easiest way of grading tests, from a statistical point of view raw scores have several drawbacks (Outhred, 2015). First, when calculating a percentage score, each assessment item is given an equal weight, which implicitly assumes that every item is equally indicative of the level of knowledge or skills that the pupil possesses. In reality, this is likely not to be the case. The use of raw scores also limits the extent to which assessment results can be compared over time and across locations. Finally, raw scores confound the difficulty level of the assessment with the ability or knowledge level of the pupils. It is not possible to separate out these two components, which jointly determine the percentage of questions a student answers correctly. Bearing in mind these relative merits of scaled versus raw scores, scaled scores have been used for the analysis of data on learning outcomes in this report.
Hausa literacy learning outcomes
The findings of the Hausa literacy assessment indicate that the majority of pupils have yet to
acquire the knowledge and skills in Hausa literacy expected by the Nigerian curriculum. It is expected that pupils who are beginning P2 will have mastered the P1 curriculum and will be ready to
receive the P2 curriculum. However, the results indicate that only 5.3% of pupils are performing within the expected range. A further 2.6% of pupils are able to demonstrate emerging literacy skills,
while 92% of pupils are unable to demonstrate literacy skills in Hausa beyond pre-literacy skills.
Table 14: Hausa proficiency level descriptions
Proficiency range Description of the knowledge and skills of pupils achieving within this range
Pre-literacy Hausa
Pupils who achieved within the pre-literacy range were able to demonstrate some
of the following skills: knowledge of print concepts, identify the initial letter in
his/her name and write the initial letter in his/her name.
Emerging Hausa
literacy
In addition to the skills above, pupils achieving within this range were able to
demonstrate at least some of the knowledge and skills within the range expected by
the P1 curriculum. Pupils achieving within this range were able to: sound out letter
sounds, spell some high frequency words, and read a short passage with limited
accuracy.
Basic Hausa literacy In addition to the skills above, pupils achieving within this range were able to
demonstrate at least some of the knowledge and skills within the range expected by
the P2 curriculum. Pupils achieving within this range were able to: identify similar
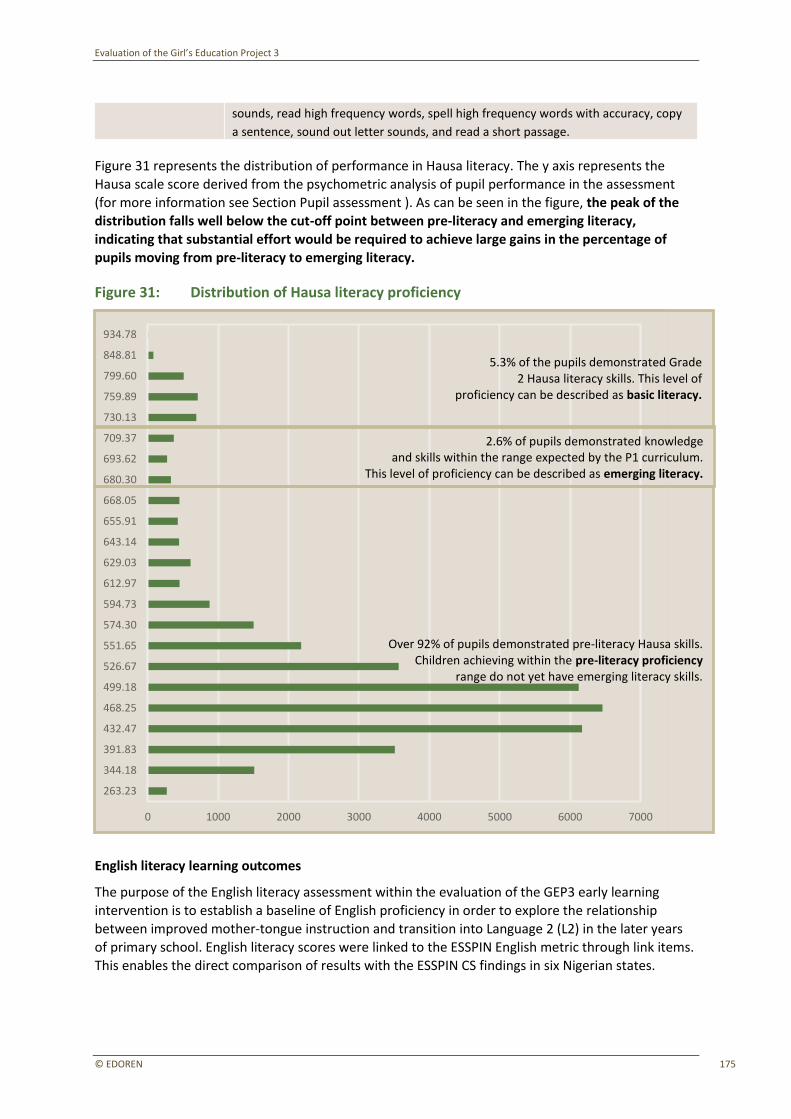
Evaluation of the Girl’s Education Project 3
© EDOREN 175
sounds, read high frequency words, spell high frequency words with accuracy, copy
a sentence, sound out letter sounds, and read a short passage.
Figure 31 represents the distribution of performance in Hausa literacy. The y axis represents the Hausa scale score derived from the psychometric analysis of pupil performance in the assessment (for more information see Section Pupil assessment ). As can be seen in the figure, the peak of the distribution falls well below the cut-off point between pre-literacy and emerging literacy, indicating that substantial effort would be required to achieve large gains in the percentage of
pupils moving from pre-literacy to emerging literacy.
Figure 31: Distribution of Hausa literacy proficiency
English literacy learning outcomes
The purpose of the English literacy assessment within the evaluation of the GEP3 early learning
intervention is to establish a baseline of English proficiency in order to explore the relationship between improved mother-tongue instruction and transition into Language 2 (L2) in the later years of primary school. English literacy scores were linked to the ESSPIN English metric through link items. This enables the direct comparison of results with the ESSPIN CS findings in six Nigerian states.
263.23
344.18
391.83
432.47
468.25
499.18
526.67
551.65
574.30
594.73
612.97
629.03
643.14
655.91
668.05
680.30
693.62
709.37
730.13
759.89
799.60
848.81
934.78
0 1000 2000 3000 4000 5000 6000 7000
2.6% of pupils demonstrated knowledge and skills within the range expected by the P1 curriculum.
This level of proficiency can be described as emerging literacy.
Over 92% of pupils demonstrated pre-literacy Hausa skills. Children achieving within the pre-literacy proficiency
range do not yet have emerging literacy skills.
5.3% of the pupils demonstrated Grade
2 Hausa literacy skills. This level of proficiency can be described as basic literacy.
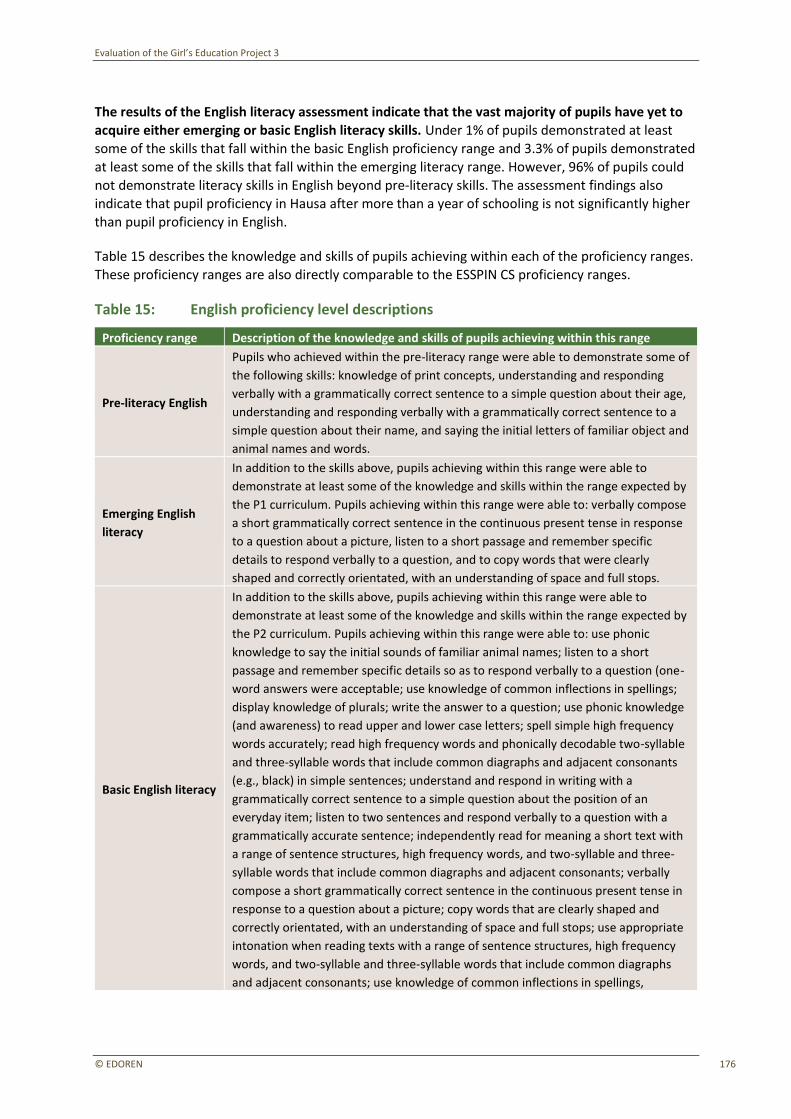
Evaluation of the Girl’s Education Project 3
© EDOREN 176
The results of the English literacy assessment indicate that the vast majority of pupils have yet to
acquire either emerging or basic English literacy skills. Under 1% of pupils demonstrated at least some of the skills that fall within the basic English proficiency range and 3.3% of pupils demonstrated at least some of the skills that fall within the emerging literacy range. However, 96% of pupils could not demonstrate literacy skills in English beyond pre-literacy skills. The assessment findings also
indicate that pupil proficiency in Hausa after more than a year of schooling is not significantly higher than pupil proficiency in English.
Table 15 describes the knowledge and skills of pupils achieving within each of the proficiency ranges. These proficiency ranges are also directly comparable to the ESSPIN CS proficiency ranges.
Table 15: English proficiency level descriptions
Proficiency range Description of the knowledge and skills of pupils achieving within this range
Pre-literacy English
Pupils who achieved within the pre-literacy range were able to demonstrate some of
the following skills: knowledge of print concepts, understanding and responding
verbally with a grammatically correct sentence to a simple question about their age,
understanding and responding verbally with a grammatically correct sentence to a
simple question about their name, and saying the initial letters of familiar object and
animal names and words.
Emerging English
literacy
In addition to the skills above, pupils achieving within this range were able to
demonstrate at least some of the knowledge and skills within the range expected by
the P1 curriculum. Pupils achieving within this range were able to: verbally compose
a short grammatically correct sentence in the continuous present tense in response
to a question about a picture, listen to a short passage and remember specific
details to respond verbally to a question, and to copy words that were clearly
shaped and correctly orientated, with an understanding of space and full stops.
Basic English literacy
In addition to the skills above, pupils achieving within this range were able to
demonstrate at least some of the knowledge and skills within the range expected by
the P2 curriculum. Pupils achieving within this range were able to: use phonic
knowledge to say the initial sounds of familiar animal names; listen to a short
passage and remember specific details so as to respond verbally to a question (one-
word answers were acceptable; use knowledge of common inflections in spellings;
display knowledge of plurals; write the answer to a question; use phonic knowledge
(and awareness) to read upper and lower case letters; spell simple high frequency
words accurately; read high frequency words and phonically decodable two-syllable
and three-syllable words that include common diagraphs and adjacent consonants
(e.g., black) in simple sentences; understand and respond in writing with a
grammatically correct sentence to a simple question about the position of an
everyday item; listen to two sentences and respond verbally to a question with a
grammatically accurate sentence; independently read for meaning a short text with
a range of sentence structures, high frequency words, and two-syllable and three-
syllable words that include common diagraphs and adjacent consonants; verbally
compose a short grammatically correct sentence in the continuous present tense in
response to a question about a picture; copy words that are clearly shaped and
correctly orientated, with an understanding of space and full stops; use appropriate
intonation when reading texts with a range of sentence structures, high frequency
words, and two-syllable and three-syllable words that include common diagraphs
and adjacent consonants; use knowledge of common inflections in spellings,
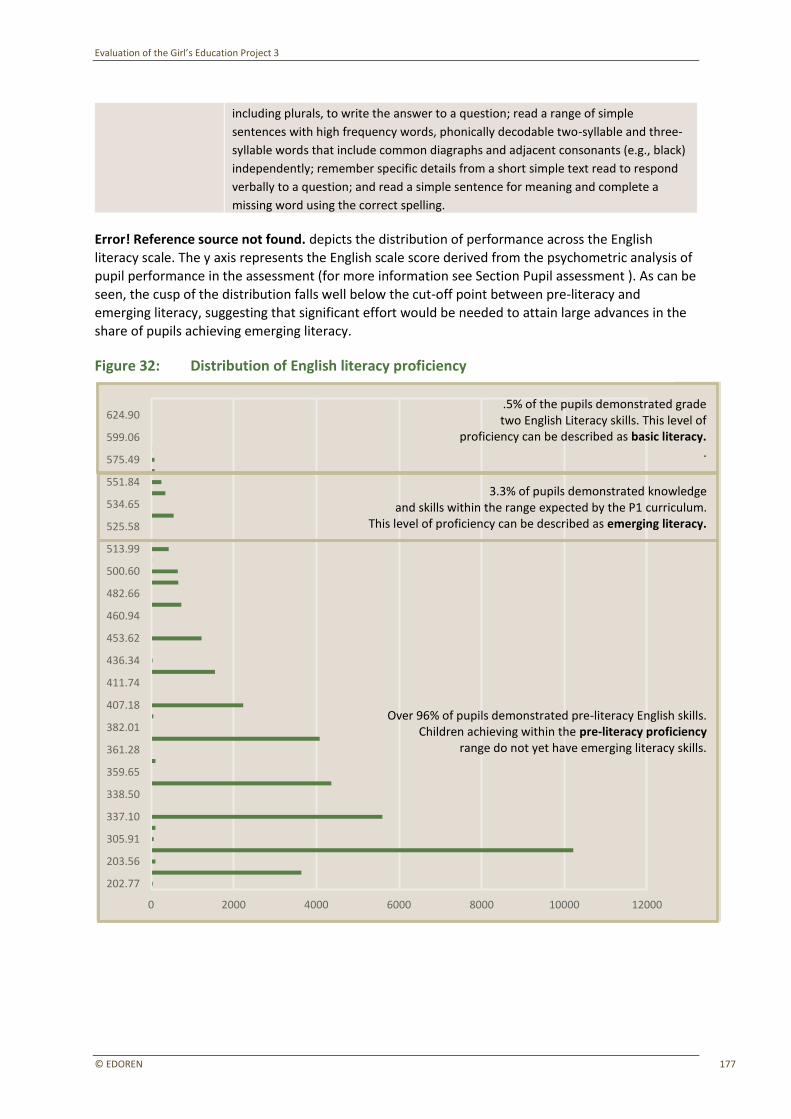
Evaluation of the Girl’s Education Project 3
© EDOREN 177
including plurals, to write the answer to a question; read a range of simple
sentences with high frequency words, phonically decodable two-syllable and three-
syllable words that include common diagraphs and adjacent consonants (e.g., black)
independently; remember specific details from a short simple text read to respond
verbally to a question; and read a simple sentence for meaning and complete a
missing word using the correct spelling.
Error! Reference source not found. depicts the distribution of performance across the English
literacy scale. The y axis represents the English scale score derived from the psychometric analysis of pupil performance in the assessment (for more information see Section Pupil assessment ). As can be seen, the cusp of the distribution falls well below the cut-off point between pre-literacy and emerging literacy, suggesting that significant effort would be needed to attain large advances in the share of pupils achieving emerging literacy.
Figure 32: Distribution of English literacy proficiency
202.77
203.56
305.91
337.10
338.50
359.65
361.28
382.01
407.18
411.74
436.34
453.62
460.94
482.66
500.60
513.99
525.58
534.65
551.84
575.49
599.06
624.90
0 2000 4000 6000 8000 10000 12000
Over 96% of pupils demonstrated pre-literacy English skills. Children achieving within the pre-literacy proficiency
range do not yet have emerging literacy skills.
.5% of the pupils demonstrated grade two English Literacy skills. This level of
proficiency can be described as basic literacy. .
3.3% of pupils demonstrated knowledge and skills within the range expected by the P1 curriculum.
This level of proficiency can be described as emerging literacy.
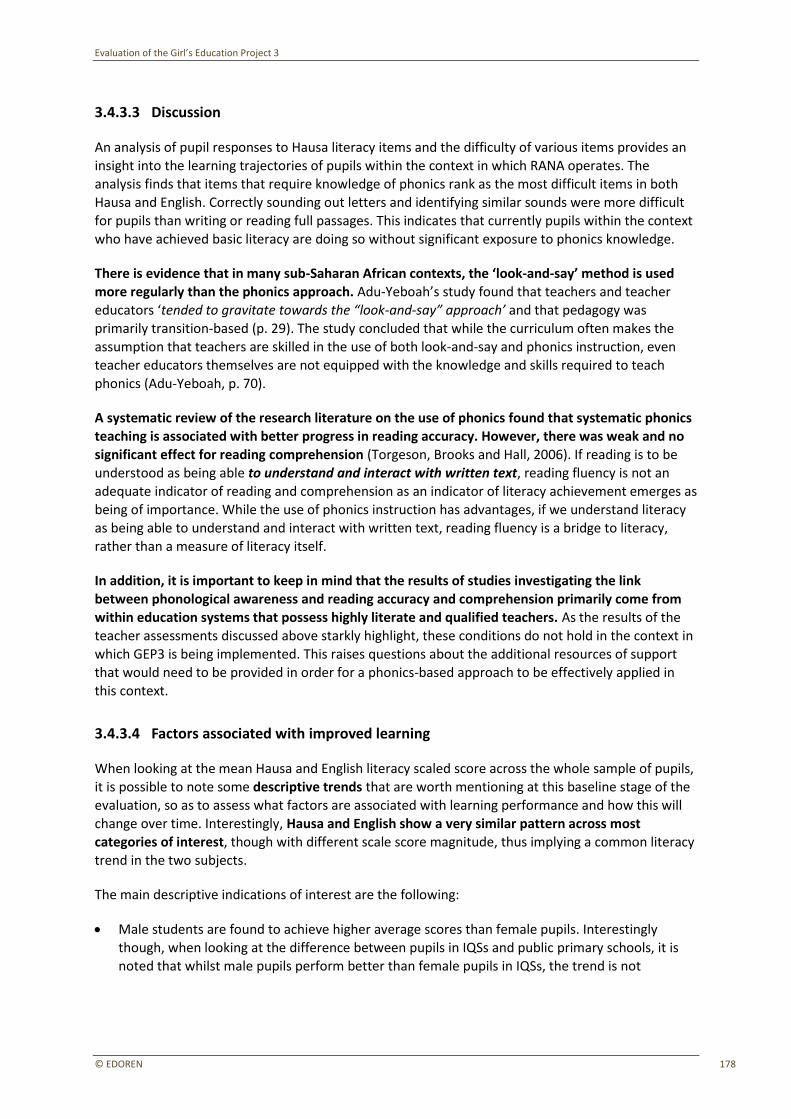
Evaluation of the Girl’s Education Project 3
© EDOREN 178
3.4.3.3 Discussion
An analysis of pupil responses to Hausa literacy items and the difficulty of various items provides an
insight into the learning trajectories of pupils within the context in which RANA operates. The analysis finds that items that require knowledge of phonics rank as the most difficult items in both Hausa and English. Correctly sounding out letters and identifying similar sounds were more difficult for pupils than writing or reading full passages. This indicates that currently pupils within the context who have achieved basic literacy are doing so without significant exposure to phonics knowledge.
There is evidence that in many sub-Saharan African contexts, the ‘look-and-say’ method is used more regularly than the phonics approach. Adu-Yeboah’s study found that teachers and teacher educators ‘tended to gravitate towards the “look-and-say” approach’ and that pedagogy was primarily transition-based (p. 29). The study concluded that while the curriculum often makes the assumption that teachers are skilled in the use of both look-and-say and phonics instruction, even
teacher educators themselves are not equipped with the knowledge and skills required to teach
phonics (Adu-Yeboah, p. 70).
A systematic review of the research literature on the use of phonics found that systematic phonics
teaching is associated with better progress in reading accuracy. However, there was weak and no
significant effect for reading comprehension (Torgeson, Brooks and Hall, 2006). If reading is to be understood as being able to understand and interact with written text, reading fluency is not an
adequate indicator of reading and comprehension as an indicator of literacy achievement emerges as being of importance. While the use of phonics instruction has advantages, if we understand literacy as being able to understand and interact with written text, reading fluency is a bridge to literacy,
rather than a measure of literacy itself.
In addition, it is important to keep in mind that the results of studies investigating the link
between phonological awareness and reading accuracy and comprehension primarily come from within education systems that possess highly literate and qualified teachers. As the results of the
teacher assessments discussed above starkly highlight, these conditions do not hold in the context in which GEP3 is being implemented. This raises questions about the additional resources of support
that would need to be provided in order for a phonics-based approach to be effectively applied in this context.
3.4.3.4 Factors associated with improved learning
When looking at the mean Hausa and English literacy scaled score across the whole sample of pupils, it is possible to note some descriptive trends that are worth mentioning at this baseline stage of the evaluation, so as to assess what factors are associated with learning performance and how this will change over time. Interestingly, Hausa and English show a very similar pattern across most
categories of interest, though with different scale score magnitude, thus implying a common literacy trend in the two subjects.
The main descriptive indications of interest are the following:
• Male students are found to achieve higher average scores than female pupils. Interestingly though, when looking at the difference between pupils in IQSs and public primary schools, it is noted that whilst male pupils perform better than female pupils in IQSs, the trend is not
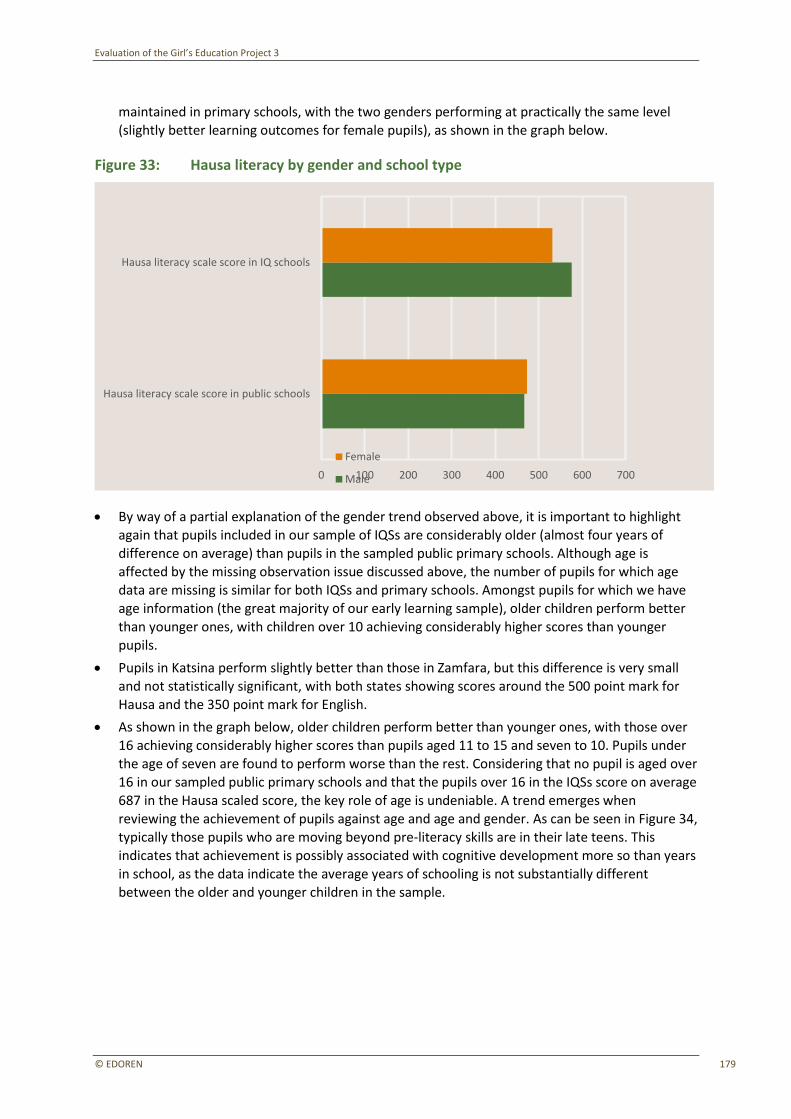
Evaluation of the Girl’s Education Project 3
© EDOREN 179
maintained in primary schools, with the two genders performing at practically the same level
(slightly better learning outcomes for female pupils), as shown in the graph below.
Figure 33: Hausa literacy by gender and school type
• By way of a partial explanation of the gender trend observed above, it is important to highlight again that pupils included in our sample of IQSs are considerably older (almost four years of
difference on average) than pupils in the sampled public primary schools. Although age is affected by the missing observation issue discussed above, the number of pupils for which age
data are missing is similar for both IQSs and primary schools. Amongst pupils for which we have age information (the great majority of our early learning sample), older children perform better
than younger ones, with children over 10 achieving considerably higher scores than younger pupils.
• Pupils in Katsina perform slightly better than those in Zamfara, but this difference is very small
and not statistically significant, with both states showing scores around the 500 point mark for Hausa and the 350 point mark for English.
• As shown in the graph below, older children perform better than younger ones, with those over
16 achieving considerably higher scores than pupils aged 11 to 15 and seven to 10. Pupils under the age of seven are found to perform worse than the rest. Considering that no pupil is aged over
16 in our sampled public primary schools and that the pupils over 16 in the IQSs score on average 687 in the Hausa scaled score, the key role of age is undeniable. A trend emerges when reviewing the achievement of pupils against age and age and gender. As can be seen in Figure 34, typically those pupils who are moving beyond pre-literacy skills are in their late teens. This indicates that achievement is possibly associated with cognitive development more so than years
in school, as the data indicate the average years of schooling is not substantially different between the older and younger children in the sample.
Hausa literacy scale score in public schools
Hausa literacy scale score in IQ schools
0 100 200 300 400 500 600 700
Female
Male
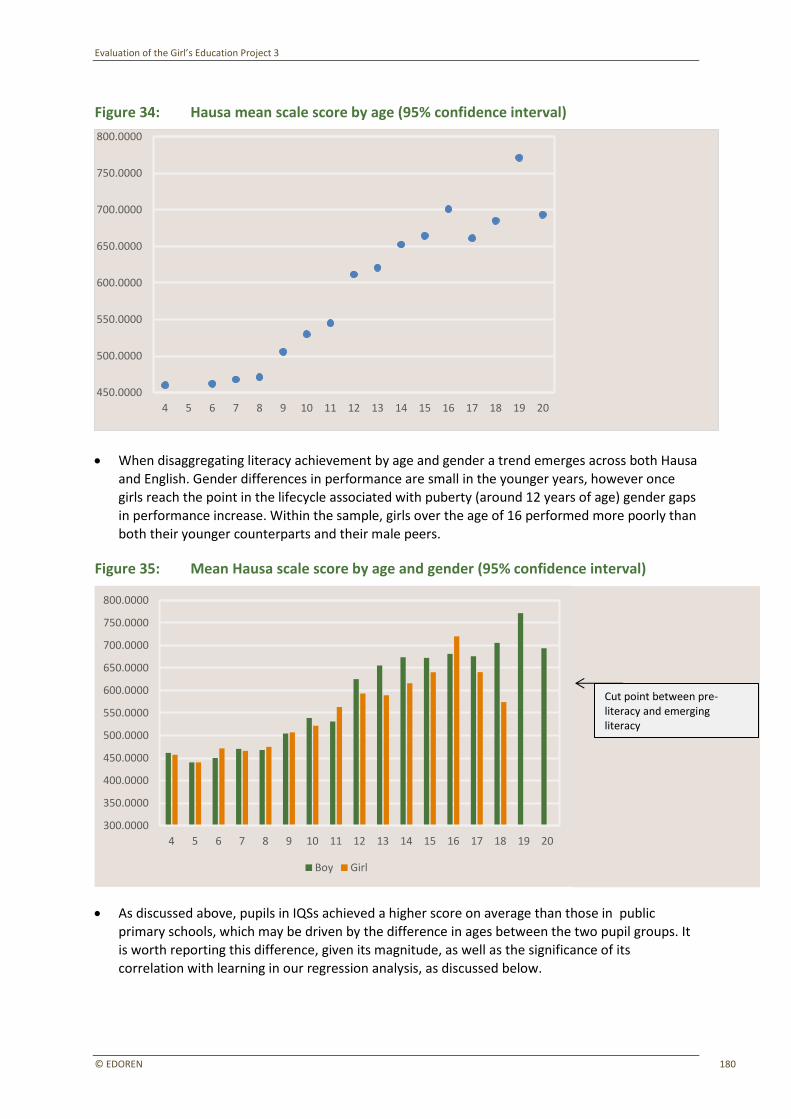
Evaluation of the Girl’s Education Project 3
© EDOREN 180
Figure 34: Hausa mean scale score by age (95% confidence interval)
• When disaggregating literacy achievement by age and gender a trend emerges across both Hausa
and English. Gender differences in performance are small in the younger years, however once girls reach the point in the lifecycle associated with puberty (around 12 years of age) gender gaps
in performance increase. Within the sample, girls over the age of 16 performed more poorly than both their younger counterparts and their male peers.
Figure 35: Mean Hausa scale score by age and gender (95% confidence interval)
• As discussed above, pupils in IQSs achieved a higher score on average than those in public primary schools, which may be driven by the difference in ages between the two pupil groups. It is worth reporting this difference, given its magnitude, as well as the significance of its correlation with learning in our regression analysis, as discussed below.
4 5 6 7 8 9 10 11 12 13 14 15 16 17 18 19 20
450.0000
500.0000
550.0000
600.0000
650.0000
700.0000
750.0000
800.0000
4 5 6 7 8 9 10 11 12 13 14 15 16 17 18 19 20
300.0000
350.0000
400.0000
450.0000
500.0000
550.0000
600.0000
650.0000
700.0000
750.0000
800.0000
Boy Girl
Cut point between pre-literacy and emerging literacy
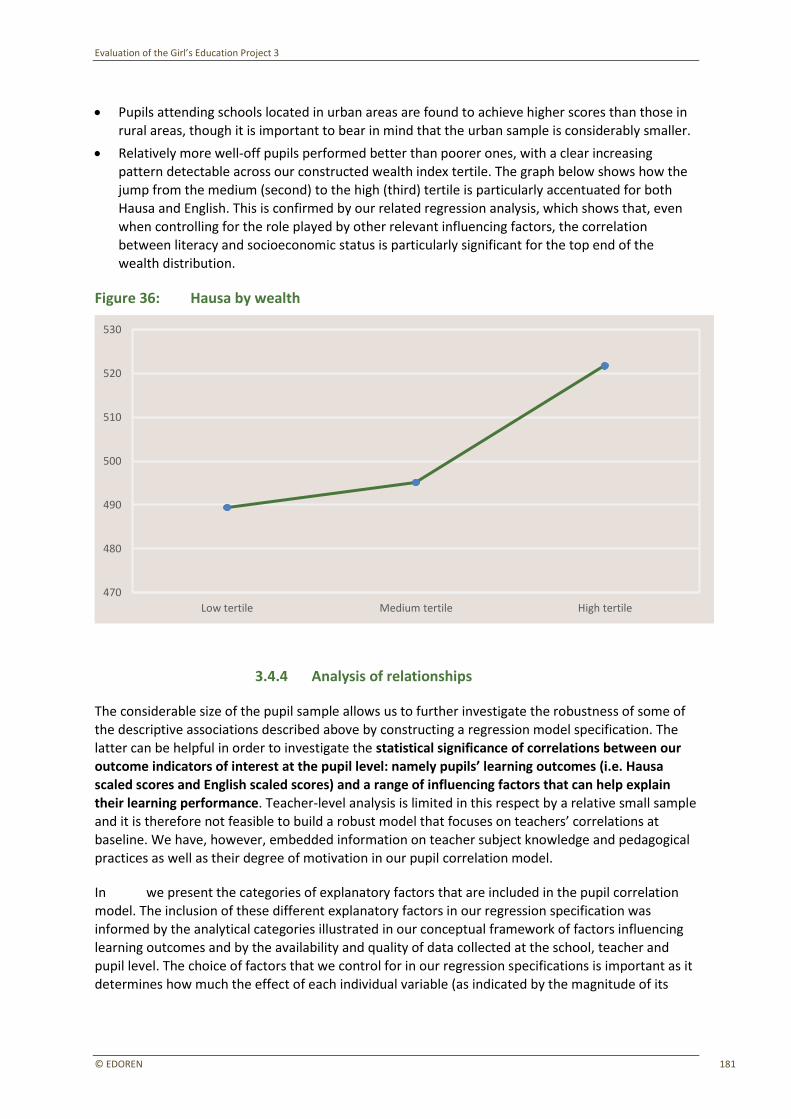
Evaluation of the Girl’s Education Project 3
© EDOREN 181
• Pupils attending schools located in urban areas are found to achieve higher scores than those in
rural areas, though it is important to bear in mind that the urban sample is considerably smaller.
• Relatively more well-off pupils performed better than poorer ones, with a clear increasing
pattern detectable across our constructed wealth index tertile. The graph below shows how the jump from the medium (second) to the high (third) tertile is particularly accentuated for both Hausa and English. This is confirmed by our related regression analysis, which shows that, even when controlling for the role played by other relevant influencing factors, the correlation between literacy and socioeconomic status is particularly significant for the top end of the
wealth distribution.
Figure 36: Hausa by wealth
3.4.4 Analysis of relationships
The considerable size of the pupil sample allows us to further investigate the robustness of some of
the descriptive associations described above by constructing a regression model specification. The latter can be helpful in order to investigate the statistical significance of correlations between our
outcome indicators of interest at the pupil level: namely pupils’ learning outcomes (i.e. Hausa scaled scores and English scaled scores) and a range of influencing factors that can help explain their learning performance. Teacher-level analysis is limited in this respect by a relative small sample
and it is therefore not feasible to build a robust model that focuses on teachers’ correlations at baseline. We have, however, embedded information on teacher subject knowledge and pedagogical
practices as well as their degree of motivation in our pupil correlation model.
In Box 7 we present the categories of explanatory factors that are included in the pupil correlation
model. The inclusion of these different explanatory factors in our regression specification was informed by the analytical categories illustrated in our conceptual framework of factors influencing learning outcomes and by the availability and quality of data collected at the school, teacher and pupil level. The choice of factors that we control for in our regression specifications is important as it determines how much the effect of each individual variable (as indicated by the magnitude of its
Low tertile Medium tertile High tertile
470
480
490
500
510
520
530
Evaluation of the Girl’s Education Project 3
© EDOREN 182
coefficient and the significance level reflected by its p-value) detected can be considered robust to
other potentially confounding factors.
For this reason we have decided to use the available information on age in our main regression specification, given the critical influence of this demographic characteristic on learning. As discussed above, though, age data are not available for all pupils; therefore, the sample size for our main
regression is 1,613 observations. Although this still represents a sizeable sample for the analysis, there is a risk of bias in the regression estimates due to the exclusion of pupils for which there is no information on age. In order to determine whether this is in fact an issue, we have undertaken two different robustness tests. On the one hand we have imputed the age group distribution of pupils for which information is missing on the basis of the distribution of the sample with age information,
separately for IQSs and primary schools. On the other hand, we have also built a regression specification without any age variable, but instead including a variable on whether the pupil is a boarder or not instead. This variable was chosen as pupils who are boarders are older than non-boarders. As shown by the regression results the indication emerging from our main regression
model, which includes the original age variable, is confirmed by these two alternative specifications. Hence, this gives us confidence that age can be controlled for as one of the key factors influencing learning.
The inclusion of pupil-, teacher- and school-level factors entails that the effect of each variable is isolated from the confounding factors that we control for at those analytical levels. At the same time,
we have also built a school-level fixed effects model, which allows us to focus on the influence of pupil-level variables, whilst controlling for all school-level confounders (observable and
unobservable).
Box 7: Explanatory factors included in the pupils correlation model
• Pupil personal characteristics, including gender and age group
• Pupil socioeconomic status, as defined by the HWI tertile categorisation
• Pupil school information, including whether pupils attend public primary schools or IQSs, whether they attend other schools in parallel and whether they can write
• Location information, including whether the school is in Katsina or Zamfara and whether it is located in an urban or rural area
• School infrastructure96, including whether the school has separate toilets for girls and whether it has access to a source of drinking water
• Teacher average motivation, as defined in our overall motivation index illustrated above, in the school attended by the pupil
• Teacher average subject and pedagogical knowledge, as defined in the relevant indexes illustrated in the section above, in the school attended by the pupil:
• teacher knowledge 1: teacher subject knowledge;
• teacher knowledge 2: teacher syllabus and curriculum knowledge;
96 Other variables for school context information, including for instance electricity or pupil/teacher, teacher/classroom, pupil/classroom and pupil and teacher gender ratios were not included as they would have reduced the regression sample size. Data on the factors above and other school aspects were in fact collected only from a limited number of schools. Information on class size was also collected as part of the lesson observation exercise through manual counting in each school. When including this variable in the model no significant correlation is detected and the other explanatory variables approximately maintain their direction, magnitude and significance. In any case, this alternative class size variable has not been included in the correlation model specification as it is not representative of the average class sizes in our early learning schools.
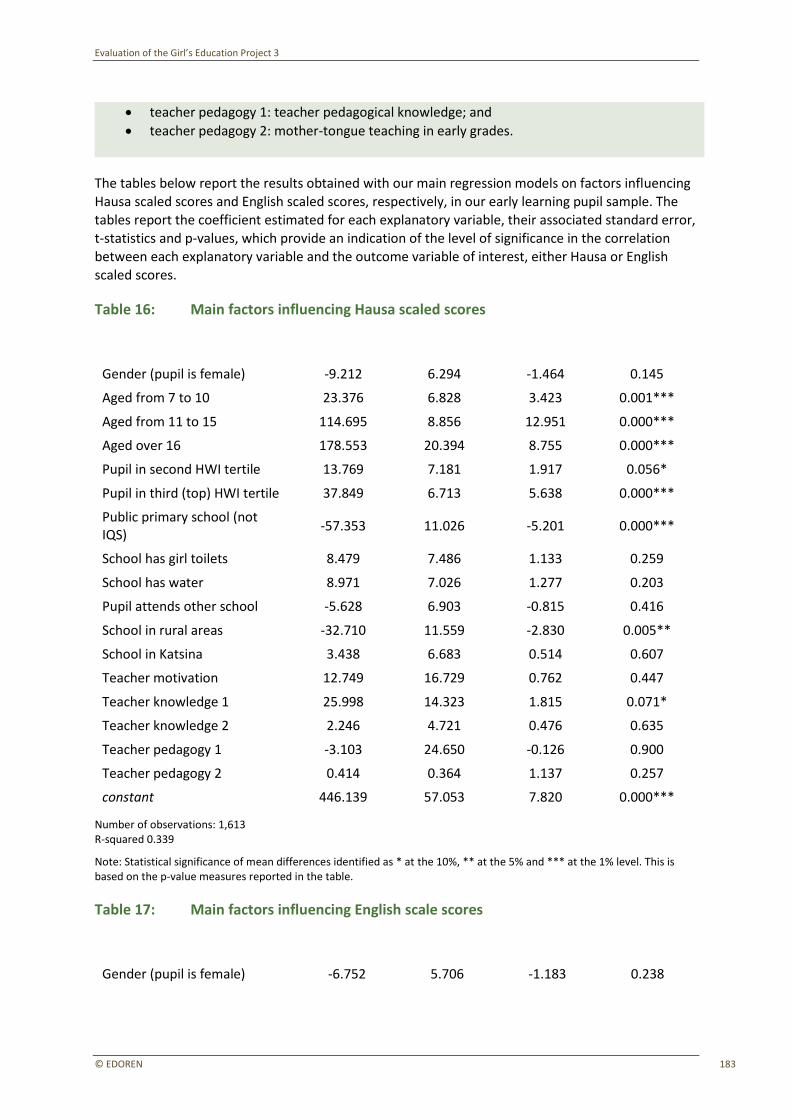
Evaluation of the Girl’s Education Project 3
© EDOREN 183
• teacher pedagogy 1: teacher pedagogical knowledge; and
• teacher pedagogy 2: mother-tongue teaching in early grades.
The tables below report the results obtained with our main regression models on factors influencing
Hausa scaled scores and English scaled scores, respectively, in our early learning pupil sample. The tables report the coefficient estimated for each explanatory variable, their associated standard error, t-statistics and p-values, which provide an indication of the level of significance in the correlation between each explanatory variable and the outcome variable of interest, either Hausa or English scaled scores.
Table 16: Main factors influencing Hausa scaled scores
Variables Coeff. Std err T-stat P-value
Gender (pupil is female) -9.212 6.294 -1.464 0.145
Aged from 7 to 10 23.376 6.828 3.423 0.001***
Aged from 11 to 15 114.695 8.856 12.951 0.000***
Aged over 16 178.553 20.394 8.755 0.000***
Pupil in second HWI tertile 13.769 7.181 1.917 0.056*
Pupil in third (top) HWI tertile 37.849 6.713 5.638 0.000***
Public primary school (not IQS)
-57.353 11.026 -5.201 0.000***
School has girl toilets 8.479 7.486 1.133 0.259
School has water 8.971 7.026 1.277 0.203
Pupil attends other school -5.628 6.903 -0.815 0.416
School in rural areas -32.710 11.559 -2.830 0.005**
School in Katsina 3.438 6.683 0.514 0.607
Teacher motivation 12.749 16.729 0.762 0.447
Teacher knowledge 1 25.998 14.323 1.815 0.071*
Teacher knowledge 2 2.246 4.721 0.476 0.635
Teacher pedagogy 1 -3.103 24.650 -0.126 0.900
Teacher pedagogy 2 0.414 0.364 1.137 0.257
constant 446.139 57.053 7.820 0.000***
Number of observations: 1,613 R-squared 0.339
Note: Statistical significance of mean differences identified as * at the 10%, ** at the 5% and *** at the 1% level. This is based on the p-value measures reported in the table.
Table 17: Main factors influencing English scale scores
Variable Names Coeff. Std err T-stat P-value
Gender (pupil is female) -6.752 5.706 -1.183 0.238

Evaluation of the Girl’s Education Project 3
© EDOREN 184
Aged from 7 to 10 18.687 6.733 2.775 0.006**
Aged from 11 to 15 82.448 9.185 8.977 0.000***
Aged over 16 126.046 14.208 8.871 0.000***
Pupil in second HWI tertile 16.665 5.759 2.894 0.004**
Pupil in third (top) HWI tertile 27.566 5.902 4.671 0.000***
Public primary school (not IQS) -45.609 8.715 -5.234 0.000***
School has girl toilets 13.246 6.512 2.034 0.043**
School has water 7.182 5.873 1.223 0.223
Pupil attends other school 3.371 6.704 0.503 0.616
School in rural areas -28.869 9.372 -3.080 0.002**
School in Katsina 4.834 5.710 0.847 0.398
Teacher motivation 21.505 15.426 1.394 0.165
Teacher knowledge 1 15.479 12.668 1.222 0.223
Teacher knowledge 2 -0.142 3.710 -0.038 0.970
Teacher pedagogy 1 -18.557 20.066 -0.925 0.356
Teacher pedagogy 2 0.192 0.350 0.550 0.583
constant 278.692 53.062 5.252 0.000***
Number of observations: 1,613 R-squared: 0.332
Note: Statistical significance of mean differences identified as * at the 10%, ** at the 5% and *** at the 1% level. This is based on the p-value measures reported in the table.
The first clear indication emerging from the results is that teacher- and school-level factors do not
appear to be significantly correlated with literacy learning outcomes. In particular, none of the teacher motivation, knowledge or pedagogy indexes are found to be significantly associated with either Hausa or English scores. Previous model iterations that included each index separately also
confirm that no correlation is detected. The lack of a detectable correlation between teacher knowledge and skills and learning outcomes seems to be in line with what emerged from the
descriptive and teacher assessment analyses presented above. In particular, the very low competency levels recorded for teachers in early learning schools can help explain why their current subject knowledge and teaching practices are not influencing pupils’ learning outcomes.
At the same time, school context variables, such as presence of separate toilets for girls and presence of a source of drinking water in the school, also do not show any significant correlation with
Hausa. Whilst the state location of the school, in either Katsina or Zamfara, does not have any association with literacy outcomes, the level of urbanisation is shown to be correlated with learning. Pupils attending schools in rural areas are found to achieve lower Hausa and English scores than
those in urban areas, a correlation that is significant in statistical terms and slightly stronger for Hausa than English in terms of magnitude. Finally, an important finding of our correlation analysis, which seems to also confirm in this case the indications of the descriptive associations discussed in the previous sections, is that pupils in public primary schools appear to achieve lower literacy scores
in both languages tested than pupils in IQSs. The negative correlation between literacy and public primary schools is larger (size of the coefficient) for Hausa than English scores. Whilst the descriptive statistics also pointed towards a difference in age between the groups of pupils, which could partially
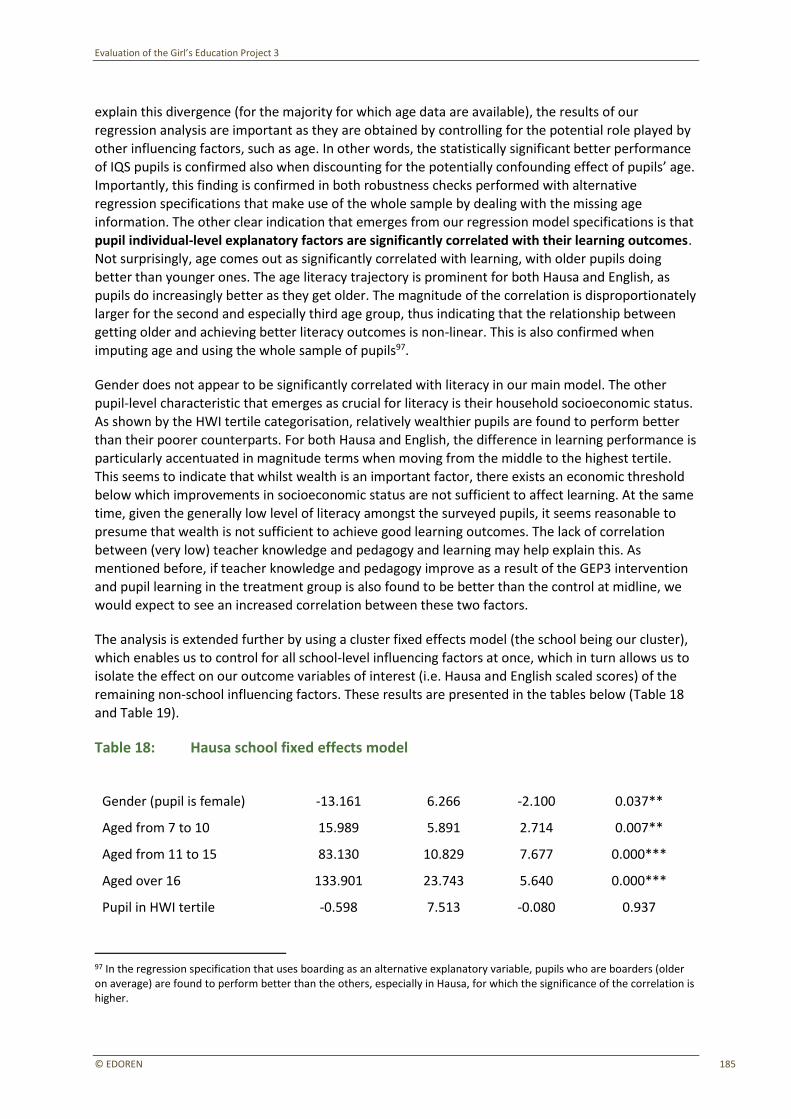
Evaluation of the Girl’s Education Project 3
© EDOREN 185
explain this divergence (for the majority for which age data are available), the results of our
regression analysis are important as they are obtained by controlling for the potential role played by other influencing factors, such as age. In other words, the statistically significant better performance of IQS pupils is confirmed also when discounting for the potentially confounding effect of pupils’ age. Importantly, this finding is confirmed in both robustness checks performed with alternative
regression specifications that make use of the whole sample by dealing with the missing age information. The other clear indication that emerges from our regression model specifications is that pupil individual-level explanatory factors are significantly correlated with their learning outcomes. Not surprisingly, age comes out as significantly correlated with learning, with older pupils doing better than younger ones. The age literacy trajectory is prominent for both Hausa and English, as
pupils do increasingly better as they get older. The magnitude of the correlation is disproportionately larger for the second and especially third age group, thus indicating that the relationship between getting older and achieving better literacy outcomes is non-linear. This is also confirmed when imputing age and using the whole sample of pupils97.
Gender does not appear to be significantly correlated with literacy in our main model. The other pupil-level characteristic that emerges as crucial for literacy is their household socioeconomic status. As shown by the HWI tertile categorisation, relatively wealthier pupils are found to perform better
than their poorer counterparts. For both Hausa and English, the difference in learning performance is particularly accentuated in magnitude terms when moving from the middle to the highest tertile.
This seems to indicate that whilst wealth is an important factor, there exists an economic threshold below which improvements in socioeconomic status are not sufficient to affect learning. At the same
time, given the generally low level of literacy amongst the surveyed pupils, it seems reasonable to presume that wealth is not sufficient to achieve good learning outcomes. The lack of correlation between (very low) teacher knowledge and pedagogy and learning may help explain this. As
mentioned before, if teacher knowledge and pedagogy improve as a result of the GEP3 intervention and pupil learning in the treatment group is also found to be better than the control at midline, we
would expect to see an increased correlation between these two factors.
The analysis is extended further by using a cluster fixed effects model (the school being our cluster),
which enables us to control for all school-level influencing factors at once, which in turn allows us to isolate the effect on our outcome variables of interest (i.e. Hausa and English scaled scores) of the
remaining non-school influencing factors. These results are presented in the tables below (Table 18 and Table 19).
Table 18: Hausa school fixed effects model
Variables Coeff. Std err T-stat P-value
Gender (pupil is female) -13.161 6.266 -2.100 0.037**
Aged from 7 to 10 15.989 5.891 2.714 0.007**
Aged from 11 to 15 83.130 10.829 7.677 0.000***
Aged over 16 133.901 23.743 5.640 0.000***
Pupil in HWI tertile -0.598 7.513 -0.080 0.937
97 In the regression specification that uses boarding as an alternative explanatory variable, pupils who are boarders (older on average) are found to perform better than the others, especially in Hausa, for which the significance of the correlation is higher.
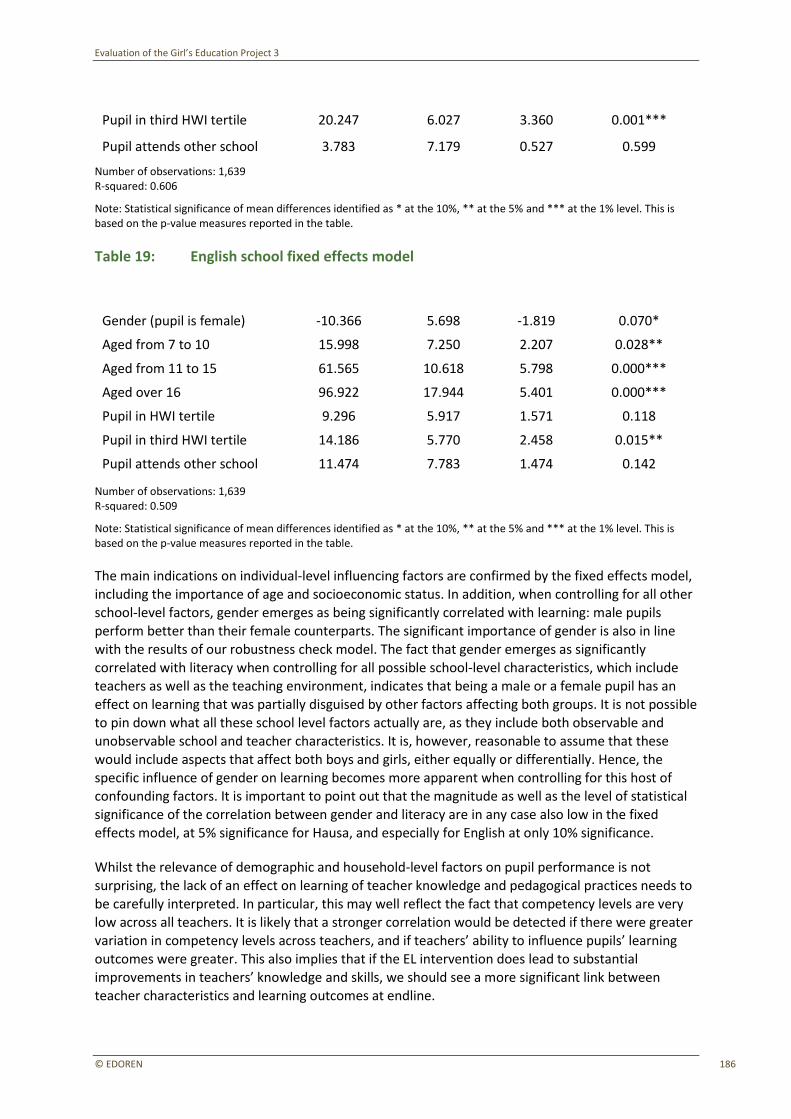
Evaluation of the Girl’s Education Project 3
© EDOREN 186
Pupil in third HWI tertile 20.247 6.027 3.360 0.001***
Pupil attends other school 3.783 7.179 0.527 0.599
Number of observations: 1,639 R-squared: 0.606
Note: Statistical significance of mean differences identified as * at the 10%, ** at the 5% and *** at the 1% level. This is based on the p-value measures reported in the table.
Table 19: English school fixed effects model
Variables Coeff. Std err T-stat P-value
Gender (pupil is female) -10.366 5.698 -1.819 0.070*
Aged from 7 to 10 15.998 7.250 2.207 0.028**
Aged from 11 to 15 61.565 10.618 5.798 0.000***
Aged over 16 96.922 17.944 5.401 0.000***
Pupil in HWI tertile 9.296 5.917 1.571 0.118
Pupil in third HWI tertile 14.186 5.770 2.458 0.015**
Pupil attends other school 11.474 7.783 1.474 0.142
Number of observations: 1,639 R-squared: 0.509
Note: Statistical significance of mean differences identified as * at the 10%, ** at the 5% and *** at the 1% level. This is based on the p-value measures reported in the table.
The main indications on individual-level influencing factors are confirmed by the fixed effects model,
including the importance of age and socioeconomic status. In addition, when controlling for all other school-level factors, gender emerges as being significantly correlated with learning: male pupils
perform better than their female counterparts. The significant importance of gender is also in line with the results of our robustness check model. The fact that gender emerges as significantly
correlated with literacy when controlling for all possible school-level characteristics, which include
teachers as well as the teaching environment, indicates that being a male or a female pupil has an effect on learning that was partially disguised by other factors affecting both groups. It is not possible to pin down what all these school level factors actually are, as they include both observable and unobservable school and teacher characteristics. It is, however, reasonable to assume that these would include aspects that affect both boys and girls, either equally or differentially. Hence, the
specific influence of gender on learning becomes more apparent when controlling for this host of confounding factors. It is important to point out that the magnitude as well as the level of statistical significance of the correlation between gender and literacy are in any case also low in the fixed effects model, at 5% significance for Hausa, and especially for English at only 10% significance.
Whilst the relevance of demographic and household-level factors on pupil performance is not
surprising, the lack of an effect on learning of teacher knowledge and pedagogical practices needs to be carefully interpreted. In particular, this may well reflect the fact that competency levels are very
low across all teachers. It is likely that a stronger correlation would be detected if there were greater variation in competency levels across teachers, and if teachers’ ability to influence pupils’ learning outcomes were greater. This also implies that if the EL intervention does lead to substantial improvements in teachers’ knowledge and skills, we should see a more significant link between teacher characteristics and learning outcomes at endline.
Evaluation of the Girl’s Education Project 3
© EDOREN 187
3.4.5 Pre-analysis plan for impact measurement at midline
The descriptive and correlation analyses presented above present baseline benchmark values for the
GEP3 impact evaluation by focusing on the baseline situation of two main areas: on the one hand, the baseline analysis draws a summary picture of the main teachers’ and pupils’ knowledge and skills, as well as their background characteristics; on the other hand, they provide an insight into significant associations and correlations between outcome indicators and categories of interest, which shed light on the factors that are found to influence pupils’ learning, including the role of
teacher-level intermediate outcomes.
At midline, there will be a first assessment of the impact of GEP3 on the early learning intervention sample under evaluation, which will be informed by both sets of baseline information. Quantitative data will be again collected on Hausa and English outcomes, as well as teacher subject knowledge and practices. Two sets of analysis are planned:
1. Impact analysis: quantitative measurement of the impact of the GEP3 early learning intervention on pupil learning outcomes (i.e. Hausa and English scaled scores), as well as teachers’ knowledge and skills, by comparing the outcome levels of treatment observations (i.e.
pupils and teachers) with the outcome level of control observations. Disaggregated analysis by
girls and boys will be conducted depending on the statistical power available, which in turn will depend on the size of the disaggregated sub-samples.
2. Correlation analysis: analysis of factors influencing learning outcomes after the GEP3 intervention has taken place and teachers’ knowledge and practices are supposed to have improved accordingly. This analysis will be directly comparable to the regression analysis
performed at baseline to assess whether the significance of the correlations have changed as a result of GEP3.
If the impact analysis shows that there is a significant difference between treatment and control
groups attributable to the GEP3 early learning intervention, the correlation analysis of influencing
factors will help determine whether this has also affected the role played by school-level factors directly in regard to learning. If teachers’ knowledge and pedagogy improve from the low benchmark
levels measured at baseline, it seems reasonable to expect that their influence on Hausa and English scaled scores will also increase. This would indeed be in line with the assumptions behind the programme and evaluation ToC. This demonstrates the crucial relevance of the baseline analysis, with respect to the midline impact analysis.
The econometric model envisaged for midline will also take advantage of the additional parameters and modelling options that will be available at that stage. If the comparison between treatment and control groups shows a positive and significant difference in outcome indicators attributable to GEP3 it will be important to account for which of the two groups pupils and teachers belong to in our regression specification, with the use of a dummy variable. This will allow us to maintain our overall
sample size intact, whilst discounting the direct influence of intervention impact from the other
correlations in the model. Finally, it will also be possible to exploit the longitudinal structure of our
sample in our regression analysis so as to control for time-invariant observed and unobserved factors, and to further isolate the effect of each explanatory variable with the outcome indicators of interest. In order to assess the relevance of this approach, the results of a panel regression analysis will be compared to those of a repeated cross-sectional setting. Any difference in the significance of the correlations captured by the two models can then be attributed to the existence of time-

Evaluation of the Girl’s Education Project 3
© EDOREN 188
invariant unobservable characteristics controlled for in the panel fixed effects model. This range of
econometric techniques will help enrich our midline quantitative analysis.
Evaluation of the Girl’s Education Project 3
© EDOREN 189
4 Baseline of the IQSS evaluation
4.1 GEP3’s IQSS
4.1.1 Objectives and expected results
GEP3’s strategy for integrated Qur’anic education focuses on the improvement of education in IQSs, with the aim of providing an acceptable alternative form of quality basic education for girls.98 The final outcomes expected are: improved learning outcomes in basic literacy and numeracy
(especially for girls), improved retention of girls, and, to a lesser extent, increased enrolment of girls.
At school-community level, the IQSS focuses, in the first instance, on strengthening the quality of teaching and, secondly, on improving the learning environment, especially for girls, with increased community participation through CBMCs. At the supra-school level GEP3 seeks to enhance the
capacity of the local government authority to support effective management and improve coordination and dialogue that contributes to planning, coordination and policy.
4.1.2 Intervention strategy
GEP3 targets registered IQTEs that implement an integrated curriculum (becoming IQSs) and largely operate as community-based initiatives, but that are willing to build links with government for the purposes of monitoring and technical support. At least 40% of the students enrolled should be
girls for the IQS to be supported by GEP3.
During the 2015–2017 period 200 IQSs per state across the six GEP3 LGAs in Niger, Bauchi and
Sokoto are receiving a full school-level support package. In all states, except Bauchi, the IQSs that are being supported during this period were already targeted during GEP3’s initial years.99 During the
scale-up phase (2017–2020) the project seeks to expand to an additional 7,500 IQSs, of which 4,500 will receive GEP3 financial support to implement the support package.
The IQSS package at school community level consists of the following:
1. Training and mentoring of IQS facilitators100
GEP3 supports centre- or cluster-based training that aims to strengthen facilitators’ classroom practices and to ensure facilitators become more effective teachers of core subjects. Two facilitators who teach core curriculum subjects are targeted per IQS. At the core of the training are monthly cluster-level training/mentoring meetings between a group of IQS facilitators and a Teacher Facilitator, who acts as trainer and mentor.101 During the meetings at a central location in the LGA facilitators review the curriculum for the following month, receive guidance on it, watch demonstration lessons, and have the chance to give feedback. Experienced Teacher
98 UNICEF (2015b). After the GEP3 re-design in 2014, the focus of GEP3 support shifted from supporting the integration of Qur’anic schools to ensuring that Qur’anic schools, once they have agreed to integration, are able to implement the integrated curriculum at a level of quality such that pupils actually learn. 99 In Bauchi, a whole new list of IQSs has been selected, and therefore these IQSs may receive GEP3 support for the first time. 100 The approach to the training and mentoring of IQS facilitators is based on the approach and pedagogy materials used by the TDP. 101 Teacher Facilitators are selected from SAMEs, SUBEBs and LGEAs.
Evaluation of the Girl’s Education Project 3
© EDOREN 190
Development Team members observe the mentoring sessions. Before the start of the 1.5-year cycle of monthly meetings the IQS facilitators attend a joint five-day induction workshop, in which they are introduced to basic pedagogical concepts and the usage of the teacher training modules. The training covers both pedagogy and subject matter (English, mathematics and sciences). The content is based on the content developed by the TDP for primary school teacher training. The manual is slightly adapted to suit the IQS context and is translated into Hausa.
A first cohort of one IQS facilitator per IQS attended the induction workshop in August/September 2015. A second facilitator from each IQS will start the training and mentoring cycle in the July–September 2016 quarter.
2. Provision of a package of classroom teaching and learning materials
GEP3 does not aim to develop new classroom materials for teachers or learners.102 In coordination with the states, locally available teaching and learning aids for lower primary grades will be procured and distributed to each IQS. Currently, the following materials have been identified: Hausa alphabet chart, Hausa consonant and vowel flash cards, Hausa alphabet text book, a Hausa alphabet handwriting workbook, and a Hausa numerical textbook.103
The materials are planned to be delivered to the IQSs by April–May 2016.
3. Training of head teachers
According to the GEP3 Strategy Paper on IQSs (UNICEF 2015b), head teacher training is meant to improve head teachers’ centre-based management and pedagogical skills. The actual content of the training is still under development.104 It is not yet clear who will be targeted for the training as not all IQSs have a head teacher position. GEP3 estimate that half of the IQSs may have a person who plays the role of head teacher and who could be trained. The training approach is likely to consist of conducting training sessions of three days per term over a two-year period.105
The training was originally planned to start between April and June 2016 but the actual start date will depend on the timing of the finalisation of the training materials.
4. Capacity building of CBMCs
The capacity building approach for CBMCs follows the training approach for SBMCs, as promoted by UBEC, with support from ESSPIN. It constitutes a combination of an initial multi-day cluster-level training, with follow-up mentoring visits, at least once a term, by the trainers to the CBMCs over a period of nine to 12 months. During the initial training CBMC members are trained on three key subjects: roles and responsibilities of the CBMC, financial management and gender-responsive whole centre development planning.106 A cascade training approach is used with national master trainers training state-level training teams. The state trainers—sourced
102 This is an adjustment compared to the GEP3 Strategy Paper on IQSs (UNICEF 2015b), in which the development of simplified instructional materials and lesson planning guides for facilitators was planned. 103 More specifically, it is planned for each IQS to receive five Hausa alphabet chats, six Hausa consonant and vowel flash cards, five Hausa alphabet textbooks, 20 Hausa alphabet handwriting workbooks, and five Hausa numerical textbooks (Communication with UNICEF d.d. 20 March 2016). 104 First drafts of the head teacher training guide and handbook are expected by the end of March 2016. Their development is led by ESSPIN (Communication with UNICEF d.d. 20 March 2016). 105 The training approach is still under discussion (Communication with UNICEF d.d. 20 March 2016). 106 According to the GEP3 Strategy Paper on SBMCs (UNICEF 2015g) the roles and responsibilities training will enable new members to understand the SBMCs policy, guidelines on the establishment of CBMCs and activities expected to be carried out by CBMCs. The whole school development training builds the capacity of members to effectively participate in evaluating the strengths and weaknesses of their school, to identify improvement priorities and to mobilise resources to support implementation. The financial management training gives CBMCs members basic skills to ensure school resources are effectively used to achieve improvement objectives.
Evaluation of the Girl’s Education Project 3
© EDOREN 191
from SAMEs, SUBEBs, LGAs and CSOs—conduct the cluster-level training and follow-up mentoring visits. Government officials and CSO staff are grouped into pairs to conduct the training and the follow-up mentoring. The training targets four members of each CBMC: the chair and secretary are expected to attend, plus two other members selected by the community from the CBMC membership.
The initial cluster-level training is scheduled to take place in July–September 2016.
5. Provision of mini-grants
GEP3 provides grants to support CBMCs to implement priority activities identified in the Whole Centre Development Plan (WCDP) that directly contribute to the enrolment or retention of girls in the IQS.107 CBMCs are eligible for GEP3 grants after attending the CBMC training and developing a WCDP. A grant can be provided to a CBMC at most twice over a two-year period.108 CBMC grant proposal will be jointly approved by the state government and UNICEF following a recommendation by the LGA.109 110 Grant amounts are planned to be an equivalent of $1,000 per IQS.111
Grants are planned to be provided from the beginning of the 2016–2017 school year.
At supra-school level GEP3 conducts advocacy with SAMEs and SUBEBs in regard to paying facilitator salaries and/or other incentives, and providing textbooks supplied by UBEC. Government-level
support is focused on enabling the involvement of SAME and SUBEB staff at state and LGA level in the training of facilitators and CBMC members, CBMC effectiveness monitoring and grant provision.
CBMC effectiveness monitoring will be conducted termly (three times a year), starting in October–December 2016, and will be carried out by CBMC trainers from SAMEs in all IQSs. In addition, independent enumerators managed by state GEP3 teams will conduct monitoring in a sample of
IQSs.112
Table 20 presents the target results that GEP3 aims to achieve during the pilot period and scale-up period.
107 According to the GEP3 Strategy Paper on SBMCs a secondary objective of the GEP3 grant is to encourage the provision of grants by government to support implementation of WSDPs. 108 A second grant is contingent upon satisfactory implementation of the planned activities and accounting for funds received (Communication with UNICEF d.d. 29 March 2016). 109 This can be the mandate of SAMEs and/or SUBEBs. This is currently not clear and is likely to be specified in the grant guidelines. 110 Grant proposals and approvals will be based on agreed grant guidelines, which are under development (Communication with UNICEF d.d. 20 March 2016). 111 The grant amount is being discussed in order to harmonise the amount across projects (among others, to harmonise with the GPE project). 112 GEP3 state teams and Teacher Facilitators may also conduct lesson observations in order to provide feedback to facilitator cluster meetings. This is still under discussion (Communication with UNICEF d.d. 20 March 2016).
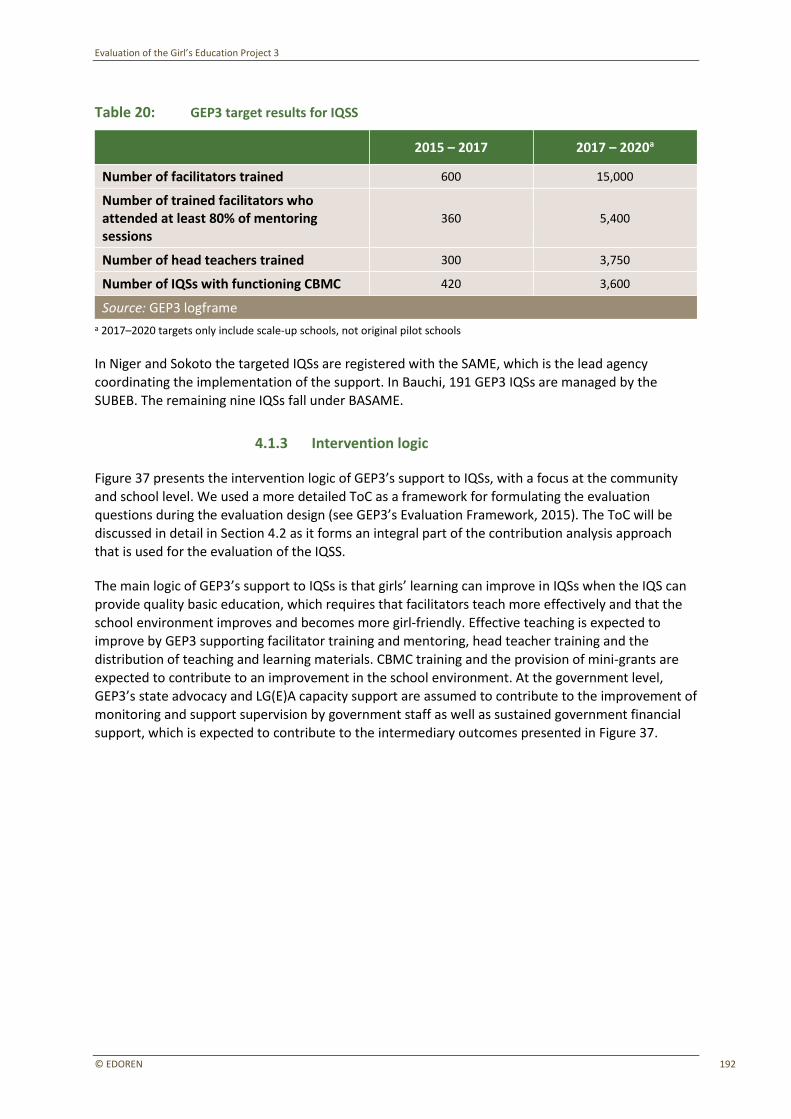
Evaluation of the Girl’s Education Project 3
© EDOREN 192
Table 20: GEP3 target results for IQSS
2015 – 2017 2017 – 2020a
Number of facilitators trained 600 15,000
Number of trained facilitators who attended at least 80% of mentoring sessions
360 5,400
Number of head teachers trained 300 3,750
Number of IQSs with functioning CBMC 420 3,600
Source: GEP3 logframe
a 2017–2020 targets only include scale-up schools, not original pilot schools
In Niger and Sokoto the targeted IQSs are registered with the SAME, which is the lead agency
coordinating the implementation of the support. In Bauchi, 191 GEP3 IQSs are managed by the SUBEB. The remaining nine IQSs fall under BASAME.
4.1.3 Intervention logic
Figure 37 presents the intervention logic of GEP3’s support to IQSs, with a focus at the community
and school level. We used a more detailed ToC as a framework for formulating the evaluation questions during the evaluation design (see GEP3’s Evaluation Framework, 2015). The ToC will be
discussed in detail in Section 4.2 as it forms an integral part of the contribution analysis approach that is used for the evaluation of the IQSS.
The main logic of GEP3’s support to IQSs is that girls’ learning can improve in IQSs when the IQS can
provide quality basic education, which requires that facilitators teach more effectively and that the
school environment improves and becomes more girl-friendly. Effective teaching is expected to improve by GEP3 supporting facilitator training and mentoring, head teacher training and the distribution of teaching and learning materials. CBMC training and the provision of mini-grants are
expected to contribute to an improvement in the school environment. At the government level, GEP3’s state advocacy and LG(E)A capacity support are assumed to contribute to the improvement of
monitoring and support supervision by government staff as well as sustained government financial support, which is expected to contribute to the intermediary outcomes presented in Figure 37.
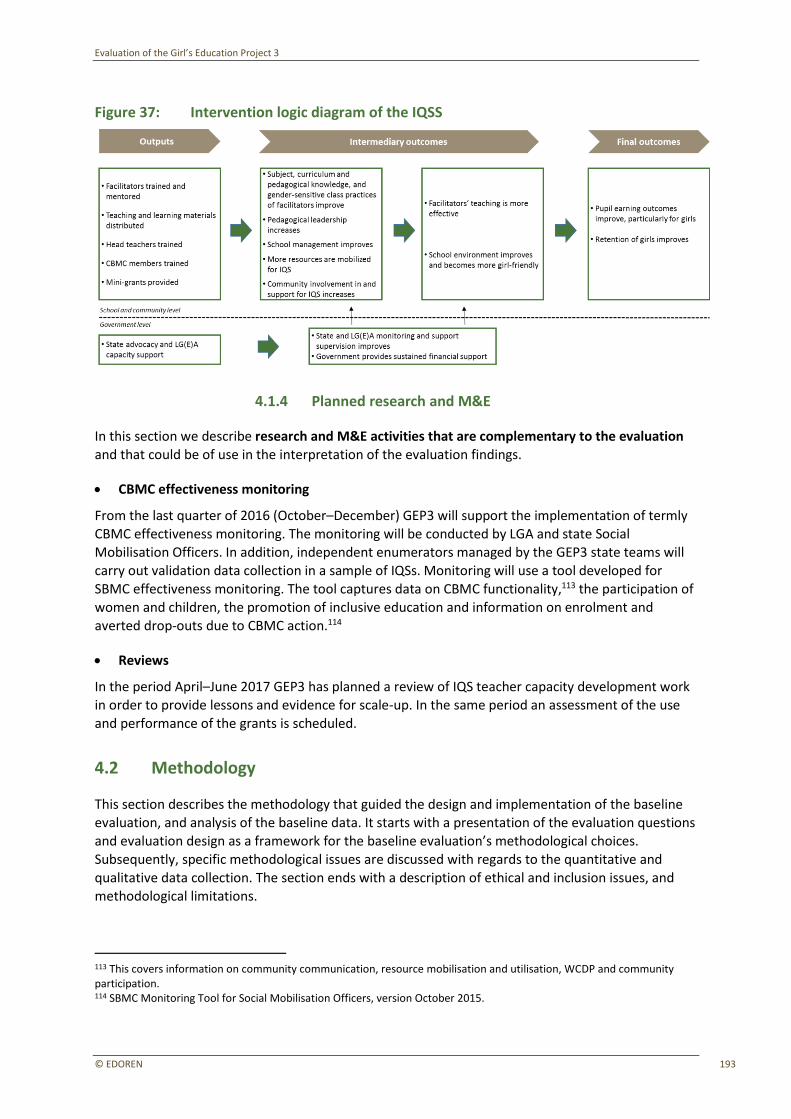
Evaluation of the Girl’s Education Project 3
© EDOREN 193
Figure 37: Intervention logic diagram of the IQSS
4.1.4 Planned research and M&E
In this section we describe research and M&E activities that are complementary to the evaluation
and that could be of use in the interpretation of the evaluation findings.
• CBMC effectiveness monitoring
From the last quarter of 2016 (October–December) GEP3 will support the implementation of termly CBMC effectiveness monitoring. The monitoring will be conducted by LGA and state Social
Mobilisation Officers. In addition, independent enumerators managed by the GEP3 state teams will carry out validation data collection in a sample of IQSs. Monitoring will use a tool developed for SBMC effectiveness monitoring. The tool captures data on CBMC functionality,113 the participation of
women and children, the promotion of inclusive education and information on enrolment and
averted drop-outs due to CBMC action.114
• Reviews
In the period April–June 2017 GEP3 has planned a review of IQS teacher capacity development work in order to provide lessons and evidence for scale-up. In the same period an assessment of the use and performance of the grants is scheduled.
4.2 Methodology
This section describes the methodology that guided the design and implementation of the baseline evaluation, and analysis of the baseline data. It starts with a presentation of the evaluation questions and evaluation design as a framework for the baseline evaluation’s methodological choices. Subsequently, specific methodological issues are discussed with regards to the quantitative and
qualitative data collection. The section ends with a description of ethical and inclusion issues, and methodological limitations.
113 This covers information on community communication, resource mobilisation and utilisation, WCDP and community participation. 114 SBMC Monitoring Tool for Social Mobilisation Officers, version October 2015.
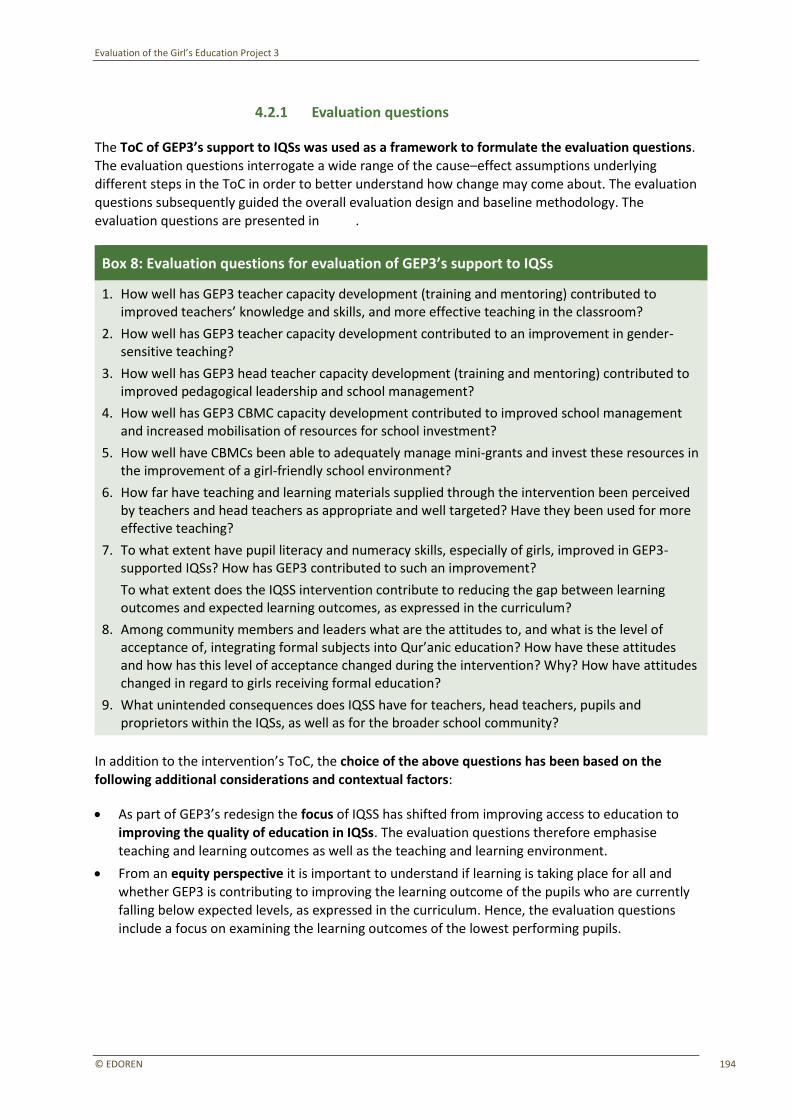
Evaluation of the Girl’s Education Project 3
© EDOREN 194
4.2.1 Evaluation questions
The ToC of GEP3’s support to IQSs was used as a framework to formulate the evaluation questions.
The evaluation questions interrogate a wide range of the cause–effect assumptions underlying different steps in the ToC in order to better understand how change may come about. The evaluation questions subsequently guided the overall evaluation design and baseline methodology. The evaluation questions are presented in Box 8.
Box 8: Evaluation questions for evaluation of GEP3’s support to IQSs
1. How well has GEP3 teacher capacity development (training and mentoring) contributed to improved teachers’ knowledge and skills, and more effective teaching in the classroom?
2. How well has GEP3 teacher capacity development contributed to an improvement in gender-sensitive teaching?
3. How well has GEP3 head teacher capacity development (training and mentoring) contributed to improved pedagogical leadership and school management?
4. How well has GEP3 CBMC capacity development contributed to improved school management and increased mobilisation of resources for school investment?
5. How well have CBMCs been able to adequately manage mini-grants and invest these resources in the improvement of a girl-friendly school environment?
6. How far have teaching and learning materials supplied through the intervention been perceived by teachers and head teachers as appropriate and well targeted? Have they been used for more effective teaching?
7. To what extent have pupil literacy and numeracy skills, especially of girls, improved in GEP3-supported IQSs? How has GEP3 contributed to such an improvement?
To what extent does the IQSS intervention contribute to reducing the gap between learning outcomes and expected learning outcomes, as expressed in the curriculum?
8. Among community members and leaders what are the attitudes to, and what is the level of acceptance of, integrating formal subjects into Qur’anic education? How have these attitudes and how has this level of acceptance changed during the intervention? Why? How have attitudes changed in regard to girls receiving formal education?
9. What unintended consequences does IQSS have for teachers, head teachers, pupils and proprietors within the IQSs, as well as for the broader school community?
In addition to the intervention’s ToC, the choice of the above questions has been based on the following additional considerations and contextual factors:
• As part of GEP3’s redesign the focus of IQSS has shifted from improving access to education to improving the quality of education in IQSs. The evaluation questions therefore emphasise teaching and learning outcomes as well as the teaching and learning environment.
• From an equity perspective it is important to understand if learning is taking place for all and whether GEP3 is contributing to improving the learning outcome of the pupils who are currently
falling below expected levels, as expressed in the curriculum. Hence, the evaluation questions include a focus on examining the learning outcomes of the lowest performing pupils.
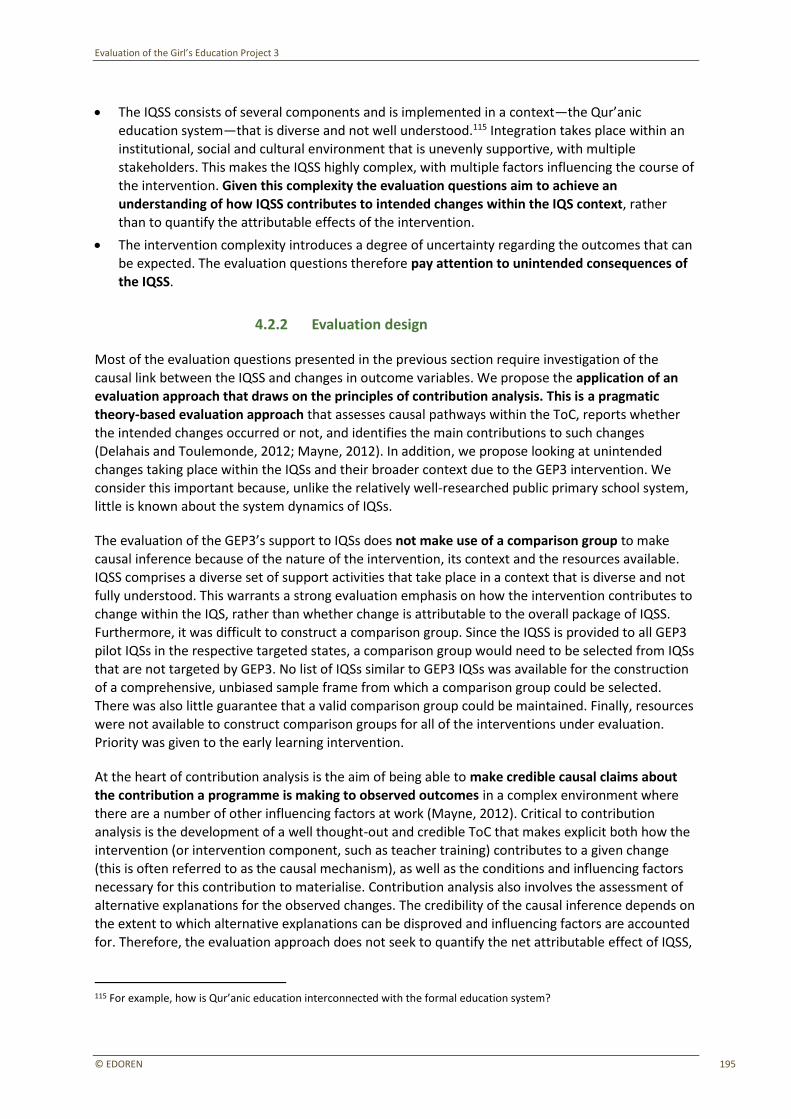
Evaluation of the Girl’s Education Project 3
© EDOREN 195
• The IQSS consists of several components and is implemented in a context—the Qur’anic
education system—that is diverse and not well understood.115 Integration takes place within an institutional, social and cultural environment that is unevenly supportive, with multiple stakeholders. This makes the IQSS highly complex, with multiple factors influencing the course of
the intervention. Given this complexity the evaluation questions aim to achieve an understanding of how IQSS contributes to intended changes within the IQS context, rather than to quantify the attributable effects of the intervention.
• The intervention complexity introduces a degree of uncertainty regarding the outcomes that can
be expected. The evaluation questions therefore pay attention to unintended consequences of the IQSS.
4.2.2 Evaluation design
Most of the evaluation questions presented in the previous section require investigation of the
causal link between the IQSS and changes in outcome variables. We propose the application of an
evaluation approach that draws on the principles of contribution analysis. This is a pragmatic theory-based evaluation approach that assesses causal pathways within the ToC, reports whether the intended changes occurred or not, and identifies the main contributions to such changes (Delahais and Toulemonde, 2012; Mayne, 2012). In addition, we propose looking at unintended
changes taking place within the IQSs and their broader context due to the GEP3 intervention. We consider this important because, unlike the relatively well-researched public primary school system,
little is known about the system dynamics of IQSs.
The evaluation of the GEP3’s support to IQSs does not make use of a comparison group to make causal inference because of the nature of the intervention, its context and the resources available.
IQSS comprises a diverse set of support activities that take place in a context that is diverse and not fully understood. This warrants a strong evaluation emphasis on how the intervention contributes to
change within the IQS, rather than whether change is attributable to the overall package of IQSS.
Furthermore, it was difficult to construct a comparison group. Since the IQSS is provided to all GEP3
pilot IQSs in the respective targeted states, a comparison group would need to be selected from IQSs that are not targeted by GEP3. No list of IQSs similar to GEP3 IQSs was available for the construction of a comprehensive, unbiased sample frame from which a comparison group could be selected.
There was also little guarantee that a valid comparison group could be maintained. Finally, resources were not available to construct comparison groups for all of the interventions under evaluation.
Priority was given to the early learning intervention.
At the heart of contribution analysis is the aim of being able to make credible causal claims about the contribution a programme is making to observed outcomes in a complex environment where
there are a number of other influencing factors at work (Mayne, 2012). Critical to contribution analysis is the development of a well thought-out and credible ToC that makes explicit both how the intervention (or intervention component, such as teacher training) contributes to a given change (this is often referred to as the causal mechanism), as well as the conditions and influencing factors
necessary for this contribution to materialise. Contribution analysis also involves the assessment of alternative explanations for the observed changes. The credibility of the causal inference depends on the extent to which alternative explanations can be disproved and influencing factors are accounted
for. Therefore, the evaluation approach does not seek to quantify the net attributable effect of IQSS,
115 For example, how is Qur’anic education interconnected with the formal education system?
Evaluation of the Girl’s Education Project 3
© EDOREN 196
but rather to assess whether and how the intervention is making a difference in combination with
other influencing factors.
The contribution analysis approach follows a set of six methodological steps, which are presented and discussed in Box 9 in the context of the IQSS intervention. These steps lead to an analysis based on the formulation of a contribution story: that is, a compelling case about the contribution being
made by the intervention. The contribution story is systematically organised into several contribution claims, which assess a causal chain generated by the intervention in conjunction with selected influencing factors (referred to as a causal package). As explained in Box 9 and in the representation of the ToC of the IQSS in Section 4.2 we have identified three contribution claims that will be the framework of building the contribution story.
A mixed-methods approach combining quantitative and qualitative data collection is applied to measure change along the ToC, to assess causal linkages and to look into unintended outcomes. Quantitative data collection consists of representative sample surveys among GEP3 IQSs in the six
GEP3 LGAs in both Bauchi and Niger,116 involving the administration of pupil and teacher tests, structured teacher classroom observations and closed-ended, structured questionnaires among pupils, teachers, head teachers and CBMC members. Baseline, midline and endline surveys will be
conducted in a cohort of IQSs sampled at baseline. The qualitative data collection involves KIIs, focus group discussions (FGDs), qualitative classroom observation and unstructured teacher praxis discussions in purposively sampled case study IQSs. The same case study IQSs will be visited at
baseline, midline and endline. The community-/school-level qualitative research is complemented with and informed by the findings of the state-level stakeholder interviews.
During the 2015–2017 pilot period the focus of the analysis is on GEP3’s contribution to achieving intermediary outcomes, such as changes in teacher knowledge and skills, teaching practices and school environment. Learning outcomes will not be measured at midline because of methodological
reasons related to the use of a cross-sectional sample survey, which is required because the evaluation design does not include a comparison group.117 A cross-sectional sample survey has two
important consequences that constrain measurement of learning outcomes at midline. First, this would require measurement in the same school term as baseline (i.e. October–November 2017),
which is not appropriate timing from the perspective of evidence needs. Second, we estimate that with the given sample size—which is circumscribed by the available budget—only an effect size of a
magnitude that is unlikely to occur in 1.5 years would be able to be detected with statistical confidence. Compared to a panel, a cross-sectional sample requires a relatively large sample size to measure a given MDE size. Therefore, the effect on learning outcomes will be the subject of the end-
of-project evaluation, meaning the evaluation question regarding improvement in learning outcomes will not be answered at midline but at endline. While endline data collection has not yet been
formalised, there is an agreement that this will take place. Stakeholders indicated that evidence on the effectiveness of GEP3 in terms of improving teaching quality and the school environment will provide valuable information for scale-up decision-making at midline. It can be assumed that if the
quality of teaching and school environments improves, and other factors that may negatively affect
116 The full package of IQSS is also implemented in Sokoto. Due to budget constraints the survey can only be administered in two states. Niger and Bauchi have been purposively selected by the stakeholders, taking into account budget considerations. 117 A panel approach is not feasible because it would not be possible to separate out the effect of ageing and years of schooling from the intervention effect since we are not comparing the intervention group with a comparison group of pupils. The contribution of such alternative explanations for the improvement of learning outcomes would be impossible to assess without a comparison group. In a cross-sectional survey, alternative explanations related to a pupil’s cognitive development do not need to be accounted for.
Evaluation of the Girl’s Education Project 3
© EDOREN 197
learning outcomes do not take place, learning outcomes will improve. This assumption will be
verified by endline.
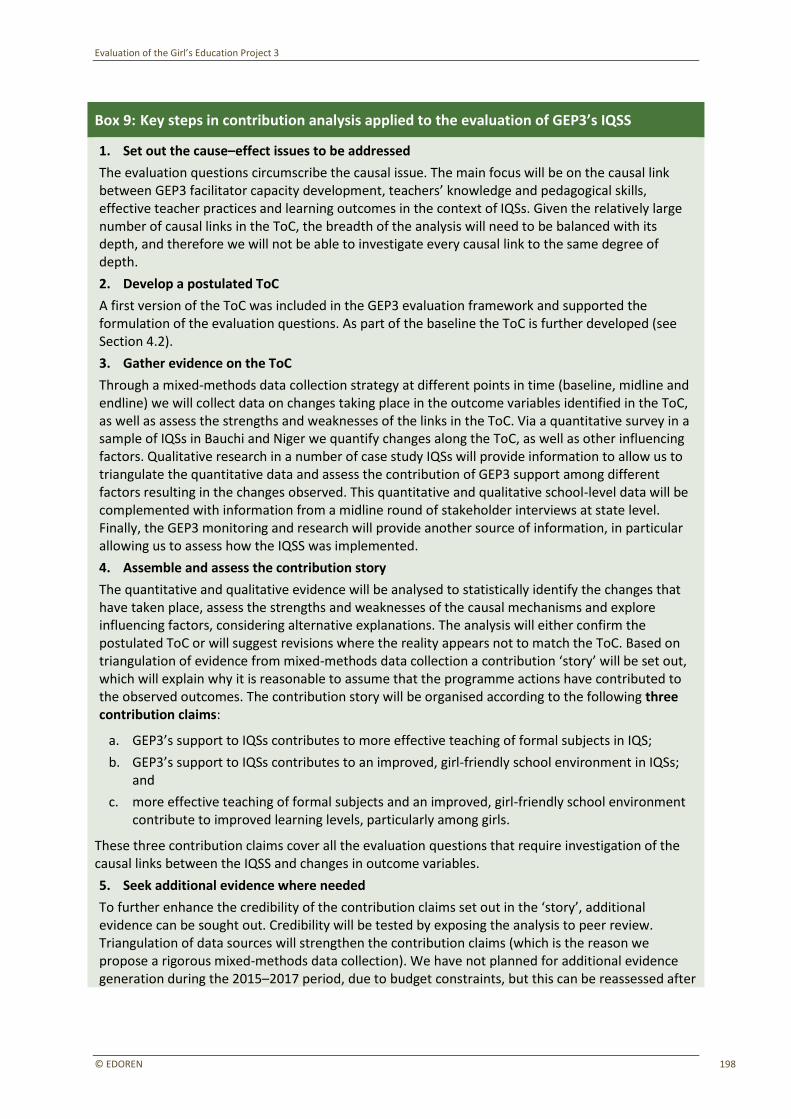
Evaluation of the Girl’s Education Project 3
© EDOREN 198
Box 9: Key steps in contribution analysis applied to the evaluation of GEP3’s IQSS
1. Set out the cause–effect issues to be addressed
The evaluation questions circumscribe the causal issue. The main focus will be on the causal link between GEP3 facilitator capacity development, teachers’ knowledge and pedagogical skills, effective teacher practices and learning outcomes in the context of IQSs. Given the relatively large number of causal links in the ToC, the breadth of the analysis will need to be balanced with its depth, and therefore we will not be able to investigate every causal link to the same degree of depth.
2. Develop a postulated ToC
A first version of the ToC was included in the GEP3 evaluation framework and supported the formulation of the evaluation questions. As part of the baseline the ToC is further developed (see Section 4.2).
3. Gather evidence on the ToC
Through a mixed-methods data collection strategy at different points in time (baseline, midline and endline) we will collect data on changes taking place in the outcome variables identified in the ToC, as well as assess the strengths and weaknesses of the links in the ToC. Via a quantitative survey in a sample of IQSs in Bauchi and Niger we quantify changes along the ToC, as well as other influencing factors. Qualitative research in a number of case study IQSs will provide information to allow us to triangulate the quantitative data and assess the contribution of GEP3 support among different factors resulting in the changes observed. This quantitative and qualitative school-level data will be complemented with information from a midline round of stakeholder interviews at state level. Finally, the GEP3 monitoring and research will provide another source of information, in particular allowing us to assess how the IQSS was implemented.
4. Assemble and assess the contribution story
The quantitative and qualitative evidence will be analysed to statistically identify the changes that have taken place, assess the strengths and weaknesses of the causal mechanisms and explore influencing factors, considering alternative explanations. The analysis will either confirm the postulated ToC or will suggest revisions where the reality appears not to match the ToC. Based on triangulation of evidence from mixed-methods data collection a contribution ‘story’ will be set out, which will explain why it is reasonable to assume that the programme actions have contributed to the observed outcomes. The contribution story will be organised according to the following three contribution claims:
a. GEP3’s support to IQSs contributes to more effective teaching of formal subjects in IQS;
b. GEP3’s support to IQSs contributes to an improved, girl-friendly school environment in IQSs; and
c. more effective teaching of formal subjects and an improved, girl-friendly school environment contribute to improved learning levels, particularly among girls.
These three contribution claims cover all the evaluation questions that require investigation of the causal links between the IQSS and changes in outcome variables.
5. Seek additional evidence where needed
To further enhance the credibility of the contribution claims set out in the ‘story’, additional evidence can be sought out. Credibility will be tested by exposing the analysis to peer review. Triangulation of data sources will strengthen the contribution claims (which is the reason we propose a rigorous mixed-methods data collection). We have not planned for additional evidence generation during the 2015–2017 period, due to budget constraints, but this can be reassessed after
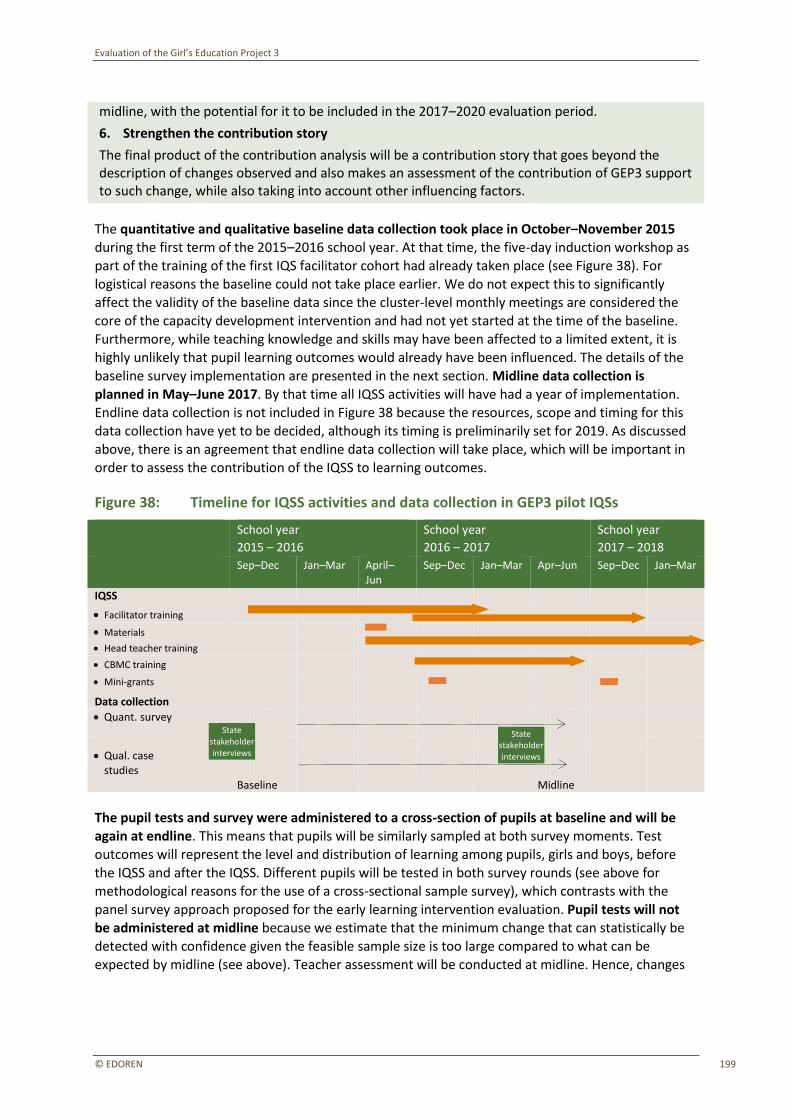
Evaluation of the Girl’s Education Project 3
© EDOREN 199
midline, with the potential for it to be included in the 2017–2020 evaluation period.
6. Strengthen the contribution story
The final product of the contribution analysis will be a contribution story that goes beyond the description of changes observed and also makes an assessment of the contribution of GEP3 support to such change, while also taking into account other influencing factors.
The quantitative and qualitative baseline data collection took place in October–November 2015
during the first term of the 2015–2016 school year. At that time, the five-day induction workshop as part of the training of the first IQS facilitator cohort had already taken place (see Figure 38). For logistical reasons the baseline could not take place earlier. We do not expect this to significantly affect the validity of the baseline data since the cluster-level monthly meetings are considered the core of the capacity development intervention and had not yet started at the time of the baseline.
Furthermore, while teaching knowledge and skills may have been affected to a limited extent, it is highly unlikely that pupil learning outcomes would already have been influenced. The details of the
baseline survey implementation are presented in the next section. Midline data collection is
planned in May–June 2017. By that time all IQSS activities will have had a year of implementation. Endline data collection is not included in Figure 38 because the resources, scope and timing for this data collection have yet to be decided, although its timing is preliminarily set for 2019. As discussed above, there is an agreement that endline data collection will take place, which will be important in
order to assess the contribution of the IQSS to learning outcomes.
Figure 38: Timeline for IQSS activities and data collection in GEP3 pilot IQSs
School year
2015 – 2016
School year
2016 – 2017
School year
2017 – 2018 Sep–Dec Jan–Mar April–
Jun Sep–Dec Jan–Mar Apr–Jun Sep–Dec Jan–Mar
IQSS
• Facilitator training
• Materials
• Head teacher training
• CBMC training
• Mini-grants
Data collection
• Quant. survey
• Qual. case studies
Baseline Midline
The pupil tests and survey were administered to a cross-section of pupils at baseline and will be again at endline. This means that pupils will be similarly sampled at both survey moments. Test outcomes will represent the level and distribution of learning among pupils, girls and boys, before
the IQSS and after the IQSS. Different pupils will be tested in both survey rounds (see above for methodological reasons for the use of a cross-sectional sample survey), which contrasts with the panel survey approach proposed for the early learning intervention evaluation. Pupil tests will not be administered at midline because we estimate that the minimum change that can statistically be
detected with confidence given the feasible sample size is too large compared to what can be expected by midline (see above). Teacher assessment will be conducted at midline. Hence, changes
State stakeholder interviews
State stakeholder interviews
Evaluation of the Girl’s Education Project 3
© EDOREN 200
in this important intermediary outcome will allow us to assess the difference that the IQSS is making
in the quality of education in the IQSs.
At baseline and endline pupils are randomly sampled among all pupils in P2 grade or its equivalent level in IQSs, when they are in the first term of the school year. Pupils need to have had at least around one year of non-religious education in the sampled IQSs to be included in the target
population, in order to ensure that they have been exposed to teaching that is the subject of the IQSS.
Teacher and head teacher surveys will take a panel survey approach. The same teachers and head teachers will be surveyed at baseline and midline. Although some attrition can be expected we anticipate that attrition levels at midline will be acceptable, and will be moderated by the fact that
the teacher and head teacher development support will incentivise against attrition. Teacher attrition is more likely to be a problem at endline in 2019. Therefore, a cross-sectional sample of teachers would need to be considered at endline.
The CBMC questionnaire will be administered among a selection of three to four current CBMC members, including, at least, the CBMC chair and members that have been trained through GEP3 support. The CBMC chair will be the main respondent. The interview will be conducted in a group
setting because interview pilots demonstrated that with multiple CBMC members present valuable complementary information is obtained. While at baseline the survey allows for a degree of flexibility regarding which CBMC members are present besides the CBMC chair,118 at midline trained members
will be invited.
4.2.3 Methodology of quantitative data collection
4.2.3.1 Sampling strategy and sample of the baseline survey
The sampling strategy for quantitative baseline data collection of the IQSS evaluation is almost equivalent to the strategy used for the baseline of the early learning intervention evaluation. This chapter will only outline the elements of the strategy that are different or unique to the IQSS
intervention.
Universe
The study universe for the baseline of the IQSS intervention evaluation consists of all IQSs selected for GEP3 intervention in the 12 LGAs in Bauchi and Niger where IQSS will be implemented. Since
GEP3 is also implementing IQSS in Sokoto, the study universe does not fully match GEP3’s intervention universe. Due to budget constraints Niger and Bauchi were purposefully selected to be covered by the evaluation.
The inclusion of schools into GEP3 requires that an IQS fulfils certain criteria set by the project. All
IQSs included in the GEP3 project need to have started integration, should teach both boys and girls and be registered with a government agency.119
118 During the CBMC interview the secretary must be present for the interview to take place because he or she is an important source of information. In addition, at least one woman representative and the CBMC treasurer are invited to the interview, whenever possible. The vice-chair can replace the chair as main respondent. 119 A minimum of 40% of pupils are girls.
Evaluation of the Girl’s Education Project 3
© EDOREN 201
The definition of the universe also extends to teachers and pupils. The target population of pupils
need to be enrolled in a P2 equivalent grade and study non-religious subjects. Because of the non-standard composition and organisation of the integrated curriculum in IQSs, a specific definition of the pupil universe is warranted in order to achieve a coherently defined population universe (see Box 4 in the methodological chapter of the early learning intervention evaluation).
Similar to the pupils, the universe of teachers considered as part of the IQSS intervention consists of teachers teaching at the designated schools and teaching pupils enrolled in Grades 1 to 3 or equivalent (see Box 5 in the methodological chapter of the early learning intervention evaluation).
Sampling frame
The sampling frame of schools includes all IQSs included in the GEP3 project in the two selected states. The sampling frame was constructed based on GEP3 school lists maintained by UNICEF. The
total sampling frame for the baseline of the IQSS intervention consists of 400 IQSs in 12 LGAs in two
states. All of the IQSs in the sampling frame were assumed to be GEP3 compliant and thus eligible for inclusion in the intervention.
Because the evaluation design of the IQSS is based on a cross-sectional sample survey of pupils, without a control group, it is key that the sampled pupils have been exposed to approximately one year of teaching of the integrated curriculum. It is of little use, in evaluating the intervention, to
compare learning outcomes of pupils that have not been exposed to the teaching of the integrated curriculum before and after the IQSS.
During the fieldwork it became apparent that the quality of the sampling frame of IQSs was poor.
The Qur’anic schools were meant to have started integration by teaching non-religious subjects. Due mainly to non-integration (schools not teaching non-religious subjects) or recent integration many of
the IQSs included in the sampling frame were found to be ineligible for being surveyed. This required the sampling of replacements schools.
Sample size and sampling parameters
The sample size is influenced by budget and survey design considerations (i.e. cross-section vs. panel survey). Within these parameters the sample size is intended to maximise the statistical power of the
measurement of the change in the learning outcome indicator between baseline and the follow-up survey (and to minimise the MDE).
In each state, 30 IQSs were sampled for study purposes, creating a total sample size of 60 IQSs across the two states. We expect to survey the same sample of schools at baseline and midline, and the likelihood of attrition within the school sample is expected to be low. In each school, the target
sample size for pupils is six girls and six boys, resulting in a total targeted sample size of 720 pupils across the 60 IQSs (360 girls and 360 boys). The sample sizes are calculated to allow for disaggregated analysis for girls and boys at endline. Given the cross-sectional nature of the pupil
sampling, this sample size will remain the same at endline as at baseline.
The targeted sample size for teachers is two facilitators per IQS, and therefore 120 IQS facilitators in total. We expect the sample size of the teachers to be lower at the midline survey due to possible attrition of the panel.
Table 21 presents the sample sizes for all IQSs and instruments implemented within each IQS.
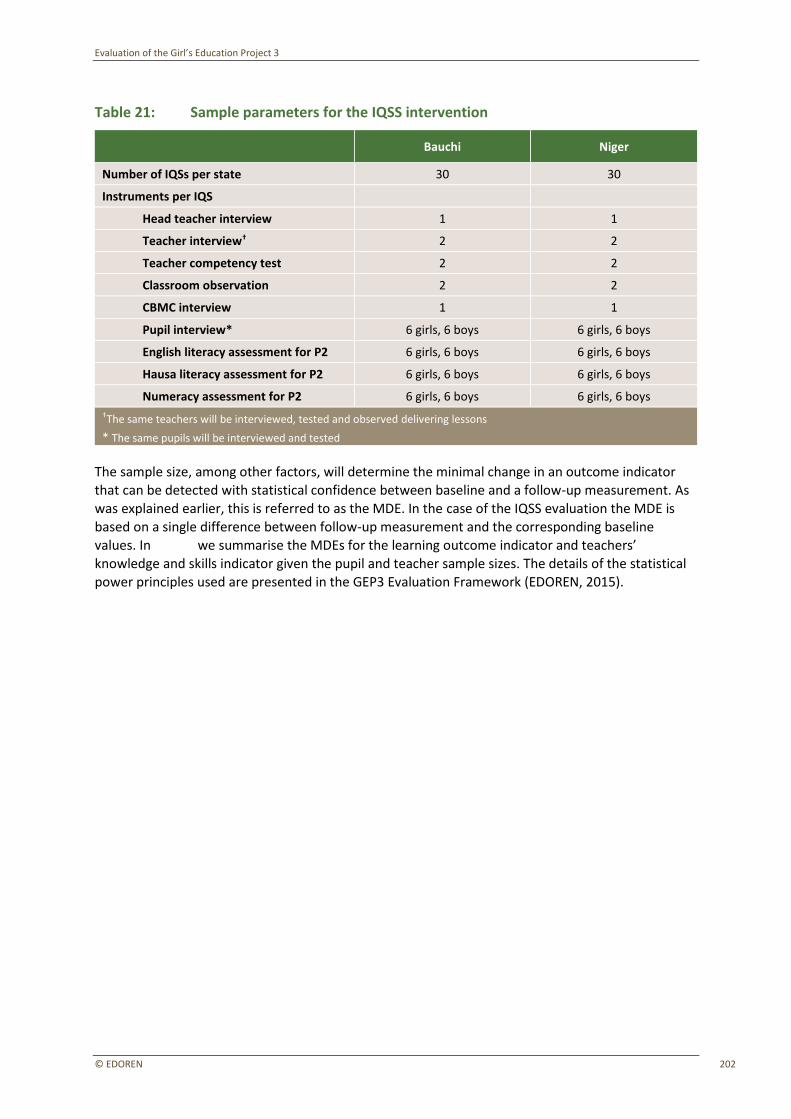
Evaluation of the Girl’s Education Project 3
© EDOREN 202
Table 21: Sample parameters for the IQSS intervention
Bauchi Niger
Number of IQSs per state 30 30
Instruments per IQS
Head teacher interview 1 1
Teacher interview† 2 2
Teacher competency test 2 2
Classroom observation 2 2
CBMC interview 1 1
Pupil interview* 6 girls, 6 boys 6 girls, 6 boys
English literacy assessment for P2 6 girls, 6 boys 6 girls, 6 boys
Hausa literacy assessment for P2 6 girls, 6 boys 6 girls, 6 boys
Numeracy assessment for P2 6 girls, 6 boys 6 girls, 6 boys
†The same teachers will be interviewed, tested and observed delivering lessons * The same pupils will be interviewed and tested
The sample size, among other factors, will determine the minimal change in an outcome indicator that can be detected with statistical confidence between baseline and a follow-up measurement. As
was explained earlier, this is referred to as the MDE. In the case of the IQSS evaluation the MDE is based on a single difference between follow-up measurement and the corresponding baseline
values. In Box 10 we summarise the MDEs for the learning outcome indicator and teachers’ knowledge and skills indicator given the pupil and teacher sample sizes. The details of the statistical power principles used are presented in the GEP3 Evaluation Framework (EDOREN, 2015).
Evaluation of the Girl’s Education Project 3
© EDOREN 203
Box 10: Estimation of MDEs
MDEs for pupil learning outcomes
In line with the GEP3 logframe, the main learning outcome indicator is defined as the percentage of girls and boys that achieve basic literacy and numeracy. In addition to the sample size, the MDE is a function of the baseline value of the outcome indicator. We do not know the baseline values of the learning outcome indicators at this point, but, as was discussed previously, learning outcomes in northern Nigeria are generally very low. However, learning outcome data mostly correspond to the situation in public primary schools and few data exist about learning outcomes in IQSs. We therefore estimate the MDEs using plausible and maximum scenarios. We assume an ICC of 0.3, a similar ITC, 80% power, and a 95% confidence level.
Using a plausible scenario that the baseline percentage of pupils that achieve basic literacy or numeracy is as low as 10%, the MDE is estimated at 6.8 percentage points when girls’ and boys’ data are analysed together, and 7.3 percentage points when analysed separately. The largest MDE for a given sample size would be produced when the baseline value is 50%. In such a case, the MDE amounts to 11.4 percentage points for a combined girls and boys analysis and 12.2 percentage points for a separate analysis. We do not expect a large magnitude of effects in learning outcomes between baseline and a midline in 2017, but consider it reasonable between baseline and an endline in 2019, which is why midline pupil testing is not proposed as part of midline data collection. If a low baseline value is assumed, such as 10%, the MDE is in line with an 8 percentage point increase by endline, as targeted in the GEP3 logframe. By controlling for some covariates that influence learning outcomes, for example age of the pupil, we expect to reduce the variance of the estimates as part of the analysis. This may allow us to detect smaller effect sizes for a given power and sample size.
MDE for knowledge and skills outcomes
The teacher knowledge and skills outcome indicator is the percentage of teachers demonstrating minimum knowledge and teaching skills. The 2013 TDNA assessed teachers’ professional knowledge and skills for IQS teachers in some GEP3 states. While the results varied from state to state, a 10% baseline value seems plausible. Between the baseline and midline a panel survey approach will be used, which results in a high ITC. We assume an ITC of 0.8, an ICC of 0.3, 80% power, and a 95% confidence level. We take into account 25% attrition of sampled teachers between baseline and midline.
Taking into account the above parameters we estimate an MDE of 5.1 percentage points between baseline and midline, assuming a baseline value of 10%. The MDE will be higher between baseline and endline if a cross-sectional sample is drawn (assuming 0.3 ITC and no attrition) – that is, 8.5 percentage points. Assuming a 50% baseline value scenario, which returns the highest possible MDE for a given sample size, the MDE for a panel survey approach between baseline and midline would be 8.4 percentage points, and 14.2 percentage points when selecting a cross-sectional sample at endline. In line with the GEP3 logframe, we anticipate that IQSS will have a considerable effect on teacher knowledge and skills since teachers will be the direct beneficiaries of intense teacher training and mentoring. The GEP3 logframe targets a 30 percentage point increase in the percentage of teachers demonstrating minimum teaching competencies.
Sampling design
The main sampling method for the IQSs was a single-stage stratified systematic random draw, while teachers and pupils were drawn through a two-stage stratified systematic sample. Explicit
strata were defined by the LGA. An equal number of schools was drawn from each LGA. Within each explicit stratum an implicit stratification was based on type of location (urban, rural). The systematic

Evaluation of the Girl’s Education Project 3
© EDOREN 204
random sample used a random start and a real sampling step. Implicit stratification was achieved by
sorting with each explicit stratum.
In each LGA five IQSs were drawn. In addition, one IQS per LGA was drawn as an initial replacement IQS, to provide a pool of IQSs that could be surveyed in case any of the IQSs in the main sample were found to be ineligible or inaccessible during the fieldwork period. Therefore, the sampling setup had
provision to select six schools in any given LGA in Niger and Bauchi.
The replacement schools were marked after the sample had been drawn. A uniformly distributed random variable was used to sort the IQSs within each LGA and the last IQS in this sequence was designated as a replacement IQS.
During the fieldwork many of the IQSs were found to be ineligible. The reason for ineligibility was
mainly non- or recent integration of schools. For this purpose, additional replacement schools had to be sampled during the fieldwork. The drawing of the replacement schools mostly mirrored the main
sampling approach. In some LGAs the number of eligible GEP3 IQSs became quite limited due to high proportions of ineligibility. In these cases all of the available replacements were released to the field for the survey team to select replacements in an order that corresponded to a pre-assigned random sequence of release.
Specifically, a random variable was used to designate the replacement sequence among the designated replacement IQSs.
Annex C provides maps with an overview of the sampled IQSs in the different LGAs in Bauchi and
Niger.
Within IQSs, sampling of pupils and teachers largely mirrored the approach described in the early
learning intervention section of this report – please see for reference Section
Sampling design.
The sampling of IQS facilitators employed a slight modification due to the modality of the intervention. At least one facilitator from each GEP3 IQS in Niger and Bauchi was trained in
September 2015. These trained facilitators, if found at the centre, were selected with the probability of 1 as one of the two potential respondents in the baseline survey. Figure 39 illustrates the sampling flow.
The CBMC questionnaire was administered to the chairperson or vice-chairperson of the CBMC, in the presence of up to three other CBMC members. The secretary of the CBMC had to be present for
the interview to take place. In addition, at least one woman representative and the CBMC treasurer was also to be present for the interview, whenever possible.
Weighting
Sampling weights were constructed to reflect the complex sampling design. The weights were estimated for all levels of analysis and reflect the multi-level nature of the school data, with pupils and teachers nested within schools. The estimated weights are population weights, which sum up to the total population size, as defined by the universe and the sampling frame. Due to the very high
sampling fraction rate (i.e. the large proportion of the eligible schools sampled), finite population
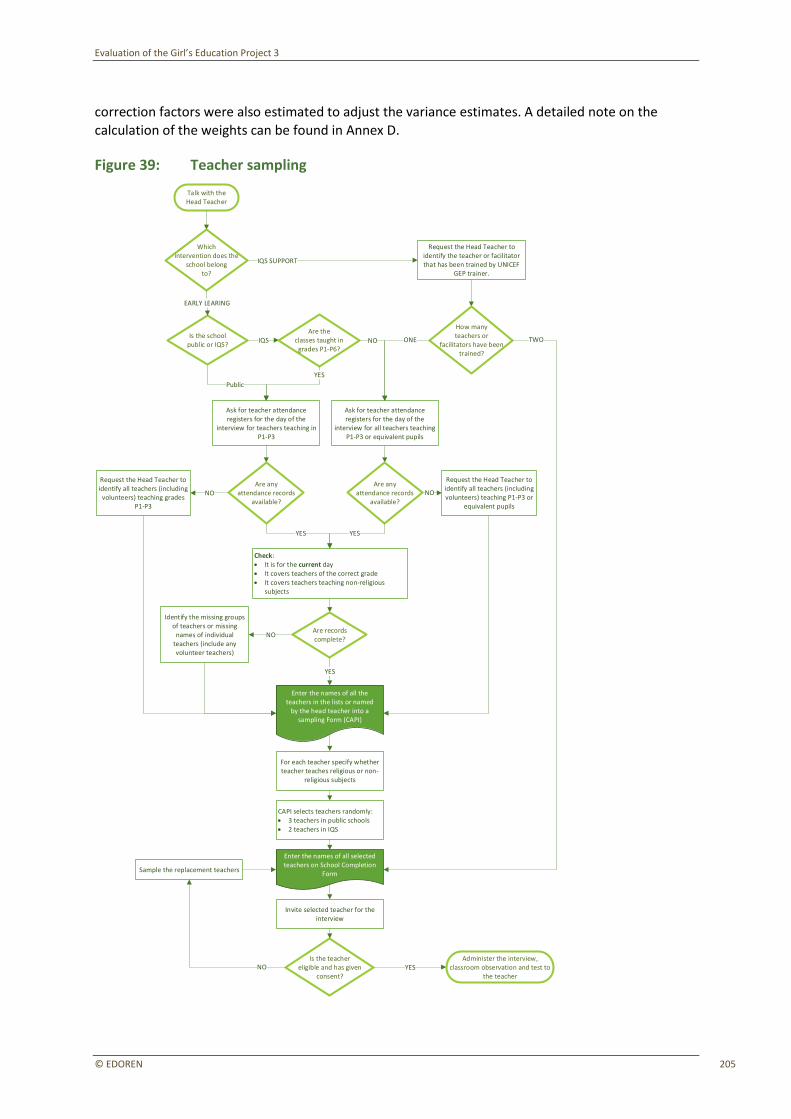
Evaluation of the Girl’s Education Project 3
© EDOREN 205
correction factors were also estimated to adjust the variance estimates. A detailed note on the
calculation of the weights can be found in Annex D.
Figure 39: Teacher sampling
Talk with theHead Teacher
Public
Ask for teacher attendance registers for the day of the
interview for teachers teaching in P1-P3
YES
Check:• It is for the current day• It covers teachers of the correct grade• It covers teachers teaching non-religious
subjects
Are any attendance records
available?NO
Request the Head Teacher to identify all teachers (including
volunteers) teaching grades P1-P3
Are records complete?
YES
Enter the names of all the teachers in the lists or named
by the head teacher into a sampling Form (CAPI)
NO
Identify the missing groups of teachers or missing
names of individual teachers (include any volunteer teachers)
Is the school public or IQS?
IQSAre the
classes taught in grades P1-P6?
YES
Ask for teacher attendance registers for the day of the
interview for all teachers teaching P1-P3 or equivalent pupils
NO
Are any attendance records
available?
YES
Request the Head Teacher to identify all teachers (including volunteers) teaching P1-P3 or
equivalent pupils
NO
For each teacher specify whether teacher teaches religious or non-
religious subjects
CAPI selects teachers randomly:• 3 teachers in public schools• 2 teachers in IQS
Invite selected teacher for the interview
Is the teacher eligible and has given
consent?
Administer the interview, classroom observation and test to
the teacher
Enter the names of all selected teachers on School Completion
Form
YESNO
Sample the replacement teachers
Which intervention does the
school belongto?
EARLY LEARING
IQS SUPPORT
Request the Head Teacher to identify the teacher or facilitator that has been trained by UNICEF
GEP trainer.
How many teachers or
facilitators have been trained?
ONE TWO
Evaluation of the Girl’s Education Project 3
© EDOREN 206
4.2.3.2 Instrument design and preparation
Nine instruments were developed to collect quantitative data at each sampled IQS. The instrument
development process was the same as the one described in the methodological section of the early learning intervention evaluation (see Section 3.2.5). The instruments for the baseline of the IQSS evaluation were similar to the ones used for IQSs as part of the baseline of the early learning intervention evaluation, in order to allow for comparability and to achieve efficiency gains. However, two additional instruments were developed to cover additional evaluation questions and elements in
the ToC: a pupil numeracy assessment and a CBMC questionnaire. The instruments are presented in Table 22.
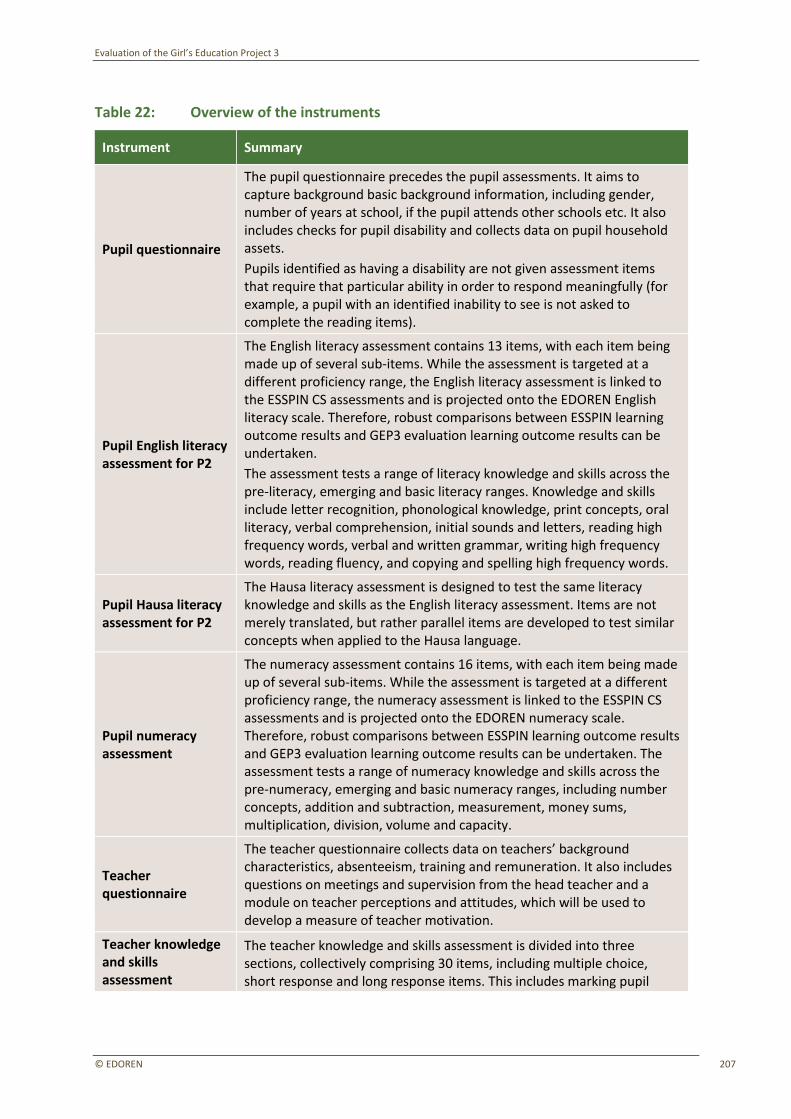
Evaluation of the Girl’s Education Project 3
© EDOREN 207
Table 22: Overview of the instruments
Instrument Summary
Pupil questionnaire
The pupil questionnaire precedes the pupil assessments. It aims to capture background basic background information, including gender, number of years at school, if the pupil attends other schools etc. It also includes checks for pupil disability and collects data on pupil household assets.
Pupils identified as having a disability are not given assessment items that require that particular ability in order to respond meaningfully (for example, a pupil with an identified inability to see is not asked to complete the reading items).
Pupil English literacy assessment for P2
The English literacy assessment contains 13 items, with each item being made up of several sub-items. While the assessment is targeted at a different proficiency range, the English literacy assessment is linked to the ESSPIN CS assessments and is projected onto the EDOREN English literacy scale. Therefore, robust comparisons between ESSPIN learning outcome results and GEP3 evaluation learning outcome results can be undertaken.
The assessment tests a range of literacy knowledge and skills across the pre-literacy, emerging and basic literacy ranges. Knowledge and skills include letter recognition, phonological knowledge, print concepts, oral literacy, verbal comprehension, initial sounds and letters, reading high frequency words, verbal and written grammar, writing high frequency words, reading fluency, and copying and spelling high frequency words.
Pupil Hausa literacy assessment for P2
The Hausa literacy assessment is designed to test the same literacy knowledge and skills as the English literacy assessment. Items are not merely translated, but rather parallel items are developed to test similar concepts when applied to the Hausa language.
Pupil numeracy assessment
The numeracy assessment contains 16 items, with each item being made up of several sub-items. While the assessment is targeted at a different proficiency range, the numeracy assessment is linked to the ESSPIN CS assessments and is projected onto the EDOREN numeracy scale. Therefore, robust comparisons between ESSPIN learning outcome results and GEP3 evaluation learning outcome results can be undertaken. The assessment tests a range of numeracy knowledge and skills across the pre-numeracy, emerging and basic numeracy ranges, including number concepts, addition and subtraction, measurement, money sums, multiplication, division, volume and capacity.
Teacher questionnaire
The teacher questionnaire collects data on teachers’ background characteristics, absenteeism, training and remuneration. It also includes questions on meetings and supervision from the head teacher and a module on teacher perceptions and attitudes, which will be used to develop a measure of teacher motivation.
Teacher knowledge and skills assessment
The teacher knowledge and skills assessment is divided into three sections, collectively comprising 30 items, including multiple choice, short response and long response items. This includes marking pupil
Evaluation of the Girl’s Education Project 3
© EDOREN 208
responses to Hausa literacy questions, indicating grade levels for items based on the curriculum, developing an answer sheet for a reading test aimed at Grade 2 pupils, answering a reading comprehension question, and making judgements about pupils’ writing, including grammar, spelling and additional support needed.
Teacher classroom observation
The classroom observation records the frequency with which the enumerator observes specific teacher talk, teacher language use, teacher action and pupil action. The enumerator also records teacher action at the start of the lesson, action at the end of the lesson, resources used and subject observed.
Head teacher questionnaire
The head teacher questionnaire includes several sections, including background information on the school, basic information about the school, school management and monitoring, attendance and enrolment, attitudes towards integration for IQSs and school infrastructure.
CBMC questionnaire
The CBMC questionnaire was administered to the chairman of the CBMC and, where possible with other members of the CBMC present to verify responses. The questionnaire includes items covering general information, CBMC activities, school monitoring and improvement, and CBMC financing and fundraising.
4.2.3.1 Survey fieldwork
The survey fieldwork implementation for the IQSS baseline survey followed the same protocols and procedures that were followed in the early learning intervention baseline survey. Only topics
specific to the IQSS intervention are discussed in this section.
Units surveyed
Using the eligibility criteria mentioned above, the team surveyed 576 pupils and 96 teachers from
60 IQSs in Bauchi and Niger (See Table 23). The targeted sample size of 60 IQSs was achieved, while the percentage of sampled pupils and teachers from these schools that were surveyed equals 80%
and 80% respectively. In around 20% of the IQSs only half or less of the target number of 12 pupils could be surveyed because only a limited number of pupils were eligible for the survey. The below-target achievement of teachers surveyed was due to the fact that the schools did not have the targeted number of teachers.
35% of the originally sampled IQSs had to be replaced, mainly due to the IQS not being considered eligible for the survey given the study universe.120 Replacements were mostly due to the centre not teaching non-religious subjects yet/anymore, or it being recently integrated.121 As explained above, a replacement process in line with the sample design—avoiding the introduction of bias in this process—was planned for, to deal with the challenges with the sample frame.
120 For an IQS to be considered eligible or qualified for the survey, it was required that: 1) the school must have a P2 equivalent class; 2) it must have teachers of non-religious subject teaching P1–P3; 3) it must have been integrated for approximately a year; and 4) it must have female pupils. 121 The length of integration in the IQSs was particularly an issue in Batsari LGA in Katsina, where approximately 80% of schools integrated in 2015. In this case the eligibility criteria of one-year integration was applied more flexibly by surveying the IQS that had actually started integration in January 2015 – hence having 10 months of integration.
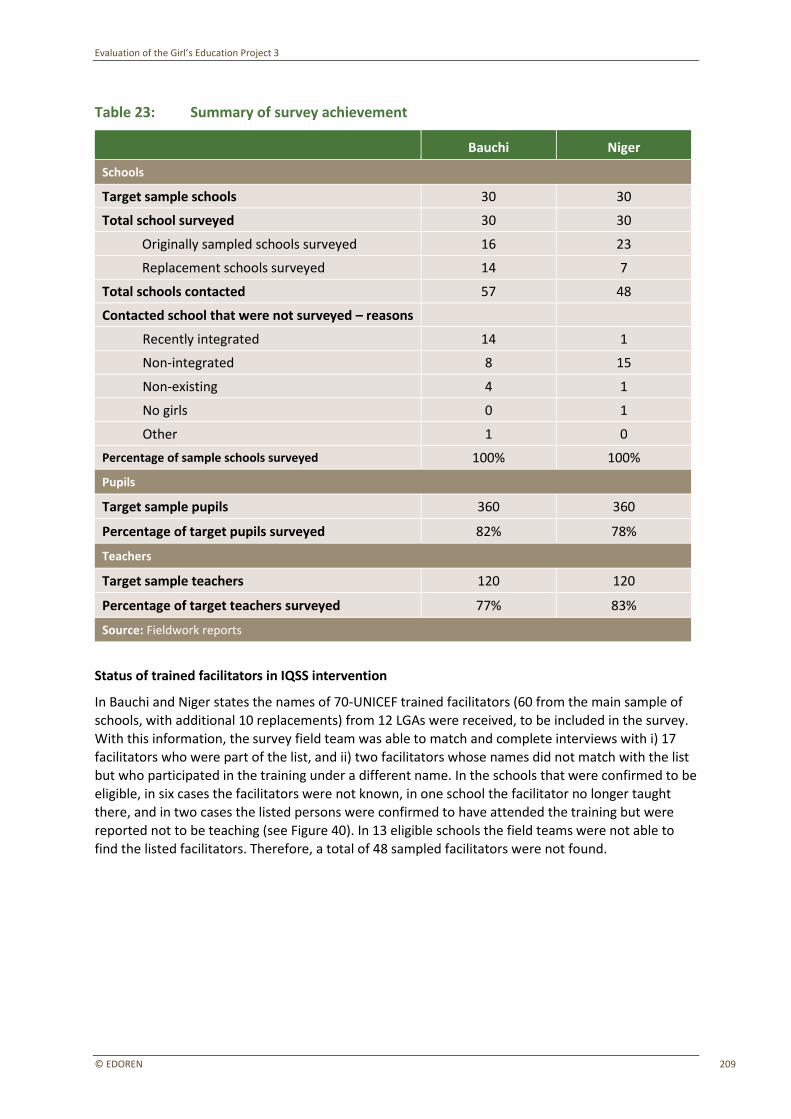
Evaluation of the Girl’s Education Project 3
© EDOREN 209
Table 23: Summary of survey achievement
Bauchi Niger
Schools
Target sample schools 30 30
Total school surveyed 30 30
Originally sampled schools surveyed 16 23
Replacement schools surveyed 14 7
Total schools contacted 57 48
Contacted school that were not surveyed – reasons
Recently integrated 14 1
Non-integrated 8 15
Non-existing 4 1
No girls 0 1
Other 1 0
Percentage of sample schools surveyed 100% 100%
Pupils
Target sample pupils 360 360
Percentage of target pupils surveyed 82% 78%
Teachers
Target sample teachers 120 120
Percentage of target teachers surveyed 77% 83%
Source: Fieldwork reports
Status of trained facilitators in IQSS intervention
In Bauchi and Niger states the names of 70-UNICEF trained facilitators (60 from the main sample of schools, with additional 10 replacements) from 12 LGAs were received, to be included in the survey. With this information, the survey field team was able to match and complete interviews with i) 17 facilitators who were part of the list, and ii) two facilitators whose names did not match with the list but who participated in the training under a different name. In the schools that were confirmed to be
eligible, in six cases the facilitators were not known, in one school the facilitator no longer taught there, and in two cases the listed persons were confirmed to have attended the training but were reported not to be teaching (see Figure 40). In 13 eligible schools the field teams were not able to find the listed facilitators. Therefore, a total of 48 sampled facilitators were not found.
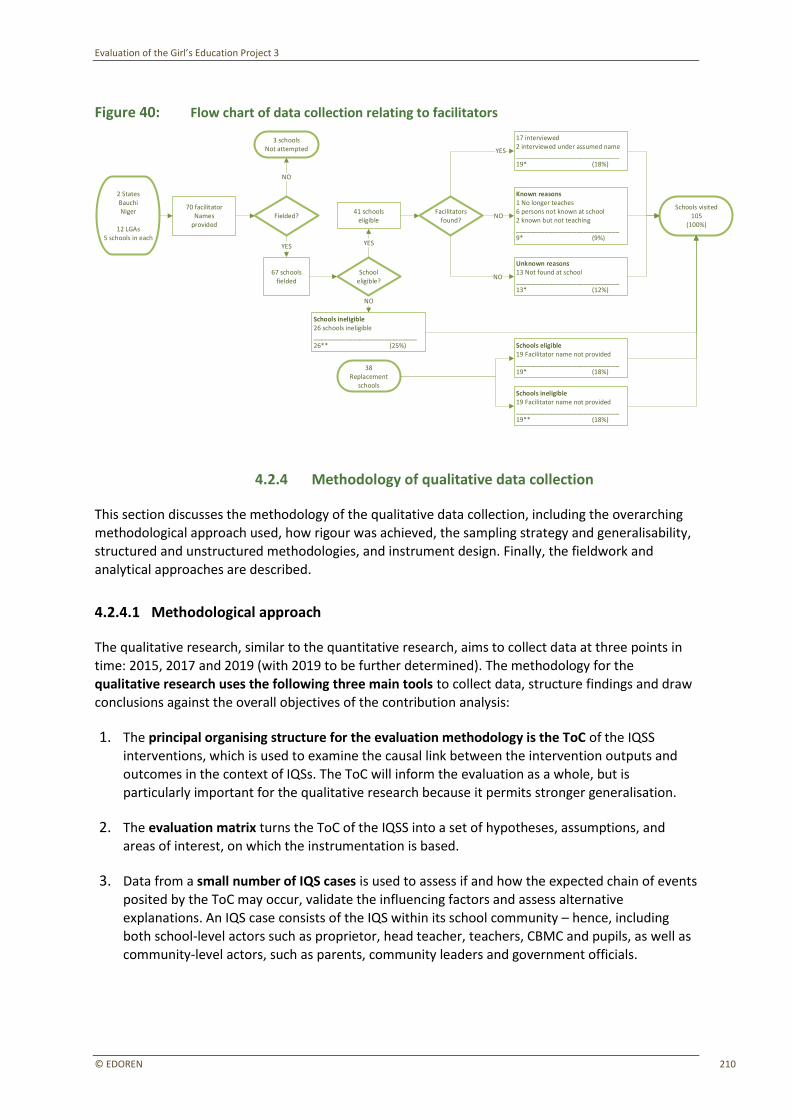
Evaluation of the Girl’s Education Project 3
© EDOREN 210
Figure 40: Flow chart of data collection relating to facilitators
2 StatesBauchiNiger
12 LGAs5 schools in each
70 facilitatorNames
providedFielded?
NO
3 schoolsNot attempted
YES
67 schoolsfielded
Schooleligible?
YES
41 schoolseligible
YES
17 interviewed2 interviewed under assumed name_____________________________19* (18%)
Facilitatorsfound?
Known reasons1 No longer teaches6 persons not known at school2 known but not teaching_____________________________9* (9%)
Unknown reasons13 Not found at school_____________________________13* (12%)
NO
NO
Schools visited105
(100%)
Schools eligible19 Facilitator name not provided_____________________________19* (18%)
Schools ineligible19 Facilitator name not provided_____________________________19** (18%)
38Replacement
schools
Schools ineligible26 schools ineligible_____________________________26** (25%)
NO
4.2.4 Methodology of qualitative data collection
This section discusses the methodology of the qualitative data collection, including the overarching methodological approach used, how rigour was achieved, the sampling strategy and generalisability,
structured and unstructured methodologies, and instrument design. Finally, the fieldwork and analytical approaches are described.
4.2.4.1 Methodological approach
The qualitative research, similar to the quantitative research, aims to collect data at three points in
time: 2015, 2017 and 2019 (with 2019 to be further determined). The methodology for the qualitative research uses the following three main tools to collect data, structure findings and draw
conclusions against the overall objectives of the contribution analysis:
1. The principal organising structure for the evaluation methodology is the ToC of the IQSS interventions, which is used to examine the causal link between the intervention outputs and
outcomes in the context of IQSs. The ToC will inform the evaluation as a whole, but is particularly important for the qualitative research because it permits stronger generalisation.
2. The evaluation matrix turns the ToC of the IQSS into a set of hypotheses, assumptions, and
areas of interest, on which the instrumentation is based.
3. Data from a small number of IQS cases is used to assess if and how the expected chain of events posited by the ToC may occur, validate the influencing factors and assess alternative explanations. An IQS case consists of the IQS within its school community – hence, including both school-level actors such as proprietor, head teacher, teachers, CBMC and pupils, as well as
community-level actors, such as parents, community leaders and government officials.
Evaluation of the Girl’s Education Project 3
© EDOREN 211
The aim of the initial qualitative baseline research is to examine the hypotheses and assumptions
with key stakeholders, and contextual factors that are likely to affect implementation and outcomes, and to assess the relevance of the planned activities for better education outcomes. As a result, the qualitative baseline, together with the quantitative research, examines the baseline situation of the ToC (confirmatory methodology) and refines, develops new hypotheses for, and enriches and
contextualises, the ToC (exploratory methodology). This process allows the EDOREN team to provide an evidence-based critique of the ToC, identifying potential weaknesses and proposing ways of strengthening the programme’s ToC.
4.2.4.1 Rigour
A major methodological challenge in qualitative research is the definition and achievement of ‘rigour’, particularly, as in this case, when the research methodology needs to be open to the identification of new hypotheses, causes and unexpected impact. Therefore, the methodology
should contain an emergent dimension not fully prescribed at the outset. Moreover, qualitative research is often accused of being open to research bias or anecdotal impressions, impossible to reproduce and difficult to generalise (Mays and Pope, 1995). However, rigour in qualitative research
can be achieved in the following ways. First, sampling ‘is a core design issue because the purposeful sample will determine what you learn about’ (Patton, 2015): through a carefully chosen sampling strategy, the most relevant sample can be approximated. In addition, rigour can be ensured through
the adequacy of qualitative instruments that best reflect the ToC, fieldwork that involves carefully trained and well-managed researchers, and quality assurance throughout each research stage. Lastly, analysis bias can be minimised by relying on a confirmatory analysis approach that utilises
qualitative data based on a set of pre-existing hypotheses. Together, these measures ensure rigour in qualitative research through ‘systematic and self-conscious research design, data collection,
interpretation and communication’ (Mays and Pope, 1995). How the qualitative research design addresses these issues is discussed in the relevant sections below.
4.2.4.1 Sampling strategy and generalisability
As with most qualitative research, the chosen approach to sampling for the qualitative component of
the IQSS evaluation was designed to generate responses from small numbers of individuals and groups that are representative (though not statistically) of groups relevant to GEP3’s IQSS, and which
allow some identification of heterogeneous contributions.
Specifically, the research employs purposive ‘typical case sampling’ and ‘extreme case sampling’. This is not designed to produce results that are generalisable in the same sense as quantitative data. Rather, the generalisability of the qualitative research results derives from the extent to which they are embedded in a ToC that has some validity in a wider context. This form of sampling allows
exploration of what the IQSS is doing in a typical case, but also performance in ‘higher performing’ and ‘lower performing’ cases, which helps explain the reasons behind higher and lower levels of contribution across contexts.
For the purposes of this evaluation ‘lower performing’ cases were interpreted as schools and communities likely to be most resistant to change in increasing the education outcomes for girls (lower female enrolment, negative attitudes toward girls’ education and lower levels of acceptance of the integration process). ‘Higher performing’ cases were interpreted as schools and communities
likely to be less resistant to change in increasing the education outcomes for girls (higher female
Evaluation of the Girl’s Education Project 3
© EDOREN 212
enrolment, positive attitudes toward girls’ education and high levels of acceptance of the integration
process).
The qualitative study sample aims to reflect the ‘typical case’ and the ‘extreme case’ of the quantitative data collection sample. This initially relied on a UNICEF list of IQSs that were reported to meet certain eligibility criteria, such as having a sufficient percentage of girls as their pupils and
teaching non-religious subjects. However, as the quantitative data collection preceded the qualitative study, it became clear that many of the IQSs included in the sampling frame were found to be ineligible for being surveyed (see Section 4.2.3). For that reason, to ensure the eligibility of all sample schools, the study sample was restricted to those schools that had been previously inspected and were confirmed as meeting UNICEF eligibility criteria.
Six schools were purposefully sampled among previously inspected GEP3 IQSs in Bauchi and Niger. For each state, a lower performing, typical performing and higher performing school were identified. The sample size was determined by resource constraints and a need to a have a minimal spread of
typical and extreme cases across the two states.
A challenge to identifying the typical and extreme IQS cases is that IQSs are not currently incorporated into the states’ EMIS databases. As such, it was impossible to sample directly based on
IQS performance. Instead, the sample design relied on a two-staged approach.
First, three LGAs per state were sampled in each case category using average public primary school performance on girls’ education in each GEP3 LGA as a proximate indicator for IQS performance on
girls’ education. Based on the evaluation matrix, and in line with the best available EMIS data, the following indicators were selected:
• Girls’ access: The GPI, as calculated by the average share of girls versus boys enrolled in school.122
• Girls’ retention: An approximated transition rate, as calculated by a school’s share of girls’
enrolment in Grade 6 (end of primary school) divided by its share of girls’ enrolment in Grade 1.123
• Girls’ education quality: A composite index of the pupil-to-qualified-teacher rate, share of qualified female teachers and pupil–classroom ratio.124
From this, an overall composite index was generated that ranked the LGAs from highest to lowest performing, based on an equal weighting across each of the three indicators. LGAs were then sampled to be as close to the top, middle and bottom of the list as possible.
Secondly, IQSs were selected within each LGA based on the following criteria:
• From inspection visits, IQS selection used two extra characteristics: variation in years since integration, and the number of non-religious subject facilitators. As longer-running schools and
more facilitators were considered to be ‘better’ IQSs, they were selected for the higher performing LGAs (with the reverse used for selecting lower performing IQSs).
122 This was used in the absence of better variables, such as the gender-disaggregated net enrolment rate. 123 This measure is an imperfect approximation and is affected by shifting enrolment size over time; a true transition rate would be calculated based on a specific cohort’s progression from Grade 1 to Grade 6. 124 In absence of direct measures of pupil performance (e.g. test scores), these three variables together provide a weak, but commonly used and indicative, measure of school quality and wealth.
Evaluation of the Girl’s Education Project 3
© EDOREN 213
• IQS location was sampled to incorporate a spread of urban, peri-urban and rural schools, with
less urban areas generally perceived to lead to a lower quality IQS. The sampling of more remote schools was balanced with the aim of completing as many instruments as possible within the possible interviewing timeframe, so as to return back to each state capital before dark.
• Language also played a part in sampling: areas with a dominant minority language (e.g. Nupe rather than Hausa) required two-way translation from one team member – overuse could lead to fatigue and reduce the quality of interview responses. As such, only one out of the six IQSs was sampled as a non-Hausa speaking school.
• Security factors were taken into consideration: one LGA in Bauchi was swapped at late notice in response to rumours regarding Boko Haram activity.
Based on the above process, two IQSs were selected (first and second choice) for each of the six LGAs in Niger and Bauchi (12 in total). The categorisation of the sampled IQSs was discussed with the state GEP3 team and responsible government officials, who validated qualitatively the categorisation
of the IQSs in higher performing, typical and lower performing. For both states, the teams managed to visit two of their first choice IQSs, while, due to unresponsiveness or unavailability, they had to
visit one second choice IQS. No additional adjustments were made to the sample.
At each IQS parents, pupils (girls and boys) and CBMC members were invited to participate in FGDs.
The selection was carried out with the support of the IQS proprietor or Mallam, which was important in order to establish a good rapport for the qualitative research, but may have brought about
selection bias. In addition to the IQSs, the qualitative research also undertook KIIs with LGA IQS officers. These were selected to match the LGAs of the sampled schools.
4.2.4.1 Qualitative instruments
The qualitative research primarily makes use of four research techniques or instruments: a qualitative classroom observation (QCO), an unstructured teacher practice discussions (TPDs), KIIs
and FGDs.

Evaluation of the Girl’s Education Project 3
© EDOREN 214
Table 24: Instruments by participant group
Instrument
Pro
pri
eto
r/O
wn
er
/Ma
llam
s
He
ad t
eac
he
rs
Faci
litat
or/
Teac
he
r
Pu
pils
CB
MC
me
mb
ers
Par
en
ts
Co
mm
un
ity
lead
er
Loca
l go
vern
me
nt
IQS
off
ice
r
QCO
TPDs
KIIs
FGD
The tools for the KIIs and FGDs were developed in order to capture information on the core areas to
probe, as outlined in the qualitative evaluation matrix, which are derived from the underlying
assumptions in the ToC.
The strengths of combining quantitative and qualitative methods in evaluation can also apply at the classroom level, in the form of classroom observations. The classroom observations undertaken as
part of the quantitative survey provide data on the degree to which teacher practices are changing, while the use of QCOs combined with the TPDs are meant to answer the ‘how’ and ‘why’ questions
(Fasse and Kolodner, 2000; 1993; Merriam, 1988; Yin, 1984). The QCO is semi-structured and was conducted by an educationalist. The instrument lists some of the core areas in which the programme aims to change teacher behaviour and pedagogy and the researcher took detailed notes under each
section during the course of the classroom observation. After the observation had taken place, the
researcher undertook the TPD with the teacher. The discussion followed the structure of the lesson observation but otherwise remained unstructured. The discussion focused on probing the
pedagogical approach of the teacher and engaging the teacher in a discussion about how and why the teacher employs specific methods within the classroom. Specific attention was given to understanding how and why the teacher implements gender-sensitive classroom practices. At
midline this will include reflecting on the extent to which the training provided through GEP3 has changed the teacher’s praxis125 and will provide data on alternative explanations.
UNICEF states that ‘“Girl friendly” schools are schools that [girls] want to attend… [they] provide children – girls in particular – with a safe, nurturing and gender-sensitive learning environment’.126 Parents, pupils and representatives from the CBMC provide divergent points of view regarding the extent to which girls want to attend school, and why (or why not). The case studies seek to construct a strong story regarding the learning environment and to identify factors that are perceived to
contribute to changes.
125 Praxis refers to the ways in which individuals engage with and reflect on a situation, as both thinkers and actors. Praxis
incorporates various components – including the theoretical (guiding rules), the productive (application of guiding rules), and the practical (how to produce under the guiding rules). 126 www.unicef.org/mdg/mali_59595.html.
Evaluation of the Girl’s Education Project 3
© EDOREN 215
Discussion guides were used for the FGDs, tailored toward the areas that were to be probed, and
making use of age-appropriate language. Semi-structured interview guides were used. These were organised around the core areas to probe, thus ensuring a degree of standardisation while at the same time allowing the national and EDOREN qualitative researchers enough flexibility to pick up on interesting themes and emerging topics and concerns.
KIs are people with in-depth knowledge and understanding of particular subjects. In the case of this research, the KIs are the proprietor/owner/Mallams of the IQS, head teachers, community leaders and the government IQS officer at the LGA level.127 While the choice of KIs was largely standardised, the design was flexible enough to also incorporate other KIs should the need have arisen in the field. This was particularly important for the IQSS as the structures within IQSs are not set and
standardised like in public primary schools. For example, the interview with the LGA IQS officer was added after the state-level stakeholder interviews had shown the importance that stakeholders attached to monitoring and supervision of the effectiveness of the IQSS.
4.2.4.1 Fieldwork
Implementation and management of the fieldwork
The fieldwork was implemented by EDOREN between 03 and 14 November 2015. It was preceded by a four-day training period for researchers (see below).
The qualitative researchers were recruited by EDOREN, and initially 11 members were invited for training from a pool of highly experienced candidates. Selection was mainly based on candidates’ CVs and their experience with other qualitative education research in northern Nigeria.128 The selection
process also took into consideration the gender balance of the teams, and especially their local language proficiency. All members were proficient in both spoken and read Hausa, which was the
main language used for interviews. Other local language requirements were also taken into
consideration when selecting team members as in some areas Hausa is not the main language
spoken. In the selection of interviewers special attention was given to Arabic, Fulfude, Nupe and Gbagyi language proficiency since these languages are spoken in the study area.
Two teams were established for the fieldwork, each team covering one state. One was led by an external consultant (an expert educationist), while the other was joint-led by an educationist and a
qualitative research specialist. These state team leads supervised all interviews, carried out the QCOs, oversaw the data transcription and ensured quality assurance at each stage of the research.
Each team lead selected four researchers from the overall 11 members trained to hold the positions
of lead interviewer, focus group facilitator, note-taker and translator. This selection was done half-way through training, and was based on each individual’s engagement and expertise, suitability for each of the four positions, the gender balance of the teams and specific language requirements.
127 These IQS officers were LGA representatives for the SAME. 128 Qualitative researchers were involved, among others, in data collection and analysis for the EDOREN Thematic Research on Teacher Management, and on a GEP3 assessment of the FTTSS.
Evaluation of the Girl’s Education Project 3
© EDOREN 216
Training
To ensure that all survey teams could do their work effectively and in accordance with high quality standards, all qualitative researchers trained intensively from 31 October to 02 November 2015 in Abuja. The instruments were piloted at the end of enumerator training.
This exercise firstly included a number of interactive exercises to deepen researchers’ understanding of the GEP3 IQS intervention, the ToC and the evaluation framework. Next, the training moved to
prudent processes for qualitative research, including data capture and translation protocols, transcription procedures and research ethics.
The final two days were spent extensively engaging with each of the eight instruments. This was done in order for researchers to practice essential interviewing techniques, such as probing, while concurrently refining the flow and phrasing of each of the instruments. The training used several
different training approaches to achieve the maximum training effect, such as small group work,
mock interviews and group presentations of findings and reflections.
Fieldwork organisation
For each of the two states, the research team comprised of:
• a state team leader: as has been said, the state team leads supervised all interviews, carried out the QCOs, oversaw the data transcription and ensured quality assurance at each stage of the research. One of the teams was joint-led by an educationist and a qualitative research specialist;
• one Lead Interviewer, responsible for conducting the KIIs;
• one focus group facilitator, responsible for conducting FGDs with CBMCs, pupils and parents;
• one translator, responsible for aiding the team lead/s in conducting the QCOs and TPDs; and
• one note-taker, responsible for taking notes during FGDs and (time permitting) KIIs, as well as
looking after audio- and video-recording equipment.
At the beginning of the fieldwork each member was given explicit guidance and training on their
particular task. For the translator, for instance, this meant repeated exercises on two-way simultaneous translation. For the lead interviewer and focus group facilitator, this meant the state team leader offered guidance on elements such as probing or creating a safe space to incite responses.
While members primarily had responsibility for their designated role, in practice they also took on additional responsibilities. For instance, due to the large amount of interviews taking place, all members were made responsible for a part of the transcription, which was then quality reviewed by the designated note-taker. Similarly, when multiple interviews took place at the same time, other members could step in to function as translator. However, all KIIs were performed by the lead
interviewer or state team lead, while all FGDs were performed by the FGD facilitator or state team
lead.
Fieldwork challenges
Some of the most pertinent challenges faced during fieldwork are listed below:
• Teaching hours at IQSs: IQSs usually do not follow their timetables strictly. In addition, some classes are taught early in the morning and some late at night. Furthermore, most of the IQSs
Evaluation of the Girl’s Education Project 3
© EDOREN 217
operate for just two hours. This required teams to make detailed enquires regarding the day’s
plan, and to set out very early or late, often administrating the head teacher, teacher and CBMC interview tools before the arrival of the pupils.
• Holiday: Some IQSs were not in session, although there was no mention of this in their
timetables. This meant that teachers and pupils had to come to school in an arranged manner in order to carry out the KIIs, FGDs and classroom observations.
• Distance and difficult terrain: Many IQSs are remotely located, without good road access, which required long travel times to reach them. This made it more difficult for the teams to complete
all the instruments within schools and to return to their base before darkness fell. Combined with the difficult teaching hours, this meant at times that the classroom observations had to be rescheduled to an unusual time, or that the researchers had to come back for several days, to complete all instruments.
• Pre-appointment: Scheduling appointments with the IQSs without a physical presence was very
difficult, as many IQSs lie outside of the reach of mobile communication networks.
4.2.4.1 Quality assurance
In order to best ensure the rigour of the qualitative research the state team leads provided quality
assurance at each stage of the research. This was first ensured at the training stage by carefully preparing each of the potential team members on qualitative research methods and by selecting only the most appropriate individuals for each of the team roles. The training stressed unbiased
delivery of instruments, and emphasised building team members’ capacity and understanding of the tools and study as a whole.
Rigour and mitigation of bias in the qualitative fieldwork was achieved through involvement of different individuals in the field teams, allowing team members to support each other, discuss and question findings. Team leads were present at all times during fieldwork, to offer support and
address technical queries in the field. Team leads also sat in on the majority of interviews and FGDs,
time permitting, to provide additional guidance and probing where necessary. Additional quality assurance was achieved through daily team briefs and debriefs. In the debriefs the team would discuss key findings from the day, link findings to the evaluation matrix (whilst noting findings that were divergent from the matrix) and compare field observational notes to help situate analysis. The
debriefings also allowed the team to address logistical and technical queries that may have arisen during the day. As the team returned to each IQS for more than one day it was possible to further explore on the second day queries that arose out of the findings from day one. Briefings were held each morning before the team set out, after having reviewed findings and transcripts from the day before, to identify questions needing further exploration, and give technical pointers for the day
ahead.
Quality assurance of transcription was ensured by allowing an initial transcript to be written up by one individual and then verified in parts by a second individual.129 This back-translation was used to
ensure standardisation of translation from Hausa to English. Any discrepancies were discussed amongst team members. Transcription and back-translation took place during the fieldwork, and so also provided immediate lessons in terms of facilitating interviewing or the need for additional probing. Such lessons were then discussed during the daily briefing and debriefing meetings. The
129 This meant that one researcher would translate/transcribe a whole transcript. A second researcher would then listen to parts of the audio from that transcript and translate/transcribe that part. The two parts were then compared.
Evaluation of the Girl’s Education Project 3
© EDOREN 218
team lead also reviewed all completed transcripts, to give guidance (particularly prior to going to the
next school), thus allowing for reflexivity in the field, and strengthening rigour. Teams also kept records of their activities, and made additional notes where possible, so that they could be linked to transcripts and analysis. Upon returning from the field the team lead reviewed transcripts, compared them to field notes and consulted with the primary translator in cases where there was any
confusion, to clarify that transcription was complete. The fact that the transcriptions were carried out verbatim helped mitigate bias at the stage of data capturing.
4.2.4.1 Analytical approach
The analytical approach to the qualitative data used applied thematic analysis. The selected principal approach—‘confirmatory analysis’—aims to confirm a set of pre-existing hypotheses (assessing the contribution claim) and generate codes from the hypotheses to be applied to the data. This is in contrast to exploratory analysis, which derives hypotheses from the data collected (Guest et
al., 2012). At baseline, exploratory analysis was used as an initial analytical technique, to ensure that the qualitative component is responsive to new information (challenges to the contribution claim). As it was important to test the assumptions of the ToC, exploratory analysis was used to first group
the data, after which, confirmatory analysis was used to validate this information.
Applied thematic analysis requires researchers to interpret data and does not rely on counting words or phrases, but rather identifies and describes implicit and explicit ideas that are organised into
themes. To strengthen the rigour of thematic analysis and mitigate researcher bias the analysis was carried out in several stages. First, familiarisation with the data was achieved through daily debriefs in the field and a day in Abuja with both state teams, consisting of presentations and discussions of
the initial findings and key themes. Second, one randomly sampled school from each state was selected and used for initial inductive brush-coding.130 This was done using Nvivo software. All
transcripts were coded directly based on what arose from the data, and the initial coding structure was discussed amongst the three team leads to mitigate single-researcher bias. The remaining
transcripts were thereafter coded into this structure, whilst allowing for new codes to emerge during the analysis. Third, the initial brush-codes were analysed and synthesised into thematic nodes. At
times this meant grouping nodes together, and at times it meant re-coding based on this initial analysis.
The set of hypotheses in the qualitative evaluation matrix provided an initial set of themes to be used to develop the thematic nodes. Each piece of data was considered in light of the context from
which it came (for instance, the knowledge that the person cited is likely to have about the subject, the incentives they may have to respond in particular ways and corroboration by other qualitative sources). The strength of thematic nodes was further determined based on the number of references and sources making up the node, to ensure triangulation of findings. As a verbatim transcription was made findings were also analysed in light of what and how questions had been asked. Researchers
then assessed the balance of these groups and whether the conclusions supported the initial hypotheses. Findings were considered both with IQSs as separate cases, and through common
themes across the six IQSs. The analysis was undertaken by the same researchers who conducted the fieldwork, to ensure that errors of interpretation were minimised, and findings were discussed amongst the team at each stage of analysis.
130 Inductive brush-coding refers to developing initial codes as they arise from the data, regardless of whether it sits within the evaluation matrix. This is done to ensure that analysis is drawn from the data collected, and not limited or biased based on what was expected to be found prior to fieldwork.
Evaluation of the Girl’s Education Project 3
© EDOREN 219
4.2.5 Ethics and inclusion
The ethics procedures for the qualitative component of the IQSS evaluation were described in the
discussion of the ethics approval process given in Section Ethics and inclusion. On 07 October 2015 a notice of Research Exemption was provided to EDOREN. The Exemption Letter is provided in Annex E. In addition, after the finalised tools were provided to the OPM Ethic Committee, ethical approval was given on 28 September 2015 (see Annex E).
4.2.6 Outcome measurement and constructs
The same measurement and tools for pupil learning outcomes, teacher motivation and teacher knowledge and skills are used in the IQSS evaluation as are used in the early learning intervention
evaluation. A description of these measurements and constructs is given in Section Outcome measurement and constructs.
4.2.7 Limitations and risks to the methodology
Different limitations and risks in the above-presented methodology need to be taken into account.
Some of these can be addressed by careful implementation of the evaluation, while others constitute real risks to the methodology. Table 25 reviews the limitations and risks.
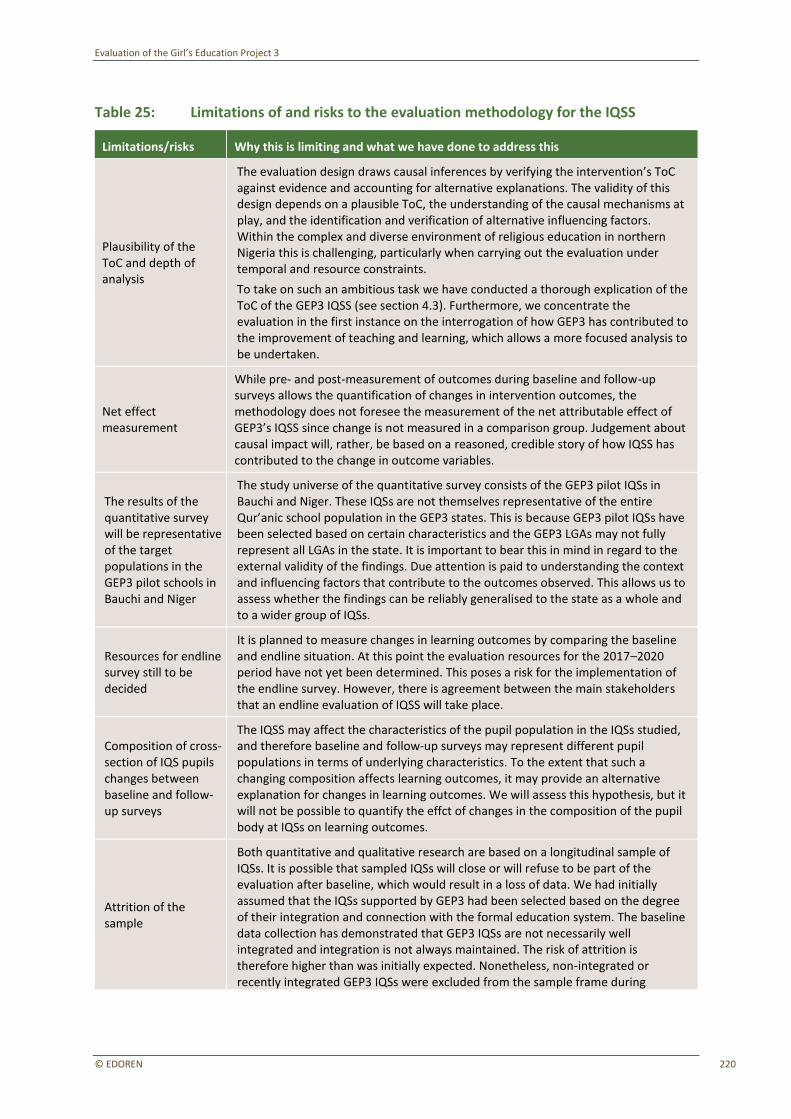
Evaluation of the Girl’s Education Project 3
© EDOREN 220
Table 25: Limitations of and risks to the evaluation methodology for the IQSS
Limitations/risks Why this is limiting and what we have done to address this
Plausibility of the ToC and depth of analysis
The evaluation design draws causal inferences by verifying the intervention’s ToC against evidence and accounting for alternative explanations. The validity of this design depends on a plausible ToC, the understanding of the causal mechanisms at play, and the identification and verification of alternative influencing factors. Within the complex and diverse environment of religious education in northern Nigeria this is challenging, particularly when carrying out the evaluation under temporal and resource constraints.
To take on such an ambitious task we have conducted a thorough explication of the ToC of the GEP3 IQSS (see section 4.3). Furthermore, we concentrate the evaluation in the first instance on the interrogation of how GEP3 has contributed to the improvement of teaching and learning, which allows a more focused analysis to be undertaken.
Net effect measurement
While pre- and post-measurement of outcomes during baseline and follow-up surveys allows the quantification of changes in intervention outcomes, the methodology does not foresee the measurement of the net attributable effect of GEP3’s IQSS since change is not measured in a comparison group. Judgement about causal impact will, rather, be based on a reasoned, credible story of how IQSS has contributed to the change in outcome variables.
The results of the quantitative survey will be representative of the target populations in the GEP3 pilot schools in Bauchi and Niger
The study universe of the quantitative survey consists of the GEP3 pilot IQSs in Bauchi and Niger. These IQSs are not themselves representative of the entire Qur’anic school population in the GEP3 states. This is because GEP3 pilot IQSs have been selected based on certain characteristics and the GEP3 LGAs may not fully represent all LGAs in the state. It is important to bear this in mind in regard to the external validity of the findings. Due attention is paid to understanding the context and influencing factors that contribute to the outcomes observed. This allows us to assess whether the findings can be reliably generalised to the state as a whole and to a wider group of IQSs.
Resources for endline survey still to be decided
It is planned to measure changes in learning outcomes by comparing the baseline and endline situation. At this point the evaluation resources for the 2017–2020 period have not yet been determined. This poses a risk for the implementation of the endline survey. However, there is agreement between the main stakeholders that an endline evaluation of IQSS will take place.
Composition of cross-section of IQS pupils changes between baseline and follow-up surveys
The IQSS may affect the characteristics of the pupil population in the IQSs studied, and therefore baseline and follow-up surveys may represent different pupil populations in terms of underlying characteristics. To the extent that such a changing composition affects learning outcomes, it may provide an alternative explanation for changes in learning outcomes. We will assess this hypothesis, but it will not be possible to quantify the effct of changes in the composition of the pupil body at IQSs on learning outcomes.
Attrition of the sample
Both quantitative and qualitative research are based on a longitudinal sample of IQSs. It is possible that sampled IQSs will close or will refuse to be part of the evaluation after baseline, which would result in a loss of data. We had initially assumed that the IQSs supported by GEP3 had been selected based on the degree of their integration and connection with the formal education system. The baseline data collection has demonstrated that GEP3 IQSs are not necessarily well integrated and integration is not always maintained. The risk of attrition is therefore higher than was initially expected. Nonetheless, non-integrated or recently integrated GEP3 IQSs were excluded from the sample frame during
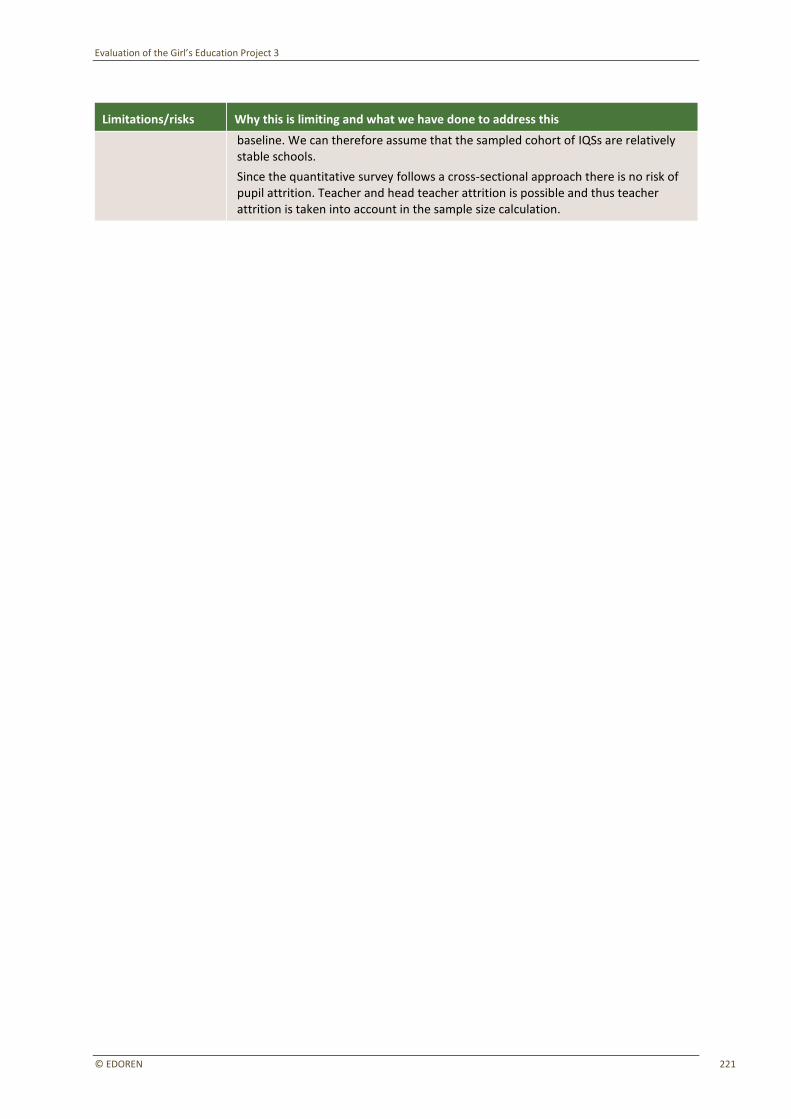
Evaluation of the Girl’s Education Project 3
© EDOREN 221
Limitations/risks Why this is limiting and what we have done to address this
baseline. We can therefore assume that the sampled cohort of IQSs are relatively stable schools.
Since the quantitative survey follows a cross-sectional approach there is no risk of pupil attrition. Teacher and head teacher attrition is possible and thus teacher attrition is taken into account in the sample size calculation.
Evaluation of the Girl’s Education Project 3
© EDOREN 222
Limitations/risks Why this is limiting and what we have done to address this
Survey response achievement
As discussed above, the survey team succeeded in surveying a high percentage of the intended schools, although a considerable number of replacements had to be surveyed. The percentage of pupils and teachers surveyed was around 80%, which is lower than expected. This was not due to a low response rate but rather because the schools involved did not have more eligible pupils or teachers. The lower than expected pupil sample size may affect the precision of the measurement of changes in learning outcomes. However, as the degree of integration increases over time, the intended sample size of pupils is more likely to be achieved at endline (given the use of a cross-sectional sample). In the case of teachers, which follows a panel approach, we estimate that less precision will not jeopardise a valid judgement of change since it is expected that the increase in teacher competencies will be relatively large (a 30% increase according to the GEP3 logframe).
In general, the substantial smaller school sample size compared to the early learning evaluation limits the use of regression modelling to examine relationships between variables, and therefore the quantitative analysis will be based more on descriptive analysis, which will be complemented with the qualitative findings.
Floor effects in measurement
High levels of missing data were observed in the teacher assessments. The amount of missing data is a major concern because it may indicate that many of the teachers who participated in the programme were not able to carry out many of the tasks asked of them. These tasks were intended to represent the core basic elements of what teachers should know and be able to do in order to teach effectively at a minimum level, so the concern is that the teachers may not be very skilled. While this suggests that the test was ‘too difficult’, the test was designed around notions of what a minimally competent teacher should be able to know and do. It is probably, therefore, unhelpful to be overly concerned about the test’s difficulty. The real issue is the competency level of the teachers.
However, these floor effects do limit the range of analyses able to be undertaken and limit the evaluation team’s capacity to draw empirically strong conclusions.
Social desirability bias
A number of items regarding attitudes towards girls’ education were included in the teacher questionnaire. While the reliability of the results was acceptable, the very high proportions of teachers responding positively to statements regarding the importance of girls’ education revealed a compliance effect. The distribution of responses across the strongly disagree, disagree, agree and strongly agree Likert scale indicates that teachers are conforming to perceived correct responses, creating a social desirability bias in the measurement. Given these compliance effects, the data on teachers’ attitudes towards girls’ education were not able to be used in the analysis. This limitation highlights the importance of observation data and qualitative methods to probe social norms and gender attitudes, particularly in an evaluation of a programme described as an intervention targeted at girls.
Bias in sampling of the quantitative survey
As part of the sampling process biases may occur when units are selected that do not form part of the target population, or when some units of the target population are less likely to be selected than others. In some schools stakeholders tried to influence pupil sampling or school eligibility. This was particularly a risk in IQSs, given their non-standard organisation and the poor quality of the sample frame. To the extent possible this risk was mitigated through the definition and implementation of rigorous and systematic sampling procedures under close supervision.
Inference beyond the selected qualitative case study sites is
While the contribution will be examined at multiple levels, the findings of the qualitative research will reflect the particular communities and schools selected. In contrast to the quantitative design, the qualitative research does not aim to

Evaluation of the Girl’s Education Project 3
© EDOREN 223
Limitations/risks Why this is limiting and what we have done to address this
limited facilitate sample-to-population inference, but rather to gather in-depth understanding of how the IQSS ToC unfolds within a specific context. Purposeful sampling has been carefully considered to ensure in-depth learning about the phenomena of integration of formal subjects in Qur’anic schools. Nevertheless, there remains a risk that the learning will be affected by the choice of communities and schools.
Given the non-representative nature of the qualitative selection of communities and schools the information provided is indicative
The qualitative component of the evaluation offers nuanced first-person accounts of people’s perspectives and experiences of the activities, without claiming that these accounts are representative of other similar communities’ and schools’ experiences. However, when considered together with the representative quantitative results, the qualitative findings provide interesting perspectives on underlying issues and factors that can determine the contribution of GEP3’s IQSS to improving learning outcomes, especially for girls.
The number of case study sites is limited due to resource constraints for the evaluation
In order to assess how GEP3’s IQSS contributes to improved learning outcomes, and how this contribution may differ across heterogeneous contexts, case study sites that collectively account for a range of contexts should be included. Given the resource constraints of the evaluation only six such sites have been included. Ideally, nine or 12 case study sites across two states would provide a greater degree of generalisability as the data generated would be based on a greater number of possible contextual situations.
4.3 Presentation of the updated ToC
The intervention ToC has an important methodological role in the evaluation of GEP3’s IQSS. While
causal inference in the case of the evaluation of the early learning intervention is derived from counterfactual comparison using a control group, contribution analysis infers causality from a
reasoned ToC. Therefore, in this section we present an in-depth discussion of the ToC of the IQSS, starting from the ToC included in the GEP3 Evaluation Framework and updated based on insights
from the baseline data collection. Since the overall ToC result chain presented in the Evaluation Framework was well-founded, little updating in this regard has been required. The review mostly focuses on further explaining the mechanism and assumptions underpinning the result chain.
Figure 41 visualises the ToC of GEP3’s IQSS. In the following subsections we will discuss the ToC according to three causal packages that make up this ToC. Each causal package consists of causal
factors interlinked via causal mechanisms, plus their underlying assumptions. A causal package is assumed to be sufficient for generating key intermediary or final outcomes on the condition that the causal chain and assumptions hold. For each causal package related to GEP3’s IQSS there may be alternative, non-GEP3 related explanations for the outcome occurring, which will require examination as part of the evaluation.
Each causal package presented below corresponds to the contribution claims presented in the methodological section.131
131 (Mayne, 2012). The causal package is defined as being sufficient to cause an outcome, while its individual elements, in particular the intervention elements, are necessary parts for the package to make a difference to the outcome.
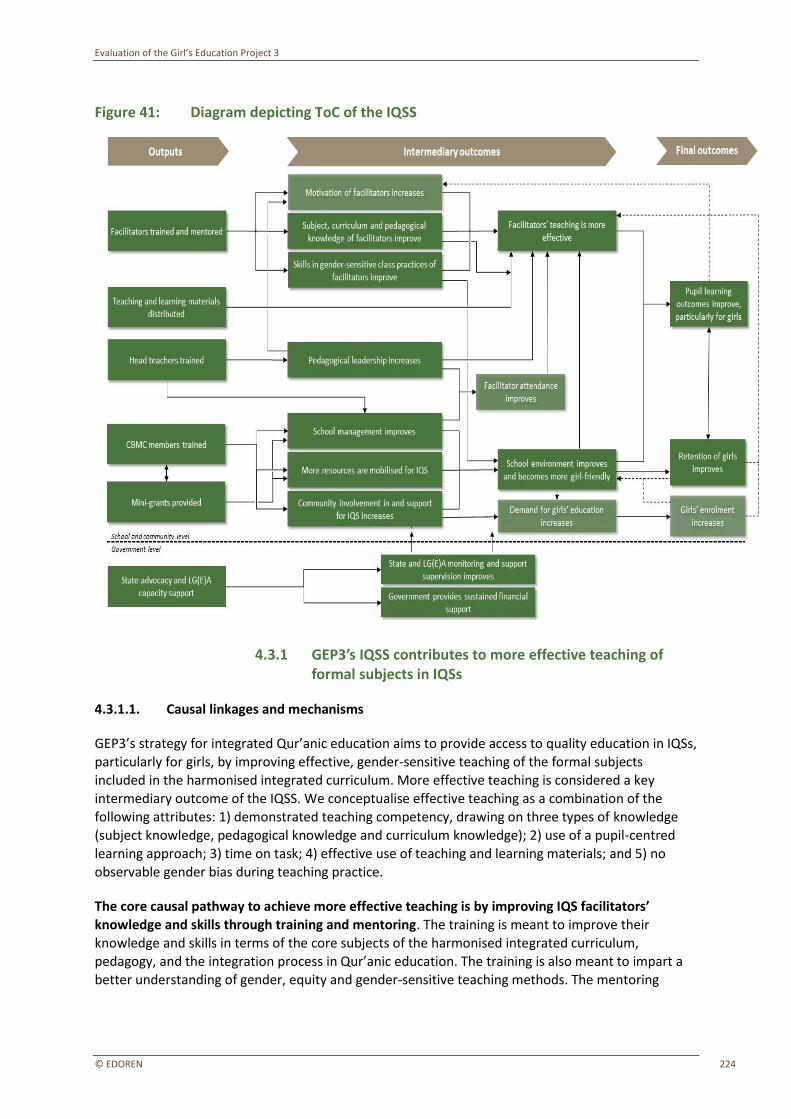
Evaluation of the Girl’s Education Project 3
© EDOREN 224
Figure 41: Diagram depicting ToC of the IQSS
4.3.1 GEP3’s IQSS contributes to more effective teaching of formal subjects in IQSs
4.3.1.1. Causal linkages and mechanisms
GEP3’s strategy for integrated Qur’anic education aims to provide access to quality education in IQSs,
particularly for girls, by improving effective, gender-sensitive teaching of the formal subjects included in the harmonised integrated curriculum. More effective teaching is considered a key intermediary outcome of the IQSS. We conceptualise effective teaching as a combination of the following attributes: 1) demonstrated teaching competency, drawing on three types of knowledge (subject knowledge, pedagogical knowledge and curriculum knowledge); 2) use of a pupil-centred
learning approach; 3) time on task; 4) effective use of teaching and learning materials; and 5) no
observable gender bias during teaching practice.
The core causal pathway to achieve more effective teaching is by improving IQS facilitators’ knowledge and skills through training and mentoring. The training is meant to improve their knowledge and skills in terms of the core subjects of the harmonised integrated curriculum, pedagogy, and the integration process in Qur’anic education. The training is also meant to impart a better understanding of gender, equity and gender-sensitive teaching methods. The mentoring
Evaluation of the Girl’s Education Project 3
© EDOREN 225
process is assumed to play an important role in facilitators effectively acquiring this knowledge and
skills, and putting it into practice, by activating the following mechanisms:
• peer interaction that encourages facilitators to discuss acquired knowledge and skills, share experiences and provide feedback based on a collaborative relationship among peers;
• school-based support that allows facilitators to access and refresh their knowledge and understanding at any time whilst using the provided materials; and
• continuous face-to-face, practical support by an experienced mentor based on a long-term, personal relationship that reinforces the learning and delivery of newly acquired knowledge and
skills with confidence.
Mentoring is also assumed to increase teacher motivation. While increased teacher motivation is not a direct intended objective of the intervention, it is assumed to be a key contributing factor to more effective teaching. The underlying theory is that peer interaction and ongoing support increase
the facilitators’ perceived teaching efficacy, self-confidence and self-esteem, which results in increased motivation, as expressed in (i) more interest and enjoyment in their work, (ii) more effort being made, (iii) more importance attached to their work, and (iv) less pressure and tension
experienced in relation to their work.132 This in turns enhances the likelihood of facilitators actually applying their improved knowledge and skills, and spending increased time on task on activities that
benefit student learning.
The distribution of Hausa teaching and learning materials contributes to more effective teaching as
materials provide guidance for the teacher during the teaching process and facilitate the knowledge transfer between teachers and pupils. This requires teachers to have the pedagogical knowledge and skills to effectively use the materials during teaching practice. Pupil workbooks and notebooks also
allow pupils to practice and allow teachers to assess pupils in writing. The provision of learning materials may also ensure the inclusiveness of integrated Qur’anic education. However, it must be
noted that poverty has been identified as one of the key barriers to accessing public primary school
and to the extent that the integration process forces parents to invest in learning materials,
compared to the situation without integration, parents’ inability to do so may cause pupils to drop out.
Head teacher training seeks to support a more effective teaching process in several ways. First, the training is assumed to increase pedagogical leadership in the IQS by providing the head teacher with knowledge and skills in terms of pedagogy and leadership. This, in turn, will provide the facilitators
with school-based, continuous guidance in how to better delivery instruction. Second, leadership can inspire and motivate the facilitator, which contributes to improved attendance and demonstrates
itself in increased effort and enjoyment of work. Third, the training also aims to improve the head teacher’s school management practices, such as teacher attendance monitoring and class scheduling, which in turn can contribute to increased facilitator attendance and time on task. Improved school
management can also increase the resources available for facilitator remuneration, which can affect their attendance, and can subsequently contribute to more effective teaching.
An improved, more girl-friendly school environment and improved monitoring and support supervision by local government education staff is assumed to contribute to more effective
teaching. A better school environment, in terms of infrastructure, classroom conditions, safety and relationships between different actors in the school, can improve teachers’ and pupils’ comfort and
132 This theory is based on the theory of motivation used by the TDP in Nigeria.
Evaluation of the Girl’s Education Project 3
© EDOREN 226
feeling of wellbeing in the school. It can also lead to increased instructional time by creating the
physical conditions required for teaching (e.g. light). Girl-friendly school features, such as the presence of female teachers or female participation in school management, can contribute to an increase in gender-sensitive teaching practices by creating a climate that is more supportive of girls. Improved government monitoring and support supervision can contribute to better school
management and can motivate facilitators and proprietors to continue providing the integrated curriculum as it signals government support for integration. Furthermore, sustained financial government support can support facilitator remuneration, which will contribute to facilitators’ motivation and attendance.
While more effective teaching is assumed to contribute to improved learning outcomes,
improvement in learning outcomes can in turn contribute to an increase in facilitators’ perceived teaching efficacy, which is expected to strengthen their motivation. An increase in girls’ enrolment and retention may also affect teaching practices: first, it may contribute positively by creating a more girl-friendly school environment, which in turn can support gender-sensitive teaching practices;
second, it may have a negative effect by increasing pupil–classroom and pupil–teacher ratios.
4.3.1.2. Assumptions
Assumptions are defined here as influencing conditions that might enable causal linkages and mechanisms to work, or may impede those linkages and mechanism. Key assumptions underlying the causal chain of Contribution Claim 1 are presented in Figure 42.
Implementation assumptions are not included in the diagram. It is assumed that the training and mentoring are implemented as planned and cover all the components of the training curriculum in a
quality manner, and that the teaching and learning materials are distributed. These are important assumptions, in particular with regards to the mentoring since GEP3’s capacity development approach for facilitators strongly emphasises continuous, school-based follow-up by experienced
mentors complemented with peer interaction.

Evaluation of the Girl’s Education Project 3
© EDOREN 227
Figure 42: Causal package and underlying assumptions of ‘more effective teaching’
4.3.1.3. Alternative explanations
We consider two alternative, non-GEP3-related explanations that could also be sufficient for the
intended change in teaching in the IQSs to be observed:
• Facilitators build capacity in other ways. If facilitators in the GEP3 IQSs participate in other training or capacity building processes during the GEP3 project period, teaching could become more effective regardless of GEP3. Such capacity building may take place when facilitators are also teachers in public primary schools. Furthermore, if new facilitators who have a higher
teaching competency level are employed, teaching may also become more effective.
• Facilitators are motivated in other ways. If facilitator remuneration or working conditions improve without any influence by GEP3 interventions, facilitators may become more motivated
and teach more effectively regardless of GEP3.
4.3.2 GEP3’s IQSS contributes to an improved, girl-friendly school environment in IQSs
4.3.2.1 Causal linkages and mechanisms
Mainly through its support to CBMCs GEP3 seeks to improve the school environment of the IQS and make it more girl-friendly. We consider the school environment to encompass the physical environment, in terms of infrastructure and classroom conditions, its security and perceived safety, and the school’s organisation and institutional culture, in terms of leadership, organisational
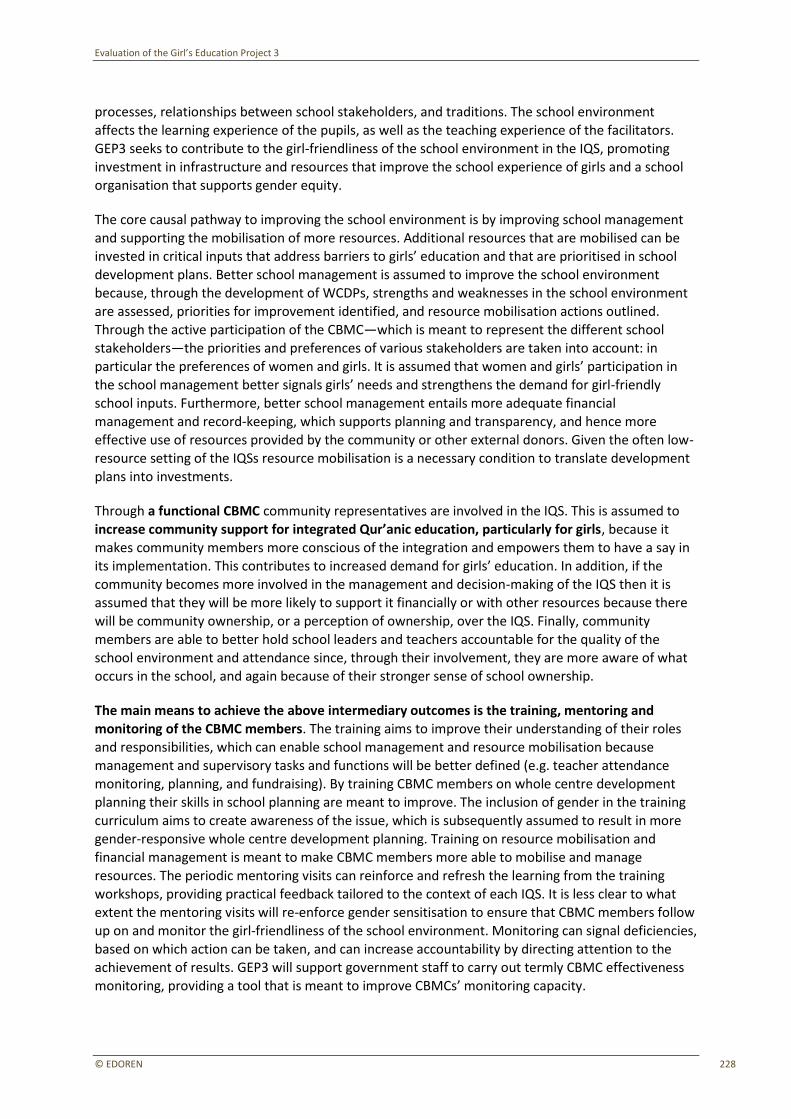
Evaluation of the Girl’s Education Project 3
© EDOREN 228
processes, relationships between school stakeholders, and traditions. The school environment
affects the learning experience of the pupils, as well as the teaching experience of the facilitators. GEP3 seeks to contribute to the girl-friendliness of the school environment in the IQS, promoting investment in infrastructure and resources that improve the school experience of girls and a school organisation that supports gender equity.
The core causal pathway to improving the school environment is by improving school management and supporting the mobilisation of more resources. Additional resources that are mobilised can be invested in critical inputs that address barriers to girls’ education and that are prioritised in school development plans. Better school management is assumed to improve the school environment because, through the development of WCDPs, strengths and weaknesses in the school environment
are assessed, priorities for improvement identified, and resource mobilisation actions outlined. Through the active participation of the CBMC—which is meant to represent the different school stakeholders—the priorities and preferences of various stakeholders are taken into account: in particular the preferences of women and girls. It is assumed that women and girls’ participation in
the school management better signals girls’ needs and strengthens the demand for girl-friendly school inputs. Furthermore, better school management entails more adequate financial management and record-keeping, which supports planning and transparency, and hence more
effective use of resources provided by the community or other external donors. Given the often low-resource setting of the IQSs resource mobilisation is a necessary condition to translate development
plans into investments.
Through a functional CBMC community representatives are involved in the IQS. This is assumed to
increase community support for integrated Qur’anic education, particularly for girls, because it makes community members more conscious of the integration and empowers them to have a say in its implementation. This contributes to increased demand for girls’ education. In addition, if the
community becomes more involved in the management and decision-making of the IQS then it is assumed that they will be more likely to support it financially or with other resources because there
will be community ownership, or a perception of ownership, over the IQS. Finally, community members are able to better hold school leaders and teachers accountable for the quality of the
school environment and attendance since, through their involvement, they are more aware of what occurs in the school, and again because of their stronger sense of school ownership.
The main means to achieve the above intermediary outcomes is the training, mentoring and monitoring of the CBMC members. The training aims to improve their understanding of their roles and responsibilities, which can enable school management and resource mobilisation because
management and supervisory tasks and functions will be better defined (e.g. teacher attendance monitoring, planning, and fundraising). By training CBMC members on whole centre development
planning their skills in school planning are meant to improve. The inclusion of gender in the training curriculum aims to create awareness of the issue, which is subsequently assumed to result in more gender-responsive whole centre development planning. Training on resource mobilisation and
financial management is meant to make CBMC members more able to mobilise and manage
resources. The periodic mentoring visits can reinforce and refresh the learning from the training workshops, providing practical feedback tailored to the context of each IQS. It is less clear to what extent the mentoring visits will re-enforce gender sensitisation to ensure that CBMC members follow
up on and monitor the girl-friendliness of the school environment. Monitoring can signal deficiencies, based on which action can be taken, and can increase accountability by directing attention to the achievement of results. GEP3 will support government staff to carry out termly CBMC effectiveness monitoring, providing a tool that is meant to improve CBMCs’ monitoring capacity.
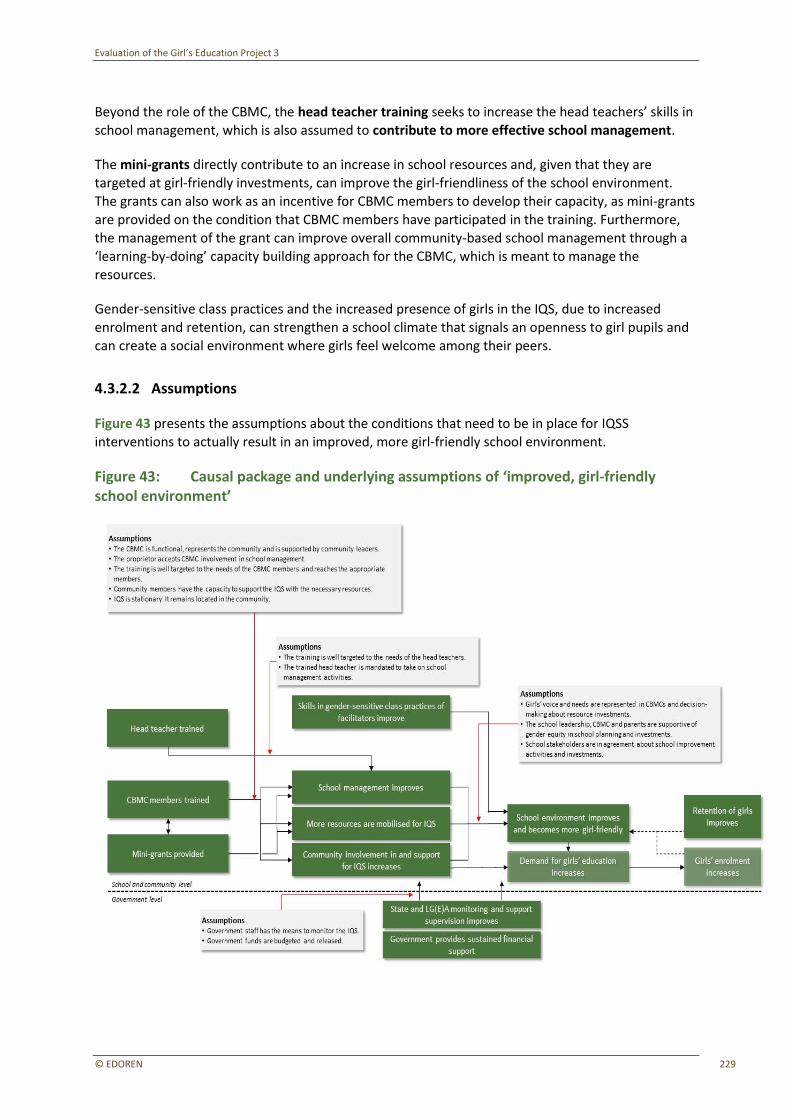
Evaluation of the Girl’s Education Project 3
© EDOREN 229
Beyond the role of the CBMC, the head teacher training seeks to increase the head teachers’ skills in
school management, which is also assumed to contribute to more effective school management.
The mini-grants directly contribute to an increase in school resources and, given that they are targeted at girl-friendly investments, can improve the girl-friendliness of the school environment. The grants can also work as an incentive for CBMC members to develop their capacity, as mini-grants
are provided on the condition that CBMC members have participated in the training. Furthermore, the management of the grant can improve overall community-based school management through a ‘learning-by-doing’ capacity building approach for the CBMC, which is meant to manage the resources.
Gender-sensitive class practices and the increased presence of girls in the IQS, due to increased
enrolment and retention, can strengthen a school climate that signals an openness to girl pupils and can create a social environment where girls feel welcome among their peers.
4.3.2.2 Assumptions
Figure 43 presents the assumptions about the conditions that need to be in place for IQSS
interventions to actually result in an improved, more girl-friendly school environment.
Figure 43: Causal package and underlying assumptions of ‘improved, girl-friendly school environment’

Evaluation of the Girl’s Education Project 3
© EDOREN 230
4.3.2.3 Alternative explanations
We consider the following alternative, non-GEP3-related explanations that could improve the school
environment and make it more girl-friendly:
• CBMC members and school leadership improve their capacity through other means. School management and resource mobilisation can improve by new stakeholders becoming involved in the IQS, regardless of GEP3 support. For example, a philanthropist may take an interest in the
IQS or the IQS may start benefitting from the influence or competencies of a highly educated or/and respected community member. It is not only difficult to identify all such influences but it will be also hard to separate out GEP3’s influence in such instances since CBMC training promotes such involvement. Some CBMC members may also be members of the SBMC in the neighbouring public primary school, and may build their capacity through their participation in
public primary school management.
4.3.3 More effective teaching of formal subjects and an improved, girl-friendly learning environment contribute to improved learning levels, particularly among girls
4.3.3.1 Causal linkages and mechanisms
The principal final outcome that GEP3 aims to achieve with its IQSS is for pupils learning outcomes to improve, particularly for girls. More effective teaching is considered a critical contributing factor, which will be supported by an improved, more girl-friendly school environment. As these
two factors improve and result in better quality education girls’ retention is also assumed to increase. In addition, girls’ enrolment is expected to increase because of an increased demand for
girls’ education as a result of more community involvement and support for IQSs. Girls’ retention and enrolment are not further discussed below, as they are not the focus of this evaluation. However, it
is important to note that increased retention and enrolment can in turn influence effective teaching and the school environment, as was discussed in the previous sections.
International studies indicate that what teachers know, what they do and how much they care accounts for more variance in pupil achievement than any other policy-amenable variable (Hattie 2003). Several mechanisms are at play that may cause more effective teaching to lead to improved learning outcomes for girls. First, the combination of improved subject knowledge and pedagogical
skills, supported by fit-for-purpose teaching and learning materials, can enable more competent and equipped facilitators to better support pupils’ learning achievement in the classroom. By teaching in a more gender-sensitive manner the teacher’s interaction with the girl pupil improves, which can improve the quality of the girl’s education in particular and provide additional motivation for her to learn. Second, student-centred teaching methods—a competency that GEP3 training intends to
strengthen—encourages children, especially girls, to attend schools, which increases the pupil’s
actual instructional time and can, therefore, increase learning. Third, effective teaching also entails
facilitators attending and teaching when in school (as a result of better school management). This, again, can increase the actual instructional time, and hence positively influence learning outcomes.
To the extent that the school environment is more conducive to girls learning, learning achievement is further strengthened. Again, the causal mechanisms here are several. First, improved physical conditions under which teaching and learning take place (e.g. less overcrowded
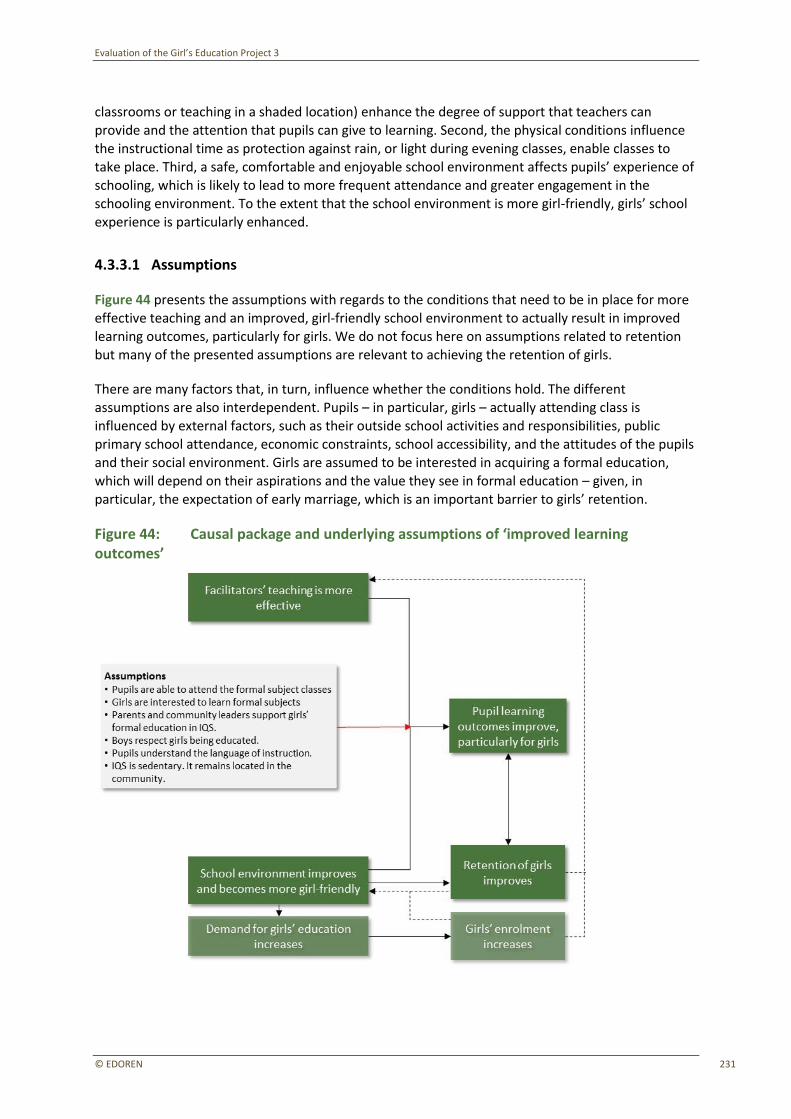
Evaluation of the Girl’s Education Project 3
© EDOREN 231
classrooms or teaching in a shaded location) enhance the degree of support that teachers can
provide and the attention that pupils can give to learning. Second, the physical conditions influence the instructional time as protection against rain, or light during evening classes, enable classes to take place. Third, a safe, comfortable and enjoyable school environment affects pupils’ experience of schooling, which is likely to lead to more frequent attendance and greater engagement in the
schooling environment. To the extent that the school environment is more girl-friendly, girls’ school experience is particularly enhanced.
4.3.3.1 Assumptions
Figure 44 presents the assumptions with regards to the conditions that need to be in place for more effective teaching and an improved, girl-friendly school environment to actually result in improved learning outcomes, particularly for girls. We do not focus here on assumptions related to retention but many of the presented assumptions are relevant to achieving the retention of girls.
There are many factors that, in turn, influence whether the conditions hold. The different assumptions are also interdependent. Pupils – in particular, girls – actually attending class is influenced by external factors, such as their outside school activities and responsibilities, public
primary school attendance, economic constraints, school accessibility, and the attitudes of the pupils
and their social environment. Girls are assumed to be interested in acquiring a formal education, which will depend on their aspirations and the value they see in formal education – given, in
particular, the expectation of early marriage, which is an important barrier to girls’ retention.
Figure 44: Causal package and underlying assumptions of ‘improved learning outcomes’

Evaluation of the Girl’s Education Project 3
© EDOREN 232
4.3.3.1 Alternative explanations
We consider the following alternative, non-GEP3-related explanations that could also be sufficient to
explain improved learning outcomes:
• Improved access and quality education in other schools. The baseline data demonstrate that IQSs are not the only alternative to accessing formal education. Pupils are enrolled in both IQSs and public primary schools. The extent that pupils attend the two schools depends on many
interacting factors, such as accessibility of the public primary school, the relative cost of attending public primary schools and poverty of the parents, as well as cultural beliefs and social norms with regards to formal education and girls’ access to this. If these underlying factors change public primary school attendance may increase and learning outcomes may improve, regardless of the integration of formal education in the Qur’anic schools. The quality of
education also plays a role. Access to public primary school does not necessarily result in improved learning outcomes. To the extent that the quality of education in the public primary
schools that IQS pupils are attending becomes better, their learning outcomes can improve.
Furthermore, in less remote areas pupils may attend vocational or other training, which may provide some form of basic education or motivate pupils to learn. Finally, in more urban areas formal private schools may also attract pupils, which can affect their learning outcomes.
• Changes in the composition of the pupil population. Over time, the IQS may attract a different pupil population: for example, younger pupils start the integrated curriculum or more pupils with
previous education experience are attracted to the IQS. To the extent that their learning outcome levels are different from the learning levels of the baseline population changes in the average learning outcome in the IQS may be observed, regardless of improved teaching or an
improved school environment.
4.4 Analysis of the data – Contribution Claim 1: GEP3’s support to IQSs contributes to more effective teaching of formal subjects in IQSs
The next three subsections (Sections 4.4 – 4.6) present the baseline analysis of the quantitative survey data gathered in 60 IQSs and the qualitative case study findings in six IQSs in Niger and
Bauchi. The evidence has been structured around the three contribution claims presented in the IQSS ToC. These baseline findings will function as the reference point to which the midline and
endline data will be compared in order to assess the impact contribution of the programme.
The quantitative analysis presents a descriptive analysis of associations of baseline indicators across categories of interest. Given that the sample size of the IQSS survey is relatively small and data are
disaggregated further across various categories (by state, by ownership, etc.) the averages presented have large confidence intervals. Hence, it is important to emphasise that these associations should
not be used to make statistical claims of causal inference. Rather, they should only be treated as a summary of the baseline sample. The figures presented alongside the text serve a descriptive
purpose, to facilitate the narrative regarding the results. A larger set of descriptive statistics, including mean estimates, standard errors and number of observations for each variable on average and by state, is included in Annex M.
In this section we present the baseline data related to teachers, teachers’ knowledge and teaching practices in IQSs. In addition, we discuss other components of the IQSS ToC that are assumed to support more effective teaching: that is, pedagogical and school leadership, and access to teaching
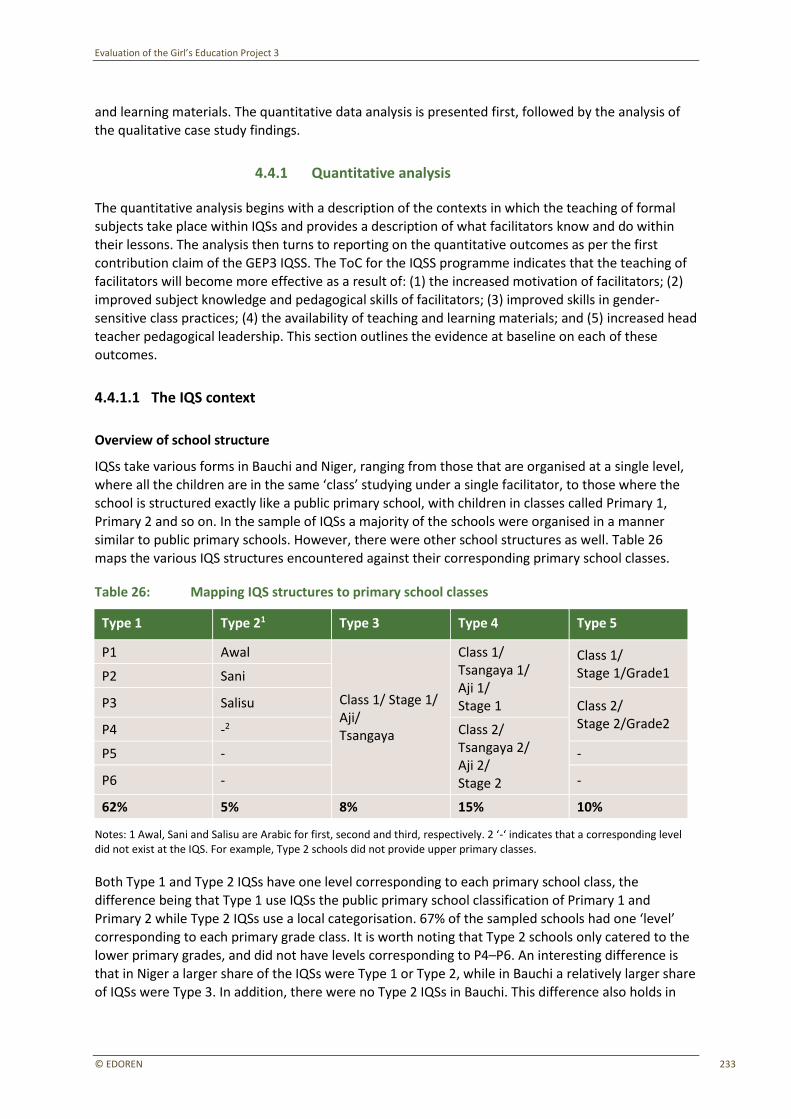
Evaluation of the Girl’s Education Project 3
© EDOREN 233
and learning materials. The quantitative data analysis is presented first, followed by the analysis of
the qualitative case study findings.
4.4.1 Quantitative analysis
The quantitative analysis begins with a description of the contexts in which the teaching of formal subjects take place within IQSs and provides a description of what facilitators know and do within their lessons. The analysis then turns to reporting on the quantitative outcomes as per the first contribution claim of the GEP3 IQSS. The ToC for the IQSS programme indicates that the teaching of
facilitators will become more effective as a result of: (1) the increased motivation of facilitators; (2) improved subject knowledge and pedagogical skills of facilitators; (3) improved skills in gender-sensitive class practices; (4) the availability of teaching and learning materials; and (5) increased head teacher pedagogical leadership. This section outlines the evidence at baseline on each of these outcomes.
4.4.1.1 The IQS context
Overview of school structure
IQSs take various forms in Bauchi and Niger, ranging from those that are organised at a single level, where all the children are in the same ‘class’ studying under a single facilitator, to those where the school is structured exactly like a public primary school, with children in classes called Primary 1,
Primary 2 and so on. In the sample of IQSs a majority of the schools were organised in a manner similar to public primary schools. However, there were other school structures as well. Table 26
maps the various IQS structures encountered against their corresponding primary school classes.
Table 26: Mapping IQS structures to primary school classes
Type 1 Type 21 Type 3 Type 4 Type 5
P1 Awal
Class 1/ Stage 1/ Aji/ Tsangaya
Class 1/ Tsangaya 1/ Aji 1/ Stage 1
Class 1/ Stage 1/Grade1 P2 Sani
P3 Salisu Class 2/ Stage 2/Grade2 P4 -2 Class 2/
Tsangaya 2/ Aji 2/ Stage 2
P5 - -
P6 - -
62% 5% 8% 15% 10%
Notes: 1 Awal, Sani and Salisu are Arabic for first, second and third, respectively. 2 ‘-‘ indicates that a corresponding level did not exist at the IQS. For example, Type 2 schools did not provide upper primary classes.
Both Type 1 and Type 2 IQSs have one level corresponding to each primary school class, the difference being that Type 1 use IQSs the public primary school classification of Primary 1 and
Primary 2 while Type 2 IQSs use a local categorisation. 67% of the sampled schools had one ‘level’ corresponding to each primary grade class. It is worth noting that Type 2 schools only catered to the lower primary grades, and did not have levels corresponding to P4–P6. An interesting difference is that in Niger a larger share of the IQSs were Type 1 or Type 2, while in Bauchi a relatively larger share of IQSs were Type 3. In addition, there were no Type 2 IQSs in Bauchi. This difference also holds in
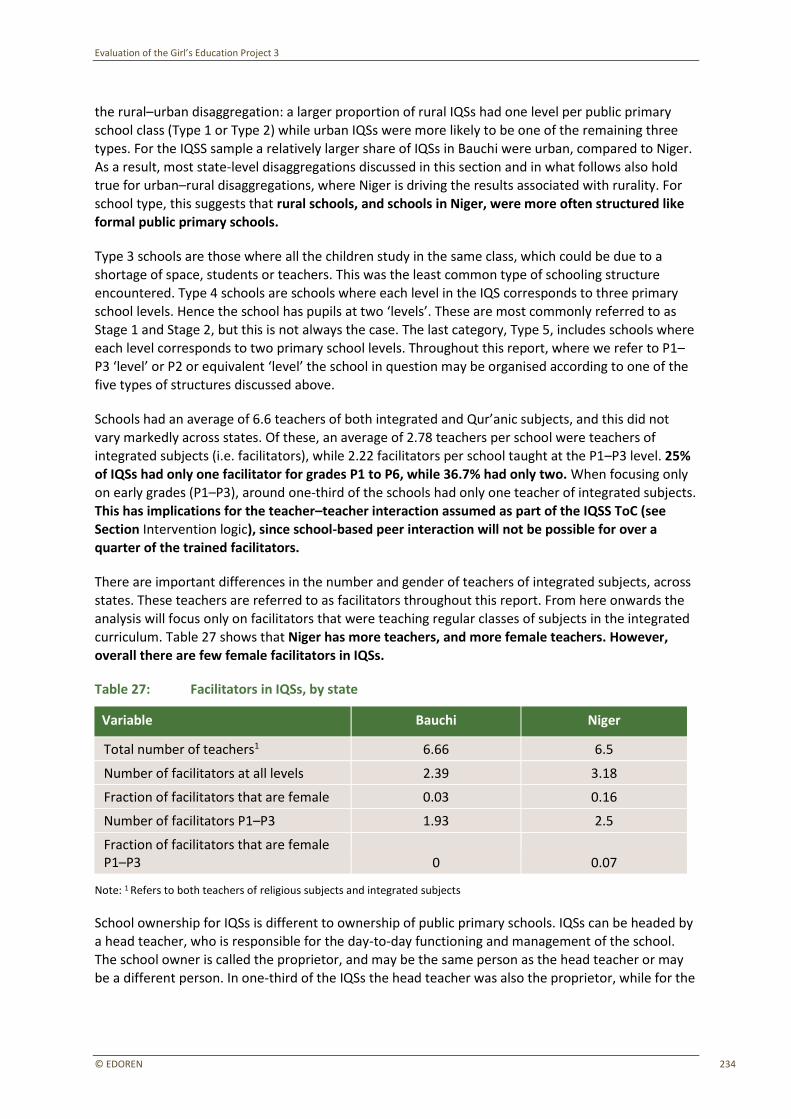
Evaluation of the Girl’s Education Project 3
© EDOREN 234
the rural–urban disaggregation: a larger proportion of rural IQSs had one level per public primary
school class (Type 1 or Type 2) while urban IQSs were more likely to be one of the remaining three types. For the IQSS sample a relatively larger share of IQSs in Bauchi were urban, compared to Niger. As a result, most state-level disaggregations discussed in this section and in what follows also hold true for urban–rural disaggregations, where Niger is driving the results associated with rurality. For
school type, this suggests that rural schools, and schools in Niger, were more often structured like formal public primary schools.
Type 3 schools are those where all the children study in the same class, which could be due to a shortage of space, students or teachers. This was the least common type of schooling structure encountered. Type 4 schools are schools where each level in the IQS corresponds to three primary
school levels. Hence the school has pupils at two ‘levels’. These are most commonly referred to as Stage 1 and Stage 2, but this is not always the case. The last category, Type 5, includes schools where each level corresponds to two primary school levels. Throughout this report, where we refer to P1–P3 ‘level’ or P2 or equivalent ‘level’ the school in question may be organised according to one of the
five types of structures discussed above.
Schools had an average of 6.6 teachers of both integrated and Qur’anic subjects, and this did not
vary markedly across states. Of these, an average of 2.78 teachers per school were teachers of integrated subjects (i.e. facilitators), while 2.22 facilitators per school taught at the P1–P3 level. 25% of IQSs had only one facilitator for grades P1 to P6, while 36.7% had only two. When focusing only
on early grades (P1–P3), around one-third of the schools had only one teacher of integrated subjects. This has implications for the teacher–teacher interaction assumed as part of the IQSS ToC (see
Section Intervention logic), since school-based peer interaction will not be possible for over a quarter of the trained facilitators.
There are important differences in the number and gender of teachers of integrated subjects, across
states. These teachers are referred to as facilitators throughout this report. From here onwards the analysis will focus only on facilitators that were teaching regular classes of subjects in the integrated
curriculum. Table 27 shows that Niger has more teachers, and more female teachers. However, overall there are few female facilitators in IQSs.
Table 27: Facilitators in IQSs, by state
Variable Bauchi Niger
Total number of teachers1 6.66 6.5
Number of facilitators at all levels 2.39 3.18
Fraction of facilitators that are female 0.03 0.16
Number of facilitators P1–P3 1.93 2.5
Fraction of facilitators that are female P1–P3 0 0.07
Note: 1 Refers to both teachers of religious subjects and integrated subjects
School ownership for IQSs is different to ownership of public primary schools. IQSs can be headed by a head teacher, who is responsible for the day-to-day functioning and management of the school. The school owner is called the proprietor, and may be the same person as the head teacher or may be a different person. In one-third of the IQSs the head teacher was also the proprietor, while for the

Evaluation of the Girl’s Education Project 3
© EDOREN 235
remaining schools these roles were filled by different individuals. The different school ownership
structures led to interesting trends in the data.
Schools where the head teacher and proprietor roles were separated had more facilitators on average, and had more female facilitators. They also had better infrastructure, as indicated by the presence of more rooms overall, more rooms being used for classes, more functioning toilets for
pupils, and the greater likelihood of having an electricity connection. This hints towards the fact that schools where the head teacher and proprietor roles are separated are perhaps better established as schools. This notion is supported by the fact that such schools had been integrated for longer than schools where the head teacher and proprietor were the same person. Schools where these roles are separated are more common in Niger than in Bauchi.
As mentioned, all the facilitators surveyed taught integrated subjects at the P1–P3 level at the time of the baseline study. A minority of them (around 12%) also taught P4 to P6 classes, thus being involved in teaching at both upper and lower levels of the school. This was particularly prominent in
Bauchi. When facilitators were asked to specify the subjects they were currently teaching, each facilitator reported teaching an average of two integrated subjects. In line with our sampling strategy, a majority of the surveyed facilitators were teachers of mathematics or English, with 65% of
facilitators teaching mathematics and 71% of the facilitators teaching English in the current term. Surveyed facilitators also taught other integrated subjects: 32% of the facilitators reported teaching Hausa, 24% reported teaching social studies and 11% reported teaching basic science. This reflects
the fact that all schools were not teaching all five core integrated subjects: English, mathematics, Hausa, science and social studies. Findings from the school-level head teacher interview confirm
that a little over 10% of surveyed schools were teaching all five integrated subjects. This trend is being driven by the schools in Niger, of which a noticeably larger proportion were teaching all five integrated subjects compared to schools in Bauchi. Although around 70% of surveyed schools taught
Hausa as a subject, the focus on English and mathematics teaching was clear in the data, with 90% of the schools teaching both of these subjects. The varied adoption of the integrated curriculum
deserves attention during implementation, to the extent that GEP3 seeks to improve the effective teaching of all core subjects.133 For schools that are not already teaching multiple integrated
subjects, additional support may be required for facilitators, as well as pupils, to cope with additional subjects.
When looking at the entire range of integrated subjects being taught by sampled facilitators (which includes physical and health education, creative arts, and computer science, in addition to the five core integrated subjects), we see that slightly more than a third of the IQS facilitators were teaching
only one of the subjects, while another third were teaching two subjects (see Figure 45). There are sharp intra-state differences: in Niger, only about a quarter of the facilitators were teaching a single
subject, while about half were teaching two subjects. This trend was reversed for Bauchi, where approximately half the facilitators taught only a single integrated subject. This is in line with the fact that more schools in Niger taught multiple subjects, while schools in Bauchi taught only one or two.
133 The GEP3 Strategy Paper for IQSs (UNICEF, 2015b) indicates that GEP3 will support the development of a training package and implementation programme to improve the capacity of IQS teachers/facilitators to be effective teachers of core subjects. The strategy does not specify whether this refers to all core subjects. The Training Manual for IQTE Teachers and Facilitators covers all core subjects. However, the outcomes stated in the Strategy Paper focus on the improvement of pupils’ literacy and numeracy skills, which indicates that literacy and mathematics may be the core subjects the effective teaching of which the project wants to emphasise.
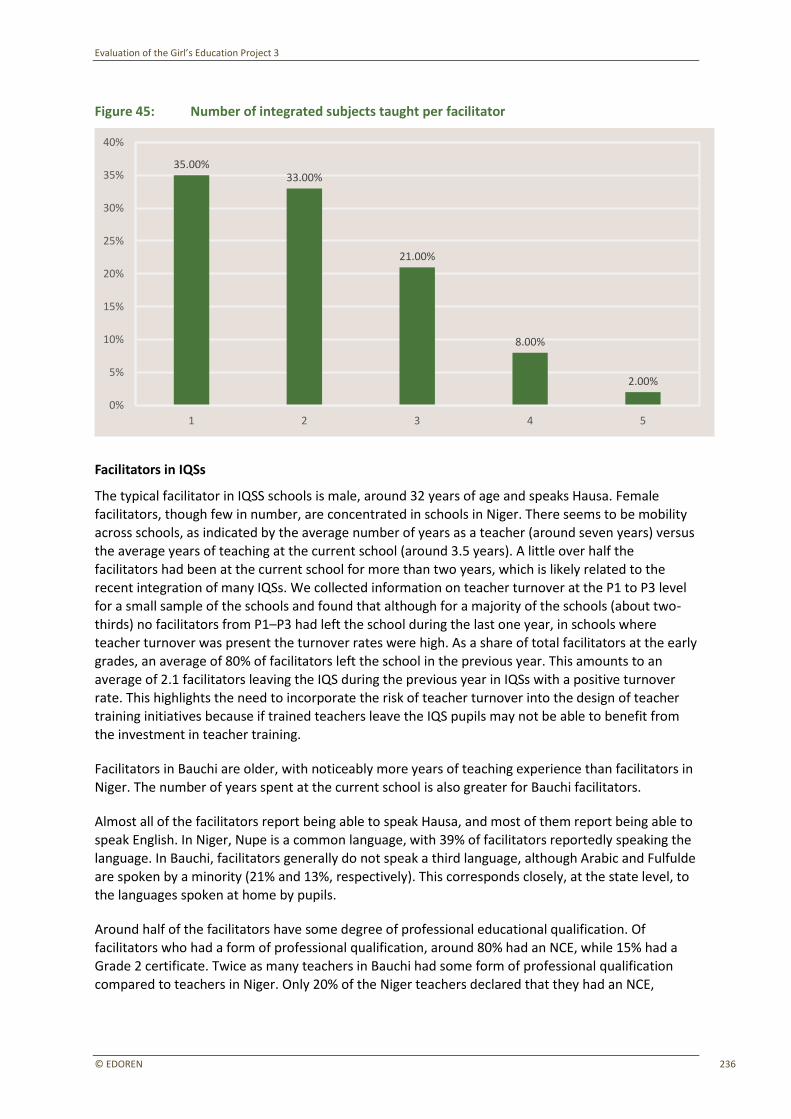
Evaluation of the Girl’s Education Project 3
© EDOREN 236
Figure 45: Number of integrated subjects taught per facilitator
Facilitators in IQSs
The typical facilitator in IQSS schools is male, around 32 years of age and speaks Hausa. Female
facilitators, though few in number, are concentrated in schools in Niger. There seems to be mobility across schools, as indicated by the average number of years as a teacher (around seven years) versus the average years of teaching at the current school (around 3.5 years). A little over half the
facilitators had been at the current school for more than two years, which is likely related to the recent integration of many IQSs. We collected information on teacher turnover at the P1 to P3 level
for a small sample of the schools and found that although for a majority of the schools (about two-
thirds) no facilitators from P1–P3 had left the school during the last one year, in schools where
teacher turnover was present the turnover rates were high. As a share of total facilitators at the early grades, an average of 80% of facilitators left the school in the previous year. This amounts to an average of 2.1 facilitators leaving the IQS during the previous year in IQSs with a positive turnover
rate. This highlights the need to incorporate the risk of teacher turnover into the design of teacher training initiatives because if trained teachers leave the IQS pupils may not be able to benefit from
the investment in teacher training.
Facilitators in Bauchi are older, with noticeably more years of teaching experience than facilitators in Niger. The number of years spent at the current school is also greater for Bauchi facilitators.
Almost all of the facilitators report being able to speak Hausa, and most of them report being able to speak English. In Niger, Nupe is a common language, with 39% of facilitators reportedly speaking the language. In Bauchi, facilitators generally do not speak a third language, although Arabic and Fulfulde
are spoken by a minority (21% and 13%, respectively). This corresponds closely, at the state level, to
the languages spoken at home by pupils.
Around half of the facilitators have some degree of professional educational qualification. Of facilitators who had a form of professional qualification, around 80% had an NCE, while 15% had a Grade 2 certificate. Twice as many teachers in Bauchi had some form of professional qualification compared to teachers in Niger. Only 20% of the Niger teachers declared that they had an NCE,
35.00%33.00%
21.00%
8.00%
2.00%
1 2 3 4 5
0%
5%
10%
15%
20%
25%
30%
35%
40%
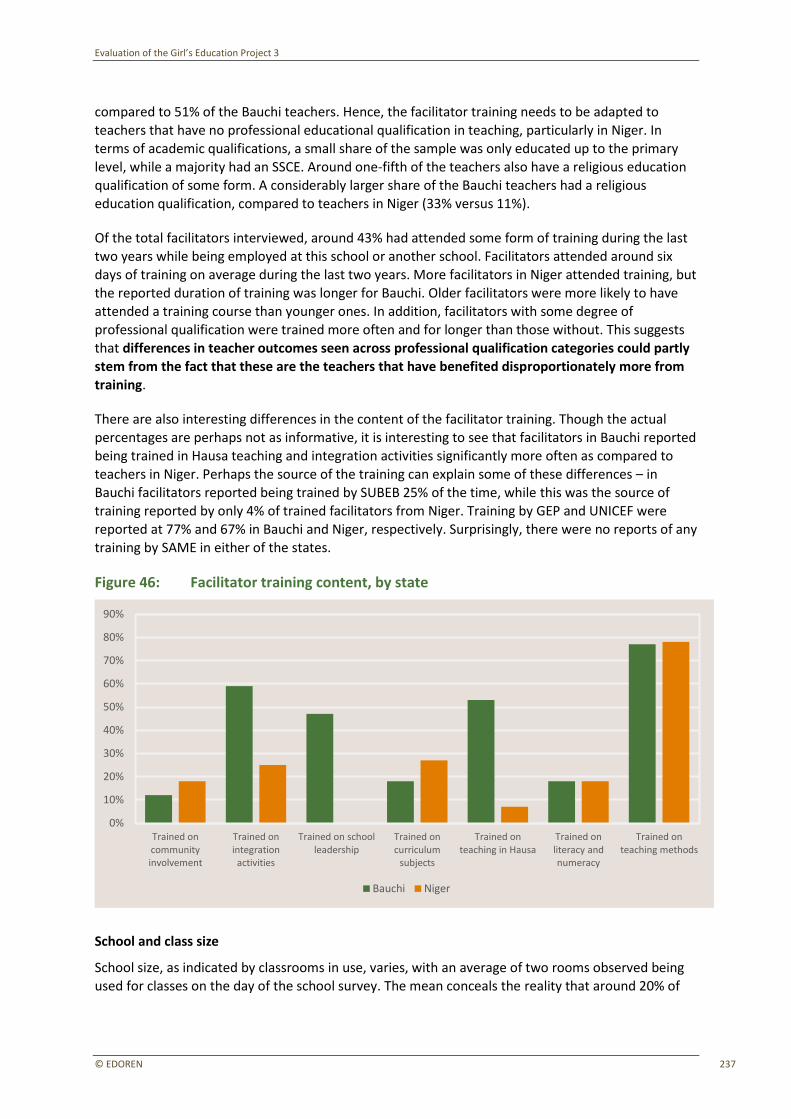
Evaluation of the Girl’s Education Project 3
© EDOREN 237
compared to 51% of the Bauchi teachers. Hence, the facilitator training needs to be adapted to
teachers that have no professional educational qualification in teaching, particularly in Niger. In terms of academic qualifications, a small share of the sample was only educated up to the primary level, while a majority had an SSCE. Around one-fifth of the teachers also have a religious education qualification of some form. A considerably larger share of the Bauchi teachers had a religious
education qualification, compared to teachers in Niger (33% versus 11%).
Of the total facilitators interviewed, around 43% had attended some form of training during the last two years while being employed at this school or another school. Facilitators attended around six days of training on average during the last two years. More facilitators in Niger attended training, but the reported duration of training was longer for Bauchi. Older facilitators were more likely to have
attended a training course than younger ones. In addition, facilitators with some degree of professional qualification were trained more often and for longer than those without. This suggests that differences in teacher outcomes seen across professional qualification categories could partly stem from the fact that these are the teachers that have benefited disproportionately more from
training.
There are also interesting differences in the content of the facilitator training. Though the actual
percentages are perhaps not as informative, it is interesting to see that facilitators in Bauchi reported being trained in Hausa teaching and integration activities significantly more often as compared to teachers in Niger. Perhaps the source of the training can explain some of these differences – in
Bauchi facilitators reported being trained by SUBEB 25% of the time, while this was the source of training reported by only 4% of trained facilitators from Niger. Training by GEP and UNICEF were
reported at 77% and 67% in Bauchi and Niger, respectively. Surprisingly, there were no reports of any training by SAME in either of the states.
Figure 46: Facilitator training content, by state
School and class size
School size, as indicated by classrooms in use, varies, with an average of two rooms observed being used for classes on the day of the school survey. The mean conceals the reality that around 20% of
Trained on community involvement
Trained on integration activities
Trained on school leadership
Trained on curriculum
subjects
Trained on teaching in Hausa
Trained on literacy and numeracy
Trained on teaching methods
0%
10%
20%
30%
40%
50%
60%
70%
80%
90%
Bauchi Niger
Evaluation of the Girl’s Education Project 3
© EDOREN 238
IQSs had no classroom structure. This fact is also supported by the qualitative research. An additional
30% of the schools had only one classroom.
Pupil enrolment data were collected in order to develop a narrative regarding the pupil–teacher ratio and the pupil–classroom ratio. A detailed analysis of these data is not possible since only a very small share (about 30%) of the IQSs had some sort of written enrolment record for the current school year.
This presented a major hindrance in the collection of reliable data on pupil numbers. Despite the limited data available on pupil enrolment, it is clear that the number of pupils studying integrated subjects in IQSs varies greatly. Figures range from as few as 20 to as many as 400 children in the school, with cross-state variation being as large as within-state variation. Of these, a majority of pupils were enrolled in the early grades, i.e. P1–P3 level. Although the gender ratio does not seem to
point towards a disproportionately higher number of boys in IQSs, a very limited sample size for enrolment data does not allow us to make stronger claims about the gender ratio in these schools, and its implications. Overall, the ratio of girls to boys suggests that IQSs do not have more boys than girls. This inference is supported by the (limited) data on pupil enrolment, and more so by the
manual counting of P2 pupils present on the day of the visit. Interestingly, the ratio of girls to boys was higher in Bauchi than in Niger, and in cases where the head teacher was the proprietor. Though this could partially be biased due to the schools’ knowledge of the survey and the focus of the
programme on getting girls into school, the differences are noteworthy. This also indicates the need to inculcate record-keeping practices in IQSs as part of school management practices.
The classroom observation data suggest a mean pupil–teacher ratio of 45 and a median of 40. The range is quite varied, from four to 183 children being taught by one teacher. A qualitative indication
of the finding that the pupil–teacher ratio is high in IQSs comes from the fact that 94% of sampled facilitators agreed with the statement ‘There are too many pupils in my classroom’. Hence it appears that facilitators in IQSs are teaching in varied and challenging contexts in the IQSS schools.
IQS integration
IQSs in the sample have been established for approximately 25 years on average, with Bauchi schools
having been established for almost twice as many years as schools in Niger. The schools have been integrated for 2.5 years on average, with schools in Bauchi having been integrated for about one year less than schools in Niger (two years versus three years, on average).
Integration, as measured by schools teaching the entire package of five core integrated subjects, is
found to be greater in schools in Niger than in Bauchi. In the latter, only 3% of the schools were teaching all five core integrated subjects, while in Niger, 20% of the schools were doing so. Schools in Niger were also spending more hours per week on teaching integrated subjects. In Bauchi, students studied non-religious subjects for 2.2 hours on average, while in Niger it was 3.8 hours – a significant difference and an indicator that schools in Niger are more deeply integrated. There is one outlier –
one school in the Niger sample reportedly provides 17 hours of integrated subject teaching per week (all other schools across both states had integrated subject teaching for 11 hours or less per week). By removing this outlier from the sample, the average for Niger falls to 3.3. Although lower, this still
supports the fact that schools in Niger are teaching more integrated subjects for a longer duration than schools in Bauchi.
It is not straightforward to assume that since Niger schools are spending more hours teaching integrated subjects they must be switching away from religious subjects. The chart below shows the
range of religious subjects taught in schools, by state. For all but one subject a larger share of schools in Niger were teaching each subject mentioned below.
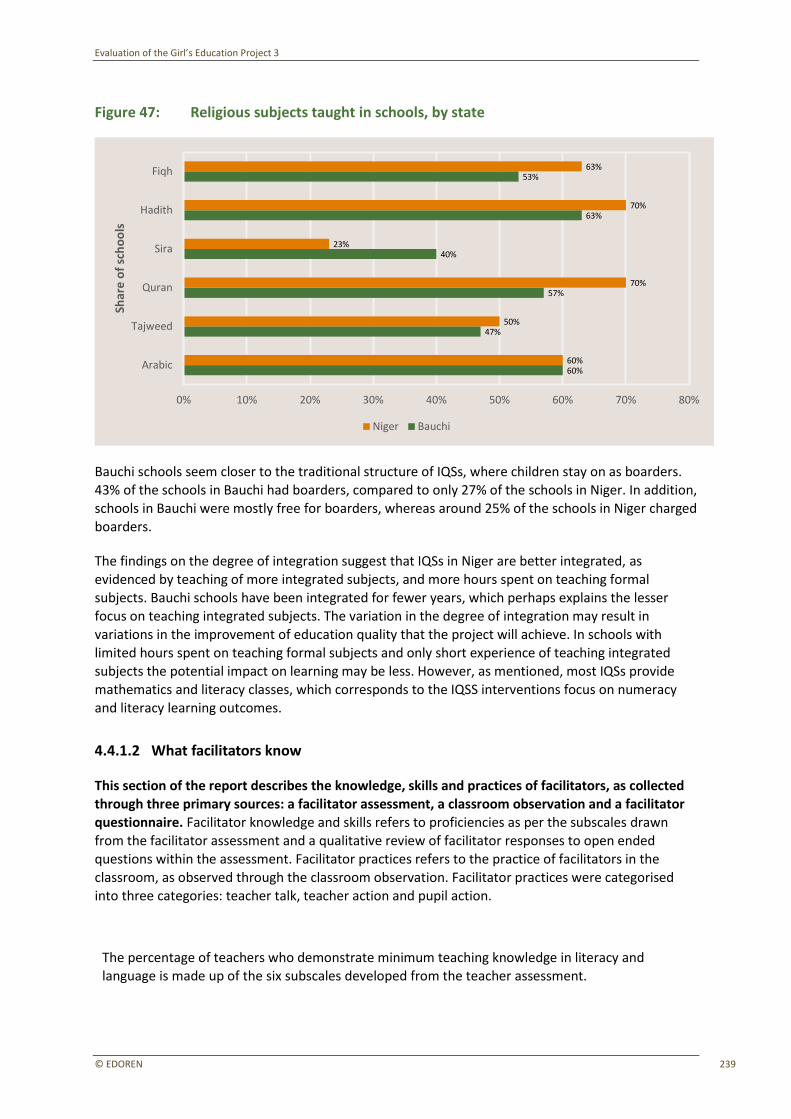
Evaluation of the Girl’s Education Project 3
© EDOREN 239
Figure 47: Religious subjects taught in schools, by state
Bauchi schools seem closer to the traditional structure of IQSs, where children stay on as boarders. 43% of the schools in Bauchi had boarders, compared to only 27% of the schools in Niger. In addition,
schools in Bauchi were mostly free for boarders, whereas around 25% of the schools in Niger charged boarders.
The findings on the degree of integration suggest that IQSs in Niger are better integrated, as
evidenced by teaching of more integrated subjects, and more hours spent on teaching formal subjects. Bauchi schools have been integrated for fewer years, which perhaps explains the lesser
focus on teaching integrated subjects. The variation in the degree of integration may result in
variations in the improvement of education quality that the project will achieve. In schools with
limited hours spent on teaching formal subjects and only short experience of teaching integrated subjects the potential impact on learning may be less. However, as mentioned, most IQSs provide
mathematics and literacy classes, which corresponds to the IQSS interventions focus on numeracy and literacy learning outcomes.
4.4.1.2 What facilitators know
This section of the report describes the knowledge, skills and practices of facilitators, as collected through three primary sources: a facilitator assessment, a classroom observation and a facilitator questionnaire. Facilitator knowledge and skills refers to proficiencies as per the subscales drawn from the facilitator assessment and a qualitative review of facilitator responses to open ended questions within the assessment. Facilitator practices refers to the practice of facilitators in the
classroom, as observed through the classroom observation. Facilitator practices were categorised into three categories: teacher talk, teacher action and pupil action.
Defining teacher competence
The percentage of teachers who demonstrate minimum teaching knowledge in literacy and language is made up of the six subscales developed from the teacher assessment.
60%
47%
57%
40%
63%
53%
60%
50%
70%
23%
70%
63%
Arabic
Tajweed
Quran
Sira
Hadith
Fiqh
0% 10% 20% 30% 40% 50% 60% 70% 80%
Shar
e o
f sc
ho
ols
Niger Bauchi
Evaluation of the Girl’s Education Project 3
© EDOREN 240
Thresholds were defined for each subscale to differentiate between teacher proficiency levels. Two cut-off points were defined for each scale, to create three proficiency levels per scale. The proficiency levels are: low band – no evidence of skill; middle band – evidence of rudimentary skill; and upper band – evidence of competence.
Facilitators’ knowledge and skills
The facilitator assessment was divided into three sections, collectively comprising 30 items, including multiple choice, short response and long response items.
• In section one facilitators were asked to mark pupil responses to Hausa literacy questions and to indicate the grade level at which the answer should be known by pupils, as defined by the
curriculum.
• In section two facilitators were asked to fill in missing information in order to prepare an answer sheet for a reading test aimed at Grade 2 pupils. Facilitators were provided with two newspaper
articles and asked to fill in missing information; this included answering basic comprehension questions and questions that required the interpretation of words and phrases.
• Section three asked facilitators to identify poor and good pupils’ work and to review pupils’ work
in order to make judgements about pupils’ writing, including the organisation of the writing, the
use of grammar, punctuation, spelling, the pupil’s ability to self-correct and reflect on their writing and the pupil’s ability to form letters and use spaces between words. Facilitators were then asked to describe how they might support the pupil in improving their writing.
As can be seen in Figure 48 the vast majority of facilitators did not display evidence of competence in the six domains covered by the facilitator assessments. None of the facilitators assessed were
able to show competence in evidencing judgements and diagnosing pupils’ work. Similarly, less than 1% had effective writing skills. Less than 3% of facilitators were found to be competent in identifying low performers, and in interpreting words and phrases. Rudimentary levels of skills were observed in
a very small proportion of the assessed facilitators in these four domains.
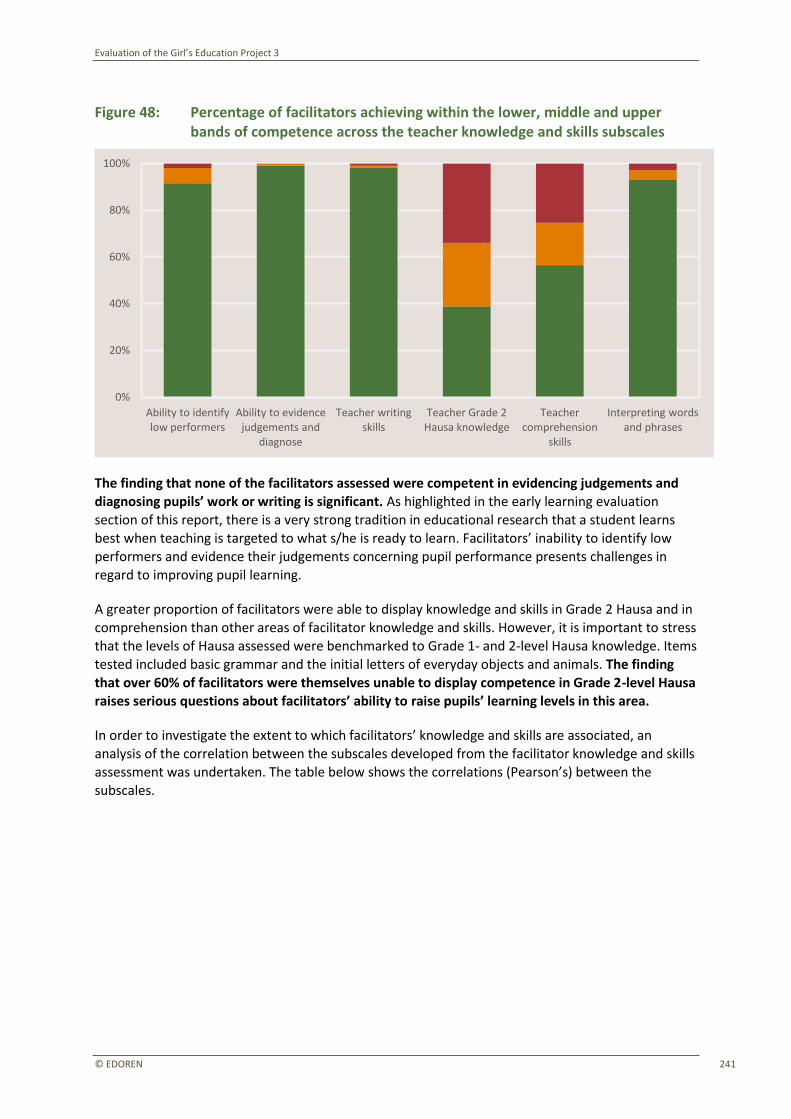
Evaluation of the Girl’s Education Project 3
© EDOREN 241
Figure 48: Percentage of facilitators achieving within the lower, middle and upper bands of competence across the teacher knowledge and skills subscales
The finding that none of the facilitators assessed were competent in evidencing judgements and
diagnosing pupils’ work or writing is significant. As highlighted in the early learning evaluation section of this report, there is a very strong tradition in educational research that a student learns
best when teaching is targeted to what s/he is ready to learn. Facilitators’ inability to identify low performers and evidence their judgements concerning pupil performance presents challenges in regard to improving pupil learning.
A greater proportion of facilitators were able to display knowledge and skills in Grade 2 Hausa and in
comprehension than other areas of facilitator knowledge and skills. However, it is important to stress that the levels of Hausa assessed were benchmarked to Grade 1- and 2-level Hausa knowledge. Items tested included basic grammar and the initial letters of everyday objects and animals. The finding
that over 60% of facilitators were themselves unable to display competence in Grade 2-level Hausa raises serious questions about facilitators’ ability to raise pupils’ learning levels in this area.
In order to investigate the extent to which facilitators’ knowledge and skills are associated, an
analysis of the correlation between the subscales developed from the facilitator knowledge and skills assessment was undertaken. The table below shows the correlations (Pearson’s) between the
subscales.
Ability to identify low performers
Ability to evidence judgements and
diagnose
Teacher writing skills
Teacher Grade 2 Hausa knowledge
Teacher comprehension
skills
Interpreting words and phrases
0%
20%
40%
60%
80%
100%
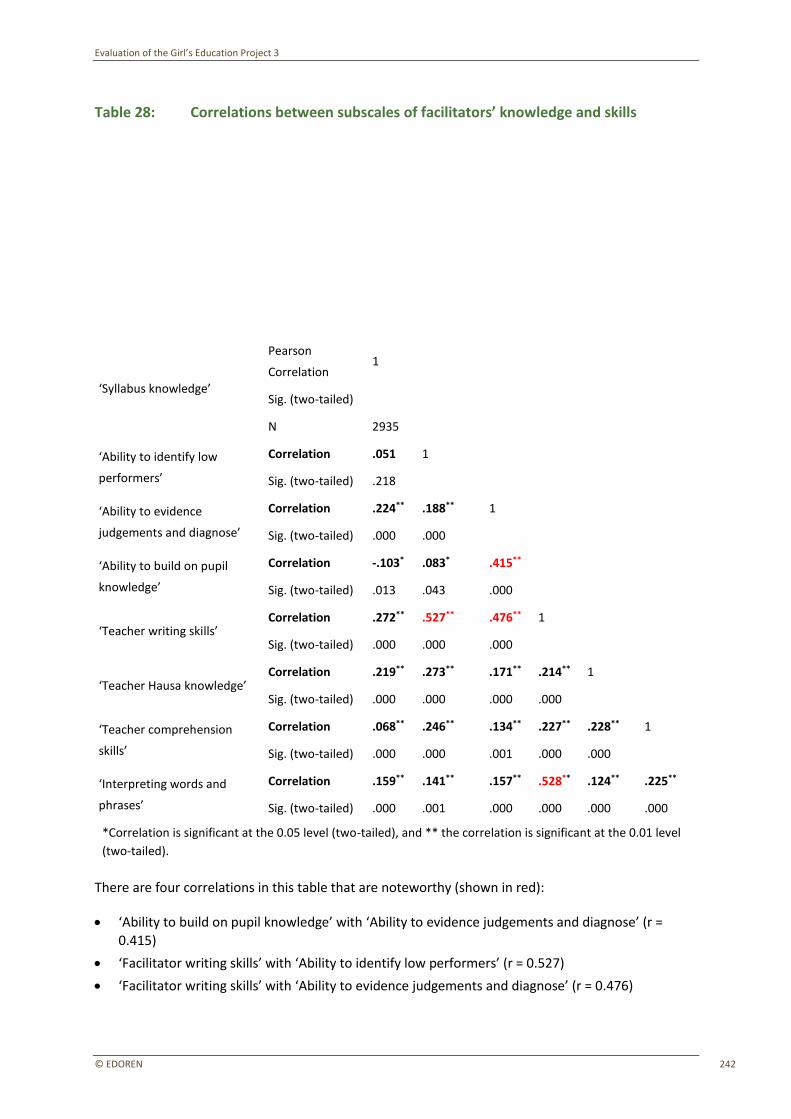
Evaluation of the Girl’s Education Project 3
© EDOREN 242
Table 28: Correlations between subscales of facilitators’ knowledge and skills
Sylla
bu
s kn
ow
led
ge
Ab
ility
to
iden
tify
low
per
form
ers
Ab
ility
to
evi
den
ce ju
dge
men
ts a
nd
dia
gno
se
Teac
he
r w
riti
ng
skill
s
Teac
he
r H
ausa
kn
ow
led
ge
Teac
he
r co
mp
reh
ensi
on
ski
lls
Inte
rpre
tin
g w
ord
s an
d p
hra
ses
‘Syllabus knowledge’
Pearson
Correlation 1
Sig. (two-tailed)
N 2935
‘Ability to identify low
performers’
Correlation .051 1
Sig. (two-tailed) .218
‘Ability to evidence
judgements and diagnose’
Correlation .224** .188** 1
Sig. (two-tailed) .000 .000
‘Ability to build on pupil
knowledge’
Correlation -.103* .083* .415**
Sig. (two-tailed) .013 .043 .000
‘Teacher writing skills’ Correlation .272** .527** .476** 1
Sig. (two-tailed) .000 .000 .000
‘Teacher Hausa knowledge’ Correlation .219** .273** .171** .214** 1
Sig. (two-tailed) .000 .000 .000 .000
‘Teacher comprehension
skills’
Correlation .068** .246** .134** .227** .228** 1
Sig. (two-tailed) .000 .000 .001 .000 .000
‘Interpreting words and
phrases’
Correlation .159** .141** .157** .528** .124** .225**
Sig. (two-tailed) .000 .001 .000 .000 .000 .000
*Correlation is significant at the 0.05 level (two-tailed), and ** the correlation is significant at the 0.01 level
(two-tailed).
There are four correlations in this table that are noteworthy (shown in red):
• ‘Ability to build on pupil knowledge’ with ‘Ability to evidence judgements and diagnose’ (r = 0.415)
• ‘Facilitator writing skills’ with ‘Ability to identify low performers’ (r = 0.527)
• ‘Facilitator writing skills’ with ‘Ability to evidence judgements and diagnose’ (r = 0.476)
Evaluation of the Girl’s Education Project 3
© EDOREN 243
• ‘Interpreting words and phrases’ with ‘Facilitator writing skills’ (r = 0.528)
These correlations suggest that facilitators’ writing skills in particular may be the key dimension influencing facilitators’ performance in the test. In other words, the literacy levels of the facilitators appear to be a key issue. If this level is low, it limits performance across a range of the areas
facilitators need to be competent in to improve pupil learning.
Overall, these findings starkly highlight that there are large gaps in facilitators’ knowledge and skills on all domains associated with effective teaching, including basic Hausa literacy. As noted in Section 3.4, effective and well-designed training programmes can fill any knowledge and skills gaps, including those in teachers’ own subject knowledge. The challenge for GEP3 will be to ensure that its facilitator
training intervention is designed and implemented in a manner that allows it to address these very large deficiencies in teachers’ competencies. There is also a need for the programme to be realistic about what can be achieved in the short timeframe covered by its pilot phase.
Qualitative review of facilitator responses
The facilitator knowledge and skills assessment included a qualitative review of facilitators’ responses to incorrect answers by pupils. An item within the facilitator knowledge and skills assessment provided a list of pupil names within a class, the gender of each child and the number of words each child could read per minute. Facilitators were asked to first describe the achievement of
girls and boys in the class, identify which pupils needed the most assistance and support, and provide ways in which a facilitator could support pupils to increase their ability to read and understand text.
Within the item, about half of the pupils scored zero and there was a small difference between boys’ and girls’ achievement, with boys scoring slightly better than girls. Facilitators were also provided with examples of pupils’ writing and asked to write what the facilitator should focus on to improve
the pupils’ handwriting.
The review found that facilitators generally perceived effort as the cause of low performance and
held that increasing pupil effort was the best response to low performance. IQSS Examples A and B provide examples of facilitator responses that focus on increasing effort and paying attention in
class, rather than displaying knowledge regarding the errors in the pupil’s work and how a facilitator might meaningfully improve the pupil’s writing. The focus on effort within this context is a likely
reflection of the low levels of competence amongst facilitators – the fact that they lack both the knowledge and skills to improve pupil learning leaves them with few explanations for low
performance.
IQSS Example A: Facilitator effort

Evaluation of the Girl’s Education Project 3
© EDOREN 244
Support for IQS Example B: Teacher effort
Responses also reflected development programme aims and objectives in shallow ways. Responses included statements about the importance of focusing on girls in the class, without any supporting
statements identifying low performers in the class or suggesting how girls (and boys) can be supported by the facilitator.
Some responses pointed to deeply ingrained gender biases, with perceptions that girls are naturally less suited to the demands of education than boys, or more suited to other roles within society (see IQSS Example C). In a number of examples, facilitators state that girls need more assistance because they have ‘a natural weakness’.
IQSS Example C: Girls’ education and gender roles
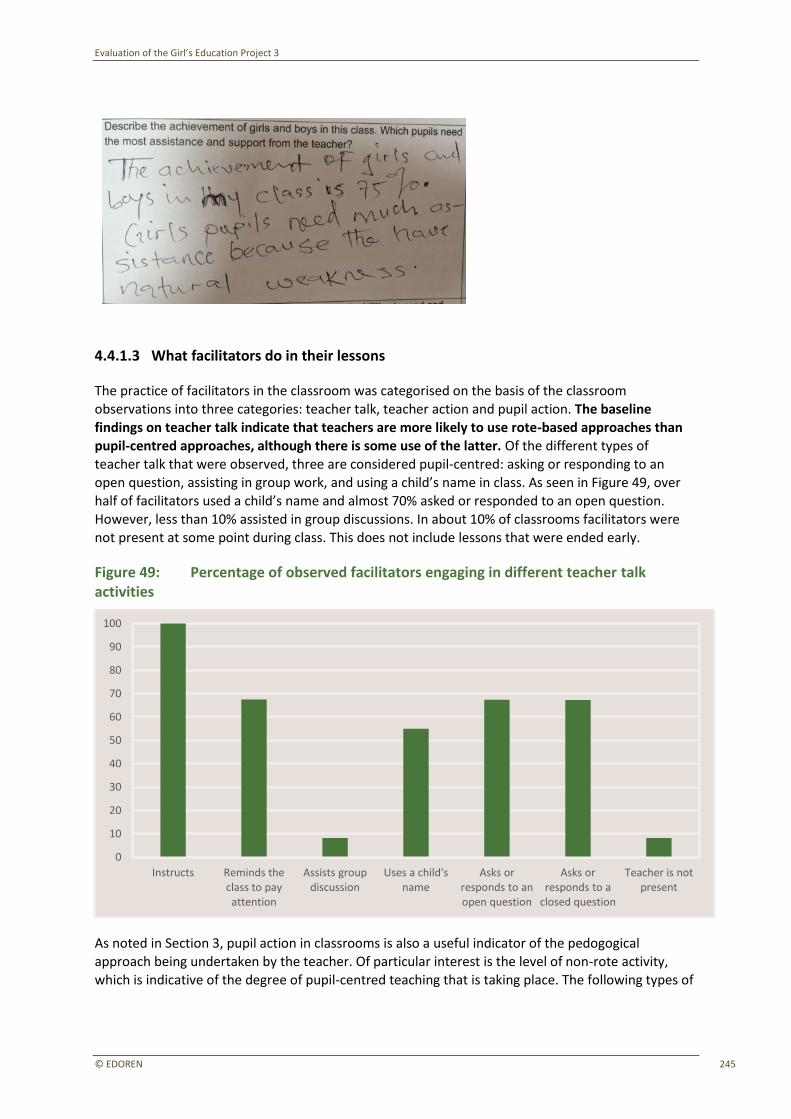
Evaluation of the Girl’s Education Project 3
© EDOREN 245
4.4.1.3 What facilitators do in their lessons
The practice of facilitators in the classroom was categorised on the basis of the classroom observations into three categories: teacher talk, teacher action and pupil action. The baseline findings on teacher talk indicate that teachers are more likely to use rote-based approaches than
pupil-centred approaches, although there is some use of the latter. Of the different types of teacher talk that were observed, three are considered pupil-centred: asking or responding to an
open question, assisting in group work, and using a child’s name in class. As seen in Figure 49, over half of facilitators used a child’s name and almost 70% asked or responded to an open question.
However, less than 10% assisted in group discussions. In about 10% of classrooms facilitators were not present at some point during class. This does not include lessons that were ended early.
Figure 49: Percentage of observed facilitators engaging in different teacher talk activities
As noted in Section 3, pupil action in classrooms is also a useful indicator of the pedogogical approach being undertaken by the teacher. Of particular interest is the level of non-rote activity, which is indicative of the degree of pupil-centred teaching that is taking place. The following types of
Instructs Reminds the class to pay
attention
Assists group discussion
Uses a child's name
Asks or responds to an open question
Asks or responds to a
closed question
Teacher is not present
0
10
20
30
40
50
60
70
80
90
100
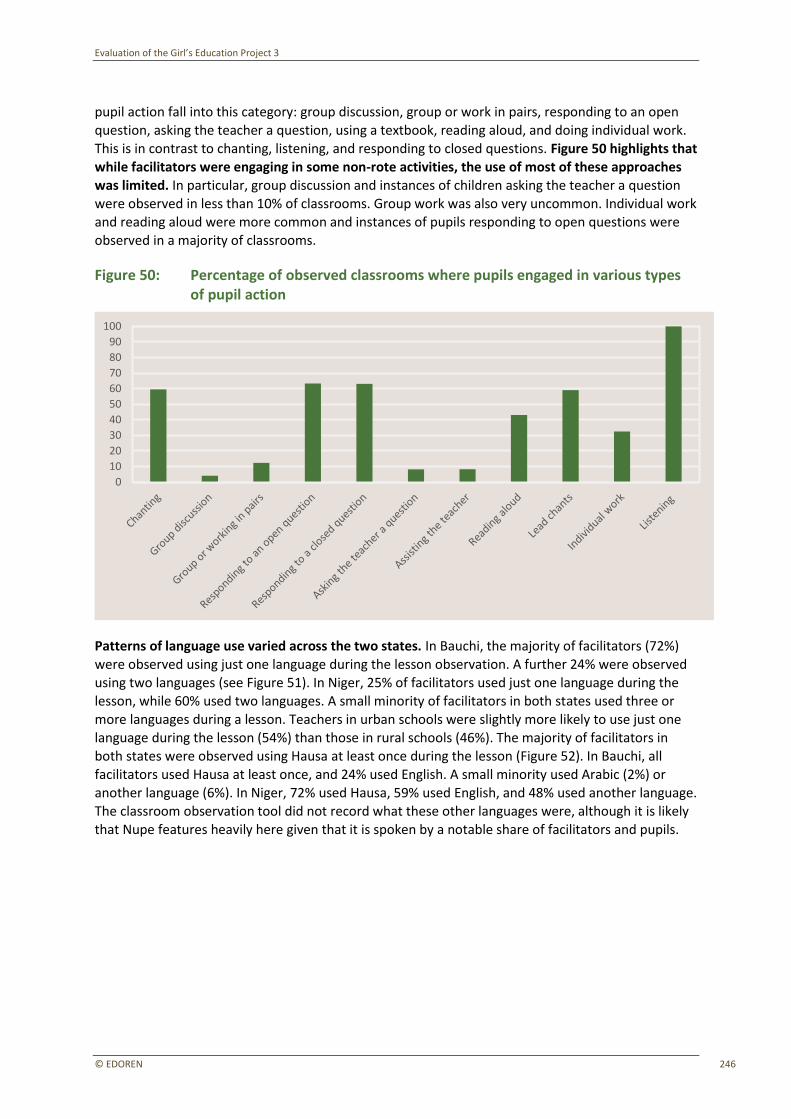
Evaluation of the Girl’s Education Project 3
© EDOREN 246
pupil action fall into this category: group discussion, group or work in pairs, responding to an open
question, asking the teacher a question, using a textbook, reading aloud, and doing individual work. This is in contrast to chanting, listening, and responding to closed questions. Figure 50 highlights that while facilitators were engaging in some non-rote activities, the use of most of these approaches was limited. In particular, group discussion and instances of children asking the teacher a question
were observed in less than 10% of classrooms. Group work was also very uncommon. Individual work and reading aloud were more common and instances of pupils responding to open questions were observed in a majority of classrooms.
Figure 50: Percentage of observed classrooms where pupils engaged in various types of pupil action
Patterns of language use varied across the two states. In Bauchi, the majority of facilitators (72%) were observed using just one language during the lesson observation. A further 24% were observed
using two languages (see Figure 51). In Niger, 25% of facilitators used just one language during the lesson, while 60% used two languages. A small minority of facilitators in both states used three or more languages during a lesson. Teachers in urban schools were slightly more likely to use just one
language during the lesson (54%) than those in rural schools (46%). The majority of facilitators in both states were observed using Hausa at least once during the lesson (Figure 52). In Bauchi, all
facilitators used Hausa at least once, and 24% used English. A small minority used Arabic (2%) or another language (6%). In Niger, 72% used Hausa, 59% used English, and 48% used another language. The classroom observation tool did not record what these other languages were, although it is likely
that Nupe features heavily here given that it is spoken by a notable share of facilitators and pupils.
0
10
20
30
40
50
60
70
80
90
100

Evaluation of the Girl’s Education Project 3
© EDOREN 247
Figure 51: Number of languages used by the facilitator during one lesson
Figure 52: Percentage of facilitators using Hausa, Arabic, English and other languages in class
4.4.1.4 Facilitators’ knowledge, skills and practices as per the ToC
As discussed in Section 3.2.9, teachers draw on three types of knowledge within classroom practice. The baseline data have been used to create composite indices for each of these knowledge types.
• Subject knowledge refers to knowing the essential questions of the subject, the networks of concepts, theoretical framework and methods of inquiry. This is measured through a composite
Teacher used one language during lesson
Teacher used two languages during lesson
Teacher used three languages during lesson
Teacher used four or more languages during lesson
0%
10%
20%
30%
40%
50%
60%
70%
80%
Bauchi Niger
Hausa Arabic English Other
0%
10%
20%
30%
40%
50%
60%
70%
80%
90%
100%
Bauchi Niger
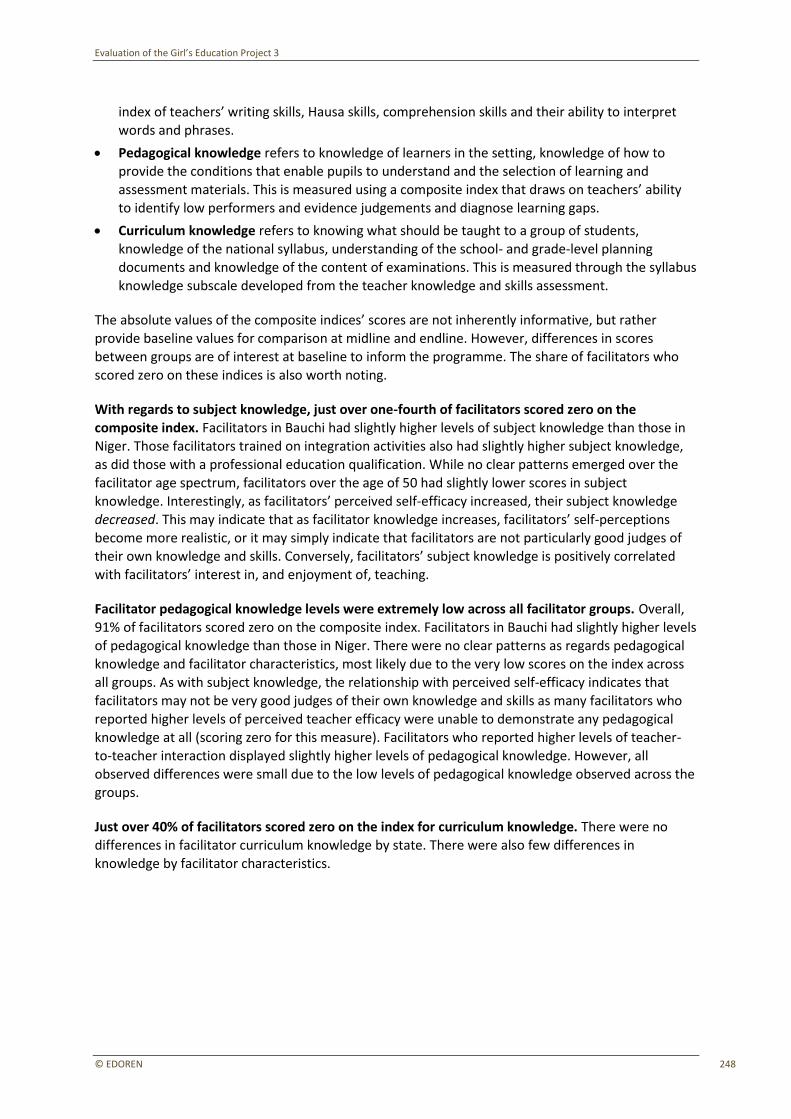
Evaluation of the Girl’s Education Project 3
© EDOREN 248
index of teachers’ writing skills, Hausa skills, comprehension skills and their ability to interpret
words and phrases.
• Pedagogical knowledge refers to knowledge of learners in the setting, knowledge of how to provide the conditions that enable pupils to understand and the selection of learning and
assessment materials. This is measured using a composite index that draws on teachers’ ability to identify low performers and evidence judgements and diagnose learning gaps.
• Curriculum knowledge refers to knowing what should be taught to a group of students, knowledge of the national syllabus, understanding of the school- and grade-level planning
documents and knowledge of the content of examinations. This is measured through the syllabus knowledge subscale developed from the teacher knowledge and skills assessment.
The absolute values of the composite indices’ scores are not inherently informative, but rather provide baseline values for comparison at midline and endline. However, differences in scores between groups are of interest at baseline to inform the programme. The share of facilitators who
scored zero on these indices is also worth noting.
With regards to subject knowledge, just over one-fourth of facilitators scored zero on the composite index. Facilitators in Bauchi had slightly higher levels of subject knowledge than those in
Niger. Those facilitators trained on integration activities also had slightly higher subject knowledge,
as did those with a professional education qualification. While no clear patterns emerged over the facilitator age spectrum, facilitators over the age of 50 had slightly lower scores in subject knowledge. Interestingly, as facilitators’ perceived self-efficacy increased, their subject knowledge
decreased. This may indicate that as facilitator knowledge increases, facilitators’ self-perceptions become more realistic, or it may simply indicate that facilitators are not particularly good judges of
their own knowledge and skills. Conversely, facilitators’ subject knowledge is positively correlated with facilitators’ interest in, and enjoyment of, teaching.
Facilitator pedagogical knowledge levels were extremely low across all facilitator groups. Overall,
91% of facilitators scored zero on the composite index. Facilitators in Bauchi had slightly higher levels
of pedagogical knowledge than those in Niger. There were no clear patterns as regards pedagogical knowledge and facilitator characteristics, most likely due to the very low scores on the index across
all groups. As with subject knowledge, the relationship with perceived self-efficacy indicates that facilitators may not be very good judges of their own knowledge and skills as many facilitators who reported higher levels of perceived teacher efficacy were unable to demonstrate any pedagogical
knowledge at all (scoring zero for this measure). Facilitators who reported higher levels of teacher-to-teacher interaction displayed slightly higher levels of pedagogical knowledge. However, all
observed differences were small due to the low levels of pedagogical knowledge observed across the groups.
Just over 40% of facilitators scored zero on the index for curriculum knowledge. There were no differences in facilitator curriculum knowledge by state. There were also few differences in knowledge by facilitator characteristics.
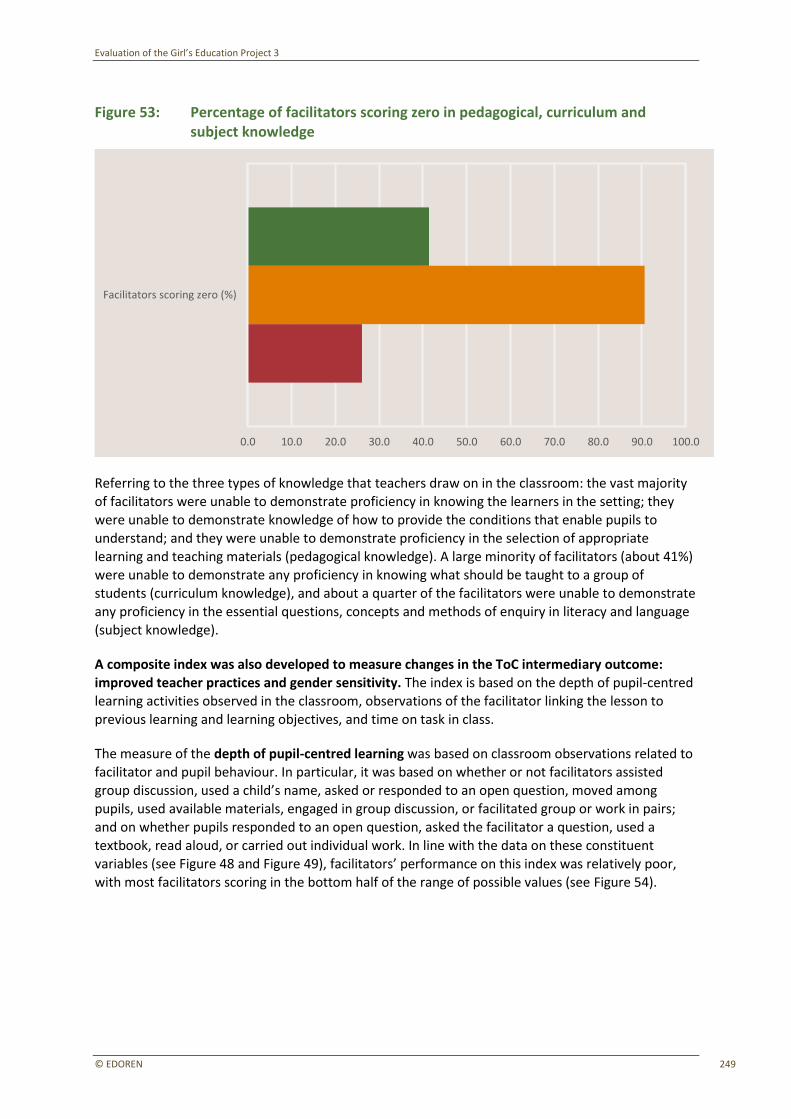
Evaluation of the Girl’s Education Project 3
© EDOREN 249
Figure 53: Percentage of facilitators scoring zero in pedagogical, curriculum and subject knowledge
Referring to the three types of knowledge that teachers draw on in the classroom: the vast majority
of facilitators were unable to demonstrate proficiency in knowing the learners in the setting; they were unable to demonstrate knowledge of how to provide the conditions that enable pupils to
understand; and they were unable to demonstrate proficiency in the selection of appropriate learning and teaching materials (pedagogical knowledge). A large minority of facilitators (about 41%) were unable to demonstrate any proficiency in knowing what should be taught to a group of
students (curriculum knowledge), and about a quarter of the facilitators were unable to demonstrate any proficiency in the essential questions, concepts and methods of enquiry in literacy and language
(subject knowledge).
A composite index was also developed to measure changes in the ToC intermediary outcome:
improved teacher practices and gender sensitivity. The index is based on the depth of pupil-centred learning activities observed in the classroom, observations of the facilitator linking the lesson to previous learning and learning objectives, and time on task in class.
The measure of the depth of pupil-centred learning was based on classroom observations related to facilitator and pupil behaviour. In particular, it was based on whether or not facilitators assisted
group discussion, used a child’s name, asked or responded to an open question, moved among pupils, used available materials, engaged in group discussion, or facilitated group or work in pairs; and on whether pupils responded to an open question, asked the facilitator a question, used a
textbook, read aloud, or carried out individual work. In line with the data on these constituent variables (see Figure 48 and Figure 49), facilitators’ performance on this index was relatively poor,
with most facilitators scoring in the bottom half of the range of possible values (see Figure 54).
Facilitators scoring zero (%)
0.0 10.0 20.0 30.0 40.0 50.0 60.0 70.0 80.0 90.0 100.0
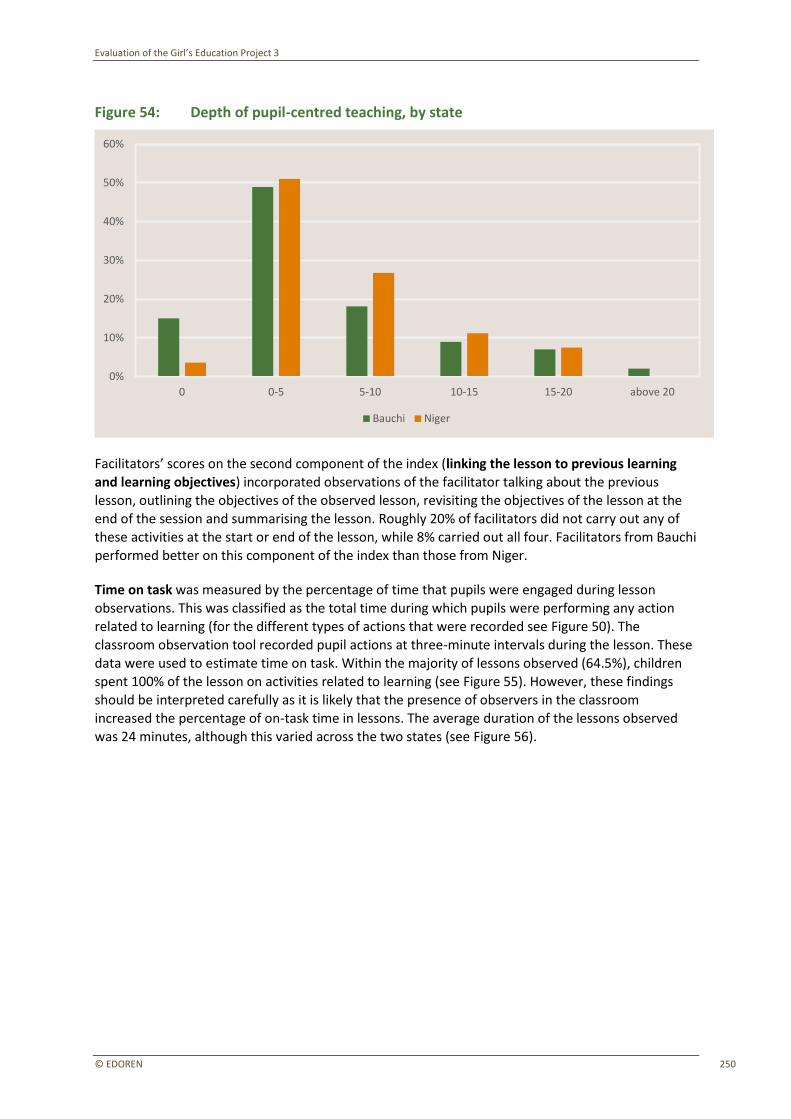
Evaluation of the Girl’s Education Project 3
© EDOREN 250
Figure 54: Depth of pupil-centred teaching, by state
Facilitators’ scores on the second component of the index (linking the lesson to previous learning and learning objectives) incorporated observations of the facilitator talking about the previous
lesson, outlining the objectives of the observed lesson, revisiting the objectives of the lesson at the end of the session and summarising the lesson. Roughly 20% of facilitators did not carry out any of these activities at the start or end of the lesson, while 8% carried out all four. Facilitators from Bauchi
performed better on this component of the index than those from Niger.
Time on task was measured by the percentage of time that pupils were engaged during lesson
observations. This was classified as the total time during which pupils were performing any action
related to learning (for the different types of actions that were recorded see Figure 50). The
classroom observation tool recorded pupil actions at three-minute intervals during the lesson. These data were used to estimate time on task. Within the majority of lessons observed (64.5%), children
spent 100% of the lesson on activities related to learning (see Figure 55). However, these findings should be interpreted carefully as it is likely that the presence of observers in the classroom
increased the percentage of on-task time in lessons. The average duration of the lessons observed was 24 minutes, although this varied across the two states (see Figure 56).
0 0-5 5-10 10-15 15-20 above 20
0%
10%
20%
30%
40%
50%
60%
Bauchi Niger
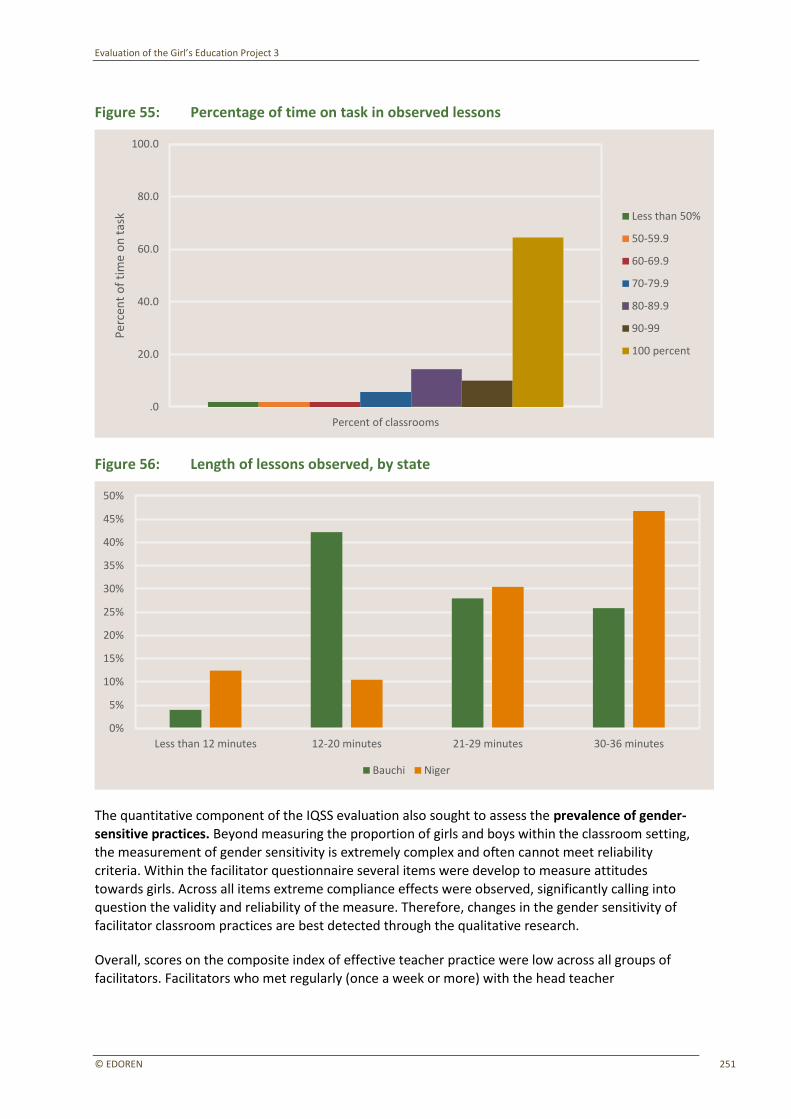
Evaluation of the Girl’s Education Project 3
© EDOREN 251
Figure 55: Percentage of time on task in observed lessons
Figure 56: Length of lessons observed, by state
The quantitative component of the IQSS evaluation also sought to assess the prevalence of gender-
sensitive practices. Beyond measuring the proportion of girls and boys within the classroom setting, the measurement of gender sensitivity is extremely complex and often cannot meet reliability criteria. Within the facilitator questionnaire several items were develop to measure attitudes
towards girls. Across all items extreme compliance effects were observed, significantly calling into question the validity and reliability of the measure. Therefore, changes in the gender sensitivity of facilitator classroom practices are best detected through the qualitative research.
Overall, scores on the composite index of effective teacher practice were low across all groups of
facilitators. Facilitators who met regularly (once a week or more) with the head teacher
Percent of classrooms
.0
20.0
40.0
60.0
80.0
100.0
Per
cen
t o
f ti
me
on
tas
k Less than 50%
50-59.9
60-69.9
70-79.9
80-89.9
90-99
100 percent
Less than 12 minutes 12-20 minutes 21-29 minutes 30-36 minutes
0%
5%
10%
15%
20%
25%
30%
35%
40%
45%
50%
Bauchi Niger
Evaluation of the Girl’s Education Project 3
© EDOREN 252
demonstrated lower levels of effective teacher practices than those who did not. Facilitators in
Bauchi demonstrated slightly higher levels of effective teacher practice than those in Niger. There were no clear patterns by facilitator characteristics, except that facilitators who were over 50 years old performed worse than their younger colleagues.
4.4.1.5 Facilitator motivation and attendance
Facilitator motivation was investigated through the use of a range of motivation scaled scores, which form a composite motivation index. The subscales cover the following areas:
• perceived teacher efficacy;
• interest in, and enjoyment of, teaching;
• effort put into, and perceived importance of, teaching;
• pressure and work-related tension; and
• teacher-to-teacher interaction.
A comparison of the different motivation subscales reveals that, on average, the surveyed facilitators score highest on effort and lowest on perceived teacher efficacy (Figure 57). Motivation subscales for interest in, and enjoyment of, teaching and effort put into, and perceived importance
of, teaching are quite high, whereas subscales measuring pressure and work-related tension and perceived efficacy appear quite low. This seems to suggest that facilitators consider their role to be
important and that they enjoy working as teachers. However, there seems to be an indication that the facilitators feel their ability to impact pupil outcomes is somewhat limited. It is also interesting to note that the teacher-to-teacher interaction score seems to indicate a relatively high level of
collaboration amongst facilitators. This could help strengthen the effects of facilitator-specific interventions at the school level. For example, if facilitators share their learning from training with
one another, the effect of facilitator training will be multiplied at that particular school. However, it
is worth noting that the teacher-to-teacher interaction here may imply interaction with teachers of
religious subjects as well, as we have already established that 25% of IQSs only have one facilitator.
The graph below presents a visual analysis of the differences across motivation subscales.
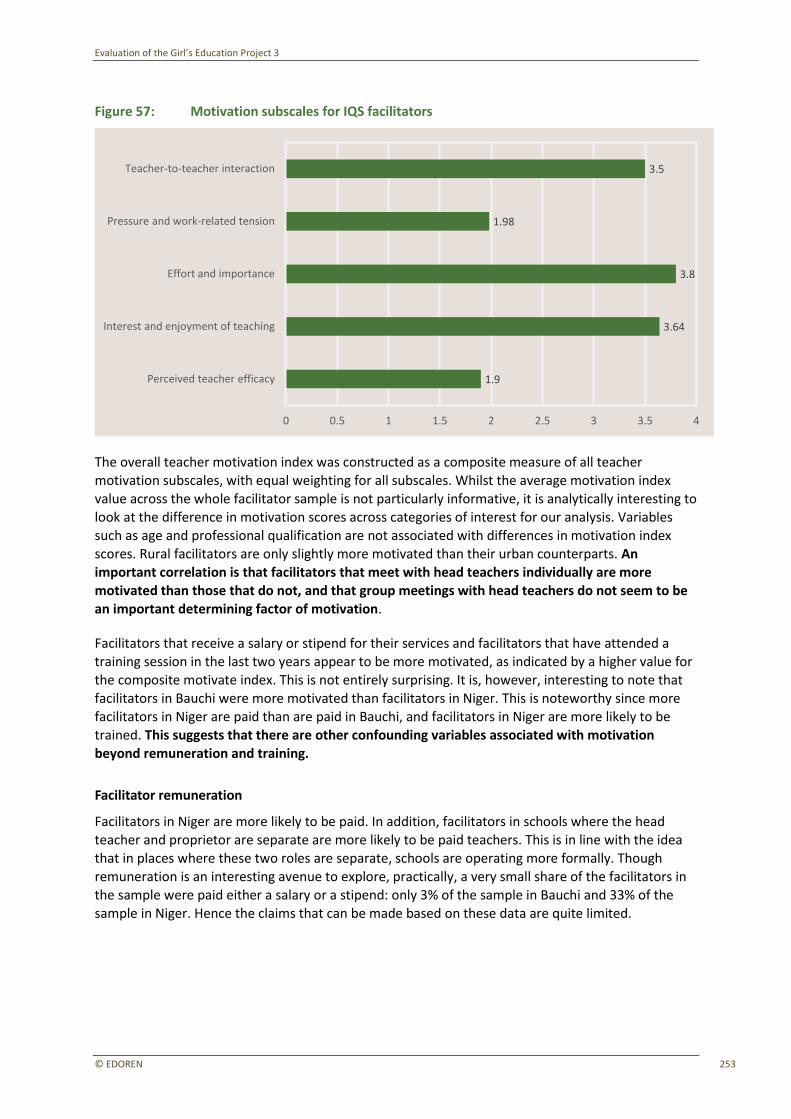
Evaluation of the Girl’s Education Project 3
© EDOREN 253
Figure 57: Motivation subscales for IQS facilitators
The overall teacher motivation index was constructed as a composite measure of all teacher
motivation subscales, with equal weighting for all subscales. Whilst the average motivation index value across the whole facilitator sample is not particularly informative, it is analytically interesting to look at the difference in motivation scores across categories of interest for our analysis. Variables
such as age and professional qualification are not associated with differences in motivation index scores. Rural facilitators are only slightly more motivated than their urban counterparts. An
important correlation is that facilitators that meet with head teachers individually are more motivated than those that do not, and that group meetings with head teachers do not seem to be an important determining factor of motivation.
Facilitators that receive a salary or stipend for their services and facilitators that have attended a
training session in the last two years appear to be more motivated, as indicated by a higher value for the composite motivate index. This is not entirely surprising. It is, however, interesting to note that
facilitators in Bauchi were more motivated than facilitators in Niger. This is noteworthy since more facilitators in Niger are paid than are paid in Bauchi, and facilitators in Niger are more likely to be trained. This suggests that there are other confounding variables associated with motivation
beyond remuneration and training.
Facilitator remuneration
Facilitators in Niger are more likely to be paid. In addition, facilitators in schools where the head teacher and proprietor are separate are more likely to be paid teachers. This is in line with the idea that in places where these two roles are separate, schools are operating more formally. Though
remuneration is an interesting avenue to explore, practically, a very small share of the facilitators in
the sample were paid either a salary or a stipend: only 3% of the sample in Bauchi and 33% of the sample in Niger. Hence the claims that can be made based on these data are quite limited.
1.9
3.64
3.8
1.98
3.5
Perceived teacher efficacy
Interest and enjoyment of teaching
Effort and importance
Pressure and work-related tension
Teacher-to-teacher interaction
0 0.5 1 1.5 2 2.5 3 3.5 4
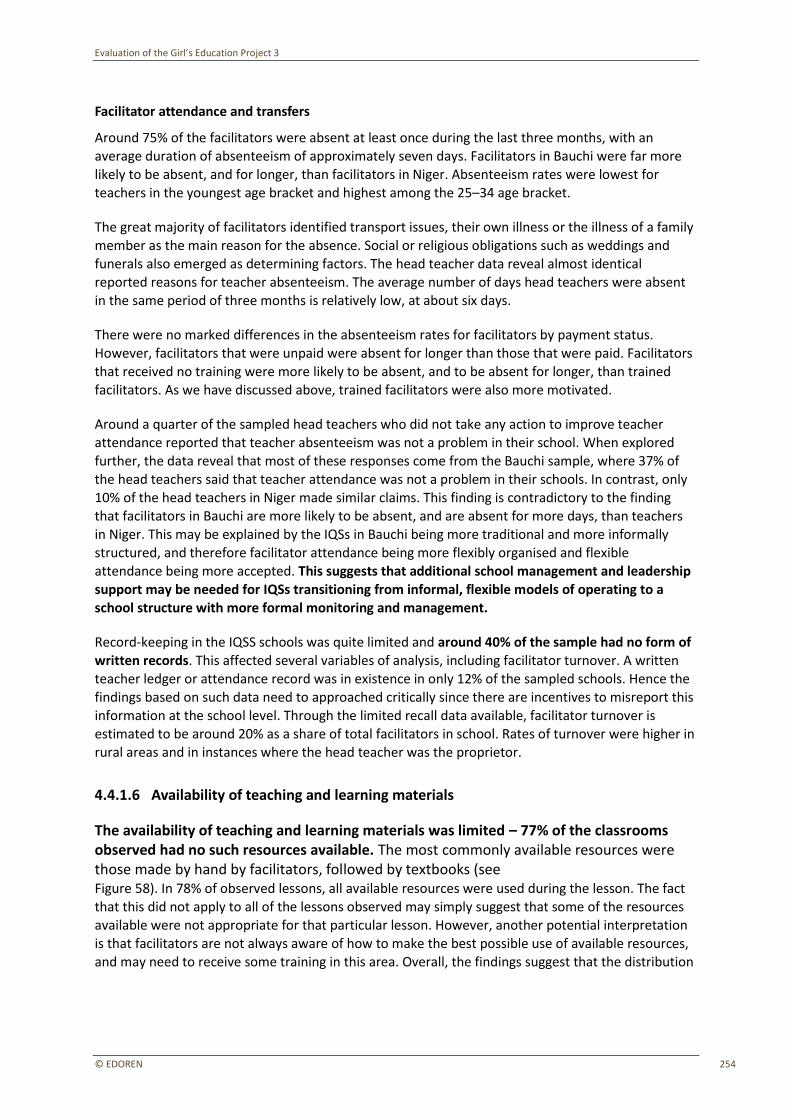
Evaluation of the Girl’s Education Project 3
© EDOREN 254
Facilitator attendance and transfers
Around 75% of the facilitators were absent at least once during the last three months, with an average duration of absenteeism of approximately seven days. Facilitators in Bauchi were far more likely to be absent, and for longer, than facilitators in Niger. Absenteeism rates were lowest for teachers in the youngest age bracket and highest among the 25–34 age bracket.
The great majority of facilitators identified transport issues, their own illness or the illness of a family
member as the main reason for the absence. Social or religious obligations such as weddings and funerals also emerged as determining factors. The head teacher data reveal almost identical reported reasons for teacher absenteeism. The average number of days head teachers were absent in the same period of three months is relatively low, at about six days.
There were no marked differences in the absenteeism rates for facilitators by payment status.
However, facilitators that were unpaid were absent for longer than those that were paid. Facilitators
that received no training were more likely to be absent, and to be absent for longer, than trained facilitators. As we have discussed above, trained facilitators were also more motivated.
Around a quarter of the sampled head teachers who did not take any action to improve teacher attendance reported that teacher absenteeism was not a problem in their school. When explored further, the data reveal that most of these responses come from the Bauchi sample, where 37% of
the head teachers said that teacher attendance was not a problem in their schools. In contrast, only 10% of the head teachers in Niger made similar claims. This finding is contradictory to the finding that facilitators in Bauchi are more likely to be absent, and are absent for more days, than teachers
in Niger. This may be explained by the IQSs in Bauchi being more traditional and more informally structured, and therefore facilitator attendance being more flexibly organised and flexible
attendance being more accepted. This suggests that additional school management and leadership support may be needed for IQSs transitioning from informal, flexible models of operating to a school structure with more formal monitoring and management.
Record-keeping in the IQSS schools was quite limited and around 40% of the sample had no form of
written records. This affected several variables of analysis, including facilitator turnover. A written teacher ledger or attendance record was in existence in only 12% of the sampled schools. Hence the findings based on such data need to approached critically since there are incentives to misreport this information at the school level. Through the limited recall data available, facilitator turnover is
estimated to be around 20% as a share of total facilitators in school. Rates of turnover were higher in rural areas and in instances where the head teacher was the proprietor.
4.4.1.6 Availability of teaching and learning materials
The availability of teaching and learning materials was limited – 77% of the classrooms observed had no such resources available. The most commonly available resources were those made by hand by facilitators, followed by textbooks (see Figure 58). In 78% of observed lessons, all available resources were used during the lesson. The fact
that this did not apply to all of the lessons observed may simply suggest that some of the resources available were not appropriate for that particular lesson. However, another potential interpretation is that facilitators are not always aware of how to make the best possible use of available resources, and may need to receive some training in this area. Overall, the findings suggest that the distribution
Evaluation of the Girl’s Education Project 3
© EDOREN 255
of teaching and learning resources could fill an important gap, provided that these are carefully
tailored to prevailing levels of knowledge and skills amongst facilitators and pupils.
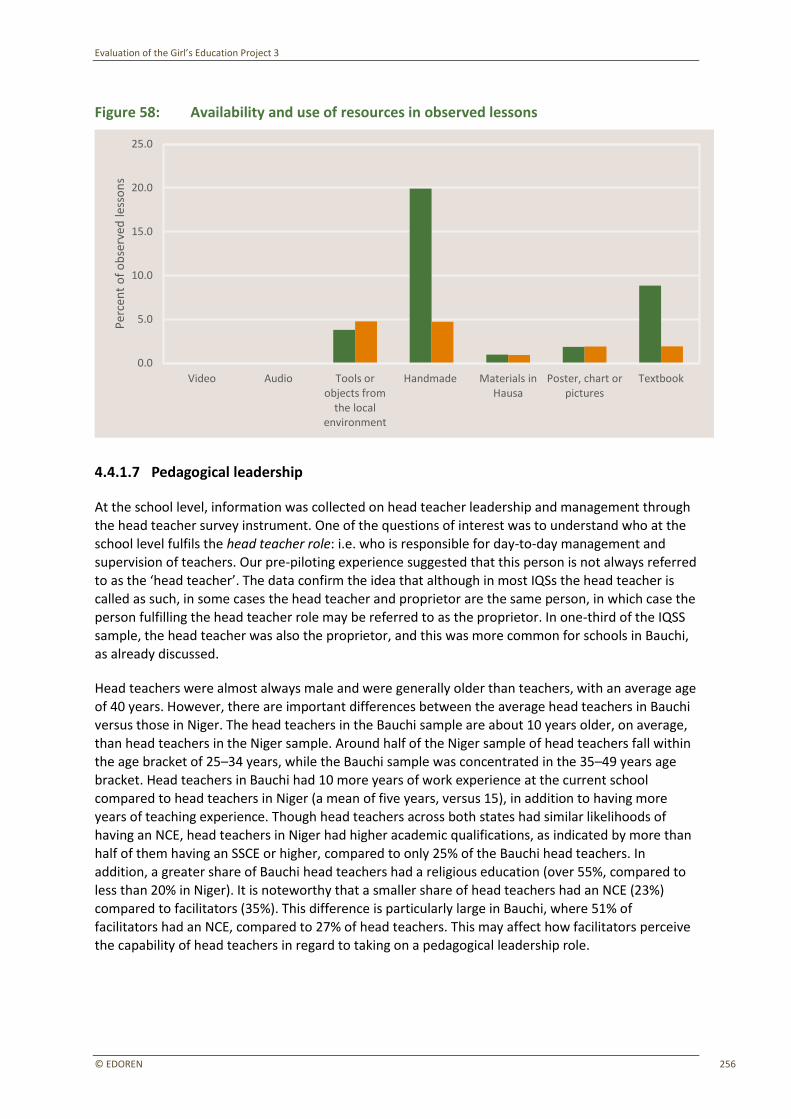
Evaluation of the Girl’s Education Project 3
© EDOREN 256
Figure 58: Availability and use of resources in observed lessons
4.4.1.7 Pedagogical leadership
At the school level, information was collected on head teacher leadership and management through
the head teacher survey instrument. One of the questions of interest was to understand who at the school level fulfils the head teacher role: i.e. who is responsible for day-to-day management and
supervision of teachers. Our pre-piloting experience suggested that this person is not always referred to as the ‘head teacher’. The data confirm the idea that although in most IQSs the head teacher is called as such, in some cases the head teacher and proprietor are the same person, in which case the
person fulfilling the head teacher role may be referred to as the proprietor. In one-third of the IQSS
sample, the head teacher was also the proprietor, and this was more common for schools in Bauchi, as already discussed.
Head teachers were almost always male and were generally older than teachers, with an average age
of 40 years. However, there are important differences between the average head teachers in Bauchi versus those in Niger. The head teachers in the Bauchi sample are about 10 years older, on average, than head teachers in the Niger sample. Around half of the Niger sample of head teachers fall within
the age bracket of 25–34 years, while the Bauchi sample was concentrated in the 35–49 years age bracket. Head teachers in Bauchi had 10 more years of work experience at the current school compared to head teachers in Niger (a mean of five years, versus 15), in addition to having more years of teaching experience. Though head teachers across both states had similar likelihoods of having an NCE, head teachers in Niger had higher academic qualifications, as indicated by more than
half of them having an SSCE or higher, compared to only 25% of the Bauchi head teachers. In
addition, a greater share of Bauchi head teachers had a religious education (over 55%, compared to
less than 20% in Niger). It is noteworthy that a smaller share of head teachers had an NCE (23%) compared to facilitators (35%). This difference is particularly large in Bauchi, where 51% of
facilitators had an NCE, compared to 27% of head teachers. This may affect how facilitators perceive the capability of head teachers in regard to taking on a pedagogical leadership role.
Video Audio Tools or objects from
the local environment
Handmade Materials in Hausa
Poster, chart or pictures
Textbook
0.0
5.0
10.0
15.0
20.0
25.0
Per
cen
t o
f o
bse
rved
less
on
s
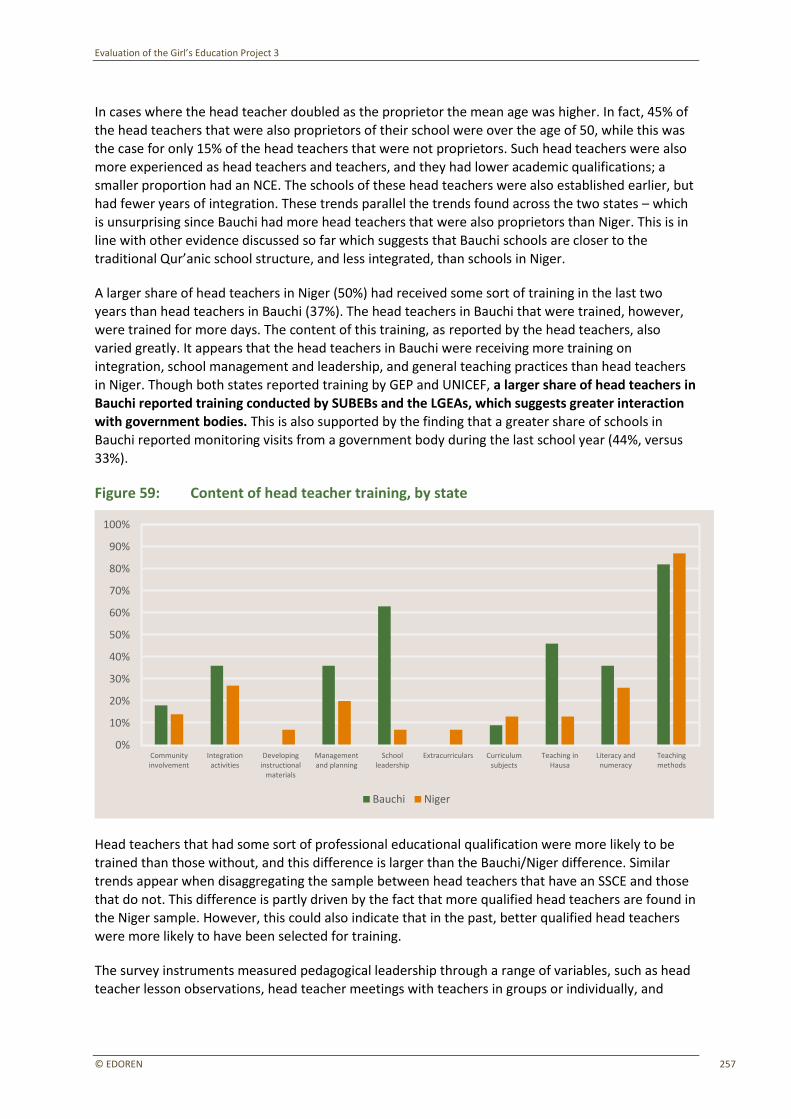
Evaluation of the Girl’s Education Project 3
© EDOREN 257
In cases where the head teacher doubled as the proprietor the mean age was higher. In fact, 45% of
the head teachers that were also proprietors of their school were over the age of 50, while this was the case for only 15% of the head teachers that were not proprietors. Such head teachers were also more experienced as head teachers and teachers, and they had lower academic qualifications; a smaller proportion had an NCE. The schools of these head teachers were also established earlier, but
had fewer years of integration. These trends parallel the trends found across the two states – which is unsurprising since Bauchi had more head teachers that were also proprietors than Niger. This is in line with other evidence discussed so far which suggests that Bauchi schools are closer to the traditional Qur’anic school structure, and less integrated, than schools in Niger.
A larger share of head teachers in Niger (50%) had received some sort of training in the last two
years than head teachers in Bauchi (37%). The head teachers in Bauchi that were trained, however, were trained for more days. The content of this training, as reported by the head teachers, also varied greatly. It appears that the head teachers in Bauchi were receiving more training on integration, school management and leadership, and general teaching practices than head teachers
in Niger. Though both states reported training by GEP and UNICEF, a larger share of head teachers in Bauchi reported training conducted by SUBEBs and the LGEAs, which suggests greater interaction with government bodies. This is also supported by the finding that a greater share of schools in
Bauchi reported monitoring visits from a government body during the last school year (44%, versus 33%).
Figure 59: Content of head teacher training, by state
Head teachers that had some sort of professional educational qualification were more likely to be trained than those without, and this difference is larger than the Bauchi/Niger difference. Similar
trends appear when disaggregating the sample between head teachers that have an SSCE and those that do not. This difference is partly driven by the fact that more qualified head teachers are found in the Niger sample. However, this could also indicate that in the past, better qualified head teachers were more likely to have been selected for training.
The survey instruments measured pedagogical leadership through a range of variables, such as head teacher lesson observations, head teacher meetings with teachers in groups or individually, and
Community involvement
Integration activities
Developing instructional
materials
Management and planning
School leadership
Extracurriculars Curriculum subjects
Teaching in Hausa
Literacy and numeracy
Teaching methods
0%
10%
20%
30%
40%
50%
60%
70%
80%
90%
100%
Bauchi Niger
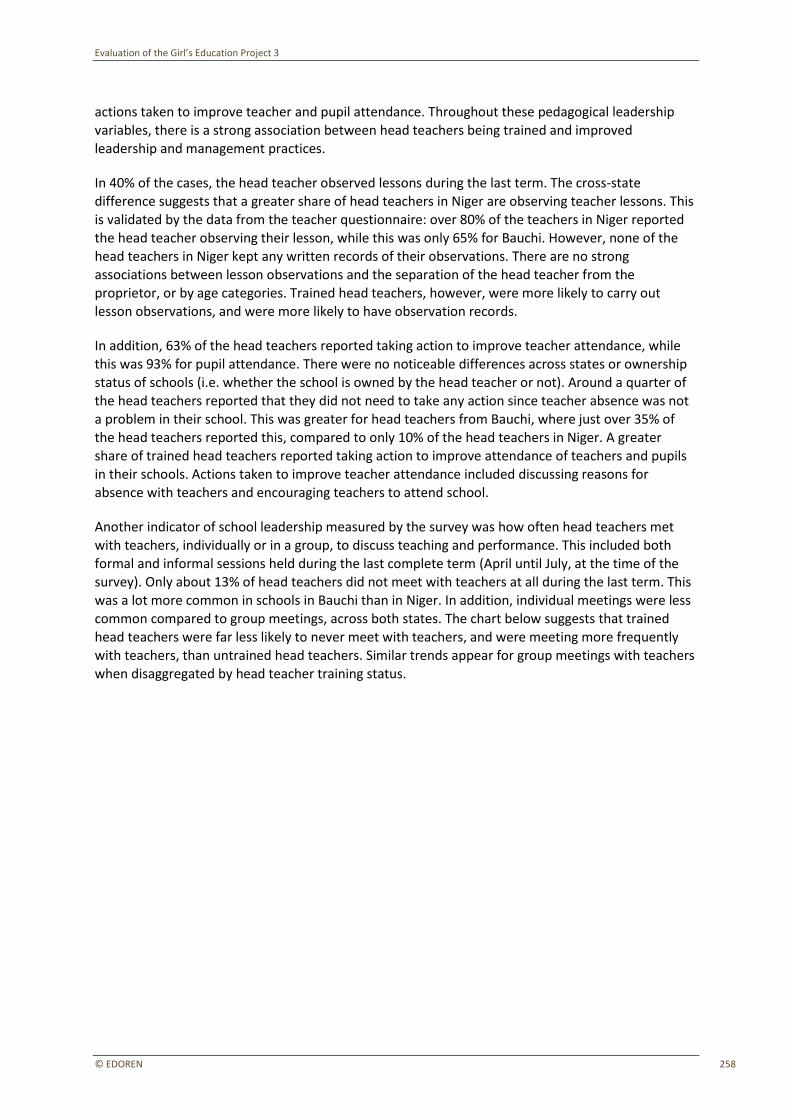
Evaluation of the Girl’s Education Project 3
© EDOREN 258
actions taken to improve teacher and pupil attendance. Throughout these pedagogical leadership
variables, there is a strong association between head teachers being trained and improved leadership and management practices.
In 40% of the cases, the head teacher observed lessons during the last term. The cross-state difference suggests that a greater share of head teachers in Niger are observing teacher lessons. This
is validated by the data from the teacher questionnaire: over 80% of the teachers in Niger reported the head teacher observing their lesson, while this was only 65% for Bauchi. However, none of the head teachers in Niger kept any written records of their observations. There are no strong associations between lesson observations and the separation of the head teacher from the proprietor, or by age categories. Trained head teachers, however, were more likely to carry out
lesson observations, and were more likely to have observation records.
In addition, 63% of the head teachers reported taking action to improve teacher attendance, while this was 93% for pupil attendance. There were no noticeable differences across states or ownership
status of schools (i.e. whether the school is owned by the head teacher or not). Around a quarter of the head teachers reported that they did not need to take any action since teacher absence was not a problem in their school. This was greater for head teachers from Bauchi, where just over 35% of
the head teachers reported this, compared to only 10% of the head teachers in Niger. A greater share of trained head teachers reported taking action to improve attendance of teachers and pupils in their schools. Actions taken to improve teacher attendance included discussing reasons for
absence with teachers and encouraging teachers to attend school.
Another indicator of school leadership measured by the survey was how often head teachers met
with teachers, individually or in a group, to discuss teaching and performance. This included both formal and informal sessions held during the last complete term (April until July, at the time of the survey). Only about 13% of head teachers did not meet with teachers at all during the last term. This
was a lot more common in schools in Bauchi than in Niger. In addition, individual meetings were less common compared to group meetings, across both states. The chart below suggests that trained
head teachers were far less likely to never meet with teachers, and were meeting more frequently with teachers, than untrained head teachers. Similar trends appear for group meetings with teachers
when disaggregated by head teacher training status.
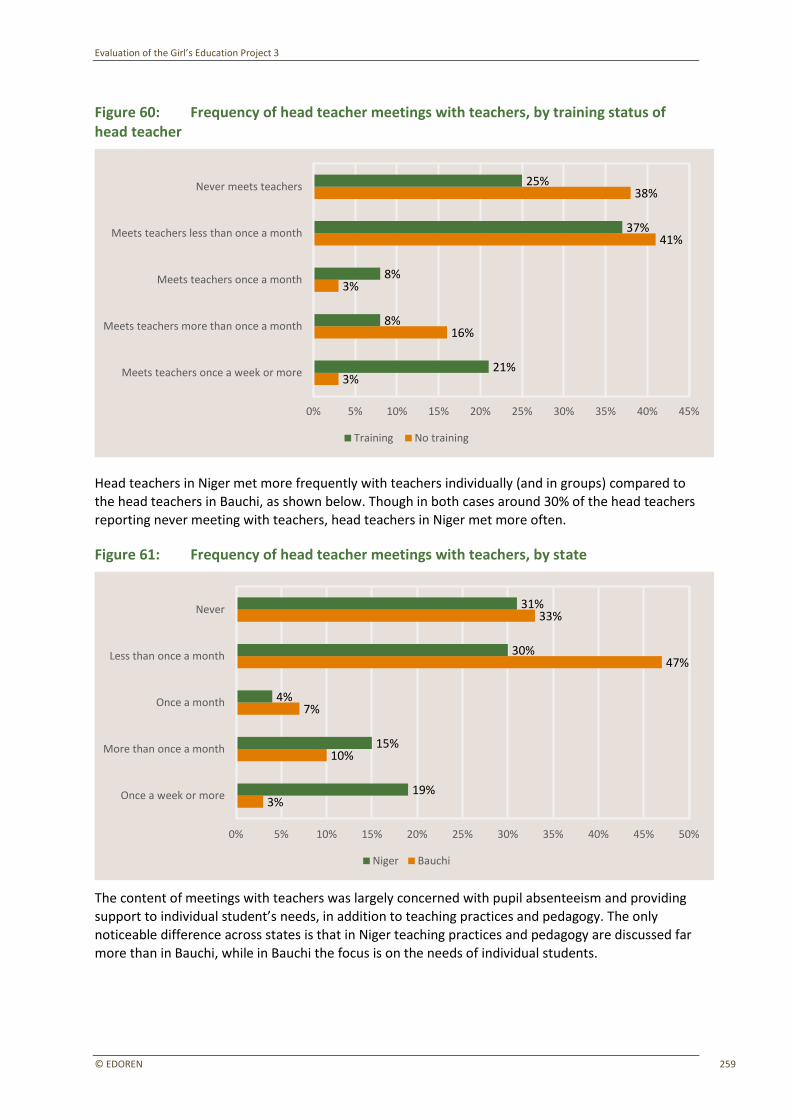
Evaluation of the Girl’s Education Project 3
© EDOREN 259
Figure 60: Frequency of head teacher meetings with teachers, by training status of head teacher
Head teachers in Niger met more frequently with teachers individually (and in groups) compared to
the head teachers in Bauchi, as shown below. Though in both cases around 30% of the head teachers reporting never meeting with teachers, head teachers in Niger met more often.
Figure 61: Frequency of head teacher meetings with teachers, by state
The content of meetings with teachers was largely concerned with pupil absenteeism and providing support to individual student’s needs, in addition to teaching practices and pedagogy. The only
noticeable difference across states is that in Niger teaching practices and pedagogy are discussed far more than in Bauchi, while in Bauchi the focus is on the needs of individual students.
3%
16%
3%
41%
38%
21%
8%
8%
37%
25%
Meets teachers once a week or more
Meets teachers more than once a month
Meets teachers once a month
Meets teachers less than once a month
Never meets teachers
0% 5% 10% 15% 20% 25% 30% 35% 40% 45%
Training No training
3%
10%
7%
47%
33%
19%
15%
4%
30%
31%
Once a week or more
More than once a month
Once a month
Less than once a month
Never
0% 5% 10% 15% 20% 25% 30% 35% 40% 45% 50%
Niger Bauchi
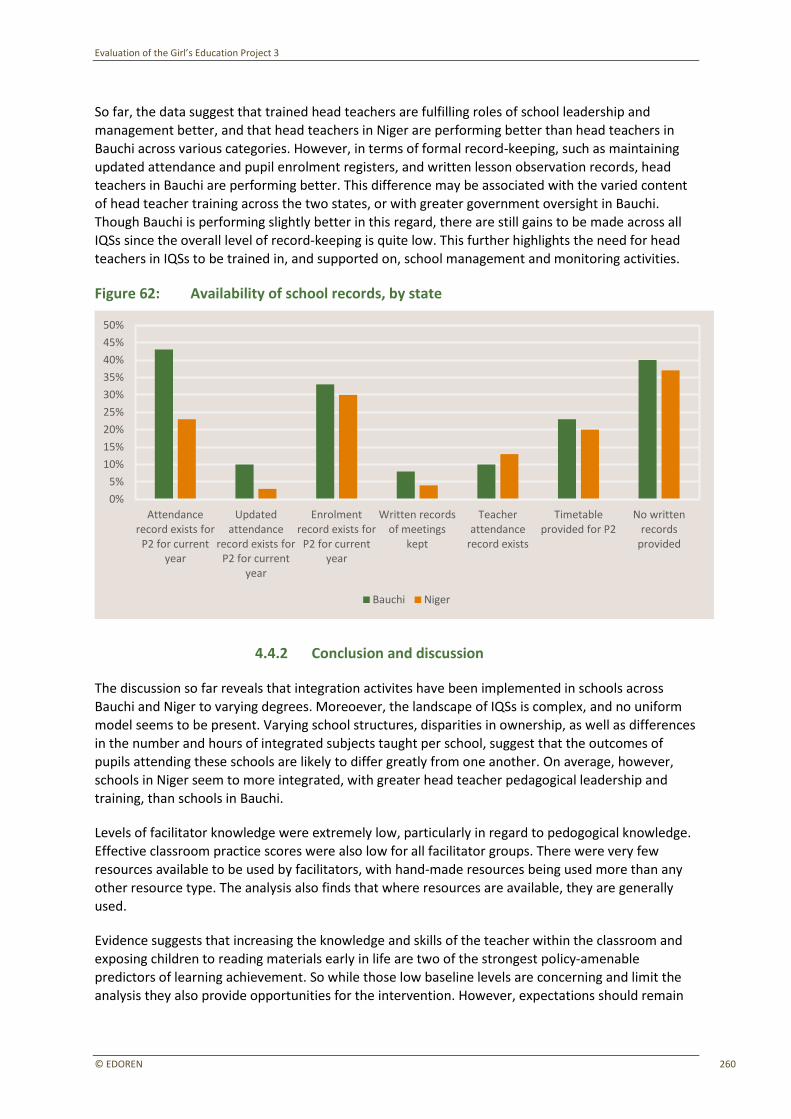
Evaluation of the Girl’s Education Project 3
© EDOREN 260
So far, the data suggest that trained head teachers are fulfilling roles of school leadership and
management better, and that head teachers in Niger are performing better than head teachers in Bauchi across various categories. However, in terms of formal record-keeping, such as maintaining updated attendance and pupil enrolment registers, and written lesson observation records, head teachers in Bauchi are performing better. This difference may be associated with the varied content
of head teacher training across the two states, or with greater government oversight in Bauchi. Though Bauchi is performing slightly better in this regard, there are still gains to be made across all IQSs since the overall level of record-keeping is quite low. This further highlights the need for head teachers in IQSs to be trained in, and supported on, school management and monitoring activities.
Figure 62: Availability of school records, by state
4.4.2 Conclusion and discussion
The discussion so far reveals that integration activites have been implemented in schools across
Bauchi and Niger to varying degrees. Moreoever, the landscape of IQSs is complex, and no uniform model seems to be present. Varying school structures, disparities in ownership, as well as differences in the number and hours of integrated subjects taught per school, suggest that the outcomes of
pupils attending these schools are likely to differ greatly from one another. On average, however, schools in Niger seem to more integrated, with greater head teacher pedagogical leadership and training, than schools in Bauchi.
Levels of facilitator knowledge were extremely low, particularly in regard to pedogogical knowledge. Effective classroom practice scores were also low for all facilitator groups. There were very few
resources available to be used by facilitators, with hand-made resources being used more than any
other resource type. The analysis also finds that where resources are available, they are generally
used.
Evidence suggests that increasing the knowledge and skills of the teacher within the classroom and
exposing children to reading materials early in life are two of the strongest policy-amenable predictors of learning achievement. So while those low baseline levels are concerning and limit the analysis they also provide opportunities for the intervention. However, expectations should remain
Attendance record exists for
P2 for current year
Updated attendance
record exists for P2 for current
year
Enrolment record exists for
P2 for current year
Written records of meetings
kept
Teacher attendance
record exists
Timetable provided for P2
No written records
provided
0%
5%
10%
15%
20%
25%
30%
35%
40%
45%
50%
Bauchi Niger
Evaluation of the Girl’s Education Project 3
© EDOREN 261
realistic as there are also significant barriers to substantially raising the knowledge and skills of
facilitators at scale, as very low levels of knowledge and skills are observed at baseline.
4.4.3 Qualitative case study analysis
To assess Contribution Claim 1, ‘GEP3’s IQSS contributes to more effective teaching of the integrated curriculum in IQSs’, the qualitative study aimed to explore the question ‘will facilitator training and mentoring, access to fit-for-purpose teaching and learning materials, and improved head teacher pedagogical leadership and support lead to more effective, gender-sensitive teaching of the
integrated curriculum?”
The sections below discuss the qualitative findings at baseline relating to the causal package that contributes to effective teaching of formal subjects. The analysis draws on data from three schools in Bauchi State (lower performing, typical, higher performing) and three schools in Niger state (lower
performing, typical, higher performing).
4.4.3.1 Perceived benefits and challenges of the integrated curriculum
A key assumption behind contribution claim 1 - that facilitator training and mentoring, access to fit-for-purpose teaching and learning materials, and improved head teacher pedagogical leadership and support will lead to more effective teaching of formal subjects - is that IQS stakeholders (proprietors,
teachers, parents, pupils and other community members) will be supportive of the introduction of the integrated curriculum in the Qur’anic school. This will depend on the benefits and challenges that
the stakeholders perceive in regard to integration. If stakeholders do not accept integration, this could pose a barrier in regard to trained facilitators turning their improved knowledge and skills into improved practices.
The six schools sampled for the qualitative study operate in diverse contexts. As a result, they display
different levels of awareness of, and attitudes towards, formal education. It is worth noting that schools will have accepted integration and a focus upon girls as a prerequisite for any GEP3 support. As a result, GEP3 IQSs tend to display positive attitudes towards integration and girls’ education,
either intrinsically or due to response bias.
The integrated curriculum appears to have largely gained acceptance in the case study
communities. Whilst stakeholders acknowledged the initial challenges in winning over the community, with some parents withdrawing their children from the school, the integrated Qur’anic
education now seems to be an integral part of the schools in which it is situated. In Bauchi—where integration has been more recent—its embeddedness within communities seems more fragile. In the Bauchi typical IQS, a facilitator referred to some members of the community who still do not support formal education, and mock the IQS facilitators as a result. Overall, however, respondents highlighted the gradual acceptance of the value of ‘Western education’, describing this as due to
‘enlightenment’ and ‘having understood the world in which we live’.
‘Previously, many people were looking at it as a form of diversion [from their traditional ways],
but gradually parents themselves became aware of the system and started sending in their children to the school, particularly when they started realising that practically children are getting educated both ways – the Qur’anic and western.” (Mallam/head teacher, Niger higher performing IQS)
Evaluation of the Girl’s Education Project 3
© EDOREN 262
This shows a recognition that both religious and non-religious education are important, and that
neither type of education is sufficient in isolation. Respondents described the two types of education as complementing each other, enabling children to succeed in all aspects of life: ‘traditional’ and ‘now’, as well as in the afterlife. As the Mallam from the Bauchi typical IQS explained: ‘There is one children’s Islamic book called “Nuru Dalala”. It teaches that a man is required to have Islamic and
formal education. Without the two, it will be like a bird flying on one wing, which is impossible. So we need the integration of both so that everything in life can be achieved.’
Two separate case study schools and various respondents used the example of the bird with one wing to exemplify the perceived value of integration. Some respondents described the value of ‘Western’ education as opening up opportunities for employment and experience. In isolation,
however, it was suggested that this education can change a child so that they become too much like the ‘Englishman’ and lose their cultural roots and values. These responses point to a tendency to view formal education as ‘Western’ education, which results in ongoing hesitation among some community members towards the introduction of formal education. Language plays an important
role here: ‘Boko’ is used interchangeably to mean Western education and also to refer to formal education when needed.134
Communities perceive that the acceptance of formal education has increased. This is owing to a combination of ‘outsiders coming and explaining’ (in the form of sensitisation campaigns) and people seeing the positive outcomes of receiving formal education. Seeing that people have ended
up in higher-status positions whilst remaining ‘devout Muslims’ is arguably important. The main reason given for the improvement in acceptance is the awareness and understanding that formal
education can complement Islamic teachings without de-valuing moral and traditional aspects. Additionally, the perception is that the need for more formal skills—such as counting (for the market and other income-generating activities) and reading letters (for privacy, and therefore not requiring
the help of neighbours)—is increasing.
‘I am very much comfortable with the integration process involving both boys and girls because
teaching the formal subjects is very important. For instance, the example I cited about banking.
If you are not educated in the formal subjects, you have to call another person to write for you who will know all your secrets and privacy but if you are educated, you will do all these for
yourself. If you are asked to fill in a particular form, and it is noticed that you do not know how to fill it, you become embarrassed. If you are educated, [there are] no such challenges on your part.” (Mallam/head teacher, Niger lower performing IQS)
Respondents described educating a child in formal subjects as benefitting both a family and a
community as a whole. Educating a child ensures that parents and others are able to receive help from their children in reading letters and in other tasks requiring certain levels of formal education.
Moreover, children can take up employment in sectors such as teaching or in hospitals, thus helping the community to develop.
Key stakeholders in all six cases stressed the importance of gradual integration. It is essential to be
considerate of the fears that parents have of the IQSs resembling public primary schools too closely
134 ‘Boko’ is a Hausa word meaning both ‘education’ and ‘secular’. It is also used to describe the Roman script, and can also be translated into ‘trick’ or ‘manoeuver’ (Hippocrene Practical Dictionary: Hausa-English English-Hausa). It is possible that, unless another term can be used to popularly describe formal education (with a narrative of modern, northern Nigerian education at its heart), the ongoing tension around a ‘loss’ of culture and religion will remain a challenge.
Evaluation of the Girl’s Education Project 3
© EDOREN 263
therefore, negatively affecting religious teaching. There are still challenges for integration135 and
though KIs, including parents, refer to the benefits of the combination of the two, the majority of study IQSs still place greater emphasis on religious education.
‘If the school is relocated, the parents will complain since they are yet to understand the
integrated system. They will feel the school has been converted to a formal school instead of the religious school that it used to be; and that will lead to withdrawal of children. Now we are integrating the formal education gradually to avoid that.’ (CBMC, Bauchi typical performing school)
However, case study communities do not see integrating the formal curriculum into Qur’anic schools as the only way to combine religious and formal education. In several cases, children are
attending both primary school (in the mornings) and the IQS (in the afternoon): ‘like now the majority of pupils here still attend the conventional primary school in the community, they go to the primary school and still come to the Islamiyya’ (CBMC, Bauchi higher performing IQS).136 This seems
less the case in IQSs that are remotely located. In the case of one of the more remote rural IQSs in Bauchi, communities had no access to a formal primary school at all and pupils interviewed indicated that few attended public primary school.137 It will be important at midline to explore further the
perceived benefits of integrated Qur’anic education in a context in which public primary schooling is readily available.
4.4.3.2 Facilitator and head teacher knowledge, skills and teaching practice
The GEP3 ToC argues that training and mentoring of facilitators will contribute to their improved subject knowledge and pedagogical skills. An underlying assumption is that the capacity
development process targets the needs of the facilitators and head teachers. Therefore, in this section, we provide a qualitative baseline assessment of current knowledge, skill and practice, which
influence training needs.
Facilitators’ and head teachers’ background and qualifications
The level of facilitator qualifications varies significantly across the six IQS case studies. In the higher
performing IQSs in both states, facilitators have the NCE; whereas in the lower performing IQSs facilitators have only just, or have nearly, completed secondary school. In both the higher performing
IQS cases, the facilitators are also teaching in public primary schools. In all cases, facilitators are from the local community.
The qualification and teaching experience of head teachers differs significantly across schools, and the extent to which head teachers have sufficient subject and pedagogical knowledge to take on the role appears to be dependent on whether the Mallam has prior qualifications or not. The level
of education amongst head teachers ranges from no formal education to holding the NCE138. In one Bauchi school, the head teacher, who was also the IQS proprietor, was a university graduate. Overall,
there is a lack of clarity within the majority of IQSs regarding the roles and responsibilities of each
135 Explored throughout the qualitative analysis. 136 See further discussion around public primary schools/IQSs and girls’ enrolment/retention in the discussion around Contribution Claim 3. 137 It is important to note that due to security considerations the qualitative research team only visited relatively accessible IQSs. Hence, the study will not be able to reveal the dynamics in remote areas. 138 The NCE is an A-Level grade course intended for secondary school leavers and their equivalents.
Evaluation of the Girl’s Education Project 3
© EDOREN 264
actor. Several respondents initially stated that the IQS has three separate roles of proprietor, Mallam
and head teacher, all held by different people. However, further probing showed that there is often one person who plays all three roles. In some schools, the proprietor of the school—who is also often the Mallam of the Qur’anic school—appears to take on the role of the head teacher as the Islamiyya/Tsangaya integrates. Where there is a separate proprietor of the school, the head teacher
of the IQS tends to be the Mallam of the Qur’anic school. The sub-section ‘School management – actors, roles and responsibilities’ will further explore the challenges around systematically identifying appropriate head teachers to take on pedagogical leadership.
Facilitators and head teachers who have higher levels of qualifications feel more confident teaching the integrated curriculum. This was not restricted to facilitators with the NCE, but
facilitators who had a level of formal education beyond secondary school (such as non-teaching degrees). Facilitators with the NCE also tend to teach in public primary schools. In cases where facilitators do not have the NCE, there seems to be a clear gap in teacher knowledge, in the area of subject and curriculum knowledge—with teachers being unaware of what is required to be taught.
Whilst facilitators report that they have had some training on methods for teaching, or that they use textbooks to plan lessons, they can only teach what they themselves know.
Facilitators’ subject knowledge in the typical and lower performing IQSs is weak. Facilitators are unable to explain which subjects it is important to teach, or why they teach what they teach. Moreover, during the QCOs it was clear that facilitators themselves, at times, did not have basic
literacy skills, beyond reciting the alphabet. Many facilitators were teaching at the level that they were themselves taught. In those cases where their own education was limited, they were only able
to pass on basic reading and numeracy skills to their students. Facilitators who also teach in public primary schools (mostly found in the two higher performing cases) often have their subject specialisations, which they then also teach in the IQS. In the other four cases, facilitators either have
not received further education or have non-teaching degrees, such as accounting or plumbing. Many Teacher Facilitators are thus teaching subjects without either advanced subject knowledge, or any
pedagogical training on imparting that knowledge to students.
‘Well, the major things of focus that we teach them are issues like spellings of basic things which they can easily learn to do even if they didn’t see the basic things practically. If they
know how to spell the things and they see them practically later that would give them an idea of the meaning of that thing.’ (Niger, lower performing IQS)
However, community members often perceive facilitators’ subject knowledge to be high. As Glover et al. (1990) discuss, perception can be dependent on the reference frame of a respondent. That is, a
respondent’s perception of the subject knowledge of teachers will be dependent on their own level of knowledge. Parents in the IQS communities often lack any formal education and though they
perceive teachers to teach well they express having difficulties following at times: ‘they are teaching them very well. You know sometimes, it is difficult to understand’ (Parents FGD, Bauchi higher performing IQS). Even in cases where facilitators themselves do not have subject specialisation
beyond secondary school, respondents believe teachers have a subject focus. The perception of knowledge is thus highly influenced by the relative lack of formal education within the IQS communities.
Pedagogical skills and teacher practices
In many of the IQSs visited (with the exception of the Niger higher performing IQS), while pedagogy was not strong among the facilitators, facilitators displayed some understanding of the importance
Evaluation of the Girl’s Education Project 3
© EDOREN 265
of lesson planning and structure, with attempts at delivering lessons in some kind of systematic
manner. For the most part, facilitators who were able to explain how and why they prepared or executed a lesson in a certain way did so on a surface level. While some facilitators identified pedagogy as important for effective teaching, there was less understanding of what it entailed: ‘if you show anything with students, or do any teaching that the children can’t understand, you must
teach very well. So that if you are teaching, the students will understand the teaching.’ (Head teacher, Niger typical IQS)
Facilitators’ ability to make use of effective methods is related to the depth of subject knowledge that they have139. In the QCO, facilitators demonstrated some knowledge of effective teaching methods, such as stating the lesson objective, asking questions about and reviewing the previous
lesson, and using participatory methods, such as group work. During the TPDs, facilitators also referred to the importance of child-centred teaching and of actively including children in the lesson. However, whilst facilitators displayed awareness of teaching and pedagogical methods, in most cases facilitators themselves did not seem to have sufficient subject knowledge. It seems that some
facilitators have knowledge of pedagogical techniques and methods without a deepened knowledge of subject matter. Thus, they often lack the ability to teach effectively.
‘We were taught how to prepare lesson plans and how to use flash cards. Back then, the way we used flash card is quite different from how we use it now. Back then, we hold flash card like
this (for longer) to the pupils but now we were taught that from the meaning of flash, we are supposed to allow the children to have just a glance and we cover the card. And we were
taught that most of the knowledge of our lesson should come from the pupils, they should say more while as a teacher I am more like a guardian.’ (TPD, Bauchi lower performing IQS)
The most commonly used teaching methods are repetition, recital and asking the class questions. Though various techniques are used, lesson structuring seems ad hoc and very brief, with facilitators
mainly employing the methods they have been told to use or what they have experienced or observed in public primary schools. It seems that teachers do not always have a deeper
understanding of the value of certain methods, and are not sure when to use a particular method. One of the facilitators in the Bauchi higher performing IQS explained why he thought repetition was
an important teaching method: ‘I want them to understand better. If I do not repeat it severally, they will not learn and if I repeat just once or twice, most of them will forget it by tomorrow but now it has
become part of them, like a song. Sometimes you find the children singing “Monday” and so on.’ Another observation from the QCOs was the facilitators’ inability to set meaningful class work and to move around the classroom in order to check and mark pupils’ progress. In all three schools in
Bauchi—even the higher performing one—the facilitators referred to pupils needing to write in their books, and made overtures regarding correcting class work. Nevertheless, in practice this behaviour
was nominal: it was often done right at the end of the class, with no real time given to explaining corrections. As not all students had notebooks, the practice was also inequitable.
It is clear that the level of effective teaching varies significantly across IQSs. Amongst the six case
study schools, the Niger higher performing IQS stood out. The majority of facilitators had an NCE and also taught at a public primary school. Facilitators displayed a higher level of subject matter knowledge, and confidence in using pedagogical techniques and effective teaching methods. In the other IQSs, facilitators who have received any form of training do display a certain level of knowledge
regarding teaching methods, but this does not seem to be complemented with sufficient subject
139 Adediwura and Tayo (2007).
Evaluation of the Girl’s Education Project 3
© EDOREN 266
knowledge, which affects the effectiveness of these methods. In general though, in all schools
sampled (and particularly in five of the six) there is a critical need for ongoing teacher training and mentoring that strengthen both pedagogical skills as well as subject knowledge.
Effective teaching of the integrated curriculum will also depend on the instructional time allotted to teaching of formal subjects. Instructional time varies between lower, typical and higher performing
IQSs. Observed lessons lasted between 10 and 45 minutes, with the most common time spent teaching being 10–20 minutes. Classes observed included maths, computer science, English, and Hausa. The study may have influenced the observed duration since class times were scheduled in order to allow for observation. However, pupils, facilitators and other stakeholders reported that lessons normally last around 20 minutes, and that about two subjects are taught per day. This did
vary between cases, with higher performing IQSs reporting that classes normally last about an hour. The qualitative data are not clear on how frequently all IQSs teach formal subjects. Though some IQSs referred to formal subjects being taught five times a week, others spoke of two to three times a week. Still, apart from in the Niger higher performing IQS (teaching five times per week), there were
inconsistencies within the cases themselves regarding how often an IQS teaches formal subjects. There are, however, some indications that classes do not take place regularly, owing to facilitator absenteeism and weather concerns.
Facilitator training and satisfaction with acquired skills
As there have been prior rounds of interventions under GEP, the qualitative data capture some perceptions regarding GEP3’s training, and satisfaction with acquired skills – even at baseline. The
IQS cases all report having received some form of training, although the baseline data are not fully able to capture the extent of this. Moreover, it is not always possible to distinguish GEP training from
other forms of support and training – something that will be important to consider at midline.
Facilitators in all IQS cases expressed an interest in receiving training. GEP training already received has, according to respondents, focused on sensitisation and the importance of formal education that
is inclusive of girls. In some cases it seemed that facilitators had received training as part of the
CBMC, rather than receiving facilitator-specific training. Some facilitators also referred to having received training on how to use teaching and learning materials, and the importance of mother-tongue instruction. Perceptions around training are that you are taught ‘tools’ with which to teach and values relating to the importance of inclusive instruction and formal education.
‘I was taught on teaching aids and how to relate better with the pupils by putting on a smiling face and also playing with them, and also not use cane to beat them.’ (TPD, Bauchi lower performing IQS)
Facilitators, however, refer to needing training in formal education – to further their own knowledge in order to be able to teach. As discussed above, the ability of facilitators to use the skills
acquired in training effectively will vary depending on their initial knowledge base. If facilitators do not have sufficient subject knowledge to make use of the teaching methods this will likely limit the
extent to which training increases the effectiveness of teaching, as teachers do not know when and why different teaching methodologies are appropriate. This is akin to learning how to use all the tools in a toolbox, without knowing for what purpose, and when, to use each one.
It is important that training is contextually driven and targeted to the level of knowledge of facilitators and head teachers. The range of qualifications and knowledge of formal education across the six cases is likely to have implications for several GEP3 outputs. It further has implications for the

Evaluation of the Girl’s Education Project 3
© EDOREN 267
ability of a head teacher to take on a pedagogical leadership position within the IQS, as discussed
below.
In schools with more than two facilitators, one needs to consider how knowledge can be disseminated and embedded beyond the two facilitators targeted for GEP3 training. In the Bauchi typical school, for example, the Mallam/proprietor had himself attended the facilitator training and
had been sharing his knowledge with the two facilitators under his remit. However, the likelihood of this happening consistently cannot be relied on, as it is not often the Mallam/proprietor who attends the training. In the Bauchi higher performing school, the interviews with the facilitators demonstrated that, while one facilitator had attended GEP3 training, the other was not even aware of it. Not only may this dampen the impact of the training, it may also cause resentment.
Furthermore, social relationships (e.g. between younger and older teachers) may affect how much transfer of knowledge actually takes place.
4.4.3.3 Gender-sensitive teaching
GEP3 seeks to improve facilitators’ skills in gender-sensitive class practices in order for teaching to become more effective, particularly for girls. This assumes that facilitators are amenable to helping
to improve girls’ education. Facilitators’ perceptions of, and attitudes towards, the education of girls
and boys will likely influence this.
Perceptions of, and attitudes towards, girls’ and boys’ education
Facilitators express positive attitudes towards girls’ education in the six case IQSs. However, the relative higher importance they attach to boys’ compared to girls’ education points to persisting
biases. As briefly mentioned above, there have been sensitisation campaigns and training about girls’ education140. Still, subtleties emerge from the various discussions informing the qualitative cases. For
example, although all facilitators perceive girls’ education as important, some facilitators think that
girls are less able than boys are, and that girls do not require as much education as boys. Thus, one
needs to consider positive attitudes towards girls’ education as relative to attitudes towards boys’ education and abilities.
In all but one case (Niger higher performing IQS) facilitators perceived boys to be more intelligent than girls. Some respondents considered this difference to be something that came ‘from God’
(Niger, typical IQS). Further probing on what was meant by ‘intelligence’ was needed, as respondents sometimes used the word interchangeably with ‘performance’. It is not always the case that facilitators consider girls as innately less ‘able’ than boys. Some facilitators are aware of the gendered context in which they teach—both institutionally and culturally.
‘The girls are not as brilliant as the boys.
Why do you think the boys are able to perform better?
140 Research bias may have affected responses since the research team was associated with the ‘Girls Education Project’. As such, one needs to consider these expressions of positive attitudes carefully. The lack of prior studies and experiences from the case study schools also meant that the research team exercised a high level of initial caution in regard to not offending respondents, which prevented more direct personal probing around gender attitudes in some cases. ‘True’ attitudes and perceptions of girls are thus difficult to pin down at this stage. For midline, questioning methods can be devised based on the greater familiarity we now have, in order to probe more deeply, whilst still being cautious of sensitivities.
Evaluation of the Girl’s Education Project 3
© EDOREN 268
Because, back then in this community, girls are not usually enrolled in school. You find out that
if parent has five girls and a boy, they will give out that boy to be enrolled in school and leave out the girls…the boys have stayed longer, the girls joined recently.’
(TPD, Bauchi higher performing IQS)
In pupil FGDs, boys said that formal subjects are more important for boys than they are for girls.
Rather than saying girls were not as able to learn formal subjects, the reason provided was that boys are more likely to need the skills taught in formal subjects, such as business, whereas girls are to be married (see further discussion on early marriage and enrolment in Section 3.2).
Though girls themselves said it was important for them to learn formal subjects, there was a difference in aspirations between boys and girls in some schools. Aspirations can be a good
indication of attitudes in a community since they show the general frame of reference possessed by girls. In all schools, boys aspired to become doctors, teachers and businesspersons, or to join the
military. Many girls, when asked, tended to shrug their shoulders and say they wanted to get married. Interestingly, this was not homogenous across IQSs, but appeared to be linked to the level of schooling available, and how long integration had been in place. For example, in the Bauchi lower performing school (with no formal school close by and only one facilitator) girls’ aspirations
were lowest. In the Niger typical IQS, the community has made it compulsory for all children to complete secondary school before marriage. Here, girls wanted to become teachers, doctors, businesswomen and mechanics. This is not to say that girls will be able to continue on to their
preferred professions. In several case schools, some girls spoke of their desire to go on to become professionals, such as midwives and doctors, but were also aware that early marriage will likely take
them out of school and will thus be a barrier to the realisation of these aspirations.
Inclusive instruction
The research pointed to various forms of gender bias in classroom organisation and instruction. In
some classrooms, girls sat at the back of the classroom whilst boys sat at the front, while in others girls and boys sat on different sides. Reasons for this separation included ‘Islamic teachings’, and
assertions that this segregation is essential in order for parents to even consider sending their children to the IQS.
‘Because in Islam, it is not good for the girls to be in front and the boys to see their backs. So that is the sharia of the Islam and that is why we do it.’ (TPD, Bauchi typical IQS)
This indicates that regardless of the acceptance of an integrated curriculum within the school, traditional Qur’anic schooling practices within the gender-biased classroom arrangement prevail in the majority of the sample schools, and attitudes in this area appear to remain quite entrenched. In those schools where the girls were at the back, their inclusion within the class was clearly more difficult to maintain, although for those girls who were determined to participate it was not a
deterrent. The observations also indicated that boys seated at the front were more easily able to
engage, and automatically received more of the facilitator’s attention. There is an understanding
amongst some facilitators that sitting at the front of the classroom is preferential. As one facilitator stated: ‘even in the formal school…the young ones in front and the older ones at the back because of the ease of copying notes. If you mix them up, both the young ones and the older ones, the young ones at the back will be unable to see the writings on the board.’ (TPD, Bauchi higher performing IQS)
Evaluation of the Girl’s Education Project 3
© EDOREN 269
While facilitators seem to demonstrate gender sensitivity in their interaction with pupils, gendered
expectations about classroom behaviour still needs further attention. During the QCOs, facilitators would actively ask both boys and girls questions. The pupil FGDs confirmed these observations and both boys and girls said that facilitators allow anyone to answer questions. However, respondents often perceive girls to be shyer and quieter than boys are, describing girls as ‘less interested’ or ‘less
motivated’. Though facilitators report that they always actively try to engage these students, some girls said that teachers have never asked them a question, and that girls have never answered a question in class. In some IQSs boys said that girls never answer questions or pay attention in class, as they are only interested in marriage. In one of these IQSs, girls, however, reported that the Mallam gets angry if they speak too much in class and that the female facilitator prefers the boys to
answer.
Some facilitators claim that they focus more on girls in school since girls will be there for a shorter time and, as such, need to learn more in less time. Interestingly, the fact that girls are less likely to continue on to further education, or even complete secondary school, has various outcomes as
regards inclusive instruction.
‘For now, we want the girls to learn more because they don’t go to school for long. They often
get married and sometimes relocate after the marriage but, for the boys, they are always with us and can further their studies anytime. But for a girl, once she has grown she starts thinking
of getting married so the boys stay longer in school and some of them (boys) want to become teachers too, that is why we are concentrating on the girls.’ (TPD, Bauchi typical IQS)
Some girls have similar perceptions:
‘The girls show more interest because here the girl is not allowed to learn much. And we have been told to acquire knowledge for our own sake and the sake of our children because
someday, you might end up teaching others or at least teaching your own children.’ (Girls FGD, Bauchi typical IQS)
Similarly, differing perceptions of the abilities of boys and girls affect the nature of instruction. However, in some cases, this does not lead to forms of instruction that disfavour girls, but rather to efforts to combat perceived differences in performance levels.
‘But if you remember during the group work activity we combined both the boys and the girls. It is not like we find the girls disgusting, or we belittle them. But, from our own understanding, the boys learn faster than the girls so that is why during group activity we try to mix them up in order to share ideas. But if I group them according to their gender, and I give them work to do, there would be challenges and the challenge is that the boys perform better so that is why we
mix them to share ideas?’ (TPD, Bauchi lower performing IQS)
There are also some gendered elements to pupil assessment. Some facilitators describe pitting boys
and girls against each other through performance competitions, by grouping pupils: whichever group
wins ‘gets pampered’ – ‘this will naturally make the other group more serious’ (CBMC, Bauchi higher
performing case).
Within the QCOs these often conflicted perspectives regarding girls’ education came through in the way facilitators would try to include girls practically as part of the class. In the two Bauchi schools where girls sat at the back, the facilitators would fluctuate between focusing on the boys who were closer to them, to then suddenly making an effort to engage with the girls who were at the back. In

Evaluation of the Girl’s Education Project 3
© EDOREN 270
the Bauchi typical school and the Niger higher performing school girls were more likely to raise their
hands and ensure their own engagement (thereby also being more likely to be called to the board to complete a sum etc.), while in the lower performing school the girls were largely silent.
Some facilitators tried to redress any gender imbalances in participation by calling only on girls to answer certain questions. However, it is important to consider that the research team observing the
class may have influenced this behaviour. It is worth considering the pitfalls of segregating boys and girls as regards their responses to questions in class (e.g. when a facilitator asks ‘only the boys’ to stand up and answer, and then ‘only the girls’ to stand up and answer), as this can serve to entrench difference.
Overall, the qualitative research found that gender biases affect classroom organisation and
practices during the teaching of the integrated curriculum, despite the display of gender-sensitive techniques, due to entrenched gendered attitudes and expectations about the benefits of education for girls, and cultural norms about how girls and boys relate. It is, therefore, important to deliver
gender-sensitive techniques in the classroom with the support of increasingly transformed gender-sensitive attitudes amongst the facilitators themselves.
4.4.3.4 Facilitator motivation
While facilitator motivation is not a direct intended objective of GEP3’s IQSS, we assume it is an important contributing factor to more effective teaching. We consider motivation to demonstrate
itself in, among other things, the effort the facilitators make in terms of attendance, punctuality and time dedicated to the work. We first discuss these aspects and the context in which they occur. Next, we present findings on some important factors affecting motivation, such as remuneration, job
satisfaction and social status attached to a facilitator role.
In general, the qualitative findings from the six IQSs indicate that issues of remuneration, social
status and community roles and relations shape facilitators’ motivation. The IQS context provides a different setting for facilitator motivation as compared to public primary schools. Since facilitators
are often from the communities themselves they are often asked by the traditional leader, or the
Mallam, to take up the role of school facilitators.
Attendance, punctuality and instructional time
Community stakeholders (including pupils) perceive facilitators to be dedicated and punctual. The qualitative study explored reasons for loss of instructional time, and whilst respondents brought up lack of facilitators as a key reason for insufficient instructional time facilitator absenteeism was not seen as a key reason, but rather the lack of facilitators in IQSs.
‘The teachers are always punctual, you see that our teacher with the red cap, there was a time he was having eye problem but that did not stop him from coming to teach us, he wore glasses
and came. He is always around to teach maths. He was even taken to the hospital in Bauchi to
get treatment.’ (Boys FGD, Bauchi typical IQS)
Few of the IQS cases seem to have set timetables, with formal subjects taught as and when a facilitator is available. Whilst respondents mentioned that formal teaching takes place for certain periods of time, for example for two hours twice a week, in practice teaching appears to happen in a
more ad hoc way, with a class for 20 minutes ‘between the hours of 4 and 6 pm’. The timetable for
Evaluation of the Girl’s Education Project 3
© EDOREN 271
formal teaching also appears less structured than that for religious teaching. This makes it difficult to
get a uniform understanding of how and when formal subjects are taught, which makes it challenging to monitor formal subject classes.
‘The Qur’an every day in the evening around 4pm, except Thursdays, while the formal subjects
are usually on Wednesdays and Saturdays. In the event that the formal teacher is unable to come, we continue with the Qur’an. The formal teacher teaches for two hours and teaches English, writing, reading, Hausa and mathematics. He teaches one or two subjects per day.’ (Mallam, Bauchi lower performing IQS)
The FGDs with pupils called attention to the role of the class monitor, who teaches younger students if the facilitator is not present. This was common in several of the IQSs, where pupils said that they
often ‘run the classes’. During the QCO in the Niger typical IQS, the facilitator started the English class by having children sing the alphabet one by one. He then left the classroom on and off and sat outside or in the doorway of the classroom. As such, facilitators may be present and start a class on
time, but it is not necessarily the case that they are present in the classroom to ensure effective instructional time.
Out-of-school activities and the weather further disrupt instructional time. Many children
attending IQSs have responsibilities helping on the farm or at home with income-generating activities, such as hawking (see further discussion in the section ‘Qualitative case study analysis’ in relation to Contribution Claim 3). This adversely affects instructional time, as parents are less likely to
send their children to school if it takes up too much of the children’s time. As farm work is seasonal, the attendance of pupils is significantly worse during harvest.141 Similarly, in contexts where the IQS
is located in a farming community, the facilitators are also involved in agricultural work and there were some indications that facilitators would be less likely to ‘run school’ during this time. Additionally, many pupils attend public primary school, thus restricting IQS instructional time to
afternoons and evenings, when Qur’anic teachings also occur.142
Some of the qualitative case schools do not have a physical school structure, but teach outside. This means that instructional time severely decreases during the rainy season: ‘it is only during rainy season that we are afraid to come because we have no shade and the winds are strong. We do not
even come regularly’ (Boys FGD, Bauchi typical IQS). Additionally, the hot sun in the absence of a roof (as in the Bauchi typical IQS) means that the presence of shade could also determine the timing and
duration of a class. Even in cases where there is a physical school structure, flooding during the rainy season can prevent schools from opening or children from attending, as IQSs are often difficult to access. The qualitative research also explored security as a reason for loss of instructional time.
Security concerns were less pressing than initially assumed, although this may be due to the influence of security considerations in sampling.
141 The agricultural cycle and farm work affect both boys and girls. While boys are more likely to be engaged in farm labour activities at planting and harvest time, such as land preparation and threshing, girls and women are often responsible for off-farm and post-harvest activities related to the yields produced, such as crop processing, storage, and food preservation and processing. 142 The only school where it was not possible to attend both IQS and primary school was in the Bauchi lower performing,
where there simply was no primary school available nearby. Later in the report we discuss issues around poverty and residual resistance to formal schooling as a barrier to attending public primary school.
Evaluation of the Girl’s Education Project 3
© EDOREN 272
Remuneration, job satisfaction and being valued by others
The majority of stakeholders in IQS communities report that facilitators are not paid for their work, apart from tokens gathered by the community. Facilitators receive an amount considered insufficient to live on.
‘In fact, I/you can call them voluntary but because they are only given some paltry assistance compared to their needs. Despite the fact that majority of them are women they also have
their own unique daily needs for survival, what we give them cannot be equated to a salary, honestly. It is just a small allowance and they are not working elsewhere.’ (CBMC FGD, Niger higher performing IQS)
IQS stakeholders acknowledge that there is an inherent inconsistency, with facilitators expected to deliver lessons at the standard of teachers, while fending for themselves financially. There appears
to be an additional gendered component to this role conflict,143 whereby male facilitators are
required to provide for a family, as well as to have a certain social standing in order to marry. Thus, many facilitators are involved in other income-generating activities, such as farming or teaching in
the public primary school, or are engaged in other social development programming activities. This has implications for instructional time and the amount of effort put into teaching at the IQS. As an example, the qualitative team found that trying to arrange the QCO and TPD according to the class
schedule for the Bauchi lower performing school was difficult, as the (sole) facilitator in that school was engaged in another agency-sponsored vaccination drive just outside of the community. It is important to consider the capture of the few educated individuals within a community by other
programmes within the wider issue of insufficient facilitator remuneration.
By not paying facilitators, the expectations placed on a facilitator, and the degree to which a
community can hold facilitators to account, might decrease. As is evident from the qualitative findings, this is a pressing concern in the communities:
‘The teachers are not paid salary so we accept whatever they offer rather than to allow the children to be left like that without learning.’ (Parents FGD, Bauchi typical IQS)
‘When teachers are not paid good salary it makes them nonchalant and that discourages the child.’ (Parents FGD, Bauchi typical IQS)
Yet, remuneration clearly is not the main motivation for facilitators teaching at an IQS. In all six IQSs, facilitators were members of the local community. Stakeholders perceived this to be the reason
why they agree to teach voluntarily. It is also worth noting that several of the facilitators had previously been pupils under the Qur’anic tutelage of the Mallam or his predecessor (this was the case in five of the six IQSs), possibly creating contexts in which a sense of responsibility to the community or even duty to a respected former teacher are at play. In the Bauchi typical school, the facilitator referred to being called by his teacher (the Mallam) to come and teach in his school in
order to ‘help teach our younger ones’ once he had completed his high school diploma.
Financial constraints make it difficult for IQSs to attract qualified facilitators. In many of the IQS
communities the majority of people lack a formal education beyond secondary school. Facilitators are thus, ‘children taught by this community’, and in many cases their subject knowledge is low (as discussed above).
143 Getzels and Guba (1957).
Evaluation of the Girl’s Education Project 3
© EDOREN 273
‘You know getting a teacher from outside the village that is far from the road is difficult. We
must get money for fuel or bicycles. We do not have money. So we give little money to try to get someone and they appreciate because they are also teaching their younger ones.’ (CBMC FGD, Niger typical IQS)
Nevertheless, in spite of the lack of remuneration facilitators in IQSs report feeling intrinsically
motivated by what they do: ‘education is important particularly for the girl child because it will help them greatly in life. That is why I want to give it my best as a contribution to see they progress in life.’ (Female facilitator, Niger higher performing IQS). Facilitators cite their motivation as coming from wanting to help children and to help the community to develop, being interested in teaching and the belief that a reward will come from ‘God’.
‘We get our reward from the community and from God in heaven. The community respect and value us; wherever we go both the parents and the pupils respect us and are happy to see us.’ (Facilitator, Bauchi typical IQS)
There are contrasting accounts of the perceived social status of being a facilitator, and this links to issues of remuneration. Though community members refer to the immense importance of the teaching profession and how they will be rewarded in heaven for this sacrifice, facilitators report not
feeling valued due to their low pay, with examples given of having been denied a girl’s hand in marriage. The financial challenges mean that facilitators struggle to ‘move up a level’ in life, as compared to their peers: ‘I have taught for almost four years but one of my friends whom I schooled
together with in Azare is now working with the airport. He owns a house and a car. As for me, only that motorcycle that you are seeing outside. The difference is clear. [If I was] not a teacher I would
have passed this level.’ (TPD Bauchi higher performing IQS)
The same facilitator spoke of the reward for a teacher as being ‘only in heaven’, a response that—when coupled with his experience of having a low status and below-par pay in comparison to peers—
indicates a potential challenge to the current goodwill and motivation of facilitators who believe
intrinsically in the educational purpose of their work. Gendered expectations of men within the society as breadwinners plays a critical role here (as exemplified by facilitators’ inability to secure a marriage), and such pressures in a predominantly male profession cannot be underestimated when it
comes not only to the motivation of facilitators, but also to retention within the profession. The report entitled ‘Being a Man in Nigeria: Perceptions and Realities’ (2015) identifies the social norm
that views men as ‘sole breadwinners’ in Nigerian society as engendering feelings of failure when it is not possible to live up to those expectations144. Meanwhile, Kelleher et al. (2011) identified consistently inadequate teacher remuneration in many countries as ‘one of the core reasons why
many men either choose not to enter the profession or end up leaving it in the long run”145.
The GEP3 ToC assumes that motivation will increase where facilitators are able to access all the
technical proficiencies, guidance, support, and materials needed in order to be a good teacher. However, such motivation, and its translation into teaching effort, is influenced by the very basic and practical underpinning of an IQS facilitator’s economic needs and responsibilities, and by how these
may conflict with the well-intentioned commitment to teaching the integrated curriculum in the absence of adequate remuneration and the status that this is more likely to bring with it. Therefore,
144 Voices for Change (2015) Being a Man in Nigeria: Perceptions and Realities, DFID. 145 Kelleher et al. (2011) Women and the Teaching Profession: Exploring the Feminisation Debate, UNESCO and the Commonwealth Secretariat.
Evaluation of the Girl’s Education Project 3
© EDOREN 274
adequate remuneration is an important contextual factor that is likely to influence the impact
pathway to more effective teaching.
4.4.3.5 Pedagogical leadership
One of the key intended outcomes of GEP3 is enhanced school leadership and management. The programme’s ToC notes that, through capacity development, head teachers will be able to lead schools and facilitators more effectively. This section will focus primarily on pedagogical leadership, whilst Contribution Claim 2 discusses school management more broadly.
School leadership positions (proprietor, Mallam, head teacher and CBMC membership) are not necessarily separate roles within the IQS context. As discussed in the section on Contribution Claim 2, there is a lack of clarity within most communities regarding who has what role, and what that role entails. When asked, some respondents considered that each IQS has each management position.
However, when probed further the most common scenario seems to be one person taking on all three roles of proprietor, Mallam and head teacher. In many cases, this person also holds a prominent position on the CBMC, such as chairperson or secretary. Consequently, while the roles may all exist within a single IQS, this does not necessarily mean that there are different people
holding each role. While a person taking up several roles in an IQS does not necessarily affect GEP3’s
school leadership and management, lack of clarity about these roles can make it difficult to identify whose leadership capacities to build. Different actors may be involved in the implementation of
similar roles, and the most qualified person may not lead on the role, for example, of pedagogical leader (see below).
There may be some variance in assigning roles and responsibilities when it comes to different
types of IQS (both prior to and after integrating). As Antoninis (2014) outlines, there are, broadly, two types of religious education institutions in northern Nigeria: Qur’anic religious education
institutions and Islamiyya religious education institutions. Qur’anic institutions encompass both
makaranta allo (‘school of the slate’) and Tsangaya.146 In both institutions, the Mallam (teacher) is in
charge of the school, and timetables are ad hoc, on the initiative of the Mallam.147 As such, children are at times able to attend public primary school as well.148 The Tsangaya element means that the
institution has a mobile element, in which the Mallam moves with his pupils ‘in the belief that an itinerant life is essential for them to fully concentrate on their study’.149 Since the Mallam in Tsangayas is ‘in charge’ of the location of the school, be it in his house or on the move, he is likely to automatically be the owner of the school. Islamiyya institutions go beyond memorising the Qur’an
and include a variety of Islamic subjects,150 such as Arabic, Islamic history etc. Islamiyyas take a more structured, stationary form than Makaranta allos and Tsangayas, and tend to have set instructional times.151 Mallams do not necessarily own Islamiyyas.
Mobility of the Tsangaya schools is likely to interrupt teaching of the integrated curriculum and may affect the gender inclusiveness of the school. In one Tsangaya IQS in Bauchi, the head teacher
(Mallam) said that they were not mobile anymore, due to the security situation in Bauchi, while the
boys in the FGD referred to having been ‘on the move’ and made clear that further mobility was
146 Antoninis (2014). 147 Ibid. 148 Ibid. 149 Antoninis (2014: 83). 150 Ibid. 151 Ibid.
Evaluation of the Girl’s Education Project 3
© EDOREN 275
planned for the future. The Mallam would then move only with boys. It is unclear at this stage
whether the formal subjects’ facilitator would continue to teach in the community in the absence of the Mallam and the boys. However, there is a high likelihood that this would interrupt the teaching of the integrated curriculum, and that girls may become disconnected from the school – therefore affecting the inclusive instruction of the girls.
The case study IQSs were referred to as Tsangaya in Bauchi and Islamiyya in Niger, although all schools appeared to display characteristics closer to Islamiyya. The qualitative study found Tsangayas referred to as schools with a mobile element, in contrast to the stationary Islamiyya that follow a more formal structure concerning timetables and teaching approach. However, in practice, there were come inconsistencies with this terminology, particularly in Bauchi, where all the schools
were called Tsangayas but all displayed slightly different characteristics. Furthermore, in conversation respondents frequently used Tsangayas interchangeably with Makaranta Allo. All three Bauchi Tsangayas appeared to have, on a spectrum, similar characteristics to Islamiyyas, although not all of the Bauchi IQS cases had physical infrastructure. The higher performing school had a solid
physical structure, more girls attending school than boys, and a large number of Qur’anic teachers covering a wide range of Islamic subjects. Of the other two Bauchi IQSs, only in the case of the lower performing school was there some indication that it was still mobile, although this was inconclusive.
In Niger state, all three schools were Islamiyyas. The schools had separate formal structures in all but one case (Niger higher performing IQS), where the school was located in the house of the proprietor.
Roles and responsibilities vary significantly from one IQS to another. The communities consider the people who founded the school, and who own and run it, to be the proprietors. In cases where
philanthropists started the IQS, or where the community did so through donations, the perception is that schools are ‘owned’ by the community and it is thus less clear who would be acting as proprietor. When the school has transitioned from a Qur’anic religious institution into becoming an
IQS, the Mallam is likely to be the acting proprietor. The Mallam is in charge of religious education. In all the six IQS visited the Mallam is also the head teacher, although, as in the case of Niger typical
IQS, he/she may not be the highest religious authority in the community. In several cases, the Mallam/head teacher also holds a prominent position on the CBMC, such as chairperson.
Additionally, each community has a community leader, which, in all six cases, was separate from the above-mentioned roles. Still, the community leader is normally able to influence school management
and is often part of the CBMC.
The head teacher role is mainly considered a ‘school leader’ role. As discussed above, the qualifications and teaching experience that the Mallam has significantly differs across the six cases,
ranging from having received no formal education to having an NCE. The ability of head teachers to provide pedagogical supervision and mentoring, and the plausibility of this, is thus questionable in
cases where head teachers do not have prior subject knowledge or teaching experience.
‘All in all I spent about 18 years in search of knowledge but through Qur’anic education, no formal education at all. But, I was taught a, b, c, d by a friend, and now I can read in Hausa. I
can even read Hausa newspaper. But I have not gone to school in terms of formal.’ (Head teacher/Mallam, Bauchi lower performing IQS)
However, most head teachers in the qualitative study appeared confident in their abilities. As senior educators within their establishments they viewed themselves as having the ability to instruct their
facilitators. The notable exception to this was the Bauchi lower performing case. Head teachers frequently consult with facilitators, and give advice on how to teach and interact with pupils. Advice
Evaluation of the Girl’s Education Project 3
© EDOREN 276
ranges from advice on how children should sit in the classroom, to how to use participatory
methods, depending on the capability of the head teacher. Pedagogical leadership seems to be shared amongst many stakeholders, with CBMC members guiding head teachers, head teachers advising facilitators, and proprietors and community leaders weighing in. It will likely be a challenge to pinpoint who to train, as the assigned head teachers are often not the most qualified in terms of
formal education. 152
‘He [the Mallam] gives me advice because sometimes when I am teaching he comes in and sits down just the way you did today, if he sees anything wrong that concerns the children, after the lesson he will ask and say why are your things done differently from ours (Arabic studies),
do it this way and then he will give me advice. You see this proprietor [Mallam] has formal education too. He did not get to finish but they were the first to attend formal school in this community. He completed his primary school, got to secondary school, which was the only school [back then], but he dropped out of school in Grade 4. He is always happy with what we do, sometimes if my attention is needed elsewhere or urgently, he takes over the lesson. Like if
I am teaching alphabets or simple sentences he will just take a ruler or stick and continues the lesson.’ (TDP, Bauchi higher performing IQS).
As discussed above, the appointment of Mallams as head teachers is not necessarily based on ability and qualifications but has to do with social status within the community and perceptions around leadership more generally. In order to discuss the various roles and responsibilities further,
we need to clarify what each management role entails, and thus to identify needs for capacity development and training. The ability, perceived credibility, and power to enact these responsibilities
would thus vary depending on whether the head teacher is responsible for monitoring whether teaching happens, or whether the head teacher is responsible for the delivery of quality teaching. Pedagogical leadership requires knowledge around formal education and methods of instruction,
while normative leadership aligns more closely with ideas of vision, values and moral leadership.153 Within the IQS context, it may not be plausible to assign the same individual these responsibilities.
Mallams will have a high social standing and credibility in terms of ‘what is right and wrong’ morally, and thus hold an important position in terms of influencing the community concerning integration
and girls’ education. As such, Mallams may be assigned positions based on perceived political and social value, rather than teaching knowledge: ‘This school has been a Qur’anic school for 10 years
now, but when we decided to integrate formal subjects we decided to allow the same Mallam to continue to teach the children instead of bringing someone else to teach.’ (CBMC FGD, Niger typical IQS)
For GEP3, the variance between the capacity of the head teacher/Mallam in terms of confidence and qualifications raises the question of who to invite for pedagogical leadership training. It is likely that
the programme will need to take time to address this on an individual (IQS) basis. The application of certain criteria and contextual issues – such as placing a facilitator above his childhood Mallam when it comes to pedagogical leadership – needs careful consideration. Simply asking the IQS to nominate
and send someone based on the title of head teacher/Mallam may not yield positive results
without providing an explanation of the expectations of this role in terms of technical capacity, and not just seniority/status.
152 The higher performing case in Niger significantly differs from the other IQSs, as previously discussed (see annex). This IQS has a proprietor with an NCE, and she has clear pedagogical leadership. There is a separate Mallam/head teacher who does not have an NCE, and several facilitators with NCEs – the head teacher is thus the least qualified; however, there may be a gendered component to this. 153 NSCL (2003).
Evaluation of the Girl’s Education Project 3
© EDOREN 277
It may also be that there is no clear ‘candidate’ for head teacher/pedagogical leader, as seen in
some of the IQS cases visited, where no one in the community had any formal education beyond secondary school. The lower performing school in Bauchi in particular exemplifies this. In this IQS, the Mallam clearly deferred to the IQS facilitator in matters pertaining to formal learning, believing himself unable to advise his facilitator (a childhood friend, of a similar age, and with whom he had
more of a peer relationship), because he had not gone through formal schooling, whereas the facilitator had. It was clear that the IQS facilitator was very much guiding and directing, himself. As the only facilitator, he could not be identified as a head teacher to provide pedagogical leadership to others. In contrast, the Bauchi typical case showed the clearest evidence of a successful pedagogical relationship, where the Mallam had higher educational qualifications than both his facilitators (he
was a university graduate) and was already training the two IQS facilitators in pedagogical techniques from the GEP3 training.
Consequently, the complex relationships and the challenges in identifying clear head teacher/facilitator relationships may have implications for the GEP3 ToC pathway through which
formal curriculum pedagogical leadership and mentoring will take place.
4.4.3.6 Availability of teaching and learning materials
GEP3 support to IQS will include the distribution of teaching and learning materials, meant to contribute to teaching that is more effective. Below, we first discuss the baseline observation of the
availability and use of teaching and learning materials in the case study IQSs. Next, we discuss the perceptions of IQS respondents about the appropriateness of the materials.
Availability and use of teaching and learning materials
The current availability and use of teaching materials varies significantly between the six case
study IQSs. The Niger higher performing IQS has access to a wide array of materials, including
exercise books, textbooks (for all subjects taught), various teaching aids (flashcards, counting blocks)
and even functioning computers. Other IQSs have one textbook from which the facilitators extract class exercises and repeat lessons. In other IQSs there are no textbooks available but facilitators look
through books in the public primary school to plans lessons. One IQS made use of stones, sticks and bottle tops to count in order to allow children to visualise maths. All IQSs visited had a blackboard; in
some cases this was the only means of enabling children to read and write.
During QCOs it became clear that many children lack basic materials, such as notebooks and pens. This requires the facilitators to assess homework verbally.
‘It happens a lot. You find a pupil coming to the class without pens or books, so we usually tell them to tell their parents to buy them pens and books, and if they continue to come to school without writing materials we just leave them, there is nothing we can do.’ (TPD, Bauchi higher performing IQS)
As some IQSs visited have no ability to provide pupils with learning materials, this responsibility falls on the parents. This could have a negative impact on inclusive instruction. Several respondents consider the inability of parents to purchase learning materials as a reason why children will not attend school.
Evaluation of the Girl’s Education Project 3
© EDOREN 278
Perceptions of teaching materials for the integrated curriculum
Some IQSs have received a curriculum for teaching Hausa, and some flashcards and other teaching aids. Amongst those IQSs that have received some materials, respondents perceive materials to be appropriate and capable of aiding learning among pupils. It was challenging to probe this issue of teaching and learning materials, as at this stage few IQSs have any materials and as such the question was interpreted as ‘what do we want’. Hence, respondents mainly cited items needed by
the school, ranging from kettles and mats, to exercise books and pencils.
Respondents referred to challenges with regard to the use of mother-tongue instruction in the communities sampled. Some respondents pointed to the lack of mother-tongue materials – in particular, teaching and learning materials in Hausa and the Hausa curriculum. However, in other IQSs, Hausa was not the mother tongue for all. For example, in the Niger typical case, the community
mainly spoke Nupe, with barely any Hausa spoken. In another IQS, although the majority of study participants spoke Hausa, there were references to pupils who did not. However, it cannot be
claimed that the qualitative case studies are representativeness of the wider pupil population.
‘It [training] was good, but our problem here, those people around here don’t understand Hausa. We understand English154 and Nupe that is our area. I have only received curriculum for Hausa.’ (Head teacher/Mallam, Niger typical IQS)
‘The reason why we like Hausa, see now you asked this question with Hausa and she does not understand the Hausa right? That is why we want to learn it very well before they start to
teach us English.’ (FGD girls, Bauchi lower performing IQS)
‘We also wish the teachers use Miya, the indigenous language, to teach the Miyamas who do not understand Hausa and English to pick up.’ (Parents FGD, Bauchi typical IQS)
At present, the complete absence of quality literacy and numeracy learning materials in some
schools presents a clear baseline. The extent to which provision of fit-for-purpose teaching and
learning materials is able to contribute to effective teaching is again highly context dependent, as the needs of IQSs vary significantly. Moreover, teaching and learning materials need to be fit-for-
purpose, not only in relation to content, but also in relation to the skill level of facilitators – as some facilitators only have basic literacy and numeracy skills.
4.5 Analysis of the data – Contribution Claim 2: GEP3’s IQSS contributes to an improved, girl-friendly learning environment155
In this section we present the baseline data on school management, resource mobilisation, and community support for integration. In addition, we discuss other components of the IQSS ToC that are assumed to support more effective teaching: that is, the degree of government support and the
general school conditions. The quantitative data analysis is presented first, followed by the analysis
of the qualitative case study findings.
154 The head teacher, who spoke a level of Pidgin English and struggled to communicate with the research team in English, said this, and the wider community did not speak much English. 155 This relates to links 4, 5, 6, 7 and 10 in the ToC.

Evaluation of the Girl’s Education Project 3
© EDOREN 279
4.5.1 Quantitative data
4.5.1.1 School management
Role of the proprietor
Of the 60 schools in the IQSS sample, over 90% had a proprietor. This suggests that in most of the
cases the IQS was in fact owned by an individual, rather than the community. In the remaining cases, the IQS was community owned, except in one case where it was owned by the government. Almost all of the proprietors were male. Female proprietors only existed in the Niger sub-sample, which is in line with the trends in facilitators’ gender observed across the two states.
In one-third of the sampled schools the head teacher was also the proprietor. In such schools, in
addition to owning the school, the proprietor was the one responsible for day-to-day school management. This operating structure was more common for schools in Bauchi than in Niger. As
already discussed, schools in Bauchi were operating in a way that was closer to the ‘traditional’
model of an IQS. This finding further supports that notion.
The establishment of the CBMC
CBMCs were only available for interview in 52 out of the 60 IQSS schools surveyed. Instead of 30 schools in each state having a CBMC, 28 schools in Niger and 24 schools in Bauchi had a CBMC. The
remaining schools had not formed a CBMC yet.
There are interesting differences between schools that have a CBMC and those that do not. Although
the sample size for schools without a CBMC is quite small, which suggests that we should be careful about extrapolating this evidence, this section presents a brief summary of the differences. Schools with a CBMC are approximately two years older, more likely to teach all five integrated subjects, and
spend more hours per week teaching the integrated curriculum. Such schools are also more likely to
have separated the role of head teacher and proprietor. This suggests that CBMCs were more prevalent in schools that had ‘deeper’ integration, and not necessarily just more years of integration.
In some cases the CBMC was formed before the year in which the Qur’anic school integrated, and
thus could have functioned as one of the drivers of integration activities at the school level, while in other cases the CBMC was formed after integration, possibly as an outcome of being integrated. In
the overall sample, the CBMC was formed before integration in 37% of the cases. Almost half of the schools in Niger had a CBMC before integration, while this was true for only a quarter of the schools
in Bauchi. A look at the years since CBMC formation suggests that in approximately 70% of the cases where the CBMC was formed before integration, the CBMC was formed the year before integration.
On average, schools had had a CBMC only within the last three years. Schools in Niger and schools where the head teacher was not the proprietor, had had a CBMC for longer than schools in Bauchi and schools where the head teacher was also the proprietor.
CBMC membership
On average, CBMCs had 14 members, with a quarter of them being female. The representation of
children, defined as anyone under the age of 15 years, was very low, as only 17% of CBMCs had a child member (and a girl child member). As a share of total members, only 2% of all the CBMC members were children. Child membership was higher in Bauchi than in Niger. In CBMCs with a child member, there were approximately two child members on the committee. Overall, however, the
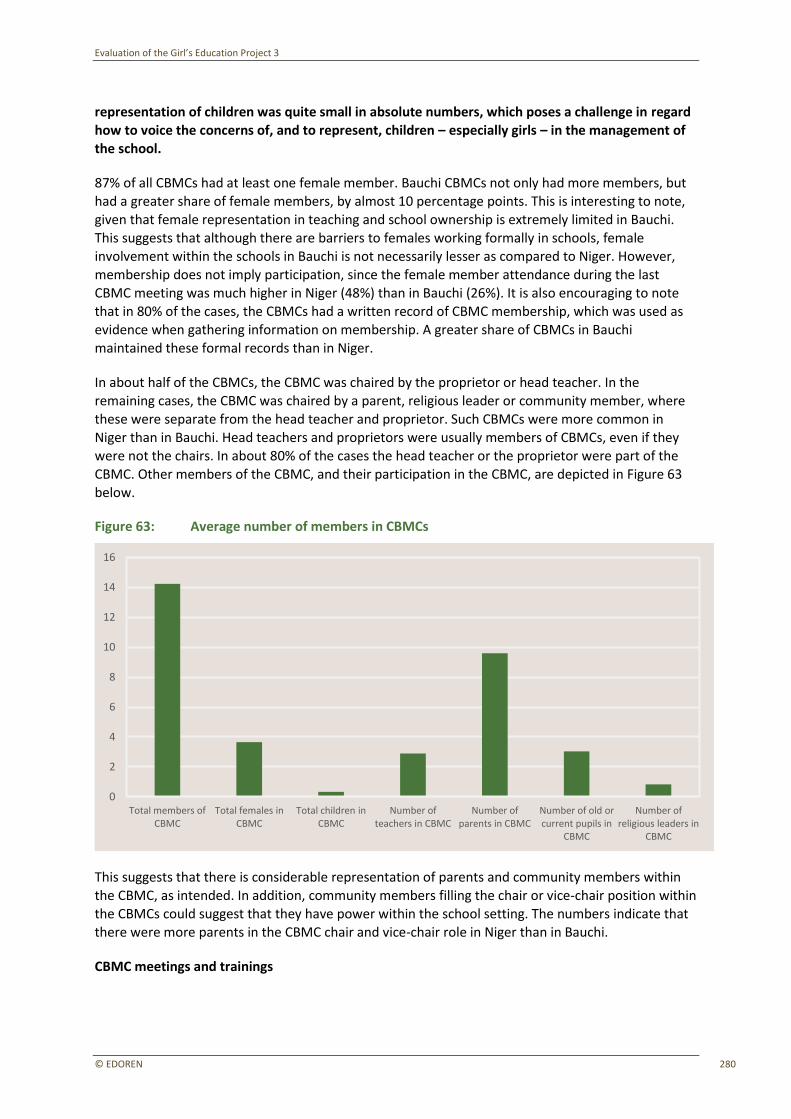
Evaluation of the Girl’s Education Project 3
© EDOREN 280
representation of children was quite small in absolute numbers, which poses a challenge in regard
how to voice the concerns of, and to represent, children – especially girls – in the management of the school.
87% of all CBMCs had at least one female member. Bauchi CBMCs not only had more members, but had a greater share of female members, by almost 10 percentage points. This is interesting to note,
given that female representation in teaching and school ownership is extremely limited in Bauchi. This suggests that although there are barriers to females working formally in schools, female involvement within the schools in Bauchi is not necessarily lesser as compared to Niger. However, membership does not imply participation, since the female member attendance during the last CBMC meeting was much higher in Niger (48%) than in Bauchi (26%). It is also encouraging to note
that in 80% of the cases, the CBMCs had a written record of CBMC membership, which was used as evidence when gathering information on membership. A greater share of CBMCs in Bauchi maintained these formal records than in Niger.
In about half of the CBMCs, the CBMC was chaired by the proprietor or head teacher. In the remaining cases, the CBMC was chaired by a parent, religious leader or community member, where these were separate from the head teacher and proprietor. Such CBMCs were more common in
Niger than in Bauchi. Head teachers and proprietors were usually members of CBMCs, even if they were not the chairs. In about 80% of the cases the head teacher or the proprietor were part of the CBMC. Other members of the CBMC, and their participation in the CBMC, are depicted in Figure 63
below.
Figure 63: Average number of members in CBMCs
This suggests that there is considerable representation of parents and community members within the CBMC, as intended. In addition, community members filling the chair or vice-chair position within the CBMCs could suggest that they have power within the school setting. The numbers indicate that there were more parents in the CBMC chair and vice-chair role in Niger than in Bauchi.
CBMC meetings and trainings
Total members of CBMC
Total females in CBMC
Total children in CBMC
Number of teachers in CBMC
Number of parents in CBMC
Number of old or current pupils in
CBMC
Number of religious leaders in
CBMC
0
2
4
6
8
10
12
14
16
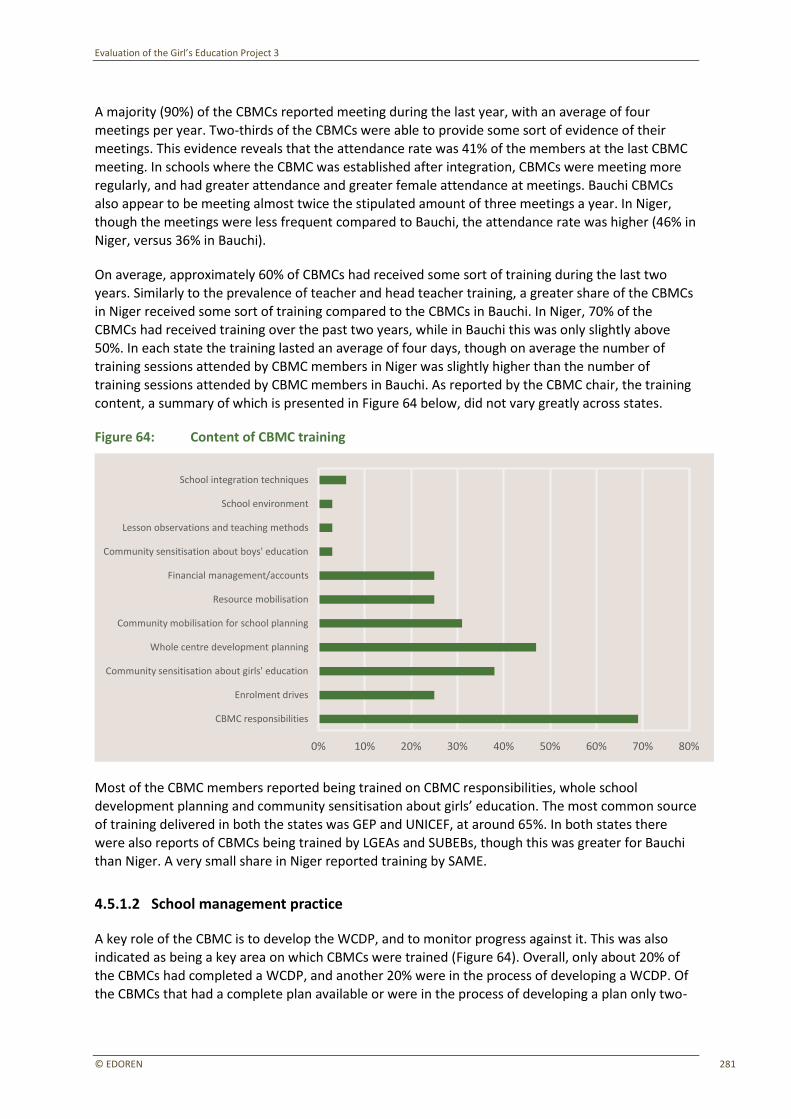
Evaluation of the Girl’s Education Project 3
© EDOREN 281
A majority (90%) of the CBMCs reported meeting during the last year, with an average of four
meetings per year. Two-thirds of the CBMCs were able to provide some sort of evidence of their meetings. This evidence reveals that the attendance rate was 41% of the members at the last CBMC meeting. In schools where the CBMC was established after integration, CBMCs were meeting more regularly, and had greater attendance and greater female attendance at meetings. Bauchi CBMCs
also appear to be meeting almost twice the stipulated amount of three meetings a year. In Niger, though the meetings were less frequent compared to Bauchi, the attendance rate was higher (46% in Niger, versus 36% in Bauchi).
On average, approximately 60% of CBMCs had received some sort of training during the last two years. Similarly to the prevalence of teacher and head teacher training, a greater share of the CBMCs
in Niger received some sort of training compared to the CBMCs in Bauchi. In Niger, 70% of the CBMCs had received training over the past two years, while in Bauchi this was only slightly above 50%. In each state the training lasted an average of four days, though on average the number of training sessions attended by CBMC members in Niger was slightly higher than the number of
training sessions attended by CBMC members in Bauchi. As reported by the CBMC chair, the training content, a summary of which is presented in Figure 64 below, did not vary greatly across states.
Figure 64: Content of CBMC training
Most of the CBMC members reported being trained on CBMC responsibilities, whole school
development planning and community sensitisation about girls’ education. The most common source of training delivered in both the states was GEP and UNICEF, at around 65%. In both states there were also reports of CBMCs being trained by LGEAs and SUBEBs, though this was greater for Bauchi than Niger. A very small share in Niger reported training by SAME.
4.5.1.2 School management practice
A key role of the CBMC is to develop the WCDP, and to monitor progress against it. This was also indicated as being a key area on which CBMCs were trained (Figure 64). Overall, only about 20% of the CBMCs had completed a WCDP, and another 20% were in the process of developing a WCDP. Of the CBMCs that had a complete plan available or were in the process of developing a plan only two-
CBMC responsibilities
Enrolment drives
Community sensitisation about girls' education
Whole centre development planning
Community mobilisation for school planning
Resource mobilisation
Financial management/accounts
Community sensitisation about boys' education
Lesson observations and teaching methods
School environment
School integration techniques
0% 10% 20% 30% 40% 50% 60% 70% 80%
Evaluation of the Girl’s Education Project 3
© EDOREN 282
thirds had a written form of the plan available, and one-third could provide some kind of written
evidence to demonstrate CBMC involvement in developing the WCDP. In the remaining 60% of CBMCs no WCDP existed. Differences between states seem minor, while proportionally more IQSs located in rural areas had a completed WCDP compared to IQSs located in urban areas. However, small sample sizes lead us to caution against any hard conclusions about such disaggregated analysis.
The main action point mentioned in the WCDP was the building of new infrastructure.
The evidence on financial management by CBMC members is limited. We attempted to verify any claims made by the CBMC members by asking for supporting evidence. Only 27% of the CBMCs reported using a cash or accounts book, of which less than half had an updated cash book available. Quite a lot of CBMCs (about 70% of the sample) used a bank account to manage funds. In most of
these cases the account was in the name of the school, followed by it being in the name of a CBMC member (in approximately 27% of the cases). In less than 3% of the cases the account was in the head teacher’s name. Only 40% of the CBMCs indicated that they kept records of bank deposits and withdrawals, of which only half could show any records from the last year. The use of a cash book or
bank account was more common in urban areas, perhaps due to easier access to financial services. In cases where the CBMC was chaired by a community member the CBMCs were twice as likely to use a bank account to store funds, as compared to CBMCs that were chaired by the proprietor or head
teacher. This evidence suggests that CBMCs need further training and support to improve their financial management practices, which is unsurprising since only about a quarter of trained CBMCs
reported being trained on financial management (Figure 64).
CBMC members were quite extensively involved in school monitoring activities. Almost all CBMC
chairs indicated having visited the school to monitor its performance during the last term, with the average number of reported visits being seven. The frequency of monitoring is higher when the chair is the head teacher, but in general large deviations are not observed when the chair is a community
member. Furthermore, over 80% of CBMCs reportedly monitored pupil and teacher attendance and took action to improve pupil and teacher attendance during the last term. This holds true when
disaggregating by state, training status, and by the CBMC being chaired by a community member. In addition, of the CBMCs that had a WCDP or were in the process of developing one 85% reported
monitoring activities against the WCDP. It is important to point out that in almost all the cases the visits of the CBMC members to schools were not recorded in the visitors’ book or any other log.
Hence, these visits could not be verified by evidence.
There was greater variation in the monitoring activities of CBMC members regarding quality of teaching. It appears that trained CBMC members monitor teaching quality more often in cases
where the CBMC chair is the head teacher or proprietor than when the chair is a community member. In 92% of the cases in which the head teacher or proprietor was the chair or co-chair
teaching quality was monitored. This was only happening 82% of the time in cases where the CBMC was chaired by a community member. Monitoring of teacher quality was more prevalent in Niger compared to Bauchi, despite Bauchi having more CBMCs chaired by the head teacher or proprietor –
perhaps because more training had taken place in Niger.
The CBMC members reported monitoring teacher attendance by visiting the school and classes during lessons. Actions taken to improve teacher attendance included discussing reasons for absenteeism with teachers and motivating them to be present regularly. For pupil attendance, CBMC
members reported discussing reasons for absenteeism with the pupils and parents, and encouraging parents to send their children to school. It is interesting to note that security- and transport-related issues were not mentioned at all during any of the discussions around absenteeism. Actions taken by
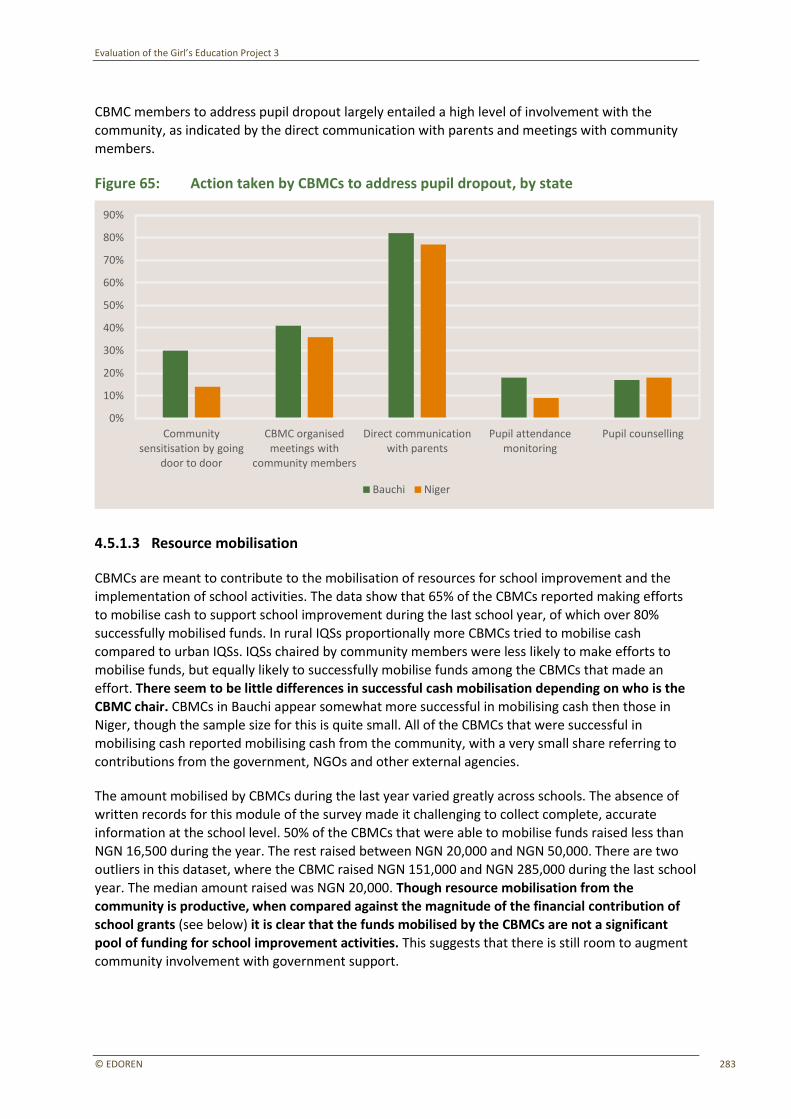
Evaluation of the Girl’s Education Project 3
© EDOREN 283
CBMC members to address pupil dropout largely entailed a high level of involvement with the
community, as indicated by the direct communication with parents and meetings with community members.
Figure 65: Action taken by CBMCs to address pupil dropout, by state
4.5.1.3 Resource mobilisation
CBMCs are meant to contribute to the mobilisation of resources for school improvement and the implementation of school activities. The data show that 65% of the CBMCs reported making efforts to mobilise cash to support school improvement during the last school year, of which over 80%
successfully mobilised funds. In rural IQSs proportionally more CBMCs tried to mobilise cash
compared to urban IQSs. IQSs chaired by community members were less likely to make efforts to mobilise funds, but equally likely to successfully mobilise funds among the CBMCs that made an effort. There seem to be little differences in successful cash mobilisation depending on who is the
CBMC chair. CBMCs in Bauchi appear somewhat more successful in mobilising cash then those in Niger, though the sample size for this is quite small. All of the CBMCs that were successful in mobilising cash reported mobilising cash from the community, with a very small share referring to
contributions from the government, NGOs and other external agencies.
The amount mobilised by CBMCs during the last year varied greatly across schools. The absence of written records for this module of the survey made it challenging to collect complete, accurate information at the school level. 50% of the CBMCs that were able to mobilise funds raised less than NGN 16,500 during the year. The rest raised between NGN 20,000 and NGN 50,000. There are two
outliers in this dataset, where the CBMC raised NGN 151,000 and NGN 285,000 during the last school
year. The median amount raised was NGN 20,000. Though resource mobilisation from the
community is productive, when compared against the magnitude of the financial contribution of school grants (see below) it is clear that the funds mobilised by the CBMCs are not a significant
pool of funding for school improvement activities. This suggests that there is still room to augment community involvement with government support.
Community sensitisation by going
door to door
CBMC organised meetings with
community members
Direct communication with parents
Pupil attendance monitoring
Pupil counselling
0%
10%
20%
30%
40%
50%
60%
70%
80%
90%
Bauchi Niger
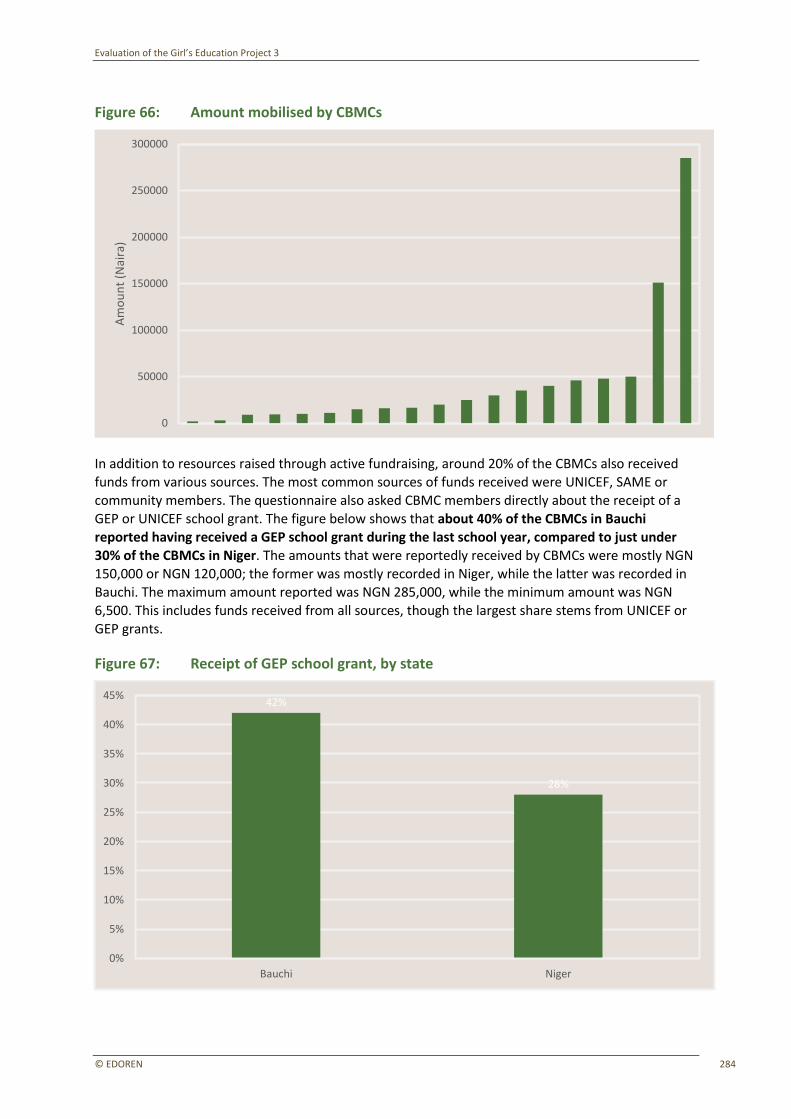
Evaluation of the Girl’s Education Project 3
© EDOREN 284
Figure 66: Amount mobilised by CBMCs
In addition to resources raised through active fundraising, around 20% of the CBMCs also received funds from various sources. The most common sources of funds received were UNICEF, SAME or
community members. The questionnaire also asked CBMC members directly about the receipt of a GEP or UNICEF school grant. The figure below shows that about 40% of the CBMCs in Bauchi reported having received a GEP school grant during the last school year, compared to just under
30% of the CBMCs in Niger. The amounts that were reportedly received by CBMCs were mostly NGN 150,000 or NGN 120,000; the former was mostly recorded in Niger, while the latter was recorded in
Bauchi. The maximum amount reported was NGN 285,000, while the minimum amount was NGN 6,500. This includes funds received from all sources, though the largest share stems from UNICEF or
GEP grants.
Figure 67: Receipt of GEP school grant, by state
0
50000
100000
150000
200000
250000
300000
Am
ou
nt
(Nai
ra)
42%
28%
Bauchi Niger
0%
5%
10%
15%
20%
25%
30%
35%
40%
45%
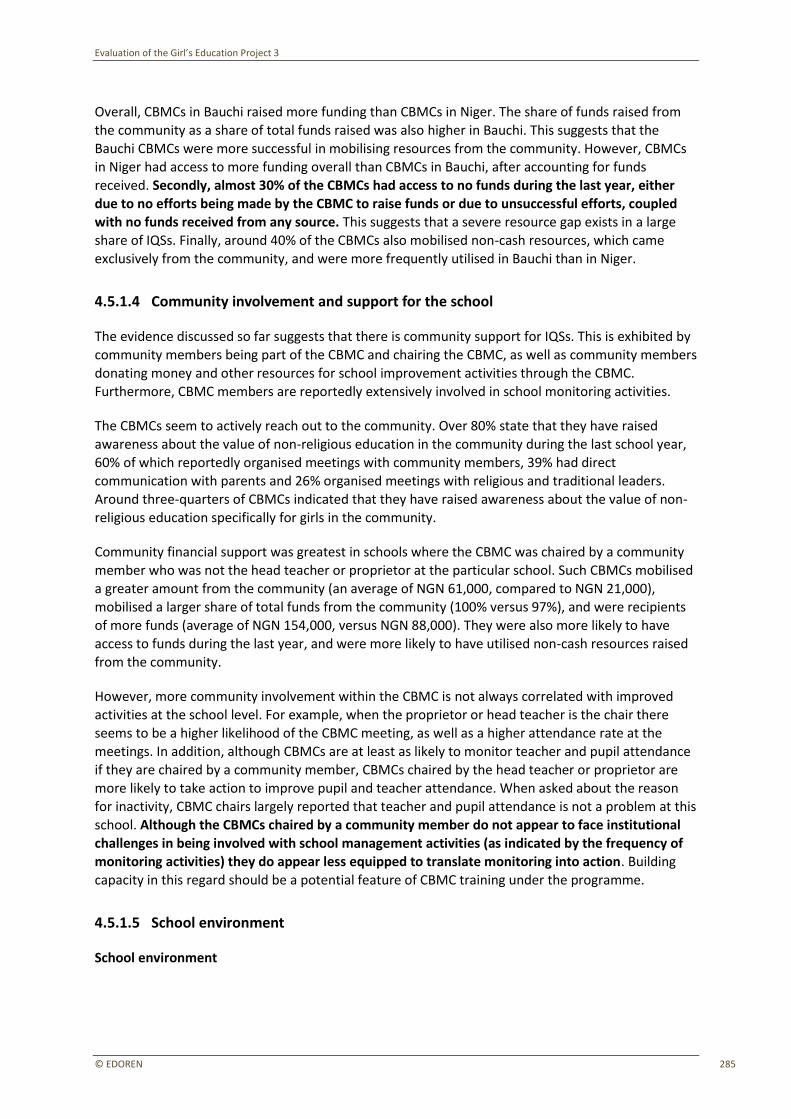
Evaluation of the Girl’s Education Project 3
© EDOREN 285
Overall, CBMCs in Bauchi raised more funding than CBMCs in Niger. The share of funds raised from
the community as a share of total funds raised was also higher in Bauchi. This suggests that the Bauchi CBMCs were more successful in mobilising resources from the community. However, CBMCs in Niger had access to more funding overall than CBMCs in Bauchi, after accounting for funds received. Secondly, almost 30% of the CBMCs had access to no funds during the last year, either
due to no efforts being made by the CBMC to raise funds or due to unsuccessful efforts, coupled with no funds received from any source. This suggests that a severe resource gap exists in a large share of IQSs. Finally, around 40% of the CBMCs also mobilised non-cash resources, which came exclusively from the community, and were more frequently utilised in Bauchi than in Niger.
4.5.1.4 Community involvement and support for the school
The evidence discussed so far suggests that there is community support for IQSs. This is exhibited by community members being part of the CBMC and chairing the CBMC, as well as community members
donating money and other resources for school improvement activities through the CBMC. Furthermore, CBMC members are reportedly extensively involved in school monitoring activities.
The CBMCs seem to actively reach out to the community. Over 80% state that they have raised
awareness about the value of non-religious education in the community during the last school year,
60% of which reportedly organised meetings with community members, 39% had direct communication with parents and 26% organised meetings with religious and traditional leaders.
Around three-quarters of CBMCs indicated that they have raised awareness about the value of non-religious education specifically for girls in the community.
Community financial support was greatest in schools where the CBMC was chaired by a community
member who was not the head teacher or proprietor at the particular school. Such CBMCs mobilised a greater amount from the community (an average of NGN 61,000, compared to NGN 21,000),
mobilised a larger share of total funds from the community (100% versus 97%), and were recipients
of more funds (average of NGN 154,000, versus NGN 88,000). They were also more likely to have
access to funds during the last year, and were more likely to have utilised non-cash resources raised from the community.
However, more community involvement within the CBMC is not always correlated with improved activities at the school level. For example, when the proprietor or head teacher is the chair there seems to be a higher likelihood of the CBMC meeting, as well as a higher attendance rate at the meetings. In addition, although CBMCs are at least as likely to monitor teacher and pupil attendance
if they are chaired by a community member, CBMCs chaired by the head teacher or proprietor are more likely to take action to improve pupil and teacher attendance. When asked about the reason for inactivity, CBMC chairs largely reported that teacher and pupil attendance is not a problem at this school. Although the CBMCs chaired by a community member do not appear to face institutional challenges in being involved with school management activities (as indicated by the frequency of
monitoring activities) they do appear less equipped to translate monitoring into action. Building
capacity in this regard should be a potential feature of CBMC training under the programme.
4.5.1.5 School environment
School environment
Evaluation of the Girl’s Education Project 3
© EDOREN 286
The school environment plays an important role in the learning experience of the pupils, as well as
the teaching experience of the facilitators. We assess the school environment for children along the lines of ‘soft’ infrastructure, which includes groups for pupils to interact with one another, a library, and a playground, as well as ‘hard’ infrastructure, which refers to physical infrastructure.
The IQSs in our sample are almost universally deficient in terms of soft infrastructure. Only 3% of
the schools had a library, defined as ‘a collection of books other than course books’, with no sharp cross-state differences. Only about one-third of the schools had a playground. Where schools had a playground, girls almost always had access to it. In Niger and in urban areas playgrounds were less common. Only 3% of the schools, which amounts to only two schools in the sample, had groups where children could come together and share their concerns. These groups took the form of a
mother group and a teacher–student association. Given the low membership of children in CBMCs this raises again the question of how children’s voices can be represented in decisions to improve the school environment.
In terms of physical infrastructure, schools were also in a poor condition. According to the survey data 90% of the schools are ‘in need of major repairs’, with all of the schools in Bauchi in need of repairs and 80% of the schools in Niger. Only 40% of the schools had an electricity connection, with
more schools in Niger having a connection than schools in Bauchi, despite Bauchi having a higher representation of urban schools where electricity connection is more likely to be available. The share of schools connected to the grid that had electricity on the day of the survey was even lower, at 30%.
Access to drinking water was limited as well, with only 30% of schools having some sort of water source. Of the schools that had a water source, around 90% had water available from the source on
the day of the visit. Across both states, there was an average of two rooms being used for classes on the day of visit. However, around 20% of the IQSs had no classroom structure and an additional 30% of the schools only had one classroom. The schools operating without any formal classroom
infrastructure were concentrated in Bauchi, whereas a large share of schools in Niger (about 50%) only had one classroom.
Less than 25% of the schools had a functioning toilet for pupils, while only 8% of the schools had a separate functioning toilet for girls. However, all the schools that had more than one functioning
toilet for pupils had a separate toilet allocated for female pupils, which suggests that when there is infrastructure available, school management is aware of this need. 22% of the schools had made
security arrangements, such as a fence or boundary wall. A larger share of the schools in Niger (30%) had a fence or other security arrangements compared to only 10% of the schools in Bauchi.
This suggests that the infrastructure situation is quite poor in both the states, and children do not
have access to basic infrastructure such as functional toilets and drinking water at the school. The infrastructure repair needs of schools are shown in Figure 68. This suggests that the two states have
similar needs but that more IQSs in Bauchi are in need of repairs. While IQSs located in urban areas have better access to electricity and water and more IQSs have functioning toilets, the infrastructure is generally in greater need of repair. In IQSs where the proprietor is the head teacher, the
infrastructure situation is relatively worse off. The need for school repairs was also expressed by facilitators. In the facilitator interviews, over 50% of the facilitators agreed with the statement that ‘It is too difficult to teach in this school because the building is in a poor condition’. Given that about 30% of CBMCs reported having no access to funds in the last school year, the likelihood of rapid
infrastructure improvements is limited unless external support is provided. Schools also need additional training on the importance of soft infrastructure. These could be areas that the GEP3
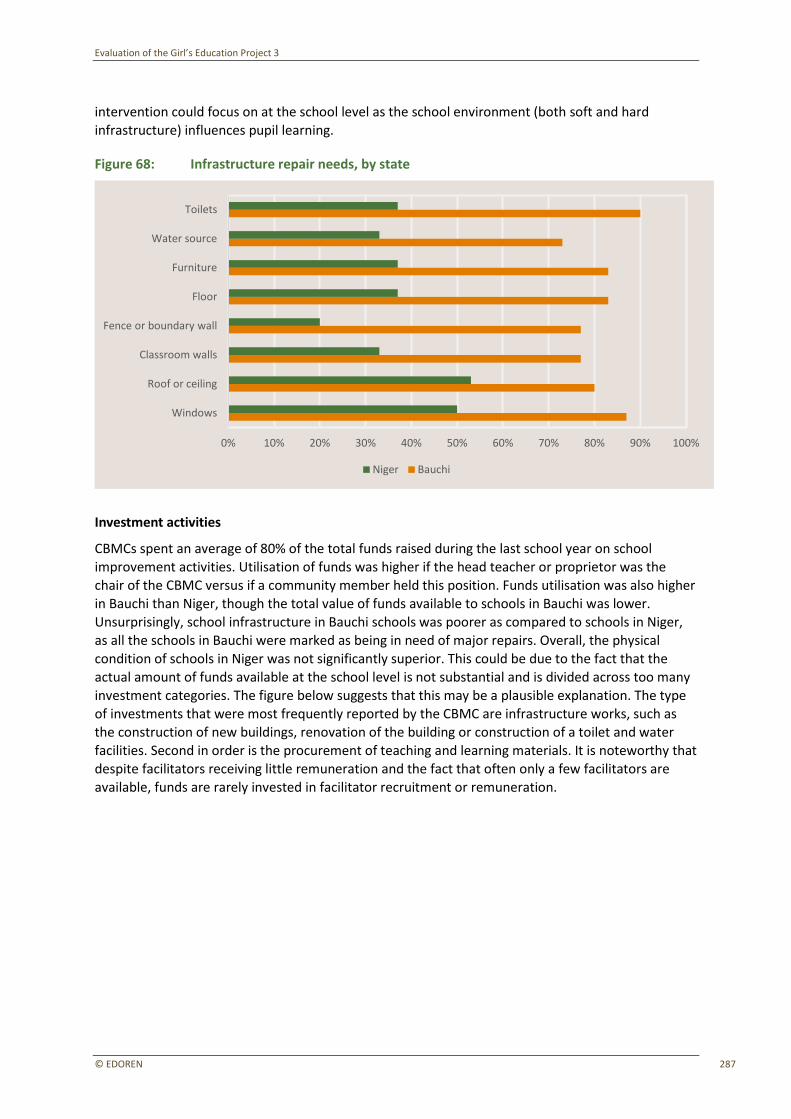
Evaluation of the Girl’s Education Project 3
© EDOREN 287
intervention could focus on at the school level as the school environment (both soft and hard
infrastructure) influences pupil learning.
Figure 68: Infrastructure repair needs, by state
Investment activities
CBMCs spent an average of 80% of the total funds raised during the last school year on school improvement activities. Utilisation of funds was higher if the head teacher or proprietor was the
chair of the CBMC versus if a community member held this position. Funds utilisation was also higher in Bauchi than Niger, though the total value of funds available to schools in Bauchi was lower.
Unsurprisingly, school infrastructure in Bauchi schools was poorer as compared to schools in Niger, as all the schools in Bauchi were marked as being in need of major repairs. Overall, the physical
condition of schools in Niger was not significantly superior. This could be due to the fact that the actual amount of funds available at the school level is not substantial and is divided across too many investment categories. The figure below suggests that this may be a plausible explanation. The type
of investments that were most frequently reported by the CBMC are infrastructure works, such as the construction of new buildings, renovation of the building or construction of a toilet and water
facilities. Second in order is the procurement of teaching and learning materials. It is noteworthy that despite facilitators receiving little remuneration and the fact that often only a few facilitators are available, funds are rarely invested in facilitator recruitment or remuneration.
Windows
Roof or ceiling
Classroom walls
Fence or boundary wall
Floor
Furniture
Water source
Toilets
0% 10% 20% 30% 40% 50% 60% 70% 80% 90% 100%
Niger Bauchi
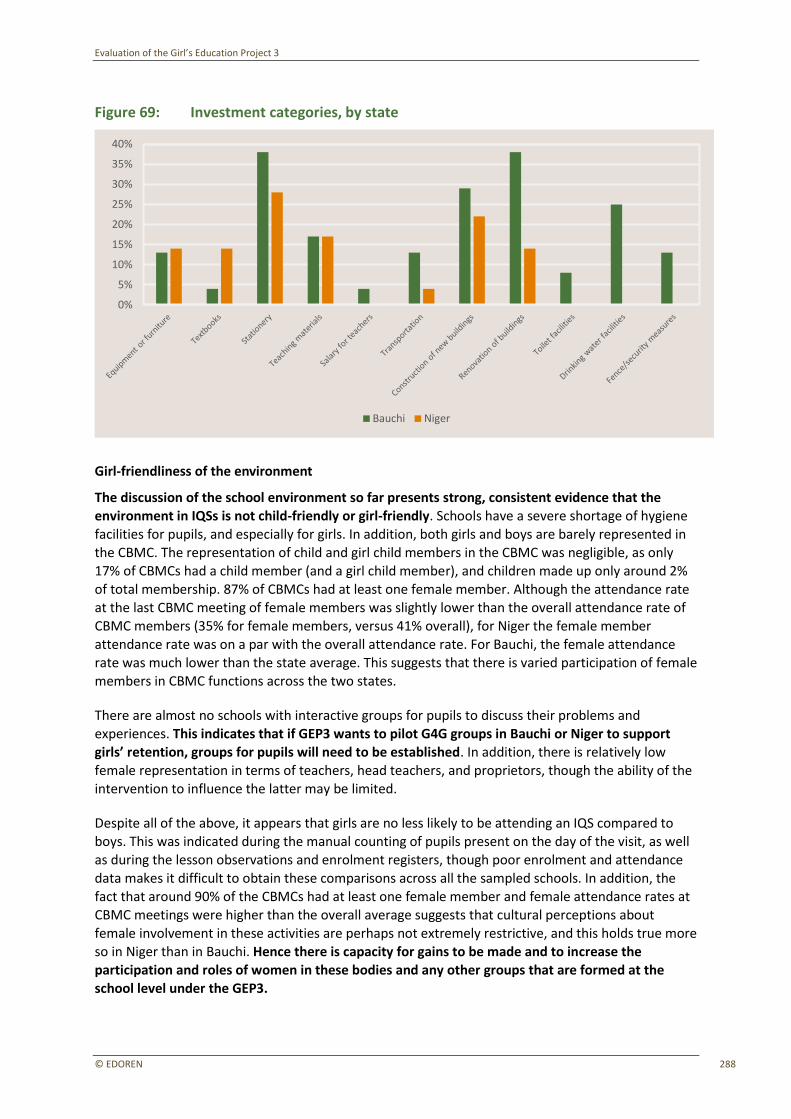
Evaluation of the Girl’s Education Project 3
© EDOREN 288
Figure 69: Investment categories, by state
Girl-friendliness of the environment
The discussion of the school environment so far presents strong, consistent evidence that the environment in IQSs is not child-friendly or girl-friendly. Schools have a severe shortage of hygiene
facilities for pupils, and especially for girls. In addition, both girls and boys are barely represented in the CBMC. The representation of child and girl child members in the CBMC was negligible, as only 17% of CBMCs had a child member (and a girl child member), and children made up only around 2%
of total membership. 87% of CBMCs had at least one female member. Although the attendance rate at the last CBMC meeting of female members was slightly lower than the overall attendance rate of
CBMC members (35% for female members, versus 41% overall), for Niger the female member attendance rate was on a par with the overall attendance rate. For Bauchi, the female attendance
rate was much lower than the state average. This suggests that there is varied participation of female members in CBMC functions across the two states.
There are almost no schools with interactive groups for pupils to discuss their problems and
experiences. This indicates that if GEP3 wants to pilot G4G groups in Bauchi or Niger to support girls’ retention, groups for pupils will need to be established. In addition, there is relatively low
female representation in terms of teachers, head teachers, and proprietors, though the ability of the intervention to influence the latter may be limited.
Despite all of the above, it appears that girls are no less likely to be attending an IQS compared to
boys. This was indicated during the manual counting of pupils present on the day of the visit, as well as during the lesson observations and enrolment registers, though poor enrolment and attendance
data makes it difficult to obtain these comparisons across all the sampled schools. In addition, the fact that around 90% of the CBMCs had at least one female member and female attendance rates at
CBMC meetings were higher than the overall average suggests that cultural perceptions about female involvement in these activities are perhaps not extremely restrictive, and this holds true more so in Niger than in Bauchi. Hence there is capacity for gains to be made and to increase the participation and roles of women in these bodies and any other groups that are formed at the school level under the GEP3.
0%
5%
10%
15%
20%
25%
30%
35%
40%
Bauchi Niger
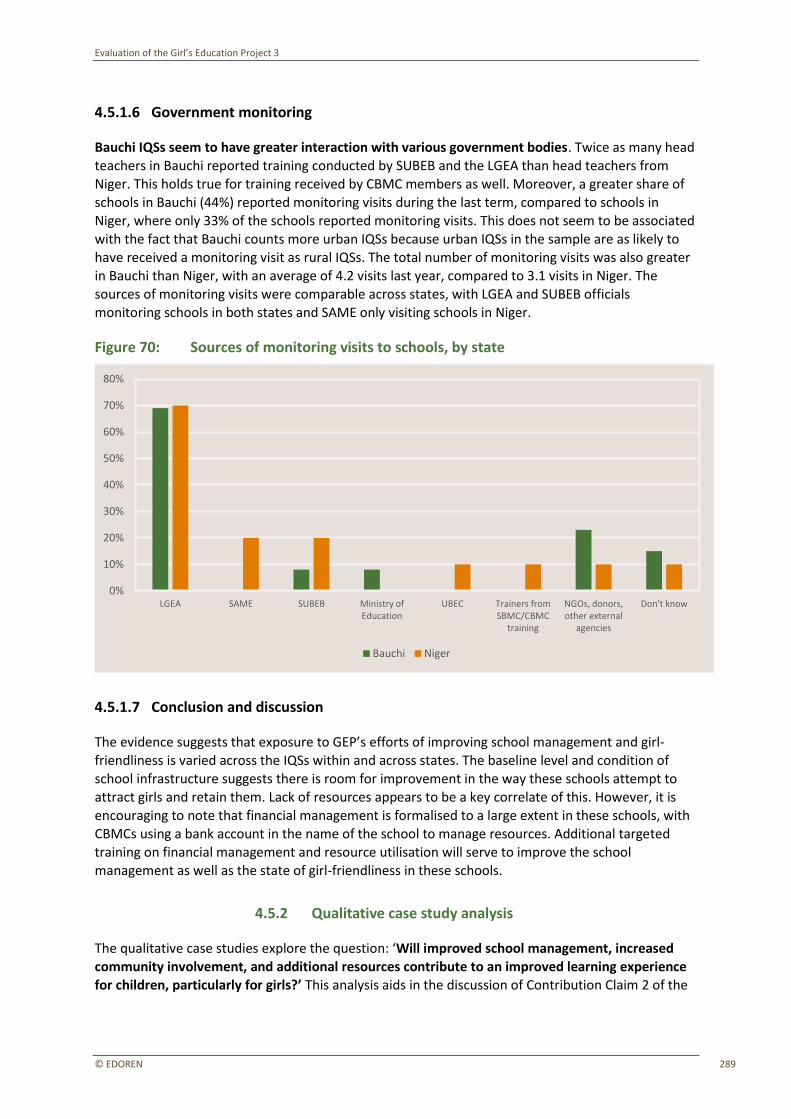
Evaluation of the Girl’s Education Project 3
© EDOREN 289
4.5.1.6 Government monitoring
Bauchi IQSs seem to have greater interaction with various government bodies. Twice as many head
teachers in Bauchi reported training conducted by SUBEB and the LGEA than head teachers from Niger. This holds true for training received by CBMC members as well. Moreover, a greater share of schools in Bauchi (44%) reported monitoring visits during the last term, compared to schools in Niger, where only 33% of the schools reported monitoring visits. This does not seem to be associated with the fact that Bauchi counts more urban IQSs because urban IQSs in the sample are as likely to
have received a monitoring visit as rural IQSs. The total number of monitoring visits was also greater in Bauchi than Niger, with an average of 4.2 visits last year, compared to 3.1 visits in Niger. The sources of monitoring visits were comparable across states, with LGEA and SUBEB officials monitoring schools in both states and SAME only visiting schools in Niger.
Figure 70: Sources of monitoring visits to schools, by state
4.5.1.7 Conclusion and discussion
The evidence suggests that exposure to GEP’s efforts of improving school management and girl-friendliness is varied across the IQSs within and across states. The baseline level and condition of school infrastructure suggests there is room for improvement in the way these schools attempt to attract girls and retain them. Lack of resources appears to be a key correlate of this. However, it is encouraging to note that financial management is formalised to a large extent in these schools, with
CBMCs using a bank account in the name of the school to manage resources. Additional targeted training on financial management and resource utilisation will serve to improve the school management as well as the state of girl-friendliness in these schools.
4.5.2 Qualitative case study analysis
The qualitative case studies explore the question: ‘Will improved school management, increased
community involvement, and additional resources contribute to an improved learning experience for children, particularly for girls?’ This analysis aids in the discussion of Contribution Claim 2 of the
LGEA SAME SUBEB Ministry of Education
UBEC Trainers from SBMC/CBMC
training
NGOs, donors, other external
agencies
Don't know0%
10%
20%
30%
40%
50%
60%
70%
80%
Bauchi Niger
Evaluation of the Girl’s Education Project 3
© EDOREN 290
GEP3 ToC: GEP3’s IQSS contributes to an improved, girl-friendly learning environment. Thus, the
qualitative study explores themes around leadership, management and responsibility, as well as perceptions around what constitutes a girl-friendly school environment. Through FGDs and KIIs, the discussions also considered social relations within the communities, both between school management stakeholders, and between pupils (in particular girls) and school leadership, to analyse
the extent to which school planning processes actively consider girls’ voices.
4.5.2.1 School management – actors, roles and responsibilities
One of the key outputs of GEP3 is enhanced school leadership and management. The qualitative findings show that various stakeholders are involved in the integration process. Community KIs identify community leaders, proprietors, imams, head teachers, teachers, parents and the CBMC as being essential for successful integration. As discussed in the section ‘School leadership: Role of community leaders and stakeholders in management on pedagogical leadership’, it is important to
gain a better understanding of how school leaders and management understand and enact their roles and responsibilities.
School leadership: Role of community leaders and stakeholders in management
In the IQS context, the delegation of responsibilities for integration and running the school is not clear. Instead, stakeholders perceive several actors – who also perceive themselves – to be part of
the successful running of the school, in many cases meaning that management becomes collective. This in turn creates some confusion around who is in charge of what, whose approval is needed and, as such, ‘who has the last word’ when it comes to decision-making. As in the discussion around
pedagogical leadership, ingrained social relations in the communities at times means that the most qualified person is not always the one who is responsible for decision-making and tasks.
School leadership does not only consist of those actively involved with the school, but includes
stakeholders such as community leaders and imams. The embeddedness of IQSs within pre-existing
community structures means that these stakeholders often have influence over the school’s vision, and hold respected leadership positions in terms of guiding community acceptance and the
sensitisation process on issues such as integration. As such, the attitudes of these key figures have a high degree of influence over communities’ acceptance of integration. In all six IQSs visited,
community leaders showed general acceptance of integration, and were in many cases actively involved in school management through positions on the CBMC.
‘They [the CBMC] usually consult me on issues concerning the school and the education of the children. They are aware that once a leader accepts something, he can convince other members of the community and the idea will have wider acceptability.’ (Community leader,
Bauchi lower performing IQS).
In Niger lower performing IQS, the qualitative team was unable to interview the community leader
due to internal political rivalries between the Mallam (the head teacher) and the community leader. The Mallam had recently come out on top in a disagreement, and thus asked the team not to interview the community leader as this might negatively affect the integration process. It was unclear to what extent this would have been the case; however, it gave some insight into the importance of understanding internal power relations for successful interventions. It was clear that
in this case the Mallam had a higher social standing amongst community members and as such had been able to proceed with integration regardless of support (or lack thereof) from the community
Evaluation of the Girl’s Education Project 3
© EDOREN 291
leader. However, in other IQS contexts the attitudes of community leaders appear to have significant
implications for the success of the integration process.
Respondents mainly understand the role of the head teacher in school management as a leadership responsibility that involves advocating for integration and girls’ education. Head teachers carry out some basic functions to fulfil these responsibilities, through speaking to the community156 and
encouraging parents to send their children to school. In this manner, teachers say they report to the head teacher when they have issues with pupil attendance, and the head teacher communicates this to the rest of the community.
‘On issues like pupils absenteeism or late coming we complain to him and he gives his full support to address the matter by announcing in the mosque during prayers, or he sends a
message to the community leader to address the parents and let them know that the teachers are complaining about pupils attendance and by that means we see changes.’ (TPD, Bauchi higher performing IQS)
‘Every society has its culture and tradition, so this community has a culture that does not tolerate the integration of formal education with the Quranic. But at the moment there are series of awareness campaign by the village head and myself via the mosque and we are
enjoying total acceptance now.’ (Mallam, Bauchi typical IQS).
Head teachers do hold authority in many IQSs and are the main people to whom teachers report. The strength of the role relates to the fact that the head teacher is often also the Mallam, and at
times also the proprietor, and thus holds a high status position that is not necessarily associated with, or limited to, ‘head teacher’. The respect and trust given to this institution within the
community – some of which appear to have been established over 100 years ago – seems to be a critical success factor in the integration process, with the position of the Mallam (often a hereditary role) being highly important.
Head teachers tend to have primary responsibility for pupil discipline, with teachers reporting any
misbehaviour to the Mallam (head teacher) for him to ‘sanction’ pupils. The head teacher is also responsible for encouraging facilitators to come to school, and is often the person who has initially asked a member of the community to take on the teacher/facilitator role.
In some cases,157 the majority of the facilitators were also former pupils of the Mallam. Thus, the head teacher has some influence over monitoring facilitator attendance and managing facilitators. As
discussed, pedagogical leadership, the level of qualifications and facilitator experience amongst head teachers varies significantly across IQSs. As such, the level of leadership on academic achievement and facilitator guidance (from a pedagogical standpoint for secular learning) is generally weak. Still, a
more informal process of mentoring appears to be taking place in some IQSs158. In view of some of the relationships that Mallams/head teachers have with facilitators who are ex-pupils, their position
as respected Qur’anic teachers means that facilitators consider their overall guidance to be important and worth listening to.
156 This is in cases where the head teacher is the Mallam. Understandings of ‘head teacher responsibilities’ are thus collapsed with those of the Mallam. 157 Bauchi higher performing and typical IQS, Niger lower performing and typical IQS. 158 Observed in Bauchi high and typical performing cases, and Niger low performing case.
Evaluation of the Girl’s Education Project 3
© EDOREN 292
In some IQSs the head teacher is the main person responsible for delivery of the formal curriculum.
Thus, the head teacher is effectively supposed to monitor themselves, in terms of attendance and performance. The sub-section below on CBMCs’ capacity development further discusses the lack of clear structure around monitoring.
While the responsibilities of key community figures are at times symbolic, they often do hold
positions on the CBMC, and thus actively form part of the school management. Training for CBMCs may have less impact in IQSs where community leaders are part of the CBMC but have not been trained by GEP3. As previously discussed, individuals with experience of formal education and/or school management may not always hold positions of importance. The head teacher in Niger low performing IQS, for example, takes on the responsibilities of pedagogical leadership and chairs the
CBMC, in spite of not having any formal education. Furthermore, religious leadership appears to confer higher social standing than formal educational experience. This may limit the overall contribution of secular head teacher training to improved school management. The importance of existing social structures and norms within the IQS communities mean that GEP3 will need to
consider how to ensure that all relevant stakeholders are included, and for training to especially target those who hold decision-making authority within communities.
CBMCs: Characteristics and functionality
All the IQSs visited have an established CBMC. Most schools created CBMCs because of the integration process. During training stakeholders in the community were instructed to start a CBMC to support integration and girls’ education. In the Niger lower performing IQS, CBMC members say
that they have not received training. Instead, the current CBMC secretary, who has children in the local public primary school and had seen how the SBMC was working there, initiated the CBMC. As
such, there was a spillover effect from the implementation and support of the public primary SBMC to the IQS in this particular community.
‘The reason how the CBMC came about was after the school was built it was basically
Qur’anic school. Then there was nothing like committee, it was just the proprietor that was in
charge of the school. We called on the proprietor and discussed with him, which was how the CBMC came about. You know in everything there is need for having an association, in school if there is association and challenges arises we will know how to go about it, to solve it but if there is no association things might not move smoothly. So for there we appointed the
Chairman, Secretary, Treasurer, etc. We are 12 members in CBMC. The reason why we established this CBMC, firstly, is to solve any challenges that arise in the school. This is the first reason why we established the CBMC; it wasn’t existing in the initial stage.’ (CBMC, Niger lower performing IQS)
However, the functioning of the CBMC varies significantly across schools. In Niger lower performing
and typical IQSs, though the CBMC meets weekly it is unclear what the purpose of these meetings is. Overall, the objectives and role of the CBMC are vague (‘encourage the integration processes’ and ‘plan the future of this school’), especially in terms of planning towards achieving these objectives.
Still, this provides a starting point for capacity building, with CBMCs’ attitudes toward integration appearing to be mostly positive.
CBMC members tend to be a mixture of key stakeholders within the community and parents. In some cases, facilitators also sit on the CBMC. In all IQSs included in the qualitative study the Mallam
holds a key position in the CBMC, such as chairperson. This is important since the Mallam is also often the proprietor and, as such, is actively involved in both resource mobilisation and monitoring.
Evaluation of the Girl’s Education Project 3
© EDOREN 293
There is thus a question around potential conflicts of interest within the IQS structure, and,
furthermore, the extent to which monitoring can be effective when roles and responsibilities tend to be largely overlapping. For example, the presence of the Mallam/head teacher/proprietor within a CBMC could be problematic in cases where that individual is quite dominant, as was observed in the Bauchi typical IQS FGD. Decision-making – such as regarding the use of funds – could easily be
heavily influenced by such an individual. Accountability and transparency can therefore become issues.
The main criteria for being a member of the CBMC is ‘for the person to be responsible and (able to) advise and impact positively when the need arises’ (CBMC, Bauchi higher performing IQS). This does not mean that one has to hold a position of power within the community, only that one is willing to
make the effort and consider the values of the CBMC. One does not have to have children in the IQS, but one needs to understand the importance of education and agree with the programme (GEP/GEP3).
‘It sometimes happen that for you to be a member, it must be seen that you are capable and have been putting in efforts towards improving the programme. It could be that your love for the programme is obvious. That way, you can be co-opted into it.’ (CBMC, Bauchi lower
performing IQS)
CBMCs mostly consider women to be an important resource of the CBMC as they have the potential to convince mothers to send their children to school and to advocate the objectives of
the CBMC to women in the communities. Not all of the CBMCs visited have female members, and in those that do the membership appears to be highly disproportionate, with one or two members out
of 12–17 being female in the lower performing and typical performing IQSs in Bauchi, and in the lower performing school in Niger159. Whilst in the higher performing IQSs in both states women currently hold around a third of membership positions, the Niger typical IQS does not have any
female members at present. As such, the representation of women on CBMCs varies significantly across IQSs. CBMC members described challenges in getting women to join the CBMC. For example,
in Niger lower performing IQS women are generally not actively a part of the public sphere or activities in the community after they get married. Thus, the committee had recently lost a female
member as she had gotten married. This means that there is currently only one female member on the CBMC, and she is the female facilitator of the school. They are not sure how to convince another
woman to join once this facilitator gets married. Thus, gender roles and responsibilities outside of school management affect the extent to which women form an active part of the CBMC. This is in spite of recognising female members as being important in order to achieve the objectives of the
integration. This may prove to be a challenge for the advocacy aspect of the CBMC, and it will be important to consider how to reach women in communities where there are no women being
trained by GEP (either through facilitator training or through being members of the CBMC).
The type of IQS may further affect the functionality of the CBMC. In all the qualitative cases the IQSs are not mobile, and appear to be actively engrained in the community. CBMCs consider this an
important aspect of why they are able to enact their responsibilities, since community members perceive them to be representative of the community in which they are situated. Where an IQS is mobile, this may affect the extent to which a CBMC can be of use. It is also important to note that if an IQS is mobile, girls’ learning will likely cease completely (as girls do not travel with the Mallam)
unless it is arranged that the IQS facilitator remains behind and continues teaching the girls and
159 It was difficult to establish the exact membership and gender distribution of CBMCs as schools apart from Niger high performing IQS did not keep a members registry.
Evaluation of the Girl’s Education Project 3
© EDOREN 294
remaining boys who did not move. In that instance, the IQS facilitator would likely be on her/his own
without the head teacher/Mallam. The Mallam not being present could weaken the CBMC’s effectiveness.
CBMC: Perceptions of main tasks, responsibilities and capacity constraints
In the six IQS cases, CBMC members generally understand their role and responsibilities, but have weak capacity to enact these. The qualitative research found that CBMCs see their roles as broad –
covering a wide range of responsibilities, from resource mobilisation to advocacy of the importance of education. CBMCs mainly see their role as involving identifying why children are not enrolled and learning, and to ‘solve’ these problems. However, CBMCs argue that they lack the funds to see these solutions through and state ‘we can do better’. Moreover, CBMCs appear willing to take on new skills and tasks. Several times during FGDs, CBMC members would say ‘we will do this more now since you
have asked us it’ (Niger lower performing IQs), in response to, for example, questions on whether they meet with parents. CBMCs and other stakeholders perceive the main responsibilities of the
CBMC to be:
• increasing awareness of the importance of education;
• ensuring attendance of pupils and teachers through problem-solving and monitoring;
• resolving problems together with community stakeholders; and
• improving school infrastructure.
A main responsibility of the CBMC is increasing the awareness of the importance of education for both boys and girls. Since the CBMCs visited as part of the qualitative study all had key community
stakeholders as members, in many regards they operate as ‘mini village councils’. CBMCs thus discuss all problems related to education (including religious education). Since community and
religious leaders are key in calling meetings with the community and in advocating for the integrated curriculum and girls’ education, the involvement of these figures and their acceptance of proposed
changes is essential for the CBMC to be able to fulfil its role.
‘We visit and discuss with them, telling them that if we allow the children to get enrolled it
translated into something meaning for the whole community in the future, telling them that the benefits may not be immediate but perhaps in the future. As such, they should help the
children by allowing them to be enrolled so that they can reap both the worldly benefits and the benefits in the hereafter.’ (CBMC Niger, lower performing IQS)
CBMCs generally feel that they are doing a good job, but believe they could do better if they faced fewer capacity constraints. Respondents see lack of funds to improve infrastructure and to pay facilitators as the main challenges. The perception is less of parents being unwilling to contribute
funds, but more that parents have limited funds to give. The fact that one of the key reasons why parents send their children to IQSs appears to be due to poverty and an inability to afford to send children to the public primary school supports this. These findings suggest that resource mobilisation
beyond the GEP3 grants may be volatile and variable, especially in cases where CBMCs rely on philanthropy/rich community members in the city, or even political philanthropy.
CBMCs report being aware of the challenges concerning not paying facilitators, since this may affect both facilitator and pupil attendance. They are also aware of the difficulty of mobilising resources
from parents. However, they lack the capacity to solve these challenges. Being either privately run by a proprietor or by the community these IQSs rely more on resource mobilisation than public primary

Evaluation of the Girl’s Education Project 3
© EDOREN 295
schools160. By relying on contributions from community members who may not have funds to give,
there is a risk that the work of CBMCs will diminish as ‘external resources’ run out.
‘Concerning raising of fund, we use to tell the children to bring 100 Naira whenever they resume from sallah break. But just few, about 10 pupils were able to pay since we resumed from the last sallah break which was several months ago.’ (CBMC, Bauchi typical IQS)
In the Niger higher performing IQS the CBMC asks parents to contribute in any way they can: ‘We have made contributions. Each of us was requested to bring either wood, nails or zinc, which we did. (Girls’ FGD). These non-monetary contributions, whilst important, are not sufficient as regards paying facilitators, which respondents perceive to be the main financial issue:
‘Our major problem is money; we do not have sufficient funds to support the school the way we
want to. There is even no money to give the teachers in order to motivate them. They just volunteer.’ (CBMC, Bauchi higher performing IQS)
CBMCs further consider promoting facilitator attendance and performance to be part of their responsibilities. However, as CBMC members monitor facilitator performance without having prior teaching experience and lack of guidance, monitoring often becomes simply symbolic. As one CBMC member stated: ‘We also carry out visits (school visits), although we have no lesson goals at that
time’ (CBMC, Bauchi typical IQS). Nevertheless, stakeholders consider monitoring by CBMCs to be useful, perceiving that it motivates pupils and parents by demonstrating that community leaders and key stakeholders take education seriously.
CBMCs in all schools believe that they would be better able to monitor facilitators, and hold them to account, if they were able to pay them a salary. This would also enable the IQS to attract
qualified facilitators. This is particularly challenging when there are not enough qualified facilitators within the community161, creating the need for the CBMC to incentivise people from outside the community to teach at the IQS, or at least to reimburse their travel costs.
‘We also talk about teachers. We want more teachers brought who can teach formal subject.
As for the Arabic, there is no problem. For the formal subject teacher it is not consistent. Sometimes he will come and some other time, he will not come. If we have people who can devote their time to us, it will guarantee better quality.’ (CBMC, Bauchi lower performing IQS)
Thus, CBMCs all state that one of their main tasks is raising funds for the facilitators. However, there is an implicit conflict here as CBMCs acknowledge that parents have limited capacity to contribute
funds. CBMCs see this as something that support from ‘externals’ must solve.
However, CBMCs do not necessarily invest funds exclusively for formal curriculum facilitators. In Bauchi higher performing IQS, formal facilitators come from the public primary school and are, as
such, paid salaries for their regular government day jobs, although they still work voluntarily in the IQS. The CBMC hence mobilises resources in order to pay the Arabic teachers but not the formal
facilitators:
160 Haq and Islam (2005). 161 By ‘qualified’ is meant someone who can read and write, or someone who has some years of formal education.
Evaluation of the Girl’s Education Project 3
© EDOREN 296
‘You know there are 10 teachers for Islamic studies in this school and we donate some money
during the CBMC meeting to support these teachers…because they don’t have government jobs.’ (TPD, Bauchi higher performing IQS)
Another key responsibility of CBMCs is dealing with pupil absenteeism. CBMCs perceive the issue of pupil absenteeism to be multifaceted, although they see it as rooted in parents not understanding
the importance of formal education. CBMCs all perceive their responsibilities as including explaining the purpose of formal education to parents, and taking the time to sit down with parents to make sure they understand this. CBMCs in many of the IQSs visited hence go from house to house to contact parents. In cases where a CBMC has female members they will go and speak to mothers.
‘They [the CBMC] are really helping us in that they encourage our parents to always send us to
school and not send us on errands that could prevent us from coming to school.’ (Girls, Bauchi higher performing IQS)
Methods used by CBMCs to ensure that children attend school also include ward heads mobilising pupils to come to school (in Niger higher performing IQS), youth monitoring groups being formed to promote attendance (Bauchi higher performing IQS), and CBMC members speaking to parents of children who are often absent (Niger lower performing IQS). In Niger typical IQS, the CBMC has
decided to make coming to school compulsory. When parents do not comply, the CBMC has the authority to physically fight the parents and bring children to school: ‘It is compulsory to comply. Such parents, we talk to them and we can even force on such parents because we fight them.’ (CBMC,
Niger typical IQS)
However, respondents perceive pupil absenteeism to be a consequence of poverty. Parents often
require children to work or look after younger siblings, and thus they bear an opportunity cost if the send their children to school. To solve this, the Niger typical IQS sees the school much as a community day care centre, where all children go, so that parents can still go to the farm. This may
negatively affect learning, as children of all ages (including babies and toddlers) are present: ‘When
school is happening all the children of the community are in school.’ (CBMC, Niger typical IQS)
In order to motivate pupils, CBMCs in both higher performing IQSs ‘test pupils’ and provide gifts for those who perform best. Rewarding pupils is seen as a way of encouraging parents to send their
children to school. The Niger lower performing IQS asks children to come up on stage during community gatherings and recite the ‘a, b, c’, with the idea that this will make parents proud and will
motivate them to send their children to school. In Niger lower performing IQS a main issue identified was the location of the IQS. Pupils had to cross a road with heavy traffic to access the school, which prevented parents from letting their children attend the IQS. Members of the CBMC therefore stand
and stop the traffic to help pupils cross before and after school, in order to increase attendance. In most cases, CBMCs thus act as ‘problem solvers’, identifying reasons for pupil absenteeism and
solving them.
Lastly, CBMCs perceive themselves as being responsible for school infrastructure and improving the
learning environment162. All IQSs have made efforts to improve the physical school environment, either through constructing a school or through purchasing mats, kettles etc. However, in some cases there are questions about whether CBMCs use funds in the best possible manner. In the Bauchi typical performing IQS, the CBMC used resources to purchase a truck-load of sand to level the ground, in order to combat rainfall erosion that had created slopes, leading to pupils sitting
162 See further discussion in Section 2.2.2 on gender considerations in school management.
Evaluation of the Girl’s Education Project 3
© EDOREN 297
uncomfortably. However, the sand had once again eroded, resulting in a return of the uneven slope.
The CBMC had used no funds to erect a roof of some sort, leaving pupils unprotected from the rain and the sun. This raises questions regarding what informs CBMCs’ decisions regarding spending funds, and thus raises question about their decision-making capacity.
CBMCs: Capacity development
As discussed above, CBMC members are willing and able to take on new skills, knowledge and ways
of working. However, the situations CBMCs face in IQSs, in terms of the socioeconomic context and level of qualifications (as well as navigating engrained social norms), means that they face a range of practical challenges when it comes to mobilising resources effectively. These contextual constraints may need to be considered in order to target capacity building in resource mobilisation. Evaluating the efficiency and effectiveness of a CBMC thus needs to take into account the context within which
it operates. In this sense, CBMCs cannot be easily compared with SBMCs in public primary schools. Moreover, CBMCs tend to be highly embedded in the school structure: they deal with aspects of
religious education and general community wellbeing, in addition to aspects of integration. Because
of this broader remit, CBMCs will likely be engaged not only in discussing and managing IQS matters, but also a blend of both Quranic and secular learning, as well as community issues external to education matters.
In some IQSs visited, CBMCs had received training on gender sensitisation and the importance of formal education. Some CBMCs (for example Niger typical IQS) referred to having received training on how to spend allocated funds. The qualitative data show that CBMCs implement activities based
on what training content they have received, but the lack of resources and clarity around roles and responsibilities of various stakeholders limits the enactment of tasks and responsibilities. As the
quote below exemplifies, the perceptions around training received were that if CBMCs started implementing integration activities, support was likely to come further down the line.
‘They taught us a lot I can remember only few. First they told us the importance of formal
education in our Qur‘anic study and to be in tune with the world. If the melody changes, the
dance should also change. We the Mallams should also give our support by allowing children to go to school, and we agreed. They said it is very likely at the end the government will give their support. So we decided to find teachers to teach these formal subjects since we are not educated though I am not among the uneducated because I am educated but since I found
myself teaching the Qur’anic knowledge, I accepted it but I teach Hausa also. I got an English teacher but I had wished the government could take the responsibility. Then I got Mallam Anas, a mathematics teacher, since I do not now know how to calculate…They said the parents should support…They do support according to their strength but the school does not receive any funds, it just 10 Naira in a week. They also said the children should be cared for and not to
be beaten, now you don’t see my teachers carry cane.’ (CBMC (Mallam), Bauchi typical IQS)
CBMC capacity will remain a critical issue for GEP3. The extent to which GEP3 plans to focus on further CBMC capacity building beyond what has already occurred could be critical if this aspect of
the ToC is to follow its desired causal path. CBMCs appear to need further training, going beyond their duties in regard to sensitisation and developing more their capacities in monitoring and ensuring the active support of girls’ education in IQSs. This can include training on how to engage with the facilitators in regard to their attitudes and teaching behaviours, and a greater sense of
accountability on the part of the CBMC to ensure a girl-friendly learning environment. The challenges the LGEA face in monitoring all of the IQS also means that follow-through on CBMC effectiveness is
Evaluation of the Girl’s Education Project 3
© EDOREN 298
difficult, with each IQS operating in what appear to be largely unstructured and contextually driven
circumstances.
4.5.2.2 Attitudes and involvement of parents
The qualitative case studies found parents to be supportive of integration and the associated efforts by school leaders and management. The perceptions are that the provision of training to CBMC members and mini-grants to the IQSs contributes to increased community involvement in and support for the IQSs. It is worth noting that there was a selection bias in the parents spoken to since
the Mallam would gather a group of parents to take part in the FGD.163 Moreover, in some IQSs the qualitative team spoke to no mothers, as it would have been inappropriate within the cultural context. In contrast, in the Niger higher performing IQS the team only spoke to mothers since fathers were away on market day during the qualitative visit. From the various discussions with school leaders and management, as well as pupils, it is clear that IQSs rely on community involvement and
support in order to function. As discussed, the IQSs’ embeddedness within social structures means that support from the Mallam and other religious authorities, as well as from community leaders, seems vital for successful integration. The active support of these respected individuals, in turn,
helps tremendously in garnering support from parents.
‘I am the owner of the school and it bears my name, but I don’t claim ownership. I am a stakeholder and the community leader. CBMC and other members of the community are all
stakeholders that ensure a smooth running of the school.’ (Mallam, Bauchi higher performing IQS)
‘We meet the teachers to tell them our worries, as they also tell us theirs and together we rub
minds for solution.’ (Parents, Bauchi typical IQS)
Communication between parents and the IQS seems to function well. In cases where the CBMC or
head teacher have issues with pupil absenteeism or resources they call parents to meetings to either discuss the importance of education or for the CBMC to request funds. In several IQSs parents report
having been involved in deciding how to spend grants received. As such, there seems to be a high
level of communication between schools and communities. This communication happens through pre-arranged meetings between CBMCs and parents, through meetings at the mosque between head teachers and parents, as well as through one-to-one discussions between head teachers or CBMCs and parents. Parents report having no problems in speaking to head teachers. This appears to be related to the fact that the head teacher is often a religious authority. It appears common for
parents to ask about children’s schooling after prayer has finished. The importance of the mosque as a meeting point means that community members frequently interact with each other. This creates opportunities for parents to engage with school leaders and management.
Moreover, CBMCs actively involve parents in order to deal with pupil absenteeism. Parents in all IQSs report that the CBMC and/or head teacher has asked them to monitor whether their children go to
school by asking children what they learn when they get home, and by walking children to school
163 At midline, it will be important to strategise how best to avoid this selection bias. This could potentially be done by approaching the CBMC more broadly in order to seek participants for the parent FGD – this would take the decision-making out of the hands of one individual. However, this may still be subject to selection bias, so, if possible, an alternative could be to gather the whole community as part of an introductory session, and ask for volunteers to raise their hands from there. If IQSs have introduced an attendance list at the time, it may also be possible to randomly sample both pupils and parents through these lists.
Evaluation of the Girl’s Education Project 3
© EDOREN 299
and/or checking in with facilitators to see that children attend school. Parents in all FGDs report
regularly asking facilitators or the Mallam if their children attend, and at times asking their children what they have learnt in school. Moreover, in the Bauchi higher performing IQS the CBMC has started a ‘vigilante group’ to ensure that pupils can walk safely to school and to monitor attendance. Pupil absenteeism might be an indirect indicator of community support for schools, and CBMCs and
facilitators report the main issue in this regard being parents not understanding the value of education. However, the IQS context is complex. Though children may not regularly attend formal classes in the IQS, this does not mean they do not attend public primary schools. Moreover, the perception is that socioeconomic reasons (as discussed) are the main reason why children do not attend school, and pupil absenteeism does not necessarily mean that parents do not support the IQS.
‘We do ask them (children) questions once in a while about what they are learning in the school, according to our level of understanding. There is a small girl that we observed doing well in maths. Sometimes we even check their books. As parents, we individually send and make sure that the kids come to school to learn. We meet and discuss with the teachers and
then advise appropriately about the way forward as far as the school is concerned.’ (Parents, Bauchi lower performing IQS)
However, not all parents are equally involved in the activities of the IQS. Some parents actively engage in school activities, and form part of the CBMC, whilst ‘some don’t care’ (Parents, Niger lower performing IQS). Although parents may be involved in decisions, and actively engage with
discussions, that does not necessarily mean that they have decision-making power. Since the Mallam often has high status, through being the proprietor, the head teacher, a CBMC member and a
religious authority, his decision-making authority tends to be strong: ‘Our participation is limited. You know he decides because he is the imam and is well respected.’ (Parents, Niger lower performing IQS). Furthermore, one school in Bauchi (lower performing) has pupils who attend from outside the
community, who come from as far away as Niger State and stay for years. It is not clear who is responsible for the attendance, and for monitoring the learning, of those pupils whose parents are
not present in the community.
Moreover, the involvement of men and women differs significantly depending on the IQS context. As
discussed in Section CBMCs: Characteristics and functionality, men currently make up the majority of CBMC membership in all schools visited. In cases where women are present they tend to have fewer
formal positions, and only in one case (Niger higher performing IQS) did a woman hold a named position (treasurer). In the Niger lower performing and typical IQS, only men attend meetings when the IQS calls parents to meet: ‘No, they (women) don’t come to the meetings; we in the village are
strict when it comes to this. We keep them at home.’ (Niger, lower performing IQS). Consequently, in this case women are only involved through the active engagement of the one female CBMC member
but, as discussed in Section CBMCs: Characteristics and functionality, this might no longer be possible once the women marry. In most cases, women are thus reliant on the information they receive through their husbands and other men in the family.
In Niger higher performing IQS women are more involved, and even make up a significant number of CBMC members. The proprietor of the school is female, and is perceived to be an ‘elder sister, or mother’ to the community. Since the IQS is in her house, it is indeed easier for mothers to be actively involved in the IQS. Moreover, this IQS also runs formal education classes for married women and
thus women are present in the school, as compared to other IQSs where women are more confined to the private sphere of the household.
Evaluation of the Girl’s Education Project 3
© EDOREN 300
‘Actually, it is this good thing she started. That made us to know her and it is because of the
trust that has been established between us and the training our children get that we have given her our children to train and educate. Our children come here to be taught and they are taught good behaviours. We are very happy, we trust each other and we have been living peacefully. We mothers see her as an elder sister, some as a mother and we have become like
one family now.’ (Niger, higher performing IQS)
4.5.2.3 Perceived community support
Across all six IQS visited parents and key community figures report providing some form of support to the school. The qualitative research found that the perceptions around support are not limited to financial contributions, but encompass moral support and trust.
‘The wider community is trying. The people appreciate my efforts and contributions towards
the education of their kids, by praying for me and patting me on the back. I also appreciate their contributions and concern towards the school.’ (Mallam, Bauchi high-performing IQS)
Parents in all cases report providing some sort of financial support to the IQS, mainly through
contributing towards paying facilitators ‘a token’. They are aware of not being able to contribute as much as required, but attribute this to poverty rather than to a lack of willingness. Parents highlight
that they support the schools in other ways, either through monitoring the attendance of children, providing advice, or through carrying out community works that benefit the school.
4.5.2.4 LGEA support and monitoring
Government authorities and ‘externals’ are perceived to be the main actors responsible for providing further support to the IQS.
‘Yes, they (the LGEA) came to see us; they met even with the community leader. That is why we
counselled the teachers the other time, for them to be patient. The visitors went to the district head and reiterated the same details. And emphasised that perhaps in the future whoever is
involved may be employed to be paid fully. That is the way it is…’ (CBMC, Niger lower performing IQS)
Respondents report that LGEA officials or ‘government’ rarely or never visit the IQS (apart from in
Niger higher performing IQS). The LGEA officers interviewed as part of the qualitative analysis confirmed this. They perceive the challenge of attempting to visit 30 schools and more on a regular
basis to be unmanageable, given the distances concerned, the lack of transportation in many cases, and their workloads. Furthermore, more funds are said to have been promised from the LGEA but not received. The CBMC in Niger lower performing IQS says they have never received support. By contrast the respective LGEA officer said that all schools have received grants. The CBMC in this case does not have a bank account. Generally, communities view support from the government
negatively, considering government actors to be unreliable164. Still, the view is that the government should be providing facilitators: if an IQS does all that is asked of it, then this should be recognised
through financial support or support of facilitators. If the perception is that no major support is to come, this may have implications for community attitudes towards integration.
164 Niger higher performing IQS is an exception here, reporting having several visits from the LGA and having ‘government members’ as part of their CBMC.
Evaluation of the Girl’s Education Project 3
© EDOREN 301
LGEA officers’ engagement with communities – when it occurs – appears to follow a similar formula.
The head teacher/Mallam/proprietor is the primary entry point for engagement with the IQS, the CBMC, and the community at large. Officers in Bauchi spoke of receiving monthly reports from the IQS. It appears that these occur through actual visits to the school by the officer himself, who would then compile a report based on discussions and meetings with stakeholders in the community. Given
the challenges faced in reaching all the schools on a regular basis, this makes the regularity of these reports and their contribution to efficiently monitoring and supporting the IQS a significant challenge. The effectiveness of what takes place when LGEA officials make these visits is also a concern, as articulated here:
‘Under my role, the challenges I have found is those schools that were selected are hard to
reach. Whenever there is an important issue, we want to discuss, we have to prepare time, but I cannot reach them on time. Then to have communication with them – they do not have network service – I have to trek, or take vehicle from my LGA down to the community. Then whenever I organise a meeting with the community members to discuss an important issue
about education, most of the parents or community members don’t like to attend, thinking [that] the government is giving something, and we don’t want to give it out, [but] they always want to get something whenever they are called to a meeting.’ (Bauchi LGEA officer, typical
case
LGEA officers also see their role as providing supervision and advice on teaching and management
practices, and offering instruction and correction based on their observations:
‘You know, when we visit, and we find out that they are not carrying out the activities
successfully, we will advise them, or still re-train them. Maybe in the method of teaching they are not going straightforward, or they are leaving some tactics or methods, either in evaluation, either in methodology…if they leave some[thing out], we will remind them. We will
tell them that is the way they should do it”. (LGEA officer, Bauchi typical case)
4.5.2.5 School experience for (girls) children
The qualitative research in the six IQSs across six districts offers insights into some of the experiences of girl children, and highlights some of the constraints that girls may face in attending an IQS. This is by no means representative of the challenges and experiences of all girls attending IQSs in the GEP3 states, but provides hints as to areas where gender considerations are important for programming.
The FGDs with pupils (boys and girls separately) asked children to describe their typical day in school,
and to discuss the ways in which they interacted with their classmates and facilitators. Both boys and girls say that the environment is friendly for all children, and that since they teach them to relate well to each other there are few problems.
However, during FGDs and in QCOs, girls (in all IQSs apart from the Niger higher performing IQS)
were significantly quieter than boys were. Girls often whispered answers or hid behind their hijabs. Whilst boys would immediately highlight their knowledge, girls would give ‘yes and no’ answers and would take a lot longer to warm up and share their perspectives.
In the classrooms visited, girls sit at the back, or boys and girls sit on separate sides of the classroom. Neither boys nor girls perceive this to be an issue since ‘the Mallam has told us this is the way he wants us to sit’ (Girls, Niger lower performing IQS). When asked, girls say they would like to sit in the
Evaluation of the Girl’s Education Project 3
© EDOREN 302
front but that this is ‘not the way it is done’. In the Bauchi typical IQS, the school is located outside
and children sit on a slope, with children further away from the blackboard sitting at lowers levels of the slope. In this case, the practice of seating girls at the back of the class directly undermines their ability to see the blackboard: ‘Where the girls sit, water has eroded the place’ (TPD).
Pupils brought up these issues of shyness and seating arrangements as perceived differences
between boys and girls, especially in the FGDs with boys. Boys interpreted girls’ shyness as a sign that boys are more intelligent than girls are – because boys answer questions in school more often than girls do. Boys perceive girls to be distracted and ‘not interested in school, but only think of marriage’ (Boys, Niger lower performing IQS).
“Between the boys and the girls who expresses more freedom in class?
The boys are freer.
I do not know how they feel.
Why?
Because they are shy
They are not supposed to behave like the boys do.’
(Boys, Bauchi higher performing IQS)
In some of the qualitative cases, girls perceive the facilitator to be more considerate of boys and to get angry if girls answer too many questions in class (Niger lower performing IQS). The perception that girls are ‘shyer’ may directly relate to the attitudes of facilitators towards boys and girls. In the
Niger higher performing IQS girls were as active and vocal in class as boys were, and considered
themselves in the FGD to be more intelligent than boys. In the other IQSs, girls would quietly giggle in response and boys would answer clearly that they were definitely more intelligent.
The case of the Niger higher performing IQS highlights the effect of the presence of a strong female
role model. In this case, girls said that of course girls were more intelligent because ‘look at Mallama’ (Niger, higher performing IQS). This IQS has a female proprietor who is a strong character in the
community and who runs the school and manages facilitators. She is also the most qualified in terms of formal education, and speaks fluent English. This clearly created a sense of confidence, not only amongst the girls, but also amongst mothers, believing that their daughters could go on to study and
become ‘like Mallama’ (Parents, Niger higher performing IQS). The presence of a strong female role model thus seems important.
However, the fact that an IQS has female facilitators does not necessarily mean that girls will display a higher level of confidence. The two IQSs visited in Niger (lower and higher performing),
which had female facilitators, showed the most evident differences, both in facilitators’ attitudes towards girls and girls’ agency in the classroom. Thus, it may be more important that the facilitator has positive attitudes towards girls and that she is also empowered within the school, than that the facilitator is female.
All IQSs visited use some corporal punishment. Pupils perceive ‘flogging’ as the main thing they dislike about school and that deters them from attending school. The level of openness around

Evaluation of the Girl’s Education Project 3
© EDOREN 303
corporal punishment varies significantly between IQS cases. In some schools, facilitators and
stakeholders report never using corporal punishment, whilst children say they are flogged or beaten when they misbehave or are too loud (Niger lower performing IQS). In other cases, facilitators are open about the use of corporal punishment and consider it an appropriate way of disciplining pupils. In these schools, CBMCs said that one of their responsibilities is to speak to facilitators about better
ways of disciplining children (Bauchi, typical IQS). In the Bauchi typical IQS, the Mallam/head teacher reported that the use of the cane no longer took place. However, the maths facilitator openly spoke of using it. This indicates that while the understanding at the leadership level is there, the practice has yet to be curbed. The reasons for this lack of translation into practice are unclear. In the higher performing IQS, facilitators say they do not use corporal punishment unless they really have to: ‘I
hate doing it, beating them is the last resort I fall back to’ (TPD, Niger higher performing IQS). Still, some pupils speak of beatings if they speak Hausa in school when they should be speaking English, or if they make too much noise. Interestingly, all pupils consider public primary schools as less of a safe space: ‘Nobody canes us here but at the formal school they cane us and that discourage us from attending lessons there’ (Boys FGD, Bauchi higher performing IQS). It will be interesting to explore
further at midline alternative means of disciplining children. Several respondents mention learning in training that they are not to beat children since it will deter them from attending school. This
appears to have been acted upon to some extent.
In most IQSs visited, girls lack the space to play. The perceptions are that boys have more freedom
to play, though girls express a wish to play the way boys do. One aspect related to this is security. Some schools in Bauchi complain about the lack of a fence around the IQS, and issues of boys
disturbing and distracting girls from reading (CBMC, Bauchi higher performing IQS). This issue further has the potential to affect instructional time. Though respondents say girls end school at the same time as boys, the perception is that it is dangerous for girls to attend late sessions, and this is
resulting in less instructional time.
Both boys and girls report being uncomfortable in school, and some IQSs lack access to facilities
such as running water, toilets and shade. In both higher performing IQSs there are bathroom facilities available for both boys and girls. However, these are not considered sufficient and pupils
say that boys often go in the bush whilst girls ‘go back home to ease themselves’ (Boys, Bauchi higher performing IQS). In Bauchi lower performing and typical IQSs respondents say that girls can use the
facilities in the Mallam’s house. However, there are contrasting accounts of whether or not this takes place in practice.
‘The challenges that boys and girls face in this school is that during lessons a child may want to
ease himself but you know for boys it is easier for them to find where to ease themselves, but for a girl she cannot ease herself anywhere. She needs a good place which we don’t have.’
(TPD, Bauchi typical IQS)
In Niger lower performing and typical IQSs girls do not have any bathroom facilities but return home to ease themselves. There is a recognition of this as an issue, since when girls go home they rarely
come back to school, leading to girls missing large parts of classes.
4.5.2.6 Gender considerations in school management
‘So girls should have a good environment where they can ease themselves and also a good place to seat.’ (TPD, Bauchi typical IQS)
Evaluation of the Girl’s Education Project 3
© EDOREN 304
There is evidence to suggest that large differences in schools’ cultures have an influence on girls’
educational performance and their agency in demanding gender equality165. Ensuring gender responsiveness across cross-school systems, structures and processes seeks to address institutional cultures in a manner that will promote girls’ education. This includes not only teaching and the curriculum, but also communication, management structures, and premises.166 Untherhalter et al.
(2014) identify separate toilet facilities for boys and girls, and efforts to change the institutional culture through advocacy and capacity building, to be important means of creating a girl-friendly school.
One can thus group aspects of girl-friendly learning environments into two broad categories: institutional and infrastructural. Institutional cultures – accepted traditions and behaviours within a
school context – are critical in the transfer of gender norms that can either benefit or negatively affect girls’ education. Infrastructural realities refer to the recognition of girls’ specific needs (including biological need), and in particular issues related to safety and accepted social norms.
In the IQSs visited, school leaders were willing to reflect on and consider gender equity in school planning. CBMCs, as mentioned, say that one of their main responsibilities is to increase awareness of the importance of formal schooling for both boys and girls. In all IQSs in the qualitative sample,
CBMC say they actively work to sensitise parents and to convince them to send their children to school. Several CBMCs consider mothers to be the main opponents of this change. They note the need to be patient, and to allow this change to occur – when mothers will realise the value of
education for all children. The role of mothers as a barrier to girls’ education critically relates to the economic realities of their income-generating and poverty alleviation activities.
‘The main way CBMC is assisting in the women aspect is that we have some challenges with some parents. Some children may desire to come to school, but their mothers will hinder them by sending them on various errands. What we do is go from house to house to sensitise our
fellow women on the importance of education.’ (CBMC, Bauchi lower performing IQS)
Some CBMCs, such as the CBMC for Bauchi higher performing IQS, also highlight the importance of female role models. The idea here is that if women are encouraged to become members of the CBMC, and girls see their mothers playing an active role on the CBMC, this will encourage them to
stay in school. In spite of engrained gender differences in all the communities visited, respondents report that changes have occurred: ‘Let me tell you, see these women? Before we only greet casually,
but look at them now. Among us. Interacting with us. This kind of thing was not possible before.’ (CBMC, Bauchi higher performing IQS)
There is an awareness that institutional cultures may affect girls’ learning outcomes: for example, the
tradition of having girls sit at the back of the class. In discussion with facilitators and CBMCs some participants reported that seating arrangements in class may be unfavourable for girls. However,
there is a fear of mixing boys and girls in the classroom for several reasons. One is that it is simply not what Islamic teachings say. Secondly, it is feared that there will be inappropriate relations between boys and girls if they are seated together. If girls sit at the front of the classroom this would
further allow boys to watch them from behind.
‘Why I feel there would be problem is because boys and girls relationship. A boy will touch a girl just to look for her trouble, so that is why it is good to separate the boys from the girls with
165 Untherhalter et al. (2014). 166 Atthill, C and Jha, J (2009) The Gender Responsive School: An Action Guide, Commonwealth Secretariat.

Evaluation of the Girl’s Education Project 3
© EDOREN 305
different seating space and without touching each other. So even if the teacher is not around
they sit in that position. Every girl with her space and every boy with his space.’ (CBMC, Bauchi typical IQS)
In the Niger typical IQS, the school has responded to this issue by constructing two rooms in the new school building, one for girls and one for boys. By separating boys and girls in this manner, girls will
be able to sit up front, closer to the board, whilst still not mixing with the boys. The perception is that this would solve the issue. However, this may have several implications. For example, the facilitator may not give as much attention or effort to teaching the girls. Still, it may have a positive impact, since girls might perceive a separate classroom to be a safer space for learning. This will need further exploration at midline – if the community does in fact complete the building and implement
the new segregated teaching.
CBMCs appear to have considered the attendance and retention of girls when allocating resources. All IQSs report that they are willing to invest community resources in schooling infrastructure that
benefits girls. CBMCs perceive a key challenge for girls’ attendance to be lack of uniforms. Several of the IQSs in Niger either provide (Niger higher performing IQS) or have started to provide (Niger typical and lower performing IQSs) school uniforms (Hijabs) to girls. However, in Niger typical IQS,
the funds only sustained about 15 pupils receiving uniforms, and thus the CBMC decided that it was better to allow children to wear anything to school, so that the children who did not receive uniforms would not feel bad. Girls agree that uniforms would make them feel encouraged to come to
school.
Other perceived needs for creating a girl-friendly environment are building toilets and providing
water in school – recognising that these facilities (in particular, toilets) are more essential for girls than for boys. Some IQSs have also invested in kettles (‘tea pots’)167. Girls report kettles/’tea pots’ as being something they need in order to go to the toilet: ‘if one asks permission from the teacher, if she
has nothing with her, she will have to go like that’ (Girls, Bauchi higher performing IQS) – meaning that she will have to go without a water container. However, though IQSs may allocate resources to
invest in facilities and means that could improve the learning environment for girls it will be essential at midline to explore the extent to which these are actively reserved for and used by girls. For
example, communities also use kettles/’tea pots’ in ablutions prior to prayer, so there is a potential that boys will have priority usage of kettles/’tea pots’ and that nonewill be available for girls to use.
Given safety concerns, distance to school is particularly important for girls. Some communities report challenges with boys coming to the school and harassing the girls. In one community, the CBMC has started a vigilante group of parents that monitor the school and even walk girls home. Still, the
qualitative team observed boys asking a facilitator to deliver a message to the school proprietor: ‘no matter how much vigilante the Mallam brings to guide the school we will still see those girls’ (Bauchi,
higher performing IQS). This underlines the challenges of ensuring safety for girls.
167 What is refered to as ‘kettles’, is a basic ‘tea pot’. These are filled with water for girls to use them when they go to the bathroom. They are also used for ablution prior to prayer.
Evaluation of the Girl’s Education Project 3
© EDOREN 306
4.6 Analysis of the data - Contribution Claim 3: More effective teaching of formal subjects and an improved, girl-friendly school environment contribute to improved learning levels, particularly among girls
This section focuses on the baseline data of pupils learning outcomes in IQSs, and factors that influence learning outcomes. We will pay particular attention to learning outcomes for girls. The qualitative findings also discuss factors that influence retention, a secondary outcome in the ToC.168 The quantitative data analysis is presented first, followed by the analysis of the qualitative case study
findings.
4.6.1 Quantitative analysis
4.6.1.1 Pupils in IQSs
Number of pupils in IQSs
Data collection on school enrolment suggests that the gender ratio in IQSs is quite balanced. Both girls and boys seem to be attending IQSs, and this holds true across both states. Given the low number of schools that had formal enrolment records (only 30%), these data could only be collected
for a small share of the sample, hence this finding cannot be taken as representative of the sample as a whole. Rather, it should be viewed as a description of the state of some schools and not be used to
generalise findings. The lack of formal record-keeping, as well as the fluid organisation and timing of classes, proved to be a real challenge in regard to obtaining formal information on school operations within IQSs. The pupil gender ratio, i.e. the ratio of enrolled girls to boys, was found to be slightly
higher than one for the schools as a whole, and in early grade enrolments. This suggests that there are at least as many girls enrolled in IQSs as there are boys. This holds across both states, with figures
being slightly more in favour of girls in Bauchi. However, given the sample size issues in this indicator,
we cannot report absolute values or significance values.
To address the data limitation imposed by a lack of enrolment records, we also collected data on pupil attendance on the day of the visit, through a manual counting exercise of all the pupils studying integrated subjects in P2 or the equivalent level on the day of the visit. These data exist for almost all the schools, and show that just as many girls as boys were attending integrated subject classes in
IQSs on the day of the visit. This is an interesting finding, which supports targeting IQSs as a means of educating girls. However, there is the continued risk that the attendance on the day of the survey is not representative of what happens at the school on a daily basis since there was an incentive for schools to misrepresent this information. Efforts were made to mitigate this risk, but it is not possible to address this completely. It is also interesting to note that the gender ratio was slightly higher in
Bauchi and in cases where the proprietor doubled as the head teacher, as well as where the head teacher was trained.
The number of pupils registered for integrated subject classes range from as few as 20 to as many as 400 children at all levels in the school. Of this, the majority are at the early grade level, i.e. P1–P3 level. Across states, a slightly higher share of Niger schools had enrolment above 100 pupils compared to schools in Bauchi.
168 The enrolment data available in the IQS were not of sufficient quality to quantitatively report on retention.
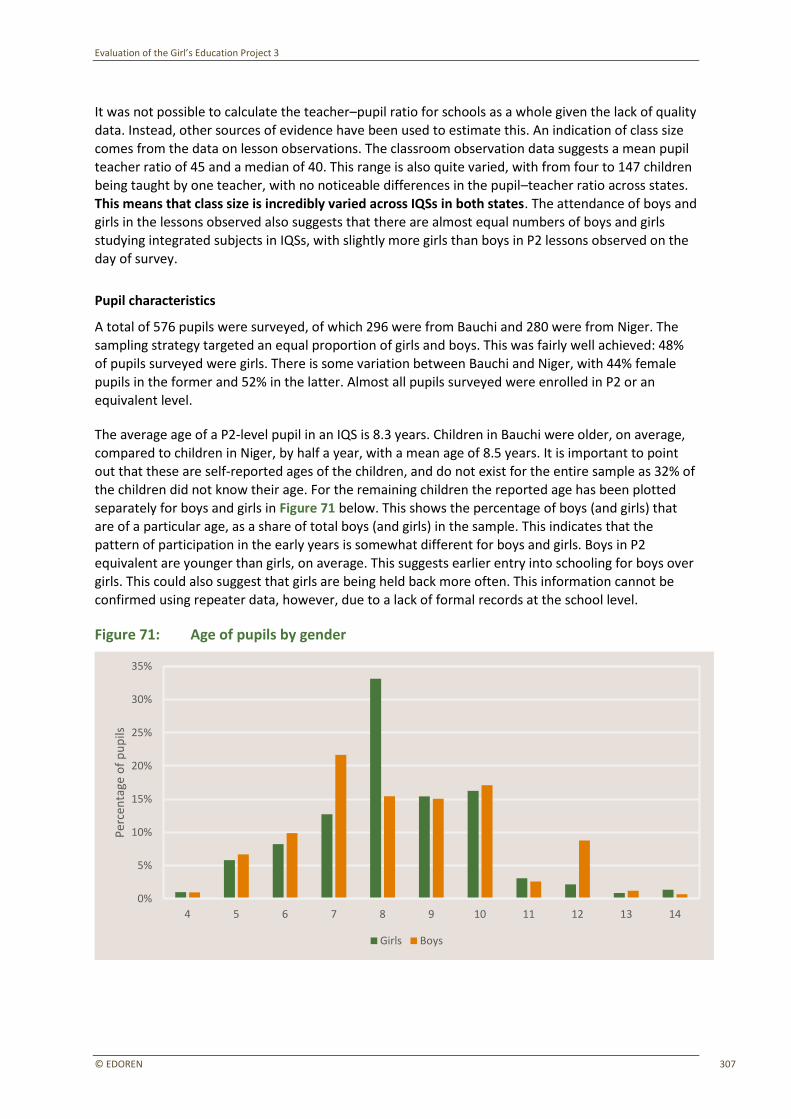
Evaluation of the Girl’s Education Project 3
© EDOREN 307
It was not possible to calculate the teacher–pupil ratio for schools as a whole given the lack of quality
data. Instead, other sources of evidence have been used to estimate this. An indication of class size comes from the data on lesson observations. The classroom observation data suggests a mean pupil teacher ratio of 45 and a median of 40. This range is also quite varied, with from four to 147 children being taught by one teacher, with no noticeable differences in the pupil–teacher ratio across states.
This means that class size is incredibly varied across IQSs in both states. The attendance of boys and girls in the lessons observed also suggests that there are almost equal numbers of boys and girls studying integrated subjects in IQSs, with slightly more girls than boys in P2 lessons observed on the day of survey.
Pupil characteristics
A total of 576 pupils were surveyed, of which 296 were from Bauchi and 280 were from Niger. The
sampling strategy targeted an equal proportion of girls and boys. This was fairly well achieved: 48% of pupils surveyed were girls. There is some variation between Bauchi and Niger, with 44% female
pupils in the former and 52% in the latter. Almost all pupils surveyed were enrolled in P2 or an
equivalent level.
The average age of a P2-level pupil in an IQS is 8.3 years. Children in Bauchi were older, on average, compared to children in Niger, by half a year, with a mean age of 8.5 years. It is important to point
out that these are self-reported ages of the children, and do not exist for the entire sample as 32% of the children did not know their age. For the remaining children the reported age has been plotted separately for boys and girls in Figure 71 below. This shows the percentage of boys (and girls) that
are of a particular age, as a share of total boys (and girls) in the sample. This indicates that the pattern of participation in the early years is somewhat different for boys and girls. Boys in P2
equivalent are younger than girls, on average. This suggests earlier entry into schooling for boys over girls. This could also suggest that girls are being held back more often. This information cannot be confirmed using repeater data, however, due to a lack of formal records at the school level.
Figure 71: Age of pupils by gender
4 5 6 7 8 9 10 11 12 13 14
0%
5%
10%
15%
20%
25%
30%
35%
Per
cen
tage
of
pu
pils
Girls Boys
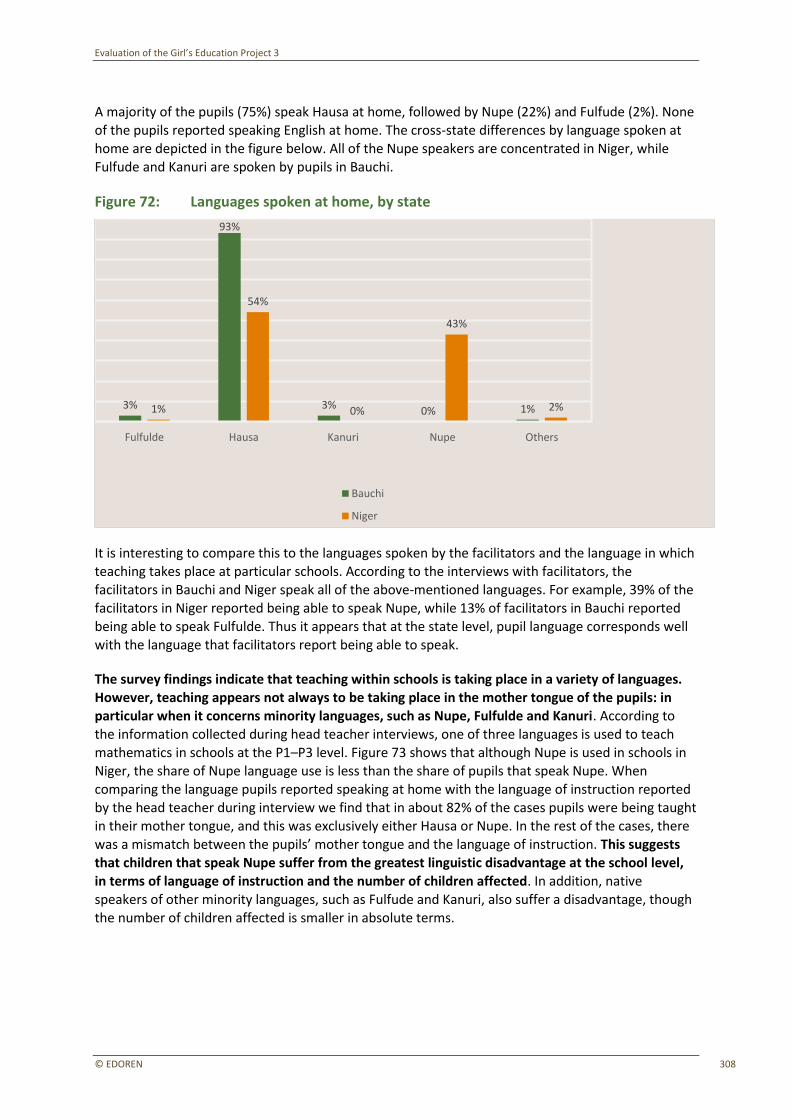
Evaluation of the Girl’s Education Project 3
© EDOREN 308
A majority of the pupils (75%) speak Hausa at home, followed by Nupe (22%) and Fulfude (2%). None
of the pupils reported speaking English at home. The cross-state differences by language spoken at home are depicted in the figure below. All of the Nupe speakers are concentrated in Niger, while Fulfude and Kanuri are spoken by pupils in Bauchi.
Figure 72: Languages spoken at home, by state
It is interesting to compare this to the languages spoken by the facilitators and the language in which
teaching takes place at particular schools. According to the interviews with facilitators, the facilitators in Bauchi and Niger speak all of the above-mentioned languages. For example, 39% of the
facilitators in Niger reported being able to speak Nupe, while 13% of facilitators in Bauchi reported
being able to speak Fulfulde. Thus it appears that at the state level, pupil language corresponds well
with the language that facilitators report being able to speak.
The survey findings indicate that teaching within schools is taking place in a variety of languages.
However, teaching appears not always to be taking place in the mother tongue of the pupils: in particular when it concerns minority languages, such as Nupe, Fulfulde and Kanuri. According to
the information collected during head teacher interviews, one of three languages is used to teach mathematics in schools at the P1–P3 level. Figure 73 shows that although Nupe is used in schools in Niger, the share of Nupe language use is less than the share of pupils that speak Nupe. When comparing the language pupils reported speaking at home with the language of instruction reported by the head teacher during interview we find that in about 82% of the cases pupils were being taught
in their mother tongue, and this was exclusively either Hausa or Nupe. In the rest of the cases, there was a mismatch between the pupils’ mother tongue and the language of instruction. This suggests that children that speak Nupe suffer from the greatest linguistic disadvantage at the school level,
in terms of language of instruction and the number of children affected. In addition, native speakers of other minority languages, such as Fulfude and Kanuri, also suffer a disadvantage, though the number of children affected is smaller in absolute terms.
3%
93%
3%0% 1%1%
54%
0%
43%
2%
Fulfulde Hausa Kanuri Nupe Others
Bauchi
Niger

Evaluation of the Girl’s Education Project 3
© EDOREN 309
Figure 73: Language of instruction, by state
Almost all of the pupils in the sample could hear, see, speak and write. Only one pupil was visually impaired, and four were unable to write. All five of these were male pupils. This could perhaps
indicate that parents are not sending disabled children to school, though there is no way to verify this indication.
A look at household asset ownership, as reported by children, suggests that children in IQSs across
the two states come from households that have basic assets, like mats, chairs, beds or mattresses, more frequently than from households with luxury assets, like computers, cameras, air conditioning
and TV. This is not surprising given that poverty is prevalent in these areas. Cross-state differences
suggest that children in Bauchi come from houses that have slightly better asset ownership than
children in Niger, as depicted by greater ownership of basic assets as well as luxury assets. However, the share of the population that owns luxury assets is so low overall that this difference is unlikely to
translate into substantial differences across the two samples. For example, only 8% of the Bauchi pupil sample reported owning either a computer or camera, while this is 4% and 5%, respectively, in
Niger.
Pupils’ school experience
Pupils in the IQS sample were asked if they currently attended another school. It is surprising to see that 40% of the children reported currently attending another school in addition to the school at which they were surveyed. This is not restricted to schools that teach integrated subjects. The
percentage of pupils attending another school does not change by pupil gender. The cross-state difference is significant, however: 72% of pupils in Bauchi reported currently attending another
school, compared to only 13% of pupils in Niger. In the case of Bauchi this other school mostly referred to a public primary school, while in Niger this was only the case for half the pupils attending
another school – hence the other school could also refer to another religious schools, a vocational training school or any other private school. The cross-state difference is party driven by the urban–rural difference: about 70% of the students in urban areas were attending another school, compared to around 35% of the students in a rural area. The fact that pupils are attending other schools, particularly in Bauchi, is important to note because it may affect the time that they have available
50%
100%
0%
67%
66%
17%
Mathematics is taught in English
Mathematics is taught in Hausa
Mathematics is taught in Nupe
Percentage of schoolsNiger
Bauchi
Evaluation of the Girl’s Education Project 3
© EDOREN 310
to attend the integrated curriculum classes, and it indicates that a substantial share of IQS pupils
have access to formal education through a channel other than the GEP-supported IQSs. This is likely to have implications for the improvements in learning attributable to the programme, as pupil learning of integrated subjects will also be influenced by their attendance at other schools that teach integrated subjects during the course of the evaluation.
Only a very small percentage of pupils reported difficulties in getting to school. Less than 4% indicated that they experience difficulties in getting to school, and this did not vary across state or pupil gender. Of those who reported difficulty, the majority reported traffic and danger in crossing roads as the main difficulty. Long distances to get to school and hazardous terrain through which to travel were the only other difficulties mentioned, by less than 20% of the sample that reported a
difficulty. This suggests that the IQSs are accessible and well located in the communities.
A small share (only 6%) of the sampled pupils were boarders at the IQSs. As expected, boys made up a larger share of this than girls. 12% of the boys and only 1% of the girls were boarding students. A
greater share of pupils in Bauchi (10%) were boarders compared to children in Niger (3%). This is in line with the school-level data, which suggest that a larger share of schools in Bauchi were boarding schools and were closer to the traditional IQS operational structure.
4.6.1.2 Student learning outcomes
Learning outcome measurement
The Hausa literacy assessment is designed to test the same literacy knowledge and skills as the English literacy assessment. Items are not merely translated, but rather parallel items are developed to test similar concepts when applied to the Hausa language. The English literacy assessment contains 13 items, with each item being made up of several sub-items.
The assessment tests a range of literacy knowledge and skills across the pre-literacy, emerging and basic literacy ranges. Knowledge and skills included letter recognition, phonological knowledge, print concepts, oral literacy, verbal comprehension, initial sounds and letters, reading high frequency words, verbal and written grammar, writing high frequency words, reading fluency, and copying and spelling high frequency words.
English literacy and Hausa literacy assessments were constructed following five steps, including clarifying constructs, test targeting, administration, psychometric analysis, drawing benchmarks and secondary data analysis.
As stated earlier in this report, learning outcomes are the result of a complex and multivariate school system, and teacher and student factors, which are influenced by social and economic considerations. The ways in which these factors interact are complex and can never be fully mapped
or accounted for in an analysis. Therefore, student learning outcomes need to be interpreted with care. For example, one of the most important predictors of learning outcomes is what the pupils bring with them into the classroom. Intellectual, social and cultural factors, as well as household-
specific factors, significantly predict pupil performance in most standardised assessments (Hartas 2011, Outhred and Beavis 2012, Outhred and Beavis 2013, Mayer, 1997, Dahl and Lochner 2005, Van der Ber 2015). Therefore, while comparisons of learning outcomes between students from different schooling systems can answer important equity questions, caution needs to be exercised when
drawing causal inferences.
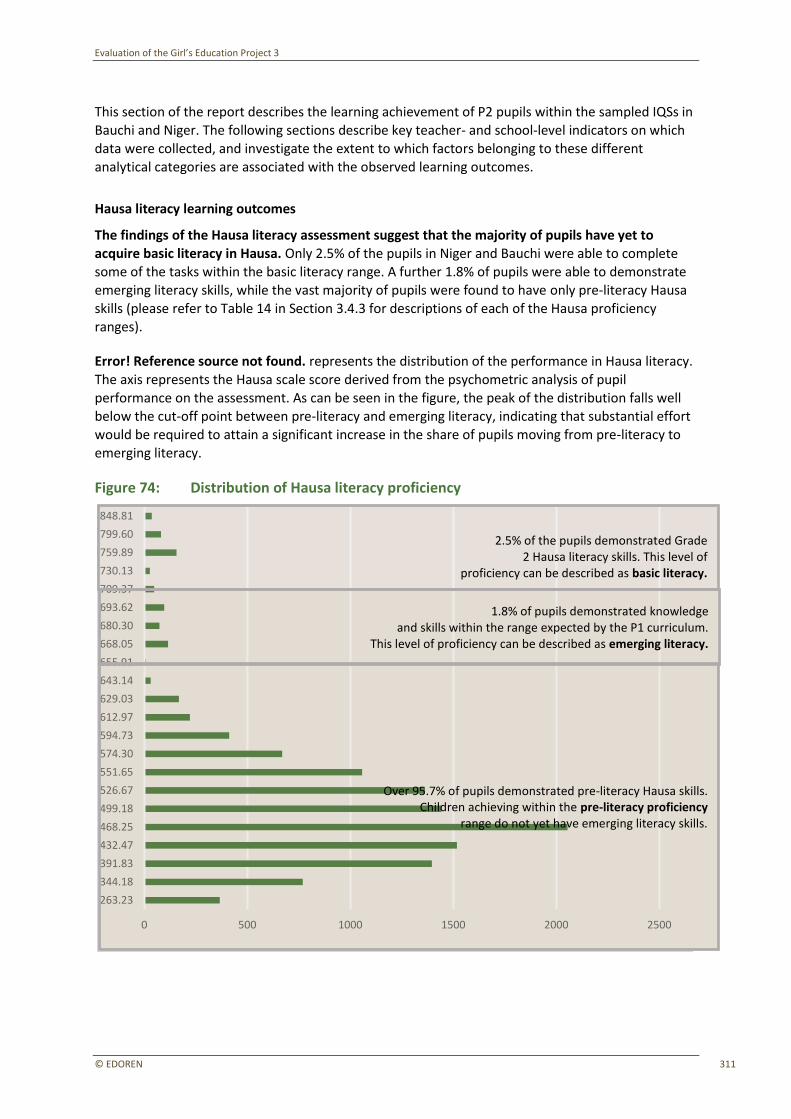
Evaluation of the Girl’s Education Project 3
© EDOREN 311
This section of the report describes the learning achievement of P2 pupils within the sampled IQSs in
Bauchi and Niger. The following sections describe key teacher- and school-level indicators on which data were collected, and investigate the extent to which factors belonging to these different analytical categories are associated with the observed learning outcomes.
Hausa literacy learning outcomes
The findings of the Hausa literacy assessment suggest that the majority of pupils have yet to
acquire basic literacy in Hausa. Only 2.5% of the pupils in Niger and Bauchi were able to complete some of the tasks within the basic literacy range. A further 1.8% of pupils were able to demonstrate emerging literacy skills, while the vast majority of pupils were found to have only pre-literacy Hausa skills (please refer to Table 14 in Section 3.4.3 for descriptions of each of the Hausa proficiency ranges).
Error! Reference source not found. represents the distribution of the performance in Hausa literacy.
The axis represents the Hausa scale score derived from the psychometric analysis of pupil performance on the assessment. As can be seen in the figure, the peak of the distribution falls well
below the cut-off point between pre-literacy and emerging literacy, indicating that substantial effort would be required to attain a significant increase in the share of pupils moving from pre-literacy to emerging literacy.
Figure 74: Distribution of Hausa literacy proficiency
263.23
344.18
391.83
432.47
468.25
499.18
526.67
551.65
574.30
594.73
612.97
629.03
643.14
655.91
668.05
680.30
693.62
709.37
730.13
759.89
799.60
848.81
0 500 1000 1500 2000 2500
2.5% of the pupils demonstrated Grade
2 Hausa literacy skills. This level of proficiency can be described as basic literacy.
1.8% of pupils demonstrated knowledge and skills within the range expected by the P1 curriculum.
This level of proficiency can be described as emerging literacy.
Over 95.7% of pupils demonstrated pre-literacy Hausa skills. Children achieving within the pre-literacy proficiency
range do not yet have emerging literacy skills.
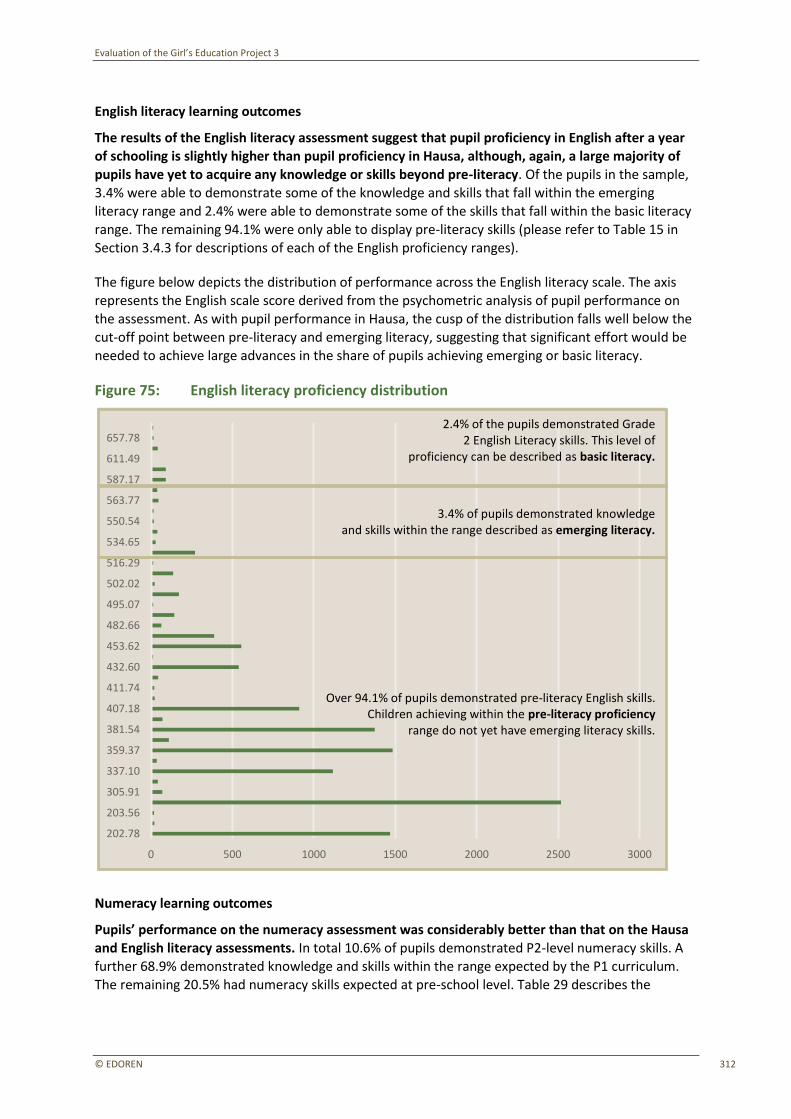
Evaluation of the Girl’s Education Project 3
© EDOREN 312
English literacy learning outcomes
The results of the English literacy assessment suggest that pupil proficiency in English after a year of schooling is slightly higher than pupil proficiency in Hausa, although, again, a large majority of pupils have yet to acquire any knowledge or skills beyond pre-literacy. Of the pupils in the sample, 3.4% were able to demonstrate some of the knowledge and skills that fall within the emerging literacy range and 2.4% were able to demonstrate some of the skills that fall within the basic literacy
range. The remaining 94.1% were only able to display pre-literacy skills (please refer to Table 15 in Section 3.4.3 for descriptions of each of the English proficiency ranges).
The figure below depicts the distribution of performance across the English literacy scale. The axis represents the English scale score derived from the psychometric analysis of pupil performance on the assessment. As with pupil performance in Hausa, the cusp of the distribution falls well below the
cut-off point between pre-literacy and emerging literacy, suggesting that significant effort would be needed to achieve large advances in the share of pupils achieving emerging or basic literacy.
Figure 75: English literacy proficiency distribution
Numeracy learning outcomes
Pupils’ performance on the numeracy assessment was considerably better than that on the Hausa and English literacy assessments. In total 10.6% of pupils demonstrated P2-level numeracy skills. A
further 68.9% demonstrated knowledge and skills within the range expected by the P1 curriculum. The remaining 20.5% had numeracy skills expected at pre-school level. Table 29 describes the
202.78
203.56
305.91
337.10
359.37
381.54
407.18
411.74
432.60
453.62
482.66
495.07
502.02
516.29
534.65
550.54
563.77
587.17
611.49
657.78
0 500 1000 1500 2000 2500 3000
Over 94.1% of pupils demonstrated pre-literacy English skills. Children achieving within the pre-literacy proficiency
range do not yet have emerging literacy skills.
2.4% of the pupils demonstrated Grade 2 English Literacy skills. This level of
proficiency can be described as basic literacy.
3.4% of pupils demonstrated knowledge and skills within the range described as emerging literacy.
Evaluation of the Girl’s Education Project 3
© EDOREN 313
knowledge and skills of pupils achieving within each of the proficiency ranges. These proficiency
ranges are also directly comparable to the ESSPIN CS proficiency ranges.
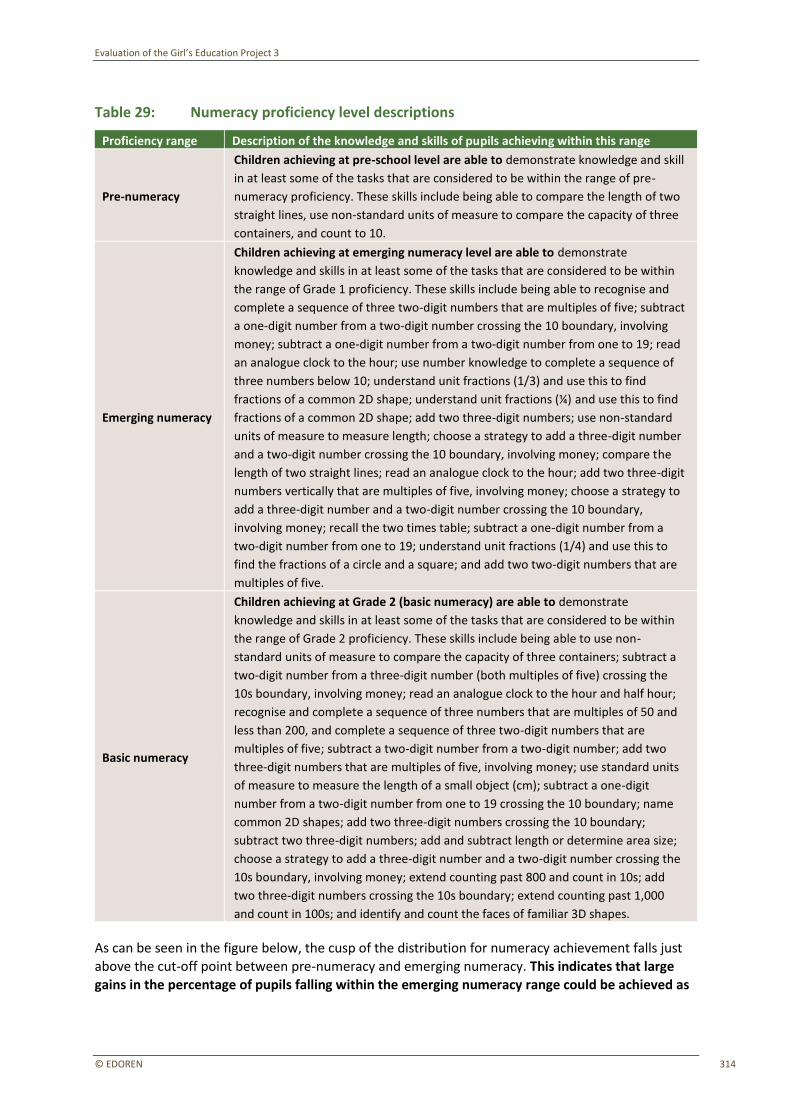
Evaluation of the Girl’s Education Project 3
© EDOREN 314
Table 29: Numeracy proficiency level descriptions
Proficiency range Description of the knowledge and skills of pupils achieving within this range
Pre-numeracy
Children achieving at pre-school level are able to demonstrate knowledge and skill
in at least some of the tasks that are considered to be within the range of pre-
numeracy proficiency. These skills include being able to compare the length of two
straight lines, use non-standard units of measure to compare the capacity of three
containers, and count to 10.
Emerging numeracy
Children achieving at emerging numeracy level are able to demonstrate
knowledge and skills in at least some of the tasks that are considered to be within
the range of Grade 1 proficiency. These skills include being able to recognise and
complete a sequence of three two-digit numbers that are multiples of five; subtract
a one-digit number from a two-digit number crossing the 10 boundary, involving
money; subtract a one-digit number from a two-digit number from one to 19; read
an analogue clock to the hour; use number knowledge to complete a sequence of
three numbers below 10; understand unit fractions (1/3) and use this to find
fractions of a common 2D shape; understand unit fractions (¼) and use this to find
fractions of a common 2D shape; add two three-digit numbers; use non-standard
units of measure to measure length; choose a strategy to add a three-digit number
and a two-digit number crossing the 10 boundary, involving money; compare the
length of two straight lines; read an analogue clock to the hour; add two three-digit
numbers vertically that are multiples of five, involving money; choose a strategy to
add a three-digit number and a two-digit number crossing the 10 boundary,
involving money; recall the two times table; subtract a one-digit number from a
two-digit number from one to 19; understand unit fractions (1/4) and use this to
find the fractions of a circle and a square; and add two two-digit numbers that are
multiples of five.
Basic numeracy
Children achieving at Grade 2 (basic numeracy) are able to demonstrate
knowledge and skills in at least some of the tasks that are considered to be within
the range of Grade 2 proficiency. These skills include being able to use non-
standard units of measure to compare the capacity of three containers; subtract a
two-digit number from a three-digit number (both multiples of five) crossing the
10s boundary, involving money; read an analogue clock to the hour and half hour;
recognise and complete a sequence of three numbers that are multiples of 50 and
less than 200, and complete a sequence of three two-digit numbers that are
multiples of five; subtract a two-digit number from a two-digit number; add two
three-digit numbers that are multiples of five, involving money; use standard units
of measure to measure the length of a small object (cm); subtract a one-digit
number from a two-digit number from one to 19 crossing the 10 boundary; name
common 2D shapes; add two three-digit numbers crossing the 10 boundary;
subtract two three-digit numbers; add and subtract length or determine area size;
choose a strategy to add a three-digit number and a two-digit number crossing the
10s boundary, involving money; extend counting past 800 and count in 10s; add
two three-digit numbers crossing the 10s boundary; extend counting past 1,000
and count in 100s; and identify and count the faces of familiar 3D shapes.
As can be seen in the figure below, the cusp of the distribution for numeracy achievement falls just
above the cut-off point between pre-numeracy and emerging numeracy. This indicates that large gains in the percentage of pupils falling within the emerging numeracy range could be achieved as

Evaluation of the Girl’s Education Project 3
© EDOREN 315
many children are on the cusp of achieving emerging numeracy. Gains in the percentage of pupils
achieving basic numeracy will be more challenging and will require more effort.
Figure 76: Distribution of numeracy proficiency
Quantitative data on associated factors
The analysis of factors associated with achievement highlights that the very low levels of learning
in the intervention schools are largely consistent across groups, although boys do perform slightly better than girls. As can be seen in Table 30, girls are over-represented in the pre-literacy and pre-numeracy proficiency ranges and under-represented in the basic literacy and numeracy proficiency ranges.
Table 30: Learning outcomes by gender
Hausa English Numeracy
Girls Boys Girls Boys Girls Boys
Pre-literacy/numeracy skills 97.5% 94.0% 96.2% 92.2% 22.4% 18.5%
Emerging skills 0.4% 3.0% 2.0% 4.8% 70.7% 67.5%
Basic skills 2.0% 2.9% 1.8% 3.1% 7.0% 14.0%
185.51
322.29
397.32
452.08
490.81
513.70
529.90
543.92
557.76
572.69
589.46
608.00
628.10
650.58
677.49
715.34
0 200 400 600 800 1000 1200 1400 1600 1800 2000
20.5% of pupils demonstrated pre-numeracy skills. Children achieving within the pre-numeracy proficiency
range do not yet have emerging numeracy skills.
68.9% of pupils demonstrated knowledge and skills within the range expected by the P1 curriculum.
This level of proficiency can be described as emerging numeracy.
10.6% of the pupils demonstrated P2 numeracy skills. This level of proficiency can be described as basic numeracy.
.
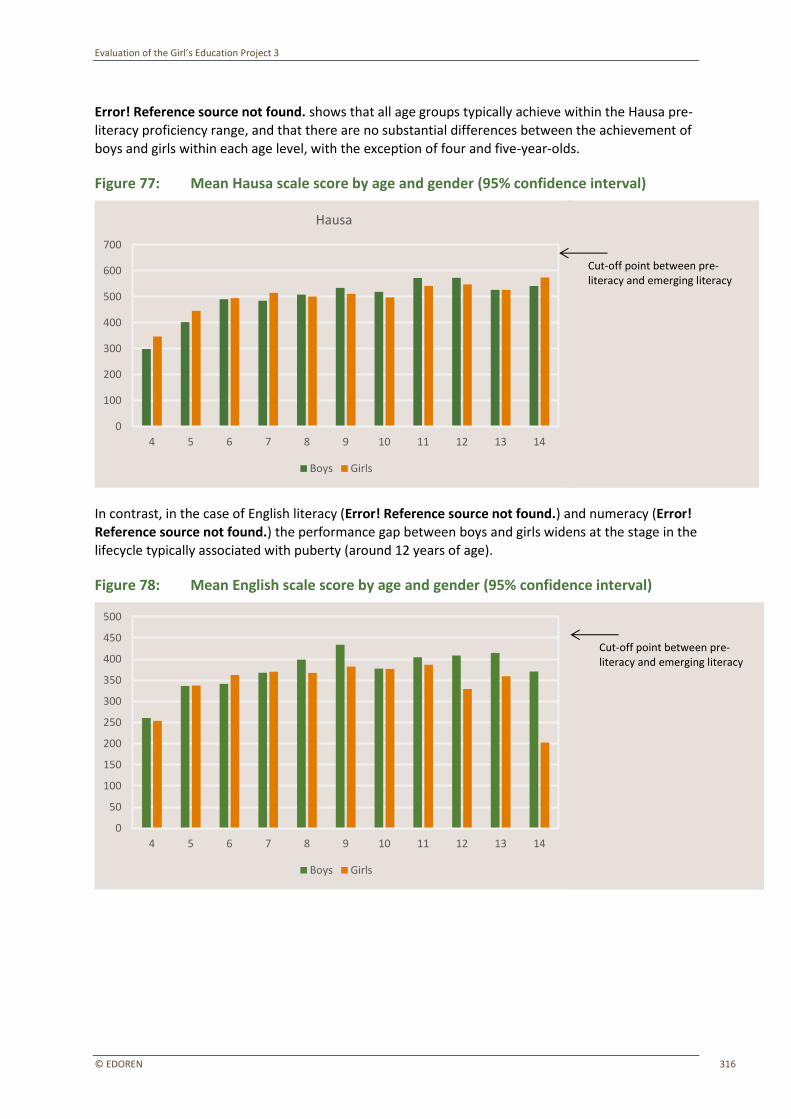
Evaluation of the Girl’s Education Project 3
© EDOREN 316
Error! Reference source not found. shows that all age groups typically achieve within the Hausa pre-
literacy proficiency range, and that there are no substantial differences between the achievement of boys and girls within each age level, with the exception of four and five-year-olds.
Figure 77: Mean Hausa scale score by age and gender (95% confidence interval)
In contrast, in the case of English literacy (Error! Reference source not found.) and numeracy (Error! Reference source not found.) the performance gap between boys and girls widens at the stage in the
lifecycle typically associated with puberty (around 12 years of age).
Figure 78: Mean English scale score by age and gender (95% confidence interval)
4 5 6 7 8 9 10 11 12 13 14
0
100
200
300
400
500
600
700
Hausa
Boys Girls
4 5 6 7 8 9 10 11 12 13 14
0
50
100
150
200
250
300
350
400
450
500
Boys Girls
Cut-off point between pre-literacy and emerging literacy
Cut-off point between pre-literacy and emerging literacy
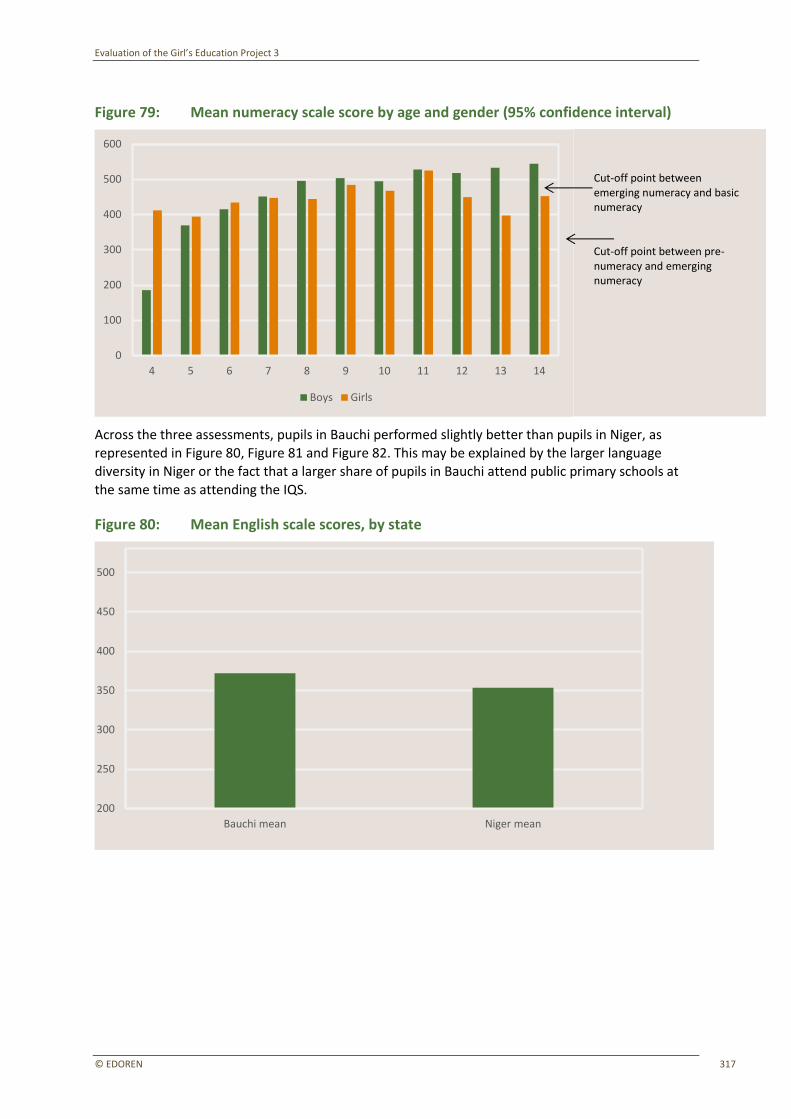
Evaluation of the Girl’s Education Project 3
© EDOREN 317
Figure 79: Mean numeracy scale score by age and gender (95% confidence interval)
Across the three assessments, pupils in Bauchi performed slightly better than pupils in Niger, as represented in Figure 80, Figure 81 and Figure 82. This may be explained by the larger language
diversity in Niger or the fact that a larger share of pupils in Bauchi attend public primary schools at the same time as attending the IQS.
Figure 80: Mean English scale scores, by state
4 5 6 7 8 9 10 11 12 13 14
0
100
200
300
400
500
600
Boys Girls
Bauchi mean Niger mean
200
250
300
350
400
450
500
Cut-off point between pre-numeracy and emerging numeracy
Cut-off point between emerging numeracy and basic numeracy
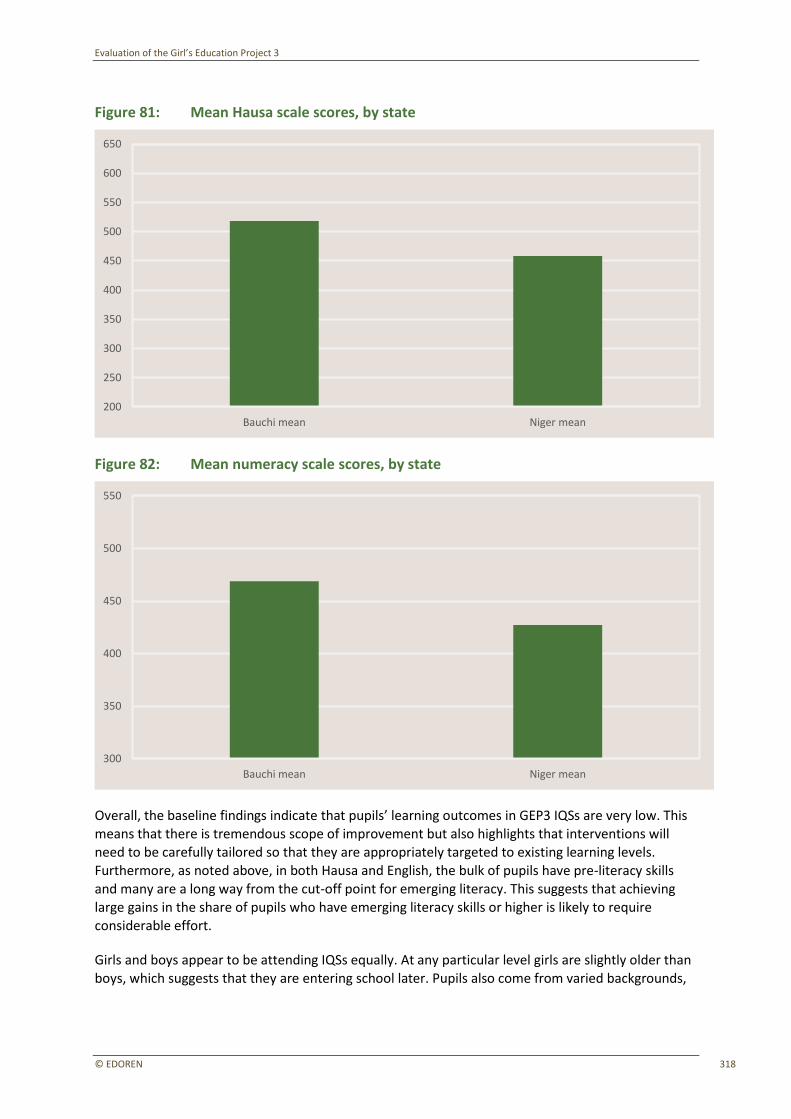
Evaluation of the Girl’s Education Project 3
© EDOREN 318
Figure 81: Mean Hausa scale scores, by state
Figure 82: Mean numeracy scale scores, by state
Overall, the baseline findings indicate that pupils’ learning outcomes in GEP3 IQSs are very low. This
means that there is tremendous scope of improvement but also highlights that interventions will need to be carefully tailored so that they are appropriately targeted to existing learning levels. Furthermore, as noted above, in both Hausa and English, the bulk of pupils have pre-literacy skills
and many are a long way from the cut-off point for emerging literacy. This suggests that achieving large gains in the share of pupils who have emerging literacy skills or higher is likely to require considerable effort.
Girls and boys appear to be attending IQSs equally. At any particular level girls are slightly older than
boys, which suggests that they are entering school later. Pupils also come from varied backgrounds,
Bauchi mean Niger mean
200
250
300
350
400
450
500
550
600
650
Bauchi mean Niger mean
300
350
400
450
500
550
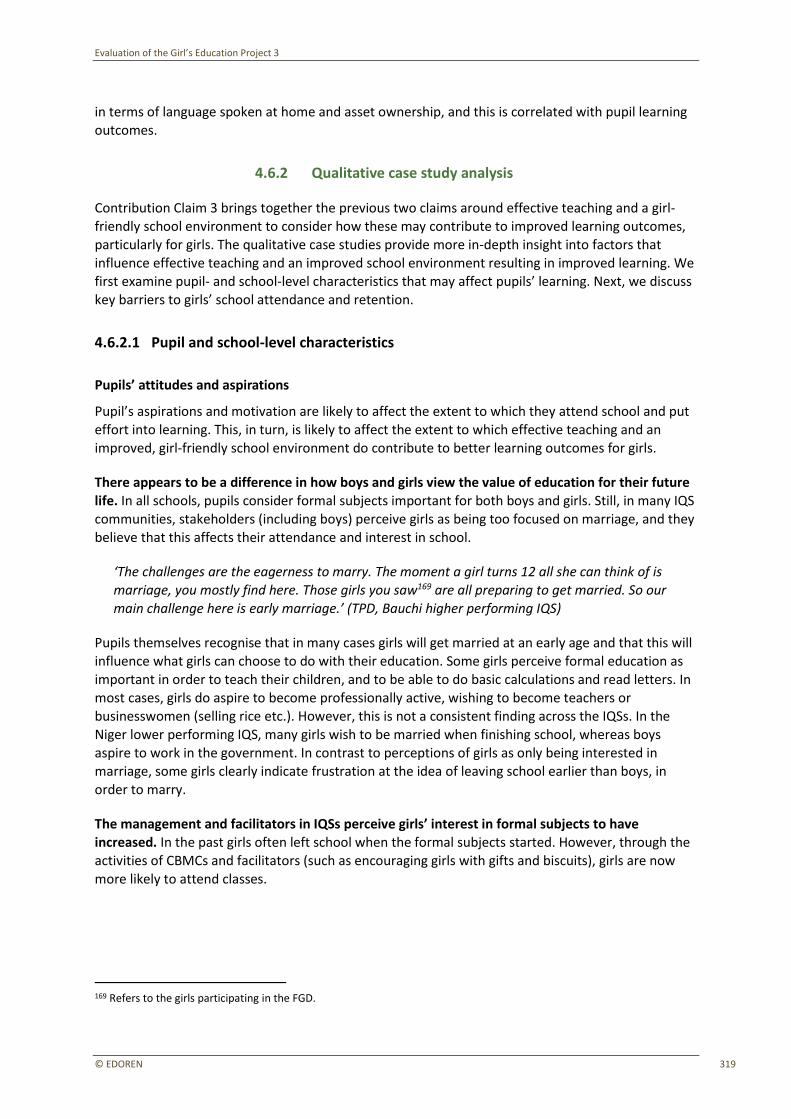
Evaluation of the Girl’s Education Project 3
© EDOREN 319
in terms of language spoken at home and asset ownership, and this is correlated with pupil learning
outcomes.
4.6.2 Qualitative case study analysis
Contribution Claim 3 brings together the previous two claims around effective teaching and a girl-friendly school environment to consider how these may contribute to improved learning outcomes, particularly for girls. The qualitative case studies provide more in-depth insight into factors that influence effective teaching and an improved school environment resulting in improved learning. We
first examine pupil- and school-level characteristics that may affect pupils’ learning. Next, we discuss key barriers to girls’ school attendance and retention.
4.6.2.1 Pupil and school-level characteristics
Pupils’ attitudes and aspirations
Pupil’s aspirations and motivation are likely to affect the extent to which they attend school and put effort into learning. This, in turn, is likely to affect the extent to which effective teaching and an
improved, girl-friendly school environment do contribute to better learning outcomes for girls.
There appears to be a difference in how boys and girls view the value of education for their future life. In all schools, pupils consider formal subjects important for both boys and girls. Still, in many IQS communities, stakeholders (including boys) perceive girls as being too focused on marriage, and they
believe that this affects their attendance and interest in school.
‘The challenges are the eagerness to marry. The moment a girl turns 12 all she can think of is
marriage, you mostly find here. Those girls you saw169 are all preparing to get married. So our main challenge here is early marriage.’ (TPD, Bauchi higher performing IQS)
Pupils themselves recognise that in many cases girls will get married at an early age and that this will influence what girls can choose to do with their education. Some girls perceive formal education as important in order to teach their children, and to be able to do basic calculations and read letters. In
most cases, girls do aspire to become professionally active, wishing to become teachers or businesswomen (selling rice etc.). However, this is not a consistent finding across the IQSs. In the
Niger lower performing IQS, many girls wish to be married when finishing school, whereas boys aspire to work in the government. In contrast to perceptions of girls as only being interested in marriage, some girls clearly indicate frustration at the idea of leaving school earlier than boys, in
order to marry.
The management and facilitators in IQSs perceive girls’ interest in formal subjects to have increased. In the past girls often left school when the formal subjects started. However, through the activities of CBMCs and facilitators (such as encouraging girls with gifts and biscuits), girls are now
more likely to attend classes.
169 Refers to the girls participating in the FGD.
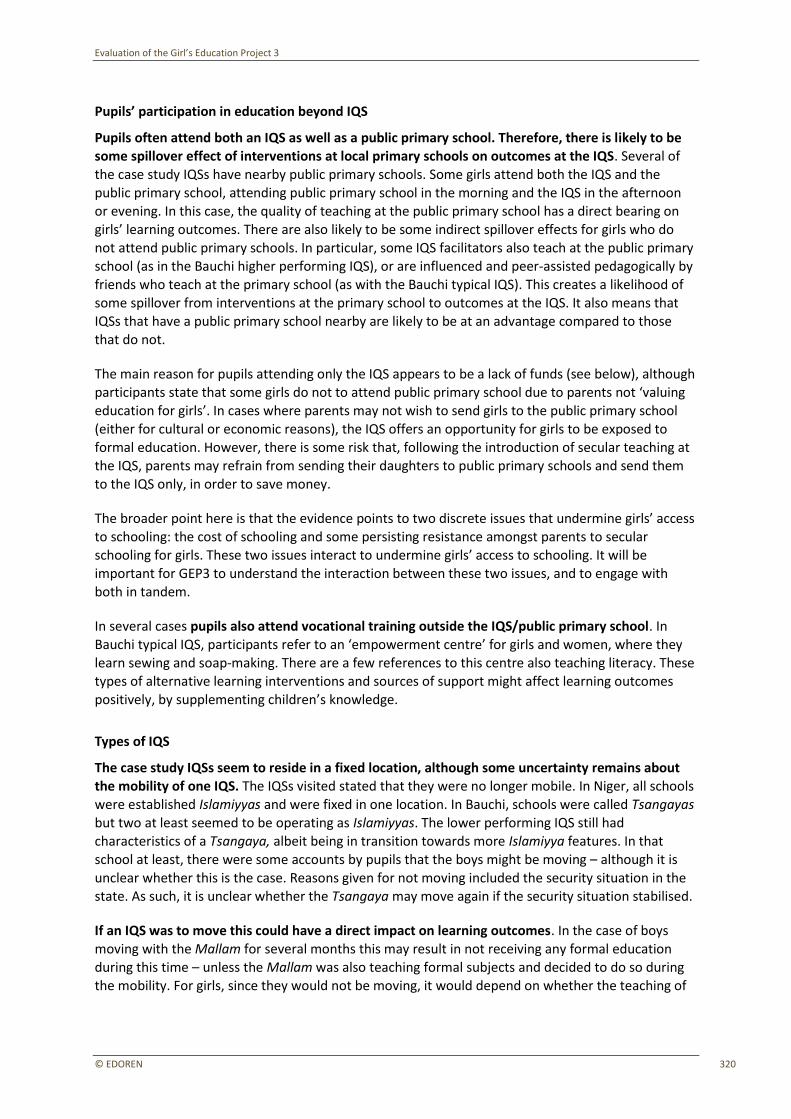
Evaluation of the Girl’s Education Project 3
© EDOREN 320
Pupils’ participation in education beyond IQS
Pupils often attend both an IQS as well as a public primary school. Therefore, there is likely to be some spillover effect of interventions at local primary schools on outcomes at the IQS. Several of the case study IQSs have nearby public primary schools. Some girls attend both the IQS and the public primary school, attending public primary school in the morning and the IQS in the afternoon or evening. In this case, the quality of teaching at the public primary school has a direct bearing on
girls’ learning outcomes. There are also likely to be some indirect spillover effects for girls who do not attend public primary schools. In particular, some IQS facilitators also teach at the public primary school (as in the Bauchi higher performing IQS), or are influenced and peer-assisted pedagogically by friends who teach at the primary school (as with the Bauchi typical IQS). This creates a likelihood of some spillover from interventions at the primary school to outcomes at the IQS. It also means that
IQSs that have a public primary school nearby are likely to be at an advantage compared to those that do not.
The main reason for pupils attending only the IQS appears to be a lack of funds (see below), although
participants state that some girls do not to attend public primary school due to parents not ‘valuing education for girls’. In cases where parents may not wish to send girls to the public primary school (either for cultural or economic reasons), the IQS offers an opportunity for girls to be exposed to
formal education. However, there is some risk that, following the introduction of secular teaching at the IQS, parents may refrain from sending their daughters to public primary schools and send them to the IQS only, in order to save money.
The broader point here is that the evidence points to two discrete issues that undermine girls’ access to schooling: the cost of schooling and some persisting resistance amongst parents to secular
schooling for girls. These two issues interact to undermine girls’ access to schooling. It will be important for GEP3 to understand the interaction between these two issues, and to engage with both in tandem.
In several cases pupils also attend vocational training outside the IQS/public primary school. In
Bauchi typical IQS, participants refer to an ‘empowerment centre’ for girls and women, where they learn sewing and soap-making. There are a few references to this centre also teaching literacy. These types of alternative learning interventions and sources of support might affect learning outcomes positively, by supplementing children’s knowledge.
Types of IQS
The case study IQSs seem to reside in a fixed location, although some uncertainty remains about
the mobility of one IQS. The IQSs visited stated that they were no longer mobile. In Niger, all schools were established Islamiyyas and were fixed in one location. In Bauchi, schools were called Tsangayas but two at least seemed to be operating as Islamiyyas. The lower performing IQS still had characteristics of a Tsangaya, albeit being in transition towards more Islamiyya features. In that school at least, there were some accounts by pupils that the boys might be moving – although it is
unclear whether this is the case. Reasons given for not moving included the security situation in the state. As such, it is unclear whether the Tsangaya may move again if the security situation stabilised.
If an IQS was to move this could have a direct impact on learning outcomes. In the case of boys moving with the Mallam for several months this may result in not receiving any formal education during this time – unless the Mallam was also teaching formal subjects and decided to do so during the mobility. For girls, since they would not be moving, it would depend on whether the teaching of

Evaluation of the Girl’s Education Project 3
© EDOREN 321
formal subjects continued in the absence of the Mallam and male pupils. As the nomadic culture of
certain Tsangayas may have significant implications for learning outcomes and the retention of, in particular, girls, it is important to explore this further at midline. As part of the implementation of GEP3 going forward, it may be necessary to consider how this information can be verified and tracked as part of the monitoring process at the LGA level.
4.6.2.2 Barriers to attendance and retention (including gendered differences)
Attitudes towards girls’ education
Attendance and retention of girls in integrated Qur’anic education remains a challenge. Across the
IQSs stakeholders referred to ‘all children attending school’170 whilst simultaneously stating that some parents pulled children (in particular girls) out of school when the integrated subjects were introduced. Similarly, not all girls attend formal classes: some leave after religious subjects have
finished (Bauchi, higher performing IQS).
All IQSs visited face challenges with regard to retaining girls in school, due to early marriage or other cultural constraints (see below). They also face challenges with regard to the attendance of both boys and girls because of out-of-school responsibilities (such as chores or work). Other challenges are
the relative lack of understanding of the importance of formal subjects, and concerns about the infrastructure and facilities at IQSs (discussed in Section 4.4.1.2). The former possibly relates to the
perception that these subjects are not relevant to the lives of people in the communities. For boys, this relates to a dearth of job opportunities that require a formal education. For girls, this relates to the fact that women typically do not enter formal work outside of the home after marriage owing to
cultural practices of seclusion and the realities of their reproductive responsibilities.
There are also persisting barriers related specifically to attitudes towards girls’ education. A lack of
awareness of the importance of education, in particular for girls, was widely cited as a reason for
continued challenges in regard to attendance. CBMCs in all IQS cases spoke of this issue: ‘You know
this is a village, people don’t value formal education for girls. They believe since they (mothers) were not educated, why should their children (girls) be educated?’ (CBMC, Bauchi typical IQS). In addition,
whilst participants considered educating the ‘girl child’ as important, the perception is that it is more important in most cases to educate the ‘boy child’.
‘We prefer that the man has more knowledge than the girl because by her nature a girl is supposed to acquire knowledge from the man. Every day of the man, even religion spoke on it, if the woman seeks one knowledge then the man seeks two knowledge. The man should teach
his wife one and her knowledge is increased. Then the man goes to seek further knowledge and teaches the woman. That is part of the law. You see, knowledge bestows on one responsibilities. If the woman is more learned than the man [is] then there is a problem. Even among siblings, the female knows more than the man, there is problem.’ (Parents, Bauchi higher performing IQS)
There were some differences in attitudes between rural and urban areas. In Bauchi, the higher to lower performing cases followed the peri-urban to remote rural divide closely. In the lower performing (rural) case, an absence of women at the parents’ FGD possibly indicated mothers’ lack of
170 While KIs perceive participation in IQSs to be high, this may at times be due to children attending religious classes, and does not necessarily indicate attendance during formal education.
Evaluation of the Girl’s Education Project 3
© EDOREN 322
engagement with the IQS process. This in turn correlates with women’s lower educational and
literacy levels in rural communities overall.
However, stakeholders perceived attitudes towards girls’ education to be changing (see Section 4.4.1.2). Whilst previously there would be significant challenges in getting girls to attend school, acceptance of integration has become more widespread in all cases. Moreover, stakeholders agreed
that more could, and needed to be, done to increase awareness of the importance of education. As parents have not yet experienced the positive consequences of allowing their children to attend school, there is still a way to go. CBMCs saw themselves as setting an example by sending their children to study, even beyond secondary level, to encourage other parents to do the same. Overall, parents and communities do appear to be willing to reflect on and reconsider the roles,
responsibilities and capabilities of girls, and attitudes towards girls’ education appear to be slowly changing.
Capacity constraints
Even though CBMC activities and wider contextual changes appear to be positively influencing
attitudes towards education, including educating girls, changes in attitudes do not necessarily lead to changes in behaviour. The qualitative research indicates that financial capacity constraints have a critical bearing on attendance and retention.
‘We did not have the opportunity of formal education properly and our knowledge of religion the way it should be impacted. We take these two as very important but the barriers are that
we have plenty children and there is no help from anywhere. For instance, if one has 10 – 15 children in the school and each child were to pay #50, it will be difficult for the parent to meet up. The same thing goes for both primary and secondary. The result is that you will send some
to school and leave some behind according to your financial strength. At the same time, we want of all of them to go. I have son in private secondary school and the books are so
expensive. These are the kind of things that could hinder education. We want the government
to step in and help.’ (Parents, Bauchi higher performing IQS)
Respondents cite poverty as a key reason why parents do not send their children to school (public primary or IQS). Costs of education play a significant role in determining whether parents send their children to public primary schools. IQSs visited do not charge as high (if any) school fees as public primary schools do, and in most cases do not require uniforms either. School fees are often non-
compulsory or are a way for the CBMC to mobilise resources to feed back into the school and to offer teachers a symbolic ‘token of gratitude’. However, even in IQSs that have low fees or no fees, poverty remains a barrier to access for some children, owing to the opportunity cost of schooling. This links to the role that children (and particularly girls) play in supporting the family’s livelihood activities.
School management in all six IQSs believe fees discourage parents from sending their children to school. Fees may affect boys and girls differently.
‘Because of poverty around here it can be a serious issue. It can discourage the parents and we will end up with low attendance. I will prefer both boys and girls to go to school but in case there is such a situation I think the boy will be sent to school because the boy is in a position to assist others.’ (Mallam, Bauchi lower performing IQS)
Evaluation of the Girl’s Education Project 3
© EDOREN 323
Parents appear to be more likely to prioritise boys in regard to going to school, although there
were some references to parents preferring to send girls to school since they are more likely to stay behind and help the community if educated. In order to encourage parents to send all their children to school, some IQSs charge parents a set amount regardless of how many children they send. Additionally, school fees can affect attendance, as children feel reluctant to come to school due to
embarrassment at not being able to pay the fee (Parents, Bauchi typical IQS).
CBMC and school leaders in all six case study schools feel they cannot insist on payment, since it will result in parents sending the children away. This includes asking parents to pay for school uniforms or requiring children to bring pens. Respondents believe that the resource constraints of the community limit the capacity of school management to invest in IQSs, which in turn may affect
the quality of education provided and the capacity to retain girls.
‘We would want to add more subjects but the challenge we have is the teachers that teach the children, we can’t afford to pay them. Initially the children paid 10 Naira every once in a week.
We noticed that most children do not come to school again because their parents could not afford it. So we stopped.’ (CBMC, Niger lower performing IQS)
The issue of fees, therefore, along with the wider opportunity cost of schooling related to child work,
indicates that improved teaching and an improved school environment will likely not be enough to address these more deep-rooted challenges. Even if the quality of education improves (and a quality supply is therefore provided), the inability of parents to reconcile the possible cost implications could
remain prohibitive, unless the value of education from an instrumentalist perspective (what it can tangibly lead to) is also effectively communicated, with demonstrable results that can offset those
costs.171
On the other side of this argument, assuming that retention is partly affected by perceptions around the value and quality of education, it will be important for schools to be able to teach effectively
when the demand for education increases in communities. During QCOs, researchers observed
overcrowded classrooms in some IQSs, with some pupils sat outside the classroom. CBMC’s limited ability to mobilise sufficient resources could have a negative impact on the quality of teaching, and thus potentially retention. Yet, some CBMCs feel that parents do not prioritise education when
allocating resources and that as attitudes change, so will spending.
‘For now, it is because they have not really enjoyed education why cost can affect them. When they begin to see the benefits, they will rather spend money they use in buying semira172 in preparation for their marriage on sending them [their children] to school. Because the plates will be broken eventually, but the knowledge will always be there and will die with the owner.’
(CBMC, Bauchi lower performing IQS)
171 Convincing parents that education offers a value that fits with their needs is still only one part of the process. If they are
unable to practically apply learning in a manner that leads to those incurred costs being mitigated or overcome, or if the opportunities are not there in the first place (like jobs), the value will not be seen. For example, if mothers are told that keeping their daughters in school (and away from hawking) to learn numeracy and literacy will make a real difference to their daughters being able to run their own businesses more profitably, they would need to see that demonstrated quite quickly in order to be convinced, otherwise they will perceive that they are just incurring losses by removing them from their income-generating roles. 172 Traditional plates.
Evaluation of the Girl’s Education Project 3
© EDOREN 324
Outside school activities and responsibilities
The qualitative research explored how boys and girls spend their time outside of school. In the Niger cases, the team spoke to boys and girls estimated to be between the ages of seven and 13. In Bauchi State they were between the ages of eight and 15 years. Across the six case study IQSs, boys and girls were all responsible for income-generating activities. Children would engage in income-generating activities, such as farming or looking after cattle (boys), or hawking and selling produce in
the market (mainly girls). Additionally, parents consider children helping with responsibilities in the household (like looking after younger siblings or fetching water) to be a necessary part of income-generating activities. Girls generally had more responsibilities for household chores.
No clear differences emerged from the qualitative data in regard to the timing of pupils’ daily routines. Pupils in all six IQSs referred to waking up and either studying Arabic or completing chores,
after which they would attend either public primary school or work. In the afternoon and evening, children reported either working or attending the IQS. Thereafter, pupils do homework in some IQSs
(Niger higher performing IQS, Niger typical IQS) and various chores. Homework appears to be
dominated by religious studies. Children in all IQSs reported having some time to play, although not as much as they would want, whereas parents consider children playing too much to have a negative effect on attendance and pupil’s motivation to learn.
Out-of-school responsibilities affect children’s school attendance. School stakeholders attribute this to the perceived lack of capacity of parents to prioritise children’s education, which they associate with a lack of understanding of the value of education.173 Parents, however, see it as a financial and
practical necessity.
‘There is major challenge for the girls because most of their parents make things for sale, like
beans cake, soya bean cake, rice and so on, and they give the girls to go sell. This affects the children’s attendance because either they come to school very late, almost in the closing hours,
or they miss school.’ (TPD, Bauchi higher performing IQS)
In three of the IQSs CBMCs have actively instigated that pupils have to drop all chores and work the
minute it is time for school (Niger typical IQS, Niger higher performing IQS, and Bauchi higher performing IQS). This means that parents are hesitant about extending the instructional time, since ‘they need us to be home for domestic job’ (Boys, Bauchi higher performing IQS). According to one stakeholder, possible solutions are to provide parents with farm implements, such as ploughs or
fertilisers, to aid parents whilst their children are in school (Mallam, Niger lower performing IQS). As long as parents require children to assist in income-generating activities, directly or indirectly, this is likely to have a negative effect on attendance and enrolment. As parents’ attitudes towards formal education become more favourable, it will become more important to address barriers related to the opportunity cost of schooling.
Respondents perceive that mothers are less positive about girls’ education than fathers. Participants state that women at times hinder girls from attending school. This might have been
thought to be a case of isolated experience if it was only referenced once; however, five out of six IQSs mentioned this occurring.
‘There are challenges. You know you women are closer to the girl child. They say that knowledge for a child lies at the foot of the mother. We men are hardly at home. You send your
173 These were perceptions drawn from a combination of teachers’ TPDs, and Mallam and LGEA officer KIIs.
Evaluation of the Girl’s Education Project 3
© EDOREN 325
daughter to school and go out to find food for the family. Then the mother will not talk her into
doing other things instead of going to school. We are facing such challenges.’ (Parents, Bauchi higher performing IQS)
Pupils share the view of (mainly male) stakeholders that mothers often require girls to stay at home. The explanation given was that with girls helping the mothers and boys helping the fathers, girls
attending school means the mother cannot generate as much income as needed. It appears that the mother is a key provider in sustaining the day-to-day life of the household. Moreover, since many mothers themselves have not attended school, it appears that there is less understanding amongst mothers in some IQSs of why girls would benefit from formal education.
CBMCs in all six schools consider sensitising women as key in order to increase the enrolment and
attendance of girls. However, as discussed, this constraint is unlikely to be removed through sensitisation alone, as women require girls to engage in income-generating activities (such as hawking) or to take care of household chores so a mother can, for example, go to the farm. In Niger
lower performing IQS, for example, women rarely left the house. Girls were responsible for actually going out and selling what the women produced, and, as such, mothers are directly dependent on girls to bring in any money.
The reasons for this are heavily rooted in the role of women as economic agents within northern Nigerian communities, and as key income generators for the family. The running of home-based businesses by women in northern Nigeria is a traditional part of the gendered economic context, and
the use of children and youth to purchase inputs and to market products has always been a critical part of the enterprise infrastructure.174 Unmarried daughters are at the heart of this system – more
so than boys, who will have other duties on the farm in rural areas. The practice of auren kuli, or seclusion, by many Muslim women when married, exacerbates this reliance on unmarried daughters, as women must manage their entire business infrastructure remotely.175
The gendered political economy of this reality is one that the ToC of GEP3’s IQSS does not address
when it comes to ensuring that girls are able to not only access the IQS, but also to remain fully engaged consistently and long enough for learning to occur. Successfully addressing this challenge will require interventions related to women’s poverty alleviation and alternative income-generating
opportunities. As such, it will need to go beyond activities within the education sector.
The extent to which CBMC advocacy and improved school management alone, and without a more
holistic approach, can raise girls’ participation in schooling is questionable. With CBMC members also being a part of the community’s economic reality, a willingness to take on the challenge to girls education that a gendered political economy poses, maybe limited without further support in this
area, despite the presence of good intentions. At midline it will be important to interrogate this area further, to understand how to reconcile the tension between girls’ successful retention and
completion of schooling and women’s income generation and poverty alleviation activities in northern Nigeria. This is also a cyclical issue, as many of the girls in question will also be transitioning to womanhood (and new economic roles) due to the another key factor that influences girls’ access
to schooling – early marriage.
174 Taylor et al. (2014) ‘Economic Opportunities and Obstacles for Women and Girls in Northern Nigeria’, DFID. 175
Zakaria, Y (2001) ‘Entrepreneurs at Home: Secluded Muslim Women and Hidden Economic Activities in Northern Nigeria’, Nordic Journal of African Studies, 10(1): 107-123 (2001).

Evaluation of the Girl’s Education Project 3
© EDOREN 326
Early marriage
One of the main reasons stated for low enrolment and retention of girls is early marriage. This links to the fact that IQSs are largely multi-grade learning environments, with classes often catering to a wide range of ages. In the Bauchi context, where integration has been a more recent process, the presence of older children reflects the numbers of children who were out-of-school (formal schooling) until the IQS made secular learning available.
Whilst the acquisition of formal education, including for girls, may be gaining acceptance in the six IQS cases, early marriage is still prevalent. This is particularly problematic for girls over the age of 10 who are acquiring a basic education for the first time. Communities and LGEA officers consistently refer to this as the key challenge for girls’ education and learning outcomes. Yet, with communities considering it as part of their Islamic faith, the view is that it is almost ‘inevitable’.
There is no set age for a girl to get married, rather this is decided by reference to ‘maturity’.176 Girls
may thus receive any number of years of schooling before they marry, at ages ranging from 12 to 20. The most commonly referred to age for marriage is 15. Depending on the ‘age of maturity’, some
girls in the GEP3 communities may not have received any education by the time communities deem them ready for marriage: ‘She was already grown even before the school started’ (Girls, Bauchi lower performing IQS). Age of maturity refers to the girl’s physical development. In the Bauchi lower
performing IQS, the Mallam/head teacher referred to the fact that when a girl had physically developed, it became important for her to be married. However, a girl who was still undeveloped beyond 15 could continue her schooling.
As many girls, especially in Bauchi, appear to be around 12 and are still in P3, it is plausible that early marriage will affect retention, even at the stage of primary education. With some communities, and
in particular girls, not having had access to formal education prior to integration there may be girls starting education at an older age. The question of how this relates to GEP3 will need further exploration at midline.
There are often provisions made for girls to continue education after marriage. However, this is
dependent on the willingness of the husband to allow his wife to attend school. Participants state that parties increasingly agree upon this before marriage, but sometimes the husband changes his mind after marriage. Though parents may say that their attitudes towards girls’ education are positive, and that they want them to ‘go far’ and study to a high level, there is an understanding that
once a girl is married she is no longer the parents’ responsibility. As a result, changes in parental attitudes will not necessarily translate into improved retention once girls are beyond the age of marriage.
‘According to the religion of Islam, a girl child should marry early, but you ask her husband to sponsor her continued education. I have a daughter in the university. She got married last year
and she is still continuing with her education. We will not discourage the girls if they desire to go to school, but when they get to their husband’s house they may continue and the
responsibility is no longer yours.’ (Parents, Bauchi higher performing IQS)
Thus, though an attitude change on the part of parents is important in the years before marriage (and in negotiating a marriage), changing the attitudes of the men who are likely to marry girls in the community is likely to be equally essential. Though GEP3 indirectly does this through current
176 This is a reference to a girl’s biological and physical maturity, indicating the point at which her body starts to develop.
Evaluation of the Girl’s Education Project 3
© EDOREN 327
pupils, and parents of boys, there may be a need to explore further the extent to which boys/men
not attached or connected to the IQS are influenced by the intervention, and whether this will impact on girls’ continued education after marriage.
Three of the six case study IQSs referred to providing some form of education for women that included formal subjects. Integration initiatives thus stretch beyond the direct target groups of girls
to also include increased awareness of the importance of formal education for women. However, in most cases it appears that women only continue with religious studies. Whether a woman continues formal school after marriage appears dependent on the attitudes of her husband-to-be.
‘Some of them who earn salaries and who also know that their wives are responsible allow
them to continue with their education. But some will even promise the girl before marriage that once they get married, she will continue with her education only to go back on the promise once the girl becomes his wife. So many marriages have broken up because of this.’ (Girls, Bauchi typical IQS)
Girls continuing to access school after marriage will also be dependent on the flexibility of their new home-based responsibilities as wives and mothers, and the restrictions imposed where the practice of seclusion applies. The importance attached to religious learning suggests that girls and young
women are encouraged to continue their Quranic education after marriage, and their mobility for this reason is not constrained. This may offer a way for married women to also continue their secular learning.
Though changing norms and practices around early marriage is not a direct objective of GEP3, the qualitative research indicates that such changes will be required in order to facilitate continued
education of girls. While some stakeholders seem to be aware of the challenge of early marriage for girls’ education, this does not necessarily change attitudes or practices. For example, the Mallam in Niger lower performing IQS said he considers early marriage a main challenge, and that he would like
to see girls study to the level of university. At the same time, it appears he had married his own
daughters at young ages. A similar contradiction came from the Bauchi lower performing case. FGDs with boys further mirror this. Some boys are happy to let their future wives continue education since ‘I want an educated wife’ (Niger, typical IQS), whilst others consider it something that is not done: ‘I
will not allow my wife, we in the village we don’t allow our wives to go to school because of suspicion of infidelity.’ (Bauchi, lower performing IQS)
Additionally, changing norms and practices in the IQS context is highly limited by pressures both from within the direct community and potentially from a wider religious community. Parents face pressures to marry their daughters since ‘she will soon become worthless if she is not married off’
(Girls, Bauchi typical IQS)
‘Some people will even keep malice with your father if he refuses to listen to them. In some cases, it is even the grandparents who wage war against their sons to marry their daughters off early and then the fathers will succumb to pressure and ask the daughter to bring home a
man she wants to marry or a husband will be chosen for her. That is one major challenge we girls face here. We are not allowed to go to school for as long as we want.’ (Girls, Bauchi typical IQS)
As long as girls are dependent on marrying for social security and to make a living this is likely to impact on the ability a girl has to study further. It is also likely to affect girls’ aspirations in school since there will be limited options available for girls to pursue. In Niger higher performing IQS the
Evaluation of the Girl’s Education Project 3
© EDOREN 328
proprietor is female and actively stressed the importance of formally educating girls even before the
GEP3 integration:
‘Now we have realised that education is very important. Before we married out our daughters at a tender age, but now we have seen the light. God willing, we shall continue to ensure that
our children get educated. It was our fault to have allowed our children to play in the past, but now that we do not allow our girls to pay attention to boys, they are no longer interested in marriage. All children are very interested in education.’ (Parents, Niger higher performing IQS)
Evaluation of the Girl’s Education Project 3
© EDOREN 329
Bibliography
Adediwura, A. and Tayo, B. (2007). ‘Perception of teachers’ knowledge attitude and teaching skills as predictor of academic performance in Nigerian secondary schools’. Educational Research and Review, 2, pp. 165–171.
Anderson, M. and Scamporlino, R. (2013) ‘The Master of Teaching at the University of Melbourne: a clinical model for pre-service teacher preparation’. International Schools Journal, 32(2), pp. 33–42.
Arnold, C. (2011) Cash Transfers, Literature Review. UK Department for International Development.
Baird, S., McIntosh, C. and Őzler, B. (2011) ‘Cash or Condition? Evidence from a Cash Transfer Experiment’. The Quarterly Journal of Economics, 126(4), pp. 1709–1753.
Benhassine, N., Devoto, F., Duflo, E., Dupas, P. and Pouliquen, V. (2014) ‘Turning a Shove into a Nudge? A “Labeled Cash Transfer” for Education’. NBER Working Paper, No. 19227.
Burns, D., and Worsley, S. (2015) Navigating Complexity in International Development. Rugby, UK: Practical Action Publishing.
Cert, Y. (2010) ‘Teacher Efficacy Scale: The Study of Validity and Reliability and Preservice Classroom Teachers’ Self’. Journal of Theory and Practice in Education, 6 (1), pp. 68–85.
CESE. (2015) What works best: evidence-based practiced to help improve NSW student performance. Centre for Educational Statistics and Evaluation (CESE). Available at http://www.cese.nsw.gov.au/images/stories/PDF/what_works_best.pdf, Accessed on 5 June 2015.
Cogill, J. (2008) ‘Primary teachers’ interactive whiteboard practice across one year: changes in pedagogy and influencing factors’. EdD thesis King’s College University of London. Available at www.juliecogill.com.
Coladarci, T. (1992) ‘Teachers’ Sense of Efficacy and Commitment to Teaching’. The Journal of Experimental Education, 60 (4), pp. 323–337.
De, S., Pettersson, G., Morris, R. and Cameron, S. (2015) Teacher Development Programme (TDP), Impact Evaluation of Output 1: In-Service Training, Final Baseline Technical Report, Volume I Results and Discussion. Oxford, UK: Education Data, Research & Evaluation in Nigeria (EDOREN)
Delahais, T. and Toulemonde, J. (2012) ‘Applying contribution analysis: Lessons from five years of practice’. Evaluation, 18(3), pp. 281–293.
DFID (2011) DFID Ethics Principles for research and evaluation. UK Department for International Development.
Dundar, H., Béteille, T., Riboud, M. and Deolalikar, A. (2014) Student Learning in South Asia: Challenges, Opportunities, and Policy Priorities. Directions in Development. Washington, DC: World Bank.
EDOREN (2015) Evaluation Framework and Plan, UNICEF’s Girls’ Education Project Phase 3 (GEP3). Oxford, UK: Education Data, Research & Evaluation in Nigeria (EDOREN).
Getzels, J. W. and Guba, E. G. (1957) ‘Social behaviour and the administrative process’. School Review, 65, pp. 423–441.
Glover, J. A. and Robert, H. B. (1990) Educational psychology: principles and applications. Harper Colons Publisher.
Evaluation of the Girl’s Education Project 3
© EDOREN 330
Graham, A., Powell, M., Taylor, N., Anderson, D. and Fitzgerald, R. (2013) Ethical Research Involving Children. Florence: UNICEF Office of Research – Innocenti.
Griffin, P. (2014) Assessment for Teaching. Cambridge University Press.
Guajardo, J. (2011) Teacher Motivation: Theoretical Framework, Situation Analysis of Save the Children Country Offices, and Recommended Strategies. Save the Children. Available at http://www.oxfamnovib.nl/Redactie/Downloads/English/SPEF/281-24%20Teacher%20Motivation%20Report.pdf.
Henson, R. (2001) Teacher Efficacy Research Keynote Address – Teacher Self-Efficacy: Substantive Implications and Measurement Dilemmas. University of North Texas. Available at http://www.uky.edu/~eushe2/Pajares/EREkeynote.PDF.
Humphreys, S. and Crawfurd, L. (2014) Review of the Literature on Basic Education in Nigeria: Issues of Access, Quality, Outcomes and Equity. Oxford, UK: Education Data, Research & Evaluation in Nigeria (EDOREN).
Jones, H., Jones, N., Shaxson, L. and Walker, D. (2013) Knowledge, policy and power in international development: a practical framework for improving policy. ODI Background Note.
Johnson, D. and Hsieh, P.J. (2014) The context of schooling, professional competencies and learning outcomes in northern Nigeria. Draft Summary Reports. UNICEF GEP3.
Kauffman, D. (2011) ‘Validation of the Motivation to Teach Scale’. H. U. Journal of Education, 40, pp. 279–290.
Kelleher, F et al. (2011) Women and the Teaching Profession: Exploring the Feminisation Debate. UNESCO and the Commonwealth Secretariat.
Leach, J. (2002) ‘The Curriculum Knowledge of Teachers: an Analytic Review of a Large Scale, National Electronic Conference Environment’. Curriculum Journal, 3(1), pp. 87–120.
Lynch, K and Good, H. (2011) ‘Girl friendly/child friendly’ schools provide a brighter future in Mali. UNICEF: Mali. Available at http://www.unicef.org/mdg/mali_59595.html.
Masters, G. N. (2013) Reforming educational assessment: Imperatives, principles and challenges. Australian Council for Educational Research (ACER). Available at http://research.acer.edu.au/cgi/viewcontent.cgi?article=1021&context=aer, Accessed on 21 July 2015.
Mayne, J. (2012) ‘Contribution analysis: Coming of age?’ Evaluation, 18(3), pp. 270–280.
Mays, N. and Pope, C. (1995) ‘Qualitative Research: Rigour and Qualitative Research’. BMJ. 311(6997), pp. 109–112.
McGrane (2014) Unpublished report on ESSPIN item functioning. OPM, Oxford.
Merriam, S. B. (1988). Case study research in education: A qualitative approach. San Francisco: Jossey Bass.
OECD. (2014) Education at a Glance 2014: OECD Indicators. OECD Publishing.
OECD Development Assistance Committee (2010) DAC Guidelines and Reference Series: Quality Standards for Development Evaluation. OECD.
Patton, M.Q. (2015) Qualitative Research and Evaluation Methods. Sage Publications.
Pedhazur, E. J. and Schmelkin, L. P. (1991). Measurement, Design and Analysis: An Integrated Approach. Hillsdale, New Jersey, Lawrence Erlbaum Associates.
Evaluation of the Girl’s Education Project 3
© EDOREN 331
RANA (2016) RANA Quarterly Report September – December 2015.
Sparc and Savi (2015) State of the States – Political Economy, Prospects for Reform and Fiscal Conditions (Unpublished PowerPoint Presentation, 13 July 2015).
Suhr, D and Shay, M. (2009) Guidelines for Reliability, Confirmatory and Exploratory Factor Analysis. University of Northern Colorado. Available at http://www.wuss.org/proceedings09/09WUSSProceedings/papers/anl/ANL-SuhrShay.pdf.
Taylor et al. (2014) Economic Opportunities and Obstacles for Women and Girls in Northern Nigeria. DFID.
Tschannen-Moran, M. and Woolfolk-Hoy, A. (2001) ‘Teachers’ Sense of Efficacy Scale’ in Teacher efficacy: Capturing an elusive construct. Teaching and Teacher Education, 17, 783-805. Available at http://u.osu.edu/hoy.17/files/2014/09/TSES-+-scoring-zted8m.pdf.
UNICEF (2015a) Unpublished Strategy Paper. GEP3 Theory of Change. GEP3.
UNICEF (2015b) Unpublished Strategy Paper. Girls’ Education Project 3, Strategy for Integrated Qur’anic Schools. GEP3.
UNICEF (2015c) Unpublished Strategy Paper. Girls’ Education Project 3, Strategy for Education Management Information System (EMIS) Capacity Building. GEP3.
UNICEF (2015d) Unpublished Strategy Paper. Girls’ Education Project 3, GEP3 Value for Money Strategy 2014. GEP3.
UNICEF (2015e) Girls’ Education project Phase 3, Operational Plan. Revised January 2015.
UNICEF (2015f) Unpublished Strategy Paper. Girls’ Education Project 3, Strategy Paper on Early Learning (literacy & numeracy) RANA. GEP3.
UNICEF (2015g) Unpublished Strategy Paper. Girls’ Education Project 3, Strategy for Building the Capacity of School/Centre Based Management Committees. GEP3.
USAID (2014) Nigeria Reading and Access Research Activity: Results of the 2014 Hausa and English Early Grade Reading Assessments (EGRAs) in Government Primary Schools and IQTE Centers in Jigawa, Kaduna, Kano and Katsina. RTI International.
Voices for Change (2015) Being a Man in Nigeria: Perceptions and Realities. UK Aid.
Yin, R. (1984) Case study research: Design and methods. Beverly Hills, CA: Sage Publishing.
Yu and Watkins (2011) Attitudes and motivation in second language acquisition: A study of international students in China from a Cultural Perspective. University of Hong Kong
Zakaria, Y. (2001) Entrepreneurs at Home: Secluded Muslim Women and Hidden Economic Activities
in Northern Nigeria. Nordic Journal of African Studies. 10(1): 107–123.
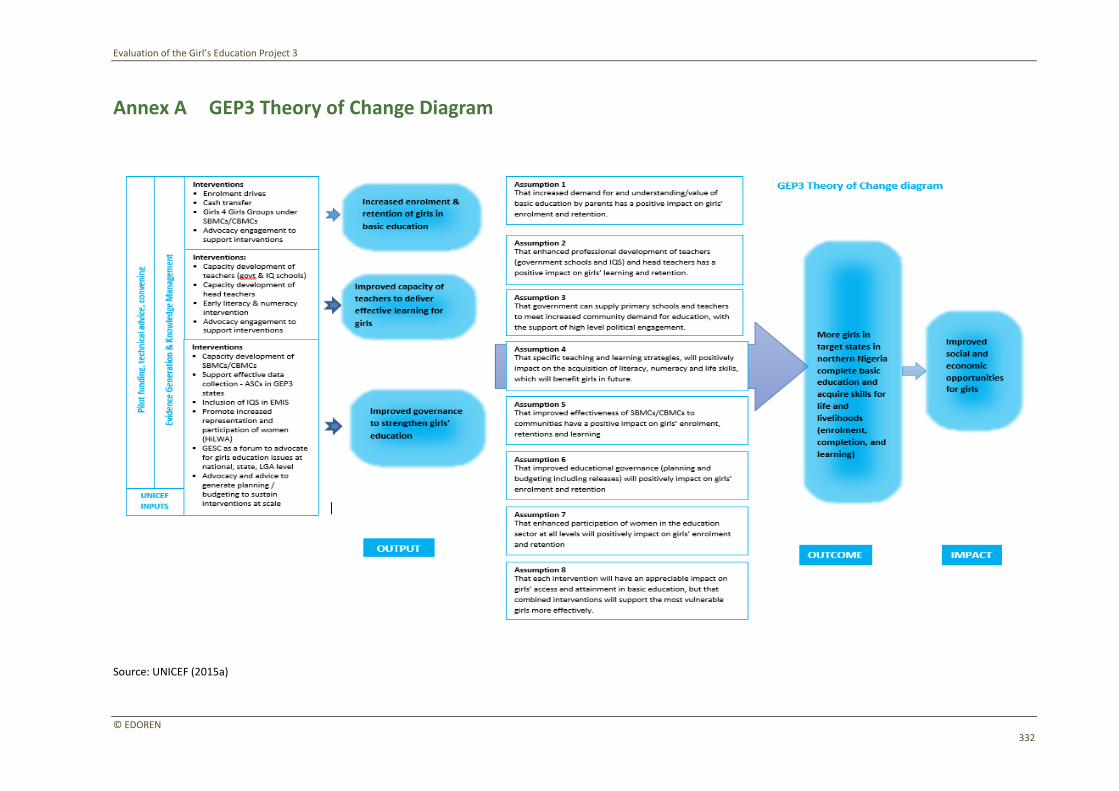
Evaluation of the Girl’s Education Project 3
© EDOREN 332
Annex A GEP3 Theory of Change Diagram
Source: UNICEF (2015a)
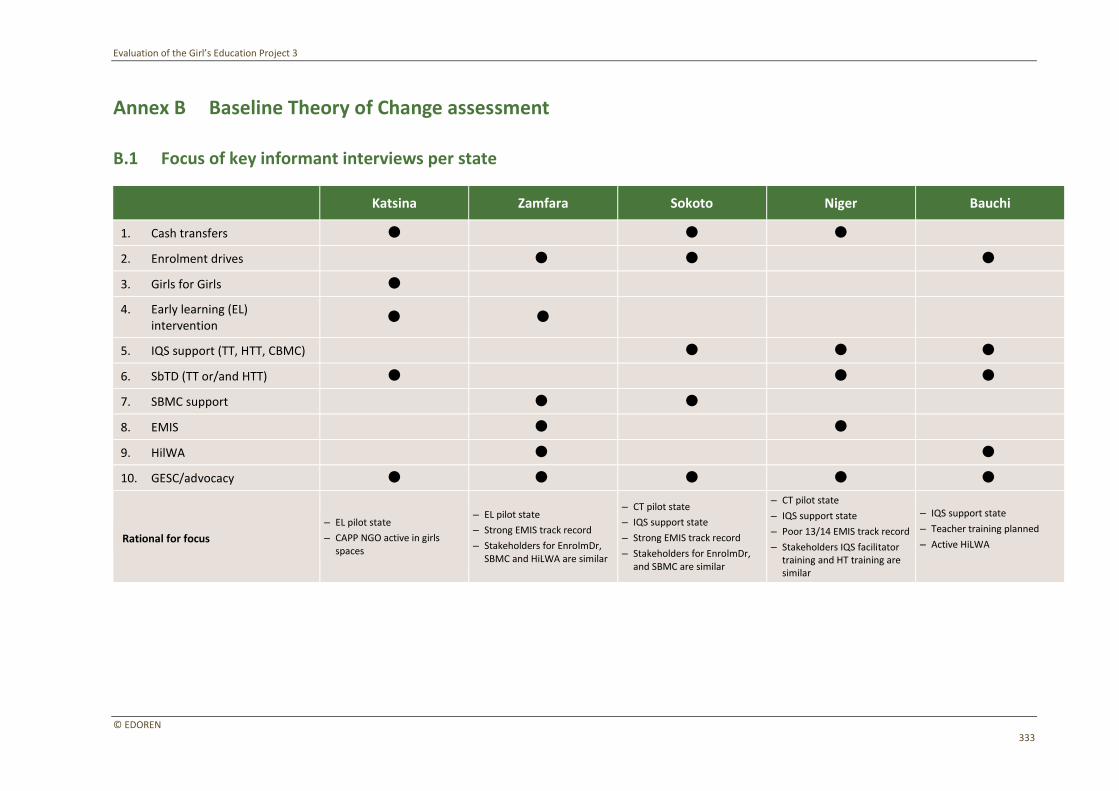
Evaluation of the Girl’s Education Project 3
© EDOREN 333
Annex B Baseline Theory of Change assessment
B.1 Focus of key informant interviews per state
Katsina Zamfara Sokoto Niger Bauchi
1. Cash transfers
2. Enrolment drives
3. Girls for Girls
4. Early learning (EL) intervention
5. IQS support (TT, HTT, CBMC)
6. SbTD (TT or/and HTT)
7. SBMC support
8. EMIS
9. HilWA
10. GESC/advocacy
Rational for focus
‒ EL pilot state
‒ CAPP NGO active in girls spaces
‒ EL pilot state
‒ Strong EMIS track record
‒ Stakeholders for EnrolmDr, SBMC and HiLWA are similar
‒ CT pilot state
‒ IQS support state
‒ Strong EMIS track record
‒ Stakeholders for EnrolmDr, and SBMC are similar
‒ CT pilot state
‒ IQS support state
‒ Poor 13/14 EMIS track record
‒ Stakeholders IQS facilitator training and HT training are similar
‒ IQS support state
‒ Teacher training planned
‒ Active HiLWA
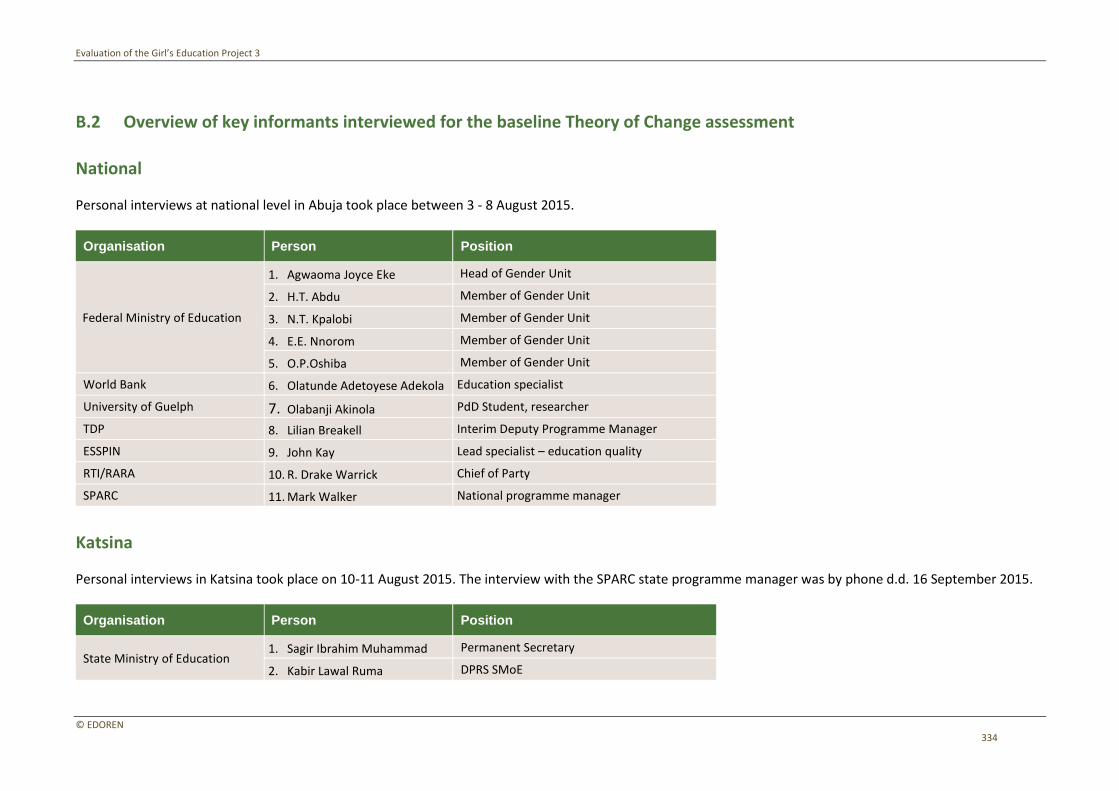
Evaluation of the Girl’s Education Project 3
© EDOREN 334
B.2 Overview of key informants interviewed for the baseline Theory of Change assessment
National
Personal interviews at national level in Abuja took place between 3 - 8 August 2015.
Organisation Person Position
Federal Ministry of Education
1. Agwaoma Joyce Eke Head of Gender Unit
2. H.T. Abdu Member of Gender Unit
3. N.T. Kpalobi Member of Gender Unit
4. E.E. Nnorom Member of Gender Unit
5. O.P.Oshiba Member of Gender Unit
World Bank 6. Olatunde Adetoyese Adekola Education specialist
University of Guelph 7. Olabanji Akinola PdD Student, researcher
TDP 8. Lilian Breakell Interim Deputy Programme Manager
ESSPIN 9. John Kay Lead specialist – education quality
RTI/RARA 10. R. Drake Warrick Chief of Party
SPARC 11. Mark Walker National programme manager
Katsina
Personal interviews in Katsina took place on 10-11 August 2015. The interview with the SPARC state programme manager was by phone d.d. 16 September 2015.
Organisation Person Position
State Ministry of Education 1. Sagir Ibrahim Muhammad Permanent Secretary
2. Kabir Lawal Ruma DPRS SMoE
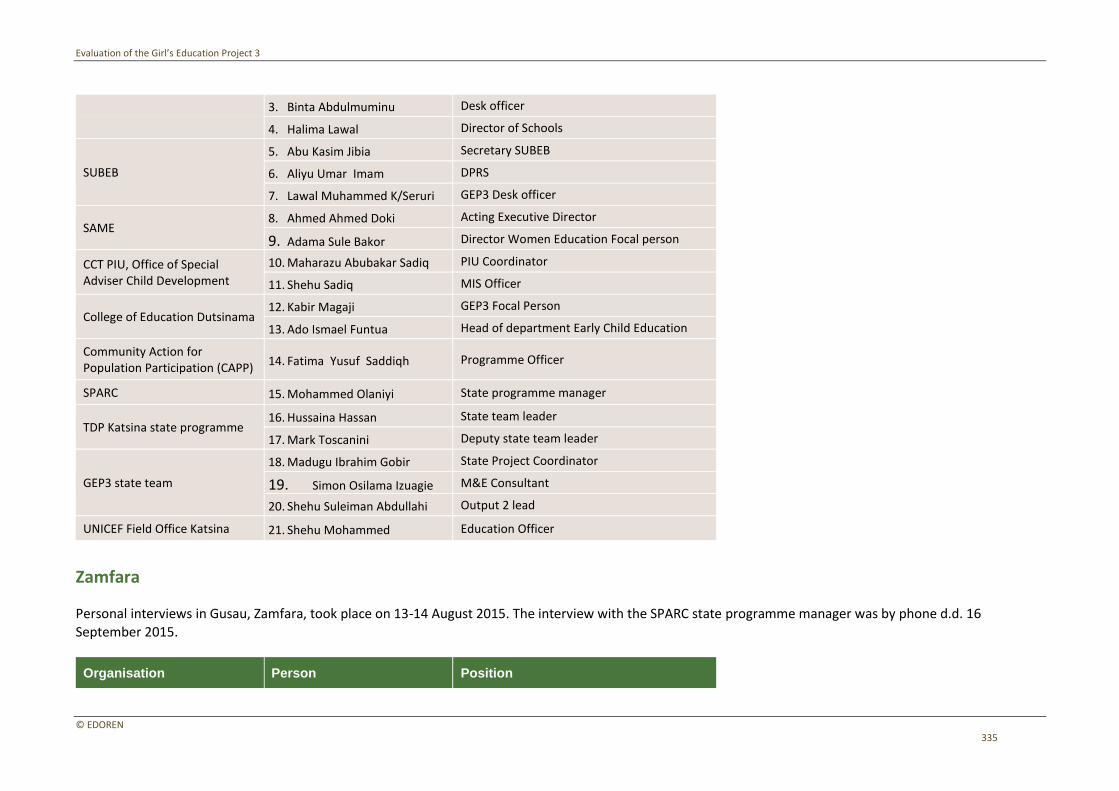
Evaluation of the Girl’s Education Project 3
© EDOREN 335
3. Binta Abdulmuminu Desk officer
4. Halima Lawal Director of Schools
SUBEB
5. Abu Kasim Jibia Secretary SUBEB
6. Aliyu Umar Imam DPRS
7. Lawal Muhammed K/Seruri GEP3 Desk officer
SAME 8. Ahmed Ahmed Doki Acting Executive Director
9. Adama Sule Bakor Director Women Education Focal person
CCT PIU, Office of Special Adviser Child Development
10. Maharazu Abubakar Sadiq PIU Coordinator
11. Shehu Sadiq MIS Officer
College of Education Dutsinama 12. Kabir Magaji GEP3 Focal Person
13. Ado Ismael Funtua Head of department Early Child Education
Community Action for Population Participation (CAPP)
14. Fatima Yusuf Saddiqh Programme Officer
SPARC 15. Mohammed Olaniyi State programme manager
TDP Katsina state programme 16. Hussaina Hassan State team leader
17. Mark Toscanini Deputy state team leader
GEP3 state team
18. Madugu Ibrahim Gobir State Project Coordinator
19. Simon Osilama Izuagie M&E Consultant
20. Shehu Suleiman Abdullahi Output 2 lead
UNICEF Field Office Katsina 21. Shehu Mohammed Education Officer
Zamfara
Personal interviews in Gusau, Zamfara, took place on 13-14 August 2015. The interview with the SPARC state programme manager was by phone d.d. 16 September 2015.
Organisation Person Position
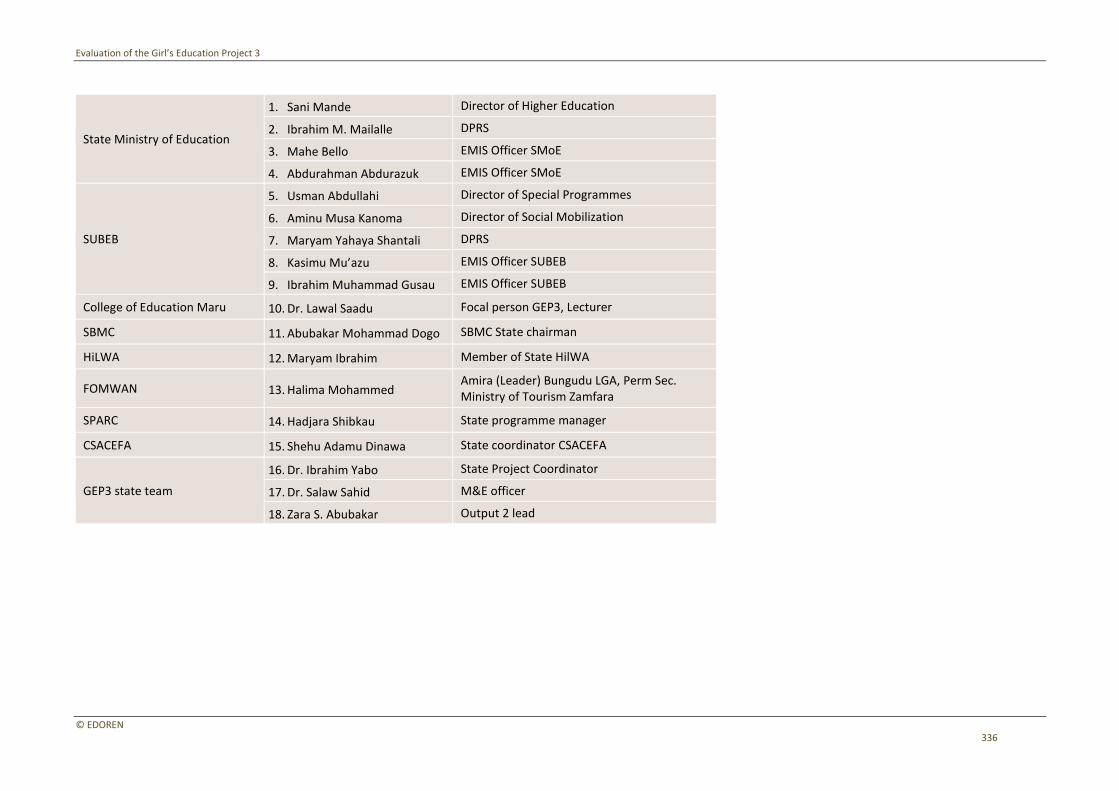
Evaluation of the Girl’s Education Project 3
© EDOREN 336
State Ministry of Education
1. Sani Mande Director of Higher Education
2. Ibrahim M. Mailalle DPRS
3. Mahe Bello EMIS Officer SMoE
4. Abdurahman Abdurazuk EMIS Officer SMoE
SUBEB
5. Usman Abdullahi Director of Special Programmes
6. Aminu Musa Kanoma Director of Social Mobilization
7. Maryam Yahaya Shantali DPRS
8. Kasimu Mu’azu EMIS Officer SUBEB
9. Ibrahim Muhammad Gusau EMIS Officer SUBEB
College of Education Maru 10. Dr. Lawal Saadu Focal person GEP3, Lecturer
SBMC 11. Abubakar Mohammad Dogo SBMC State chairman
HiLWA 12. Maryam Ibrahim Member of State HilWA
FOMWAN 13. Halima Mohammed Amira (Leader) Bungudu LGA, Perm Sec. Ministry of Tourism Zamfara
SPARC 14. Hadjara Shibkau State programme manager
CSACEFA 15. Shehu Adamu Dinawa State coordinator CSACEFA
GEP3 state team
16. Dr. Ibrahim Yabo State Project Coordinator
17. Dr. Salaw Sahid M&E officer
18. Zara S. Abubakar Output 2 lead
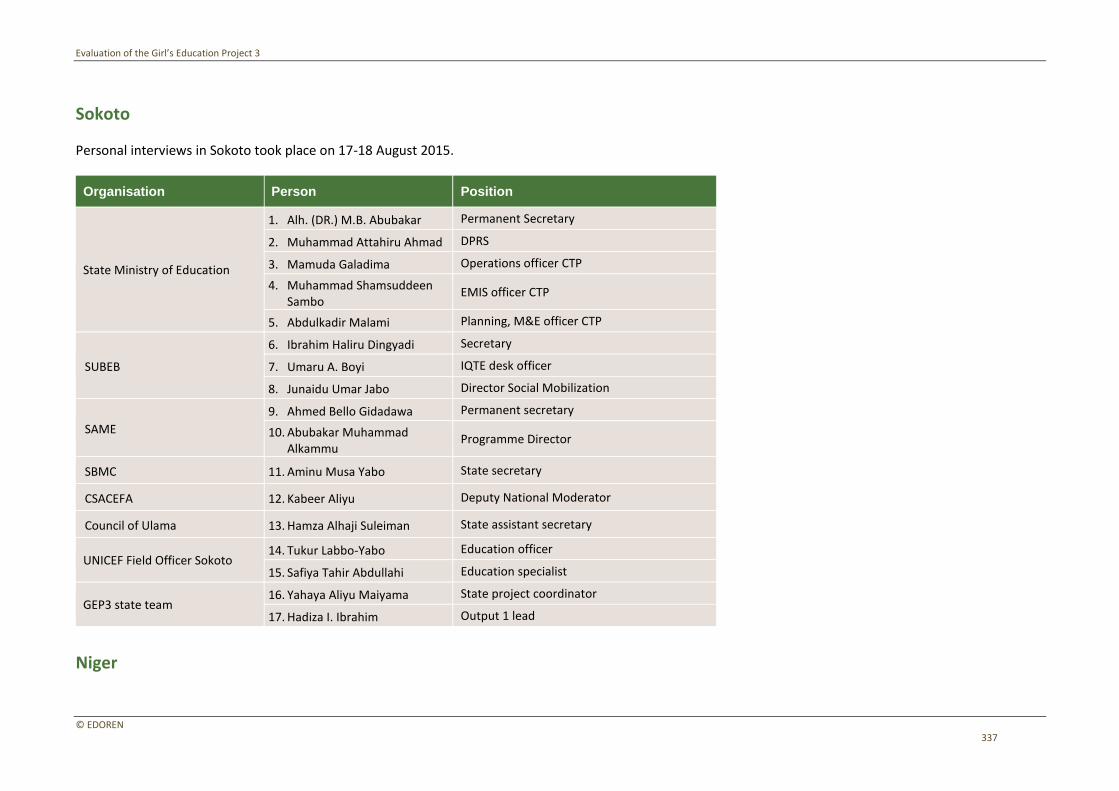
Evaluation of the Girl’s Education Project 3
© EDOREN 337
Sokoto
Personal interviews in Sokoto took place on 17-18 August 2015.
Organisation Person Position
State Ministry of Education
1. Alh. (DR.) M.B. Abubakar Permanent Secretary
2. Muhammad Attahiru Ahmad DPRS
3. Mamuda Galadima Operations officer CTP
4. Muhammad Shamsuddeen Sambo
EMIS officer CTP
5. Abdulkadir Malami Planning, M&E officer CTP
SUBEB
6. Ibrahim Haliru Dingyadi Secretary
7. Umaru A. Boyi IQTE desk officer
8. Junaidu Umar Jabo Director Social Mobilization
SAME
9. Ahmed Bello Gidadawa Permanent secretary
10. Abubakar Muhammad Alkammu
Programme Director
SBMC 11. Aminu Musa Yabo State secretary
CSACEFA 12. Kabeer Aliyu Deputy National Moderator
Council of Ulama 13. Hamza Alhaji Suleiman State assistant secretary
UNICEF Field Officer Sokoto 14. Tukur Labbo-Yabo Education officer
15. Safiya Tahir Abdullahi Education specialist
GEP3 state team 16. Yahaya Aliyu Maiyama State project coordinator
17. Hadiza I. Ibrahim Output 1 lead
Niger
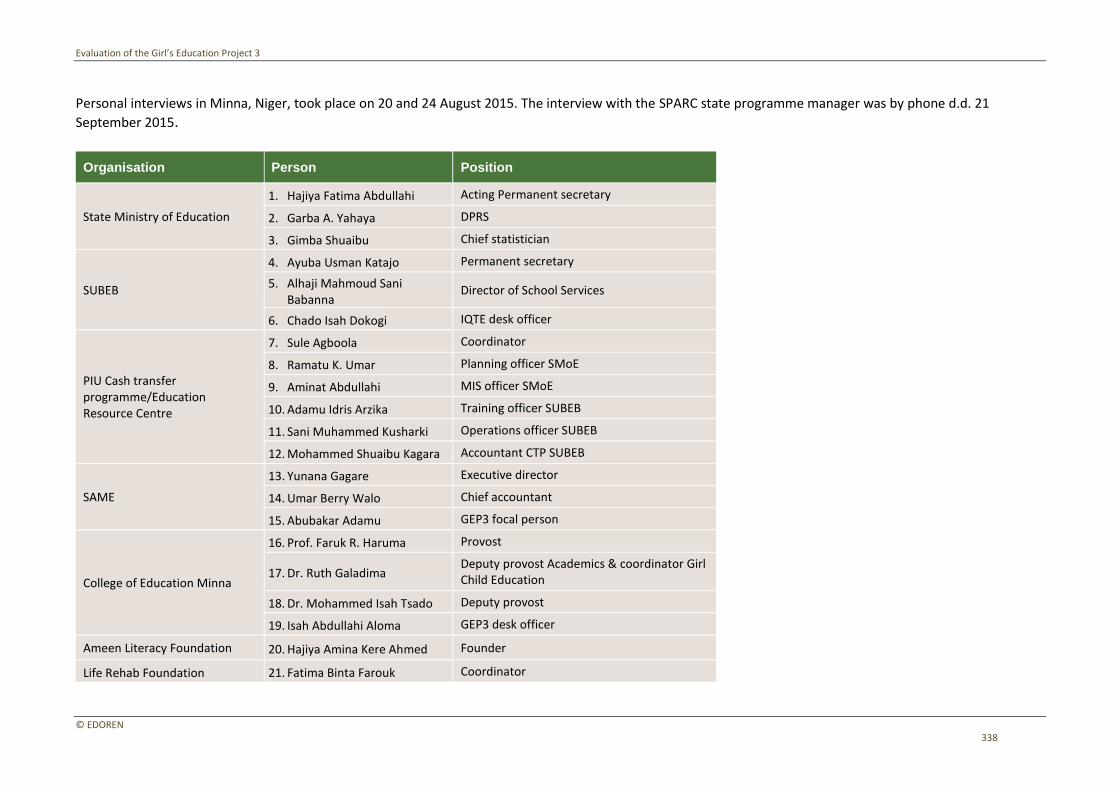
Evaluation of the Girl’s Education Project 3
© EDOREN 338
Personal interviews in Minna, Niger, took place on 20 and 24 August 2015. The interview with the SPARC state programme manager was by phone d.d. 21
September 2015.
Organisation Person Position
State Ministry of Education
1. Hajiya Fatima Abdullahi Acting Permanent secretary
2. Garba A. Yahaya DPRS
3. Gimba Shuaibu Chief statistician
SUBEB
4. Ayuba Usman Katajo Permanent secretary
5. Alhaji Mahmoud Sani Babanna
Director of School Services
6. Chado Isah Dokogi IQTE desk officer
PIU Cash transfer programme/Education Resource Centre
7. Sule Agboola Coordinator
8. Ramatu K. Umar Planning officer SMoE
9. Aminat Abdullahi MIS officer SMoE
10. Adamu Idris Arzika Training officer SUBEB
11. Sani Muhammed Kusharki Operations officer SUBEB
12. Mohammed Shuaibu Kagara Accountant CTP SUBEB
SAME
13. Yunana Gagare Executive director
14. Umar Berry Walo Chief accountant
15. Abubakar Adamu GEP3 focal person
College of Education Minna
16. Prof. Faruk R. Haruma Provost
17. Dr. Ruth Galadima Deputy provost Academics & coordinator Girl Child Education
18. Dr. Mohammed Isah Tsado Deputy provost
19. Isah Abdullahi Aloma GEP3 desk officer
Ameen Literacy Foundation 20. Hajiya Amina Kere Ahmed Founder
Life Rehab Foundation 21. Fatima Binta Farouk Coordinator
Evaluation of the Girl’s Education Project 3
© EDOREN 339
22. Dr. Mrs. Ladi Shambo
23. Yhuza A. Abdullahi
24. Emmanuel Amuta
25. Kabiru Ahmed
SPARC 26. Grace Okuchuwi State programme manager
UNICEF Field Office Kaduna 27. Elizabeth Obaba Education officer
GEP3 state team
28. Ibrahim U. Nagwamatse State project coordinator
29. Saka Adebayo Ibrahim M&E officer
30. Hauwa Abdulkadir Output 1 lead
31. Yusuf Kobo Ango Output 2 lead
Bauchi
Personal interviews in Bauchi took place on 25 - 27 August 2015.
Organisation Person Position
State ministry of education
1. Nasiru Muhammad Yalwa Permanent Secretary
2. Dan Azumi Zakari Tilde DPRS
3. Umar Sani GEP3 focal person
4. Binta Sambo Director School Services
5. Louis B. Musa Director Policy
SUBEB
6. Sabo Bappayo Ahmed Permanent Secretary
7. Abdullazeez Saibo State Almajiri officer
8. Muhammad Bello IQE Desk Officer
9. Ismail H. Umar Director Social mobilization
College of Education Azare 10. Bose Odeyemi Head of Department Early Childhood Care Education (Head Teacher Desk Officer)
Evaluation of the Girl’s Education Project 3
© EDOREN 340
11. Shehu Mohammed Senior Lecturer School of Science (Desk Officer SbTD)
BASAME
12. Hauwa Abubakar Balewa
Executive Secretary
13. Halilu Usman Rishi Director Literacy/IQS
14. Asabe Lawa GEP3 focal person
15. Abubakar Maishanu Desk Officer IQS
RARA 16. Sadiq Ilelah Research coordinator
17. Emengu Augustus M&E advisor
HiLWA
18. Jummei S. Abudcar Chair HiLWA
19. Tabittaa Sabo Deputy chair HiLWA
20. Zainab A. Gidado Member HiLWA
21. Victoria Yusuf Secretary HiLWA
22. Salamatu A. Lasan Member HiLWA
23. Tabitha C. Shawulu Member HiLWA
Rahama Women Development Programme
24. Miriam Iilya Executive director
Fahimta Women and Youth Development Initiative
25. Maryam Garba Executive director
UNICEF Field Office Bauchi 26. Muntake M. Mukhtar Education officer
GEP3 state team 27. Saleh Muhammed State project coordinator
28. Bimbi Tahir Output 1 lead
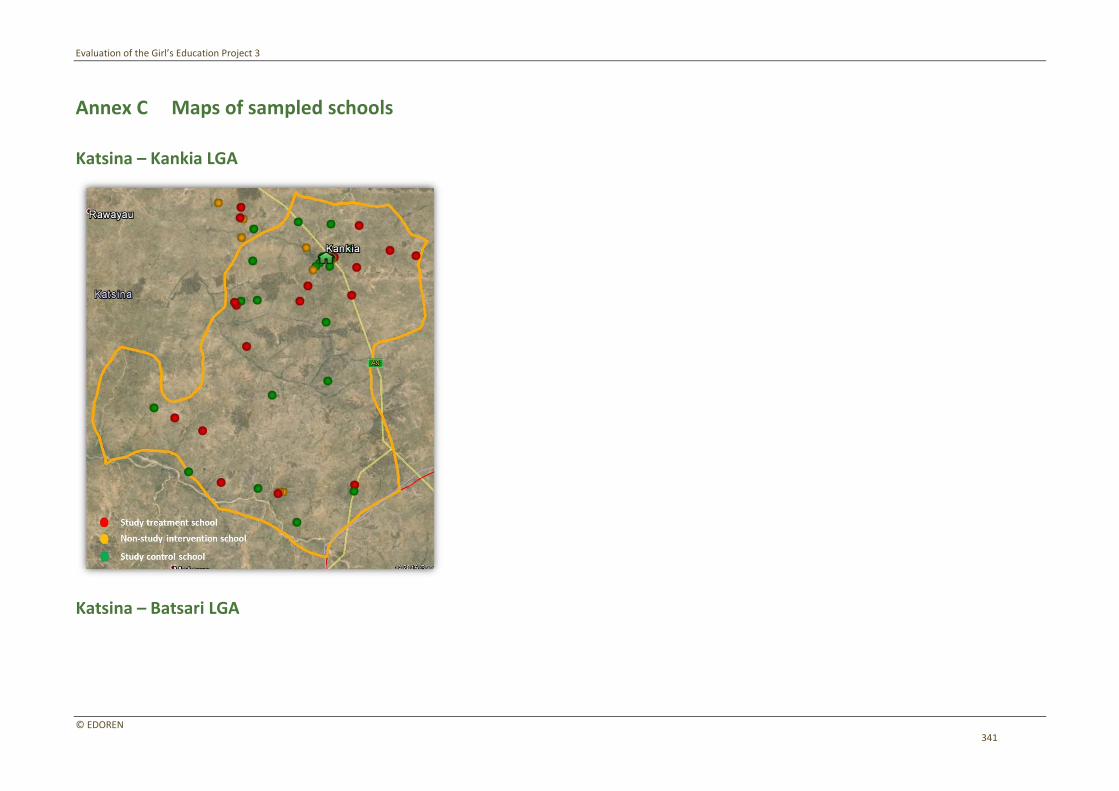
Evaluation of the Girl’s Education Project 3
© EDOREN 341
Annex C Maps of sampled schools
Katsina – Kankia LGA
Katsina – Batsari LGA
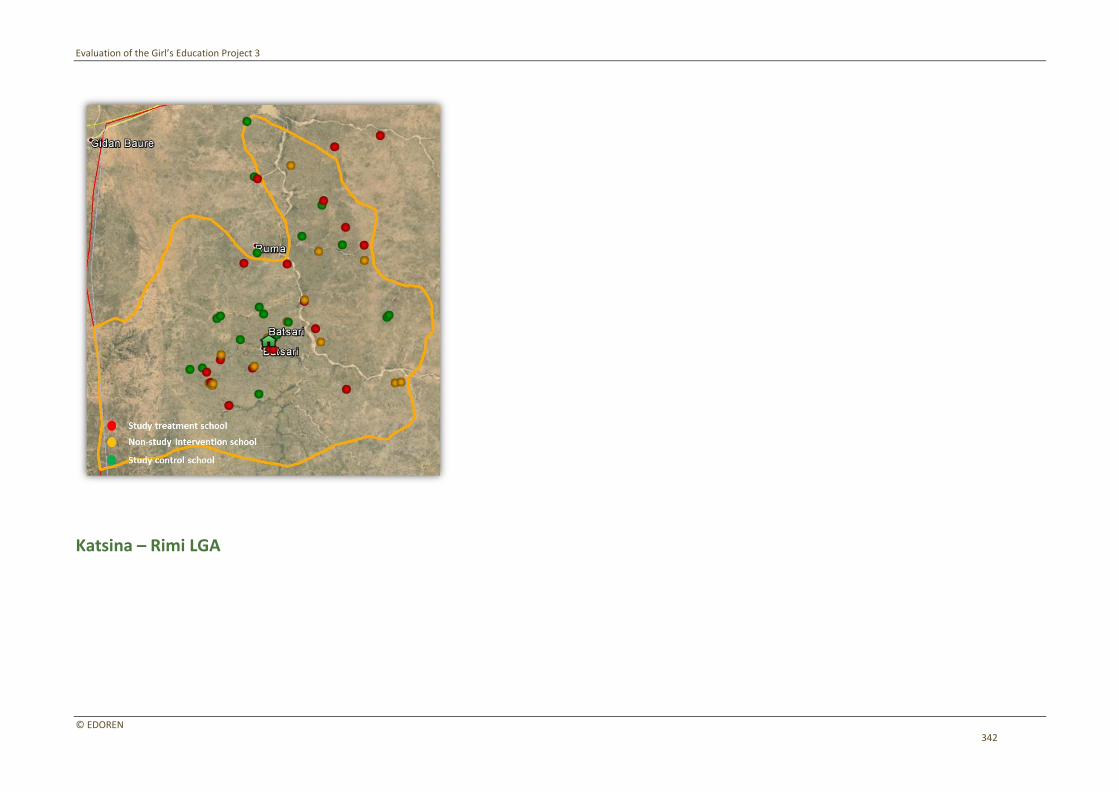
Evaluation of the Girl’s Education Project 3
© EDOREN 342
Katsina – Rimi LGA
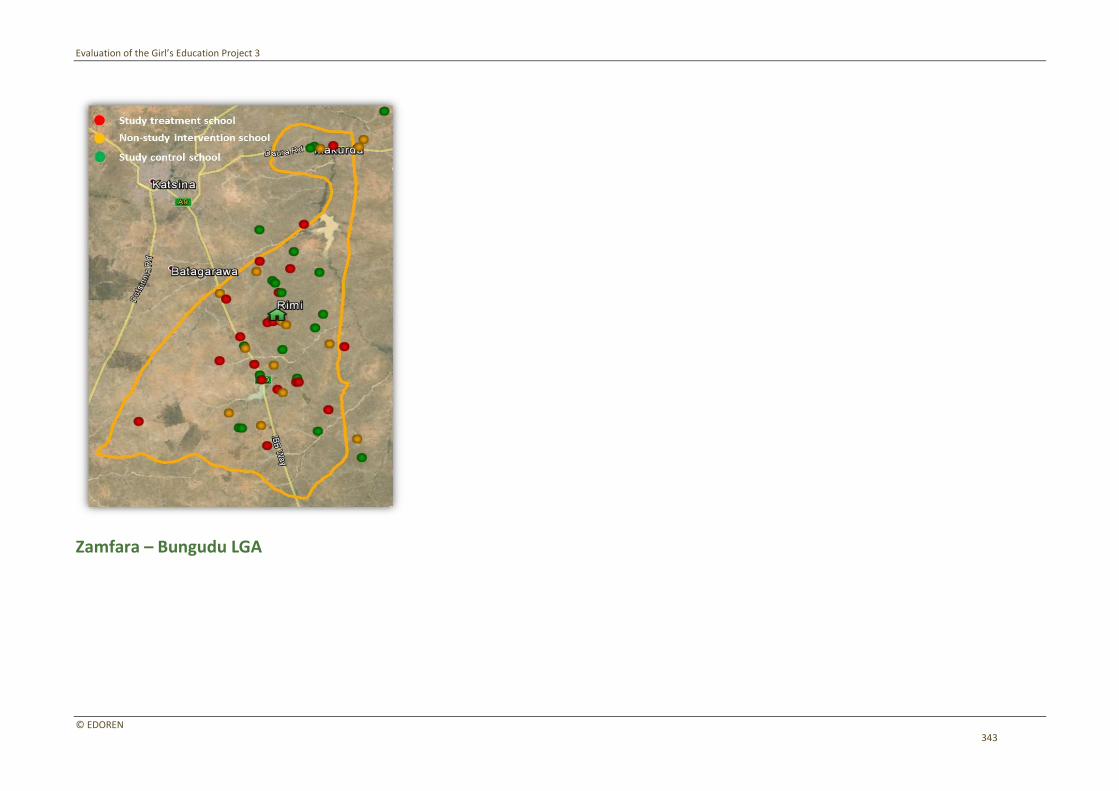
Evaluation of the Girl’s Education Project 3
© EDOREN 343
Zamfara – Bungudu LGA

Evaluation of the Girl’s Education Project 3
© EDOREN 344
Zamfara – Kaura Namoda LGA
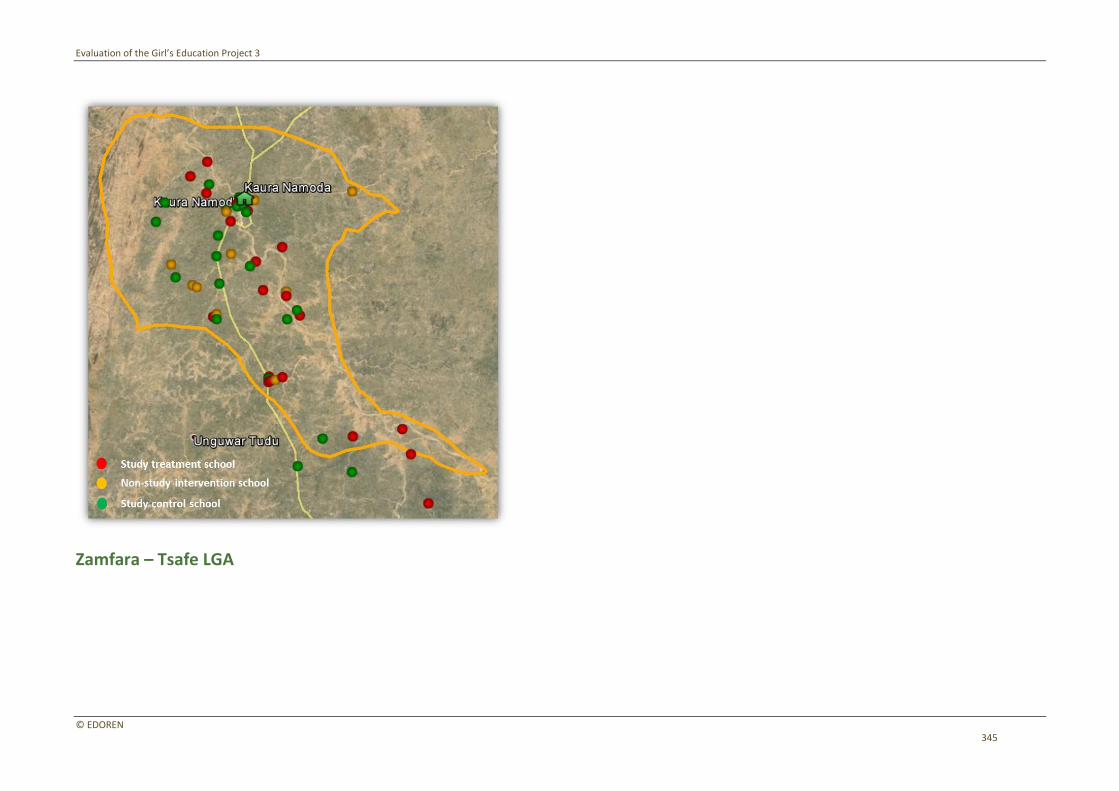
Evaluation of the Girl’s Education Project 3
© EDOREN 345
Zamfara – Tsafe LGA
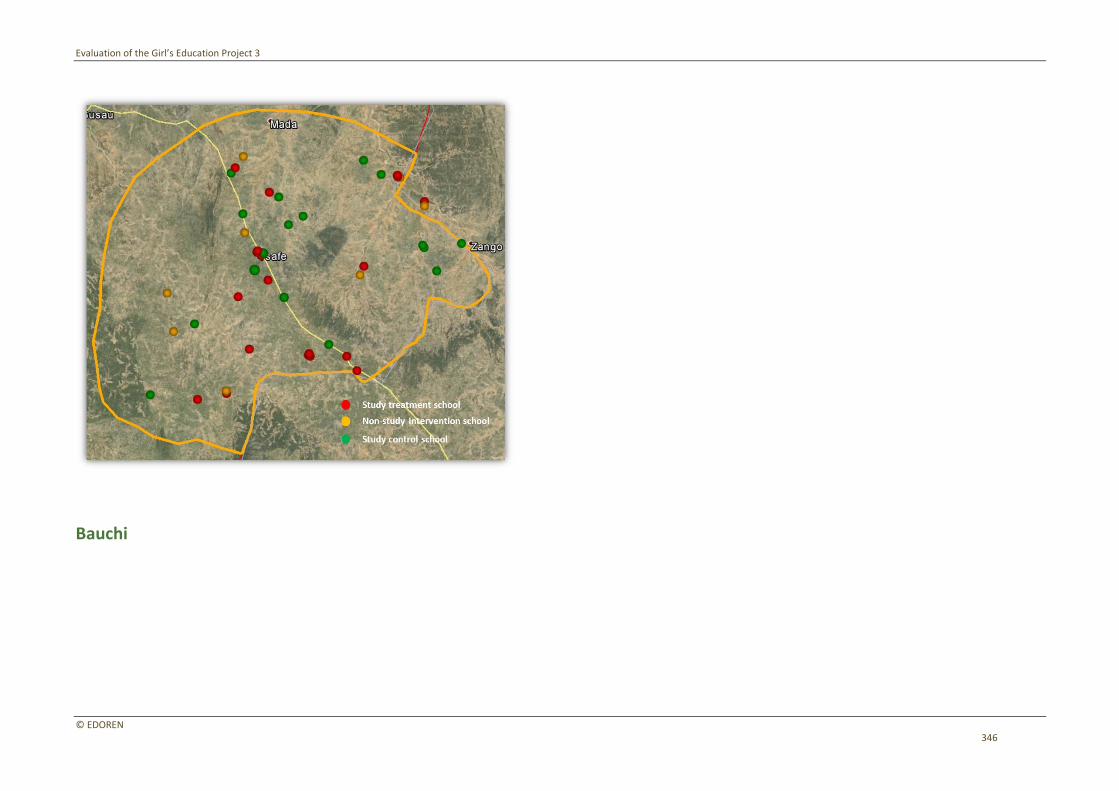
Evaluation of the Girl’s Education Project 3
© EDOREN 346
Bauchi
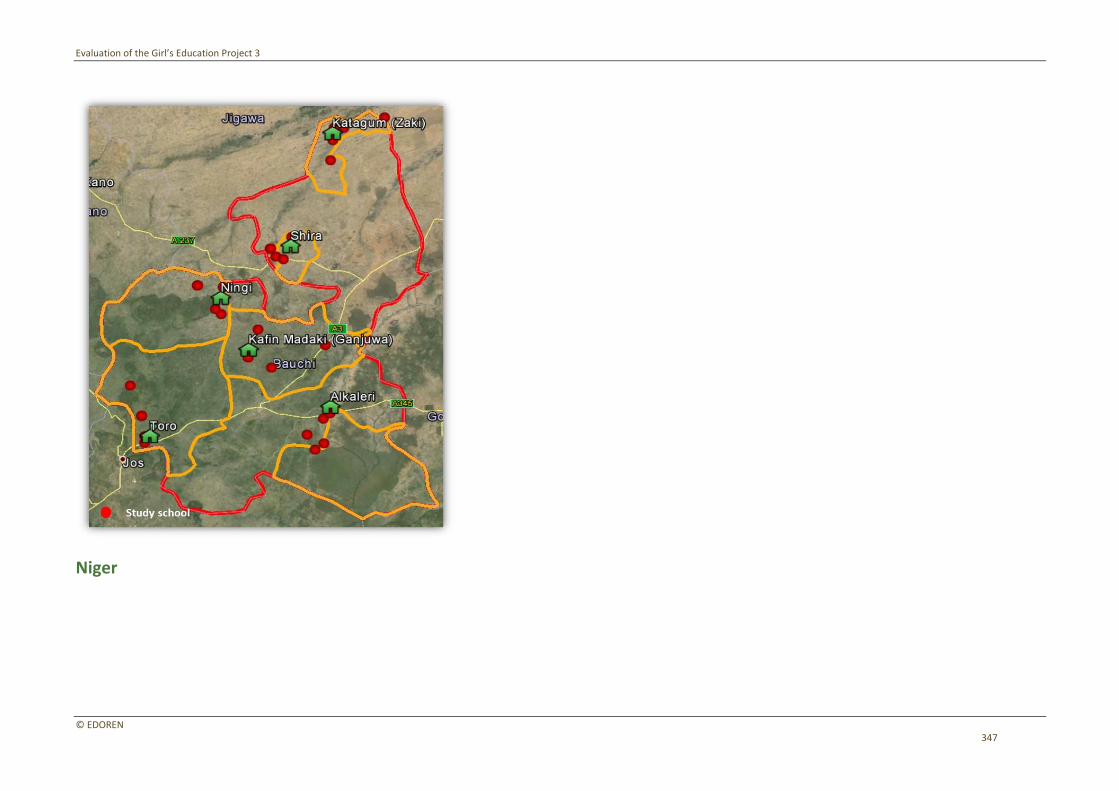
Evaluation of the Girl’s Education Project 3
© EDOREN 347
Niger
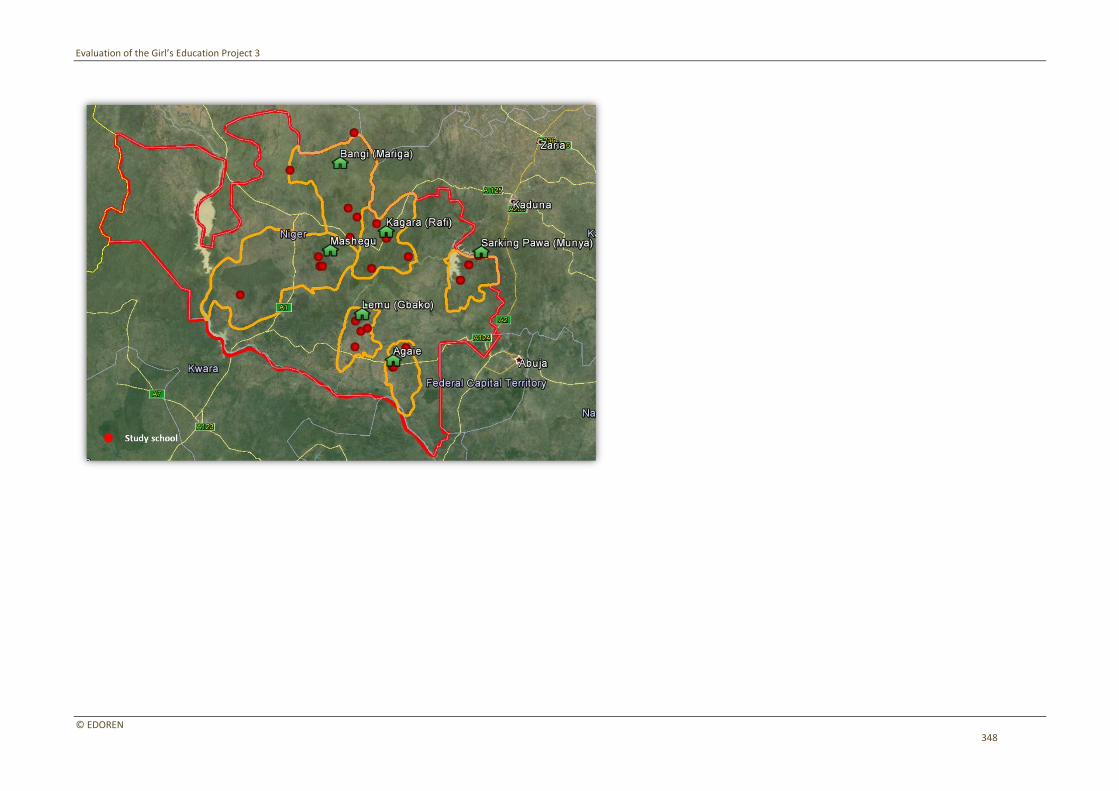
Evaluation of the Girl’s Education Project 3
© EDOREN 348
Evaluation of the Girl’s Education Project 3
© EDOREN 349
Annex D Calculation of Weights and Finite Population Correction Factors for GEP3 School, Teacher and Pupil Data
D.1 Calculation of GEP3 Weights
The weighting procedures for the GEP3 data reflect the overall design and implementation of the sample, described in a previous section of this report. The
combined sampling frame consists of all the eligible public and integrated Qur’anic schools (IQS) included in the GEP3 project in four states in northern Nigeria:
Zamfara, Katsina, Niger and Bauchi. The GEP3 project operates in 6 selected LGAs in each state. In Zamfara and Katsina 3 LGAs out of the 6 available have been
selected to be included in this current study. The selection of the LGAs was purposive and lead by UNICEF. The stratum corresponds to state/LGA and type (public school or IQS) in the frame for each domain, and the primary sampling units (PSUs) are the schools.
The GEP3 baseline survey is designed to evaluate two separate interventions under a overall GEP3 project: early learning intervention (RANA) and IQS support. In the case of the early learning intervention the schools were randomised into treatment and control groups as part of the evaluation. Since the sample treatment and control schools are each representative of the frame for the corresponding domain, the weights were calculated separately for each.
In order to maintain the effective sample size, any sample school for which data could not be collected (because of eligibility or response problems) was replaced.
It was necessary to select more than one random set of reserve schools for replacement in some strata. Each set of replacement schools was selected randomly
from the remaining schools that had yet not been selected in the corresponding stratum. Since all schools within the stratum had the same probability of being
selected either in the original sample or in one of the sets of replacements, ultimately each school in the final completed sample for each stratum had the same probability of selection and corresponding weight, regardless whether it was an original sample school or from one of the sets of replacements.
When some of the sample schools were contacted during the sampling implementation it was found that they did not meet the criteria for eligibility. This was especially a problem for IQS, since many schools were not implementing the teaching programs as mandated. As a result, the corresponding frame for each
stratum was reduced. All of the schools in the original and replacement samples that were contacted were classified as eligible or ineligible. However, the
eligibility of the remaining (non-contacted) schools in the frame is unknown. In order to estimate how many schools in the frame for each stratum were eligible, it was necessary to calculate the proportion of eligible schools among those with information, and multiply the total number of schools in the frame for that stratum
by the corresponding proportion.
Within each stratum, the sample schools were selected with equal probability. Therefore the weight for the schools in each stratum would be calculated as follows:
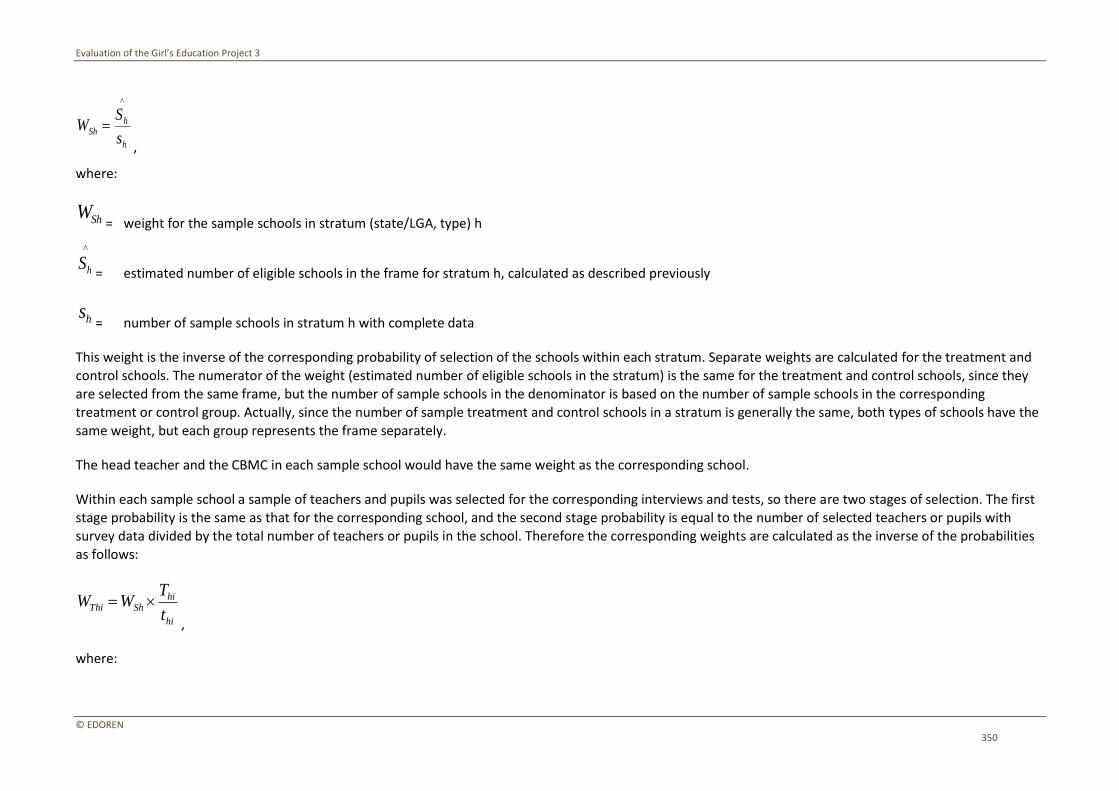
Evaluation of the Girl’s Education Project 3
© EDOREN 350
,
where:
= weight for the sample schools in stratum (state/LGA, type) h
= estimated number of eligible schools in the frame for stratum h, calculated as described previously
= number of sample schools in stratum h with complete data
This weight is the inverse of the corresponding probability of selection of the schools within each stratum. Separate weights are calculated for the treatment and control schools. The numerator of the weight (estimated number of eligible schools in the stratum) is the same for the treatment and control schools, since they
are selected from the same frame, but the number of sample schools in the denominator is based on the number of sample schools in the corresponding treatment or control group. Actually, since the number of sample treatment and control schools in a stratum is generally the same, both types of schools have the
same weight, but each group represents the frame separately.
The head teacher and the CBMC in each sample school would have the same weight as the corresponding school.
Within each sample school a sample of teachers and pupils was selected for the corresponding interviews and tests, so there are two stages of selection. The first stage probability is the same as that for the corresponding school, and the second stage probability is equal to the number of selected teachers or pupils with survey data divided by the total number of teachers or pupils in the school. Therefore the corresponding weights are calculated as the inverse of the probabilities
as follows:
,
where:
h
hSh
s
SW
^
ShW
^
hS
hs
hi
hiShThi
t
TWW
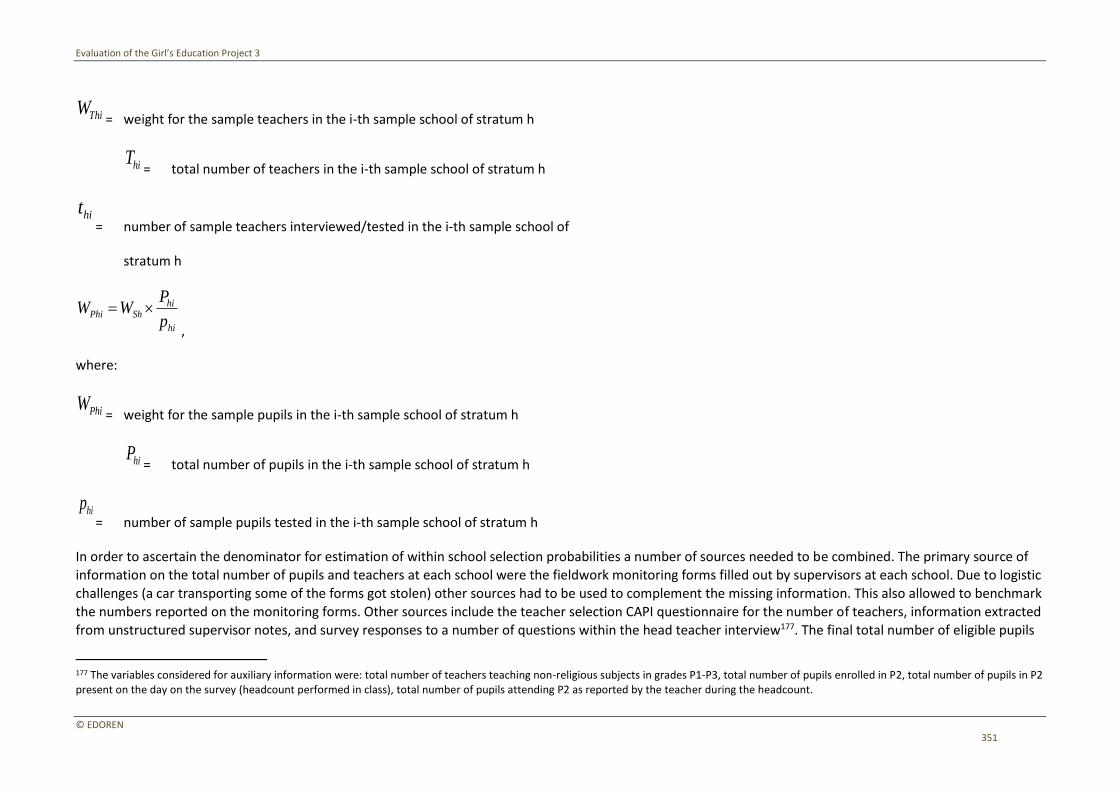
Evaluation of the Girl’s Education Project 3
© EDOREN 351
= weight for the sample teachers in the i-th sample school of stratum h
= total number of teachers in the i-th sample school of stratum h
= number of sample teachers interviewed/tested in the i-th sample school of
stratum h
,
where:
= weight for the sample pupils in the i-th sample school of stratum h
= total number of pupils in the i-th sample school of stratum h
= number of sample pupils tested in the i-th sample school of stratum h
In order to ascertain the denominator for estimation of within school selection probabilities a number of sources needed to be combined. The primary source of
information on the total number of pupils and teachers at each school were the fieldwork monitoring forms filled out by supervisors at each school. Due to logistic
challenges (a car transporting some of the forms got stolen) other sources had to be used to complement the missing information. This also allowed to benchmark
the numbers reported on the monitoring forms. Other sources include the teacher selection CAPI questionnaire for the number of teachers, information extracted from unstructured supervisor notes, and survey responses to a number of questions within the head teacher interview177. The final total number of eligible pupils
177 The variables considered for auxiliary information were: total number of teachers teaching non-religious subjects in grades P1-P3, total number of pupils enrolled in P2, total number of pupils in P2 present on the day on the survey (headcount performed in class), total number of pupils attending P2 as reported by the teacher during the headcount.
ThiW
hiT
hit
hi
hiShPhi
p
PWW
PhiW
hiP
hip
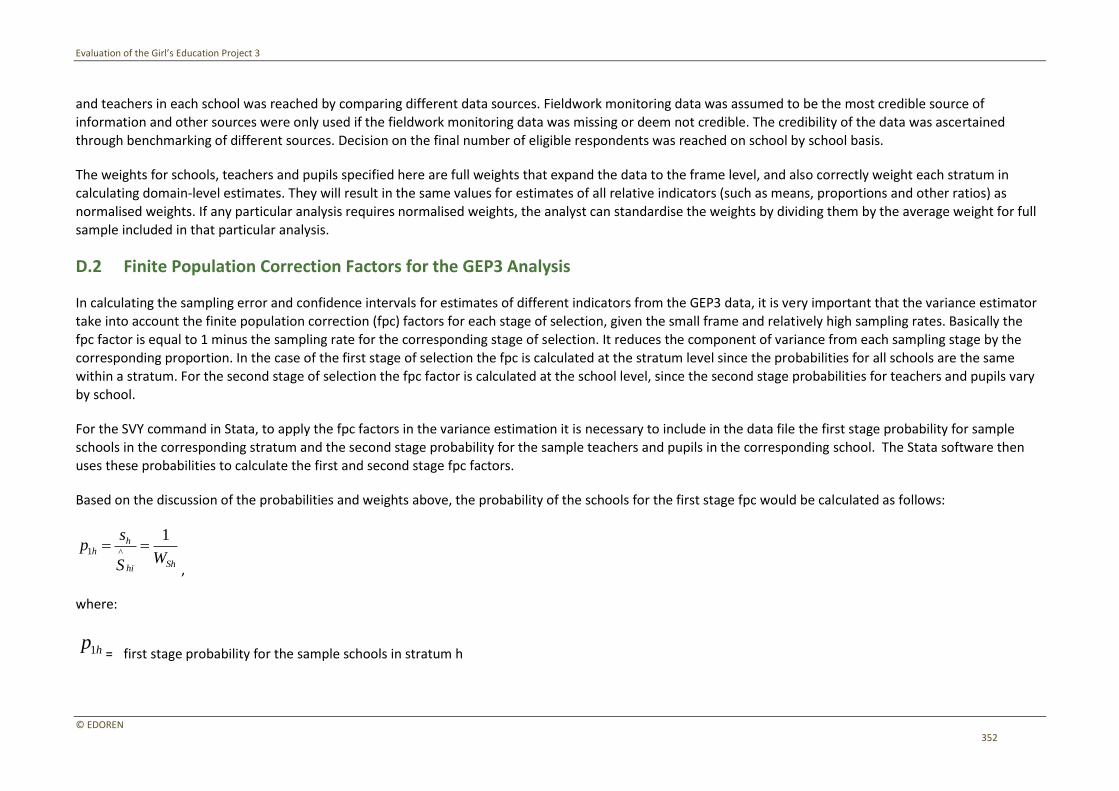
Evaluation of the Girl’s Education Project 3
© EDOREN 352
and teachers in each school was reached by comparing different data sources. Fieldwork monitoring data was assumed to be the most credible source of
information and other sources were only used if the fieldwork monitoring data was missing or deem not credible. The credibility of the data was ascertained
through benchmarking of different sources. Decision on the final number of eligible respondents was reached on school by school basis.
The weights for schools, teachers and pupils specified here are full weights that expand the data to the frame level, and also correctly weight each stratum in calculating domain-level estimates. They will result in the same values for estimates of all relative indicators (such as means, proportions and other ratios) as
normalised weights. If any particular analysis requires normalised weights, the analyst can standardise the weights by dividing them by the average weight for full sample included in that particular analysis.
D.2 Finite Population Correction Factors for the GEP3 Analysis
In calculating the sampling error and confidence intervals for estimates of different indicators from the GEP3 data, it is very important that the variance estimator
take into account the finite population correction (fpc) factors for each stage of selection, given the small frame and relatively high sampling rates. Basically the fpc factor is equal to 1 minus the sampling rate for the corresponding stage of selection. It reduces the component of variance from each sampling stage by the
corresponding proportion. In the case of the first stage of selection the fpc is calculated at the stratum level since the probabilities for all schools are the same within a stratum. For the second stage of selection the fpc factor is calculated at the school level, since the second stage probabilities for teachers and pupils vary by school.
For the SVY command in Stata, to apply the fpc factors in the variance estimation it is necessary to include in the data file the first stage probability for sample
schools in the corresponding stratum and the second stage probability for the sample teachers and pupils in the corresponding school. The Stata software then uses these probabilities to calculate the first and second stage fpc factors.
Based on the discussion of the probabilities and weights above, the probability of the schools for the first stage fpc would be calculated as follows:
,
where:
= first stage probability for the sample schools in stratum h
Shhi
hh
WS
sp
1^1
hp1
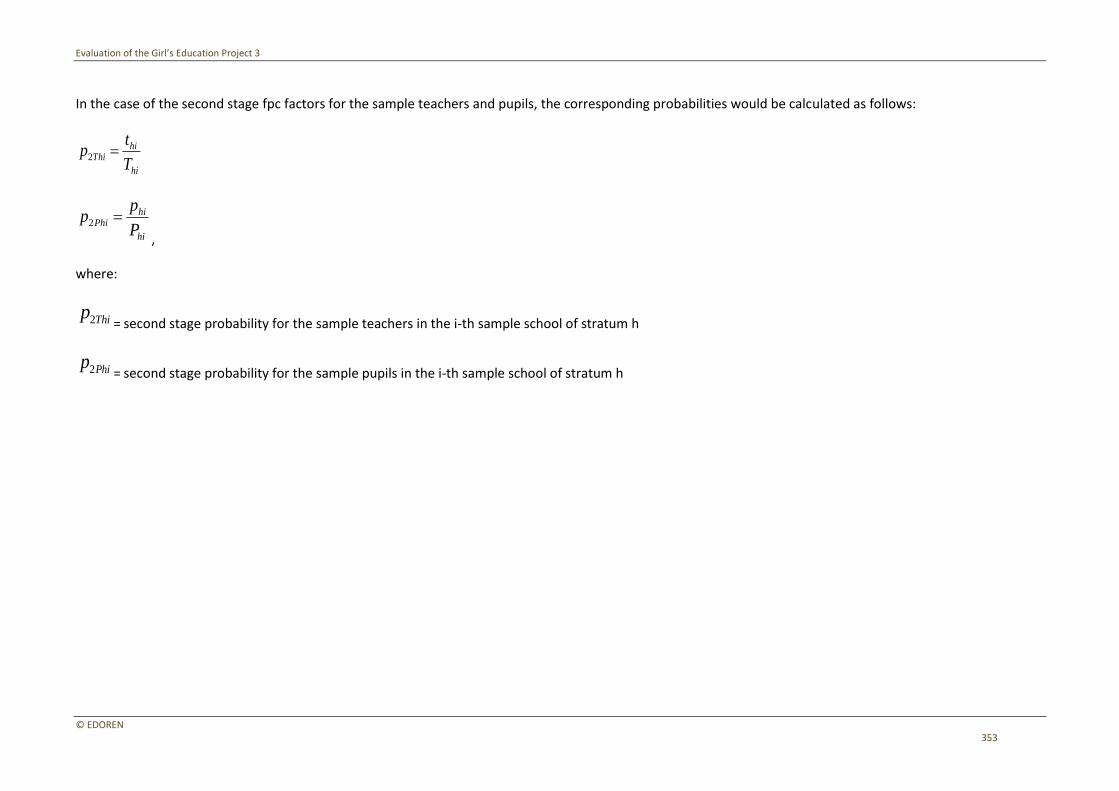
Evaluation of the Girl’s Education Project 3
© EDOREN 353
In the case of the second stage fpc factors for the sample teachers and pupils, the corresponding probabilities would be calculated as follows:
,
where:
= second stage probability for the sample teachers in the i-th sample school of stratum h
= second stage probability for the sample pupils in the i-th sample school of stratum h
hi
hiThi
T
tp 2
hi
hiPhi
P
pp 2
Thip2
Phip2

Evaluation of the Girl’s Education Project 3
© EDOREN 354
Annex E Ethical Review
Evaluation of the Girl’s Education Project 3
© EDOREN 355

Evaluation of the Girl’s Education Project 3
© EDOREN 356
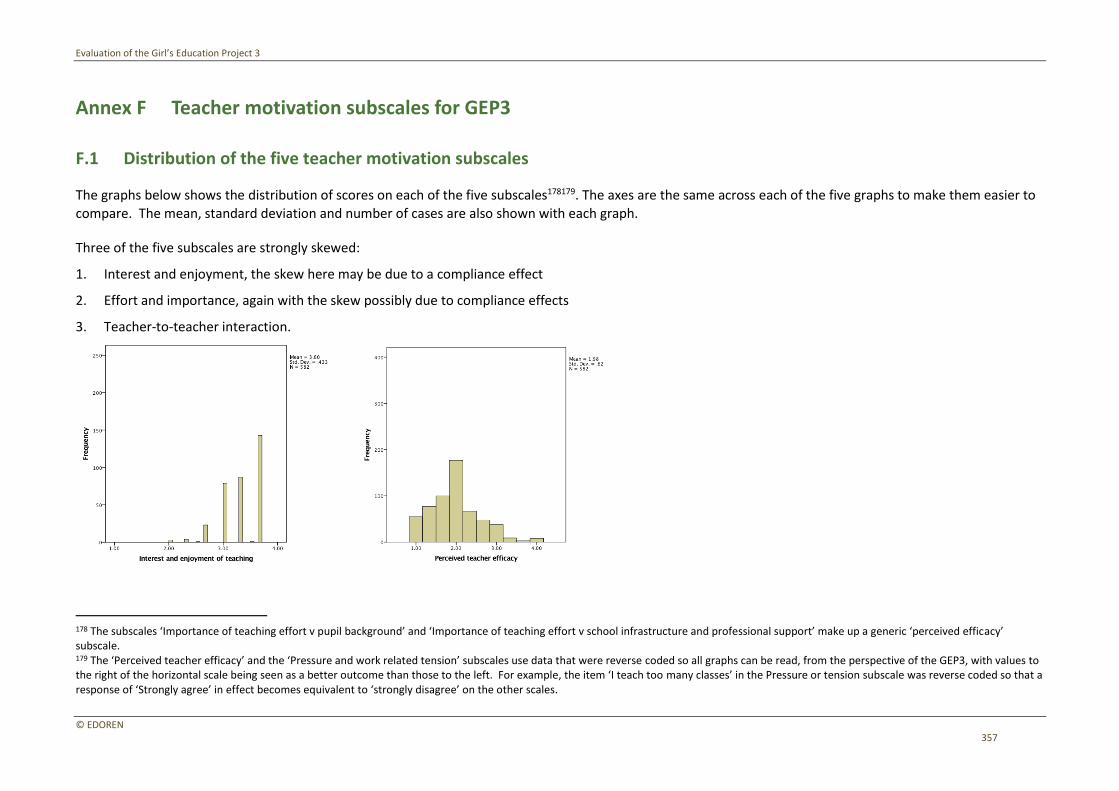
Evaluation of the Girl’s Education Project 3
© EDOREN 357
Annex F Teacher motivation subscales for GEP3
F.1 Distribution of the five teacher motivation subscales
The graphs below shows the distribution of scores on each of the five subscales178179. The axes are the same across each of the five graphs to make them easier to
compare. The mean, standard deviation and number of cases are also shown with each graph.
Three of the five subscales are strongly skewed:
1. Interest and enjoyment, the skew here may be due to a compliance effect
2. Effort and importance, again with the skew possibly due to compliance effects
3. Teacher-to-teacher interaction.
178 The subscales ‘Importance of teaching effort v pupil background’ and ‘Importance of teaching effort v school infrastructure and professional support’ make up a generic ‘perceived efficacy’ subscale. 179 The ‘Perceived teacher efficacy’ and the ‘Pressure and work related tension’ subscales use data that were reverse coded so all graphs can be read, from the perspective of the GEP3, with values to the right of the horizontal scale being seen as a better outcome than those to the left. For example, the item ‘I teach too many classes’ in the Pressure or tension subscale was reverse coded so that a response of ‘Strongly agree’ in effect becomes equivalent to ‘strongly disagree’ on the other scales.

Evaluation of the Girl’s Education Project 3
© EDOREN 358
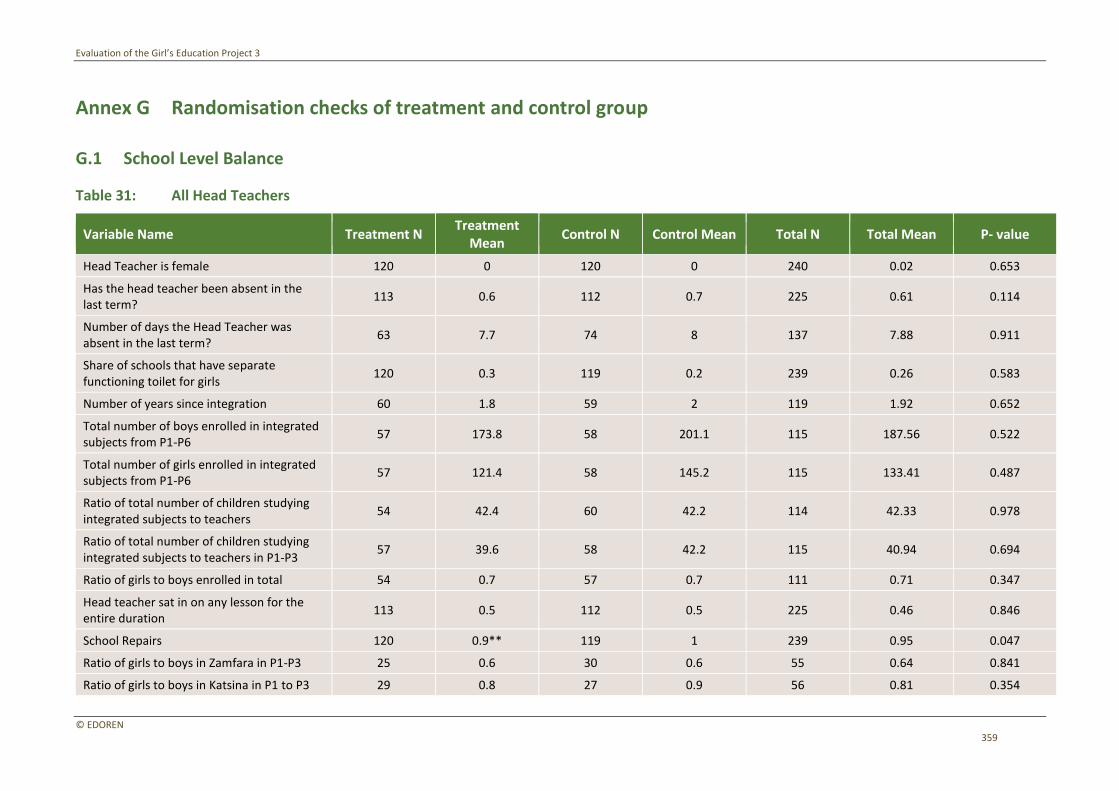
Evaluation of the Girl’s Education Project 3
© EDOREN 359
Annex G Randomisation checks of treatment and control group
G.1 School Level Balance
Table 31: All Head Teachers
Variable Name Treatment N Treatment
Mean Control N Control Mean Total N Total Mean P- value
Head Teacher is female 120 0 120 0 240 0.02 0.653
Has the head teacher been absent in the last term?
113 0.6 112 0.7 225 0.61 0.114
Number of days the Head Teacher was absent in the last term?
63 7.7 74 8 137 7.88 0.911
Share of schools that have separate functioning toilet for girls
120 0.3 119 0.2 239 0.26 0.583
Number of years since integration 60 1.8 59 2 119 1.92 0.652
Total number of boys enrolled in integrated subjects from P1-P6
57 173.8 58 201.1 115 187.56 0.522
Total number of girls enrolled in integrated subjects from P1-P6
57 121.4 58 145.2 115 133.41 0.487
Ratio of total number of children studying integrated subjects to teachers
54 42.4 60 42.2 114 42.33 0.978
Ratio of total number of children studying integrated subjects to teachers in P1-P3
57 39.6 58 42.2 115 40.94 0.694
Ratio of girls to boys enrolled in total 54 0.7 57 0.7 111 0.71 0.347
Head teacher sat in on any lesson for the entire duration
113 0.5 112 0.5 225 0.46 0.846
School Repairs 120 0.9** 119 1 239 0.95 0.047
Ratio of girls to boys in Zamfara in P1-P3 25 0.6 30 0.6 55 0.64 0.841
Ratio of girls to boys in Katsina in P1 to P3 29 0.8 27 0.9 56 0.81 0.354
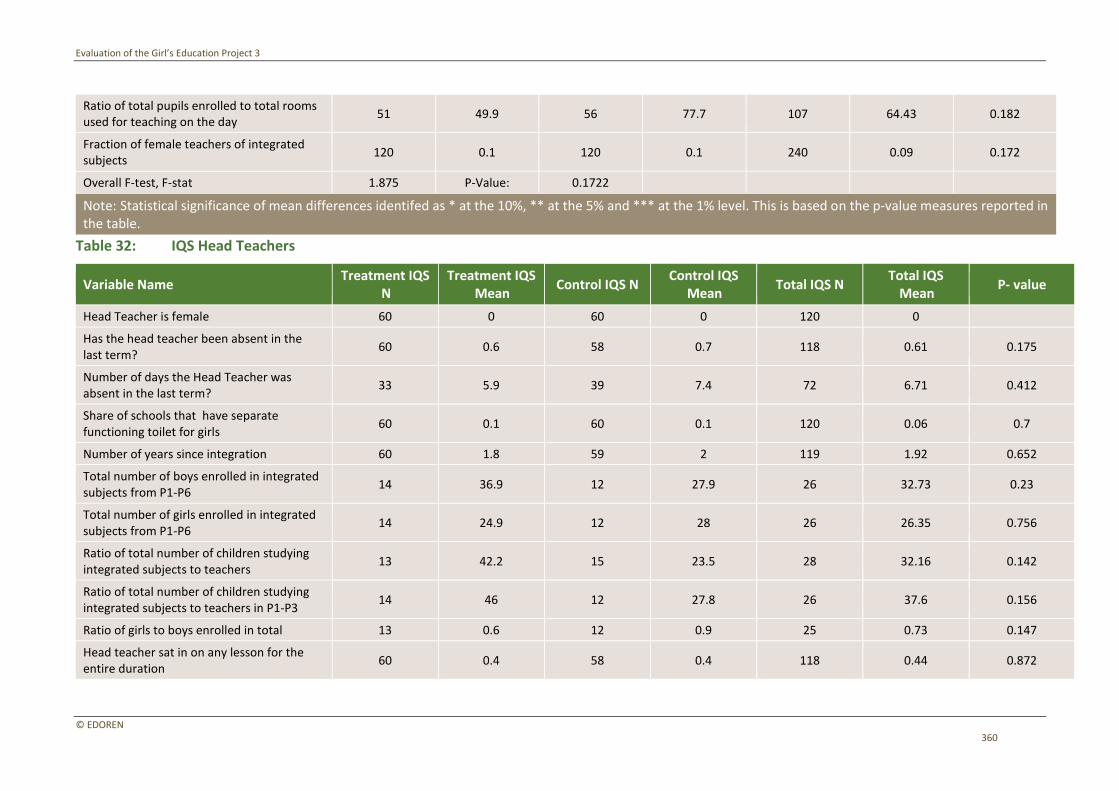
Evaluation of the Girl’s Education Project 3
© EDOREN 360
Ratio of total pupils enrolled to total rooms used for teaching on the day
51 49.9 56 77.7 107 64.43 0.182
Fraction of female teachers of integrated subjects
120 0.1 120 0.1 240 0.09 0.172
Overall F-test, F-stat 1.875 P-Value: 0.1722
Note: Statistical significance of mean differences identifed as * at the 10%, ** at the 5% and *** at the 1% level. This is based on the p-value measures reported in the table.
Table 32: IQS Head Teachers
Variable Name Treatment IQS
N Treatment IQS
Mean Control IQS N
Control IQS Mean
Total IQS N Total IQS
Mean P- value
Head Teacher is female 60 0 60 0 120 0
Has the head teacher been absent in the last term?
60 0.6 58 0.7 118 0.61 0.175
Number of days the Head Teacher was absent in the last term?
33 5.9 39 7.4 72 6.71 0.412
Share of schools that have separate functioning toilet for girls
60 0.1 60 0.1 120 0.06 0.7
Number of years since integration 60 1.8 59 2 119 1.92 0.652
Total number of boys enrolled in integrated subjects from P1-P6
14 36.9 12 27.9 26 32.73 0.23
Total number of girls enrolled in integrated subjects from P1-P6
14 24.9 12 28 26 26.35 0.756
Ratio of total number of children studying integrated subjects to teachers
13 42.2 15 23.5 28 32.16 0.142
Ratio of total number of children studying integrated subjects to teachers in P1-P3
14 46 12 27.8 26 37.6 0.156
Ratio of girls to boys enrolled in total 13 0.6 12 0.9 25 0.73 0.147
Head teacher sat in on any lesson for the entire duration
60 0.4 58 0.4 118 0.44 0.872
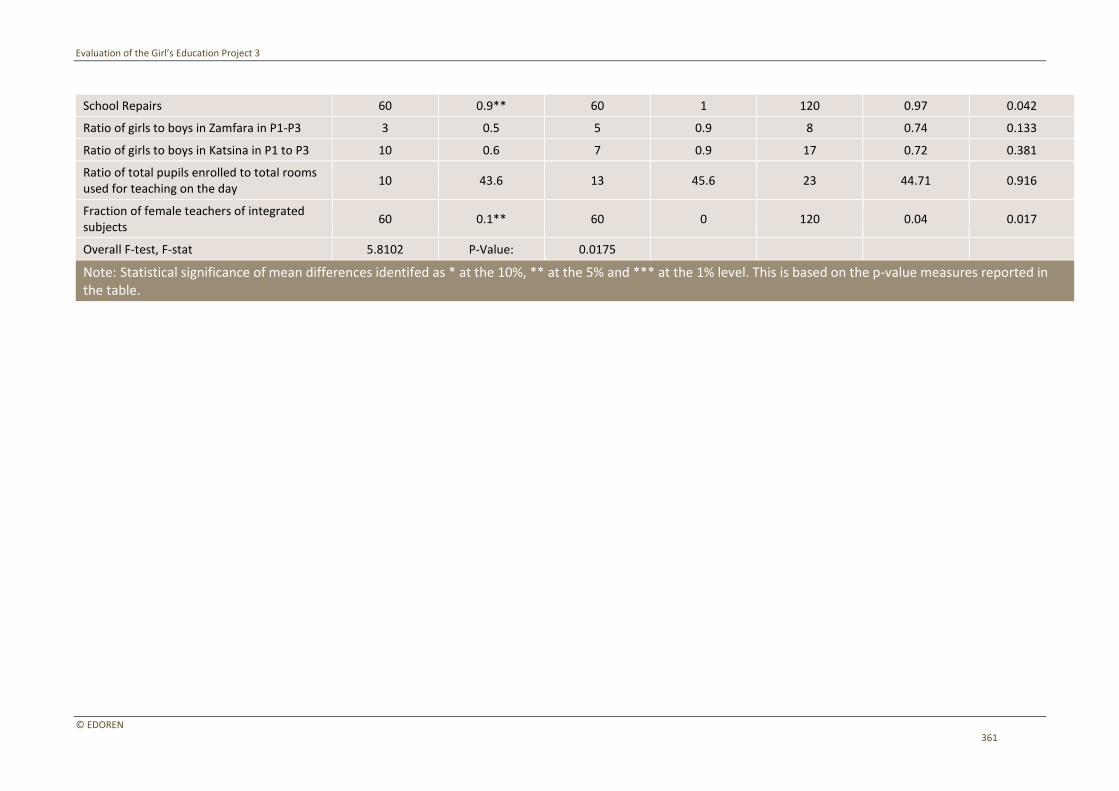
Evaluation of the Girl’s Education Project 3
© EDOREN 361
School Repairs 60 0.9** 60 1 120 0.97 0.042
Ratio of girls to boys in Zamfara in P1-P3 3 0.5 5 0.9 8 0.74 0.133
Ratio of girls to boys in Katsina in P1 to P3 10 0.6 7 0.9 17 0.72 0.381
Ratio of total pupils enrolled to total rooms used for teaching on the day
10 43.6 13 45.6 23 44.71 0.916
Fraction of female teachers of integrated subjects
60 0.1** 60 0 120 0.04 0.017
Overall F-test, F-stat 5.8102 P-Value: 0.0175
Note: Statistical significance of mean differences identifed as * at the 10%, ** at the 5% and *** at the 1% level. This is based on the p-value measures reported in the table.
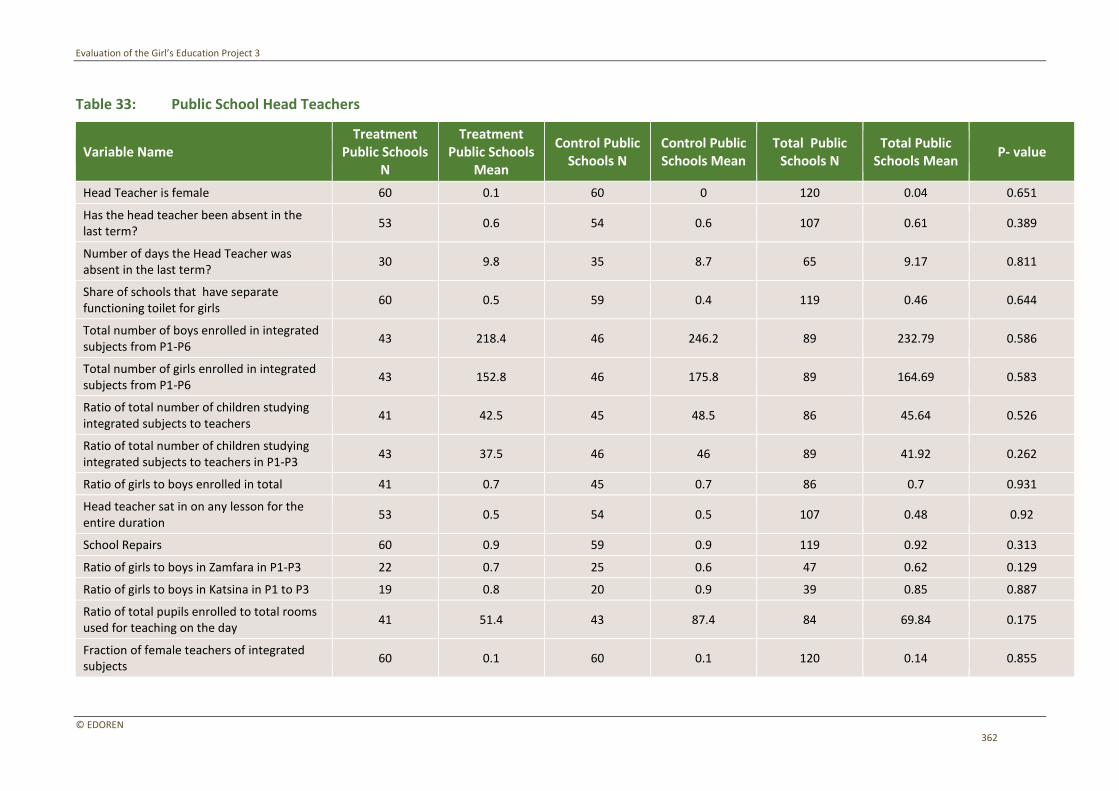
Evaluation of the Girl’s Education Project 3
© EDOREN 362
Table 33: Public School Head Teachers
Variable Name Treatment
Public Schools N
Treatment Public Schools
Mean
Control Public Schools N
Control Public Schools Mean
Total Public Schools N
Total Public Schools Mean
P- value
Head Teacher is female 60 0.1 60 0 120 0.04 0.651
Has the head teacher been absent in the last term?
53 0.6 54 0.6 107 0.61 0.389
Number of days the Head Teacher was absent in the last term?
30 9.8 35 8.7 65 9.17 0.811
Share of schools that have separate functioning toilet for girls
60 0.5 59 0.4 119 0.46 0.644
Total number of boys enrolled in integrated subjects from P1-P6
43 218.4 46 246.2 89 232.79 0.586
Total number of girls enrolled in integrated subjects from P1-P6
43 152.8 46 175.8 89 164.69 0.583
Ratio of total number of children studying integrated subjects to teachers
41 42.5 45 48.5 86 45.64 0.526
Ratio of total number of children studying integrated subjects to teachers in P1-P3
43 37.5 46 46 89 41.92 0.262
Ratio of girls to boys enrolled in total 41 0.7 45 0.7 86 0.7 0.931
Head teacher sat in on any lesson for the entire duration
53 0.5 54 0.5 107 0.48 0.92
School Repairs 60 0.9 59 0.9 119 0.92 0.313
Ratio of girls to boys in Zamfara in P1-P3 22 0.7 25 0.6 47 0.62 0.129
Ratio of girls to boys in Katsina in P1 to P3 19 0.8 20 0.9 39 0.85 0.887
Ratio of total pupils enrolled to total rooms used for teaching on the day
41 51.4 43 87.4 84 69.84 0.175
Fraction of female teachers of integrated subjects
60 0.1 60 0.1 120 0.14 0.855
Evaluation of the Girl’s Education Project 3
© EDOREN 363
Overall F-test, F-stat 0.0333 P-Value: 0.8554
Note: Statistical significance of mean differences identifed as * at the 10%, ** at the 5% and *** at the 1% level. This is based on the p-value measures reported in the table.

Evaluation of the Girl’s Education Project 3
© EDOREN 364
Table 34: All Teachers
Variable Name Treatment N Treatment
Mean Control N Control Mean Total N Total Mean P- value
Teacher is female 236 0.1 241 0.1 477 0.12 0.613
Does the teacher have an SSCE? 236 0.7 241 0.7 477 0.72 0.515
Does the teacher have an NCE? 236 0.6 241 0.5 477 0.53 0.33
Does the teacher have a Grade 2 Certificate?
236 0.1 241 0.1 477 0.08 0.344
Has the teacher been absent in the last term?
221 0.7 229 0.7 450 0.66 0.862
Number of days the teacher was absent in the last term
221 6.1 228 5 449 5.52 0.341
Does the teacher speak Hausa? 177 1 179 1 356 1
Has the teacher attended training in the last 2 years?
233 0.4 240 0.5 473 0.46 0.238
Is the teacher able to identify low performers?
231 0.4 232 0.5 463 0.49 0.43
Is the teacher able to give evidence for judgements and diagnose?
231 0.1 232 0.1 463 0.07 0.556
Does the teacher have writing skills? 231 0.2 232 0.2 463 0.17 0.578
Does the teacher have Hausa knowledge? 231 2.9 232 2.8 463 2.87 0.763
Does the teacher have comprehension skills?
231 2.1* 232 2.3 463 2.21 0.091
Is the teacher able to interpret words and phrases?
231 0.2 232 0.1 463 0.16 0.652
Overall F-test, F-stat 0.2037 P-Value: 0.6519
Note: Statistical significance of mean differences identifed as * at the 10%, ** at the 5% and *** at the 1% level. This is based on the p-value measures reported in the table.
Evaluation of the Girl’s Education Project 3
© EDOREN 365
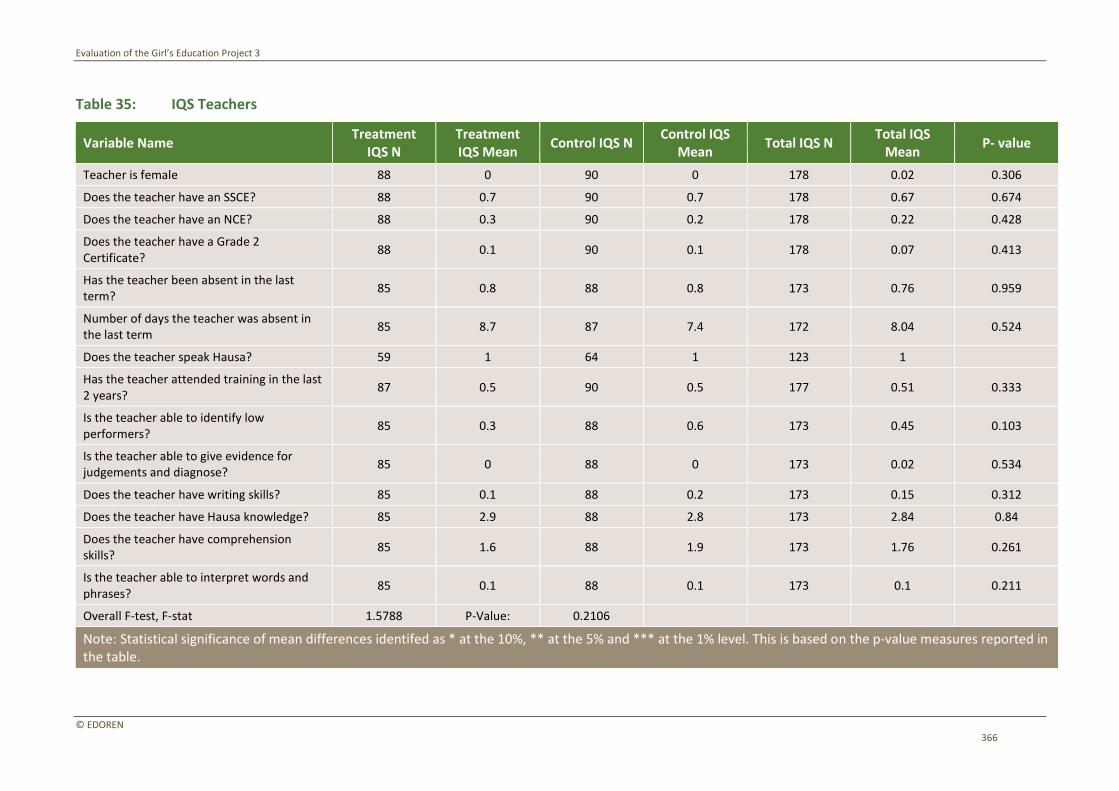
Evaluation of the Girl’s Education Project 3
© EDOREN 366
Table 35: IQS Teachers
Variable Name Treatment
IQS N Treatment IQS Mean
Control IQS N Control IQS
Mean Total IQS N
Total IQS Mean
P- value
Teacher is female 88 0 90 0 178 0.02 0.306
Does the teacher have an SSCE? 88 0.7 90 0.7 178 0.67 0.674
Does the teacher have an NCE? 88 0.3 90 0.2 178 0.22 0.428
Does the teacher have a Grade 2 Certificate?
88 0.1 90 0.1 178 0.07 0.413
Has the teacher been absent in the last term?
85 0.8 88 0.8 173 0.76 0.959
Number of days the teacher was absent in the last term
85 8.7 87 7.4 172 8.04 0.524
Does the teacher speak Hausa? 59 1 64 1 123 1
Has the teacher attended training in the last 2 years?
87 0.5 90 0.5 177 0.51 0.333
Is the teacher able to identify low performers?
85 0.3 88 0.6 173 0.45 0.103
Is the teacher able to give evidence for judgements and diagnose?
85 0 88 0 173 0.02 0.534
Does the teacher have writing skills? 85 0.1 88 0.2 173 0.15 0.312
Does the teacher have Hausa knowledge? 85 2.9 88 2.8 173 2.84 0.84
Does the teacher have comprehension skills?
85 1.6 88 1.9 173 1.76 0.261
Is the teacher able to interpret words and phrases?
85 0.1 88 0.1 173 0.1 0.211
Overall F-test, F-stat 1.5788 P-Value: 0.2106
Note: Statistical significance of mean differences identifed as * at the 10%, ** at the 5% and *** at the 1% level. This is based on the p-value measures reported in the table.

Evaluation of the Girl’s Education Project 3
© EDOREN 367
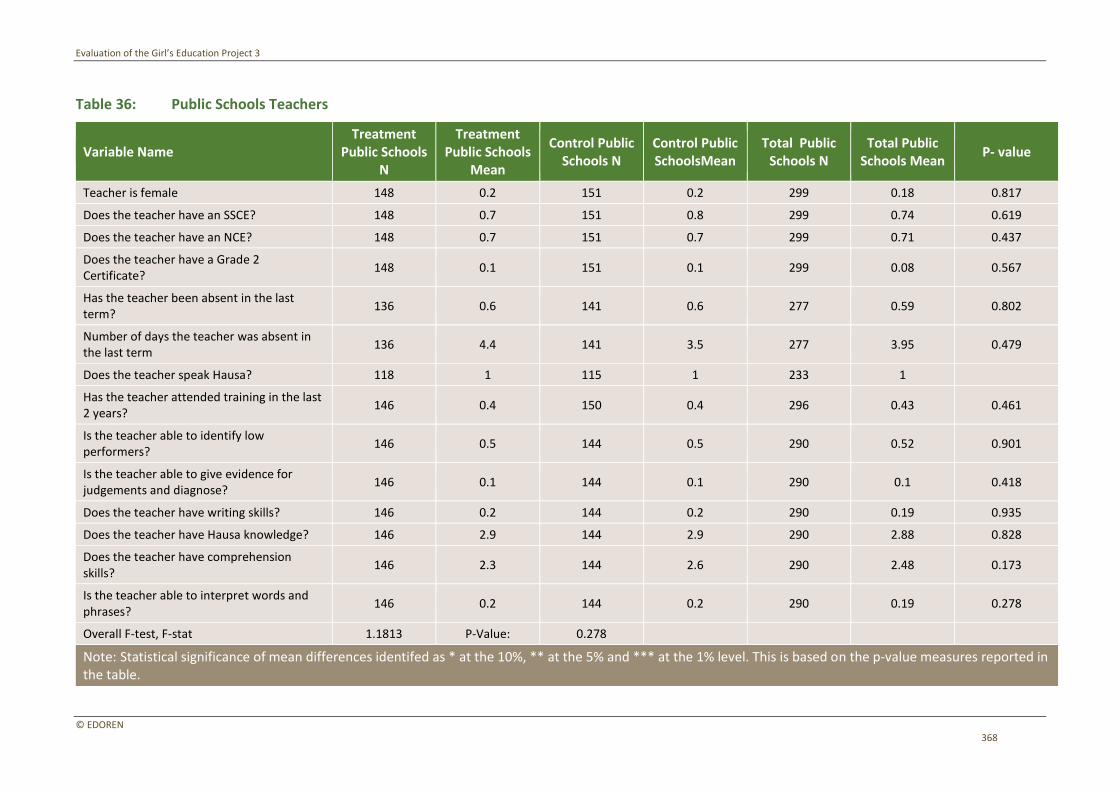
Evaluation of the Girl’s Education Project 3
© EDOREN 368
Table 36: Public Schools Teachers
Variable Name Treatment
Public Schools N
Treatment Public Schools
Mean
Control Public Schools N
Control Public SchoolsMean
Total Public Schools N
Total Public Schools Mean
P- value
Teacher is female 148 0.2 151 0.2 299 0.18 0.817
Does the teacher have an SSCE? 148 0.7 151 0.8 299 0.74 0.619
Does the teacher have an NCE? 148 0.7 151 0.7 299 0.71 0.437
Does the teacher have a Grade 2 Certificate?
148 0.1 151 0.1 299 0.08 0.567
Has the teacher been absent in the last term?
136 0.6 141 0.6 277 0.59 0.802
Number of days the teacher was absent in the last term
136 4.4 141 3.5 277 3.95 0.479
Does the teacher speak Hausa? 118 1 115 1 233 1
Has the teacher attended training in the last 2 years?
146 0.4 150 0.4 296 0.43 0.461
Is the teacher able to identify low performers?
146 0.5 144 0.5 290 0.52 0.901
Is the teacher able to give evidence for judgements and diagnose?
146 0.1 144 0.1 290 0.1 0.418
Does the teacher have writing skills? 146 0.2 144 0.2 290 0.19 0.935
Does the teacher have Hausa knowledge? 146 2.9 144 2.9 290 2.88 0.828
Does the teacher have comprehension skills?
146 2.3 144 2.6 290 2.48 0.173
Is the teacher able to interpret words and phrases?
146 0.2 144 0.2 290 0.19 0.278
Overall F-test, F-stat 1.1813 P-Value: 0.278
Note: Statistical significance of mean differences identifed as * at the 10%, ** at the 5% and *** at the 1% level. This is based on the p-value measures reported in the table.
Evaluation of the Girl’s Education Project 3
© EDOREN 369
G.2 Pupil Level Balance
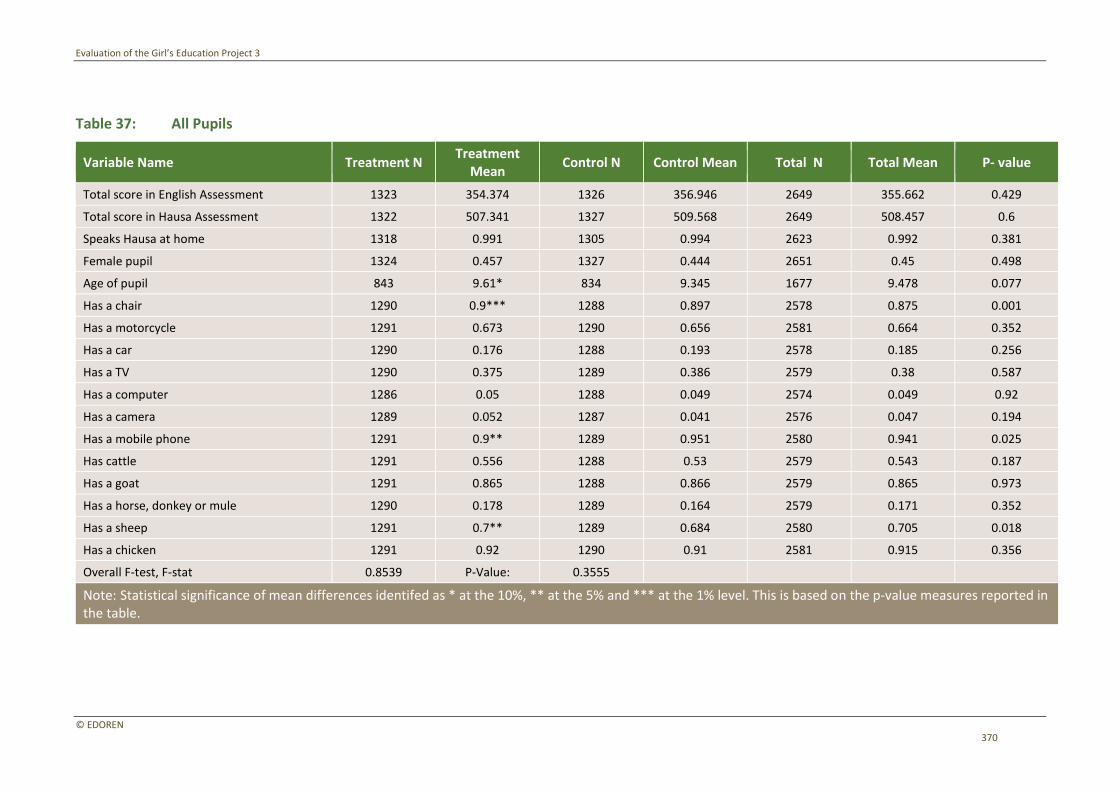
Evaluation of the Girl’s Education Project 3
© EDOREN 370
Table 37: All Pupils
Variable Name Treatment N Treatment
Mean Control N Control Mean Total N Total Mean P- value
Total score in English Assessment 1323 354.374 1326 356.946 2649 355.662 0.429
Total score in Hausa Assessment 1322 507.341 1327 509.568 2649 508.457 0.6
Speaks Hausa at home 1318 0.991 1305 0.994 2623 0.992 0.381
Female pupil 1324 0.457 1327 0.444 2651 0.45 0.498
Age of pupil 843 9.61* 834 9.345 1677 9.478 0.077
Has a chair 1290 0.9*** 1288 0.897 2578 0.875 0.001
Has a motorcycle 1291 0.673 1290 0.656 2581 0.664 0.352
Has a car 1290 0.176 1288 0.193 2578 0.185 0.256
Has a TV 1290 0.375 1289 0.386 2579 0.38 0.587
Has a computer 1286 0.05 1288 0.049 2574 0.049 0.92
Has a camera 1289 0.052 1287 0.041 2576 0.047 0.194
Has a mobile phone 1291 0.9** 1289 0.951 2580 0.941 0.025
Has cattle 1291 0.556 1288 0.53 2579 0.543 0.187
Has a goat 1291 0.865 1288 0.866 2579 0.865 0.973
Has a horse, donkey or mule 1290 0.178 1289 0.164 2579 0.171 0.352
Has a sheep 1291 0.7** 1289 0.684 2580 0.705 0.018
Has a chicken 1291 0.92 1290 0.91 2581 0.915 0.356
Overall F-test, F-stat 0.8539 P-Value: 0.3555
Note: Statistical significance of mean differences identifed as * at the 10%, ** at the 5% and *** at the 1% level. This is based on the p-value measures reported in the table.
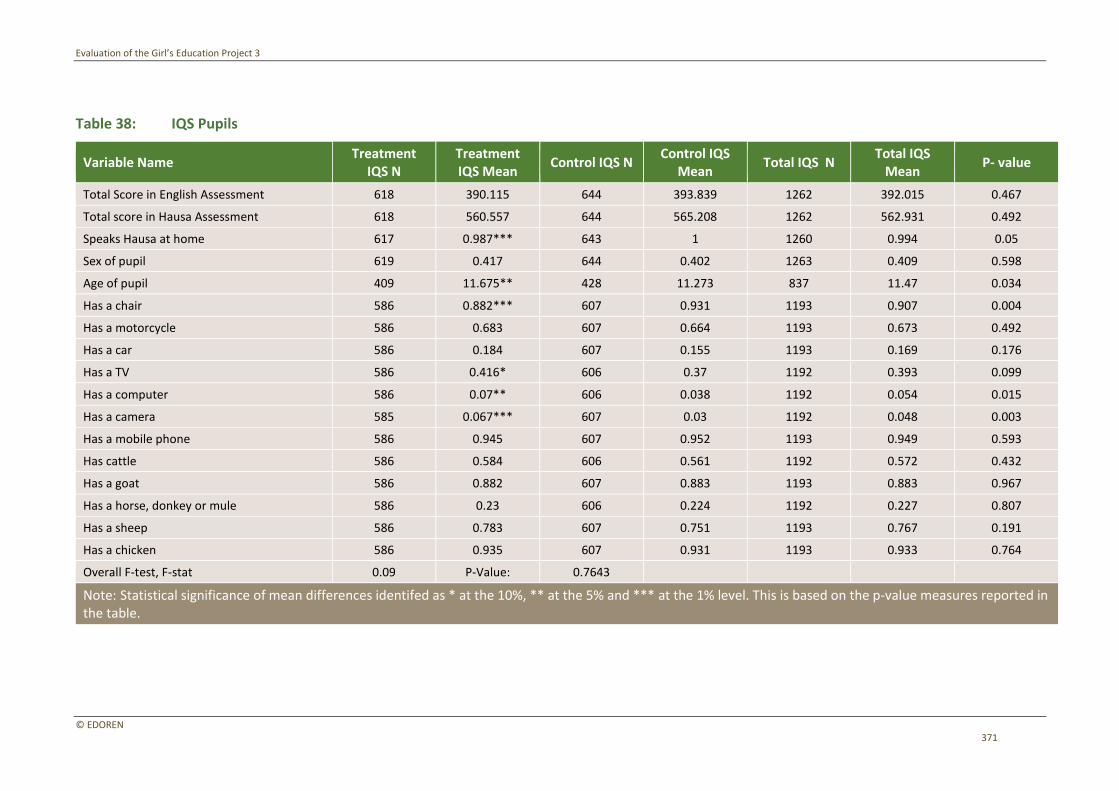
Evaluation of the Girl’s Education Project 3
© EDOREN 371
Table 38: IQS Pupils
Variable Name Treatment
IQS N Treatment IQS Mean
Control IQS N Control IQS
Mean Total IQS N
Total IQS Mean
P- value
Total Score in English Assessment 618 390.115 644 393.839 1262 392.015 0.467
Total score in Hausa Assessment 618 560.557 644 565.208 1262 562.931 0.492
Speaks Hausa at home 617 0.987*** 643 1 1260 0.994 0.05
Sex of pupil 619 0.417 644 0.402 1263 0.409 0.598
Age of pupil 409 11.675** 428 11.273 837 11.47 0.034
Has a chair 586 0.882*** 607 0.931 1193 0.907 0.004
Has a motorcycle 586 0.683 607 0.664 1193 0.673 0.492
Has a car 586 0.184 607 0.155 1193 0.169 0.176
Has a TV 586 0.416* 606 0.37 1192 0.393 0.099
Has a computer 586 0.07** 606 0.038 1192 0.054 0.015
Has a camera 585 0.067*** 607 0.03 1192 0.048 0.003
Has a mobile phone 586 0.945 607 0.952 1193 0.949 0.593
Has cattle 586 0.584 606 0.561 1192 0.572 0.432
Has a goat 586 0.882 607 0.883 1193 0.883 0.967
Has a horse, donkey or mule 586 0.23 606 0.224 1192 0.227 0.807
Has a sheep 586 0.783 607 0.751 1193 0.767 0.191
Has a chicken 586 0.935 607 0.931 1193 0.933 0.764
Overall F-test, F-stat 0.09 P-Value: 0.7643
Note: Statistical significance of mean differences identifed as * at the 10%, ** at the 5% and *** at the 1% level. This is based on the p-value measures reported in the table.
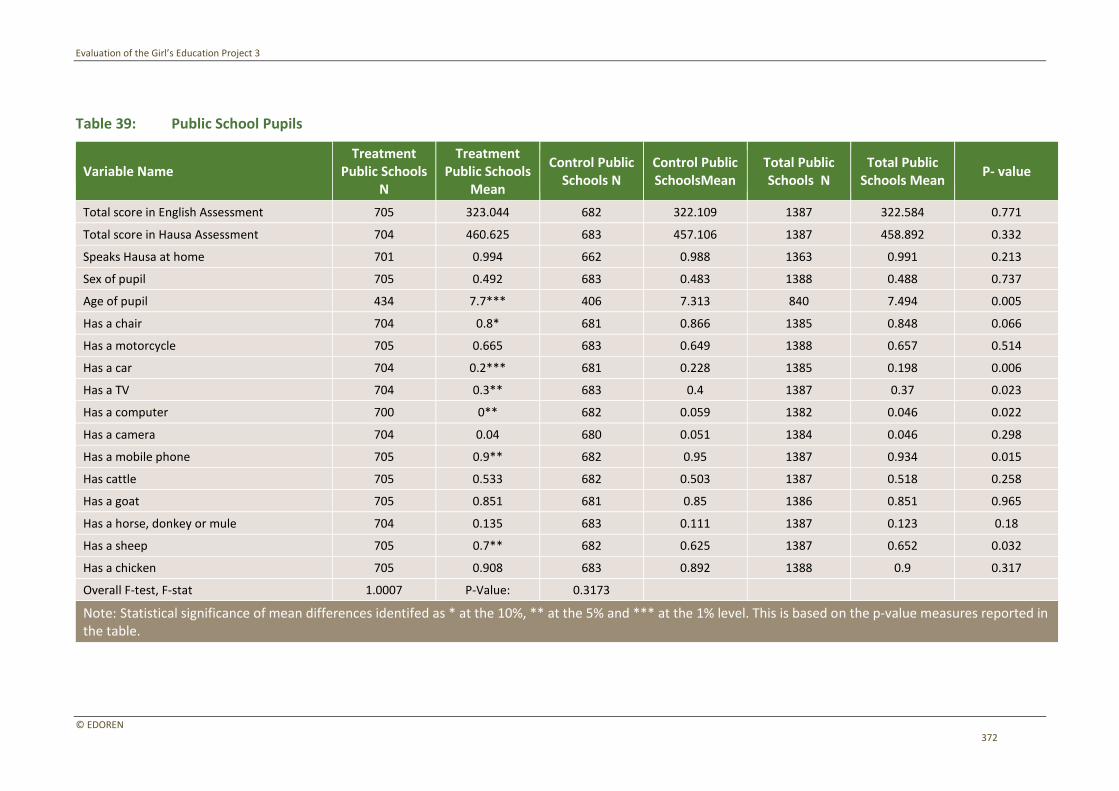
Evaluation of the Girl’s Education Project 3
© EDOREN 372
Table 39: Public School Pupils
Variable Name Treatment
Public Schools N
Treatment Public Schools
Mean
Control Public Schools N
Control Public SchoolsMean
Total Public Schools N
Total Public Schools Mean
P- value
Total score in English Assessment 705 323.044 682 322.109 1387 322.584 0.771
Total score in Hausa Assessment 704 460.625 683 457.106 1387 458.892 0.332
Speaks Hausa at home 701 0.994 662 0.988 1363 0.991 0.213
Sex of pupil 705 0.492 683 0.483 1388 0.488 0.737
Age of pupil 434 7.7*** 406 7.313 840 7.494 0.005
Has a chair 704 0.8* 681 0.866 1385 0.848 0.066
Has a motorcycle 705 0.665 683 0.649 1388 0.657 0.514
Has a car 704 0.2*** 681 0.228 1385 0.198 0.006
Has a TV 704 0.3** 683 0.4 1387 0.37 0.023
Has a computer 700 0** 682 0.059 1382 0.046 0.022
Has a camera 704 0.04 680 0.051 1384 0.046 0.298
Has a mobile phone 705 0.9** 682 0.95 1387 0.934 0.015
Has cattle 705 0.533 682 0.503 1387 0.518 0.258
Has a goat 705 0.851 681 0.85 1386 0.851 0.965
Has a horse, donkey or mule 704 0.135 683 0.111 1387 0.123 0.18
Has a sheep 705 0.7** 682 0.625 1387 0.652 0.032
Has a chicken 705 0.908 683 0.892 1388 0.9 0.317
Overall F-test, F-stat 1.0007 P-Value: 0.3173
Note: Statistical significance of mean differences identifed as * at the 10%, ** at the 5% and *** at the 1% level. This is based on the p-value measures reported in the table.
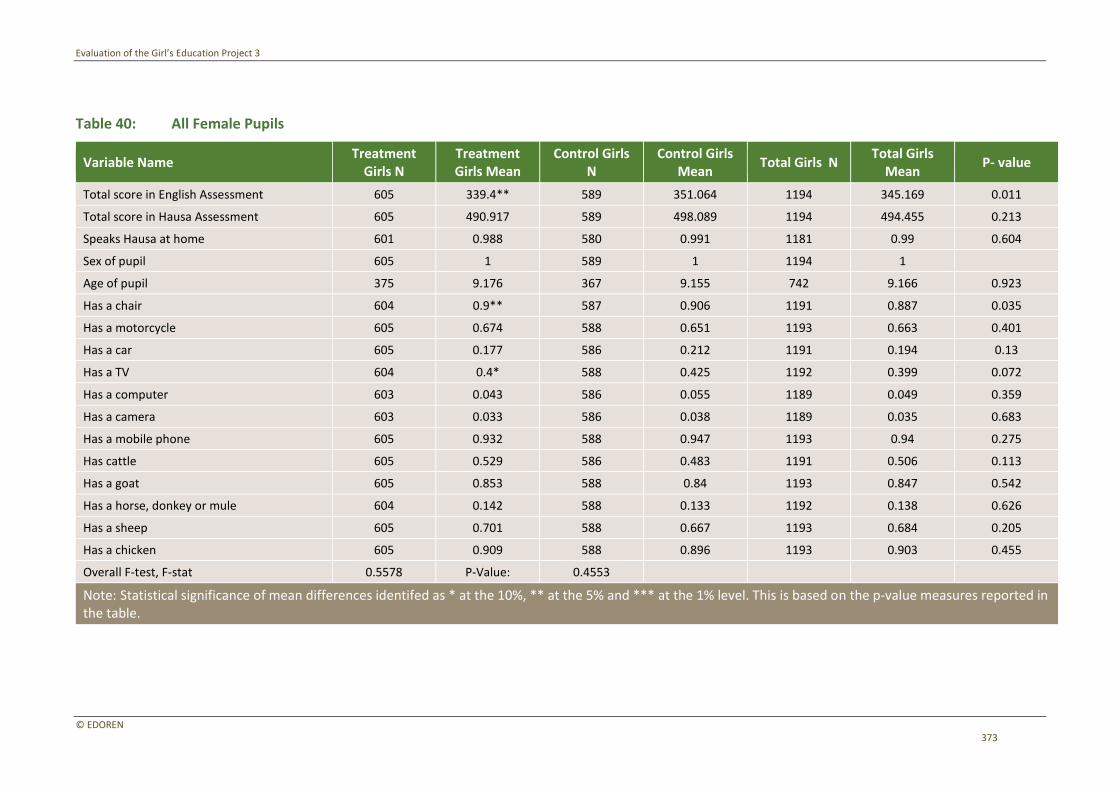
Evaluation of the Girl’s Education Project 3
© EDOREN 373
Table 40: All Female Pupils
Variable Name Treatment
Girls N Treatment Girls Mean
Control Girls N
Control Girls Mean
Total Girls N Total Girls
Mean P- value
Total score in English Assessment 605 339.4** 589 351.064 1194 345.169 0.011
Total score in Hausa Assessment 605 490.917 589 498.089 1194 494.455 0.213
Speaks Hausa at home 601 0.988 580 0.991 1181 0.99 0.604
Sex of pupil 605 1 589 1 1194 1
Age of pupil 375 9.176 367 9.155 742 9.166 0.923
Has a chair 604 0.9** 587 0.906 1191 0.887 0.035
Has a motorcycle 605 0.674 588 0.651 1193 0.663 0.401
Has a car 605 0.177 586 0.212 1191 0.194 0.13
Has a TV 604 0.4* 588 0.425 1192 0.399 0.072
Has a computer 603 0.043 586 0.055 1189 0.049 0.359
Has a camera 603 0.033 586 0.038 1189 0.035 0.683
Has a mobile phone 605 0.932 588 0.947 1193 0.94 0.275
Has cattle 605 0.529 586 0.483 1191 0.506 0.113
Has a goat 605 0.853 588 0.84 1193 0.847 0.542
Has a horse, donkey or mule 604 0.142 588 0.133 1192 0.138 0.626
Has a sheep 605 0.701 588 0.667 1193 0.684 0.205
Has a chicken 605 0.909 588 0.896 1193 0.903 0.455
Overall F-test, F-stat 0.5578 P-Value: 0.4553
Note: Statistical significance of mean differences identifed as * at the 10%, ** at the 5% and *** at the 1% level. This is based on the p-value measures reported in the table.
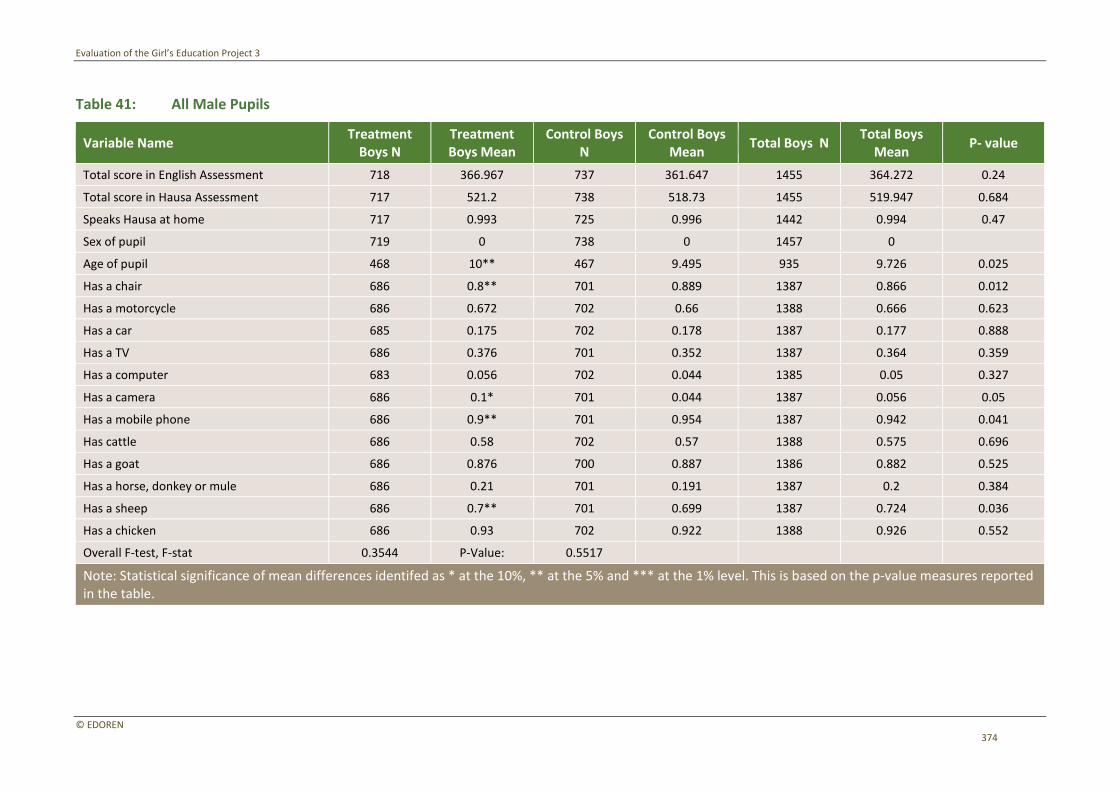
Evaluation of the Girl’s Education Project 3
© EDOREN 374
Table 41: All Male Pupils
Variable Name Treatment
Boys N Treatment Boys Mean
Control Boys N
Control Boys Mean
Total Boys N Total Boys
Mean P- value
Total score in English Assessment 718 366.967 737 361.647 1455 364.272 0.24
Total score in Hausa Assessment 717 521.2 738 518.73 1455 519.947 0.684
Speaks Hausa at home 717 0.993 725 0.996 1442 0.994 0.47
Sex of pupil 719 0 738 0 1457 0
Age of pupil 468 10** 467 9.495 935 9.726 0.025
Has a chair 686 0.8** 701 0.889 1387 0.866 0.012
Has a motorcycle 686 0.672 702 0.66 1388 0.666 0.623
Has a car 685 0.175 702 0.178 1387 0.177 0.888
Has a TV 686 0.376 701 0.352 1387 0.364 0.359
Has a computer 683 0.056 702 0.044 1385 0.05 0.327
Has a camera 686 0.1* 701 0.044 1387 0.056 0.05
Has a mobile phone 686 0.9** 701 0.954 1387 0.942 0.041
Has cattle 686 0.58 702 0.57 1388 0.575 0.696
Has a goat 686 0.876 700 0.887 1386 0.882 0.525
Has a horse, donkey or mule 686 0.21 701 0.191 1387 0.2 0.384
Has a sheep 686 0.7** 701 0.699 1387 0.724 0.036
Has a chicken 686 0.93 702 0.922 1388 0.926 0.552
Overall F-test, F-stat 0.3544 P-Value: 0.5517
Note: Statistical significance of mean differences identifed as * at the 10%, ** at the 5% and *** at the 1% level. This is based on the p-value measures reported in the table.
Evaluation of the Girl’s Education Project 3
© EDOREN 375
Annex H
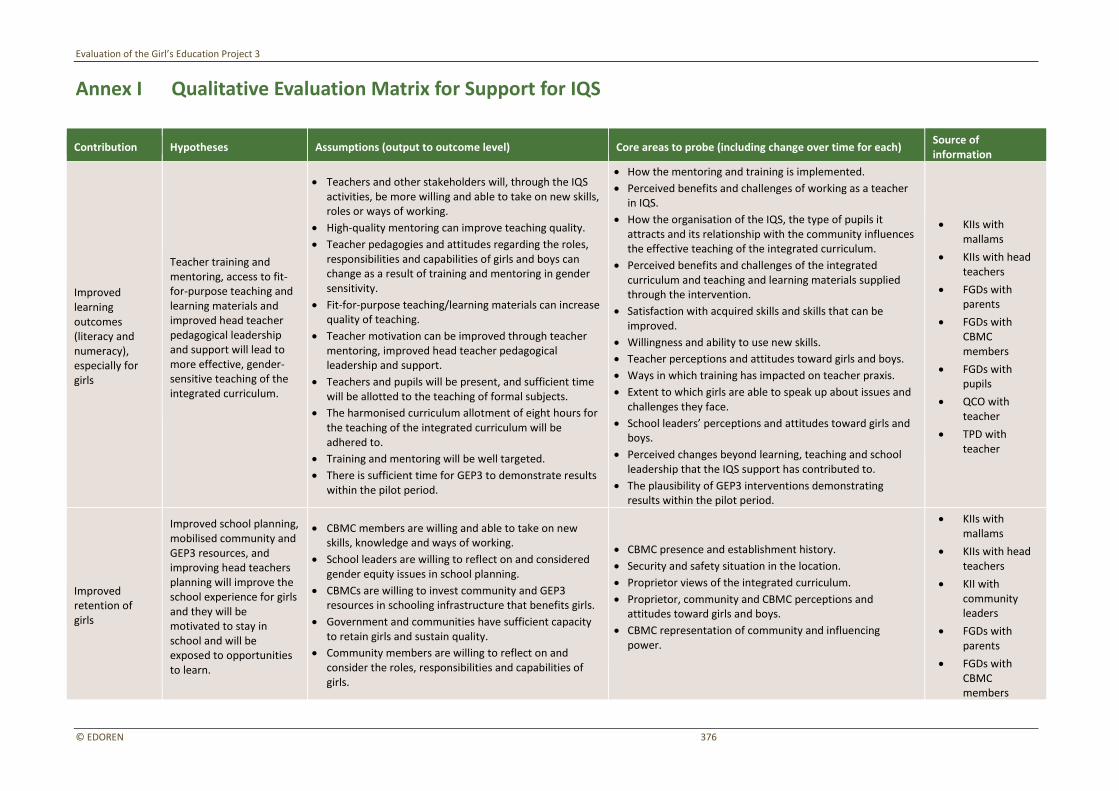
Evaluation of the Girl’s Education Project 3
© EDOREN 376
Annex I Qualitative Evaluation Matrix for Support for IQS
Contribution Hypotheses Assumptions (output to outcome level) Core areas to probe (including change over time for each) Source of information
Improved learning outcomes (literacy and numeracy), especially for girls
Teacher training and mentoring, access to fit-for-purpose teaching and learning materials and improved head teacher pedagogical leadership and support will lead to more effective, gender-sensitive teaching of the integrated curriculum.
• Teachers and other stakeholders will, through the IQS activities, be more willing and able to take on new skills, roles or ways of working.
• High-quality mentoring can improve teaching quality.
• Teacher pedagogies and attitudes regarding the roles, responsibilities and capabilities of girls and boys can change as a result of training and mentoring in gender sensitivity.
• Fit-for-purpose teaching/learning materials can increase quality of teaching.
• Teacher motivation can be improved through teacher mentoring, improved head teacher pedagogical leadership and support.
• Teachers and pupils will be present, and sufficient time will be allotted to the teaching of formal subjects.
• The harmonised curriculum allotment of eight hours for the teaching of the integrated curriculum will be adhered to.
• Training and mentoring will be well targeted.
• There is sufficient time for GEP3 to demonstrate results within the pilot period.
• How the mentoring and training is implemented.
• Perceived benefits and challenges of working as a teacher in IQS.
• How the organisation of the IQS, the type of pupils it attracts and its relationship with the community influences the effective teaching of the integrated curriculum.
• Perceived benefits and challenges of the integrated curriculum and teaching and learning materials supplied through the intervention.
• Satisfaction with acquired skills and skills that can be improved.
• Willingness and ability to use new skills.
• Teacher perceptions and attitudes toward girls and boys.
• Ways in which training has impacted on teacher praxis.
• Extent to which girls are able to speak up about issues and challenges they face.
• School leaders’ perceptions and attitudes toward girls and boys.
• Perceived changes beyond learning, teaching and school leadership that the IQS support has contributed to.
• The plausibility of GEP3 interventions demonstrating results within the pilot period.
• KIIs with mallams
• KIIs with head teachers
• FGDs with parents
• FGDs with CBMC members
• FGDs with pupils
• QCO with teacher
• TPD with teacher
Improved retention of girls
Improved school planning, mobilised community and GEP3 resources, and improving head teachers planning will improve the school experience for girls and they will be motivated to stay in school and will be exposed to opportunities to learn.
• CBMC members are willing and able to take on new skills, knowledge and ways of working.
• School leaders are willing to reflect on and considered gender equity issues in school planning.
• CBMCs are willing to invest community and GEP3 resources in schooling infrastructure that benefits girls.
• Government and communities have sufficient capacity to retain girls and sustain quality.
• Community members are willing to reflect on and consider the roles, responsibilities and capabilities of girls.
• CBMC presence and establishment history.
• Security and safety situation in the location.
• Proprietor views of the integrated curriculum.
• Proprietor, community and CBMC perceptions and attitudes toward girls and boys.
• CBMC representation of community and influencing power.
• KIIs with mallams
• KIIs with head teachers
• KII with community leaders
• FGDs with parents
• FGDs with CBMC members
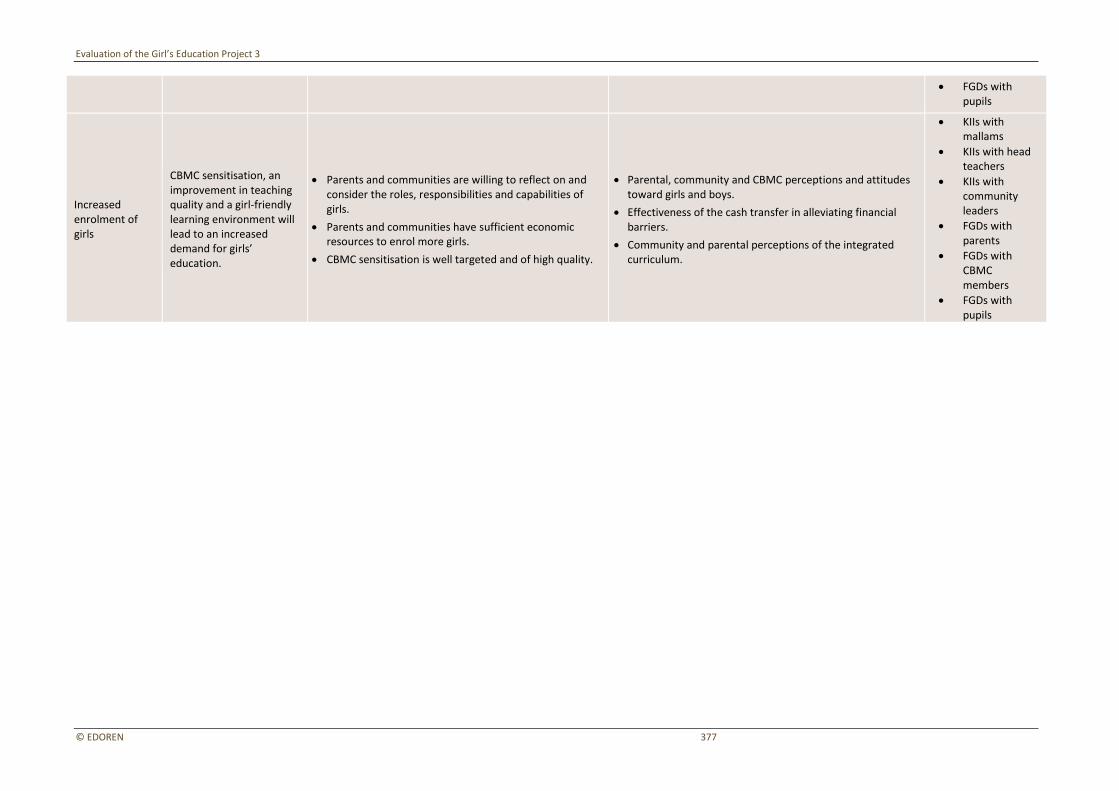
Evaluation of the Girl’s Education Project 3
© EDOREN 377
• FGDs with pupils
Increased enrolment of girls
CBMC sensitisation, an improvement in teaching quality and a girl-friendly learning environment will lead to an increased demand for girls’ education.
• Parents and communities are willing to reflect on and consider the roles, responsibilities and capabilities of girls.
• Parents and communities have sufficient economic resources to enrol more girls.
• CBMC sensitisation is well targeted and of high quality.
• Parental, community and CBMC perceptions and attitudes toward girls and boys.
• Effectiveness of the cash transfer in alleviating financial barriers.
• Community and parental perceptions of the integrated curriculum.
• KIIs with mallams
• KIIs with head teachers
• KIIs with community leaders
• FGDs with parents
• FGDs with CBMC members
• FGDs with pupils
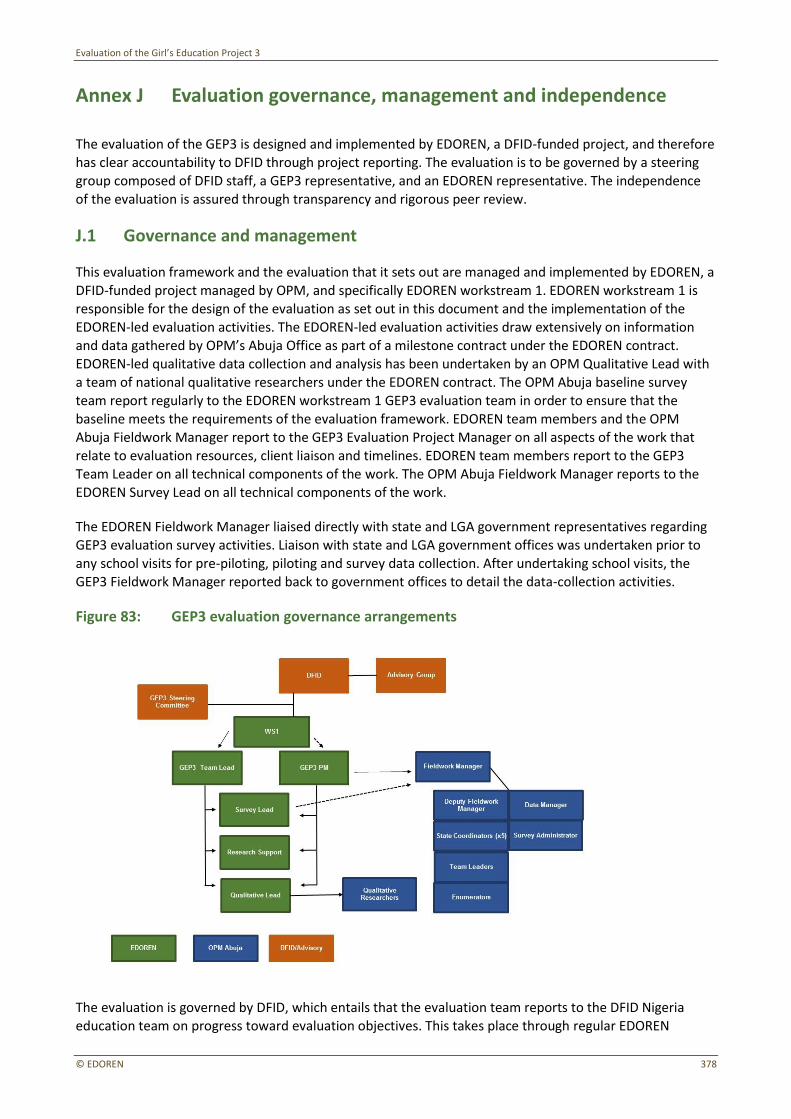
Evaluation of the Girl’s Education Project 3
© EDOREN 378
Annex J Evaluation governance, management and independence
The evaluation of the GEP3 is designed and implemented by EDOREN, a DFID-funded project, and therefore has clear accountability to DFID through project reporting. The evaluation is to be governed by a steering group composed of DFID staff, a GEP3 representative, and an EDOREN representative. The independence of the evaluation is assured through transparency and rigorous peer review.
J.1 Governance and management
This evaluation framework and the evaluation that it sets out are managed and implemented by EDOREN, a DFID-funded project managed by OPM, and specifically EDOREN workstream 1. EDOREN workstream 1 is responsible for the design of the evaluation as set out in this document and the implementation of the
EDOREN-led evaluation activities. The EDOREN-led evaluation activities draw extensively on information and data gathered by OPM’s Abuja Office as part of a milestone contract under the EDOREN contract. EDOREN-led qualitative data collection and analysis has been undertaken by an OPM Qualitative Lead with
a team of national qualitative researchers under the EDOREN contract. The OPM Abuja baseline survey team report regularly to the EDOREN workstream 1 GEP3 evaluation team in order to ensure that the baseline meets the requirements of the evaluation framework. EDOREN team members and the OPM Abuja Fieldwork Manager report to the GEP3 Evaluation Project Manager on all aspects of the work that
relate to evaluation resources, client liaison and timelines. EDOREN team members report to the GEP3 Team Leader on all technical components of the work. The OPM Abuja Fieldwork Manager reports to the
EDOREN Survey Lead on all technical components of the work.
The EDOREN Fieldwork Manager liaised directly with state and LGA government representatives regarding GEP3 evaluation survey activities. Liaison with state and LGA government offices was undertaken prior to
any school visits for pre-piloting, piloting and survey data collection. After undertaking school visits, the GEP3 Fieldwork Manager reported back to government offices to detail the data-collection activities.
Figure 83: GEP3 evaluation governance arrangements
The evaluation is governed by DFID, which entails that the evaluation team reports to the DFID Nigeria education team on progress toward evaluation objectives. This takes place through regular EDOREN

Evaluation of the Girl’s Education Project 3
© EDOREN 379
quarterly written reporting to DFID and six-weekly verbal project management updates. This process means that the EDOREN GEP3 evaluation team provides fortnightly updates directly to the DFID Educatio
Advisor.
In addition, it was recommended in the Evaluation Framework that an Evaluation Steering Committee be formalised, composed of DFID Nigeria education and results advisers, GEP3 and EDOREN staff – a group of people that already meets regularly. This committee could formally meet every six months to discuss
evaluation progress, and would be responsible for peer review and QA (in addition to EDOREN’s internal QA processes).
The issue of government representation on the GEP3 Evaluation Steering Committee was discussed by EDOREN, UNICEF and DFID,180 with UNICEF noting that government participation is important for ownership and take-up of results. EDOREN fully agreed and indicated that it would welcome the
participation of a government representative but would seek to have DFID and UNICEF take the lead in approaching and liaising with government to set up this participation. DFID and UNICEF agreed to liaise with government on this issue. At present, DFID and UNICEF plan to use the baseline evaluation report to
engage government and begin the process of establishing a GEP3 Evaluation Steering Committee as originally envisaged.
J.2 Stakeholder involvement in framework development
The GEP Team Lead and the GEP3 Project Manager/Education Specialist engaged with DFID Nigeria, DFID’s Research and Evidence Division, GEP3 management, UNICEF, international researchers within OPM and
EDOREN, other education projects and implementing agencies in both face-to-face meetings and over Skype on multiple occasions throughout the evaluation design process. Engaging government throughout
the evaluation design was complex in the case of GEP3 as the Evaluation Framework was put on hold during the redesign of the GEP3 programme. Therefore, the evaluation team placed a specific focus on engaging with government during the state-level stakeholder engagement activity in the early stages of the
evaluation.
After the GEP3 programme design was finalised, the implementing partner, DFID and the EDOREN GEP3 Evaluation team spent 10 days in March 2015 completing the evaluation matrix, by finalising the evaluation questions, assigning responsibilities and resources against evaluation activities, and firming up the timing of
various activities.
The GEP3 evaluation team has documented the discussions undertaken throughout this engagement and
has kept highly detailed minutes of meetings with key stakeholders. This has enabled the team to review the views, priorities and concerns of stakeholders, in detail, while developing the evaluation framework. At points where trade-offs or compromises were necessary due to scope or resources, the GEP3 Evaluation
Team Lead and Project Manager communicated the options and trade-offs to key stakeholders in order to ensure all parties were involved in the decision-making processes.
DFID education specialists and the programme implementers were provided with a final draft of the evaluation framework prior to finalisation so as to ensure all decisions and agreements are reflected in the
final product.
180 2 July 2015 EDOREN GEP3 Evaluation meeting minutes, circulated 8 July 2015.
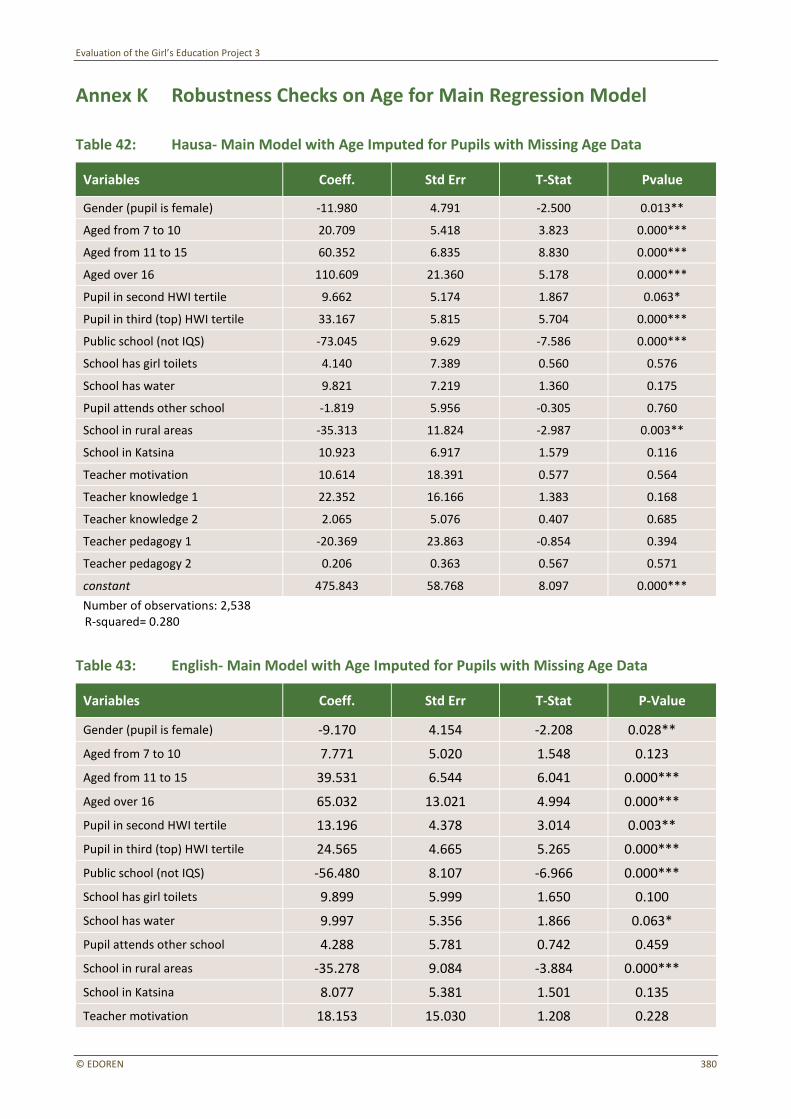
Evaluation of the Girl’s Education Project 3
© EDOREN 380
Annex K Robustness Checks on Age for Main Regression Model
Table 42: Hausa- Main Model with Age Imputed for Pupils with Missing Age Data
Variables Coeff. Std Err T-Stat Pvalue
Gender (pupil is female) -11.980 4.791 -2.500 0.013**
Aged from 7 to 10 20.709 5.418 3.823 0.000***
Aged from 11 to 15 60.352 6.835 8.830 0.000***
Aged over 16 110.609 21.360 5.178 0.000***
Pupil in second HWI tertile 9.662 5.174 1.867 0.063*
Pupil in third (top) HWI tertile 33.167 5.815 5.704 0.000***
Public school (not IQS) -73.045 9.629 -7.586 0.000***
School has girl toilets 4.140 7.389 0.560 0.576
School has water 9.821 7.219 1.360 0.175
Pupil attends other school -1.819 5.956 -0.305 0.760
School in rural areas -35.313 11.824 -2.987 0.003**
School in Katsina 10.923 6.917 1.579 0.116
Teacher motivation 10.614 18.391 0.577 0.564
Teacher knowledge 1 22.352 16.166 1.383 0.168
Teacher knowledge 2 2.065 5.076 0.407 0.685
Teacher pedagogy 1 -20.369 23.863 -0.854 0.394
Teacher pedagogy 2 0.206 0.363 0.567 0.571
constant 475.843 58.768 8.097 0.000***
Number of observations: 2,538 R-squared= 0.280
Table 43: English- Main Model with Age Imputed for Pupils with Missing Age Data
Variables Coeff. Std Err T-Stat P-Value
Gender (pupil is female) -9.170 4.154 -2.208 0.028**
Aged from 7 to 10 7.771 5.020 1.548 0.123
Aged from 11 to 15 39.531 6.544 6.041 0.000***
Aged over 16 65.032 13.021 4.994 0.000***
Pupil in second HWI tertile 13.196 4.378 3.014 0.003**
Pupil in third (top) HWI tertile 24.565 4.665 5.265 0.000***
Public school (not IQS) -56.480 8.107 -6.966 0.000***
School has girl toilets 9.899 5.999 1.650 0.100
School has water 9.997 5.356 1.866 0.063*
Pupil attends other school 4.288 5.781 0.742 0.459
School in rural areas -35.278 9.084 -3.884 0.000***
School in Katsina 8.077 5.381 1.501 0.135
Teacher motivation 18.153 15.030 1.208 0.228
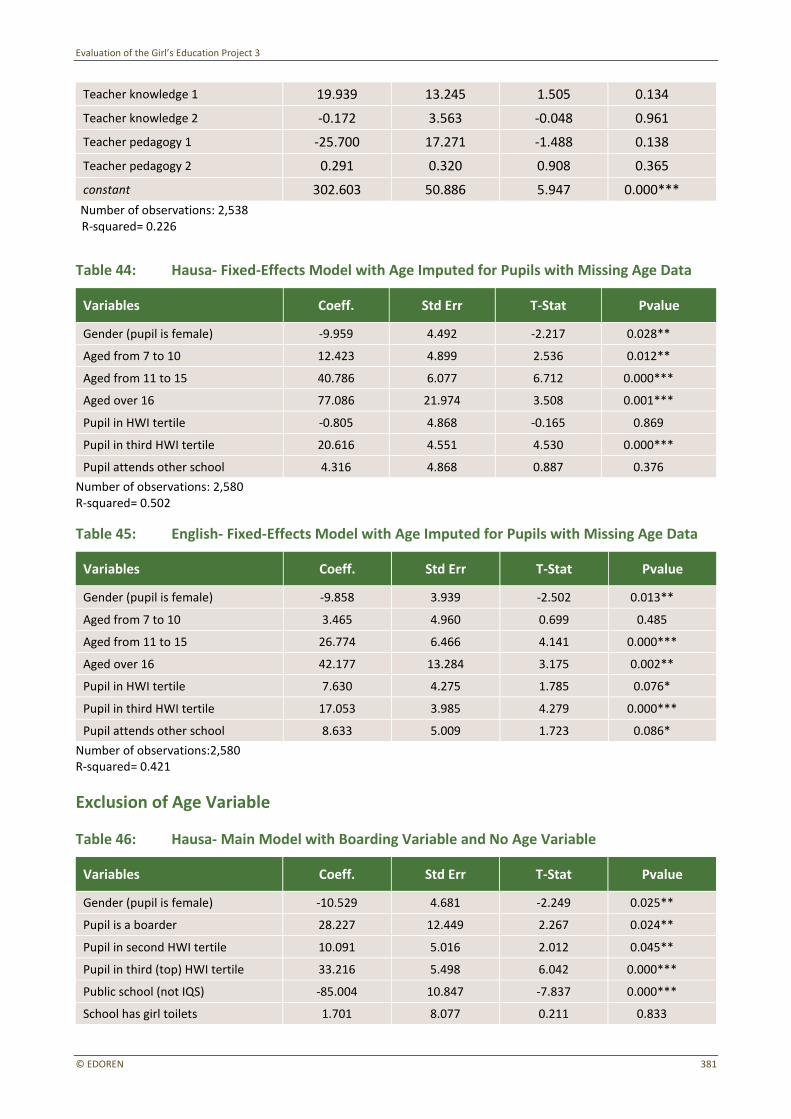
Evaluation of the Girl’s Education Project 3
© EDOREN 381
Teacher knowledge 1 19.939 13.245 1.505 0.134
Teacher knowledge 2 -0.172 3.563 -0.048 0.961
Teacher pedagogy 1 -25.700 17.271 -1.488 0.138
Teacher pedagogy 2 0.291 0.320 0.908 0.365
constant 302.603 50.886 5.947 0.000***
Number of observations: 2,538 R-squared= 0.226
Table 44: Hausa- Fixed-Effects Model with Age Imputed for Pupils with Missing Age Data
Variables Coeff. Std Err T-Stat Pvalue
Gender (pupil is female) -9.959 4.492 -2.217 0.028**
Aged from 7 to 10 12.423 4.899 2.536 0.012**
Aged from 11 to 15 40.786 6.077 6.712 0.000***
Aged over 16 77.086 21.974 3.508 0.001***
Pupil in HWI tertile -0.805 4.868 -0.165 0.869
Pupil in third HWI tertile 20.616 4.551 4.530 0.000***
Pupil attends other school 4.316 4.868 0.887 0.376
Number of observations: 2,580 R-squared= 0.502
Table 45: English- Fixed-Effects Model with Age Imputed for Pupils with Missing Age Data
Variables Coeff. Std Err T-Stat Pvalue
Gender (pupil is female) -9.858 3.939 -2.502 0.013**
Aged from 7 to 10 3.465 4.960 0.699 0.485
Aged from 11 to 15 26.774 6.466 4.141 0.000***
Aged over 16 42.177 13.284 3.175 0.002**
Pupil in HWI tertile 7.630 4.275 1.785 0.076*
Pupil in third HWI tertile 17.053 3.985 4.279 0.000***
Pupil attends other school 8.633 5.009 1.723 0.086*
Number of observations:2,580 R-squared= 0.421
Exclusion of Age Variable
Table 46: Hausa- Main Model with Boarding Variable and No Age Variable
Variables Coeff. Std Err T-Stat Pvalue
Gender (pupil is female) -10.529 4.681 -2.249 0.025**
Pupil is a boarder 28.227 12.449 2.267 0.024**
Pupil in second HWI tertile 10.091 5.016 2.012 0.045**
Pupil in third (top) HWI tertile 33.216 5.498 6.042 0.000***
Public school (not IQS) -85.004 10.847 -7.837 0.000***
School has girl toilets 1.701 8.077 0.211 0.833
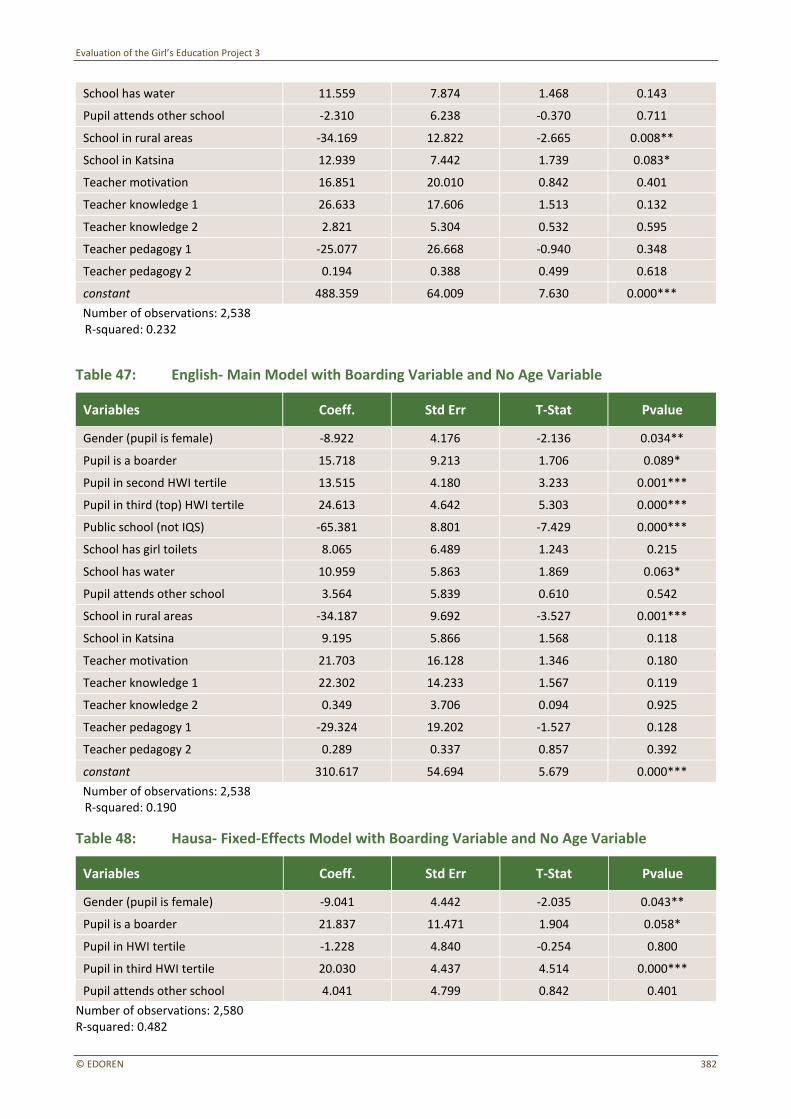
Evaluation of the Girl’s Education Project 3
© EDOREN 382
School has water 11.559 7.874 1.468 0.143
Pupil attends other school -2.310 6.238 -0.370 0.711
School in rural areas -34.169 12.822 -2.665 0.008**
School in Katsina 12.939 7.442 1.739 0.083*
Teacher motivation 16.851 20.010 0.842 0.401
Teacher knowledge 1 26.633 17.606 1.513 0.132
Teacher knowledge 2 2.821 5.304 0.532 0.595
Teacher pedagogy 1 -25.077 26.668 -0.940 0.348
Teacher pedagogy 2 0.194 0.388 0.499 0.618
constant 488.359 64.009 7.630 0.000***
Number of observations: 2,538 R-squared: 0.232
Table 47: English- Main Model with Boarding Variable and No Age Variable
Variables Coeff. Std Err T-Stat Pvalue
Gender (pupil is female) -8.922 4.176 -2.136 0.034**
Pupil is a boarder 15.718 9.213 1.706 0.089*
Pupil in second HWI tertile 13.515 4.180 3.233 0.001***
Pupil in third (top) HWI tertile 24.613 4.642 5.303 0.000***
Public school (not IQS) -65.381 8.801 -7.429 0.000***
School has girl toilets 8.065 6.489 1.243 0.215
School has water 10.959 5.863 1.869 0.063*
Pupil attends other school 3.564 5.839 0.610 0.542
School in rural areas -34.187 9.692 -3.527 0.001***
School in Katsina 9.195 5.866 1.568 0.118
Teacher motivation 21.703 16.128 1.346 0.180
Teacher knowledge 1 22.302 14.233 1.567 0.119
Teacher knowledge 2 0.349 3.706 0.094 0.925
Teacher pedagogy 1 -29.324 19.202 -1.527 0.128
Teacher pedagogy 2 0.289 0.337 0.857 0.392
constant 310.617 54.694 5.679 0.000***
Number of observations: 2,538 R-squared: 0.190
Table 48: Hausa- Fixed-Effects Model with Boarding Variable and No Age Variable
Variables Coeff. Std Err T-Stat Pvalue
Gender (pupil is female) -9.041 4.442 -2.035 0.043**
Pupil is a boarder 21.837 11.471 1.904 0.058*
Pupil in HWI tertile -1.228 4.840 -0.254 0.800
Pupil in third HWI tertile 20.030 4.437 4.514 0.000***
Pupil attends other school 4.041 4.799 0.842 0.401
Number of observations: 2,580 R-squared: 0.482
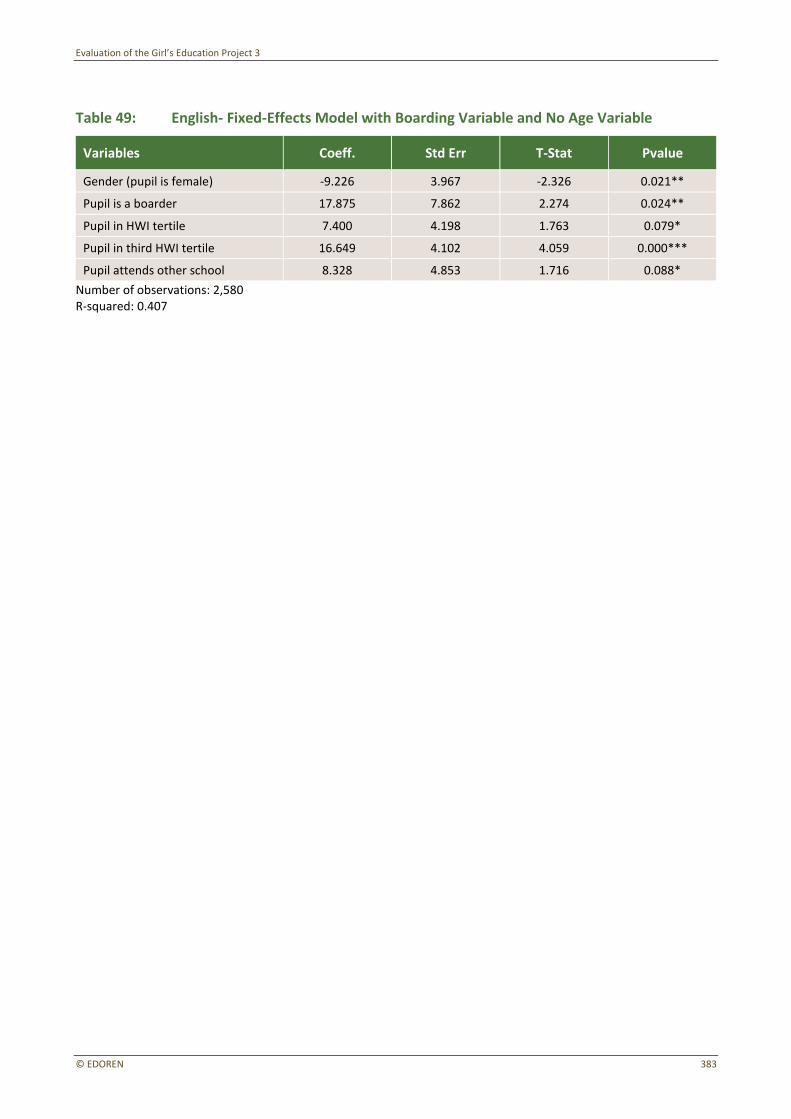
Evaluation of the Girl’s Education Project 3
© EDOREN 383
Table 49: English- Fixed-Effects Model with Boarding Variable and No Age Variable
Variables Coeff. Std Err T-Stat Pvalue
Gender (pupil is female) -9.226 3.967 -2.326 0.021**
Pupil is a boarder 17.875 7.862 2.274 0.024**
Pupil in HWI tertile 7.400 4.198 1.763 0.079*
Pupil in third HWI tertile 16.649 4.102 4.059 0.000***
Pupil attends other school 8.328 4.853 1.716 0.088*
Number of observations: 2,580 R-squared: 0.407
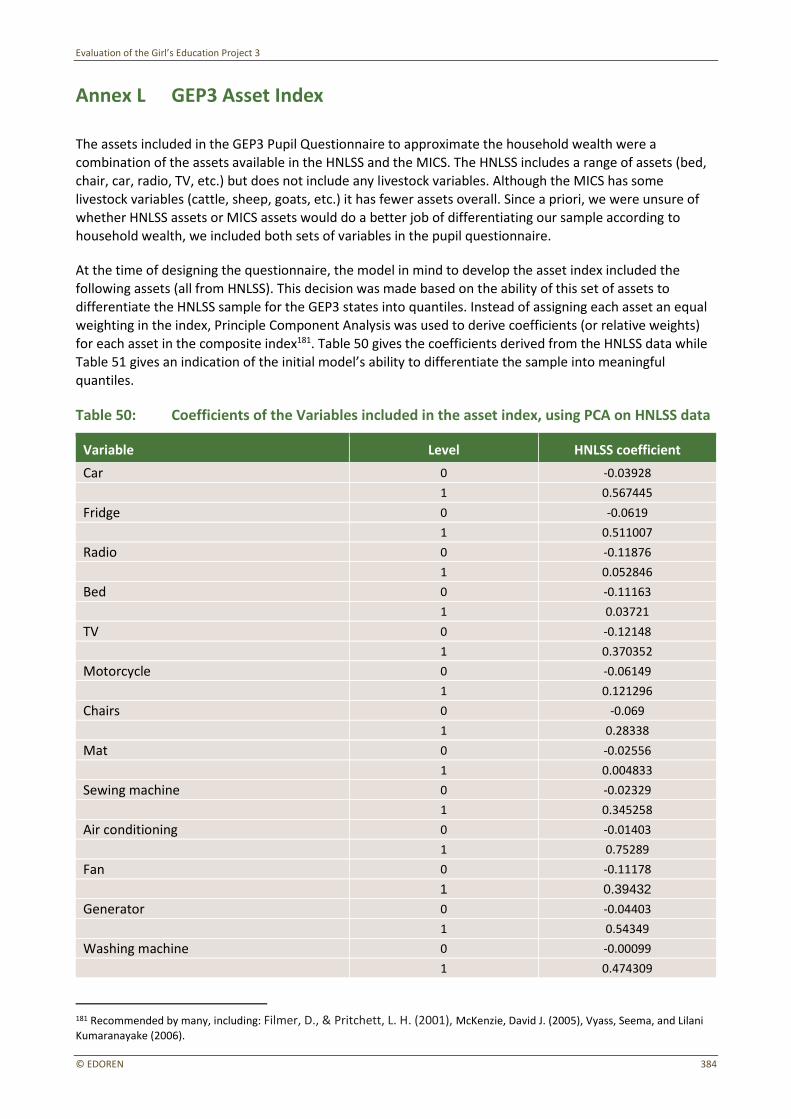
Evaluation of the Girl’s Education Project 3
© EDOREN 384
Annex L GEP3 Asset Index
The assets included in the GEP3 Pupil Questionnaire to approximate the household wealth were a combination of the assets available in the HNLSS and the MICS. The HNLSS includes a range of assets (bed, chair, car, radio, TV, etc.) but does not include any livestock variables. Although the MICS has some livestock variables (cattle, sheep, goats, etc.) it has fewer assets overall. Since a priori, we were unsure of
whether HNLSS assets or MICS assets would do a better job of differentiating our sample according to household wealth, we included both sets of variables in the pupil questionnaire.
At the time of designing the questionnaire, the model in mind to develop the asset index included the following assets (all from HNLSS). This decision was made based on the ability of this set of assets to differentiate the HNLSS sample for the GEP3 states into quantiles. Instead of assigning each asset an equal
weighting in the index, Principle Component Analysis was used to derive coefficients (or relative weights) for each asset in the composite index181. Table 50 gives the coefficients derived from the HNLSS data while Table 51 gives an indication of the initial model’s ability to differentiate the sample into meaningful
quantiles.
Table 50: Coefficients of the Variables included in the asset index, using PCA on HNLSS data
Variable Level HNLSS coefficient
Car 0 -0.03928
1 0.567445
Fridge 0 -0.0619
1 0.511007
Radio 0 -0.11876
1 0.052846
Bed 0 -0.11163
1 0.03721
TV 0 -0.12148
1 0.370352
Motorcycle 0 -0.06149
1 0.121296
Chairs 0 -0.069
1 0.28338
Mat 0 -0.02556
1 0.004833
Sewing machine 0 -0.02329
1 0.345258
Air conditioning 0 -0.01403
1 0.75289
Fan 0 -0.11178
1 0.39432
Generator 0 -0.04403
1 0.54349
Washing machine 0 -0.00099
1 0.474309
181 Recommended by many, including: Filmer, D., & Pritchett, L. H. (2001), McKenzie, David J. (2005), Vyass, Seema, and Lilani
Kumaranayake (2006).
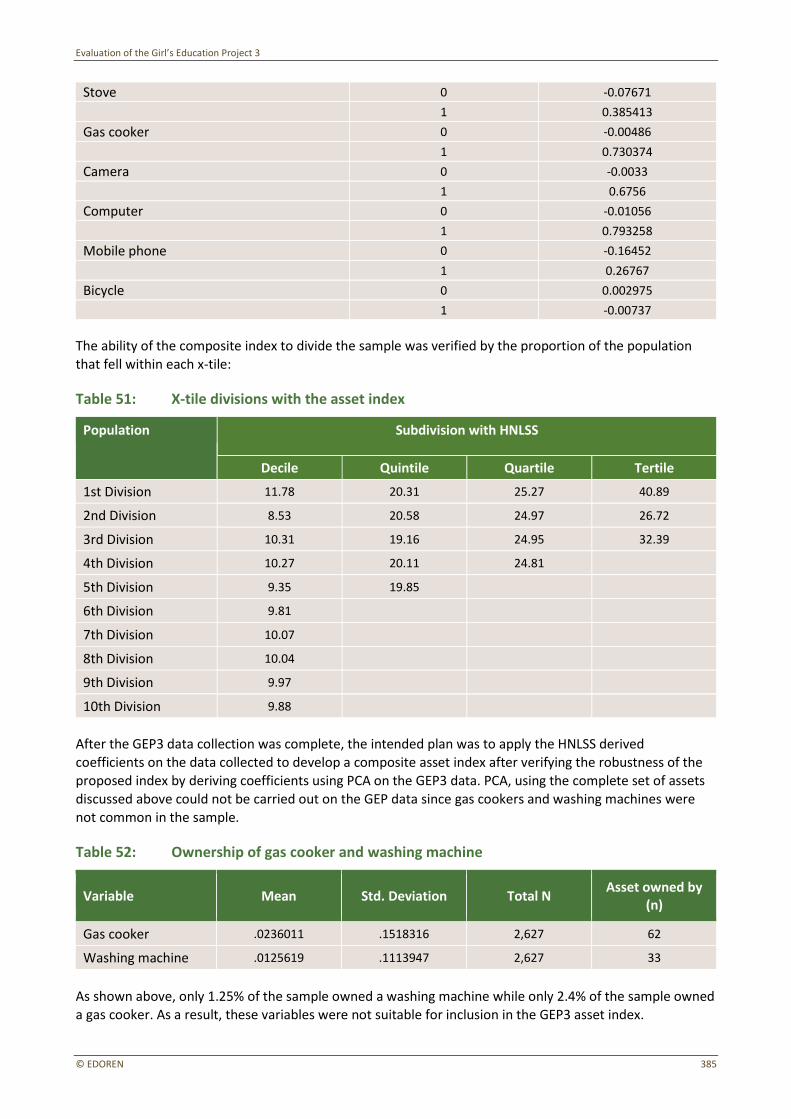
Evaluation of the Girl’s Education Project 3
© EDOREN 385
Stove 0 -0.07671
1 0.385413
Gas cooker 0 -0.00486
1 0.730374
Camera 0 -0.0033
1 0.6756
Computer 0 -0.01056
1 0.793258
Mobile phone 0 -0.16452
1 0.26767
Bicycle 0 0.002975
1 -0.00737
The ability of the composite index to divide the sample was verified by the proportion of the population that fell within each x-tile:
Table 51: X-tile divisions with the asset index
Population Subdivision with HNLSS
Decile Quintile Quartile Tertile
1st Division 11.78 20.31 25.27 40.89
2nd Division 8.53 20.58 24.97 26.72
3rd Division 10.31 19.16 24.95 32.39
4th Division 10.27 20.11 24.81
5th Division 9.35 19.85
6th Division 9.81
7th Division 10.07
8th Division 10.04
9th Division 9.97
10th Division 9.88
After the GEP3 data collection was complete, the intended plan was to apply the HNLSS derived
coefficients on the data collected to develop a composite asset index after verifying the robustness of the proposed index by deriving coefficients using PCA on the GEP3 data. PCA, using the complete set of assets discussed above could not be carried out on the GEP data since gas cookers and washing machines were
not common in the sample.
Table 52: Ownership of gas cooker and washing machine
Variable Mean Std. Deviation Total N Asset owned by
(n)
Gas cooker .0236011 .1518316 2,627 62
Washing machine .0125619 .1113947 2,627 33
As shown above, only 1.25% of the sample owned a washing machine while only 2.4% of the sample owned a gas cooker. As a result, these variables were not suitable for inclusion in the GEP3 asset index.
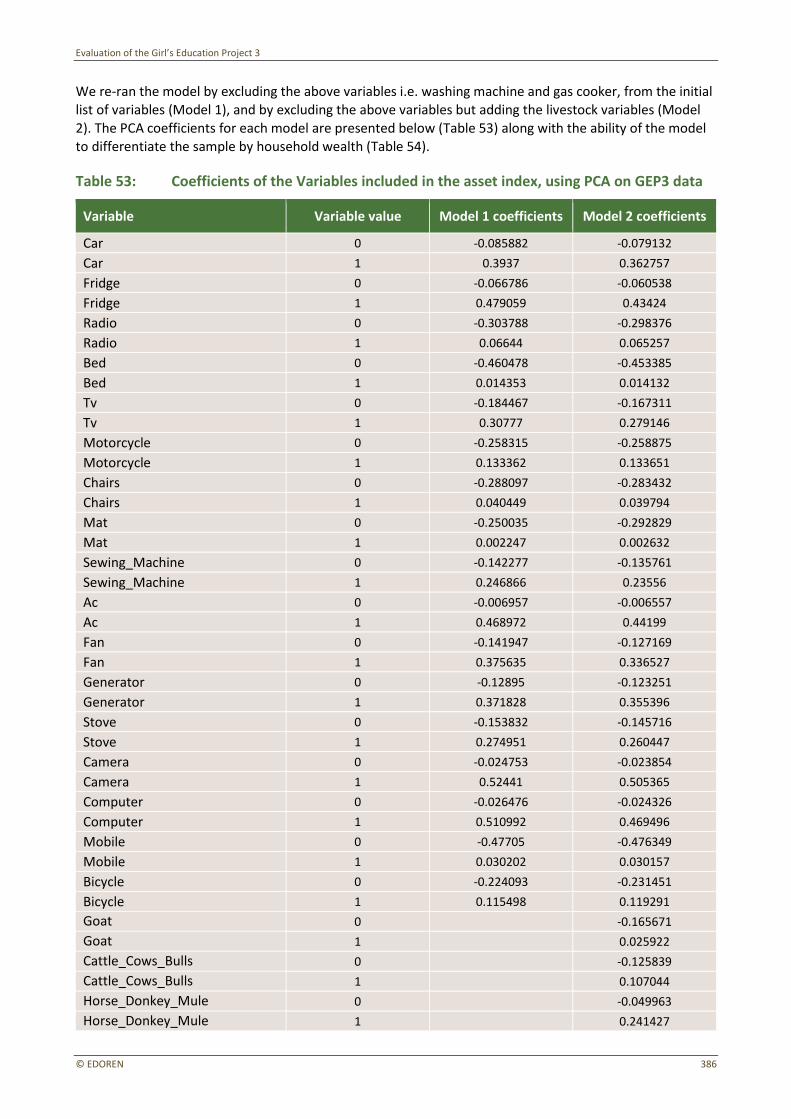
Evaluation of the Girl’s Education Project 3
© EDOREN 386
We re-ran the model by excluding the above variables i.e. washing machine and gas cooker, from the initial list of variables (Model 1), and by excluding the above variables but adding the livestock variables (Model
2). The PCA coefficients for each model are presented below (Table 53) along with the ability of the model to differentiate the sample by household wealth (Table 54).
Table 53: Coefficients of the Variables included in the asset index, using PCA on GEP3 data
Variable Variable value Model 1 coefficients Model 2 coefficients
Car 0 -0.085882 -0.079132
Car 1 0.3937 0.362757
Fridge 0 -0.066786 -0.060538
Fridge 1 0.479059 0.43424
Radio 0 -0.303788 -0.298376
Radio 1 0.06644 0.065257
Bed 0 -0.460478 -0.453385
Bed 1 0.014353 0.014132
Tv 0 -0.184467 -0.167311
Tv 1 0.30777 0.279146
Motorcycle 0 -0.258315 -0.258875
Motorcycle 1 0.133362 0.133651
Chairs 0 -0.288097 -0.283432
Chairs 1 0.040449 0.039794
Mat 0 -0.250035 -0.292829
Mat 1 0.002247 0.002632
Sewing_Machine 0 -0.142277 -0.135761
Sewing_Machine 1 0.246866 0.23556
Ac 0 -0.006957 -0.006557
Ac 1 0.468972 0.44199
Fan 0 -0.141947 -0.127169
Fan 1 0.375635 0.336527
Generator 0 -0.12895 -0.123251
Generator 1 0.371828 0.355396
Stove 0 -0.153832 -0.145716
Stove 1 0.274951 0.260447
Camera 0 -0.024753 -0.023854
Camera 1 0.52441 0.505365
Computer 0 -0.026476 -0.024326
Computer 1 0.510992 0.469496
Mobile 0 -0.47705 -0.476349
Mobile 1 0.030202 0.030157
Bicycle 0 -0.224093 -0.231451
Bicycle 1 0.115498 0.119291
Goat 0 -0.165671
Goat 1 0.025922
Cattle_Cows_Bulls 0 -0.125839
Cattle_Cows_Bulls 1 0.107044
Horse_Donkey_Mule 0 -0.049963
Horse_Donkey_Mule 1 0.241427

Evaluation of the Girl’s Education Project 3
© EDOREN 387
Sheep 0 -0.179079
Sheep 1 0.075002
Chicken 0 -0.221941
Chicken 1 0.020529
Though each of the models successfully divided the sample into tertiles (with 33% of the population in each band), the division into quartiles, quintiles and deciles varied.
Table 54: Division Into Tertiles, By Model
Population Model 1 Model 2
1st Division 33.61 33.35
2nd Division 33.08 33.35
3rd Division 33.31 33.31
Table 55: Division Into Quartiles, By Model
Population Model 1 Model 2
1st Division 25.39 25.01
2nd Division 24.70 26.38
3rd Division 25.01 23.64
4th Division 24.90 24.97
Table 56: Division Into Quintiles, By Model
Population Model 1 Model 2
1st Division 20.02 20.02
2nd Division 24.25 20.21
3rd Division 16.18 20.40
4th Division 20.18 19.38
5th Division 19.38 19.98
Table 57: Division Into Deciles, By Model
Population Model 1 Model 2
1st Division 10.01 10.01
2nd Division 10.01 10.01
3rd Division 11.42 10.01
4th Division 12.83 10.20
5th Division 5.82 11.15
6th Division 10.35 9.25
7th Division 10.05 9.36
8th Division 10.13 10.01

Evaluation of the Girl’s Education Project 3
© EDOREN 388
9th Division 9.40 10.09
10th Division 9.97 9.90
Model 1 and Model 2 assign similar weights to common assets included in the model which suggests that Model 1 is a robust specification since it yields similar coefficients with a smaller set of variables. Model 2 fares better in dividing up the sample into groups – i.e. its divisions hold for quintiles as well as deciles. Model 1, on the other hand, successfully divides the sample into tertiles and quartiles.
An additional robustness check for Model 1 is to derive this new model using the HNLSS data for GEP
states, as was done initially. This cannot be done for Model 2 since it has livestock variables which are not included in the HNLSS dataset. By calculating the HNLSS coefficients according to Model 1, we see that this composite index still splits up the sample into approximately equivalent quartiles and quintiles.
Table 58: X-tile divisions with the asset index (Model 1) on HNLSS data
Population Subdivision with HNLSS
Decile Quintile Quartile Tertile
1st Division 12.01 20.09 25.49 42.73
2nd Division 8.08 22.64 26.22 23.95
3rd Division 10.80 18.84 23.38 33.31
4th Division 11.85 18.59 24.91
5th Division 8.97 19.83
6th Division 9.87
7th Division 8.46
8th Division 10.12
9th Division 9.84
10th Division 10.00
By applying the HNLSS coefficients from the new model (excluding gas cooker and washing machine), we find that the HNLSS coefficients when applied to the GEP data still differentiate the sample into equivalent
quantiles and quartiles. Though the absolute values of the asset ‘score’ vary based on the coefficients used, the ability to split up the population holds.

Evaluation of the Girl’s Education Project 3
© EDOREN 389
Table 59: Comparison of Model 1 using GEP and HNLSS coefficients
Population Model 1
Using GEP coefficients Using HNLSS coefficients
Min Max Mean Min Max Mean
1st Division -3.486999 .702507 -1.001735 -1.083544 -.65499 -.8612033
2nd Division -2.450946 1.155099 -.0800134 -.649942 -.371386 -.5463656
3rd Division -2.225513 1.661305 .2626109 -.364134 .399303 -.0181731
4th Division -1.6906 2.165238 .8327104 .401963 5.160044 1.389426
*different data sources used to derive coefficients, applied to GEP3 dataset
The final choice of the coefficients used to develop the GEP3 asset index was a function of the variation in asset ownership in the actual data, robustness check on the model using the HNLSS data, and the ability of the model to differentiate the sample into groups based on asset ownership.
Lastly, the asset index was only used in the baseline analysis for the pupils in the Early Learning evaluation sample. The index was not constructed for pupils in the IQS support sample due to a small sample of the
sampled pupils owning ‘luxury’ assets combined with limited variation in asset ownership (Table 60). Principal component analysis imputes a score for each observation using the variation across the sample.
However, in the case of IQS support pupils, ownership of assets such as camera, computer and air conditioner were perfect predictors of ownership of other assets such as bed, mat and mattress. Due to
this, principal component analysis was not possible for this sample using the robust model developed for the Early Learning sample. Hence it has not been reported or used in the analysis of IQS support schools and associated pupil outcomes.
Table 60: Ownership of assets in IQS support sample
Variable Mean Std. Deviation Total N Asset owned by
(n)
Computer .0664336 .2492564 572 38
Air conditioner .0313589 .1744377 574 18
Camera .0596491 .2370436 570 34
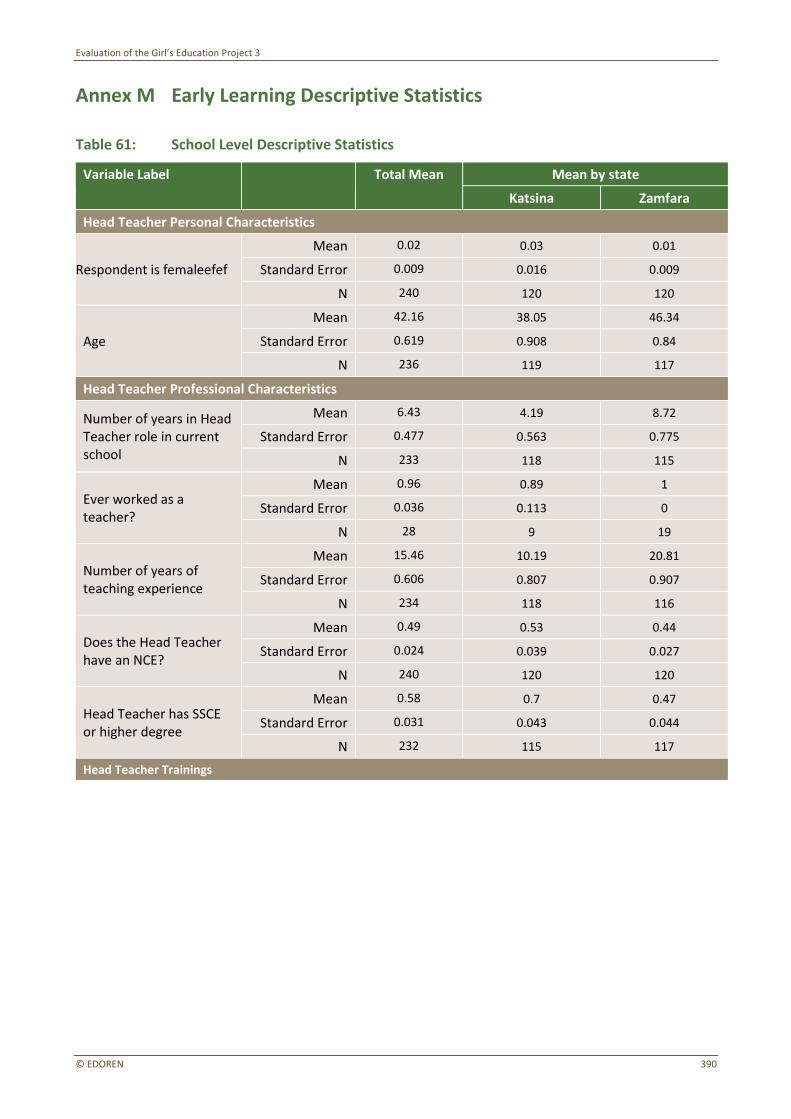
Evaluation of the Girl’s Education Project 3
© EDOREN 390
Annex M Early Learning Descriptive Statistics
Table 61: School Level Descriptive Statistics
Variable Label Total Mean Mean by state
Katsina Zamfara
Head Teacher Personal Characteristics
Respondent is femaleefef
Mean 0.02 0.03 0.01
Standard Error 0.009 0.016 0.009
N 240 120 120
Age
Mean 42.16 38.05 46.34
Standard Error 0.619 0.908 0.84
N 236 119 117
Head Teacher Professional Characteristics
Number of years in Head Teacher role in current school
Mean 6.43 4.19 8.72
Standard Error 0.477 0.563 0.775
N 233 118 115
Ever worked as a teacher?
Mean 0.96 0.89 1
Standard Error 0.036 0.113 0
N 28 9 19
Number of years of teaching experience
Mean 15.46 10.19 20.81
Standard Error 0.606 0.807 0.907
N 234 118 116
Does the Head Teacher have an NCE?
Mean 0.49 0.53 0.44
Standard Error 0.024 0.039 0.027
N 240 120 120
Head Teacher has SSCE or higher degree
Mean 0.58 0.7 0.47
Standard Error 0.031 0.043 0.044
N 232 115 117
Head Teacher Trainings

Evaluation of the Girl’s Education Project 3
© EDOREN 391
Head Teacher has attended training or workshop
Mean 0.63 0.61 0.66
Standard Error 0.031 0.045 0.043
N 237 118 119
Maximum trainings and workshops attended by the Head Teacher
Mean 1.54 1.4 1.67
Standard Error 0.067 0.067 0.114
N 150 72 78
Number of days trained
Mean 9.54 7.11 11.78
Standard Error 1.328 0.971 2.392
N 150 72 78
Is the Head Teacher trained on management and planning?
Mean 0.31 0.21 0.4
Standard Error 0.037 0.047 0.056
N 150 72 78
Is the Head Teacher trained on teaching in Hausa?
Mean 0.2 0.18 0.22
Standard Error 0.032 0.044 0.046
N 150 72 78
Is the Head Teacher trained on teaching methods?
Mean 0.63 0.72 0.55
Standard Error 0.038 0.054 0.053
N 150 72 78
Is the Head Teacher trained on community involvement?
Mean 0.25 0.08 0.41
Standard Error 0.031 0.033 0.052
N 150 72 78
Is the Head Teacher trained on integration activities?
Mean 0.22 0.19 0.25
Standard Error 0.028 0.041 0.039
N 150 72 78
Is the Head Teacher trained on developing instructional materials?
Mean 0.09 0.04 0.13
Standard Error 0.023 0.023 0.039
N 150 72 78
Is the Head Teacher trained on school leadership?
Mean 0.32 0.19 0.45
Standard Error 0.037 0.047 0.057
N 150 72 78
Is the Head Teacher trained on extra-curricular?
Mean 0.08 0.07 0.09
Standard Error 0.022 0.03 0.032
N 150 72 78
Is the Head Teacher trained on curriculum subjects?
Mean 0.3 0.29 0.31
Standard Error 0.38 0.055 0.052
N 150 72 78
Is the Head Teacher trained on literacy and
Mean 0.27 0.29 0.26
Standard Error 0.037 0.055 0.05

Evaluation of the Girl’s Education Project 3
© EDOREN 392
numeracy? N 150 72 78
Head Teacher absenteeism
How many days is the Head Teacher absent?
Mean 7.9 5.96 10.05
Standard Error 1.146 0.878 2.211
N 137 72 65
Head Teacher School Leadership
Observe any lesson for the entire duration
Mean 0.46 0.34 0.57
Standard Error 0.032 0.044 0.046
N 225 112 113
Total number of written observations available
Mean 0.2 0 0.31
Standard Error 0.1 0 0.158
N 103 38 65
Take action to improve Head Teacher attendance
Mean 0.71 0.67 0.75
Standard Error 0.026 0.037 0.038
N 225 112 113
Take action to improve pupil attendance
Mean 0.97 0.99 0.96
Standard Error 0.011 0.009 0.02
N 225 112 113
Receive any monitoring visits
Mean 0.78 0.77 0.79
Standard Error 0.023 0.032 0.034
N 240 120 120
Number of monitoring visits per school
Mean 8.27 8.47 8.07
Standard Error 0.503 0.704 0.719
N 186 92 94
Note: For each variable the table above includes Mean value, Standard Error and Number of observations.
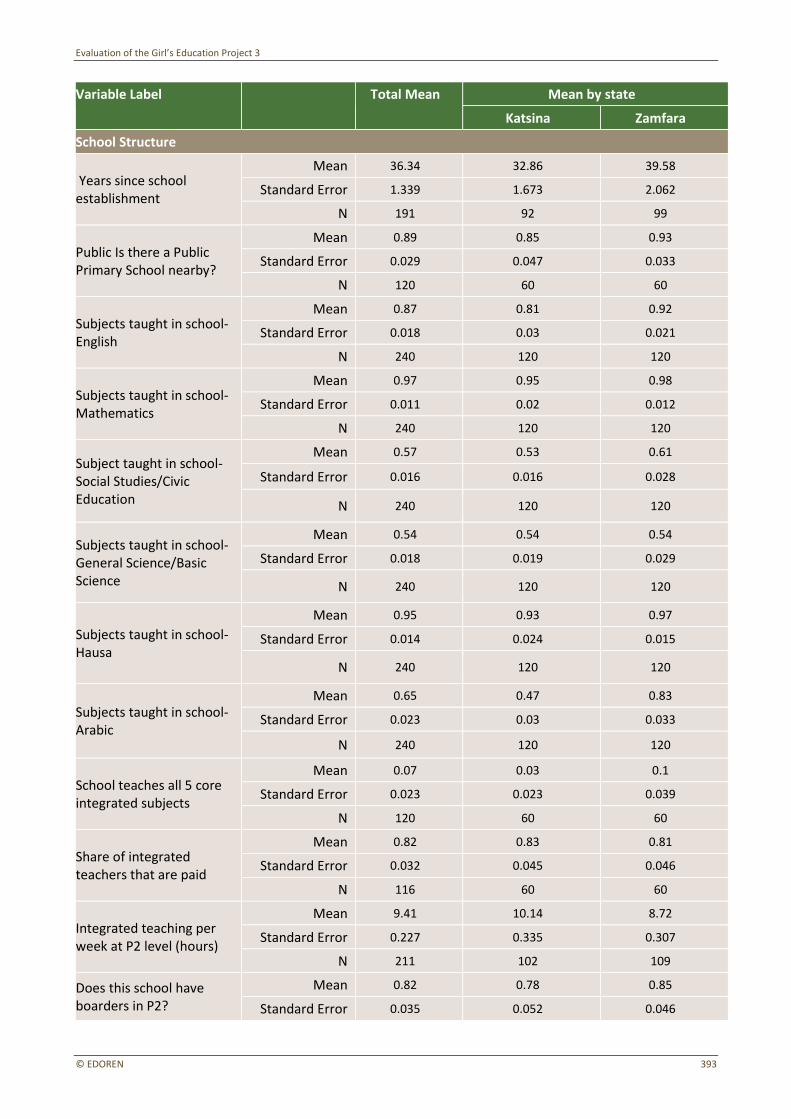
Evaluation of the Girl’s Education Project 3
© EDOREN 393
Variable Label Total Mean Mean by state
Katsina Zamfara
School Structure
Years since school establishment
Mean 36.34 32.86 39.58
Standard Error 1.339 1.673 2.062
N 191 92 99
Public Is there a Public Primary School nearby?
Mean 0.89 0.85 0.93
Standard Error 0.029 0.047 0.033
N 120 60 60
Subjects taught in school- English
Mean 0.87 0.81 0.92
Standard Error 0.018 0.03 0.021
N 240 120 120
Subjects taught in school- Mathematics
Mean 0.97 0.95 0.98
Standard Error 0.011 0.02 0.012
N 240 120 120
Subject taught in school- Social Studies/Civic Education
Mean 0.57 0.53 0.61
Standard Error 0.016 0.016 0.028
N 240 120 120
Subjects taught in school- General Science/Basic Science
Mean 0.54 0.54 0.54
Standard Error 0.018 0.019 0.029
N 240 120 120
Subjects taught in school- Hausa
Mean 0.95 0.93 0.97
Standard Error 0.014 0.024 0.015
N 240 120 120
Subjects taught in school- Arabic
Mean 0.65 0.47 0.83
Standard Error 0.023 0.03 0.033
N 240 120 120
School teaches all 5 core integrated subjects
Mean 0.07 0.03 0.1
Standard Error 0.023 0.023 0.039
N 120 60 60
Share of integrated teachers that are paid
Mean 0.82 0.83 0.81
Standard Error 0.032 0.045 0.046
N 116 60 60
Integrated teaching per week at P2 level (hours)
Mean 9.41 10.14 8.72
Standard Error 0.227 0.335 0.307
N 211 102 109
Does this school have boarders in P2?
Mean 0.82 0.78 0.85
Standard Error 0.035 0.052 0.046

Evaluation of the Girl’s Education Project 3
© EDOREN 394
N 120 60 60
Teacher Roster
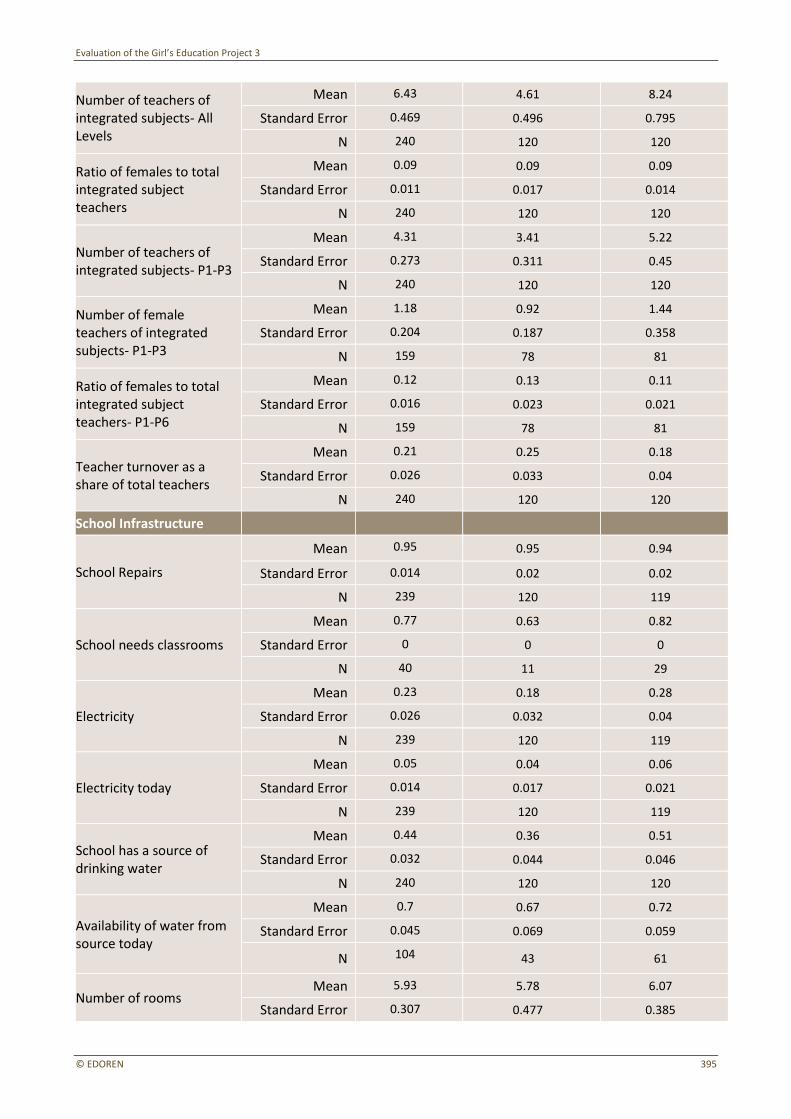
Evaluation of the Girl’s Education Project 3
© EDOREN 395
Number of teachers of integrated subjects- All Levels
Mean 6.43 4.61 8.24
Standard Error 0.469 0.496 0.795
N 240 120 120
Ratio of females to total integrated subject teachers
Mean 0.09 0.09 0.09
Standard Error 0.011 0.017 0.014
N 240 120 120
Number of teachers of integrated subjects- P1-P3
Mean 4.31 3.41 5.22
Standard Error 0.273 0.311 0.45
N 240 120 120
Number of female teachers of integrated subjects- P1-P3
Mean 1.18 0.92 1.44
Standard Error 0.204 0.187 0.358
N 159 78 81
Ratio of females to total integrated subject teachers- P1-P6
Mean 0.12 0.13 0.11
Standard Error 0.016 0.023 0.021
N 159 78 81
Teacher turnover as a share of total teachers
Mean 0.21 0.25 0.18
Standard Error 0.026 0.033 0.04
N 240 120 120
School Infrastructure
School Repairs
Mean 0.95 0.95 0.94
Standard Error 0.014 0.02 0.02
N 239 120 119
School needs classrooms
Mean 0.77 0.63 0.82
Standard Error 0 0 0
N 40 11 29
Electricity
Mean 0.23 0.18 0.28
Standard Error 0.026 0.032 0.04
N 239 120 119
Electricity today
Mean 0.05 0.04 0.06
Standard Error 0.014 0.017 0.021
N 239 120 119
School has a source of drinking water
Mean 0.44 0.36 0.51
Standard Error 0.032 0.044 0.046
N 240 120 120
Availability of water from source today
Mean 0.7 0.67 0.72
Standard Error 0.045 0.069 0.059
N 104 43 61
Number of rooms Mean 5.93 5.78 6.07
Standard Error 0.307 0.477 0.385
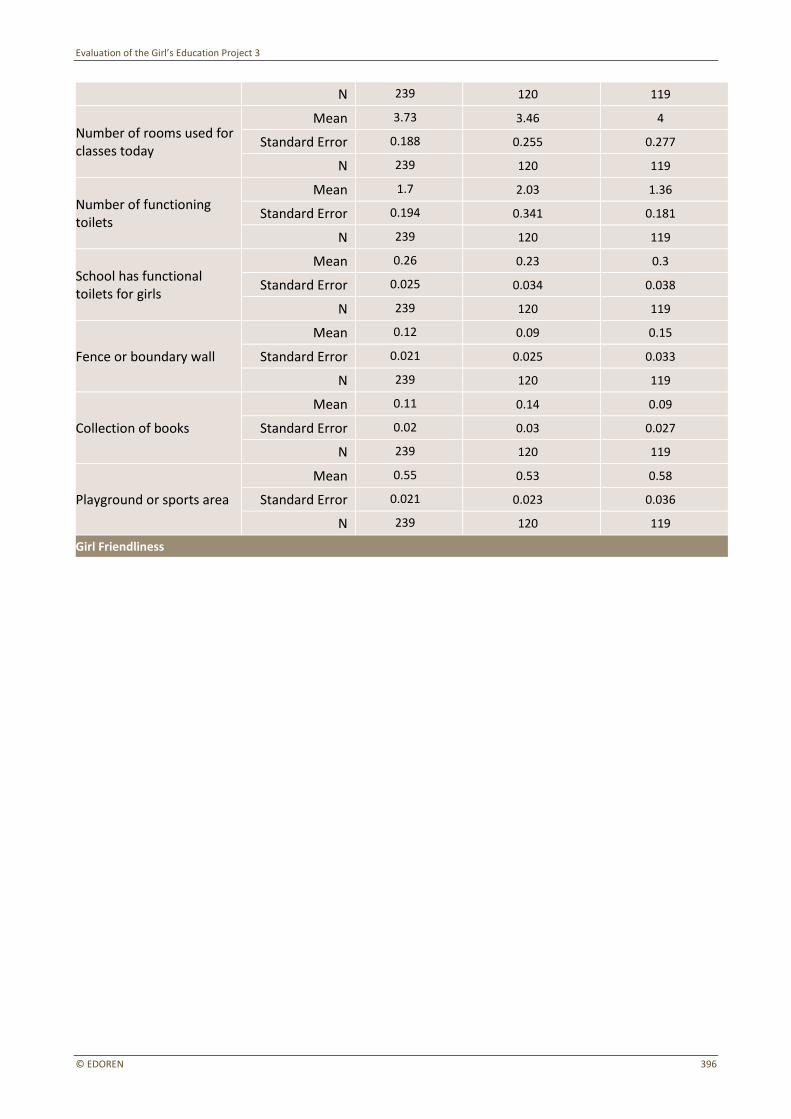
Evaluation of the Girl’s Education Project 3
© EDOREN 396
N 239 120 119
Number of rooms used for classes today
Mean 3.73 3.46 4
Standard Error 0.188 0.255 0.277
N 239 120 119
Number of functioning toilets
Mean 1.7 2.03 1.36
Standard Error 0.194 0.341 0.181
N 239 120 119
School has functional toilets for girls
Mean 0.26 0.23 0.3
Standard Error 0.025 0.034 0.038
N 239 120 119
Fence or boundary wall
Mean 0.12 0.09 0.15
Standard Error 0.021 0.025 0.033
N 239 120 119
Collection of books
Mean 0.11 0.14 0.09
Standard Error 0.02 0.03 0.027
N 239 120 119
Playground or sports area
Mean 0.55 0.53 0.58
Standard Error 0.021 0.023 0.036
N 239 120 119
Girl Friendliness
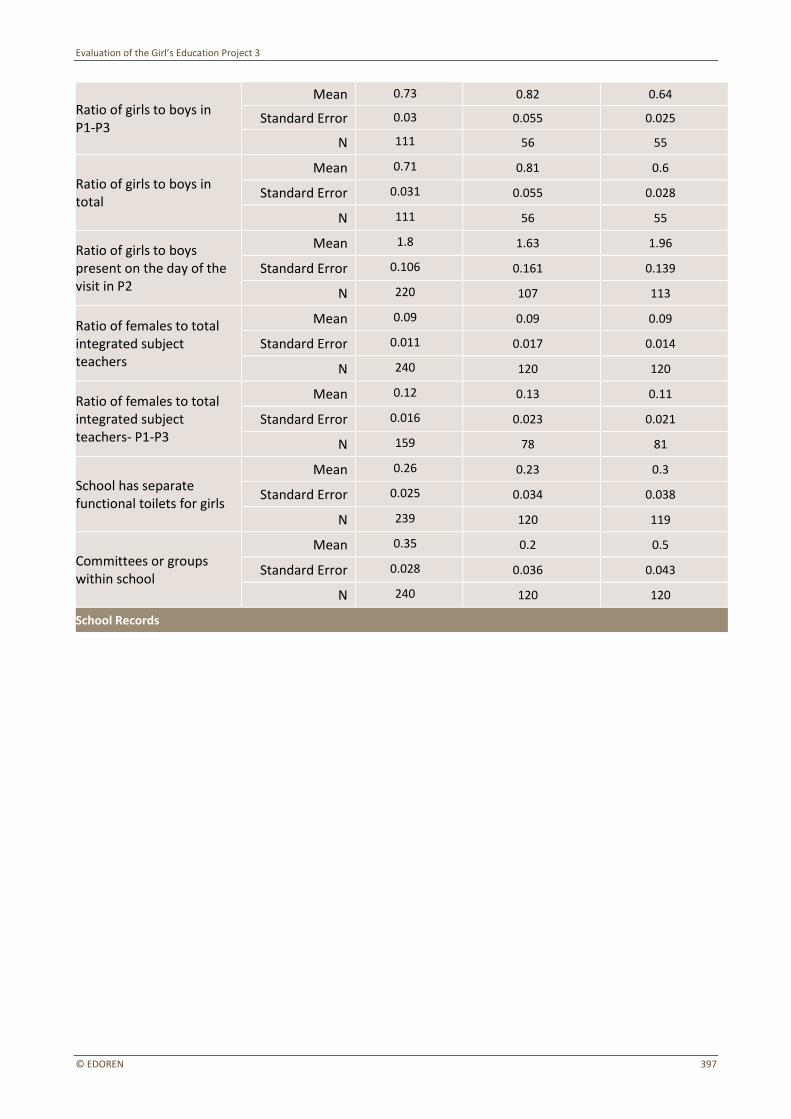
Evaluation of the Girl’s Education Project 3
© EDOREN 397
Ratio of girls to boys in P1-P3
Mean 0.73 0.82 0.64
Standard Error 0.03 0.055 0.025
N 111 56 55
Ratio of girls to boys in total
Mean 0.71 0.81 0.6
Standard Error 0.031 0.055 0.028
N 111 56 55
Ratio of girls to boys present on the day of the visit in P2
Mean 1.8 1.63 1.96
Standard Error 0.106 0.161 0.139
N 220 107 113
Ratio of females to total integrated subject teachers
Mean 0.09 0.09 0.09
Standard Error 0.011 0.017 0.014
N 240 120 120
Ratio of females to total integrated subject teachers- P1-P3
Mean 0.12 0.13 0.11
Standard Error 0.016 0.023 0.021
N 159 78 81
School has separate functional toilets for girls
Mean 0.26 0.23 0.3
Standard Error 0.025 0.034 0.038
N 239 120 119
Committees or groups within school
Mean 0.35 0.2 0.5
Standard Error 0.028 0.036 0.043
N 240 120 120
School Records
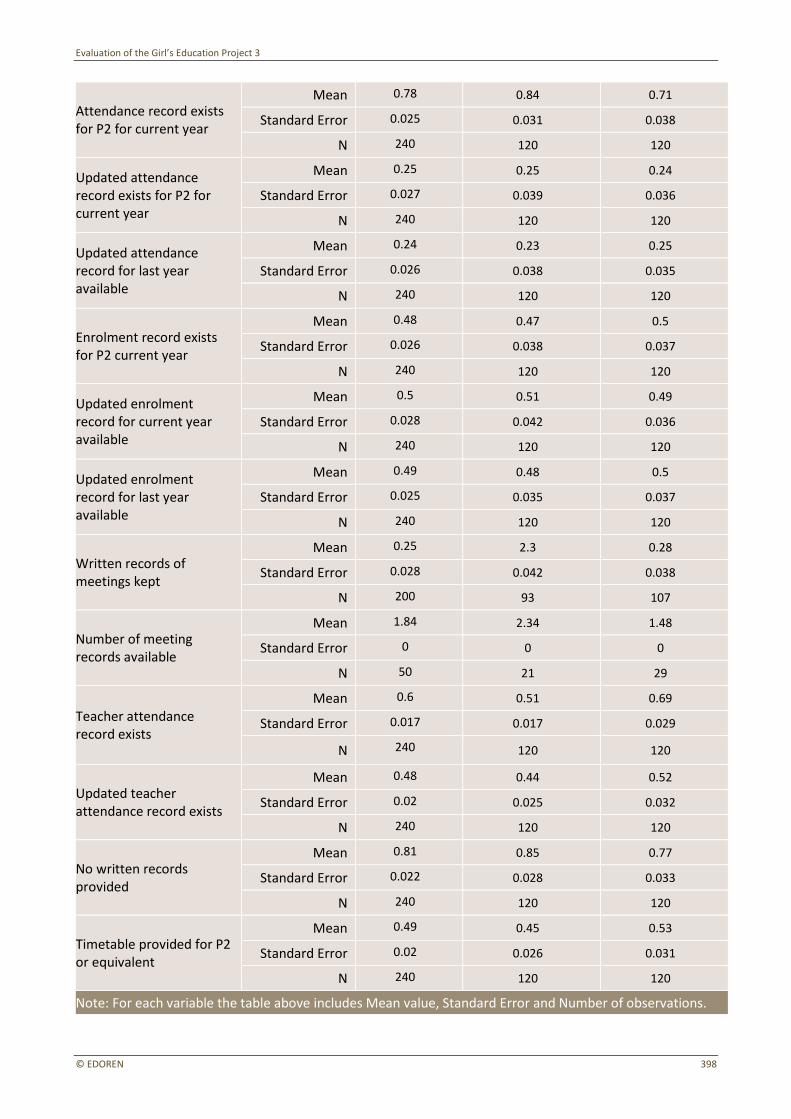
Evaluation of the Girl’s Education Project 3
© EDOREN 398
Attendance record exists for P2 for current year
Mean 0.78 0.84 0.71
Standard Error 0.025 0.031 0.038
N 240 120 120
Updated attendance record exists for P2 for current year
Mean 0.25 0.25 0.24
Standard Error 0.027 0.039 0.036
N 240 120 120
Updated attendance record for last year available
Mean 0.24 0.23 0.25
Standard Error 0.026 0.038 0.035
N 240 120 120
Enrolment record exists for P2 current year
Mean 0.48 0.47 0.5
Standard Error 0.026 0.038 0.037
N 240 120 120
Updated enrolment record for current year available
Mean 0.5 0.51 0.49
Standard Error 0.028 0.042 0.036
N 240 120 120
Updated enrolment record for last year available
Mean 0.49 0.48 0.5
Standard Error 0.025 0.035 0.037
N 240 120 120
Written records of meetings kept
Mean 0.25 2.3 0.28
Standard Error 0.028 0.042 0.038
N 200 93 107
Number of meeting records available
Mean 1.84 2.34 1.48
Standard Error 0 0 0
N 50 21 29
Teacher attendance record exists
Mean 0.6 0.51 0.69
Standard Error 0.017 0.017 0.029
N 240 120 120
Updated teacher attendance record exists
Mean 0.48 0.44 0.52
Standard Error 0.02 0.025 0.032
N 240 120 120
No written records provided
Mean 0.81 0.85 0.77
Standard Error 0.022 0.028 0.033
N 240 120 120
Timetable provided for P2 or equivalent
Mean 0.49 0.45 0.53
Standard Error 0.02 0.026 0.031
N 240 120 120
Note: For each variable the table above includes Mean value, Standard Error and Number of observations.
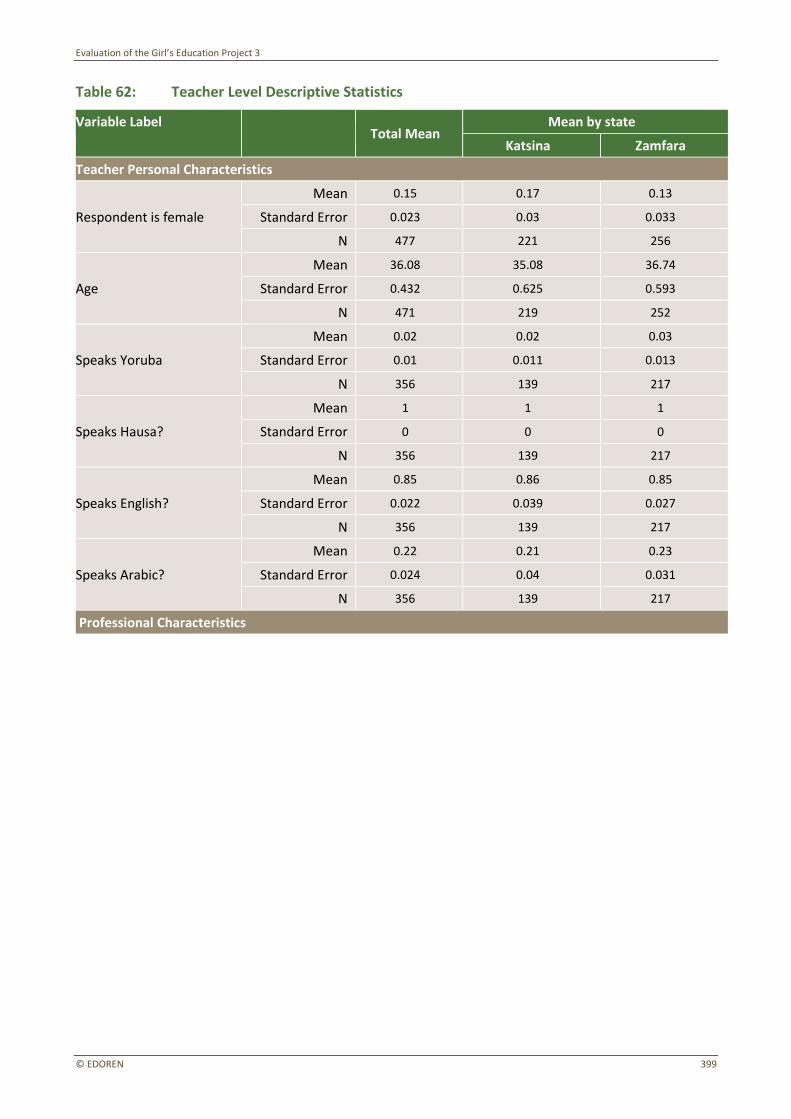
Evaluation of the Girl’s Education Project 3
© EDOREN 399
Table 62: Teacher Level Descriptive Statistics
Variable Label Total Mean
Mean by state
Katsina Zamfara
Teacher Personal Characteristics
Respondent is female
Mean 0.15 0.17 0.13
Standard Error 0.023 0.03 0.033
N 477 221 256
Age
Mean 36.08 35.08 36.74
Standard Error 0.432 0.625 0.593
N 471 219 252
Speaks Yoruba
Mean 0.02 0.02 0.03
Standard Error 0.01 0.011 0.013
N 356 139 217
Speaks Hausa?
Mean 1 1 1
Standard Error 0 0 0
N 356 139 217
Speaks English?
Mean 0.85 0.86 0.85
Standard Error 0.022 0.039 0.027
N 356 139 217
Speaks Arabic?
Mean 0.22 0.21 0.23
Standard Error 0.024 0.04 0.031
N 356 139 217
Professional Characteristics
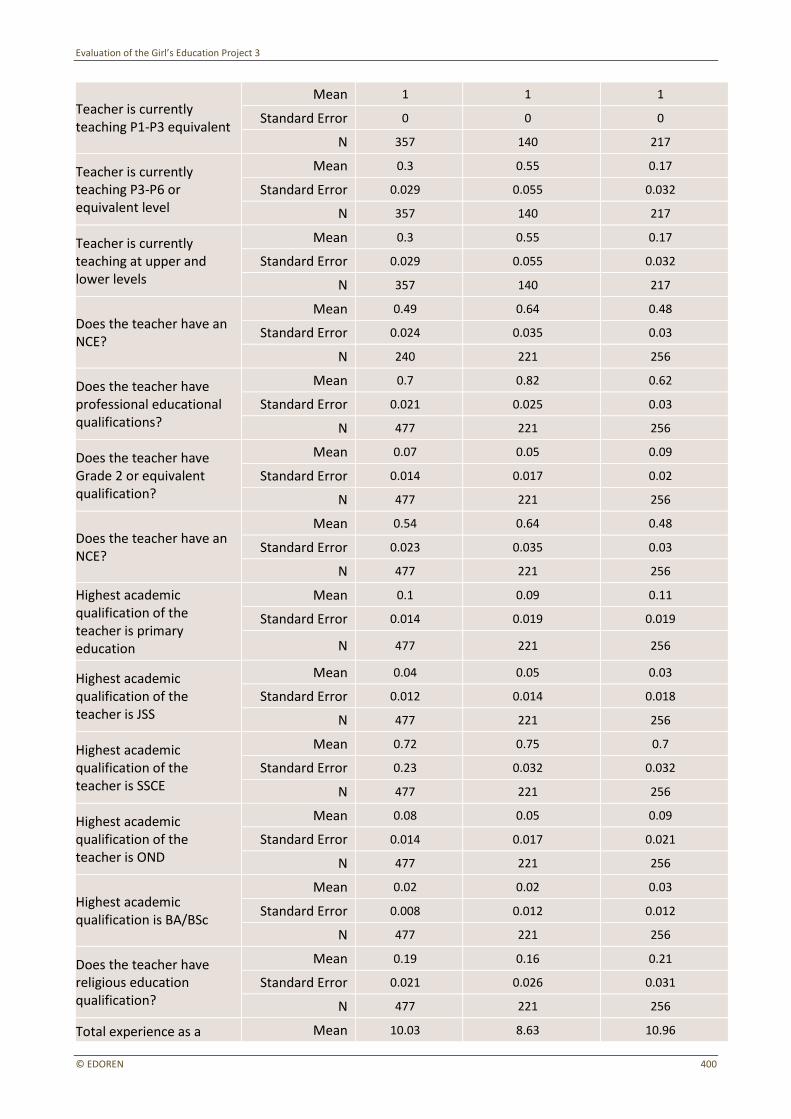
Evaluation of the Girl’s Education Project 3
© EDOREN 400
Teacher is currently teaching P1-P3 equivalent
Mean 1 1 1
Standard Error 0 0 0
N 357 140 217
Teacher is currently teaching P3-P6 or equivalent level
Mean 0.3 0.55 0.17
Standard Error 0.029 0.055 0.032
N 357 140 217
Teacher is currently teaching at upper and lower levels
Mean 0.3 0.55 0.17
Standard Error 0.029 0.055 0.032
N 357 140 217
Does the teacher have an NCE?
Mean 0.49 0.64 0.48
Standard Error 0.024 0.035 0.03
N 240 221 256
Does the teacher have professional educational qualifications?
Mean 0.7 0.82 0.62
Standard Error 0.021 0.025 0.03
N 477 221 256
Does the teacher have Grade 2 or equivalent qualification?
Mean 0.07 0.05 0.09
Standard Error 0.014 0.017 0.02
N 477 221 256
Does the teacher have an NCE?
Mean 0.54 0.64 0.48
Standard Error 0.023 0.035 0.03
N 477 221 256
Highest academic qualification of the teacher is primary education
Mean 0.1 0.09 0.11
Standard Error 0.014 0.019 0.019
N 477 221 256
Highest academic qualification of the teacher is JSS
Mean 0.04 0.05 0.03
Standard Error 0.012 0.014 0.018
N 477 221 256
Highest academic qualification of the teacher is SSCE
Mean 0.72 0.75 0.7
Standard Error 0.23 0.032 0.032
N 477 221 256
Highest academic qualification of the teacher is OND
Mean 0.08 0.05 0.09
Standard Error 0.014 0.017 0.021
N 477 221 256
Highest academic qualification is BA/BSc
Mean 0.02 0.02 0.03
Standard Error 0.008 0.012 0.012
N 477 221 256
Does the teacher have religious education qualification?
Mean 0.19 0.16 0.21
Standard Error 0.021 0.026 0.031
N 477 221 256
Total experience as a Mean 10.03 8.63 10.96
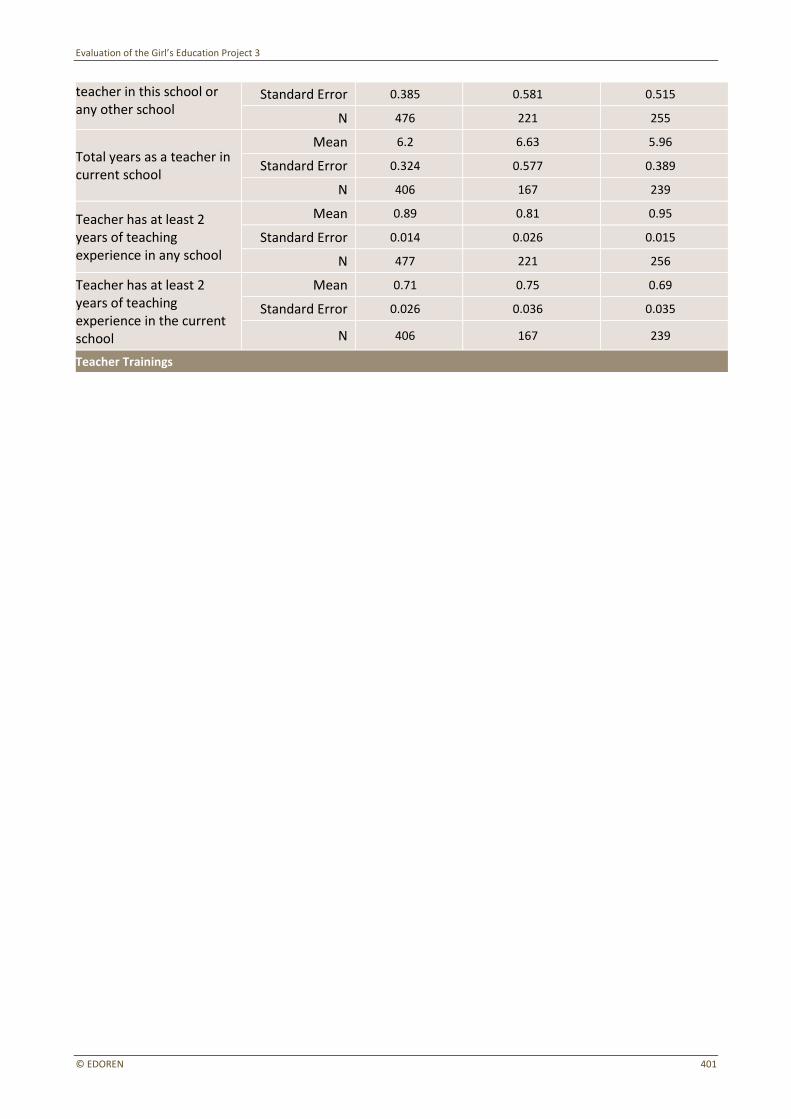
Evaluation of the Girl’s Education Project 3
© EDOREN 401
teacher in this school or any other school
Standard Error 0.385 0.581 0.515
N 476 221 255
Total years as a teacher in current school
Mean 6.2 6.63 5.96
Standard Error 0.324 0.577 0.389
N 406 167 239
Teacher has at least 2 years of teaching experience in any school
Mean 0.89 0.81 0.95
Standard Error 0.014 0.026 0.015
N 477 221 256
Teacher has at least 2 years of teaching experience in the current school
Mean 0.71 0.75 0.69
Standard Error 0.026 0.036 0.035
N 406 167 239
Teacher Trainings
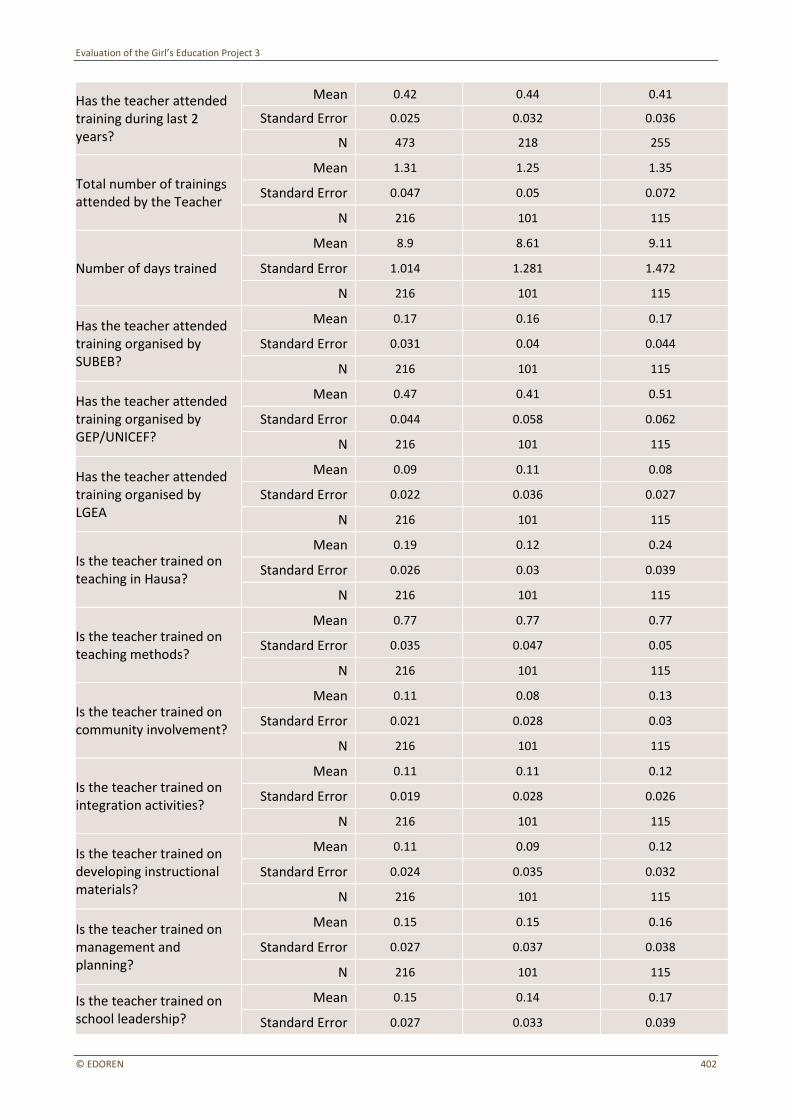
Evaluation of the Girl’s Education Project 3
© EDOREN 402
Has the teacher attended training during last 2 years?
Mean 0.42 0.44 0.41
Standard Error 0.025 0.032 0.036
N 473 218 255
Total number of trainings attended by the Teacher
Mean 1.31 1.25 1.35
Standard Error 0.047 0.05 0.072
N 216 101 115
Number of days trained
Mean 8.9 8.61 9.11
Standard Error 1.014 1.281 1.472
N 216 101 115
Has the teacher attended training organised by SUBEB?
Mean 0.17 0.16 0.17
Standard Error 0.031 0.04 0.044
N 216 101 115
Has the teacher attended training organised by GEP/UNICEF?
Mean 0.47 0.41 0.51
Standard Error 0.044 0.058 0.062
N 216 101 115
Has the teacher attended training organised by LGEA
Mean 0.09 0.11 0.08
Standard Error 0.022 0.036 0.027
N 216 101 115
Is the teacher trained on teaching in Hausa?
Mean 0.19 0.12 0.24
Standard Error 0.026 0.03 0.039
N 216 101 115
Is the teacher trained on teaching methods?
Mean 0.77 0.77 0.77
Standard Error 0.035 0.047 0.05
N 216 101 115
Is the teacher trained on community involvement?
Mean 0.11 0.08 0.13
Standard Error 0.021 0.028 0.03
N 216 101 115
Is the teacher trained on integration activities?
Mean 0.11 0.11 0.12
Standard Error 0.019 0.028 0.026
N 216 101 115
Is the teacher trained on developing instructional materials?
Mean 0.11 0.09 0.12
Standard Error 0.024 0.035 0.032
N 216 101 115
Is the teacher trained on management and planning?
Mean 0.15 0.15 0.16
Standard Error 0.027 0.037 0.038
N 216 101 115
Is the teacher trained on school leadership?
Mean 0.15 0.14 0.17
Standard Error 0.027 0.033 0.039

Evaluation of the Girl’s Education Project 3
© EDOREN 403
N 216 101 115
Is the teacher trained on extra-curricular?
Mean 0.07 0.08 0.07
Standard Error 0.019 0.025 0.028
N 216 101 115
Is the teacher trained on curriculum subjects?
Mean 0.21 0.31 0.14
Standard Error 0.029 0.049 0.035
N 216 101 115
Is the teacher trained on literacy and numeracy?
Mean 0.34 0.24 0.4
Standard Error 0.04 0.052 0.057
N 216 101 115
Teacher absenteeism
Teacher is absent at least once during last 3 months
Mean 0.63 0.57 0.67
Standard Error 0.025 0.039 0.032
N 450 209 241
Number of days teacher is absent during the last 3 months
Mean 7.73 6.21 8.58
Standard Error 0.719 1.041 0.966
N 294 127 167
Teacher Motivation
Teacher motivation composite index
Mean N/A 2.98 2.99
Standard Error N/A 0.022 0.02
N N/A 220 254
Teacher Knowledge
Teacher subject knowledge composite index
Mean 0.49 0.51 0.48
Standard Error 0.022 0.034 0.028
N 463 211 252
Teacher pedagogical knowledge composite index
Mean 0.05 0.06 0.05
Standard Error 0.012 0.013 0.019
N 463 211 252
Mother-Tongue teaching (Hausa) in early grades index
Mean 38.33 39.77 37.4
Standard Error 0.815 0.938 1.164
N 459 209 250
Hausa teaching/learning materials composite index
Mean 0.02 0.03 0.02
Standard Error 0.005 0.008 0.006
N 469 217 252
Syllabus/Curriculum knowledge
Mean 0.89 0.77 0.97
Standard Error 0.056 0.086 0.072
N 463 211 252
Note: For each variable the table above includes Mean value, Standard Error and Number of observations.
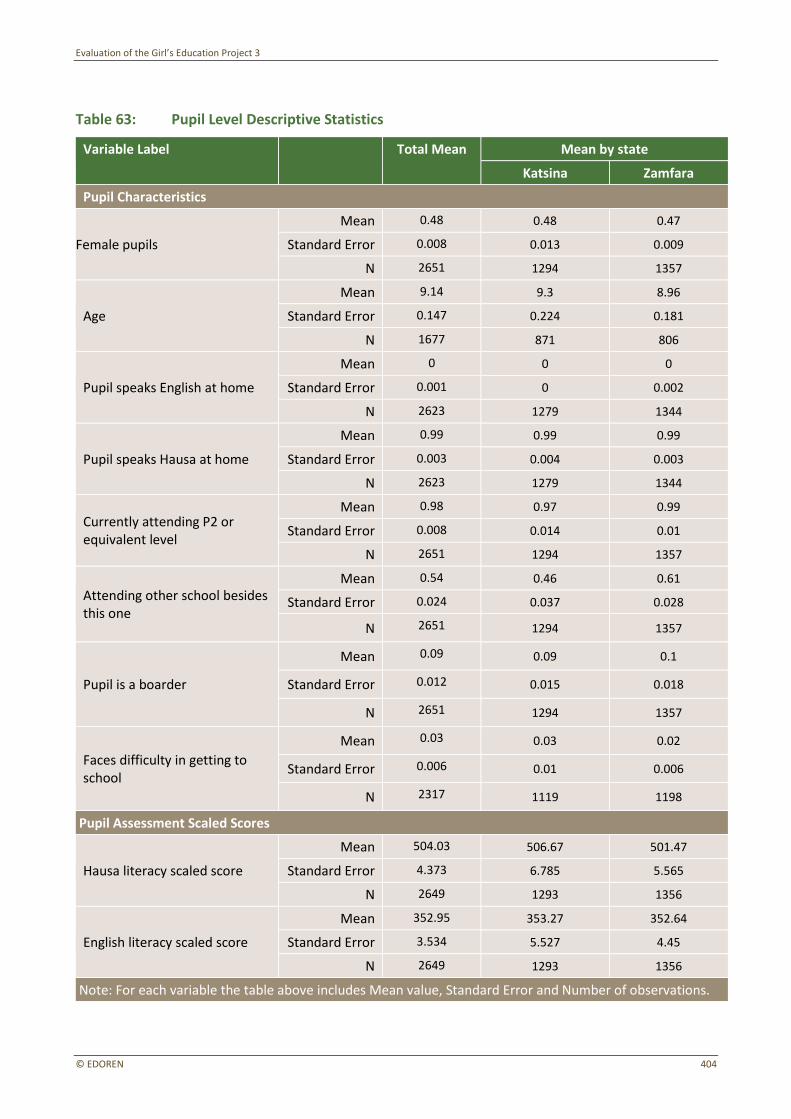
Evaluation of the Girl’s Education Project 3
© EDOREN 404
Table 63: Pupil Level Descriptive Statistics
Variable Label Total Mean Mean by state
Katsina Zamfara
Pupil Characteristics
Female pupils
Mean 0.48 0.48 0.47
Standard Error 0.008 0.013 0.009
N 2651 1294 1357
Age
Mean 9.14 9.3 8.96
Standard Error 0.147 0.224 0.181
N 1677 871 806
Pupil speaks English at home
Mean 0 0 0
Standard Error 0.001 0 0.002
N 2623 1279 1344
Pupil speaks Hausa at home
Mean 0.99 0.99 0.99
Standard Error 0.003 0.004 0.003
N 2623 1279 1344
Currently attending P2 or equivalent level
Mean 0.98 0.97 0.99
Standard Error 0.008 0.014 0.01
N 2651 1294 1357
Attending other school besides this one
Mean 0.54 0.46 0.61
Standard Error 0.024 0.037 0.028
N 2651 1294 1357
Pupil is a boarder
Mean 0.09 0.09 0.1
Standard Error 0.012 0.015 0.018
N 2651 1294 1357
Faces difficulty in getting to school
Mean 0.03 0.03 0.02
Standard Error 0.006 0.01 0.006
N 2317 1119 1198
Pupil Assessment Scaled Scores
Hausa literacy scaled score
Mean 504.03 506.67 501.47
Standard Error 4.373 6.785 5.565
N 2649 1293 1356
English literacy scaled score
Mean 352.95 353.27 352.64
Standard Error 3.534 5.527 4.45
N 2649 1293 1356
Note: For each variable the table above includes Mean value, Standard Error and Number of observations.

Evaluation of the Girl’s Education Project 3
© EDOREN 405
Annex N IQ School Support (IQSS) Descriptive Statistics
Table 64: School Level Descriptive Statistics
Variable Label Total Mean Mean by state
Bauchi Niger
Head Teacher Personal Characteristics
Respondent is female
Mean 0.03 0 0.07
Standard Error 0.024 0 0.048
N 60 30 30
Age
Mean 40 44.07 35.63
Standard Error 1.225 1.73 1.733
N 56 29 27
Head Teacher Professional Characteristics
Number of years in Head Teacher role in current school
Mean 9.61 14.48 4.8
Standard Error 1.25 2.35 0.939
N 60 29 30
Ever worked as a teacher?
Mean 0.89 1 0.76
Standard Error 0 0 0
N 9 5 4
Number of years of teaching experience
Mean 13.58 17.41 9.62
Standard Error 1.048 1.566 1.386
N 59 30 29
Does the Head Teacher have an NCE?
Mean 0.23 0.27 0.2
Standard Error 0.053 0.079 0.07
N 60 30 30
Head Teacher has SSCE or higher degree
Mean 0.4 0.23 0.57
Standard Error 0.061 0.082 0.091
N 60 30 30
Head Teacher has professional education
Mean 0.33 0.4 0.27
Standard Error 0.056 0.088 0.07
N 60 30 30
Head Teacher has religious education
Mean 0.38 0.56 0.2
Standard Error 0.06 0.091 0.078
N 60 30 30
Head Teacher Trainings
Head Teacher has attended training or workshop
Mean 0.43 0.37 0.5
Standard Error 0.067 0.088 0.1
N 60 30 30

Evaluation of the Girl’s Education Project 3
© EDOREN 406
Maximum trainings and workshops attended by the Head Teacher
Mean 1.34 1.45 1.26
Standard Error 0 0 0
N 26 11 15
Number of days trained
Mean 4.72 5.28 4.31
Standard Error 0 0 0
N 26 11 15
Is the Head Teacher trained on management and planning?
Mean 0.27 0.36 0.2
Standard Error 0 0 0
N 26 11 15
Is the Head Teacher trained on teaching in Hausa?
Mean 0.27 0.46 0.13
Standard Error 0 0 0
N 26 11 15
Is the Head Teacher trained on teaching methods?
Mean 0.85 0.82 0.87
Standard Error 0 0 0
N 26 11 15
Is the Head Teacher trained on community involvement?
Mean 0.16 0.18 0.14
Standard Error 0 0 0
N 26 11 15
Is the Head Teacher trained on integration activities?
Mean 0.31 0.36 0.27
Standard Error 0 0 0
N 26 11 15
Is the Head Teacher trained on developing instructional materials?
Mean 0.04 0 0.07
Standard Error 0 0 0
N 26 11 15
Is the Head Teacher trained on school leadership?
Mean 0.31 0.63 0.07
Standard Error 0 0 0
N 26 11 15
Is the Head Teacher trained on extra-curricular?
Mean 0.04 0 0.07
Standard Error 0 0 0
N 26 11 15
Is the Head Teacher trained on curriculum subjects?
Mean 0.11 0.09 0.13
Standard Error 0 0 0
N 26 11 15
Is the Head Teacher trained on literacy and numeracy?
Mean 0.31 0.36 0.26
Standard Error 0 0 0
N 26 11 15
Head Teacher absenteeism

Evaluation of the Girl’s Education Project 3
© EDOREN 407
How many days is the Head Teacher absent?
Mean 5.87 5.88 5.86
Standard Error 0.825 0.663 1.791
N 47 28 19
Head Teacher School Leadership
Observe any lesson for the entire duration
Mean 0.42 0.3 0.56
Standard Error 0.065 0.078 0.105
N 57 30 27
Total number of written observations available
Mean 0.04 0.11 0
Standard Error 0 0 0
N 24 9 15
Take action to improve Head Teacher attendance
Mean 0.61 0.63 0.59
Standard Error 0.066 0.085 0.101
N 57 30 27
Take action to improve pupil attendance
Mean 0.91 0.93 0.89
Standard Error 0.037 0.04 0.064
N 57 30 27
Receive any monitoring visits
Mean 0.38 0.44 0.33
Standard Error 0.062 0.091 0.085
N 60 30 30
Number of monitoring visits per school
Mean 3.75 4.24 3.1
Standard Error 0 0 0
N 23 13 10
Who came for monitoring visits-LGEA Officer?
Mean 0.7 0.69 0.7
Standard Error 0 0 0
N 23 13 10
Who came for monitoring visits- SAME Officer?
Mean 0.09 0 0.2
Standard Error 0 0 0
N 23 13 10
Who came for monitoring visits- SUBEB Officer?
Mean 0.13 0.08 0.2
Standard Error 0 0 0
N 23 13 10
Who came for monitoring visits- Ministry of Education Officer?
Mean 0.04 0.08 0
Standard Error 0 0 0
N 23 13 10
Who came for monitoring visits- UBEC Officer?
Mean 0.04 0 0.1
Standard Error 0 0 0
N 23 13 10
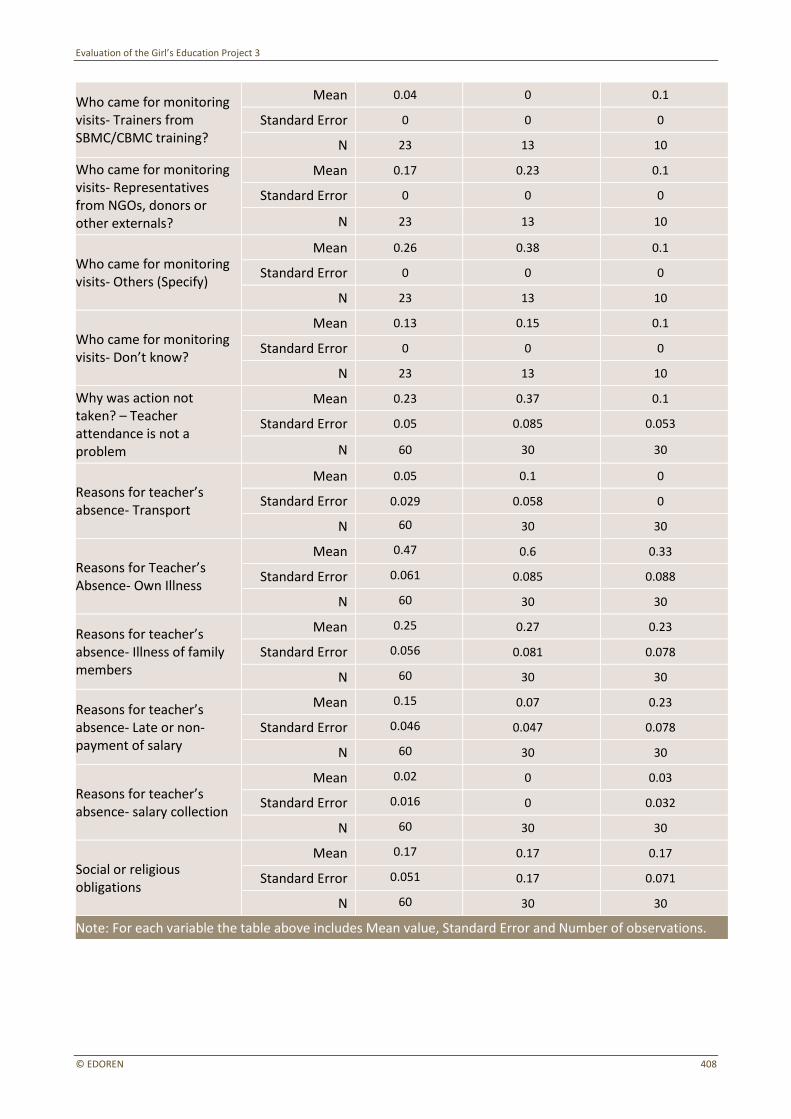
Evaluation of the Girl’s Education Project 3
© EDOREN 408
Who came for monitoring visits- Trainers from SBMC/CBMC training?
Mean 0.04 0 0.1
Standard Error 0 0 0
N 23 13 10
Who came for monitoring visits- Representatives from NGOs, donors or other externals?
Mean 0.17 0.23 0.1
Standard Error 0 0 0
N 23 13 10
Who came for monitoring visits- Others (Specify)
Mean 0.26 0.38 0.1
Standard Error 0 0 0
N 23 13 10
Who came for monitoring visits- Don’t know?
Mean 0.13 0.15 0.1
Standard Error 0 0 0
N 23 13 10
Why was action not taken? – Teacher attendance is not a problem
Mean 0.23 0.37 0.1
Standard Error 0.05 0.085 0.053
N 60 30 30
Reasons for teacher’s absence- Transport
Mean 0.05 0.1 0
Standard Error 0.029 0.058 0
N 60 30 30
Reasons for Teacher’s Absence- Own Illness
Mean 0.47 0.6 0.33
Standard Error 0.061 0.085 0.088
N 60 30 30
Reasons for teacher’s absence- Illness of family members
Mean 0.25 0.27 0.23
Standard Error 0.056 0.081 0.078
N 60 30 30
Reasons for teacher’s absence- Late or non-payment of salary
Mean 0.15 0.07 0.23
Standard Error 0.046 0.047 0.078
N 60 30 30
Reasons for teacher’s absence- salary collection
Mean 0.02 0 0.03
Standard Error 0.016 0 0.032
N 60 30 30
Social or religious obligations
Mean 0.17 0.17 0.17
Standard Error 0.051 0.17 0.071
N 60 30 30
Note: For each variable the table above includes Mean value, Standard Error and Number of observations.

Evaluation of the Girl’s Education Project 3
© EDOREN 409
Variable Label Total Mean Mean by state
Bauchi Niger
School Structure
Years since school establishment
Mean 26.65 34.81 18.15
Standard Error 2.437 3.555 3.321
N 53 27 26
Public Primary School?
Mean 0.98 0.97 1
Standard Error 0.017 0.033 0
N 60 30 30
Subjects taught in school- English
Mean 0.92 0.97 0.87
Standard Error 0.035 0.034 0.062
N 60 30 30
Subjects taught in school- Mathematics
Mean 0.92 0.97 0.87
Standard Error 0.035 0.034 0.062
N 60 30 30
Subject taught in school- Social Studies/Civic Education
Mean 0.23 0.17 0.3
Standard Error 0.055 0.071 0.085
N 60 30 30
Subjects taught in school- General Science/Basic Science
Mean 0.2 0.2 0.2
Standard Error 0.05 0.071 0.07
N 60
30 30
Subjects taught in school- Hausa
Mean 0.73 0.7 0.77
Standard Error 0.057 0.081 0.078
N 60 30 30
Subjects taught in school- Arabic
Mean 0.6 0.6 0.6
Standard Error 0.066 0.097 0.088
N 60 30 30
School teaches all 5 core integrated subjects
Mean 0.12 0.03 0.2
Standard Error 0.039 0.034 0.07
N 60 30 30
Share of integrated teachers that are paid
Mean 0.18 0.03 0.33
Standard Error 0.047 0.033 0.088
N 60 30 30
Integrated teaching per week at P2 level (hours)
Mean 2.98 2.2 3.81
Standard Error 0.378 0.34 0.693
N 58 30 30
Does this school have boarders in P2?
Mean 0.35 0.43 0.27
Standard Error 0.062 0.091 0.082
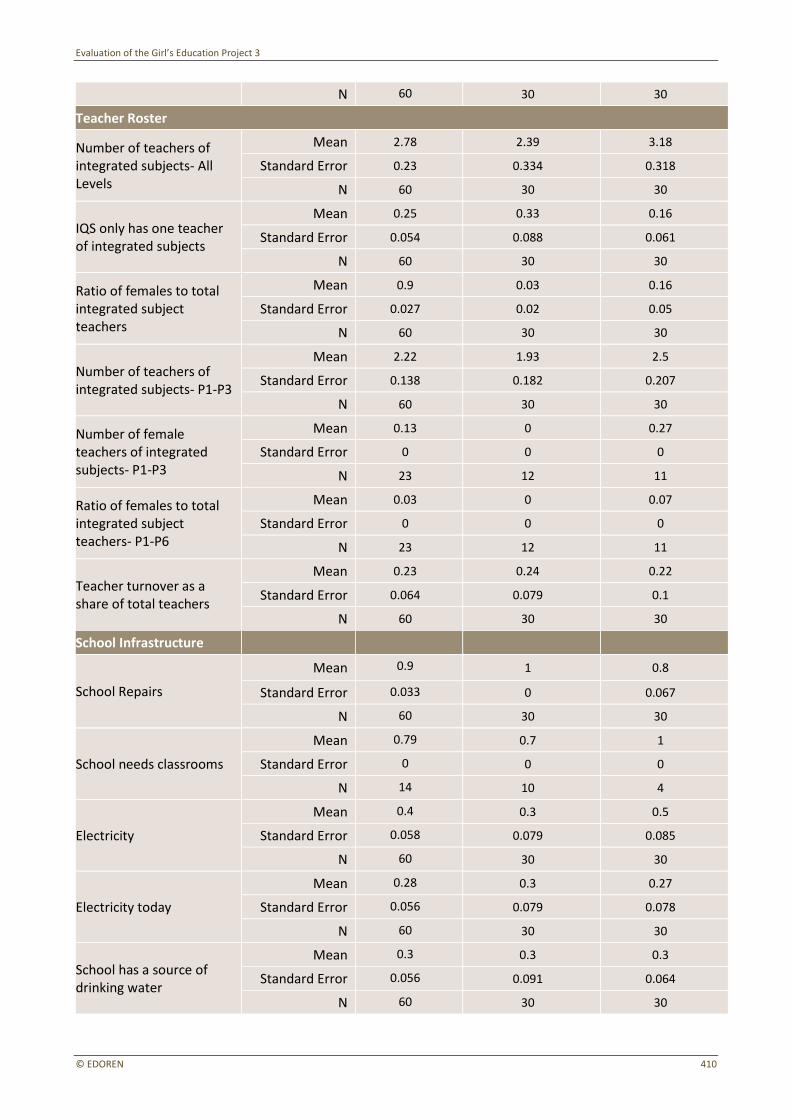
Evaluation of the Girl’s Education Project 3
© EDOREN 410
N 60 30 30
Teacher Roster
Number of teachers of integrated subjects- All Levels
Mean 2.78 2.39 3.18
Standard Error 0.23 0.334 0.318
N 60 30 30
IQS only has one teacher of integrated subjects
Mean 0.25 0.33 0.16
Standard Error 0.054 0.088 0.061
N 60 30 30
Ratio of females to total integrated subject teachers
Mean 0.9 0.03 0.16
Standard Error 0.027 0.02 0.05
N 60 30 30
Number of teachers of integrated subjects- P1-P3
Mean 2.22 1.93 2.5
Standard Error 0.138 0.182 0.207
N 60 30 30
Number of female teachers of integrated subjects- P1-P3
Mean 0.13 0 0.27
Standard Error 0 0 0
N 23 12 11
Ratio of females to total integrated subject teachers- P1-P6
Mean 0.03 0 0.07
Standard Error 0 0 0
N 23 12 11
Teacher turnover as a share of total teachers
Mean 0.23 0.24 0.22
Standard Error 0.064 0.079 0.1
N 60 30 30
School Infrastructure
School Repairs
Mean 0.9 1 0.8
Standard Error 0.033 0 0.067
N 60 30 30
School needs classrooms
Mean 0.79 0.7 1
Standard Error 0 0 0
N 14 10 4
Electricity
Mean 0.4 0.3 0.5
Standard Error 0.058 0.079 0.085
N 60 30 30
Electricity today
Mean 0.28 0.3 0.27
Standard Error 0.056 0.079 0.078
N 60 30 30
School has a source of drinking water
Mean 0.3 0.3 0.3
Standard Error 0.056 0.091 0.064
N 60 30 30
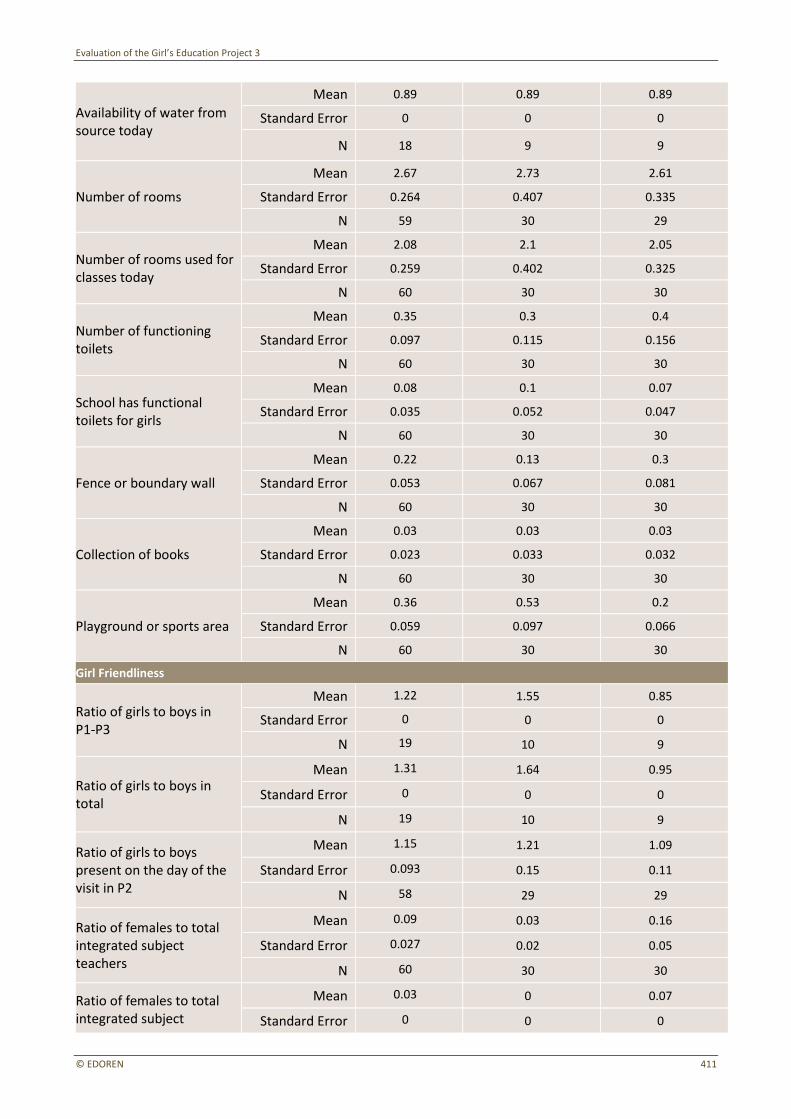
Evaluation of the Girl’s Education Project 3
© EDOREN 411
Availability of water from source today
Mean 0.89 0.89 0.89
Standard Error 0 0 0
N 18 9 9
Number of rooms
Mean 2.67 2.73 2.61
Standard Error 0.264 0.407 0.335
N 59 30 29
Number of rooms used for classes today
Mean 2.08 2.1 2.05
Standard Error 0.259 0.402 0.325
N 60 30 30
Number of functioning toilets
Mean 0.35 0.3 0.4
Standard Error 0.097 0.115 0.156
N 60 30 30
School has functional toilets for girls
Mean 0.08 0.1 0.07
Standard Error 0.035 0.052 0.047
N 60 30 30
Fence or boundary wall
Mean 0.22 0.13 0.3
Standard Error 0.053 0.067 0.081
N 60 30 30
Collection of books
Mean 0.03 0.03 0.03
Standard Error 0.023 0.033 0.032
N 60 30 30
Playground or sports area
Mean 0.36 0.53 0.2
Standard Error 0.059 0.097 0.066
N 60 30 30
Girl Friendliness
Ratio of girls to boys in P1-P3
Mean 1.22 1.55 0.85
Standard Error 0 0 0
N 19 10 9
Ratio of girls to boys in total
Mean 1.31 1.64 0.95
Standard Error 0 0 0
N 19 10 9
Ratio of girls to boys present on the day of the visit in P2
Mean 1.15 1.21 1.09
Standard Error 0.093 0.15 0.11
N 58 29 29
Ratio of females to total integrated subject teachers
Mean 0.09 0.03 0.16
Standard Error 0.027 0.02 0.05
N 60 30 30
Ratio of females to total integrated subject
Mean 0.03 0 0.07
Standard Error 0 0 0
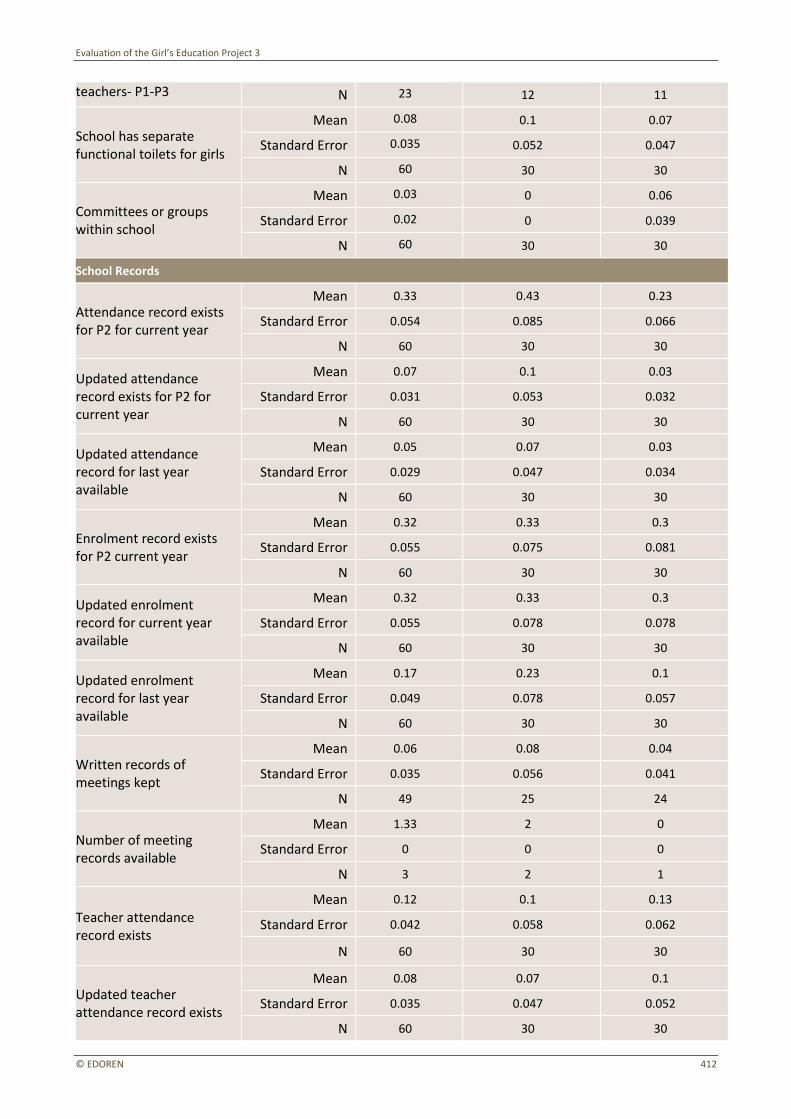
Evaluation of the Girl’s Education Project 3
© EDOREN 412
teachers- P1-P3 N 23 12 11
School has separate functional toilets for girls
Mean 0.08 0.1 0.07
Standard Error 0.035 0.052 0.047
N 60 30 30
Committees or groups within school
Mean 0.03 0 0.06
Standard Error 0.02 0 0.039
N 60 30 30
School Records
Attendance record exists for P2 for current year
Mean 0.33 0.43 0.23
Standard Error 0.054 0.085 0.066
N 60 30 30
Updated attendance record exists for P2 for current year
Mean 0.07 0.1 0.03
Standard Error 0.031 0.053 0.032
N 60 30 30
Updated attendance record for last year available
Mean 0.05 0.07 0.03
Standard Error 0.029 0.047 0.034
N 60 30 30
Enrolment record exists for P2 current year
Mean 0.32 0.33 0.3
Standard Error 0.055 0.075 0.081
N 60 30 30
Updated enrolment record for current year available
Mean 0.32 0.33 0.3
Standard Error 0.055 0.078 0.078
N 60 30 30
Updated enrolment record for last year available
Mean 0.17 0.23 0.1
Standard Error 0.049 0.078 0.057
N 60 30 30
Written records of meetings kept
Mean 0.06 0.08 0.04
Standard Error 0.035 0.056 0.041
N 49 25 24
Number of meeting records available
Mean 1.33 2 0
Standard Error 0 0 0
N 3 2 1
Teacher attendance record exists
Mean 0.12 0.1 0.13
Standard Error 0.042 0.058 0.062
N 60 30 30
Updated teacher attendance record exists
Mean 0.08 0.07 0.1
Standard Error 0.035 0.047 0.052
N 60 30 30
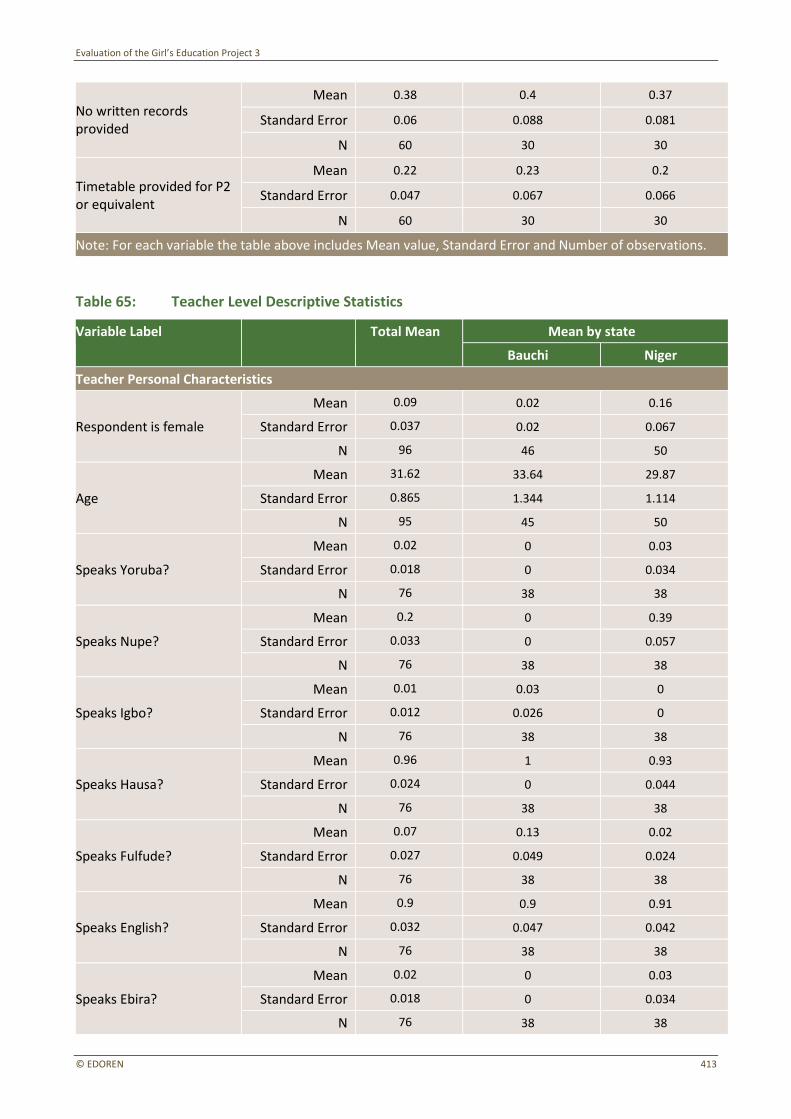
Evaluation of the Girl’s Education Project 3
© EDOREN 413
No written records provided
Mean 0.38 0.4 0.37
Standard Error 0.06 0.088 0.081
N 60 30 30
Timetable provided for P2 or equivalent
Mean 0.22 0.23 0.2
Standard Error 0.047 0.067 0.066
N 60 30 30
Note: For each variable the table above includes Mean value, Standard Error and Number of observations.
Table 65: Teacher Level Descriptive Statistics
Variable Label Total Mean Mean by state
Bauchi Niger
Teacher Personal Characteristics
Respondent is female
Mean 0.09 0.02 0.16
Standard Error 0.037 0.02 0.067
N 96 46 50
Age
Mean 31.62 33.64 29.87
Standard Error 0.865 1.344 1.114
N 95 45 50
Speaks Yoruba?
Mean 0.02 0 0.03
Standard Error 0.018 0 0.034
N 76 38 38
Speaks Nupe?
Mean 0.2 0 0.39
Standard Error 0.033 0 0.057
N 76 38 38
Speaks Igbo?
Mean 0.01 0.03 0
Standard Error 0.012 0.026 0
N 76 38 38
Speaks Hausa?
Mean 0.96 1 0.93
Standard Error 0.024 0 0.044
N 76 38 38
Speaks Fulfude?
Mean 0.07 0.13 0.02
Standard Error 0.027 0.049 0.024
N 76 38 38
Speaks English?
Mean 0.9 0.9 0.91
Standard Error 0.032 0.047 0.042
N 76 38 38
Speaks Ebira?
Mean 0.02 0 0.03
Standard Error 0.018 0 0.034
N 76 38 38

Evaluation of the Girl’s Education Project 3
© EDOREN 414
Speaks Arabic?
Mean 0.17 0.21 0.13
Standard Error 0.048 0.079 0.055
N 76 38 38
Professional Characteristics
Teacher is currently teaching P1-P3 equivalent
Mean 1 1 1
Standard Error 0 0 0
N 76 38 38
Teacher is currently teaching P3-P6 or equivalent level
Mean 0.12 0.15 0.09
Standard Error 0.043 0.069 0.054
N 76 38 38
Teacher is currently teaching at upper and lower levels
Mean 0.12 0.15 0.09
Standard Error 0.043 0.069 0.054
N 76 38 38
Does the teacher have an NCE?
Mean 0.35 0.51 0.2
Standard Error 0.042 0.07 0.052
N 96 46 50
Subjects Taught-Mathematics
Mean 0.65 0.65 0.65
Standard Error 0.042 0.064 0.056
N 76 38 38
Subjects Taught- English
Mean 0.71 0.69 0.74
Standard Error 0.049 0.064 0.073
N 76 38 38
Subjects Taught- Hausa
Mean 0.32 0.36 0.28
Standard Error 0.051 0.057 0.082
N 76 38 38
Does the teacher have professional educational qualifications?
Mean 0.45 0.59 0.33
Standard Error 0.043 0.068 0.056
N 96 46 50
Does the teacher have Grade 2 or equivalent qualification?
Mean 0.08 0.06 0.09
Standard Error 0.033 0.044 0.049
N 96 46 50
Highest academic qualification of the teacher is primary education
Mean 0.12 0.15 0.09
Standard Error 0.032 0.048 0.044
N 96 46 50
Highest academic qualification of the teacher is JSS
Mean 0.04 0.05 0.04
Standard Error 0.02 0.036 0.027
N 96 46 50
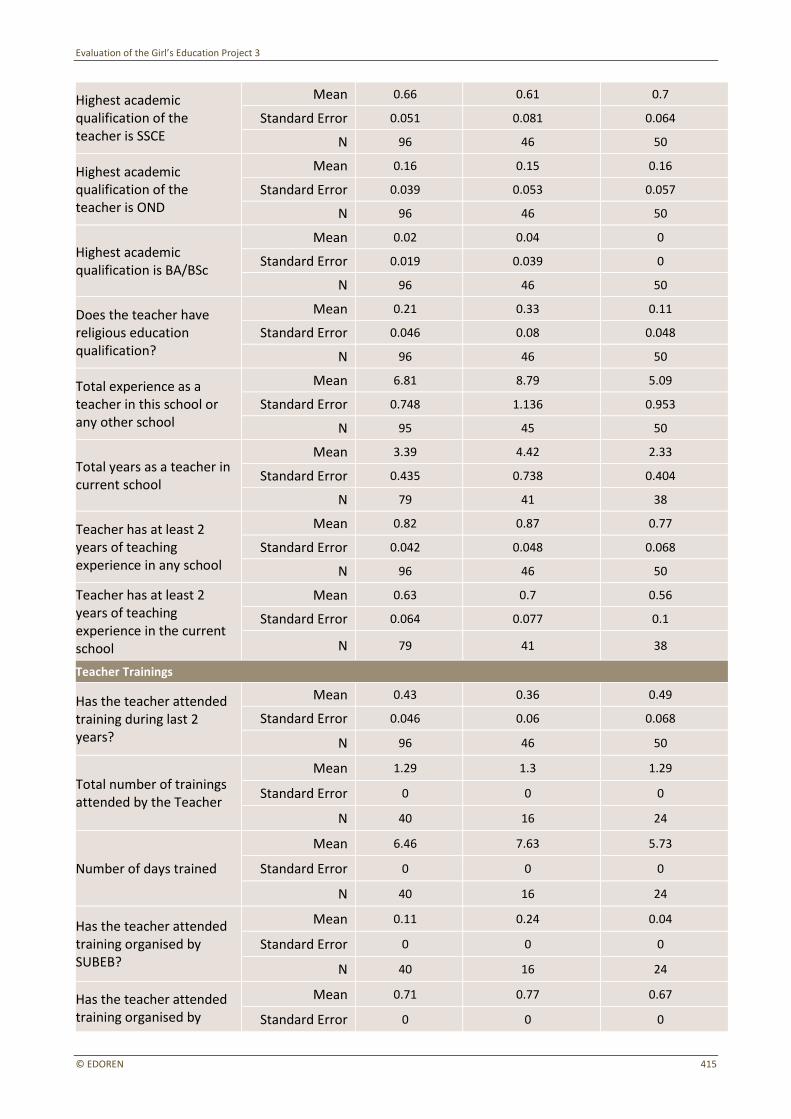
Evaluation of the Girl’s Education Project 3
© EDOREN 415
Highest academic qualification of the teacher is SSCE
Mean 0.66 0.61 0.7
Standard Error 0.051 0.081 0.064
N 96 46 50
Highest academic qualification of the teacher is OND
Mean 0.16 0.15 0.16
Standard Error 0.039 0.053 0.057
N 96 46 50
Highest academic qualification is BA/BSc
Mean 0.02 0.04 0
Standard Error 0.019 0.039 0
N 96 46 50
Does the teacher have religious education qualification?
Mean 0.21 0.33 0.11
Standard Error 0.046 0.08 0.048
N 96 46 50
Total experience as a teacher in this school or any other school
Mean 6.81 8.79 5.09
Standard Error 0.748 1.136 0.953
N 95 45 50
Total years as a teacher in current school
Mean 3.39 4.42 2.33
Standard Error 0.435 0.738 0.404
N 79 41 38
Teacher has at least 2 years of teaching experience in any school
Mean 0.82 0.87 0.77
Standard Error 0.042 0.048 0.068
N 96 46 50
Teacher has at least 2 years of teaching experience in the current school
Mean 0.63 0.7 0.56
Standard Error 0.064 0.077 0.1
N 79 41 38
Teacher Trainings
Has the teacher attended training during last 2 years?
Mean 0.43 0.36 0.49
Standard Error 0.046 0.06 0.068
N 96 46 50
Total number of trainings attended by the Teacher
Mean 1.29 1.3 1.29
Standard Error 0 0 0
N 40 16 24
Number of days trained
Mean 6.46 7.63 5.73
Standard Error 0 0 0
N 40 16 24
Has the teacher attended training organised by SUBEB?
Mean 0.11 0.24 0.04
Standard Error 0 0 0
N 40 16 24
Has the teacher attended training organised by
Mean 0.71 0.77 0.67
Standard Error 0 0 0
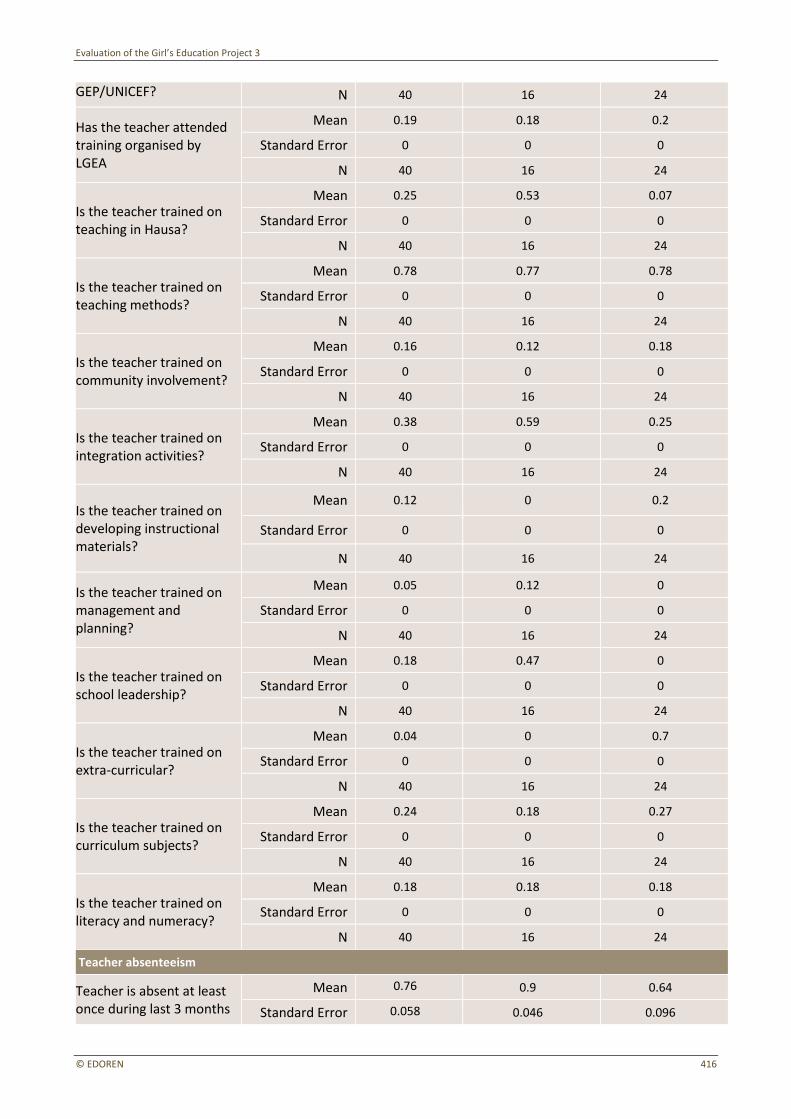
Evaluation of the Girl’s Education Project 3
© EDOREN 416
GEP/UNICEF? N 40 16 24
Has the teacher attended training organised by LGEA
Mean 0.19 0.18 0.2
Standard Error 0 0 0
N 40 16 24
Is the teacher trained on teaching in Hausa?
Mean 0.25 0.53 0.07
Standard Error 0 0 0
N 40 16 24
Is the teacher trained on teaching methods?
Mean 0.78 0.77 0.78
Standard Error 0 0 0
N 40 16 24
Is the teacher trained on community involvement?
Mean 0.16 0.12 0.18
Standard Error 0 0 0
N 40 16 24
Is the teacher trained on integration activities?
Mean 0.38 0.59 0.25
Standard Error 0 0 0
N 40 16 24
Is the teacher trained on developing instructional materials?
Mean 0.12 0 0.2
Standard Error 0 0 0
N 40 16 24
Is the teacher trained on management and planning?
Mean 0.05 0.12 0
Standard Error 0 0 0
N 40 16 24
Is the teacher trained on school leadership?
Mean 0.18 0.47 0
Standard Error 0 0 0
N 40 16 24
Is the teacher trained on extra-curricular?
Mean 0.04 0 0.7
Standard Error 0 0 0
N 40 16 24
Is the teacher trained on curriculum subjects?
Mean 0.24 0.18 0.27
Standard Error 0 0 0
N 40 16 24
Is the teacher trained on literacy and numeracy?
Mean 0.18 0.18 0.18
Standard Error 0 0 0
N 40 16 24
Teacher absenteeism
Teacher is absent at least once during last 3 months
Mean 0.76 0.9 0.64
Standard Error 0.058 0.046 0.096
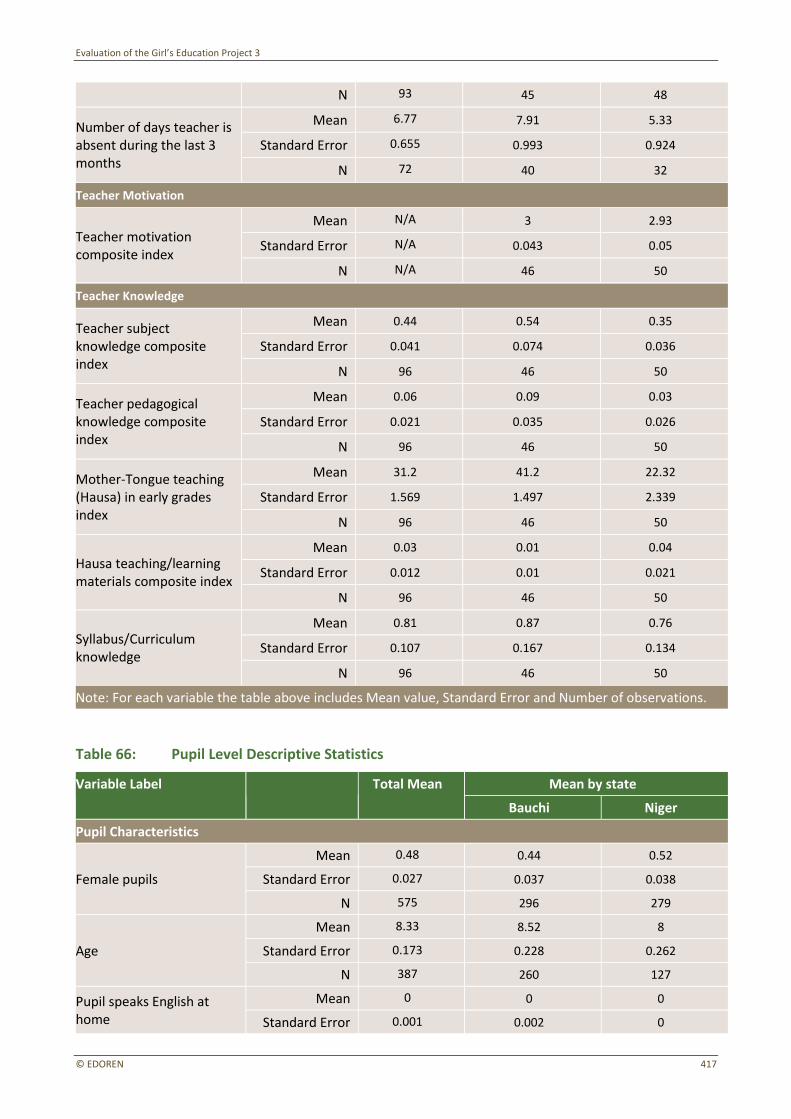
Evaluation of the Girl’s Education Project 3
© EDOREN 417
N 93 45 48
Number of days teacher is absent during the last 3 months
Mean 6.77 7.91 5.33
Standard Error 0.655 0.993 0.924
N 72 40 32
Teacher Motivation
Teacher motivation composite index
Mean N/A 3 2.93
Standard Error N/A 0.043 0.05
N N/A 46 50
Teacher Knowledge
Teacher subject knowledge composite index
Mean 0.44 0.54 0.35
Standard Error 0.041 0.074 0.036
N 96 46 50
Teacher pedagogical knowledge composite index
Mean 0.06 0.09 0.03
Standard Error 0.021 0.035 0.026
N 96 46 50
Mother-Tongue teaching (Hausa) in early grades index
Mean 31.2 41.2 22.32
Standard Error 1.569 1.497 2.339
N 96 46 50
Hausa teaching/learning materials composite index
Mean 0.03 0.01 0.04
Standard Error 0.012 0.01 0.021
N 96 46 50
Syllabus/Curriculum knowledge
Mean 0.81 0.87 0.76
Standard Error 0.107 0.167 0.134
N 96 46 50
Note: For each variable the table above includes Mean value, Standard Error and Number of observations.
Table 66: Pupil Level Descriptive Statistics
Variable Label Total Mean Mean by state
Bauchi Niger
Pupil Characteristics
Female pupils
Mean 0.48 0.44 0.52
Standard Error 0.027 0.037 0.038
N 575 296 279
Age
Mean 8.33 8.52 8
Standard Error 0.173 0.228 0.262
N 387 260 127
Pupil speaks English at home
Mean 0 0 0
Standard Error 0.001 0.002 0
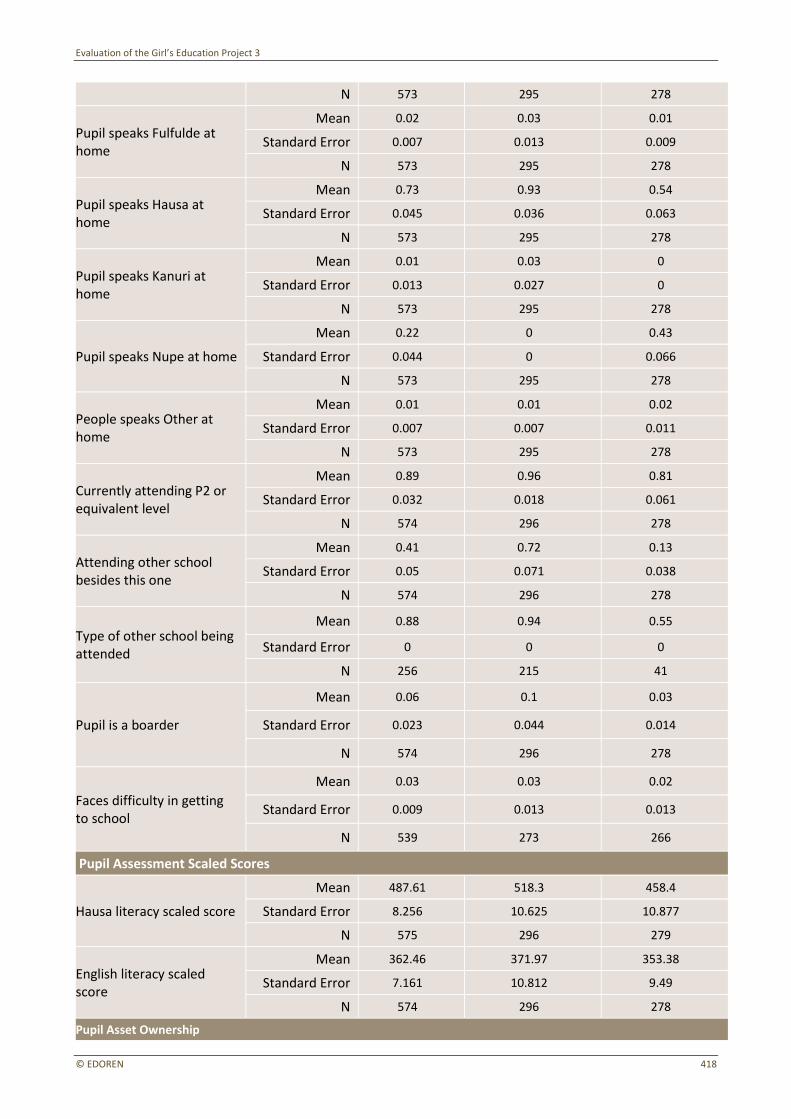
Evaluation of the Girl’s Education Project 3
© EDOREN 418
N 573 295 278
Pupil speaks Fulfulde at home
Mean 0.02 0.03 0.01
Standard Error 0.007 0.013 0.009
N 573 295 278
Pupil speaks Hausa at home
Mean 0.73 0.93 0.54
Standard Error 0.045 0.036 0.063
N 573 295 278
Pupil speaks Kanuri at home
Mean 0.01 0.03 0
Standard Error 0.013 0.027 0
N 573 295 278
Pupil speaks Nupe at home
Mean 0.22 0 0.43
Standard Error 0.044 0 0.066
N 573 295 278
People speaks Other at home
Mean 0.01 0.01 0.02
Standard Error 0.007 0.007 0.011
N 573 295 278
Currently attending P2 or equivalent level
Mean 0.89 0.96 0.81
Standard Error 0.032 0.018 0.061
N 574 296 278
Attending other school besides this one
Mean 0.41 0.72 0.13
Standard Error 0.05 0.071 0.038
N 574 296 278
Type of other school being attended
Mean 0.88 0.94 0.55
Standard Error 0 0 0
N 256 215 41
Pupil is a boarder
Mean 0.06 0.1 0.03
Standard Error 0.023 0.044 0.014
N 574 296 278
Faces difficulty in getting to school
Mean 0.03 0.03 0.02
Standard Error 0.009 0.013 0.013
N 539 273 266
Pupil Assessment Scaled Scores
Hausa literacy scaled score
Mean 487.61 518.3 458.4
Standard Error 8.256 10.625 10.877
N 575 296 279
English literacy scaled score
Mean 362.46 371.97 353.38
Standard Error 7.161 10.812 9.49
N 574 296 278
Pupil Asset Ownership

Evaluation of the Girl’s Education Project 3
© EDOREN 419
Has a car
Mean 0.24 0.29 0.19
Standard Error 0.029 0.038 0.039
N 574 296 278
Has a fridge
Mean 0.25 0.25 0.25
Standard Error 0.034 0.04 0.055
N 574 296 278
Has a radio
Mean 0.78 0.89 0.68
Standard Error 0.042 0.027 0.06
N 574 296 278
Has a mattress/bed
Mean 0.94 0.99 0.88
Standard Error 0.029 0.004 0.05
N 574 296 278
Has a TV
Mean 0.57 0.53 0.61
Standard Error 0.054 0.067 0.083
N 574 296 278
Has a motorcycle
Mean 0.74 0.72 0.75
Standard Error 0.024 0.03 0.04
N 574 296 278
Has a chair
Mean 0.87 0.89 0.85
Standard Error 0.032 0.027 0.056
N 574 296 278
Has a mat
Mean 0.98 1 0.96
Standard Error 0.01 0.002 0.018
N 574 296 278
Has a sewing machine
Mean 0.37 0.42 0.32
Standard Error 0.034 0.051 0.039
N 574 296 278
Has an air conditioner
Mean 0.03 0.02 0.03
Standard Error 0.008 0.011 0.012
N 574 296 278
Has a fan
Mean 0.5 0.4 0.6
Standard Error 0.052 0.059 0.078
N 574 296 278
Has a generator
Mean 0.38 0.32 0.44
Standard Error 0.034 0.036 0.056
N 572 296 276
Has a stove
Mean 0.39 0.41 0.38
Standard Error 0.037 0.057 0.047
N 573 296 278
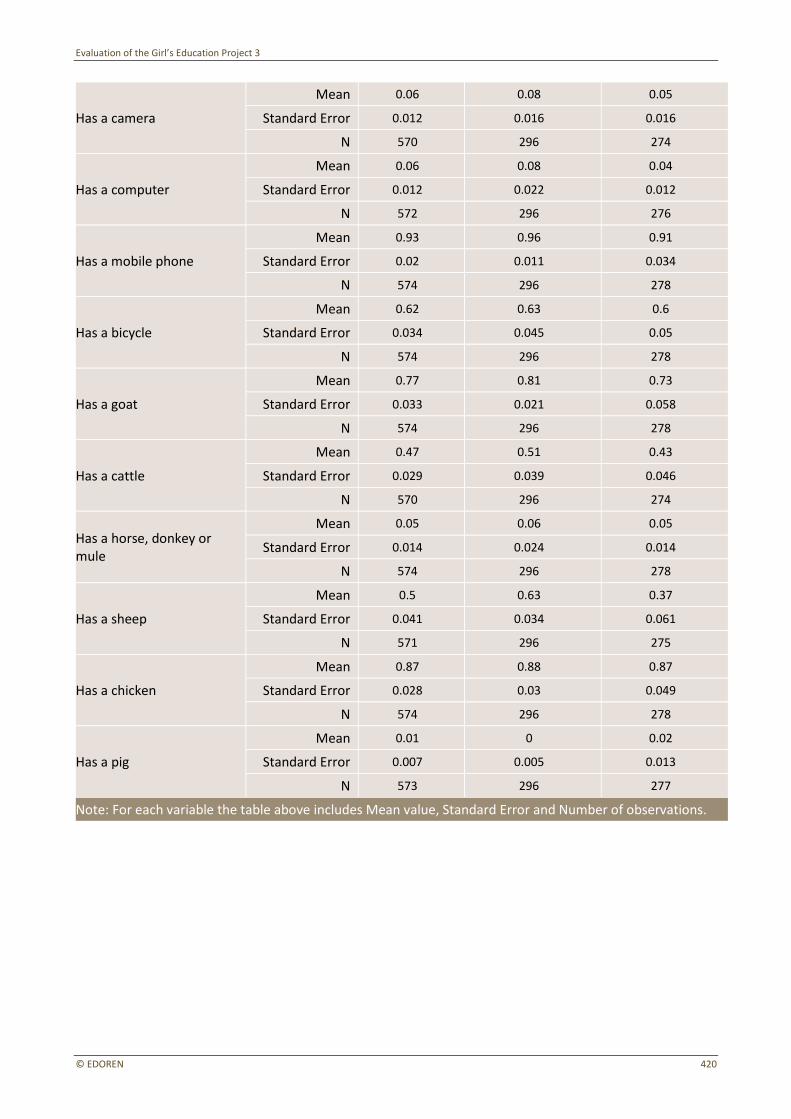
Evaluation of the Girl’s Education Project 3
© EDOREN 420
Has a camera
Mean 0.06 0.08 0.05
Standard Error 0.012 0.016 0.016
N 570 296 274
Has a computer
Mean 0.06 0.08 0.04
Standard Error 0.012 0.022 0.012
N 572 296 276
Has a mobile phone
Mean 0.93 0.96 0.91
Standard Error 0.02 0.011 0.034
N 574 296 278
Has a bicycle
Mean 0.62 0.63 0.6
Standard Error 0.034 0.045 0.05
N 574 296 278
Has a goat
Mean 0.77 0.81 0.73
Standard Error 0.033 0.021 0.058
N 574 296 278
Has a cattle
Mean 0.47 0.51 0.43
Standard Error 0.029 0.039 0.046
N 570 296 274
Has a horse, donkey or mule
Mean 0.05 0.06 0.05
Standard Error 0.014 0.024 0.014
N 574 296 278
Has a sheep
Mean 0.5 0.63 0.37
Standard Error 0.041 0.034 0.061
N 571 296 275
Has a chicken
Mean 0.87 0.88 0.87
Standard Error 0.028 0.03 0.049
N 574 296 278
Has a pig
Mean 0.01 0 0.02
Standard Error 0.007 0.005 0.013
N 573 296 277
Note: For each variable the table above includes Mean value, Standard Error and Number of observations.
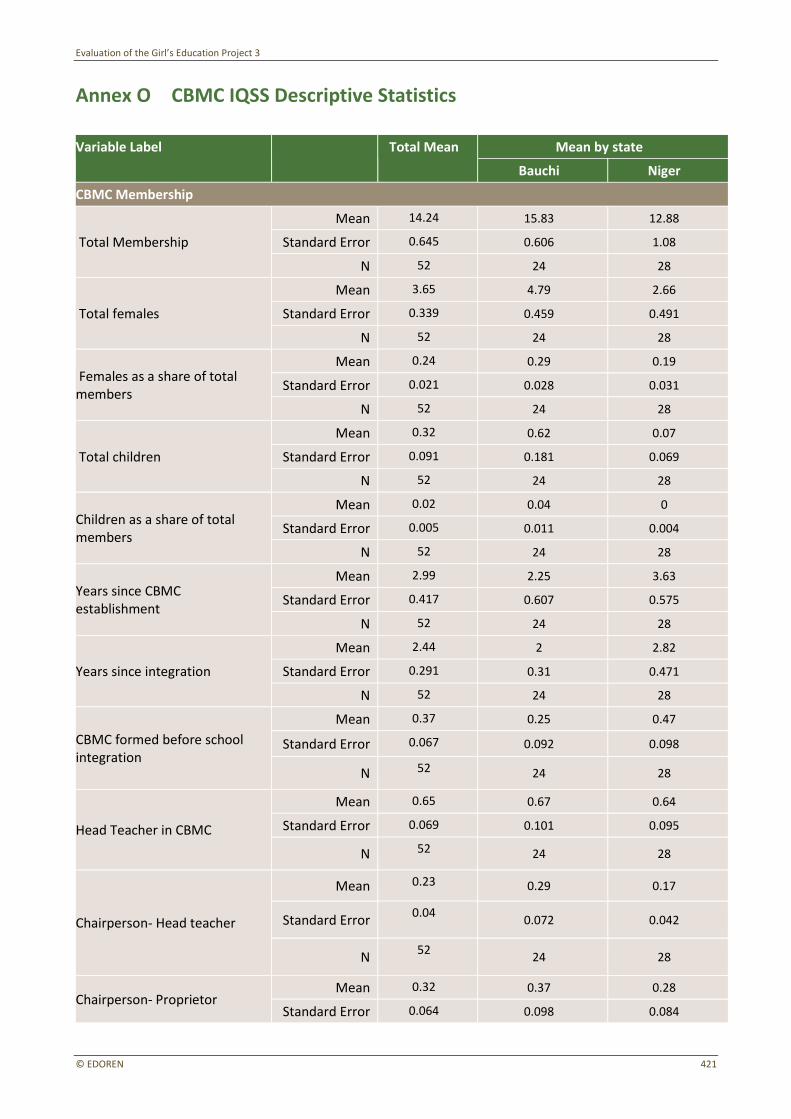
Evaluation of the Girl’s Education Project 3
© EDOREN 421
Annex O CBMC IQSS Descriptive Statistics
Variable Label Total Mean Mean by state
Bauchi Niger
CBMC Membership
Total Membership
Mean 14.24 15.83 12.88
Standard Error 0.645 0.606 1.08
N 52 24 28
Total females
Mean 3.65 4.79 2.66
Standard Error 0.339 0.459 0.491
N 52 24 28
Females as a share of total members
Mean 0.24 0.29 0.19
Standard Error 0.021 0.028 0.031
N 52 24 28
Total children
Mean 0.32 0.62 0.07
Standard Error 0.091 0.181 0.069
N 52 24 28
Children as a share of total members
Mean 0.02 0.04 0
Standard Error 0.005 0.011 0.004
N 52 24 28
Years since CBMC establishment
Mean 2.99 2.25 3.63
Standard Error 0.417 0.607 0.575
N 52 24 28
Years since integration
Mean 2.44 2 2.82
Standard Error 0.291 0.31 0.471
N 52 24 28
CBMC formed before school integration
Mean 0.37 0.25 0.47
Standard Error 0.067 0.092 0.098
N 52 24 28
Head Teacher in CBMC
Mean 0.65 0.67 0.64
Standard Error 0.069 0.101 0.095
N 52 24 28
Chairperson- Head teacher
Mean 0.23 0.29 0.17
Standard Error 0.04
0.072 0.042
N 52
24 28
Chairperson- Proprietor Mean 0.32 0.37 0.28
Standard Error 0.064 0.098 0.084
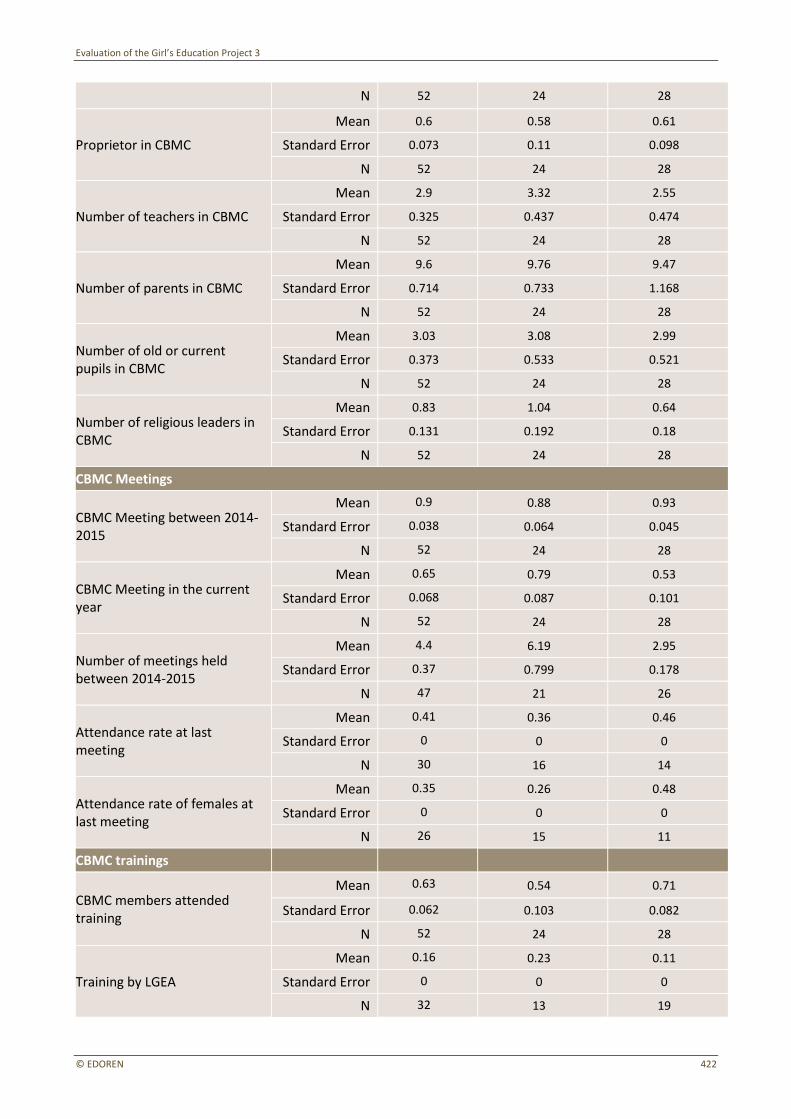
Evaluation of the Girl’s Education Project 3
© EDOREN 422
N 52 24 28
Proprietor in CBMC
Mean 0.6 0.58 0.61
Standard Error 0.073 0.11 0.098
N 52 24 28
Number of teachers in CBMC
Mean 2.9 3.32 2.55
Standard Error 0.325 0.437 0.474
N 52 24 28
Number of parents in CBMC
Mean 9.6 9.76 9.47
Standard Error 0.714 0.733 1.168
N 52 24 28
Number of old or current pupils in CBMC
Mean 3.03 3.08 2.99
Standard Error 0.373 0.533 0.521
N 52 24 28
Number of religious leaders in CBMC
Mean 0.83 1.04 0.64
Standard Error 0.131 0.192 0.18
N 52 24 28
CBMC Meetings
CBMC Meeting between 2014-2015
Mean 0.9 0.88 0.93
Standard Error 0.038 0.064 0.045
N 52 24 28
CBMC Meeting in the current year
Mean 0.65 0.79 0.53
Standard Error 0.068 0.087 0.101
N 52 24 28
Number of meetings held between 2014-2015
Mean 4.4 6.19 2.95
Standard Error 0.37 0.799 0.178
N 47 21 26
Attendance rate at last meeting
Mean 0.41 0.36 0.46
Standard Error 0 0 0
N 30 16 14
Attendance rate of females at last meeting
Mean 0.35 0.26 0.48
Standard Error 0 0 0
N 26 15 11
CBMC trainings
CBMC members attended training
Mean 0.63 0.54 0.71
Standard Error 0.062 0.103 0.082
N 52 24 28
Training by LGEA
Mean 0.16 0.23 0.11
Standard Error 0 0 0
N 32 13 19
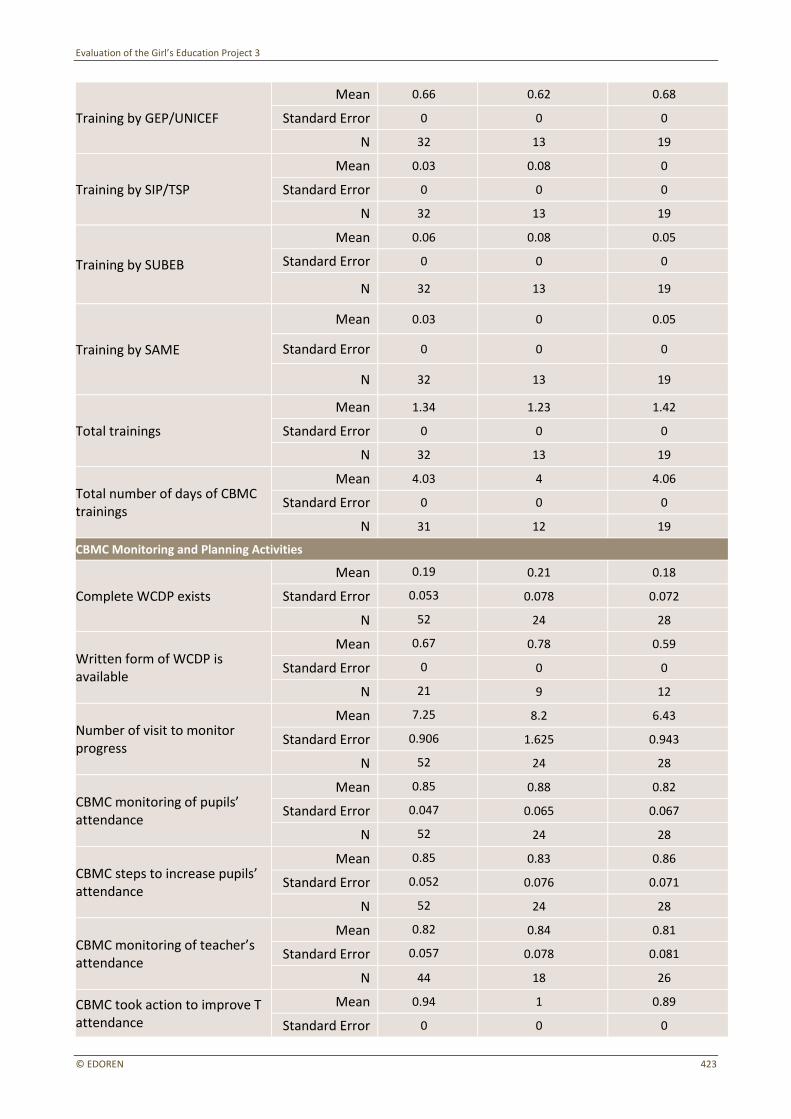
Evaluation of the Girl’s Education Project 3
© EDOREN 423
Training by GEP/UNICEF
Mean 0.66 0.62 0.68
Standard Error 0 0 0
N 32 13 19
Training by SIP/TSP
Mean 0.03 0.08 0
Standard Error 0 0 0
N 32 13 19
Training by SUBEB
Mean 0.06 0.08 0.05
Standard Error 0 0 0
N 32 13 19
Training by SAME
Mean 0.03 0 0.05
Standard Error 0 0 0
N 32 13 19
Total trainings
Mean 1.34 1.23 1.42
Standard Error 0 0 0
N 32 13 19
Total number of days of CBMC trainings
Mean 4.03 4 4.06
Standard Error 0 0 0
N 31 12 19
CBMC Monitoring and Planning Activities
Complete WCDP exists
Mean 0.19 0.21 0.18
Standard Error 0.053 0.078 0.072
N 52 24 28
Written form of WCDP is available
Mean 0.67 0.78 0.59
Standard Error 0 0 0
N 21 9 12
Number of visit to monitor progress
Mean 7.25 8.2 6.43
Standard Error 0.906 1.625 0.943
N 52 24 28
CBMC monitoring of pupils’ attendance
Mean 0.85 0.88 0.82
Standard Error 0.047 0.065 0.067
N 52 24 28
CBMC steps to increase pupils’ attendance
Mean 0.85 0.83 0.86
Standard Error 0.052 0.076 0.071
N 52 24 28
CBMC monitoring of teacher’s attendance
Mean 0.82 0.84 0.81
Standard Error 0.057 0.078 0.081
N 44 18 26
CBMC took action to improve T attendance
Mean 0.94 1 0.89
Standard Error 0 0 0
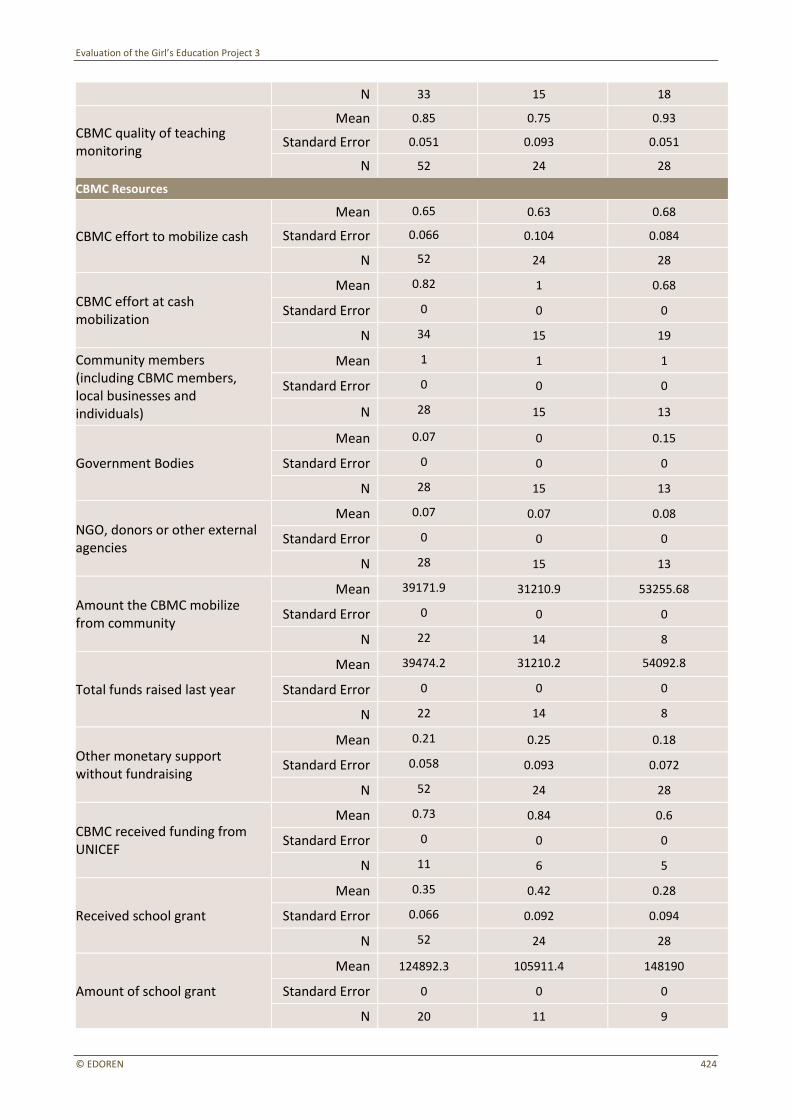
Evaluation of the Girl’s Education Project 3
© EDOREN 424
N 33 15 18
CBMC quality of teaching monitoring
Mean 0.85 0.75 0.93
Standard Error 0.051 0.093 0.051
N 52 24 28
CBMC Resources
CBMC effort to mobilize cash
Mean 0.65 0.63 0.68
Standard Error 0.066 0.104 0.084
N 52 24 28
CBMC effort at cash mobilization
Mean 0.82 1 0.68
Standard Error 0 0 0
N 34 15 19
Community members (including CBMC members, local businesses and individuals)
Mean 1 1 1
Standard Error 0 0 0
N 28 15 13
Government Bodies
Mean 0.07 0 0.15
Standard Error 0 0 0
N 28 15 13
NGO, donors or other external agencies
Mean 0.07 0.07 0.08
Standard Error 0 0 0
N 28 15 13
Amount the CBMC mobilize from community
Mean 39171.9 31210.9 53255.68
Standard Error 0 0 0
N 22 14 8
Total funds raised last year
Mean 39474.2 31210.2 54092.8
Standard Error 0 0 0
N 22 14 8
Other monetary support without fundraising
Mean 0.21 0.25 0.18
Standard Error 0.058 0.093 0.072
N 52 24 28
CBMC received funding from UNICEF
Mean 0.73 0.84 0.6
Standard Error 0 0 0
N 11 6 5
Received school grant
Mean 0.35 0.42 0.28
Standard Error 0.066 0.092 0.094
N 52 24 28
Amount of school grant
Mean 124892.3 105911.4 148190
Standard Error 0 0 0
N 20 11 9

Evaluation of the Girl’s Education Project 3
© EDOREN 425
Total funding available to CBMC
Mean 112258.5 94258.66 135938.1
Standard Error 0 0 0
N 30 17 13
Share of total funds invested
Mean 85.68 90.93 78.19
Standard Error 0 0 0
N 29 17 12
Utilization of any non-cash resource
Mean 0.42 0.46 0.39
Standard Error 0.069 0.1 0.094
N 52 24 28
CBMC Financial Management
Use of cash book
Mean 0.27 0.38 0.18
Standard Error 0.062 0.099 0.073
N 52 24 28
Cash flow is recorded in cash book
Mean 0.63 0.57 0.75
Standard Error 0 0 0
N 11 7 4
Use a bank account to store the funds received
Mean 0.69 0.75 0.65
Standard Error 0.064 0.092 0.083
N 52 24 28
Account in school’s name
Mean 0.69 0.89 0.5
Standard Error 0.079 0.078 0.119
N 36 18 18
Account is in CBMC’s name
Mean 0.28 0.06 0.5
Standard Error 0.074 0.055 0.119
N 36 18 18
Evidence of bank transaction available
Mean 0.53 0.63 0.43
Standard Error 0.144 0.186 0.186
N 15 8 7
CBMC Community Support
Community members (including CBMC members, local businesses, and individuals)
Mean 1 1 1
Standard Error 0 0 0
N 28
15 13
Amount the CBMC mobilize from community
Mean 39171.9 31210.19 53255.68
Standard Error 13846.3 10168.79 32507.92
N 22 14 8
Proportion of total funds raised from community
Mean 98.41 100 95.81
Standard Error 1.585 0 3.838
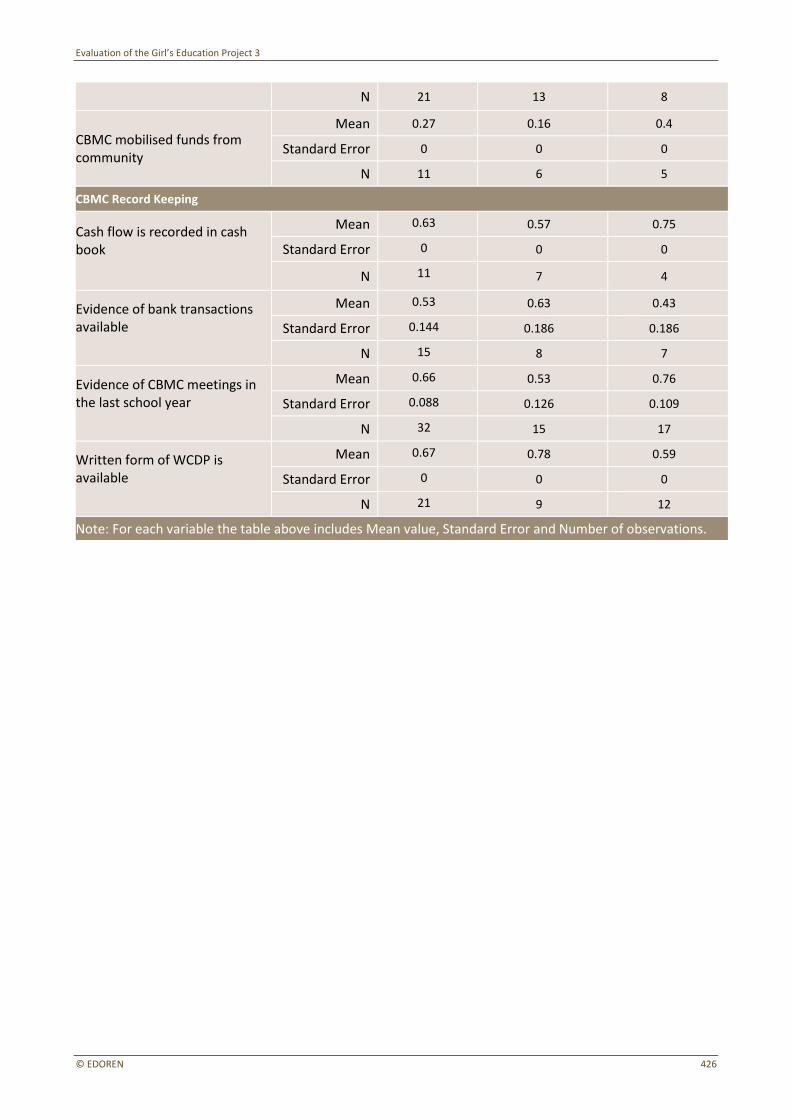
Evaluation of the Girl’s Education Project 3
© EDOREN 426
N 21 13 8
CBMC mobilised funds from community
Mean 0.27 0.16 0.4
Standard Error 0 0 0
N 11 6 5
CBMC Record Keeping
Cash flow is recorded in cash book
Mean 0.63 0.57 0.75
Standard Error 0 0 0
N 11 7 4
Evidence of bank transactions available
Mean 0.53 0.63 0.43
Standard Error 0.144 0.186 0.186
N 15 8 7
Evidence of CBMC meetings in the last school year
Mean 0.66 0.53 0.76
Standard Error 0.088 0.126 0.109
N 32 15 17
Written form of WCDP is available
Mean 0.67 0.78 0.59
Standard Error 0 0 0
N 21 9 12
Note: For each variable the table above includes Mean value, Standard Error and Number of observations.