BASELINE SURVEY REPORT - United States Agency for …pdf.usaid.gov/pdf_docs/PNADP502.pdf ·...
57
LIVELIHOOD EXPANSION AND ASSET DEVELOPMENT (LEAD) PROGRAM WITH FUNDING FROM USAID AND THE GOVERNMENT OF SIERRA LEONE BASELINE SURVEY REPORT October 2006 – September 2009 Submission Date: 31 May 2008 Contacts: CARE Sierra Leone (Freetown) Brian Larson, Country Director Ekramuel Kabir, Chief of Party, LINKS Program 35 & 35A Wilkinson Road P.O. Box 744 Freetown, Sierra Leone Telephone: 232-22-234227/8 FAX : 232-22-234280 E-Mail : [email protected] , [email protected]
Transcript of BASELINE SURVEY REPORT - United States Agency for …pdf.usaid.gov/pdf_docs/PNADP502.pdf ·...

LIVELIHOOD EXPANSION AND ASSET DEVELOPMENT (LEAD) PROGRAM
WITH FUNDING FROM USAID AND THE GOVERNMENT OF SIERRA
LEONE
BASELINE SURVEY REPORT October 2006 – September 2009
Submission Date: 31 May 2008
Contacts: CARE Sierra Leone (Freetown) Brian Larson, Country Director
Ekramuel Kabir, Chief of Party, LINKS Program 35 & 35A Wilkinson Road
P.O. Box 744 Freetown, Sierra Leone
Telephone: 232-22-234227/8 FAX : 232-22-234280
E-Mail : [email protected], [email protected]

TABLE OF CONTENTS List of Tables iii List of Figures iv List of Acronyms v Executive Summary vi 1. INTRODUCTION 1 2. BASELINE AIMS AND OBJECTIVES 1 2.1 Evaluation Methodologies 2 2.1.1 Team Composition 2 2.1.2 Sample Methodology 2 2.1.3 Training of Enumerators 3 2.1.4 Data Collection Methods and Tools Used 3 2.1.5 Analysis 3 2.1.6 Discussion of Limitations 3 3. SURVEY FINDINGS 4 3.1 General Description of the Population and Households Surveyed 4 3.1.1 Description of Household Heads 5 3.1.2 Chronically Ill Persons and Individuals with Physical Disabilities 6 3.2 Access to Relief Assistance 6 3.3 Asset Ownership (Material and Livestock) 7
3.3.1 Material Assets (Domestic and Productive) 7
3.3.2 Livestock Assets 7
3.3.3 Asset Wealth 8
3.4 Access to Potable Water 9
3.4.1 Primary Source of Potable Water 9
3.4.2 Secondary and Tertiary Sources of Potable Water 10
3.4.3 Time Spent in Water Collection 10
3.5 Food Security Situation of Households 11
3.5.1 Months of Inadequate Household Food Provision 11
3.5.2 Household Diet Diversity Score 12
3.6 Households’ Main Source of Income 13
3.7 Agriculture 14
3.7.1 Farmers Field Schools and Use of Improved Agricultural
Production Practices 14
3.7.2 Use of Agricultural Pesticides in Crop Production 15
3.7.3 Post Harvest Losses and Agro-processing 15
i

3.7.4 Measures to Reduce Post Harvest Losses 16
3.7.5 Access to Post-harvest Infrastructure and Agro-
Processing Facilities 17
3.7.6 Utilization of Drying Floors 18
3.7.7 Types of Agro-Processing Facilities 18
3.7.8 Land Use and Agricultural Production 19
3.7.9 Crop Production 19
3.7.10 Farm Income 20
3.7.11 Smallholder Plantation Farming 21
3.7.12 Production of Major Tree (Plantation) Crops 21
3.7.13 Commercial Vegetable Farming 22
3.7.14 Production Commercial Vegetables 22
3.8 Health and Nutrition 23
3.8.1 Child’s Nutritional Status 23
3.8.2 Infant and Child Feeding Practices 27
3.8.3 Child Health 31
3.8.4 Neonatal and Maternal Health 41
4. CONCLUSIONS AND RECOMMENDATIONS 44
4.1 Conclusions 44
4.2 Recommendations 45
ii

List of Tables Table i: Summary of Key LEAD Indicators and Baseline Findings viii
Table 1: Gender Characteristics of Population 4
Table 2: Distribution of Chronically Ill Persons/Physically Disabled by Gender 6
Table 3: Distribution of Household by Type of Relief Assistance and
Source 6
Table 4: Frequency Distribution of Households by Ownership of Material Assets 7
Table 5: Frequency Distribution of Households by Ownership of Livestock 8
Table 6: Average Number of Assets per Household 9
Table 7: Main Sources of Potable Water 10
Table 8: Categories of Food Consumed by Households Within 24 hours Prior
to the Survey 13
Table 9: Distribution of Households by Sources of Income 13
Table 10: Agricultural Activities of Sample Households 14
Table11: Percentage of Households Cultivating the Main Crops 19
Table12: Area Cultivated and Total Harvest of Food Crops by Gender 19
Table 13: Average Income Derived from Sale of Farm Produce 20
Table 14: Population of Household Engaged in Smallholder Plantation Farming 21
Table 15: Average Quantity of Produce and Income Derived from Plantation Crops 22
Table 16: Population of Household Engaged in Commercial Vegetables Farming 22
Table 17: Average Quantity of Produce and Income Derived from Commercial Veg. 23
Table 18: Malnutrition Status of Children (6-59 Months) in the Sample Population 24
Table 19: Percentage of Children Weighed by Age Group 25
Table 20: -3 Standard Deviation Units by Gender 26
Table 21: Breastfeeding Practices Among Children 0-5 Months Old 29
Table 22: Continued Breastfeeding Patterns among Sample Population 30
Table 23: Complementary Food Groups 31
Table 24: Breast Milk, Other Fluids and Food Intake during Diarrhea Episode 35
Table 25: Treatment and Care Giving Practices for Diarrhea 37
Table 26: Treatment and Care Giving Practices for Coughs 37
Table 27: Treatment and Care Giving Practices for Fever 38
Table 28: Sources of Treatment for Childhood Illnesses 38
Table 29: Reasons Given by Caregivers for Not Using Hospitals/ Clinics/
Peripheral Health Units 39
iii

Table 30: Antenatal Care during the Last Pregnancy 41
iv

List of Figures Fig 1: Age Distribution of Sample Population 5
Fig 2: Education Level of Household Heads 5
Fig 3: Months of Inadequate Household Food Provision 12
Fig 4: Use of Improved Farming Practices 15
Fig 5: Households Reporting Post Harvest Losses by Crop 16
Fig 6: Distribution of Respondents by Post Harvest Prevention Practices 17
Fig 7: Distribution of Households by Source and Type of Agro-Processing/ Infrastructure 18
Fig 8: Moderately Malnourished by Age 24
Fig 9: Severely Underweight (-3 SD) by Age Group 25
Fig 10: Overall Underweight (-2 SD and –3 SD) by Age Group 26
Fig 11: Proportions of Children with and Without < 5 Cards on Day of
Interview 31
Fig 12: Distribution of Children 0-59 Months by Type of Vaccination and
Gender 32
Fig 13 Status of Immunization among Children 9-59 Months by Gender 33
Fig 14: Diarrhea Management Practices 35
Fig 15: Respondents’ Knowledge on Causes of Malaria 39
Fig 16: Respondents’ Knowledge on Prevention of Malaria 39
Fig 17: Use of Bed Nets in Household 40
Fig 18: Distribution of Caregivers by Latest Child Delivery 42
Fig 19: Distribution of Caregivers by Source of Assistance during Latest
Delivery 43
v

List of Acronyms ASR Agricultural Sector Review CI Confidence Interval CMR Child Mortality Rate CORAD Consortium for Rehabilitation and Development CRS Catholic Relief Services DDS Dietary Diversity Score FAO Food and Agriculture Organization GoSL Government of Sierra Leone HDDS Household Dietary Diversity Score IMR Infant Mortality Rate INGO International Non-Governmental Organization IPTT Indicators of Performance Tracking Table ITN Insecticide-Treated Nets IVS Inland Valley Swamp Rice LEAD Livelihood Enhancement and Asset Development Program M&E Monitoring and Evaluation MAFFS Ministry of Agriculture, Forestry and Food Security MIHFP Months of Inadequate Household Food Provision MLCPE Ministry of Lands, Country Planning and Environment MTASP Medium Term Agricultural Strategic Plan NNGO National Non-Governmental Organization ORS Oral Rehydration Salts PHU Peripheral Health Unit PITT Performance Indicator Tracking Table PPS Population Proportion to Size PVO Private Voluntary Organization SLIHS Sierra Leone Integrated Household Survey SPSS Statistical Package for the Social Sciences SSL Statistics Sierra Leone TBA Traditional Birth Attendants UNICEF United Nations Children’s Fund USAID United States Agency for International Development VAM Vulnerability Analysis and Mapping WFP World Food Programme WHO World Health Organization WVSL World Vision Sierra Leone
vi

Executive Summary The Livelihood Enhancement and Asset Development (LEAD) program is a three year USAID/FFP-funded initiative that is implemented by the Consortium for Rehabilitation and Development (CORAD)1. The program began in March 2007, and the baseline study was conducted in April-June 2007 by means of a household survey, and covered targeted chiefdoms2 in Kono, Koinadugu, Kailahun, Tonkolili, Kenema, and Bombali Districts. Surveying was done by LEAD project staff in most cases, although some local partner staff were used as enumerators. The survey reached a final total sample of 3,139 households.
Only 4 percent of sampled households are headed by females. There are, however, more females (51.7 percent) than males (48.3 percent) in the entire population sampled. Educational levels are relatively low among the populations sampled. Overall, 71.9 percent of the sample population has no education at all; 27.1 percent has some primary education (class 1-6), while 0.7 percent and 0.3 percent have attained secondary and tertiary level education, respectively. Of the total households interviewed, 43 percent are considered “asset poor,” 34 percent are “asset medium” and 23 percent are “asset rich.”
An estimated 4 percent of the population sampled is either chronically ill or physically disabled. The sample population comprises males (54.8 percent) and females (45.2 percent). About 22.4 percent of the sample households have at least one chronically ill or physically disabled individual.
On average, households in the sample have fairly diversified diets. The Household Dietary Diversity Score (HDDS) for the entire sample is 6.7, indicating that household members consumed food from approximately 7 food groups. The median value of the HDDS is also 7, meaning that 50 percent of the sample households consumed food from 7 or more food groups during the reference period. Cereals and oils/fats were the two most consumed food groups, cited by 95.5 and 92.6 percent of respondents respectively, while eggs (3.2 percent) were the least consumed food item, followed by dairy products (6.6 percent).
The majority of the sample households suffer from seasonal food insecurity for an average four out of 12 months, which in duration and timing corresponds to the traditional “hungry season” in Sierra Leone, from June to September. The period of greatest shortage falls between June and October, with the month of August exhibiting the time of greatest food insecurity. For the entire sample, only 2.4 percent of households reported having enough food throughout the 12 months preceding the survey.
The most commonly cultivated crop is upland rice, reported by 69.3 percent of sample households, followed by inland valley swamp rice (58.9 percent), cassava (22.4 percent) and groundnuts (20.0 percent). Both inland valley swamp rice and groundnuts were also cultivated as a secondary crop (i.e. cultivated when other crops were also cultivated), and involved 4.3 percent and 3.1 percent of households, respectively.
Due to various factors, post harvest losses are high. Using proportional piling, nearly 20 percent of farmers reported losses equal to or greater than the amount of food utilized in the home or sold. This further exacerbates extremely low yields of certain crops: compared to the results of a study by MAFFS, FAO, and WFP, the per acreage yield of rice 1 CARE (prime), World Vision (WV), Catholic Relief Services (CRS), Africare. 2 See the annexes for a complete list of targeted chiefdoms
vii

found among households in the LEAD sample was only 34 percent of the maximum possible acreage yield (272 kg compared to 800 kg). Such low levels of production translates into insufficient quantities of food for household subsistence, and in reduced potential for generating cash income from agriculture.
The most commonly sold food crops were cassava and groundnuts, with about 60 percent and 81 percent of households growing cassava and groundnuts, respectively. Groundnut sales, overall, attracted the highest volume of income. Relatively fewer households were engaged in selling upland rice (24.9 percent ) and IVS rice (19.7 percent) harvested during the last season, due probably to the low production of both types of rice, along with the need to satisfy household demand for the crops (rice is the main staple of the communities in the study area).
Approximately 27.2 percent of the households interviewed reported establishing new plantations of coffee. The proportion of households that established new farms of cocoa and oil palm is 30.9 percent and 33.0 percent, respectively. In terms of rehabilitation of old farms, 36.1percent reported working on coffee, 34.7 percent on cocoa and 28.1 percent on oil palm.
Of the entire sample of children aged 6 to 59 months who were weighed (2,544), about one-fourth (25.5 percent) were found to be less than two standard deviations (<2SD) weight-for-age (moderately or severely underweight). Stratification by a child’s gender yielded significant underweight differences between males (with a prevalence rate of 29.2 percent) and females (with a prevalence rate of 21.7 percent). In terms of the age distribution among children found to be underweight, 20 percent were between 6 and 11 months, 39 percent between 12 and 23 months, and 41 percent were in the 24-59 months age group. Disaggregating by gender shows that boys were significantly more likely to be underweight than girls, 59 percent (95 percent CI: 56.5 to 61.5) versus 41 percent (95 percent CI: 38.5 to 43.5) (p < 0.05). Of those respondents with an infant under six months of age (N=446), 9.6 percent indicated that they were practicing exclusive breastfeeding.
About two-thirds of the children 9 to 59 months in the sample population were found to be fully immunized, without significant differences between males and females. Immunization coverage exceeded 80 percent for BCG, Polio-0, Polio-1 and DPT-1; also, more than two-thirds of the sample children aged between 0 and 59 months received Polio 2&3, and DPT 2&3 as depicted. Coverage is lowest (less than 60 percent) for measles.
High rates of illness and diseases are indicated for children of both genders in the sample population. Among children between 0 and 59 months, 67 percent were reported to have suffered from a cough, fever, or an episode of diarrhea in the two weeks prior to data collection. Over half (53.7 percent) of the respondents reported using ORS to treat diarrhea in their homes. The other common practices for treatment diarrhea among the sample population were the use of tablets (cited by 44.4 percent of respondents) and water (cited by 37.1 percent of respondents). Approximately 45 percent of sampled households reported having access to a protected water source for their drinking purposes year round. Finally, 76 percent of respondents reported owning a mosquito net, and 88.3 percent of those owning nets indicated that an under five child slept under the net the previous night.
viii

Based on these findings, the following table summarizes the key program indicators, the baseline results, the figures represented by the LOA targets specified in planning documents, and indications regarding how realistic these targets may be in lieu of the baseline findings.
Table i: Summary of Key LEAD Program Indicators and Baseline Findings
PO Indicators Baseline Value
LOA Targets Direction LOA Target Figues
Evaluation of Targets Against Baseline
Goal Months of Inadequate Household Food Provisioning (MIHFP)
4.6 months
No target set NA
Recommended target: 10% less
than baseline (4.1 months)
Goal Household Dietary Diversity Score (HDDS)
6.7 food groups
NA NA
Recommended target: 10% over baseline (7.0 groups)
Average value of household production of selected crops/livestock
390,509.88 429,560.86
Cassava 220,885 242,973.50 IVS Rice 177,199 194,918.90 Upland Valley Rice 238,780 262,658.00 Groundnuts 412,882 454,170.20 Coffee 323,294 355,623.40 Cocoa 664,778 731,255.80 Oil Palm 1,084,348 1,192,782.80
Goal
Commercial Vegetable 1,913.00
10% greater than baseline
2,104.30
Reasonable
PO1 % of children under 5 years who are underweight (percentage of children under five years of age with weight-for-age of less than 2SD)
25.50%
3% less than baseline 24.74% Reasonable
PO1 % of farmers using sustainable agricultural technologies similar to those to be introduced through LEAD
35% 20% greater than
baseline 42.00% Reasonable
Average of farm production of targeted crops per household (in kg)
895.23 1,119.04
Cassava 2,840.00 2,840.00 IVS Rice (both seasons) 1,047.00 1,047.00 Upland Valley Rice 551.00 551.00 Groundnuts (both seasons) 204.00 204.00 Coffee 199.50 199.50 Cocoa 357.40 357.40 Oil Palm 49.96 49.96
PO2
Commercial Vegetable 1,913.00
25% greater than baseline
1,913.00
Reasonable
Average gross sales per household of targeted crops (in leones)
400,468.97 440,515.87
Cassava 220,885 220,885.00 IVS Rice 177,199 177,199.00 Upland Valley Rice 238,780 238,780.00 Groundnuts 412,882 412,882.00 Coffee 323,294 323,294.00
PO2
Cocoa 664,778
10% greater than baseline
664,778.00
Reasonable
ix

x
PO Indicators Baseline Value
LOA Targets Direction LOA Target Figues
Evaluation of Targets Against Baseline
Oil Palm 1,084,348 1,084,348.00 Commercial Vegetable 81,585.75 81,585.75
PO3 % of births attended by trained TBA or other skilled personnel in the past six months
21.00% 20% greater than
baseline 25.20% Reasonable
Of households reporting morbidity from malaria, ARI, or diarrhea in the past two weeks, percentage that sought care from a health facility
72.81%
87.37%
Malaria 70.49% 70.49% ARI 80.21% 80.21%
PO3
Diarrhea 67.73%
20% greater than baseline
67.73%
Target high
PO3 Percentage of children under one year fully immunized
60% 15% greater than
baseline 69.00% Reasonable
PO3 Average percentage increase in purchases of input supply goods or services participating farmer groups
0 30% greater than
baseline 30.00%
PO4 Number of targeted community-based organizations (village development committees, farmer groups, community health clubs, village development health committees, youth groups and welfare committees) practicing transparent and democratic governance.
0
30% greater than baseline 297 Reasonable
FFP Ind.
% of infants under 6 months who are exclusively breastfed
8.50% NA NA

1. Introduction
The Livelihood Enhancement and Asset Development (LEAD) program is a three year (2007-2010) USAID/FFP-funded initiative that is implemented by the Consortium for Rehabilitation and Development (CORAD). The LEAD program has the goal of reducing food insecurity among vulnerable populations in 32 chiefdoms (including five major towns) in six districts in Sierra Leone. LEAD has the following four major objectives:
1. Protect and enhance human capabilities of farmers in 16,000 poor farm households, of 3,400 economically marginalized youth, and of pregnant and lactating women/children in 16,000 poor farm households.
2. Protect and enhance livelihood capacities of 16,000 poor farm households and 3,400 economically marginalized youth.
3. Improve community infrastructure and strengthen linkages to service providers in 375 rural communities.
4. Enhance the ability of 990 community-based organizations in both rural and urban areas to practice and demand the basic principles of good governance, i.e., transparency accountability and representation.
This report summarizes the findings of a baseline survey conducted by CORAD prior to the start of interventions.1 The baseline served to assess the conditions prevalent in target areas before the start of interventions so that progress made throughout the project with respect to its targeted outcomes could be reliably measured. If appropriately implemented, a baseline survey can also help adjust the program’s implementation design to the reality on the ground. This report presents the results obtained from the baseline survey conducted jointly by the four CORAD members (CARE, Catholic Relief Services (CRS), World Vision (WVSL), and Africare). A total of 3,139 households were interviewed on issues ranging from nutrition of children to agricultural production. Four of the 12 districts of Sierra Leone are represented in the sample.2
2. Baseline Aims and Objectives The purpose of the LEAD Baseline was to take a first measurement of the major long-term indicators for success of the LEAD program. The specific objectives of the evaluation were:
1. To serve as the first measure of all main program indicators as per the Performance Indicator Tracking Table (PITT), thus establishing the foundation for the program’s monitoring and evaluation (M&E) system (the assessed conditions as of the start of interventions).
2. To establish or validate the indicator targets described in the Indicators of Performance Tracking Table (IPTT).
3 Data collection was conducted in April-May 2007. Due to delays in the data analysis and report production, results were released in early 2008. 4 Kailahun, Koinadugu, Kono and Tonkolili. Data collection was not done in Bombali or Kenema as the only work that is planned in these areas is micro-enterprise with youth in urban centers. Separate youth data collection and analysis is done as a part of entry activities that can serve as a baseline reference point.
1
3. To gather data that will inform managers regarding the actual situation during the commencement of LEAD.
2.1 Evaluation Methodologies
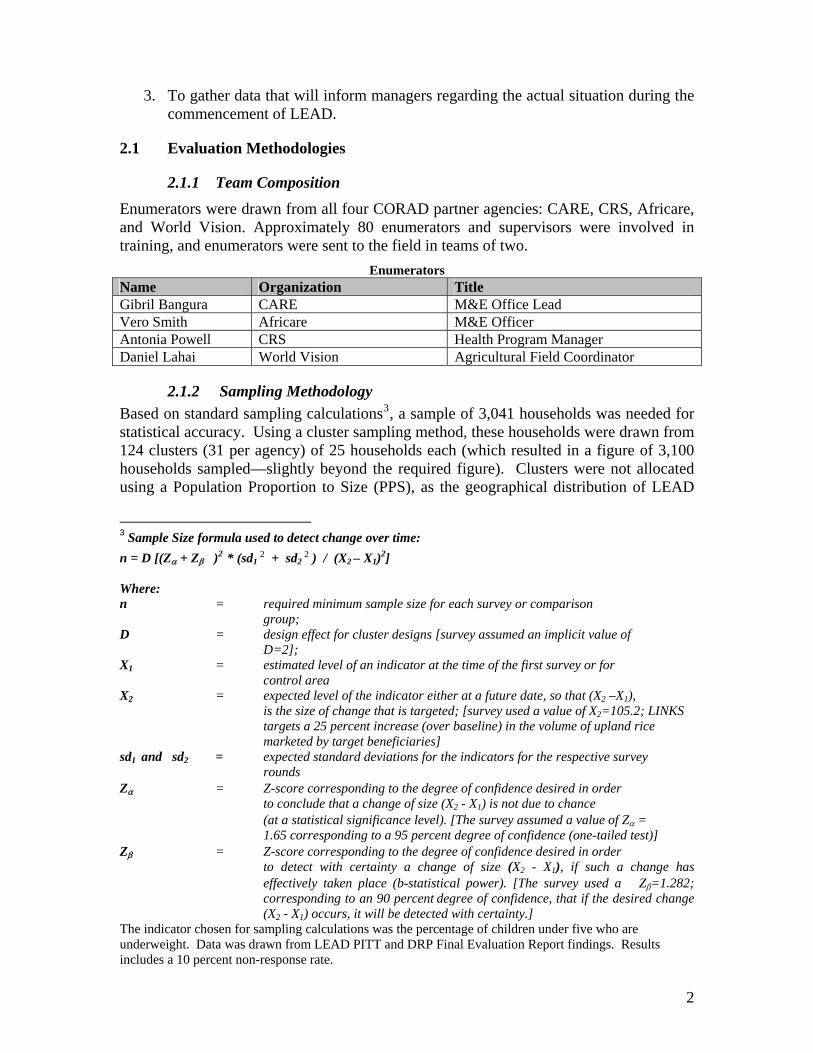
2.1.1 Team Composition Enumerators were drawn from all four CORAD partner agencies: CARE, CRS, Africare, and World Vision. Approximately 80 enumerators and supervisors were involved in training, and enumerators were sent to the field in teams of two.
Enumerators Name Organization Title Gibril Bangura CARE M&E Office Lead Vero Smith Africare M&E Officer Antonia Powell CRS Health Program Manager Daniel Lahai World Vision Agricultural Field Coordinator
2.1.2 Sampling Methodology Based on standard sampling calculations3, a sample of 3,041 households was needed for statistical accuracy. Using a cluster sampling method, these households were drawn from 124 clusters (31 per agency) of 25 households each (which resulted in a figure of 3,100 households sampled—slightly beyond the required figure). Clusters were not allocated using a Population Proportion to Size (PPS), as the geographical distribution of LEAD
2 2
3 Sample Size formula used to detect change over time: n = D [(Zα + Zβ )2 * (sd1 + sd2 ) / (X2 – X1)2] Where: n = required minimum sample size for each survey or comparison
group; D = design effect for cluster designs [survey assumed an implicit value of
D=2]; X1 = estimated level of an indicator at the time of the first survey or for
control area X2 = expected level of the indicator either at a future date, so that (X2 –X1),
is the size of change that is targeted; [survey used a value of X2=105.2; LINKS targets a 25 percent increase (over baseline) in the volume of upland rice marketed by target beneficiaries]
sd1 and sd2 = expected standard deviations for the indicators for the respective survey rounds
Zα = Z-score corresponding to the degree of confidence desired in order to conclude that a change of size (X2 - X1) is not due to chance (at a statistical significance level). [The survey assumed a value of Zα = 1.65 corresponding to a 95 percent degree of confidence (one-tailed test)]
Zβ = Z-score corresponding to the degree of confidence desired in order to detect with certainty a change of size (X2 - X1), if such a change has effectively taken place (b-statistical power). [The survey used a Zβ=1.282; corresponding to an 90 percent degree of confidence, that if the desired change (X2 - X1) occurs, it will be detected with certainty.]
The indicator chosen for sampling calculations was the percentage of children under five who are underweight. Data was drawn from LEAD PITT and DRP Final Evaluation Report findings. Results includes a 10 percent non-response rate.
2

activities was done purposively and not on the basis of population. For this reason, clusters were selected using the same criteria used by agencies to determine their areas of operation. 2.1.3 Training of Enumerators A training of all enumerators and supervisors was held on the 24th and 25th of April, 2007. There was a formal training on the 24th, which covered best practices, proper behavior, sampling protocols and the questionnaire instrument. On April 25th, training included a field test of questionnaires and a final revision of the instrument based on the enumerators’ field experience.
2.1.4 Data Collection Methods and Tools Used Data was gathered using a 32-page household questionnaire4 that was developed in consultation with stakeholders both within CORAD (i.e. representatives of the four partner agencies) and without (representatives of ministries, Statistics Sierra Leone representatives, and others).
2.1.5 Analysis All data will be entered into SPSS for analysis, using a template developed by the consultant (and report author), Mr. Lansana Wonneh. Data cleaning was likewise conducted by Mr. Wonneh. The consultant who was responsible for writing the Baseline Study Report will also be responsible for researching relevant secondary sources, for the purposes of comparative analysis.
2.1.6 Discussion of Limitations Challenges were found in transporting the field questionnaires from the field sites to Freetown for data entry. This did not result in significant delays in data entry, but nonetheless proved problematic for some partners.
Difficulties were noted in finding a pool of qualified consultants who were willing to participate in a competitive bidding process. Although a suitable consultant was found, it was necessary for CORAD staff to remain engaged throughout the process to ensure that work was completed according to USAID standards and practices.
The original plan was for data entry and data cleaning to be supervised by the M&E Unit; however, capacity challenges in the creation of an appropriate template meant that these responsibilities were transferred to the consultant, Mr. Wonneh. This was done to ensure that the best possible quality of analysis was conducted, but did result in some delays in the production of the report. In the future, the consultant will be requested to produce the template and play a role in the supervision of the data entry process.
4 A copy of this questionnaire can be obtained from CORAD upon request.
3

3. Survey Findings
3.1 General Description of the Population and Households Surveyed This survey collected information on 3,139 households,5 which equaled a total of 20,869 persons, with an average of 6.65 persons per household—a figure slightly higher than the national average of 6.0 as measured in the 2004 Census Results. There are slightly more females (51.7 percent) than males (48.3 percent) in the survey population. Patriarchy appears to be the norm overall: only 4 percent of the households sampled are headed by females.
Table 1: Gender Characteristics of Population (Percent of Population)
Males Females Overall Proportion of population 48.3 51.7 100 Head of household 96.0 4.0 100 Level of Education No education 68.6 73.1 71.9 Some primary education 29.9 26.4 27.1 Some secondary education 1.2 0.5 0.7 Some tertiary education 0.3 0.0 0.3
Educational levels are relatively low among the populations sampled. Overall, 71.9 percent of the sample population has no education at all; 27.1 percent have some primary education (class 1 to 6) and 0.7 percent have reached secondary education. Those proportions change significantly if we consider only the current primary school age population (6 to 12 years), as proportion having no education reduces to 23.7 percent, with the remainder having received some primary or secondary school education.
The data in Table 1 shows that proportionately more females (73.1 percent) than males (68.6 percent) have not been to school. For all persons over six years of age, females appear much less likely than males to have received any education. The educational gap between males and females widens as the education level gets higher. The difference, however, disappears when considering only the primary school age population, for which the proportion of uneducated persons is 5.7 percent for males and 5.5 percent for females. Young females appear to have the same chance of starting school as young males, but males are more likely to reach higher levels than females.
Figure 1 provides the age strata for the survey population. Of the total population sampled, about 35 percent are 15 years of age or under, while only 3 percent are above 65 years and over. The median age of the population is 24 years.
5 Defined as a group of people eating from the same pot.
4

Fig 1: Age Distribution of Sample Population
3.1.1 Description of Household Heads Overall, only 4 percent of the households sampled are headed by a female member of the family. The majority of household heads are between 20 and 59 years of age, with a slightly higher proportion (47.6 percent) in the 20 to 39 year range than in the 40 to 59 year range (41.3 percent). The average age of the head of household is 42 years, with the youngest reported as 19 years old and the oldest as 83 years old. Male household heads are slightly younger than female household heads, 43.2 and 44.8 years old, respectively.
About three-fourths of the household heads have never been to school, 22.7 percent have some primary education (classes 1 to 6), and only 2.2 percent have received secondary education. Those proportions change when the data is disaggregated by gender (Figure 2). Surprisingly, the proportion of female heads of households that have attended secondary school (6.6 percent) is greater than that of male heads of households (2.0 percent).
Fig 2: Education Level of Household Heads
0 20 40 60 80
100
Percentage
NoEducation
SomePrimary
Education
SomeSecondary Education
Education Level
Male Female
0 to 15 Yrs36%
16 to 35 Yrs37%
36 to 65 Yrs24%
Above 65 Yrs3%
5
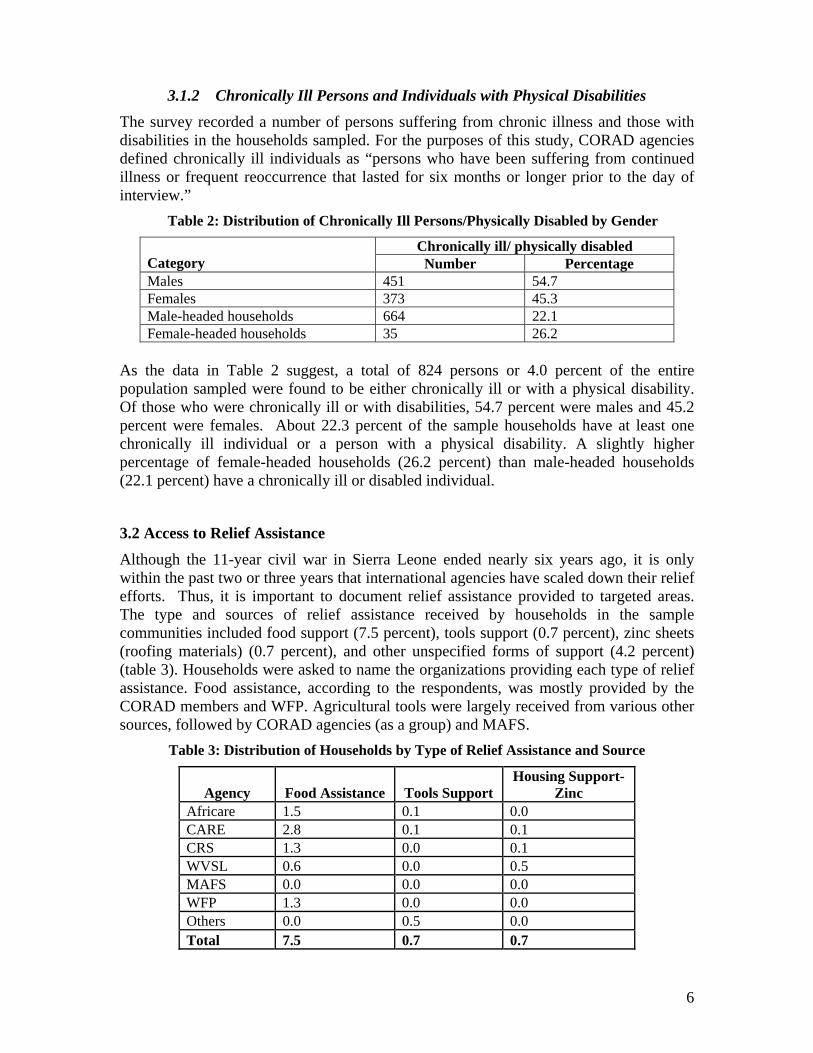
3.1.2 Chronically Ill Persons and Individuals with Physical Disabilities The survey recorded a number of persons suffering from chronic illness and those with disabilities in the households sampled. For the purposes of this study, CORAD agencies defined chronically ill individuals as “persons who have been suffering from continued illness or frequent reoccurrence that lasted for six months or longer prior to the day of interview.” Table 2: Distribution of Chronically Ill Persons/Physically Disabled by Gender
Chronically ill/ physically disabled Category Number Percentage Males 451 54.7 Females 373 45.3 Male-headed households 664 22.1 Female-headed households 35 26.2
As the data in Table 2 suggest, a total of 824 persons or 4.0 percent of the entire population sampled were found to be either chronically ill or with a physical disability. Of those who were chronically ill or with disabilities, 54.7 percent were males and 45.2 percent were females. About 22.3 percent of the sample households have at least one chronically ill individual or a person with a physical disability. A slightly higher percentage of female-headed households (26.2 percent) than male-headed households (22.1 percent) have a chronically ill or disabled individual.
3.2 Access to Relief Assistance Although the 11-year civil war in Sierra Leone ended nearly six years ago, it is only within the past two or three years that international agencies have scaled down their relief efforts. Thus, it is important to document relief assistance provided to targeted areas. The type and sources of relief assistance received by households in the sample communities included food support (7.5 percent), tools support (0.7 percent), zinc sheets (roofing materials) (0.7 percent), and other unspecified forms of support (4.2 percent) (table 3). Households were asked to name the organizations providing each type of relief assistance. Food assistance, according to the respondents, was mostly provided by the CORAD members and WFP. Agricultural tools were largely received from various other sources, followed by CORAD agencies (as a group) and MAFS.
Table 3: Distribution of Households by Type of Relief Assistance and Source
Agency Food Assistance Tools Support Housing Support-
Zinc Africare 1.5 0.1 0.0 CARE 2.8 0.1 0.1 CRS 1.3 0.0 0.1 WVSL 0.6 0.0 0.5 MAFS 0.0 0.0 0.0 WFP 1.3 0.0 0.0 Others 0.0 0.5 0.0 Total 7.5 0.7 0.7
6

3.3 Asset Ownership (Material and Livestock) Asset ownership is an important indicator of wealth and is a useful proxy for characterizing livelihood security of households. In Sierra Leone, the value of assets owned by rural households has been shown to correlate highly with other livelihood indicators, and to closely mimic qualitative wealth rankings.6
3.3.1 Material Assets (Domestic and Productive) The following table shows the proportion of households that own various assets, with items listed in decreasing order of frequency of ownership, and the average number of each asset per household by gender. The most commonly owned domestic asset is a cooking pot, owned by nearly all (98.5 percent) households, followed by a wooden bed frame, owned by 70.1 percent of households. Slightly more than half (51.6 percent) of all households sampled owned a radio or tape recorder. Less than 10 percent of households owned a foam mattress, stove or charcoal pot (Table 4).
In terms of productive assets, hoes and machetes, owned by 91 percent of households each, are the most common, followed by axes and shovels. Ownership of bicycles, motorcycles, and sewing machines was less than 5 percent across the whole sample.
Table 4: Frequency Distribution of Households by Ownership of Material Assets
Asset Number of households Percentage Cooking pot 3092 98.5 Hoe 2865 91.3 Machete 2867 91.3 Axe 2395 76.3 Wooden bed frame 2200 70.1 Radio 1620 51.6 Shovel 613 19.5 Large cooking pot 532 16.9 Foam mattress 281 9.0 Bicycle 282 9.0 Charcoal pot 134 4.3 Sewing machine 94 3.0 Stove 85 2.7 Motorcycle 64 2.0
3.3.2 Livestock Assets
Poultry were owned by more than half (58.5 percent) of all households sampled, followed by goats (8.9 percent), sheep (6.8 percent), and cows (2.0 percent) (Table 5). The average flock/herd size of the different types of livestock per household were: chicken (3.84), guinea fowl (3.53) goats (1.99), sheep (2.25) and cattle (3.40). It is important to note that cattle ownership is tied strongly to both the area of the country where herding traditionally takes place (especially Koinadugu District), as well as the level of pillaging that took place during the conflict, depleting the number of animals in those areas. In this study, households reporting owning one or more cattle are most commonly observed in
6 Statistics Sierra Leone: Sierra Leone Integrated Household Survey 2004.
7

the districts of Koinadugu and Tonkolili. Higher levels of sheep and goat ownership is also seen in these districts.
Table 5: Frequency Distribution of Households by Ownership of Livestock
Asset Number of households Percentage
Average Flock/Herd Size Per Household
Chickens 836 58.5 3.84 Ducks 298 9.5 2.13 Goats 278 8.9 1.99 Sheep 212 6.8 2.25 Cows 68 2.2 3.40 Guinea fowl 31 1.0 3.53
3.3.3 Asset Wealth As stated earlier, the number of assets owned is a strong proxy indicator for food security of a household. A greater variety of assets indicates the purchasing power of the household, the lack of past need to sell assets to meet food needs, and a reserve in the form of these assets in case of severe shock. On the basis of the number of different types of assets owned using a list of 19 productive and non-productive assets, households are then classified into either:
“Asset poor”: households having 0 to 4 different types of assets
“Asset medium”: households having 5 to 9 different types of assets
“Asset rich”: households having 10 or more different types of assets
Based on these definitions, 43 percent of the households interviewed were “asset poor”, 34 percent were “asset medium” and 23 percent were “asset rich”. In general, female-headed households were less likely to be asset rich (0.7 percent) as compared to male-headed households (7.6 percent)7.
In the sample as a whole, the mean number of household assets is 4. Male-headed households report a mean of 5 assets, while female-headed households own an average of only 3 assets. Those households that own relatively few assets will usually have basic farming tools such as hoes and machetes, as well as cooking pots.
In every asset category measured, male ownership is higher than female ownership. Key assets with the largest gaps between households headed by males and those headed by females include basic agricultural tools, such as machetes, hoes, and shovels, and livestock, especially sheep and cows. Male-headed households have a larger variety of assets than do female-headed households. Female-headed households do not typically own capital-intensive items such as bicycles, motorcycles or sewing machines, although for certain of these assets, such as bicycles, there may be cultural reasons for this finding. Table 6 shows the average of the different assets per household.
7 The classification is adopted from the Food Security and Vulnerability Analysis Methodology used by the Ministry of Agriculture, Forestry and Food Security, FAO, WFP and DACO- (VAM 2007.)
8

Table 6: Average Number of Assets per Household
Average number of Assets per Household8
Assets Male Female Male/Female Ratio Radio 1.16 1.05 1.10 Charcoal pot 1.25 1.17 1.07 Stove 1.56 1.00 1.56 Cooking pot (average Size) 2.17 2.06 1.05 Large cooking pot 1.28 1.35 0.95 Wooden bed frame 1.62 1.30 1.25 Mattress 1.27 1.10 1.15 Bicycle 1.00 0.00 Motorcycle 1.08 0.00 Sewing machine 1.06 0.00 Shovel 1.50 1.00 1.50 Hoe 2.81 1.34 2.10 Axe 1.87 1.40 1.34 Machete 2.52 1.36 1.85 Chicken 3.86 3.39 1.14 Duck 2.37 2.33 1.02 Guinea fowl 3.70 1.00 3.70 Sheep 3.79 1.33 2.85 Goat 1.99 1.50 1.33 Cow 3.42 2.00 1.71
3.4 Access to Potable water The availability and access of water, in both the rainy season and dry season, was examined in detail during the household interviews. Respondents were asked to name the household’s primary, secondary, and tertiary sources of water in both the dry season (November to April) and the rainy season (May to October). Additionally, they were asked to estimate, for each source of water, the time it takes to reach the water point from the household and return home, and the length of the wait at the water site before collecting water. In Table 7, the various sources of water reported by respondents have been divided into two broad categories: “protected water sources” and “non-protected water sources”. The term “protected water source” in this study refers to water points that are covered and are fitted with a lifting device that minimizes contamination.
3.4.1 Primary Source of Potable Water
Table 7 shows the water situation of sample households in detail, looking at access and availability during the dry and rainy season. Overall, the results indicate that about 45 percent have access to protected water for their drinking needs, no matter the time of the year. During the rainy season the primary source of drinking water for a significant proportion (45.4 percent) of the sample household is protected: it comes from either a protected dug well (26.6 percent), a tube-well/borehole (12.1 percent), a public tap/stand
8 This is an average for only the households that reported owning the particular asset.
9

pipe (4.8 percent), a protected spring water (1.3 percent) or is piped into the compound or dwelling house (0.6 percent). However, more than half (54.6 percent) of the sample households derive water mainly from an unprotected source. Unprotected sources include rain water9 (20.7 percent), surface water (10.4 percent), unprotected dug well (9.6 percent), stream/irrigation canal (8.3 percent), and unprotected spring (5.4 percent).
Table 7: Main Source of Potable Water
Protected Source Dry Season Rainy Season Piped water into dwelling 0.6 0.5 Piped water into yard/compound 0.1 0.1 Public tap/stand pipe 4 4.8 Tube-well/borehole 12.6 12.1 Protected dug well 29.1 26.6 Protected spring 1.7 1.3 Total 48.1 45.4
Unprotected Source Dry Season Rainy Season Unprotected dug well 14.4 9.6 Unprotected spring 8.4 5.4 Rain water collection 0.7 20.7 Surface water (river/pond) 18 10.4 Stream/canal/irrigation canal 10.2 8.3 Other 0.2 0.2 Total 51.9 54.6
The data in Table 7 show that the proportion of households with access to protected sources increases slightly during the dry season. The reason for this is two-fold: there is no rain water in the dry season, which is the main source of water for some households; and, due to the severity of the seasonal rains, people are less likely to walk long distances to a protected water source.
3.4.2 Secondary and Tertiary Sources of Potable Water Secondary and tertiary water sources refer to water sites that are used when the primary water source is unavailable. For the entire sample, 87.7 percent of households reported having a secondary source of water and slightly less than half (40.2 percent) reported having a tertiary source of water during the rainy season. The proportion of households with a secondary source of water drops to 55.3 percent in the dry season, and relatively few households reported having a tertiary source of water.
3.4.3 Time Spent in Water Collection The distance one must travel to a water point and the time it takes to collect the water are two major factors that determine access to potable water. The SPHERE Standards recommend that the maximum distance from any household to the nearest potable water source is 500 meters, and that the queuing time at a water source is no more than 15
9 Given the current nature of rain water collection (i.e. without cover or fencing to keep animals and other contaminants away), it is not considered a protected source. It would be possible to adapt current collection methods.
10

minutes.10 During household interviews, respondents were asked about the time it takes to fetch drinking water in both the rainy and the dry seasons.
On average, households included in the sample reported that it takes 13.56 minutes to walk to their main drinking water point during the rainy season. The walk almost doubles during the dry season, averaging 26.98 minutes. The difference in time taken to reach a water source can be explained by the fact that people are more likely to collect rain water during the rainy season, and that wells that are be dry in the dry season fill during the rainy season. During the rainy season, people may settle on a poorer quality of water because they do not want walk long distances carrying heavy containers in the rain.
The questionnaire also collected information on the amount of time it takes to queue at the water site. In general, extended waits at the water collection point are due to a malfunction at the water point, an inadequate number of water sources in the community relative to the population size, poor management control over sources by the community, or low water levels. The data show that people spend more time waiting at the water site during the dry season, for an average of 6.11 minutes, as compared to an average of 15.39 minutes in the dry season.
3.5 Food Security Situation of Households
3.5.1 Months of Inadequate Household Food Provision (MIHFP) Respondents were asked about the food security situation in their households. A first set of questions asked whether there were months in which the household did not have enough food to meet the needs of its members during the 12 months prior to the survey, and on a month-by-month basis.
For the entire sample, less than 3.0 percent of households had enough food to eat at all times during the 12 months preceding the survey, indicating that a great majority of the sample households suffered from food insecurity at some point during the reference period. On average, households included in the sample had inadequate food provision for 4.6 out 12 months. Shortages generally occurred in the period June to October 2006, with the month of August being the time of greatest food insecurity, while families had the greatest access to food from November 2006 to March 2007 (Figure 3).
10 SPHERE Handbook, 2004.
11

Fig 3: Months of Inadequate Household Food Provision
Months of Inadequate HH Provision
0
20
40
60
80
100
120
Jun-0
6
Jul-0
6
Aug-06
Sep-06
Oct-
06
Nov-06
Dec-06
Jan-0
7
Feb-07
Mar-07
Apr-0
7
May
-07
Months
Perc
ent o
f HH
3.5.2 Household Dietary Diversity Score (HDDS)
To better reflect households’ access to food and the quality of their diets, respondents were asked to indicate the different food groups consumed in the household during the previous 24 hours. For the purpose of this study, a set of 12 food groups was used to determine the HDDS. This set of food groups is derived from the UN Food and Agricultural Organization (FAO) Food Composition Table for Africa11, and was adapted to suit the Sierra Leone context.
Overall, households in the sample have fairly diversified diets. The HDDS value for the entire sample is 6.712, indicating that households in the sample, on average, consumed food from approximately 7 food groups. The median value of the HDDS is 7, meaning that 50 percent of the sample households consumed food from 7 or more food groups during the reference period.
Table 8 presents the percentage of households that consumed food from each of the specified groups in the previous 24 hours. Nearly all (95.5 percent) households ate cereals during the reference period. Vegetables, mostly green leaves, fruits, and oil (mostly palm oil) were also widely consumed, with a total of 92.6 percent of households reporting consumption. Foods made from roots, tubers, and legumes (such as beans, benni, peas or lentils) were consumed by 47.7 percent of the total households sampled. The intake of food rich in animal protein (e.g., meat, eggs, milk and milk products) was generally lower for the entire sample.
11 Latham, M (1997) Human Nutrition, the Department of Food and Agriculture, Organisation of the United Nations. Rome, Italy. 12 Disaggregating by gender yielded an HDDS value of 6.7 and 6.6 for male-headed households and female-headed households, respectively.
12

Table 8: Categories of Food Consumed by Households within 24 Hours Prior to the Survey
Households Categories of Food Frequency Percentage
Cereals: rice, bulgur, bread, wheat, flour, noodles, sorghum 2999 95.5 Roots and tubers: potatoes, cassava, bush yam, etc. 1393 44.4 Vegetables: includes cassava leaves, potato leaves 2674 85.2 Fruits: includes oranges, lemons, bananas, mangoes, etc. 2727 86.9 Animal protein: meat such as beef, pork, lamb, goat, chicken, wild game, etc. 376 12.0
Eggs 99 3.2 Any fish or crab 2255 71.8 Food made from beans, benni, seeds, peas, lentils 1498 47.7 Cheese, milk or milk products 208 6.6 Food made with palm oil, other oil, fats 2907 92.6 Sugar or honey 680 21.7 Pepper, salt, condiments 3008 95.8
3.6 Households’ Main Source of Income Households in the survey population were asked to name their main source of income in the previous year (January to December 2007). The various sources of income cited are listed in table 9 along with the percentage of respondents citing the income sources. For nearly 80 percent of the respondents, crop agriculture was the main source of household income during the previous year. This includes the cultivation and sale of upland rice, tree crops, inland valley swamp rice, and vegetables. Wages from local employment was the other main source of income, and was cited by 3.6 percent of respondents. For 1.9 percent of the sample household, a remittance from friends and relatives was the main source of income in the previous year. About 13.6 percent of respondents cited various other activities as their main source of income during the previous year. Disaggregating the data by gender of household heads shows that both male-headed and female-headed households have similar sources of income.
Table 9: Distribution of Households by Sources of Income by Percentage
Income Sources Male-
headed Female-headed
All households
Cultivation and sales of upland rice crops 31.8 17.2 31.2 Cultivation and sale of inland valley swamp rice crops 10.3 17.2 10.6 Cultivation and sale of tree crops 31.7 21.6 31.3 Cultivation and sale of commercial vegetables 5.0 14.9 5.4 Wages from local employment 3.7 0.7 3.6 Remittance from relatives or friends 1.7 6.7 1.9 Migrant labor wage 2.4 2.2 2.4 Trading 5.2 6.0 5.1 Processing and sale of palm oil 4.1 3.7 4.1 Others 4.1 9.8 4.4
100.0 100.0 100.0 N=3005 N=134 N=3139
13
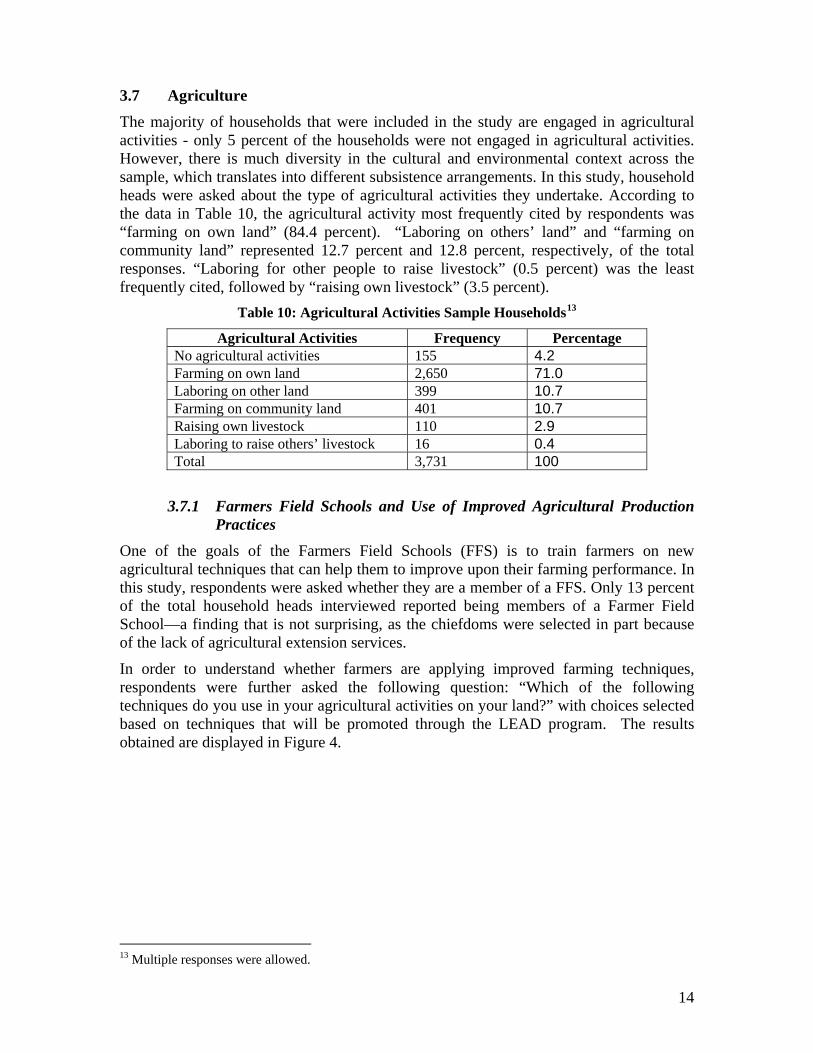
3.7 Agriculture The majority of households that were included in the study are engaged in agricultural activities - only 5 percent of the households were not engaged in agricultural activities. However, there is much diversity in the cultural and environmental context across the sample, which translates into different subsistence arrangements. In this study, household heads were asked about the type of agricultural activities they undertake. According to the data in Table 10, the agricultural activity most frequently cited by respondents was “farming on own land” (84.4 percent). “Laboring on others’ land” and “farming on community land” represented 12.7 percent and 12.8 percent, respectively, of the total responses. “Laboring for other people to raise livestock” (0.5 percent) was the least frequently cited, followed by “raising own livestock” (3.5 percent).
Table 10: Agricultural Activities Sample Households13
Agricultural Activities Frequency Percentage No agricultural activities 155 4.2 Farming on own land 2,650 71.0 Laboring on other land 399 10.7 Farming on community land 401 10.7 Raising own livestock 110 2.9 Laboring to raise others’ livestock 16 0.4 Total 3,731 100
3.7.1 Farmers Field Schools and Use of Improved Agricultural Production Practices
One of the goals of the Farmers Field Schools (FFS) is to train farmers on new agricultural techniques that can help them to improve upon their farming performance. In this study, respondents were asked whether they are a member of a FFS. Only 13 percent of the total household heads interviewed reported being members of a Farmer Field School—a finding that is not surprising, as the chiefdoms were selected in part because of the lack of agricultural extension services.
In order to understand whether farmers are applying improved farming techniques, respondents were further asked the following question: “Which of the following techniques do you use in your agricultural activities on your land?” with choices selected based on techniques that will be promoted through the LEAD program. The results obtained are displayed in Figure 4.
13 Multiple responses were allowed.
14

Fig 4: Use of Improved Farming Practices
Use of Improved Farming Practices
010203040506070
Sm
all S
cale
Irrig
atio
n
Legu
min
ous
cove
r cro
pus
age
Impr
oved
plan
ting
mat
eria
l
Terr
acin
g of
hills
ides
Cro
pro
tatio
n
Non
e
Practices/Techniques
Perc
ent
As shown in Figure 3, of the total sample households, 65 percent do not apply any of the techniques listed. None of the improved practices listed is commonly used by the sample households, although it should be noted that the choices listed were based upon those that CORAD planned to promote (to provide a baseline of these activities), rather than those that might be promoted by other agencies or the Ministry of Agriculture (MAFS). Less than 20 percent of the respondents reported using improved planting materials, or practicing crop rotation. Only 8 percent of households are using small-scale irrigation, and fewer than 4 percent of the total households interviewed reported practicing terracing of hillsides and leguminous cover cropping. However, no information was collected on why farmers were not practicing the improved techniques. However, experience from other projects conducted by NGOs, FAO, and MAFS has shown that adopting some of these technologies is that they require substantial technical knowledge, access to planting materials and labor. On the other hand, it is believed that farmers are using improved planting materials, but they have given local names to these varieties, which vary with the different cultures. As a result, people find it difficult to differentiate improved varieties from local varieties.
3.7.2 Use of Agricultural Pesticides in Crop Production For all households sampled, 6.2 percent reported using pesticides on their crops during the last cropping season. When asked about the crops for which pesticides were used, respondents mentioned commercial vegetables, inland valley swamp rice and tree crops, including cocoa, coffee and oil palm.
3.7.3 Post Harvest Losses and Agro-Processing Farmers were asked whether they experienced any post-harvest losses during the six months preceding the survey, and to compare such losses, if any, to what was consumed by households or sold using proportional piling. According to the data, about 75 percent of all farm households in the sample reported experiencing some amount of post-harvest losses. For the vast majority (81.6 percent) of these households, the size of post-harvest losses was less than the amount used by the household or sold. In 15 percent of the
15

households, the amount of post harvest losses was considered to be greater than the quantity utilized or sold by the household. For the remaining households (less than 5 percent), the post harvest losses matched the quantity consumed in the household or sold.
The respondents were also asked about the types of crops from which they experienced post harvest losses. The crops most frequently mentioned were upland rice and inland valley swamp rice, cited by 63.5 percent and 44.3 percent of respondents, respectively. Surprisingly, however, other food crops such as cassava, sweet potatoes, and vegetables, which are more susceptible to post-harvest losses because they are perishable, were less frequently mentioned (see Figure 5).
Fig 5: Households Reporting Post Harvest Losses by Crop
Household's reporting post harvest loss by crop
63.5
44.3
5.6 6.9 3 3 5.3
010203040506070
Uplan
d Rice
IVS
Rice
Cass
ava
Swee
t Pota
to
Vege
table
s
Groun
dnut
crops
perc
ent
3.7.4 Measures to Reduce Post Harvest Losses The survey next asked respondents about the measures taken to reduce post-harvest losses. Their answers are presented in Figure 6. According to the data, more than half (56.8 percent) of the households said that they did not take any measure to reduce post harvest losses. Of the households that identified some measures, 9.8 percent mentioned use of a storage facility, 7.0 percent identified use of drying mats, while 5.4 percent and 4.8 percent reported using a wooden box and a drying floor, respectively. About 16.2 percent of respondents indicated other measures apart those listed above. Recent studies14 and experiences of several professionals with knowledge about agriculture in Sierra Leone disagree with the large percentage of farmers, as indicated by this data, who reported not taking any measures to reduce post-harvest losses. It may be possible that the concept of post-harvest losses was not clearly understood by the respondents, who could be taking certain measures, but do know that know that their practices are measures against post-harvest losses. This opinion is particularly reinforced when account is taken
14 Koroma, EY (2004): Survey of post-harvest practices for rice among farmers in Sierra Leone. Annual research review: Rice Research Station, Rokupr, March 2004.
16

of the data in the next two sections (3.7.5 and 3.7.6), relating to those who claim to have access to a drying floor.
Fig 6: Distribution of Respondents by Post Harvest Prevention Practices
Distribution of respondents by post-harvest prevention practices
56.8
4 8 7 9.8 5.416.2
0102030405060
No mea
sure ta
ken
Use dryi
ng flo
or
Use dryi
ng m
at
Use st
orag
e fac
ility
Use w
oode
n bo
x
Other
Practices
Perc
ent
The relatively low percentage of households using drying floor and grain stores, as documented, certainly has a profound implication in terms of post harvest loss. It should be noted that the use of other commonly used local measures (such as mud floors and tarmac roadsides) to dry farm produce such as rice, cause contamination and thus affect grain quality. Similarly, lack of appropriate storage facilities can result in households losing a significant part of their produce to pests and diseases and through theft.
As can be seen in the next section, however, it is not the case that farmers do not know about the benefits of using concrete drying floors and improved grain stores or that they are not interested in improved techniques. Rather, these structures, which are relatively costly to construct, might not be available in some communities.
3.7.5 Access to Post-Harvest Infrastructure and Agro-Processing Facilities Respondents were asked whether their village had drying floors and agro-processing facilities and who provided the facilities. Overall, 32.9 percent and 90.3 percent of households reported having a drying floor and agro-processing facilities, respectively, in their villages. As for who provided the facilities, CORAD members (CARE, CRS, WVSL, and Africare) as a group, were the most important providers of these facilities in the villages sampled. In the case of drying floors, the next important providers cited were local groups, followed by other INGOs, NNGOs and the Ministry of Agriculture and Food Security (MAFFS). For the agro-processing facilities, NNGOs were the next most frequently cited providers after CORAD, followed by other INGOs, private individuals, local groups, and MAFFS, in that order (Figure 7).
17

Fig 7: Distribution of Households by Source and Type of Agro-processing/ Infrastructure
Percent of HH reporting access to agro-processing equipment or drying floors, by source
05
10152025303540
Africare
CARECRS
WVSLMAFS
Other N
GO
Loca
l NGO
Loca
l gov
ernment
Private In
dividu
alsPer
cent
of H
H w
ith a
cces
s
Agro-processingequipmentdrying floor
3.7.6 Utilization of Drying Floors Those households who reported having drying floors in their villages were further asked about how frequently the facilities are used by community members. More than 80 percent of the respondents said that people in their communities are using the drying floors frequently, implying the importance of the facilities to large numbers of rural households and their communities. When asked about the population group that uses the drying floor, 90.7 percent of respondents cited women, 69.7 percent cited men and 63.7 percent mentioned youth. The implication therefore is that a drying floor, where it exists, is beneficial to the entire population, and tends to be widely accessible by the different sub-groups of the community. However, women are more likely than men to use drying floors because they are traditionally responsible for post-harvest processing of food crops.
3.7.7 Types of Agro-Processing Activities Respondents from across the study area are not actively involved in agro-processing activities, mainly because they are largely primary producers, and some other person takes economics of scale by processing their produce to secondary products of higher values. The key agro-processing activities that are carried out in the sample communities are cassava processing (29.1 percent) and oil palm processing (8.6 percent). While rice milling is an important agro-processing activity across the country, there was no mention of it by any of the respondents. One cannot be certain as to whether this question was in fact well framed by the interviewers or properly understood by respondents during the interviews.
18

3.7.8 Land Use and Agricultural Production Land ownership and production is the most important aspect of rural livelihoods in Sierra Leone15. As mentioned earlier, the vast majority of households included in this survey are engaged in agricultural activities. The survey asked people the amount of land that is owned or accessible to their households. Only 6.8 percent of households reported having no access to land, whether it was rented or owned. An average of 4.53 hectares (11.2 acres) was accessible to households, and varied from 0.4 hectares to 20 hectares.
3.7.9 Crop Production Production is also an important indicator when looking at land access. Different agricultural practices and soil qualities have a large impact on crop yields and total farm harvest. Table 11 below presents the percentage of households that report having cultivated four major food crops, including upland rice, inland valley swamp rice, cassava, and groundnuts. The most commonly cultivated crop is upland rice, reported by 64.0 percent of sample households, followed by inland valley swamp rice (52.8 percent), cassava (19.2 percent) and groundnuts (18.2 percent). It should be noted that IVS rice and groundnuts have two growing seasons; overwhelmingly, however, the figures in Table 11 reveal that farmers are only cultivating these two crops in one season.
Table 11: Percentage of Households Cultivating Main Food Crops
IVS Rice Groundnuts Type of Food Crop
Upland Rice 1st Crop 2nd Crop Cassava 1st Crop 2nd Crop
Number of HH 2,007 1,656 209 603 570 161 Percent (%) of sample
64.0
52.8
6.7
19.2
18.2
5.1
Households were asked to estimate the area cultivated, and total harvest of the main food crops. Table 12 highlights gender differences in the pattern of food crop production during the last cropping season.
Table 12: Area Cultivated and Total Harvest of Food Crops by Gender
Average Area Cultivated (Acres) Average Total Harvest (Kg)
Crop Type
Male-headed
Household
Female-headed
Household All
Households
Male-headed
Household
Female-headed
Household All
HouseholdsUpland Rice 2.39 1.72 2.37 567 369 551 IVS Rice (1st season) 2.17 1.33 2.14 691 563 583 IVS Rice (2nd season) 1.61 1.15 1.18 574 459 464 Cassava 2.41 2.28 2.42 3064 2664 2840 Groundnuts (1st season) 0.64 0.55 0.63 112 115 113 Groundnuts (2nd season) 0.42 0.50 0.44 83 107 91
15 Bomah A K (2004): Land Policy, Land Tenure and Implications for Economic Development in Sierra Leone. Paper presented at the workshop on the Draft National Land Policy, Ministry of Lands, Country Planning and the Environment (MLCPE) Freetown, August 16-19, 2004.
19

The data compares production levels of male and female-headed households for upland rice, lowland (IVS) rice, cassava, sweet potatoes and groundnuts. With the exception of groundnuts, both average total harvest and area cultivated per household were higher for male-headed households than female-headed households. The crops with the largest gender gap are upland rice and IVS rice. Average production of male-headed households exceeded that of female-headed households by more than 100 percent for upland rice and by 36 percent for swamp rice.
Similarly, male-headed households cultivated on average 39 percent more land than female-headed households for upland rice. Previous studies in the rural areas of Sierra Leone have associated inequality between male-headed and female-headed households in terms of farm sizes and productivity to women’s unequal access to production inputs, such as fertile land, labor, and credit, and material inputs16.
Looking at the average production of the different food crops per farm in relation to the average area cultivated, it can be observed that crop yields are relatively low when compared to their theoretical potential (defined as yield of the same crop obtained by researchers under the same growing conditions) and figures obtained through recent nation-wide farm production and household food security surveys that were jointly conducted by MAFFS, FAO, and WFP in 2005 and 2007. In both studies, the district level average yield reported for inland valley swamp rice, for instance, ranged between 440 kg/acre to 600 kg/acre. When grown on a researcher/farmer managed on-farm plot, inland valley swamp rice produces about 2.0 MT/hectare which translates to approximately 800 kg per acre17. The average yield reported by our sample farmers for the same crop (272.0 kg) is about 34 percent of the potential yield of this crop. There is thus ample room to increase yields for most of the crops examined in this study. Reducing this gap should continue to be a pressing priority for future food security interventions.
Due to low yield levels, total farm production, as observed earlier, is not sufficient to meet the domestic consumption needs of the overwhelming majority of households.
3.7.10 Farm Income: Food Crop Farming
Table 13: Average Income Derived From Sale of Farm Produce
Crop
Percentage of Farmers Who Sold Crop Products
Last Season
Income Derived From Sale of
Produce (in leones) Upland rice 24.95 238,780 IVS rice 19.67 177,199 Cassava 60.00 220,885 Groundnuts 80.70 412,882
16 Davies, VAB (2000): Gender, Agricultural Production and the Theory of the Household as Applied to Rice Farming Households in South-Eastern Sierra Leone. Research paper presented to the Agricultural and Rural Forum, United Nations Institute for Development Economics and Planning, Dakar, Senegal, August 2000. 17 Wonneh, LMA and Huss W (1993-1995): Annual Reports, Farming Systems Research Division, Rice Research Station Rokupr.
20

As Table 13 shows, relatively few households were engaged in selling rice crops harvested during the last season. This was likely due to the low production of both upland and IVS rice, along with the need to satisfy household demand for crops (rice being the main staple of the communities in the study area). The most commonly sold food crops were cassava and groundnuts, with about 60 percent and 81 percent of households growing cassava and groundnuts, respectively, engaged in sales. Groundnut sales, overall, attracted the highest volume of income.
3.7.11 Smallholder Plantation Farming Table 14 summarizes data on the population of households engaged in smallholder plantation farming. During the civil war, most of the smallholder plantations of coffee, cocoa and oil palm almost reverted to bush due to a long period of abandonment. Since the end of the war, the owners of these farms have been trying to rehabilitate them, and to establish new farms. In the household interviews, respondents were asked whether their households planted new plantations, and/or rehabilitated old plantations during the previous year. About 27.2 percent of the households interviewed reported establishing new plantations of coffee. The proportion of households that established new farms of cocoa and oil palm is 30.9 percent and 33.0 percent respectively. In terms of rehabilitation of old farms, 36.1 percent reported working on coffee, 34.7 percent on cocoa and 28.1 percent on oil palm.
Table 14: Population of Households Engaged in Smallholder Plantation Farming
Coffee Cocoa Oil Palm Type of Tree (Plantation)
Crop Establishment of New farm
RehabilitationOf Old Farm
Establishment of New Farm
RehabilitationOf Old Farm
Establishment of New Farm
RehabilitationOf Old Farm
Number of HH 855 1132 970 1092 1035 882
Percent (%) of sample 27.2 36.1 30.9 34.7 33.0 28.1
Average area (acre) rehabilitated /established
0.42 3.45 0.46 3.44 3.65 3.65
3.7.12 Production of Major Tree (Plantation) Crops Overall production levels of the major cash crops were low for the sample households compared to the pre-war period18. This was to be expected because, as was noted earlier, most of these plantations were abandoned during the civil war. Farmers have yet to undertake full rehabilitation. Even where the crops were rehabilitated, it will take some time before full productivity is restored. The reported total income derived was highest for palm oil, followed by cocoa and coffee, in that order. Income figures for palm oil, however, seem highly exaggerated considering the average production figures reported for this crop. It is likely that farmers have underestimated their production figures for palm oil.
18 MAFFS (2003): Agricultural Sector Review (ASR)
21

Table 15: Average Quantity of Produce and Income Derived From Plantation Crops
Type Tree Crop (Plantation)
Average Size of Plantation
(Acres)
Total Production (Kg)
Total Income Obtained From Sale of Produce
(Leones)
Coffee 3.87 199.5 323,294 Cocoa 4.18 357.4 664,778 Oil Palm 3.654 49.96 1,084,348
3.7.13 Commercial Vegetable Farming Table 16 summarizes data on the population of households engaged in the farming of commercial vegetables—a small but nonetheless significant group of farmers limited almost wholly to Koinadugu District. Previous experience under the DRP and LINKS programs has taught CORAD that although commercial vegetables can be high profit crops for farmers, there is a high possibility of crop failure due to drought, disease, or insect infestation. In the household interviews, respondents were asked whether their household had planted any type of commercial vegetables. One of the challenges with developing data with regards to yield for commercial vegetables is that no standardized system of weights and measures exists in Sierra Leone. An estimated 19 volumetric measures are actively in use in markets in the Area of Operation, with the exact volumes and weights varying from one market to the next. For this reason, CORAD looked at two proxy crops to allow for the development of conversion figures.
A total of 6.2 percent of farmers stated that they had grown commercial vegetables. Table 16: Population of Households Engaged in Commercial Vegetable Farming
Tomatoes Potato Leaves Total
Number of HH 121 100 221
Percent (%) of sample 3.4 2.8 6.2
3.7.14 Production of Commercial Vegetables
As noted, the production of commercial vegetables was low, although significant income was noted among farmers. As noted in Table 17, although farmers realized an income of nearly $200 US from the sale of commercial vegetables, not many farmers grew and sold these crops. The main reasons for this have to do with the growing climate; however, market access may be another significant factor.
22

Table 17: Average Quantity of Produce and Income Derived From Commercial Vegetables
Type Tree Crop (Plantation)
Total Production (Kg)
Total Income Obtained From Sale of Produce
(Leones)
Tomato 3.2 698,929.54 Potato Leaves 1,909.8 305,470.25 Total 1,913.8 520.893.66
3.8 Health and Nutrition This section describes and analyzes the health and nutrition conditions in a representative sample of the project’s target population. The findings described are based on the measurement of current levels of knowledge, type of behaviors and conditions of health and nutrition related issues. The main topics covered in the study were: infant and child feeding, the child’s health status, the care provided by caregivers and neonatal and maternal health practices.
3.8.1 Child’s Nutritional Status The key outcome of interest in this section is the nutritional status of children. According to literature, malnutrition exacts a heavy burden on individuals and on society through its effects on diminished child health and increased mortality, and by its long-term negative consequences on weakened socio-economic development. The presence of malnutrition means higher rates of illness, disease, and increased risk for mortality.19
According to the Sierra Leone Health Sector Revision report, there are three major determining factors leading to malnutrition: 1. Immediate causes. These causes are attributed to inadequate food intake and diseases; 2. Underlying causes. These causes are attributed to poor household food security, lack of adequate health care and lack of adequate maternal and child health care; and 3. Basic causes. These are usually embedded in cultural, economic, social and political factors.20
3.8.1.1 Nutritional Status of Children in the Sample Population
Consistent with USAID guidelines for Food for Peace (FFP) Title II programs, this baseline survey included the assessment of underweight (weight-for-age, less than/minus two standard deviations from the mean (< -2 SD)) for children 6 to 59 months of age. Please refer to the table below for malnutrition classification levels and cut-offs. Classifications of Malnutrition for Individuals21 System Cut-off Malnutrition classification WHO < -1 to >-2 Z-scores Mild < -2 to >-3 Z-scores Moderate < -3 Z-scores Severe
19 Derek Macallan, Medicine Journal UK. Volume 33, Issue 3, Pages 1-51 (01 March 2005) Infections 1.
20Sierra Leone Health Sector Review, 2004. By Dr. Akim Gibril, Dr. Tom Kargbo, Dr. Bailah Leigh and Andy O’Connell. 21 Cogill, Bruce. Anthropometric Indicators Measurement Guide. Food and Nutrition Technical Assistance Project, Academy for Educational Development, Washington, DC, 2003, p. 42.
23
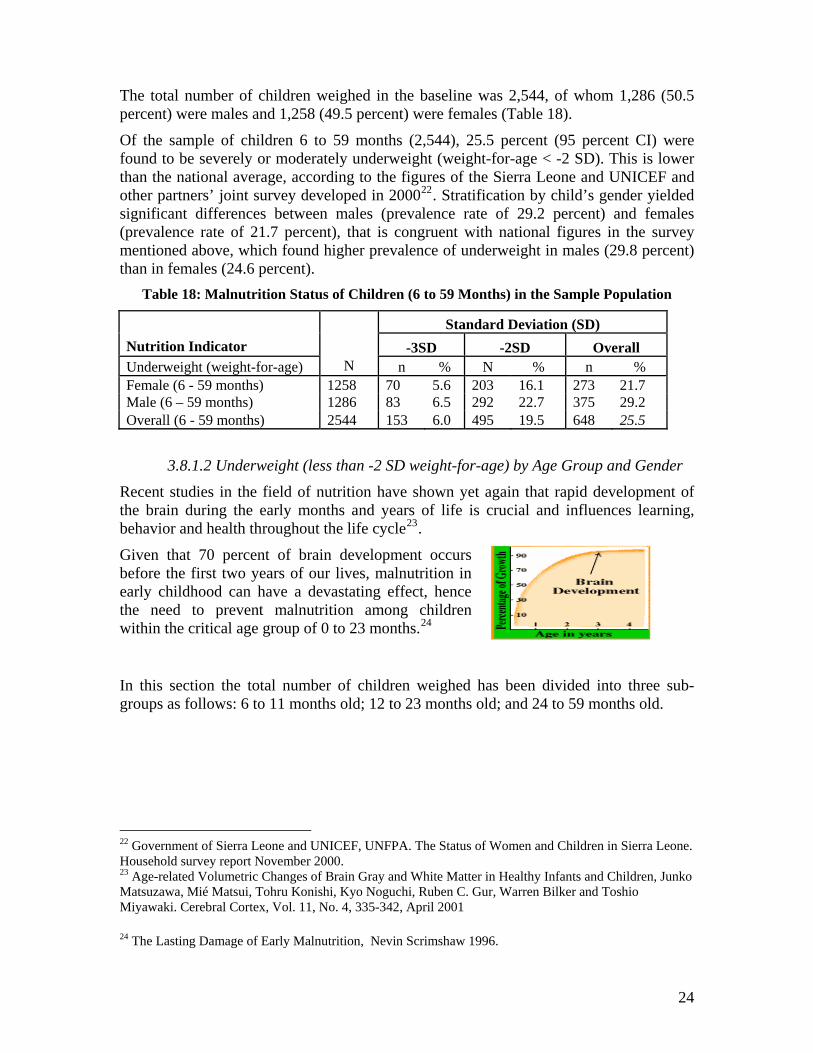
The total number of children weighed in the baseline was 2,544, of whom 1,286 (50.5 percent) were males and 1,258 (49.5 percent) were females (Table 18).
Of the sample of children 6 to 59 months (2,544), 25.5 percent (95 percent CI) were found to be severely or moderately underweight (weight-for-age < -2 SD). This is lower than the national average, according to the figures of the Sierra Leone and UNICEF and other partners’ joint survey developed in 200022. Stratification by child’s gender yielded significant differences between males (prevalence rate of 29.2 percent) and females (prevalence rate of 21.7 percent), that is congruent with national figures in the survey mentioned above, which found higher prevalence of underweight in males (29.8 percent) than in females (24.6 percent).
Table 18: Malnutrition Status of Children (6 to 59 Months) in the Sample Population
Standard Deviation (SD) Nutrition Indicator -3SD -2SD Overall Underweight (weight-for-age) N n % N % n % Female (6 - 59 months) 1258 70 5.6 203 16.1 273 21.7 Male (6 – 59 months) 1286 83 6.5 292 22.7 375 29.2 Overall (6 - 59 months) 2544 153 6.0 495 19.5 648 25.5
3.8.1.2 Underweight (less than -2 SD weight-for-age) by Age Group and Gender
Recent studies in the field of nutrition have shown yet again that rapid development of the brain during the early months and years of life is crucial and influences learning, behavior and health throughout the life cycle23.
Given that 70 percent of brain development occurs before the first two years of our lives, malnutrition in early childhood can have a devastating effect, hence the need to prevent malnutrition among children within the critical age group of 0 to 23 months.24
In this section the total number of children weighed has been divided into three sub-groups as follows: 6 to 11 months old; 12 to 23 months old; and 24 to 59 months old.
22 Government of Sierra Leone and UNICEF, UNFPA. The Status of Women and Children in Sierra Leone. Household survey report November 2000. 23 Age-related Volumetric Changes of Brain Gray and White Matter in Healthy Infants and Children, Junko Matsuzawa, Mié Matsui, Tohru Konishi, Kyo Noguchi, Ruben C. Gur, Warren Bilker and Toshio Miyawaki. Cerebral Cortex, Vol. 11, No. 4, 335-342, April 2001
24 The Lasting Damage of Early Malnutrition, Nevin Scrimshaw 1996.
24

Table 19: Percentage of Children Weighed by Age Group
Age group (months) Number of
children Percentage 6 – 11 587 23.07 12 – 23 857 33.69 24 – 59 1100 43.24 Total 2544 100.00
For all the children weighed, a total of 495 were found to be moderately malnourished. Of this total, 20 percent were in the age group 6 to 11 months, 39 percent were between 12 to 23 months, and 41 percent were in the 24 to 59 months age group (Figure 8).
Fig 8: Moderately Malnourished by Age (in Months)
While children aged 6 to11 months were infrequently found to be moderate underweight (99 children/3.9 percent of sampled children), the prevalence of this level of malnutrition increases rapidly for the two successive age groups. The percentages increase by almost 19 points for children 12 to 23 months, and by an additional 2 points for children 24 to 59 months. This rise in prevalence is at its highest peak among the age group of 12 to 23 months and levels off before five years. Overall, about 60 percent of moderately malnourished children in the sample were less than 2 years of age, and thus still within the critical growth period (Figure 7).
3.8.1.3 Underweight (Severe -3SD) by Gender and Age
Table 20 presents data on the percentage of children severely malnourished based on weight-for-age index. According to the data, the prevalence rate of severely underweight is lower among females (5.6 percent), as compared to males (6.5 percent). This trend is also congruent with those found by at the Sierra Leone Government 2000 household survey: males 10.4 percent and females 6.8 percent.
25

Table 20: -3 Standard Deviation Units by Gender
Gender Number Percentage Male 83 6.5 Female 70 5.6 Total 153 6.0
Significant variations are observed across age groups, with 17 percent of children aged 6 to 11 months found to be severely underweight as compared to 42.5 percent for children 12 to 23 months, and 40.5 percent for the 24 to 59 months age group. The data suggest that severe underweight among children less than five years in the sample population is more prevalent among children in the 12 to 59 months age group. There were relatively few cases of severe underweight among children aged 6 to 11 months (Figure 9).
Fig 9: Severe Underweight (-3 SD) by Age Group
16.99
42.48 40.52
0 5
10 15 20 25 30 35 40 45
Percentage
6 – 11 Months 12 – 23Months
24 – 59Months
Age group (months)
As we can see in the graph above, infants in the sample population (12 to 23 months) were most likely to be severely underweight. This has clear negative implications, as malnutrition impairs children’s cognitive and physical development. Much of the damage caused at this key time of child development is irreversible. 25
3.8.1.4 Global Underweight [moderate and severe (-2 and -3SD)]
As noted in Figure 10 below, the percentage of moderately malnourished children (between 2 and 3 SD) is higher among older children. The prevalence of underweight is highest during the period of 24 to 59 months.
25 The Lasting Damage of Early Malnutrition, Nevin Scrimshaw 1996.
26

Fig 10: Global Underweight: -2 SD and -3 SD by Age Group
17.8
43.7 38.6
0.05.0
10.0 15.0 20.0 25.0 30.0 35.0 40.0 45.0 50.0
6-11 Months 12-23 Months 24 - 59 Months
Age group (months)
By two years of age, the cumulative attacks of illness and under-nutrition are evident, with nearly 45 percent of children ages 24 to 59 months underweight. Similar to the patterns indicated by the corresponding prevalence of underweight (see Figure 9 above), the extent of malnutrition appears to have reached its peak among children by two years of age. Beyond that, however, the extent of malnutrition appears to remain relatively constant.
Based on the findings related to malnutrition in children, we can highlight the following facts: 1. There is a higher prevalence rate of global underweight in male children (29.2 percent) compared to females (21.7 percent); and 2. There are higher levels of underweight in “older” children (82.2 percent of the underweighted children are 12 months old or above).
The above data suggest that, in order to prevent child malnutrition, appropriate health and nutrition practices must begin early on in a child’s life and should be continued according to the child’s age growth and development. Specifically, these data imply that the greatest impact of interventions aimed at preventing malnutrition may be obtained by targeting children less than 24 months of age and caregiver practices related to children of this age.
3.8.2 Infant and Child Feeding Practices
Appropriate infant and child feeding practices are essential to the health and nutritional status of children. The provision of adequate energy and nutrients in a child’s diet allows for proper growth and development. Moreover, children fed appropriately are equipped with the strongest possible defense against infection and diseases. In the absence of appropriate feeding practices, inadequate energy, protein, and micronutrient intake are likely to result. As discussed earlier, this in turn, increases vulnerability to disease and
27
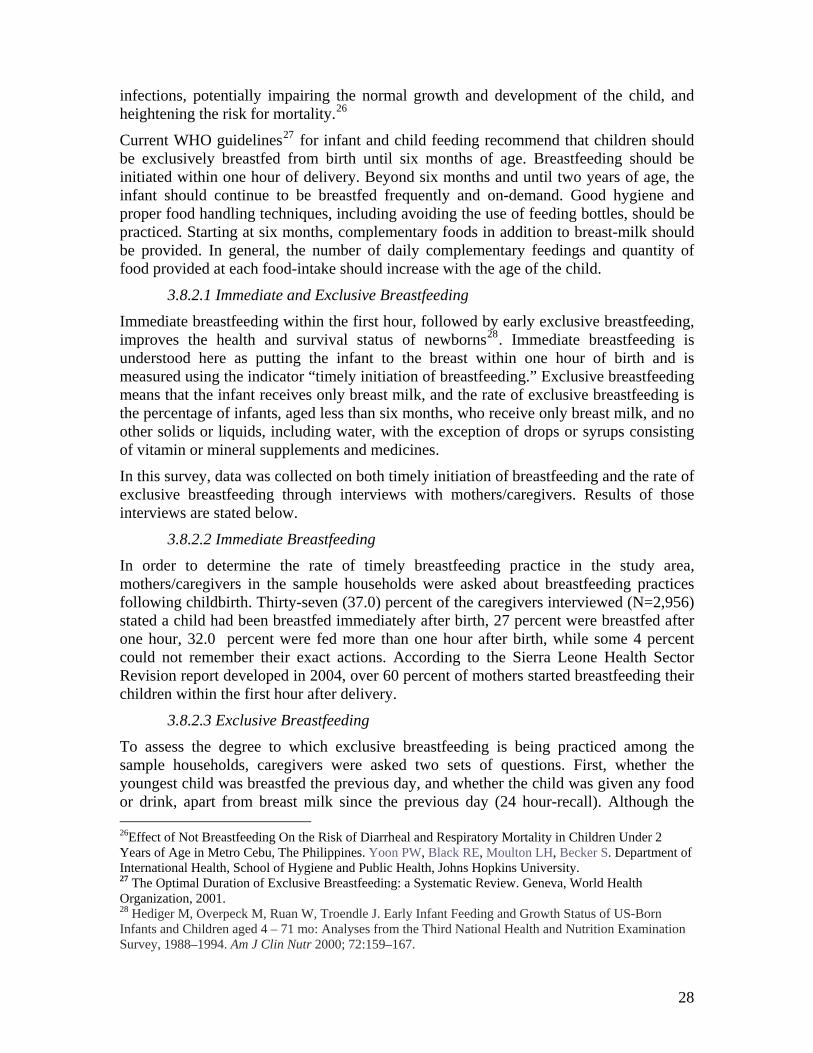
infections, potentially impairing the normal growth and development of the child, and heightening the risk for mortality.26
Current WHO guidelines27 for infant and child feeding recommend that children should be exclusively breastfed from birth until six months of age. Breastfeeding should be initiated within one hour of delivery. Beyond six months and until two years of age, the infant should continue to be breastfed frequently and on-demand. Good hygiene and proper food handling techniques, including avoiding the use of feeding bottles, should be practiced. Starting at six months, complementary foods in addition to breast-milk should be provided. In general, the number of daily complementary feedings and quantity of food provided at each food-intake should increase with the age of the child.
3.8.2.1 Immediate and Exclusive Breastfeeding
Immediate breastfeeding within the first hour, followed by early exclusive breastfeeding, improves the health and survival status of newborns28. Immediate breastfeeding is understood here as putting the infant to the breast within one hour of birth and is measured using the indicator “timely initiation of breastfeeding.” Exclusive breastfeeding means that the infant receives only breast milk, and the rate of exclusive breastfeeding is the percentage of infants, aged less than six months, who receive only breast milk, and no other solids or liquids, including water, with the exception of drops or syrups consisting of vitamin or mineral supplements and medicines.
In this survey, data was collected on both timely initiation of breastfeeding and the rate of exclusive breastfeeding through interviews with mothers/caregivers. Results of those interviews are stated below.
3.8.2.2 Immediate Breastfeeding
In order to determine the rate of timely breastfeeding practice in the study area, mothers/caregivers in the sample households were asked about breastfeeding practices following childbirth. Thirty-seven (37.0) percent of the caregivers interviewed (N=2,956) stated a child had been breastfed immediately after birth, 27 percent were breastfed after one hour, 32.0 percent were fed more than one hour after birth, while some 4 percent could not remember their exact actions. According to the Sierra Leone Health Sector Revision report developed in 2004, over 60 percent of mothers started breastfeeding their children within the first hour after delivery. 3.8.2.3 Exclusive Breastfeeding
To assess the degree to which exclusive breastfeeding is being practiced among the sample households, caregivers were asked two sets of questions. First, whether the youngest child was breastfed the previous day, and whether the child was given any food or drink, apart from breast milk since the previous day (24 hour-recall). Although the 26Effect of Not Breastfeeding On the Risk of Diarrheal and Respiratory Mortality in Children Under 2 Years of Age in Metro Cebu, The Philippines. Yoon PW, Black RE, Moulton LH, Becker S. Department of International Health, School of Hygiene and Public Health, Johns Hopkins University. 27 The Optimal Duration of Exclusive Breastfeeding: a Systematic Review. Geneva, World Health Organization, 2001. 28 Hediger M, Overpeck M, Ruan W, Troendle J. Early Infant Feeding and Growth Status of US-Born Infants and Children aged 4 – 71 mo: Analyses from the Third National Health and Nutrition Examination Survey, 1988–1994. Am J Clin Nutr 2000; 72:159–167.
28

question was answered by all caregivers in the sample households, for the assessment of exclusive breastfeeding, only those respondents (caregivers) whose youngest child was less than six months of age were included in the analysis. Thus, the total sample size for this purpose totals 446 caregivers.
Of the 446 caregivers interviewed, about 86 percent reported breastfeeding the youngest child (of 0-6 months old) during the reference period, while 14 percent did not. When those who reported breastfeeding (381), were further asked if they provided any liquid or food to the child apart from breast milk within a recall period of 24 hours, 338 reported giving some other liquid or food apart from breast milk, while 43 reported not giving any other food or liquid except breast milk. Regarding exclusive feeding, the statistics above thus suggest that only 43 out of total sample of 446 (or 9.6 percent) of children 0 to 5 months were exclusively breastfed during the last 24 hours prior to the survey (Table 21).
Table 21: Breastfeeding Practices Among Children 0 to 6 Months Old
Breast Feeding Practices
N
Number of Responses
Percentage
Breast milk only (exclusive breastfeeding) 446 43 8.50% At least water and breast milk 446 287 56.72% At least formula/milk and breast milk 446 27 5.34% At least orange juice and breast milk 446 4 0.79% At least coconut water and breast milk 446 7 1.38% At least sugar-water/beverage etc. and breast milk 446 7 1.38% At least palm wine and breast milk 446 3 0.59% At least porridge or pap breast milk 446 57 11.26% At least cerelac and breast milk 446 6 1.19% At least other (unspecified food) and breast milk 446 65 12.85% Total 506 100.00%
For caregivers who are not practicing exclusive breastfeeding, the most frequent supplement given (as recorded in Table 21) was water, cited by 64.3 percent of respondents. Other common supplements also mentioned were porridge and infant formula (12.8 percent). A significant proportion of respondents mention some other unspecified supplements (14.6 percent). The findings during the LEAD baseline reveal that a high percentage of mothers (97 percent) were breastfeeding, but few practiced exclusive breastfeeding. Another finding was that water was the most common supplement to breastfeeding: while 97 percent of the mothers were breast feeding at the time of the study, no child benefited from exclusive breast feeding. In fact 71 percent of the mothers said they gave their children water to drink right from the first day of life.”
3.8.2.4 Continued Breastfeeding
Continued breastfeeding is a widespread practice in the sample communities. Results of the survey revealed that 86.8 percent of all the children sampled between the ages of 6 and 24 months were still being breastfed at the date of interview. While continued breastfeeding is a widespread practice, the rate at which it is practiced decreases with the age of a child. The data in Table 22 show that the rate of continued breastfeeding among the sample population is highest for the children between 6 to 12 months (97.3 percent). The rate of breastfeeding declines as a child progresses in age, to 91.3 percent for children aged 13 to 18 months, and by another 19.3 percentage points as they enter the 19
29

to 23 months age group. Although levels of continued breastfeeding in sample communities are very high at one year of age (97.3 percent), fewer than 40 percent of infants in the sample are continuously given breast milk until they reach the recommended age of 24 months. This finding is close to the UNICEF figure that reports that only 56 percent of children 20 to 23 months are still breastfeeding29. Thus, the current breastfeeding patterns are still far from the recommended levels. Interestingly, however, more than one-fifth (205 children, representing 21.72 percent) of the children beyond the recommended breastfeeding age were still being breastfed at the time of the survey.
Table 22: Continued Breastfeeding Patterns Among Sample Population
Age of child Still
Breastfeeding No Longer
Breastfeeding Total
Percentage Practicing Continued
Breastfeeding 6 to 12 months 655 18 673 97.33 13 to 18 months 422 40 462 91.34 19 to 23 months 198 77 275 72.00 Exactly 24 months 41 66 107 38.32 All children (6 to 24 months) 1,316 201 1517 86.75 Breastfeeding Beyond Two Years (The Recommended Age) 25 to 59 months 205 739 944 21.72
3.8.2.5 Complementary Food
According to the UNICEF summary of indicators for Sierra Leone, 52 percent of children aged 6 to 9 months receive complementary food in addition to breast milk.30 Nevertheless, an evaluation developed by European Commission's Humanitarian Aid Office (ECHO) in 2001, revealed that weaning foods are usually introduced before 6 months and are reported nutritionally inadequate, as they tend to be high in carbohydrates with low concentrations of protein and fat31.
With regards to dietary diversity, our data show that children in the sample have poor quality diets, with average consumption of only four food groups. The median number consumed is also four different food groups. In general, complementary foods given are cereal based, as cited by more than two-thirds of caregivers. Fats and oils were mentioned by more than half (57.5 percent) of the respondents, followed by vegetables, fruits, fish/seafood, and legumes, in that order. The least consumed food types are eggs (1.9 percent), followed by meat (4.6 percent), and dairy products, including milk and cheese (6.6 percent). This seems to be congruent with ECHO’s survey finding mentioned above, except for the consumption of fats and oils.
Condiments as a food type is also commonly mentioned (60 percent of respondents), most likely as additive to enhance the taste of the other food types (Table 23). The
29 UNICEF, Countries’ Statistics at a Glance, 2006. (http://www.unicef.org/infobycountry/sierraleone_statistics html). 30 UNICEF, Countries’ Statistics at a Glance, 2006. (http://www.unicef.org/infobycountry/sierraleone_statistics html). 31 Final Report ECHO/EVA/210/2001/01011 5 Health, Nutrition, Water and Sanitation Sectors.
30

composition of complementary foods appears to be relatively low in animal protein, including dairy products, which are an important nutrient source for growth. Similarly, energy dense food such as sugar and honey are not commonly given to children below five years.
Table 23: Complementary Food Groups Consumed by Children 6 to 59 months
Dietary Diversity Score (DDS) for children 6 to 59 months 4.0
Complementary Food Groups Percent of
respondentsCereals: rice, bulgur, bread, wheat, noodles 76.8 Roots and tubers: potatoes, yams, cassava 17.6 Vegetables: edible leaves, wild herbs, mushrooms 49.2 Fruits: bananas, mangoes, papayas 45.7 Meat: beef, pork, lamb, goat, chicken, bush meat 4.6 Eggs 1.9 Fish, crabs, sea food 44.0 Legumes: beans, benni, peas, lentils, groundnuts 33.9 Dairy products cheese, milk 6.6 Fats and oils: palm oil, other oils and butter 57.5 Sugar or honey 10.9 Condiments: pepper, salt 60.1
3.8.3 Child Health Appropriate prevention and treatment of infection and diseases are essential to protect a child’s nutritional status. Similarly, children who are malnourished are not as resistant to illness, disease and infections. Children’s health status is therefore both an underlying causal factor and a related outcome of malnutrition. According to the World Health Organization: Poor nutrition contributes to 1 out of 2 deaths (53 percent) associated with infectious diseases among children aged under five in developing countries (see graph)32 The 2004 report of the Health Sector revision states that the interaction between nutrition and infection among children and their mothers is of great concern in Sierra Leone. In fact it is estimated that about half of all deaths in children are attributed to malnutrition.
3.8.3.1 Childhood Immunization
Child immunization is one of the most cost-effective public health interventions for reducing child morbidity and mortality. The goal of immunization programs is to reduce the incidence of vaccine-preventable diseases in children by means of high coverage with potent vaccines administered at the appropriate age. The “principal” diseases normally 32 WHO, Nutrition for Health Initiative (Challenges).
31

targeted are poliomyelitis, diphtheria, pertussis and tetanus (DPT), tuberculosis (BCG), and measles.
Although immunization is recognized as one of the best investments in health according to ECHO, there are structural and contextual constraints that affect immunization delivery in Sierra Leone, in particular, the poor Ministry of Health and Sanitation capacity at the field level and the lack of adequate monitoring and follow-up systems for EPI.
EPI in Sierra Leone is implemented at static clinics and during National Immunization Days (NIDs). Immunization services rely upon the availability and quality of resources such as cold chain equipment, vaccines, and injection equipment, as well as the correct usage of these supplies and equipment. While UNICEF’s interim report does not provide detailed information of what has been achieved, field visits indicate that, in most instances, routine immunization is virtually non-existent and poorly conducted. Obviously the NIDs campaigns are diverting significant resources from the strengthening of routine systems, but poor planning and irregular transport from the MoHS are also negatively affecting the supply of the correct items and vaccines at district level.33
Data was collected on immunization using only growth cards, because it commonly held that recall data is less reliable than observational data documented on a health card. All caregivers in the sample were asked to show their child’s growth card.
When asked to present their child’s vaccination cards, about 82.0 percent of respondents were able to show them, while 13.0 percent stated they have never taken a card for the child, and 4.0 percent reported they had a card but they lost it. (Figure 11).
Fig 11: Proportions of Children With and Without <5 Card on Day of Interview
Fig 11: Proportions of children with and Without <5 card on day of interview
82%
13% 5%Have <5 card
Don't have <5 card
Had one but got lost
Information provided on each growth card regarding immunization and vitamin A capsule supplementation was recorded during the household interview.
Figure 11 below details immunization coverage proportions by vaccination type, stratified by child’s gender. The data show immunization coverage exceeding 80 percent for BCG, Polio-0, Polio-1 and DPT-1. The records also showed that more than two-thirds 33 Final Report ECHO/EVA/210/2001/01011 5 Health, Nutrition, Water and Sanitation Sectors.
32

of the children sampled between the ages of 0 to 59 months received Polio 2&3, and DPT 2&3, as depicted in Figure 12. Measles has the least coverage, of less than 60 percent of the sample population.
Fig 12: Distribution of Children 0 to 59 Months by Type of Vaccination and Gender
Distribution of children 0-59 months by type of Vaccination and gender
0.0
20.0
40.0
60.0
80.0
100.0
120.0 B
CG
PO
LIO
-0
PO
LIO
-1
PO
LIO
-2
PO
LIO
-3
DP
T -1
DP
T -2
DP
T- 3
ME
AS
LES
VIT
AM
IN A
Vaccines
Perc
enta
ge o
f chi
ldre
n im
mun
ized
Male FemaleOverall
Full immunization refers to the number of children aged 6 to 59 months who received Polio-3, DPT-3, and measles vaccines, according to records on growth cards. Using this more restrictive indicator, about two-thirds (60 percent) of the children 9 to 59 months in the sample population were found to be fully immunized, without significant differences between males and females. According to an evaluation conducted by ECHO in 2001, the full immunization coverage among children 12 to 23 months old was estimated at 39 percent at the national level, and that the tetanus toxoid (TT) coverage for women is not known with precision. The ECHO study does not; however, specify what criteria were used to define full immunization.34
34 Final Report ECHO/EVA/210/2001/01011 5 Health, Nutrition, Water and Sanitation Sectors.
33

Fig 13: Status of Immunization among Children 9 to 59 Months by Gender
Status of immunization among children 9-59 months by gender
0.010.020.030.040.050.060.070.0
Male Female Overall
Gender of child
Per
cent
age
Not Fully ImmunizedFully Immunized
3.8.3.2 Vitamin A Supplementation
According to WHO, deficiencies in Vitamin A have various negative implications for a child’s health and nutritional status. The potential consequences of Vitamin A deficiency include diminished cellular integrity, immuno-competence, and increased mortality risk35. Clinical Vitamin A deficiencies often manifest themselves through defects in ocular tissue, causing negative changes in vision (e.g. night blindness) and potential corneal disease (e.g. corneal xerosis, ulceratation or keratomalacia)36.
According to current WHO guidelines, Vitamin A capsule supplementation in developing countries is recommended for children 12 to 59 months; they should receive 200,000 IU as a single dose every six months. During the household interview, under-five growth cards were observed for vitamin supplementation. Among those children having a health card in the sample population, 43.1 percent were indicated to have received a Vitamin A capsule supplement at some point in the past (see Figure 12).
The Sierra Leonean Health Sector Review carried out in 2004 revealed that an estimated 40 percent of children under five years of age suffer from Vitamin A deficiency. Despite mass campaigns during the National Immunization Days, Vitamin A supplementation reached only 64 percent of the children under five and 33 percent of women after delivery in 2000.37
3.8.3.3 Prevalence and Management of Acute Illnesses
Appropriate prevention and treatment of infection and disease are essential to protecting a child’s health and nutritional status. In the presence of infection and disease, appetite as well as the absorption and utilisation of nutrients may diminish. Similarly, children who are malnourished are not as resistant to illness, disease, and infection. Children’s health
35 (Underwood 1998) 36 WHO 1996. 37Sierra Leone Health Sector Review, 2004. By Dr. Akim Gibril, Dr. Tom Kargbo, Dr. Bailah Leigh and Andy O’Connell.
34

status is therefore both an underlying causal factor, and a related outcome of malnutrition.38
The baseline survey collected information on the practice of caretakers with respect to the status of children’s health. Specifically, data were collected on the prevalence of fever, cough, and diarrhea among children, as well as information on the type of treatment sought by caretakers when children were ill. Additionally, information was gathered on the extent to which recommended preventative and treatment practices are followed and what remedial action may be taken to improve health practices among caretakers.
3.8.3.4 Prevalence of Diarrhea
Overall, more than one-third of children in the sample were reported to have had episodes of diarrhea in the two weeks prior to the survey period. Stratification by gender shows diarrhea prevalence for girls (33.4 percent) to be slightly less than for boys (34.9 percent), though the difference is not statistically significant.
According to the statistics of the Government of Sierra Leone and the UNICEF country program of cooperation, the prevalence of diarrhea in Sierra Leone, at 14 percent, is lower than those actually found in the baseline (33 percent). Something to consider in this comparison is the possibility of seasonal effects, as rates of diarrhea tend to rise during the rainy season. The GoSL/UNICEF data was collected in October/November, while the CORAD study was conducted in May.
Table 24: Breast Milk, Other Fluids and Food Intake during Diarrhea Episode
Responses Sample Breast Milk (%) Other Fluids (%) Food (%) Did not give 1040 38.6 27.7 33.5 Gave as usual 1040 30.9 27.9 25.9 Gave less than usual 1040 21.9 17.4 34.9 Gave more than usual 1040 8.6 27.1 5.6
3.8.3.5 Diarrhea Management Practices
The survey sought further information concerning treatment and care seeking practices for a child that suffers from diarrhea. Caregivers were asked about breast milk, fluid and food intake during the reported diarrhea episode. About 39 percent of caregivers reported not breastfeeding their child, 30.9 percent continued breastfeeding at the usual level, and 21.9 percent decreased the level of breastfeeding. Only 8.6 percent of respondents increased breastfeeding levels.
The summary of indicators from GoSL/UNICEF reports that 31 percent of under-five children received oral rehydration and continued to be breastfed during diarrhea. This figure is equal to that found in the baseline.
In relation to the intake of other fluids, 27.7 percent of caregivers did not give any fluids to the child, 27.9 percent stated that provision of other fluids remained the same, and 17.4 percent decreased provision of other fluids during an episode of diarrhea. More than one-fifth (27.1 percent) cited increasing other fluids (Table 24).
38 Indian Journal of Pediatrics, Dr. K C Chaudhuri Foundation, co-published by Springer India.
35

Food intake during the last diarrhea episode was reduced for more than one-third of the children that suffered from a diarrhea episode, remained the same for 25.9 percent and was increased for 5.6 percent of the children. Food was not provided for about one-third of the children during diarrhea episode. According to the Global WHO Guidelines, a child suffering from diarrhea should be given more fluids in addition to normal food intake to prevent dehydration39.
According to the Centre National de la Recherche Scientifique (CNRS),40 improvement in mortality may include the implementation of a National Diarrheal Diseases Control Program and improved case management; some 55 percent of cases of acute diarrhea in Freetown now receive oral rehydration therapy. Nevertheless, the survey developed by ECHO in 2000 showed that, on the national level, during diarrhea episodes, correct home management through increased fluids was almost non-existent.
Caregivers reporting diarrhea in children were asked about their practices to manage of the diarrhea. The use of ORS, cited by 53.7 percent, was the most common practice, followed by the use of tablets (44.4 percent) and water (37.1 percent). The least frequently used practice was use of “jelly water” (coconut milk), followed by “water meresin”41. A small proportion of respondents stated that they did not provide anything when the child had diarrhea.
Fig 14: Diarrhea Management Practices
Diarrhea management practices
0.0
10.0
20.0
30.0
40.0
50.0
60.0
Nothing
Water
ORS
Water M
eres
in
Rice
pap
Table
ts
Syrup
Jelly water
Othe
r
Practices
Perc
enta
ge
When diarrhea was present, 57.2 percent of caregivers sought advice or treatment. Of those caregivers who sought treatment or advice for diarrhea, 30.4 percent did so on the same day symptoms were manifested. For almost half of the respondents, care or treatment was sought the next day, while 20.6 percent sought treatment or care after two or more days (Table 25).
39 WHO 1996. 40 A government-funded research organization, under the administrative authority of France's Ministry of Research. 41 Sugar salt solution.
36

Table 25: Treatment and Care Giving Practices for Diarrhea
Caregivers of Children Who Were Reported Sick with Diarrhea
Sought advice or treatment as
percentage of total
Sought advice or treatment
same day
Sought advice or
treatment the next day
Sought advice or treatment
after two days or more
Proportion of respondents (percent) 57.2 30.4 49.0 20.6
3.8.3.6 Prevalence of Acute Respiratory Infections (ARI)
Almost one-fourth (19.9 percent) of caregivers reported that their child had a cough with rapid breathing in the last two weeks. According to the data, girls were slightly less sick with coughs, 19.6 percent, compared with 20.3 percent for boys.
These caregivers were asked further questions regarding treatment and care seeking for coughs. Almost two-thirds of caregivers reporting a cough and fast breathing over the past two weeks sought treatment or advice (Table 26). About 31.2 percent of those seeking care did so the same day they noticed symptoms, 49.4 percent sought advice the next day and 19.4 percent did so only after two or more days.
Acute respiratory infection in Sierra Leone, according to the statistical summary of child survival indicators developed by the GoSL and UNICEF, has a prevalence rate of 11 percent. The same source of information reveals that 21 percent of suspected pneumonia cases were treated with antibiotics.42
Table 26: Treatment and Care Giving Practices for Coughs
Caregivers of Children Who Were Reported Sick with a Cough Sought advice or
treatment as percentage of total
Sought advice or treatment
same day
Sought advice or treatment the
next day
Sought advice or treatment
after two days or more
Proportion of respondents (%)
65.3
31.2
49.4
19.4
3.8.3.7 Prevalence of Fever
About half the total sample of caregivers reported that their child had fever at some time during the last two weeks. As in the case of diarrhea and coughs, these caregivers were further asked about treatment and care seeking practices. While the prevalence of fever (50.4 percent) is generally higher than that of coughs and diarrhea, the pattern of prevalence in terms of gender remains more or less the same for all three types of illnesses. With fever, prevalence was again not significantly different between girls (49.9 percent), and boys (51.1 percent).
When asked about whether they had sought treatment for reported fever within the past two weeks, 68.3 percent of respondents stated that they did so (Table 27). More than one- 42 GoSL/UNICEF Country Program of Cooperation. http://www.unicef.org/wcaro/WCARO_SL_FactSheet_ChildSurvivalIndic.pdf.
37

third (36.6 percent) of these children were brought for care the same day the symptoms for fever were recognized. Almost half (51.0 percent) sought care the next day, and 13.4 percent did so only after two or more days.
Table 27: Treatment and Care Practices for Fever
Caregivers of Children Who Were Reported Sick with Fever
Sought advice or treatment as
percentage of total
Sought advice or treatment
same day
Sought advice or
treatment the next day
Sought advice or treatment
after two days or more
Proportion of respondents (%)
68.3 36.6 51.0 13.4
3.8.3.8. First Source of Heath Care and Treatment Services for Childhood Illnesses
Table 28 summarizes sources of care and treatment services sought by caregivers during the period of a child’s illness. More than 50 percent of caregivers who sought advice or treatment reported first taking the child to a clinic or Peripheral Health Unit (PHU), while district hospitals were also a common source for health care and treatment for diarrhea (14.7 percent), fever (14.0 percent) and cough (16.8 percent). Traditional Birth Attendants (TBAs) and traditional healers are also a frequent source of treatment and care, especially for diarrhea and fever. These findings provide information about common reference sources for a child’s health and treatment of childhood illnesses. The results show that the majority of caregivers are using the clinics and PHUs. However, the fact that a substantial proportion of caregivers are seeking advice and treatment from traditional and non-certified medical sources implies that clinics and PHUs are not being optimally utilized.
Table 28: Sources of Treatment for Childhood Illnesses (Diarrhea, Fever and Cough)
Service Provider Diarrhea (%) Fever (%) Cough (%) District hospital 14.73 14.05 16.83 Clinic/PHU 53.00 56.44 63.38 Drug store or pharmacy 2.06 3.64 3.59 TBA 7.50 3.51 1.93 Traditional healer 3.33 2.62 1.79 Blue flag volunteer43
1.18 2.71 0.41 Drug peddlers 17.17 14.20 11.10 Other 1.03 2.83 0.97
Caregivers who did not go to the hospital, clinic or PHU for treatment of their child’s illness were asked to give a reason. As shown in Table 29, costs of consultations/medications seem to be the most important factor, accounting for more than 50 percent of responses for each of the disease or illness type, followed by distance to the
43 Someone who has received training in Oral Rehydration Therapy.
38

health facility. Overall, caregivers have trust in institutional health service providers, but they appear unable to utilize the services, largely due to economic reasons.
Table 29: Reasons Given by Caregivers for Not Utilizing Hospital/PHU/Clinic
Percent of caregivers by type of illness Factors Diarrhea Fever Cough Cost of consultation/medications 58.05 62.66 61.26 Distance to health facility 33.66 24.68 28.83 Don't trust nurses/doctors 0.49 0.95 0.90 Other 7.80 11.71 9.01 Total 100.00 100.00 100
3.8.3.9 Knowledge of Causes and Prevention of Malaria
Malaria, often manifested by fever, is a major disease and one of the leading causes of mortality for children under five years of age. Malaria accounts for the greatest disease burden in Sierra Leone, accounting for more than one-third of all out-patient medical visits. During district consultations for this review, it was reported as the top cause of illness in all districts. In the recent household survey of those people that were sick in the past year, malaria was the illness suffered most, at 39.3 percent, with women reporting slightly higher rates than men: 52.1 percent versus 47.9 percent.44
During the household interview, all caregivers were asked about malaria knowledge as well as mosquito net ownership and its use. More than half (57.0 percent) of respondents identified a mosquito bite as a cause for malaria. However, a very large proportion (37.2 percent) of the sample population stated that they did not know what causes malaria.
Approximately 12.0 percent attributed causes of malaria to incorrect factors or activities. These results have implications regarding the need for effective health education in the rural areas. As the survey was conducted at the onset of the rainy season, it was expected that problems of malaria would increase in the months following.
Fig 15: Respondents’ Knowledge of Causes of Malaria
0
20
40
60
percentage
Respondents Knowledge on causes of malaria
Series1 57 3.1 2.1 0.1 0.3 2.6 2.9 37.2 6.3
Mosquito bites
Eating Orange
Eating oil
Sharing blade
palm wine
Eating mango
Bed bugs
Don’t Know
Other
44 Sierra Leone Health Sector Review, 2004. By Dr. Akim Gibril, Dr. Tom Kargbo, Dr. Bailah Leigh and Andy O’Connell.
39

When asked about the measures to prevent malaria, more than 50 percent of respondents correctly identified the use of Insecticide Treated Bed Nets (ITNs) as a preventive measure against malaria. Another 22 percent of respondents also identified environmental sanitation as one of the measures to prevent malaria. A large proportion (39.9 percent) of the respondents, similar to those who did not know the causes of malaria, also stated that they do not know how to prevent malaria.
Fig 16: Respondents’ knowledge of Prevention of Malaria
0
20
40
60
percent
Respondents knowledge on prevention of malaria
Series1 54.9 2.6 22.8 39.9 5.5
Use of bed nets/ITN
Preventive Rx Preg.
Environmental sanitation
Don’t know Other
ITNs have been shown to reduce the incidence of malaria episode by half, and in malaria endemic areas the widespread use of ITN can be expected to reduce all childhood malaria cases by about one fifth.45 Respondents were asked about ownership and use of ITNs in their households: overall, 74.3 percent of households had a mosquito net in their home. According to UNICEF country statistics, approximately 20 percent of children were reported to sleep under a mosquito net, but only 5 percent sleep under a treated mosquito net.46
When households with mosquito nets were asked about the person(s) who used it the night before, the vast majority (88.3 percent) cited children less than five years of age. The survey did not (via demonstration or other means) ask households to demonstrate their use of the bed net, which means that there is no way to draw a conclusion about whether they are used properly. It would; however, for CORAD field staff to gather information on this point and provide training to those using nets if they are found to be using them improperly. Unfortunately, pregnant women, who are also very vulnerable to malaria, are not frequent users of ITNs.
45 Technical Reference Materials Malaria, PVO Child Survival and Health Grant Program, revised 2004 46 UNICEF, Countries’ Statistics at a Glance, 2006. (http://www.unicef.org/infobycountry/sierraleone_statistics html)
40

Fig 17: Users of Bed Nets in Households
0
20
40
60
80
100
Percentage
Users of bed nets in household
Series1 88.3 21.9 9.6 41.8 3.3
Children <5 yrs
Children >5 yrs
Preg. Women
Other No one
3.8.4 Neonatal and Maternal Health Several practices can contribute to reducing maternal, peri-natal and neo-natal deaths, and poor pregnancy outcomes in developing countries. Good quality prenatal care offers important preventive health benefits to the mother and her infant. The baseline survey asked mothers with children less than one year of age about maternal and newborn care. Questions related to pre-natal care, place of delivery, and assistance with delivery.
According to the report of the survey on the Status of Women and Children developed in Sierra Leone in November 2000, the infant and child mortality rates of 170/1,000 and 286/1,000, respectively, are among the highest in the world. A similar picture exists for maternal health care statistics, with an estimated Maternal Mortality Rate (MMR) of 1,800 per 100,000 live births.47 Although the number of maternal deaths about which information was collected is too small to draw conclusions, the study found that induced abortions, the distance to district hospitals at the time of obstetrical emergencies and low income are negatively affecting maternal outcomes.
The data show a high utilization rate of pre-natal services of 92.96 percent among respondents during their latest pregnancy, with more than 70 percent providing evidence by showing their Antenatal Care (ANC) cards (Table 30).
Table 30: Antenatal Care during the Last Pregnancy
Respondents (%) N=1080 Antenatal Care
No Antenatal Care Don't Know
92.96 6.48 0.56 Has a card
Verified Not verified Does not have Don't Know Responses (%) N=1080 70.09 21.57 7.69 0.65
47 Survey Report on the Status of Women and Children in Sierra Leone at the End of the Decade, November 2000, Government of Sierra Leone.
41

Mothers were asked to identify the birth location of their baby. More than 50 percent said they gave birth at home, 18.4 percent delivered at a PHU or clinic, and 14.1 percent delivered at a TBA hut. A significant proportion also delivered at other homes (11.2 percent). Only very few mothers reported delivering their baby in a hospital. Of particular concern are those mothers, though very few, who reported delivering their babies in the bush (1.3 percent).
The Government of Sierra Leone and UNICEF report on Child Survival Indicators reports that 81 percent of women received antenatal care by skilled staff. The same report reveals that 43 percent of deliveries in Sierra Leone are attended by skilled staff.
Something to highlight is the great difference between rural and urban figures. While 76 percent of deliveries in urban settings are attended by skilled staff, only 35 percent fall in the same category in rural settings.
The source does not describe whether TBAs are considered skilled staff. This is key to compare statistics with LEAD baseline findings in this area.48
Fig 18: Distribution of Caregivers by Latest Child Delivery
Distribution of caregivers by location of latest child delivery
51.57
11.2 14.1718.24
3.33 1.3 0.190
10
20
30
40
50
60
Own hom
e
Anothe
r hom
e
TBA hu
t
Clinic/
PHU
Hospit
alBus
hOthe
r
Location
Perc
ent
48 GoSL/UNICEF Country Program of Cooperation. http://www.unicef.org/wcaro/WCARO_SL_FactSheet_ChildSurvivalIndic.pdf
42

The presence of a trained health worker during delivery increases the likelihood that neonatal and post – partum infection will be prevented, and that referral to emergency health care will be made when necessary. Further, health messages are shared when a trained health worker is present at birth: the relationship between the health worker and the mother can be established and important infant feeding and core guidance can be impressed.
According to the MOHS, almost three-quarters of deliveries are attended by a TBA, and it is known that most communities have a traditional healer.49 The same source reveals that between 1995 and 2001 an average of 42 percent of births were attended by skilled health personnel.
In the survey, only 21.0 percent of women reported having a trained health worker present at delivery, and the vast majority of those (46.3 percent) were assisted by a trained TBA. Other assistance providers included untrained TBAs and friends and family members. Nearly one-tenth of respondents did not receive assistance from anyone at the time of delivery (Figure 18).
Fig 19: Distribution of Caregivers by Source of Assistance during Latest Delivery
Distribution of caregivers by source of assistance during latest delivery
9.72
21.2
46.3
14.17
7.220.93 0.46
05
101520253035404550
No one
Health
prov
ider
Train
ed TBA
Untrain
ed T
BA
Family
mem
ber/f
riend
Other
No resp
onse
Source of assistance
perc
ent
Reviewing the previous three tables shows the difference between knowledge and practice. Most mothers know they should seek care, but the vast majority deliver at home and often with TBAs.
49 Ministry of Health and Sanitation, “Health Status in Sierra Leone,” 2004.
43

4.0 Conclusions and Recommendations 4.1 Conclusions This report has attempted to analyze information collected through the LEAD baseline survey on the socio-economic and health/nutritional status of the populations, households, and communities in the areas targeted by the LEAD Program. Specifically, it has provided baseline values for indicators in a wide range of areas, including: livelihood activities, food security, including dietary diversity and food production, health, nutrition, and potable water. The findings from this study are expected to be used as the benchmark against which progress made by the CORAD group in the target communities can be established.
The average farm output of the main food crops is low compared to the potentials identified by FAO and other agencies, with, for example, rice production at an average of 272 kg per acre among the sampled households compared to the 800 kg per acre identified as the production capacity in the FAO study. This translates into low incomes derived from agricultural goods and insufficient crop stores to sustain the community members throughout the year, as is demonstrated by the high number of households that say they do not have adequate food all year long. According to the data, a large proportion (97 percent) of the sample households were unable to access sufficient quantities of food for one month or more, with the mean number of months of inadequate food at 4.6. The most crucial time with respect to household food insecurity is the “hunger gap” period of June to October. Households in the sample, however, had fairly diversified diets (an average of 7 food groups consumed by sampled households), which may be attributed to seasonal availability of certain types of food at the time of the survey. Yields for rice, the main staple cereal crop, were found to be well below their theoretical potential, which is defined as yield of the same crop obtained by researchers under farmer conditions and figures obtained through recent nationwide farm production and household food security surveys, jointly conducted by MAFFS, FAO, and WFP in 2005 and 2007. In both studies, the district level average yield reported for inland valley swamp rice, for instance, ranged between 440 kg/acre to 600 kg/acre. When grown on a researcher/farmer managed on-farm plot, inland valley swamp rice produces about 2.0 MT/hectare, which translates to approximately 800 kg per acre50. The average weight reported by our sample farmers for the same crop (272.0 kg) is only about 34 percent of the potential yield of this crop. Reducing this gap should continue to be a pressing priority for future food security interventions.
Occupations in the communities mainly revolve around agriculture, with crop production being the predominant element of the farming systems. Aside from this, the local economies of the sample communities are not very diversified: other activities such as wage labor, trading, remittances, and value added processing only involve small proportions of the populations. Male-headed and female-headed households derive income from similar sources, but some differences were noted, in particular with respect to wages from local employment, which tends to be dominated by male-headed households, and the cultivation and sale of commercial vegetables, which appear to be
50 Wonneh, LMA and Huss, W (1993-1995): Annual Reports, Farming Systems Research Division, Rice Research Station Rokupr.
44

dominated by female-headed households. Families also rely on remittances from relatives and friends for income.
Post-harvest losses appear to be considerable among the farm households in the sample, and are one of the main factors constraining productivity and food security of the households. The findings regarding drying floors are mixed, but do suggest that, where available, farmers are using them to overcome the challenges of post harvest losses.
The use of improved technologies, other than crop varieties, was found to be very low among the sample farmers. While farmers were not asked specifically about the factors that may be preventing them from adopting technologies, it is worth mentioning that the chiefdoms targeted by the LEAD program have had very limited access to agricultural extension services in the past.
Marketing of agricultural produce is an important activity among the sample households. The most commonly sold food crops were cassava and groundnuts, with approximately 60 percent and 81 percent of households engaged in the sale of cassava and groundnuts, respectively. Groundnut sales, overall, attracted the highest volume of income. Relatively fewer households were engaged in selling upland rice (24.9 percent) and IVS rice (19.7 percent) harvested during the last season, most likely due to the low production gained from both types of rice, along with the need to satisfy household demand for the crop (rice being the main staple of the communities in the study area).
Regarding health, the target communities appear to be suffering from a high prevalence of diseases, particularly among children under five years of age. More than three out of four children aged 0 to 59 months were reported to have some sort of illness or disease such as a cough, fever or an episode of diarrhea in the two weeks prior to data collection. This could have a significant bearing on the nutritional status of these children, as well as other health implications, such as anemia.
Although breastfeeding is common, exclusive breastfeeding is not widely practiced in the sample population. Slightly less than one in 10 children (9.6 percent) 0 to 6 months is exclusively breastfed. The use of liquids and food other than breast milk is common among children of that age group. The initiation of breastfeeding is also delayed as only one out of three mothers initiate breastfeeding within one hour of delivery.
The average prevalence of underweight for children 6 to 59 months is 25.5 percent. This figure varies by other age groups, with prevalence rates of 41 percent among children aged 24 to 59 months, 39 percent for children 12 to 23 months, and 20 percent for those within the age group of 6 to 11 months. These anthropometric data provide critical information regarding the targeting of not only nutrition and health, but also food security interventions in the populations sampled.
4.2 Recommendations Several program implications and actions for improving the situation of the surveyed communities have been identified following the analyses provided in this report. Those are summarized below, looking at each sector in turn.
With regards to the general orientation of the food security intervention, it is essential to promote diversification of income, as focusing on crop production alone to improve access to food will not be sufficient.
45
46
With regards to agriculture itself, it was noted that total farm output and productivity are low; hence it is necessary to identify the key constraints affecting agricultural performance in the target areas and implement activities that will help farmers to overcome their production constraints.
The presence and use of Farmers Field Schools as a framework for agricultural extension appears to be a promising approach, although more research is needed to understand what effects the FFS are having on agricultural performance in their communities.
Post-harvest losses were reported by a large percentage of respondents. Where possible, communities will need to be supported with facilities and services to minimize those losses.
Female-headed households were found to be less productive than male-headed ones. Extension programs should therefore include features that make them more gender-friendly. For instance, supporting crops that offer opportunities for value added processing and marketing may be a good way to improve the economic situation of female-headed households in the target communities.
With regards to health and nutrition a series of interventions may be recommended, each targeting a particular aspect of health and nutrition.
To improve the diet of children, breastfeeding should be promoted throughout the first six months of life and continued until the child reaches two years of age, and initiated within one hour after delivery. Among children aged 12 to 24 months, complementary foods should be introduced, and the variety of food groups offered to all groups should be increased, especially to include protein.
To improve child health, access to immunization services including Vitamin A supplementation should be increased. Counseling in the comprehensive treatment of child illness, particularly diarrhea, across age groups and in child feeding practices following episodes of sickness should be strengthened.
To improve resources for care and support, the target group for behavior change messages should be expanded to include other relatives. Also, achievements in pre-natal care should be supported, and expectant mothers should have increased access to trained health providers at delivery. Women should also be reached to emphasize post-natal visits, and the access to post-natal care services, including Vitamin A supplementation should be increased.