Baseline research findings on fishers and seafood workers ... · Moving towards decent work in the...
84
Baseline research findings on fishers and seafood workers in Thailand
Transcript of Baseline research findings on fishers and seafood workers ... · Moving towards decent work in the...
Baseline research findings on fishers and seafood workers in Thailand
Copyright © International Labour Organization 2018First published 2018
Publications of the International Labour Office enjoy copyright under Protocol 2 of the Universal Copyright Convention. Nevertheless, short excerpts from them may be reproduced without authorization, on condition that the source is indicated. For rights of reproduction or translation, application should be made to ILO Publications (Rights and Licensing), International Labour Office, CH-1211 Geneva 22, Switzerland, or by email: [email protected]. The International Labour Office welcomes such applications.Libraries, institutions and other users registered with a reproduction rights organization may make copies in accordance with the licences issued to them for this purpose. Visit www.ifrro.org to find the reproduction rights organization in your country.
ISBN: 978-92-2-030691-8 (print); 978-92-2-030692-5 (web pdf)
Also available in Thai: ข้อค้นพบจากการศึกษาเส้นฐานเกี่ยวกับแรงงานประมงและอาหารทะเลในประเทศไทยISBN 978-92-2-030691-8 (print); 978-2-030692-5 (web pdf)
The designations employed in ILO publications, which are in conformity with United Nations practice, and the presentation of material therein do not imply the expression of any opinion whatsoever on the part of the International Labour Office concerning the legal status of any country, area or territory or of its authorities, or concerning the delimitation of its frontiers.
The responsibility for opinions expressed in signed articles, studies and other contributions rests solely with their authors, and publication does not constitute an endorsement by the International Labour Office of the opinions expressed in them.
Reference to names of firms and commercial products and processes does not imply their endorsement by the International Labour Office, and any failure to mention a particular firm, commercial product or process is not a sign of disapproval.
Information on ILO publications and digital products can be found at: www.ilo.org/publns.
Photos: © ILO/V. Sankham; © ILO, page ii, ivPrinted in Thailand

Ship to Shore RightsBaseline research findings on fishers and seafood workers in Thailand


iBaseline research findings on fishers and seafood workers in Thailand
Foreword Moving towards decent work in the fishing and seafood industry
In its 2017 Global Estimates of Modern Slavery report, the International Labour Organization (ILO) estimated that nearly 25 million workers in 2016 were in some form of slavery. One in ten of those workers was in the fishing and agriculture industries.
The global interest in ending forced labour in the fishing and seafood industry picked up steam in recent years, with Thailand at the forefront. This attention has helped to produce important changes in the past three years, and more is planned. The ILO Ship to Shore Rights Project (funded by the European Union) set out to support the Thai Ministry of Labour and other agencies, along with employers’ and workers’ organizations, in making the necessary changes – stronger laws, including protection against forced labour, more effective labour law enforcement, organizing workers and protecting their rights, and advancing good labour practices on board Thai fishing boats and in seafood processing plants.
With so much at stake for workers, employers, regulators and buyers of Thai-produced seafood, tracking real progress towards decent work in the industry is vital. The new research presented in this publication shows some progress. For example, more workers reported having written contracts in 2017 than a few years ago, and reports of underage workers in fishing were rare. But some abuses persist. For example, one third of workers in Thai fishing or seafood processing covered by the research reported being paid less than the minimum wage. One quarter of the fishers reported that some of their pay was withheld from them for months. This last measure is especially important because withholding wages from workers is an ILO indicator of forced labour. Sustainable Development Goal 8 is about achieving decent work for all, and the data in this report indicate that further progress needs to be made to realise decent work in the fishing and seafood sector. Adding to the pressures for an end to forced labour and other abuses in Thai fishing and seafood processing is the demand from some buyers of Thai – produced seafood around the world for fair labour practices in their supply chains. When buyers use their sourcing power to reward decent work, Thai seafood suppliers will see that remaining competitive in this global industry means more than low prices and high quality, it also means achieving decent work for all workers.
Graeme BuckleyDirector, ILO Country Office for Thailand,
Cambodia and Lao People’s Democratic Republic


iiiBaseline research findings on fishers and seafood workers in Thailand
Contents
Foreword i
Acknowledgements v
Summary 1Indications of progress 3
Persistent labour abuses 4
Measures of compliance 5
Baseline findings 91. Where the survey looked 9
2. Profile of surveyed workers 11
3. Recruitment experiences 13
4. Wages and deductions 21
5. Working and living conditions 26
6. Forced labour indicators 33
7. Seeking help and reporting grievances 39
Baseline recommendations 45
Annex I Baseline research methodology 49
Annex 2 Comparative literature 51
Annex 3 Survey questionnaire 53
Annex 4 Extension questionnaire 71
Ship to shore rightsiv
TablesTable 1. Legal compliance, by sector 6Table 2. Location of survey interviews, by sector 10Table 3. Worker profile, by sector and nationality 11Table 4. Work conditions worse than agreed, by sex, sector and zone 17Table 5. Sector of previous employment, current employment and future employment 18Table 6. Type of wage payments, by sex and sector 22Table 7. Type of wage deductions 23Table 8. Work days and hours 27Table 9. Entitlements received, by sex and sector 28Table 10. Access to facilities, by sex and sector 31Table 11. Benefit scheme enrolment, by sex and sector 39Table 12. Sources of help 41
FiguresFigure 1. Geographical coverage 9Figure 2. Social media access 13Figure 3. Recruitment fee paid, by where it was paid 14Figure 4. Respondents who paid a recruitment fee, by where it was paid (per cent) 14Figure 5. Identity or work permit documents in hand, by sector 15Figure 6. Respondents who could recall signing a contract, by sex and sector (per cent) 16 Figure 7. Reasons for wanting to change employer, by sector 19Figure 8. Respondents paid at least minimum wage, by sex and sector 20Figure 9. Wage deductions for all respondents 24Figure 10. Wage deductions, by sector 25Figure 11. Health and safety 29Figure 12. Type of accommodation 30Figure 13. Forced labour indicators, by sector 35Figure 14. Forced labour indicators, by sex and sector 36Figure 15. Access to support services and who provided, by sector 40Figure 16. Membership in an association or interest in joining one 43
BoxesBox 1 Determining hours worked on fishing boats 26Box 2 Framework developed by ILO with forced labour indicators 34Box 3 What type of boat do you work on? 38

vBaseline research findings on fishers and seafood workers in Thailand
Acknowledgements
This report was prepared by Jason Judd and Supavadee Chotikajan of the ILO Ship to Shore Rights Project (Combatting Unacceptable Forms of Work in the Thai Fishing and Seafood Industry, funded by the European Union) and Karen Emmons, an external consultant. The findings are based on research and analysis conducted on behalf of the International Labour Organization by Daniel Lindgren and Thitaree Uaumnuay of Rapid Asia. Ship to Shore Right Project partners including the Royal Thai Government and the Ministry of Labour, employers' and workers' organizations, civil society organizations and the European Union participated in the planning and review of the research.
Technical comments were provided by Michaelle De Cock and Federico Blanco of the ILO Fundamental Principles and Rights at Work Branch, Benjamin Harkins of the ILO TRIANGLE in ASEAN Programme, and to Jittima Srisuknam of ILO country office for Thailand, Cambodia and Lao PDR.
This study was prepared with the support of the European Union. Views expressed in this report are those of the authors and contributors and do not necessarily represent those of the ILO or funding partners.
Ship to shore rightsvi

1Baseline research findings on fishers and seafood workers in Thailand
Summary
Project background
Graphic reports in recent years of human and labour rights abuses committed in the Thai commercial fishing and seafood processing industries – particularly against migrant workers – triggered dramatic reactions. The Government of Thailand, industry and workers’ groups, civil society organizations and United Nations agencies have since stepped up their efforts to redress these abuses.
The stakes are high as the commercial fishing and seafood industry contributed US$6.6 billion to Thai exports in 2014. Thailand ranked fourth among global exporters of seafood behind Viet Nam, Norway and China.1 The Thai fishing and seafood processing sectors together employed more than 600,000 workers in 2017, of whom 302,000 were registered migrant workers. The Thai fishing industry alone registered more than 57,000 migrant fishers in 2017 on approximately 6,700 commercial fishing vessels. The reactions and results of labour reform in Thailand are also of interest to Cambodia and Myanmar – home to the vast majority of these workers – and to buyers of Thai seafood, such as Wal-Mart, Costco, Tesco, Coles, Simplot, Migros, Mars and Nestlé. Also watching closely are governments in the region as they attempt to take the measure of labour practices in their own fishing industries and build labour law enforcement regimes.
Among the recent efforts to prevent and reduce unacceptable forms of work in the Thai fishing and seafood processing sectors is the Ship to Shore Rights Project, an initiative of the International Labour Organization (ILO) funded by the European Union. The project encompasses four objectives: (i) strengthen the legal, policy and regulatory framework; (ii) improve the labour inspectorate’s ability to move against forced labour and other rights abuses; (iii) improve compliance with ILO core labour standards and establish a complaints mechanism across the supply chain; and (iv) increase access to support services for workers, especially victims of labour abuses. The three-year project, which ends in 2019, began with a baseline survey of workers in Thai fishing and seafood processing in five zones where commercial fishing boats dock and seafood processing concentrates. The survey questions covered workers’ recent experience in the industry with recruitment, wages, hours, safety and health, support services, complaint mechanisms and living conditions as well as forced labour indicators and legal compliance levels. This report summarizes the findings of the survey to provide a baseline against which to measure progress in the months and years ahead.
The data in this survey can help ILO partners as well as others working to end labour abuses in the fishing and seafood processing sectors to move from reaction and anecdote to a more detailed picture of current practices in the industry. The baseline data also help us build the debate with substantiated figures, focus on priority issues and – because this research is focused more on questions of “what?” and “how much” than “why?” – identify issues and dynamics that need more investigation.
1 Food and Agriculture Organization of the United Nations: State of the world fisheries and aquaculture (Rome, 2016).

Ship to shore rights2
Research Methodology
The baseline research was conducted in March and April of 2017. A total of 434 workers were surveyed in 11 areas within Chonburi, Chumporn, Pattani, Phang Nga, Phuket, Rayong, Samut Sakhon, Songkhla, Surat Thani, Trang and Ranong provinces. Workers surveyed were divided almost evenly between those working in fishing and those in seafood processing (which included aquaculture), and came from a mix of larger and smaller employers.
On account of the nearly all-male fishing workforce, the majority of all workers surveyed were men, at 69 per cent, with 31 per cent women. They were asked about their personal demographics, how they were recruited, if they had a contract, what they earned, what their working conditions were like, hours worked, satisfaction with their accommodations, benefits received and how they reported grievances. Additionally, 16 civil society representatives were interviewed about their experiences related to fishing and seafood workers. Their comments appear throughout the report to provide useful context to a particular question or finding.
Comparisons are made between fishing work and seafood processing as well the research locations to highlight significant differences in sex, country of origin and region. Aquaculture – shrimp farms and a few crab farms – is treated here as part of seafood processing. On the whole and in relation to fishing work, the data from seafood processing and aquaculture were similar enough to treat as one sector.
The independent consulting firm Rapid Asia that conducted this survey on behalf of the Ship to Shore Rights Project has conducted similar surveys for the ILO and the International Organization for Migration in Thailand and the region, with a special focus on labour rights and practices among low-wage migrant workers. In this survey, Rapid Asia researchers found that responses provided by workers generally were consistent across regions in Thailand. The Rapid Asia researchers also found that the results are consistent with past studies on migrants from Cambodia and Myanmar. For example, the findings on recruitment fees and migration costs in this study are in line with the findings in the 2016 ILO TRIANGLE study2 on returned migrants in Cambodia and Myanmar.
The researchers worked with the civil society organizations Raks Thai Foundation and Stella Maris Seafarers’ Center, both of which have offices in the research areas and staff who are familiar with where workers work, sleep and eat. The researchers did not just go to docks to interview workers; through intercept and snowball approaches, they went to where people pray, have coffee, shop and to their homes to find respondents.
The research employed both qualitative and quantitative methods. The qualitative part allowed for more in-depth data gathering as part of the evaluation process. In this process, semi-structured interviews with 16 civil society representatives were conducted. The qualitative part helped to gain more insightful findings from relevant individuals regarding the situation and critical issues about workers in the fishing and seafood industry.
It is important to note the limitations of the research. First, the results of this study cannot be extrapolated to the entire fishing and seafood processing industry in Thailand, given that the selec-tion of respondents did not follow probabilistic sampling principles. 2 TRIANGLE: Tripartite Action to Protect the Rights of Migrant Workers Within and From the Greater Mekong Subregion From Labour
Exploitation. See ILO: Risks and rewards: Outcomes of labour migration in South-East Asia (Bangkok, 2017). The survey was conducted in 2016.

3Baseline research findings on fishers and seafood workers in Thailand
3 ILO and Asian Research Center for Migration: Employment practices and working conditions in Thailand’s fishing sector (Bangkok, ILO, 2013). The use of non-probabilistic samples and different quesionnaires makes comparison between the two studies problematic.
Second, the nature of work of fishers requires them to work under specific weather conditions and during periods of time dictated by type of vessel they worked on. The researchers were not able to stick to a pre-determined schedule for data collection and relied on individuals who were available at the time of the interview.
Third, the fishers interviewed worked on short-haul fishing boats (at sea fewer than 30 days). It proved difficult to interview fishers on long-haul fishing boats and fishers who work outside Thai waters because they return to port less frequently and there are now few Thai-flagged vessels engaged in long-haul fishing. The situation of these fishers is not captured by this survey.
Finally, the workers’ responses to the survey questions require a caveat regarding recall and perception of their working and living conditions. For instance, some workers may have signed a contract but did not receive a copy and therefore could not recall having a written contract. Or some workers may not realize they had spoken with a government official monitoring labour abuses and thus said they had never met anyone.
The baseline research results were discussed with leaders in government and with employers’ and workers’ organizations in advance of publication, all of whom – despite their different interests and perspectives – deemed the data on the whole to be representative of their experience in the industry.
Indications of progress
Since 2014, changes have been made to Thailand’s legal and regulatory framework that have contributed to positive developments. When the ILO compared responses to similar questions from the ILO 2013 survey on working conditions in Thai fishing (comparable in-depth research has been scant over the past decade), in a couple critical areas, we found indications of progress. For instance, on the question of whether a respondent has signed a contract or has a written contract, 6 per cent of fishing boat workers in the 2013 ILO survey said yes.3 In our baseline survey conducted in early 2017, 43 per cent said they recalled signing a contract. That difference suggests progress due to changes in Thai law that now require all fishing boat workers to have a written contract. Unfortunately, only 14 per cent of the respondents reported receiving a copy to keep, indicating improvements are still needed to align the situation with the requirements in Thai law and the ILO Work in Fishing Convention, 2007 (No. 188).
The makeup of wage payments to fishers has shifted since the 2013 study. Around 41 per cent of the surveyed fishers reported being paid with a “share of the catch” in 2013, but that figure declined to 22 per cent in this survey. The percentage of fishers paid a fixed wage climbed from 10 per cent in 2013 to 39 per cent in this survey. This shift from variable pay based on a share of the amount of fish caught to a promised minimum daily or monthly wage has been driven in large part by the extension in 2014 of minimum wages to fishers. The shift has helped to push up the average monthly gross wages among fishers, from THB6,483 in 2013 to THB9,980 (before deductions) in this survey

Ship to shore rights4
for an inflation-adjusted increase of 50 per cent over four years. However, the percentage of fishers reporting deductions from their wages rose from 42 per cent in 2013 to 48 per cent in 2017, and average monthly wages after deductions for fishers in this survey was THB7,730 – below the legal minimum wage.
Another possible sign of progress is the type of abuses reported. Although 12 per cent of all workers surveyed this year reported harassment or verbal abuse – and 7 per cent faced threats of violence at work – reports of physical violence were relatively few, at 2 per cent of all workers surveyed.
This survey set out to look at adult labour experiences but was prepared with a separate extension survey for any cases of possible forced labour or workers younger than 18 years. As it turned out, the researchers found only four persons younger than 18 years (less than 1 per cent of the workers surveyed) working in the surveyed sectors. This finding suggests that some new labour controls are working, including the fine of THB400,000 and enforcement attention from the Ministry of Labour for employing workers younger than 18 years in fishing or seafood processing. We look forward to the results of the forthcoming national child labour survey by the Government – the first of its kind in Thailand – in 2018.
Set up in mid-2015, the Command Centre to Combat Illegal Fishing and the 32 Port-In/Port-Out (PIPO) Centres help track the movement of fishing vessels as they depart and arrive back at ports and enforce vessel registration and the proper registration of workers. The new controls require that fishing vessels of 30 gross tonnage or more report to a PIPO Centre before leaving and re-entering a Thai fishing port. The controls include a rule that Thai-flagged fishing boats cannot stay longer than 30 days at sea. Our survey found respondents who, on average, were now at sea for nine days at a time.
Persistent labour abuses
Findings of concern begin with payment of wages. One third of workers reported being paid less than the legal minimum wage, before any deductions were made. As many as 53 per cent of respondents cited deductions made to their monthly earnings; between 20 and 37 per cent of those deductions were for things the employer should cover, such as accommodation, required clothing, safety gloves and food. In a few cases, deductions were made as punishment. Some wage penalties and advances or debt arrangements are legal under Thai law.
There was significant disparity between men and women in relation to earnings, with 73 per cent of men receiving the minimum wage or more, while only 48 per cent of the women received it. And on average, the men in seafood work were paid THB840 more than women each month. These are two of serveral key findings of gender disparities in the survey. There was also significant disparity between respondents in the East region – represented in this research by fishing and seafood workers in Rayong and Chonburi provinces – and elsewhere on wage issues. Workers in the East region reported being paid less, on average, per month (at THB8,630) and experiencing bigger deductions (at THB4,740) than the other respondents.

5Baseline research findings on fishers and seafood workers in Thailand
The combination in the fishing industry of traditional cash payments, lack of pay slips and low levels of literacy and numeracy carries big risks for workers. Added to this is a confusing mix of pay practices base wages, deductions (both legal and illegal), wage withholding, advances and share of the catch. Taken together, they create a tangled mess for workers, employers and labour officials. The new data in our survey emphasize the need for intensive and consistent enforcement of wage standards in Thai law in both fishing and seafood processing.
A second major concern spotlighted by the current survey results is evidence of ILO forced labour indicators, including deception in recruiting or contracting, wage withholding (at 24 per cent, up from 12 per cent in the 2013 ILO survey) and widespread identity document retention among fishers (at 30 per cent). The survey findings revealed higher levels of wage withholding, abusive working conditions and deception among Cambodian migrants than among migrants from Myanmar and higher levels of forced labour indicators in fishing work than in seafood processing. Only 29 per cent of the fishers reported no indicators of forced labour in their work, but as much as 56 per cent of workers in seafood processing reported no indicators.
In contrast with the 2013 ILO survey findings on working conditions in Thai fishing, which estimated forced labour at 17 per cent of fishers in the Thai industry, the research method used in this base-line study was not designed to produce an estimate of forced labour. Instead, when researchers found indicators of possible forced labour during the survey session, a semi-structured extension interview was conducted with the worker. A total of 40 such interviews were conducted to explore their experiences in more detail, wherein definite violations of labour rights emerged. Comparisons of forced labour indicators covered in both studies, including measures of wage withholding and threats of violence, are detailed in section 6.
Measures of compliance
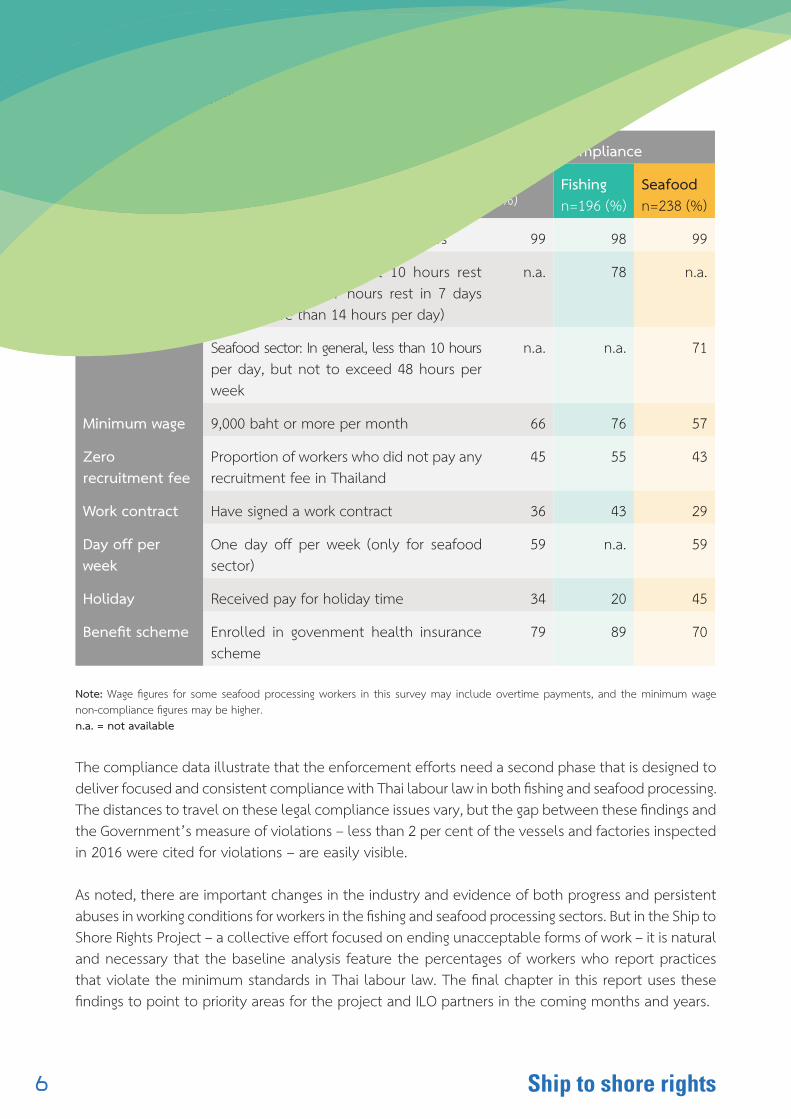
Coming after two years of intense activity and new regimes introduced by the Government of Thailand, suppliers, global buyers and civil society organizations, the data in this report take stock of those efforts. Table 1 summarizes the legal compliance rates in both industries based on the survey findings.
The data reflect the overall compliance for minimum working age, work hours, minimum wage, zero recruitment fees, work contracts and more. Results have been broken down by the fishing and seafood sectors.
Minimum working age had the highest level of compliance, with 99 per cent overall, followed by work hours. Minimum wage compliance was 66 per cent, followed by zero recruitment fees, at 45 per cent. Regarding work contracts, some 36 per cent of respondents could recall having signed a contract but fewer still said they had received a copy of the contract. Almost half of the respondents, at 48 per cent, had one day off a week, and a third (34 per cent) had paid holidays. Around 79 per cent of respondents were enrolled in the government health insurance scheme and slightly more fishing workers than seafood workers.
Ship to shore rights6
Table 1. Legal compliance, by sector
Labour law issue
Compliance withTotal n=434 (%)
Compliance
Fishing n=196 (%)
Seafood n=238 (%)
Child labour Minimum age for working at 18 years 99 98 99
Work hours In fishing sector: At least 10 hours rest in 24 hours and 77 hours rest in 7 days (or not more than 14 hours per day)
n.a. 78 n.a.
Seafood sector: In general, less than 10 hours per day, but not to exceed 48 hours per week
n.a. n.a. 71
Minimum wage 9,000 baht or more per month 66 76 57
Zero recruitment fee
Proportion of workers who did not pay any recruitment fee in Thailand
45 55 43
Work contract Have signed a work contract 36 43 29
Day off per week
One day off per week (only for seafood sector)
59 n.a. 59
Holiday Received pay for holiday time 34 20 45
Benefit scheme Enrolled in govenment health insurance scheme
79 89 70
Note: Wage figures for some seafood processing workers in this survey may include overtime payments, and the minimum wage non-compliance figures may be higher.n.a. = not available
The compliance data illustrate that the enforcement efforts need a second phase that is designed to deliver focused and consistent compliance with Thai labour law in both fishing and seafood processing. The distances to travel on these legal compliance issues vary, but the gap between these findings and the Government’s measure of violations – less than 2 per cent of the vessels and factories inspected in 2016 were cited for violations – are easily visible.
As noted, there are important changes in the industry and evidence of both progress and persistent abuses in working conditions for workers in the fishing and seafood processing sectors. But in the Ship to Shore Rights Project – a collective effort focused on ending unacceptable forms of work – it is natural and necessary that the baseline analysis feature the percentages of workers who report practices that violate the minimum standards in Thai labour law. The final chapter in this report uses these findings to point to priority areas for the project and ILO partners in the coming months and years.

7Baseline research findings on fishers and seafood workers in Thailand
Ship to shore rights8

9Baseline research findings on fishers and seafood workers in Thailand
Baseline findings
1. Where the survey looked
Who was covered in the baseline survey?
Figure 1. Geographical coverage
A total of 434 survey interviews were conducted in 11 provinces across five zones (see the map and table 2): East (Rayong Province), Central (Chonburi and Samut Sakhon Provinces, upper Gulf (Chumporn and Surat Thani Provinces), lower Gulf (Songkhla and Pattani Provinces) and Andaman (Phuket, Ranong, Trang and Phang Nga Provinces). The researchers selected respondents either only in the capital city or in a few sites within a province.
Regular and irregular migrant workers were included. But only people who had worked in the sector for at least six months prior to the field research were included in the survey.
Sex-based quotas were only applied to seafood processing due to the sex makeup of that sector. Because the commercial fishing sector employs only men on boats, only men were surveyed. By sector, the workers interviewed break down as shown in table 2. As noted previously, aquaculture findings are combined in this report with seafood processing data because – on the whole and in relation to fishing work – the data were similar enough to treat the two as one sector.
Rayong
Surat Thani
Ranong
Samut Sakhon
Pattani
Phang Nga
Chonburi
Songkhla Trang
Chumporn
Phuket

Ship to shore rights10
Table 2. Location of survey interviews, by sector
Province Fishing Seafood Aquaculture Total %
Rayong 4223
(10 women)6
(3 women)71 16
Chonburi 41 - - 41 9
Samut Sakhon -90
(51 women)10
(7 women)100 23
Chumporn 40 -4
(no women)44 10
Surat Thani -20
(9 women)7
(no women)27 6
Pattani 40 -5
(1 woman)45 10
Songkhla -20
(12 women)2
(no women)22 5
Phang Nga 164
(4 women)3
(no women)23 5
Phuket 173
(3 women)- 20 5
Ranong -20
(16 women)1
(no women)21 5
Trang -20
(17 women)- 20 5
Total 196200
(122 women)38
(11 women)434
(133 women)100
Note: In all tables, “-“ means 0. n.a. means “not applicable”.

11Baseline research findings on fishers and seafood workers in Thailand
2. Profile of surveyed workers
How old are you? How long did you stay in school? Do you have dependants?
On average, the surveyed workers were young, with most (66 per cent) aged between 18 and 34 years (table 2). And the majority (64 per cent) had fewer than six years of basic education. The completed education level was similar across the two sectors, with a marginal number of respondents in seafood jobs having more education.
In Thailand, it is legal for children aged 15–17 years to work in certain industries, such as the retail and restaurant sectors. For the fishing and seafood sectors, the minimum age for workers is 18 years. One third of the migrant worker respondents said they had started working before they were 18 – most of them first working in their home country in a range of sectors. This was more common among the workers and women from Myanmar. Approximately 15 per cent of the migrant worker respondents said they came to Thailand before they were 18. And three of the 434 respondents, or less than 1 per cent, reported that they were younger than 18 years at the time of the survey (one worker from Cambodia and two workers from Myanmar). Based on comments from the extension interviews, most of the respondents who began working in Thailand before they were 18 said their parents approved.
Around a third of the migrant workers were older than 35 years (38 per cent from Cambodia, 30 per cent from Myanmar) but just over half of workers from Thailand were over 35 (55 per cent). The largest portion of workers were aged 25–34 years (at 42 per cent overall). More than two-thirds (70 per cent) of all respondents were married at the time of the survey, and most (60 per cent) had children – on average, two children.
Table 3. Worker profile, by sector and nationality
ProfileTotaln=434(%)
Fishingn=196(%)
Seafoodn=200(%)
Aquaculturen=38(%)
Cambodian=125(%)
Myanmarn=287(%)
Thailandn=22(%)
Age
Younger than 18 1 2 1 - 1 2 -
18–24 24 20 27 21 18 28 5
25–34 42 41 40 53 44 40 41
35 or older 33 37 32 26 38 30 55
Working age
Started work before age 18
33 24 41 39 16 39 59

Ship to shore rights12
ProfileTotaln=434(%)
Fishingn=196(%)
Seafoodn=200(%)
Aquaculturen=38(%)
Cambodian=125(%)
Myanmarn=287(%)
Thailandn=22(%)
Employed in which sector
Fishing 45 100 - - 75 33 27
Seafood 46 - 100 - 22 55 68
Aquaculture 9 - - 100 3 12 5
When comparing migrant workers from Cambodia and Myanmar, some differences emerged (table 3). More respondents from Cambodia were married and had children. Respondents from Myanmar tended to be younger on average and had somewhat less education.
Where is home?
The survey respondents covered three countries: Thailand (22 workers, or 5 per cent), Cambodia (125 workers, or 29 per cent) and Myanmar (287 workers, or 66 per cent).
The Cambodians who were surveyed were far more likely to be in fishing (at 75 per cent) than respondents from Myanmar (at 33 per cent). Only 27 per cent of the 22 Thai workers surveyed were in fishing.
More of the migrants from Myanmar were in seafood work (at 55 per cent) than from Cambodia (at 22 per cent). These findings echo previous studies that also found significantly more workers from Myanmar in the seafood sector, with the vast majority of Thai workers typically employed in the seafood sector (at 68 per cent).
Within the seafood processing sector, Myanmar migrants made up 80 per cent of the survey respondents, Thais 7 per cent and Cambodians 13 per cent. These proportions reflect a similar makeup of the sector’s workforce from previous surveys. However, the rough parity between the Cambodian and Myanmar respondents in fishing (at 48 per cent) suggests a shift towards Cambodian workers from the ILO 2013 survey in which 51 per cent of fishers surveyed were from Myanmar and 40 per cent from Cambodia. This shift is also reflected in the 2017 Thai Ministry of Labour figures for migrant workers in fishing.
Do you own a smart phone or access social media?
Social media use among migrant workers can impact labour market choices, mobility and even working conditions. Respondents were asked about access to a phone and social media as a way to see if they could at least access resources for assistance or information. Nearly three in four respondents had a smartphone (76 per cent of the fishers and 71 per cent of seafood workers). Nearly all of them had a social media subscription. The most popular social media was Facebook, with 68 per cent penetration among all respondents (Twitter and Instagram were barely used, at 1 per cent each). Respondents were also asked if they owned a television or radio as an indicator of where they might find useful information: 65 per cent of them owned a television, but only 6 per cent had a radio.
Table 3. Worker profile, by sector and nationality

13Baseline research findings on fishers and seafood workers in Thailand
5 See ILO: Risks and rewards: Outcomes of labour migration in South-East Asia (Bangkok, 2017). The survey was conducted in 2016.
Figure 2. Social media accessBase: all respondents (n=434)
3. Recruitment experiences How did you find your current job?
Workers were asked whether they had applied for their current job. Three of four respondents (74 per cent) said they had. Most of them sought their current job either directly with the employer (24 per cent) or through tips from a relative or friend (29 per cent). In the 26 per cent of cases in which the respondent did not apply for their current job (they were placed there, or “assigned” by a recruitment agency or told by a relative to work there), it was far more common that a recruitment agency was used (39 per cent).
Half of the respondents (51 per cent in seafood processing and 53 per cent in fishing) acquired their job via an immediate family member, a relative or a friend. Between the two sectors, 29 per cent of fishing workers used a recruitment agency, while 17 per cent of seafood workers did. There was a significant difference in responses to this question between regions: Half of the 71 respondents in Rayong Province had used a recruiting agency, while only 8 per cent in the Andaman Sea area had used an agency.
Did you pay a recruitment fee?
More than half (55 per cent) of the migrant worker respondents paid a recruitment fee, and more of them paid fees in Thailand than in their country of origin (figure 2). (Thai workers were not asked if they had paid a recruitment fee.) The 2016 migrant worker regulations (Royal Ordinance Concerning Rules on Bringing Migrant Workers to Work with Employers in the Kingdom) requires that employers – not workers – pay the recruitment fee in Thailand. It is possible that some workers might include the fee for their passport and work permit costs, for example, into their replies on recruitment fee paid because these costs are typically bundled together.
The average recruitment fee paid by migrants from Myanmar (THB11,000) were considerably higher than what was paid by Cambodian migrants (THB4,900). The 2017 ILO TRIANGLE study5 with returned migrants found that total migration costs for migrants from Myanmar were double the costs paid by migrants from Cambodia.
All workers100%
Facebook68%
Smart phone78%
Ship to shore rights14
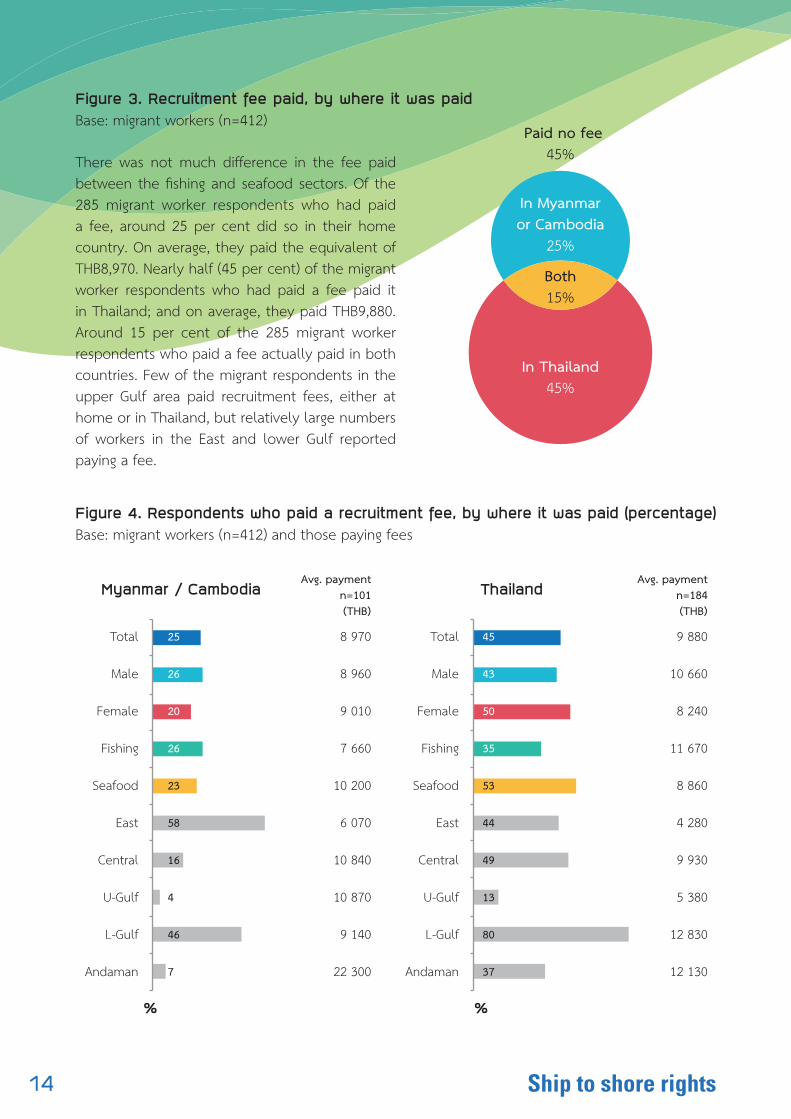
Figure 3. Recruitment fee paid, by where it was paidBase: migrant workers (n=412)
There was not much difference in the fee paid between the fishing and seafood sectors. Of the 285 migrant worker respondents who had paid a fee, around 25 per cent did so in their home country. On average, they paid the equivalent of THB8,970. Nearly half (45 per cent) of the migrant worker respondents who had paid a fee paid it in Thailand; and on average, they paid THB9,880. Around 15 per cent of the 285 migrant worker respondents who paid a fee actually paid in both countries. Few of the migrant respondents in the upper Gulf area paid recruitment fees, either at home or in Thailand, but relatively large numbers of workers in the East and lower Gulf reported paying a fee.
Figure 4. Respondents who paid a recruitment fee, by where it was paid (percentage)Base: migrant workers (n=412) and those paying fees
Avg. paymentn=101(THB)
Avg. paymentn=184(THB)
Myanmar / Cambodia
%
Thailand
%
Paid no fee45%
Both15%
In Myanmaror Cambodia
25%
In Thailand45%
Total
Male
Female
Fishing
Seafood
East
Central
U-Gulf
L-Gulf
Andaman
45
43
50
35
53
44
49
13
80
37
25
26
20
26
23
58
16
4
46
7
9 880
10 660
8 240
11 670
8 860
4 280
9 930
5 380
12 830
12 130
8 970
8 960
9 010
7 660
10 200
6 070
10 840
10 870
9 140
22 300
Total
Male
Female
Fishing
Seafood
East
Central
U-Gulf
L-Gulf
Andaman

15Baseline research findings on fishers and seafood workers in Thailand
Which identity documents do you have in your possession?
As indicated in figure 4, nearly all the migrant worker respondents had some form of identity documents (98 per cent). In contrast, the 2013 ILO survey on working conditions in Thai fishing found that 55.3 per cent of its respondents had no documents. Not all 2017 respondents had the documents required to work in Thailand at the time of the current survey, which rendered them irregular migrants (13 per cent).
Nearly two-thirds of the migrant worker respondents (65 per cent) had a “pink card”,5 which means they had come to Thailand as irregular migrants but later regularized their status. Pink cards were more common among the respondents in the fishing sector (at 83 per cent) than in seafood processing (at 50 per cent). Note: The Government of Thailand stopped issuing pink cards in March 2017, but they were still in use at the time the data collection was carried out.
Only 10 per cent of the migrant worker respondents had a passport and visa to be in Thailand, and 11 per cent had entered Thailand through an agreement process between their government and the Government of Thailand (memorandum of understanding (MOU) on regularizing migrant workers). Through the MOU process, workers are required to obtain a passport, visa and work permit and follow guidelines agreed by both governments (figure 4). In total, only a third of the respondents had regular migrant status via the national verification process, the MOU scheme or had a passport and visa only. The migrant workers were asked if they had ever had irregular status in their time in Thailand; 43 per cent yes and on average, they had such status for a year.
Employers sometimes take away identity documents to prevent workers from leaving. Overall, 17 per cent of the migrant worker respondents experienced this at some time during the 12 months prior to the survey (not necessarily with their current employer). The practice was more common among the respondents in fishing work: 30 per cent of the fishers and 7 per cent for seafood workers reported that they did not have control of or access to their identity documents. Figure 5. Identity or work permit documents in hand, by sectorBase: migrant workers (n=412)
5 Since 2008, foreigners can acquire a Thai ID card if they are in one of four categories: (i) having permanent residency; (ii) children who can live in the country; (iii) work reasons; and (iv) not approved (illegal entry into the country). These cards are pink coloured. Following the military coup of 2014, the Government began to register the thousands of migrant workers from Cambodia, the Lao People’s Democratic Republic and Myanmar and extended opportunity to apply for pink cards.
Pink card (Tor Ror 38/1)
Fishing Seafood
83% 50%65%
Passport and visa only 5% 14%10%
Passport only 1% 1%1%None 1% 1%2%
Passport, visa and work permit (MOU process) 2% 19%
7% 16%
11%
Temporary passport, certificate of identity, visa and work permit (national verification process) 12%

Ship to shore rights16
Have you ever paid money unofficially to a government official?
Migrant worker respondents were asked if they could recall having made, at any time in Thailand, any “unofficial payment” to someone they thought was a government official. Some 8 per cent of the migrant worker respondents said yes, although the question did not specify policeperson or government official. This practice was more common among the seafood workers and among respondents in the Central region.
Do you recall signing a written contract for your current job?
As of 2015, Thai law requires that all workers on fishing boats sign a contract and receive a copy. Respondents were asked if they had received a contract for the job they were in at the time of the survey. Some 36 per cent of the worker respondents recalled signing a work contract. Of them, few could recall having received a copy (at 14 per cent). And only half said they understood the terms of their contract (figure 5).
More respondents in the fishing sector (43 per cent) recalled signing a contract than did respondents in seafood work (29 per cent). The larger proportions of respondents who recalled signing a written contract were working in the East and lower Gulf areas, at 65 and 67 per cent, respectively. The two smaller proportions of respondents who recalled signing contracts worked in the Central and upper Gulf areas, at 21 and 18 per cent, respectively.
Figure 6. Respondents who could recall signing a contract, by sex and sector (percentage)Base: all respondents (n=434) and those recalling signing a contract
Could recall signing a contract
%
Total
Male
Female
Fishing
Seafood
East
Central
U-Gulf
L-Gulf
Andaman
36
37
32
43
29
65
21
18
67
25
Could recall signing a contractn=154
%
Native language 71
Understood terms 51
Given copy to keep 14
Discussed with employer or other worker
29

17Baseline research findings on fishers and seafood workers in Thailand
Did you find conditions worse than agreed when you were recruited?
One of five respondents (19 per cent) experienced working conditions that were worse than what had been agreed (in the contract or verbally) with the employer or recruiting agent. In the aggregate, there was little difference between the experience of men and women or between fishing and seafood on these “deception” questions. And whether the worker could recall having signed work contract did not appear to make a significant difference.
The percentage of respondents in fishing who reported conditions worse than promised (17 per cent) is practically unchanged from the 2013 ILO survey in which 15 per cent of fishers – asked about wages, working hours, living conditions, nature of the job – reported conditions to be “worse” or “much worse” than promised.
Looking more closely at the data, it appears that deception of workers in fishing is worst when it comes to hours – cited by 65 per cent of those reporting deception – dangers of the work (56 per cent), and wages (41 per cent). Deception in recruiting among seafood workers focused on wages and hours (both at 36 per cent), the nature of the work tasks assigned (23 per cent) and dangers (21 per cent).
Table 4. Work conditions worse than agreed, by sex, sector and zoneBase: all respondents (n=434) and those experiencing worse conditions
Note: Freedom of movement is not the same as “locked up” and could include restrictions on movement in a port town, for example, based on migration status.
Experienced worse conditions
%
Total
Male
Female
Fishing
Seafood
East
Central
U-Gulf
L-Gulf
Andaman
19
19
19
17
20
28
20
13
10
19
Work conditionsTotaln=81 (%)
Fishingn=34 (%)
Seafoodn=47 (%)
Salary 38 41 36
Work hours: overtime 48 65 36
Work location 20 24 17
Work days 25 32 19
Safety: danger 36 56 21
Housing and living conditions 15 24 9
Work tasks 20 15 23
Benefit (no sick leave) 21 27 17
Freedom of movement 15 18 13
Food and water 16 27 9
Other 10 3 15

Ship to shore rights18
How long have you worked in this sector and how much longer do you intend to stay?
The movement of respondents between employers and sectors was looked at to determine how long workers have spent in the industry and their plans to stay, change employers and – in the case of migrant workers – return home.
Migrant worker respondents in the fishing sector had worked on average (median) in the industry for four years and planned to stay in Thailand for another 4.5 years. Some 29 per cent of the fishers had been with their current employer since they first came to Thailand; 44 per cent had changed employers within the sector, and 27 per cent came to fishing from a different sector.
When asked about their future plans, slightly more than half of the respondents in fishing (57 per cent) reported that they intend to stay with their current employer. And 16 per cent wanted to get off their boat and onto a different boat. But more than a quarter of the fishers (27 per cent) wanted to move to a different sector altogether. These findings are largely unchanged from 2013 when the ILO survey found that 53 per cent of fishers intended to continue with their current employer, 9 per cent wanted to continue working in fishing but on a different boat, and 25 per cent wanted to leave fishing for work in another sector.
Migrant worker respondents in the seafood sector had worked in the industry for an average of two years and planned to stay in Thailand for another two years. Some 34 per cent had been with their current employer since they first came to Thailand and the remaining workers had changed from other employers (44 per cent) or other sectors (27 per cent). More than two-thirds of the respondents (71 per cent) intended to stay with their current employer, 9 per cent wanted to change factories, and 20 per cent intended to leave seafood processing for another sector.
On the whole, the migrant worker respondents clearly prefer work in seafood processing rather than fishing. Based on where respondents see themselves working in a year from the time of the survey, fishing’s share of the industry workforce will fall by 3 per cent, while seafood processing will experience a 13 per cent increase.
Table 5. Sector of previous employment, current employment and future employment
SectorPreviousemploymentn=434 (%)
Current employmentn=434 (%)
Future employmentn=434 (%)
Difference
Fishing 39 45 36 -3
Seafood processing 32 55 45 +13
Domestic work 1 - - -1
Agriculture 3 - 1 -2
Manufacturing 9 - 8 -1

19Baseline research findings on fishers and seafood workers in Thailand
Construction 9 - 4 -5
Hospitality 1 - - -1
Other 6 - 6 -
Total 100 100 100
Why do you want to change employers?
The most common reason for wanting to change employers was to earn a higher income (56 per cent), followed by obtaining better accommodation (37 per cent) or better benefits (31 per cent). These motivations were found to be similar when comparing men and women as well as fishing and seafood processing. Being closer to home was a major factor for seafood processing workers who wanted to change their employer. For the fishers, avoiding mistreatment (12 per cent) rated four times higher as a reason for leaving their employer than for seafood workers.
Figure 7. Reasons for wanting to change employer, by sectorBase: all respondents (n=434)
Table 5. Sector of previous employment, current employment and future employment
Earn more income
Better benefit
Other
No more work available
Forced to move by employer
Better accommodation
Closer to home
Avoid mistreatment
End of visa or work permit
55%
32%
22%
6%
1%
35%
13%
12%
6%
57%
29%
14%
11%
10%
40%
29%
3%
5%
56%
31%
18%
8%
1%
37%
20%
8%
4%
Fishing Seafood
Ship to shore rights20
21Baseline research findings on fishers and seafood workers in Thailand
4. Wages and deductions
The baseline survey included an array of questions for seafood processing workers and fishers on wages – monthly amounts, timing of payments, structure of wages, deductions and advances. This was done to help the project develop a clearer picture of pay practices for workers in the industry and for workers in fishing, in particular, where cash payments have made practices (and compliance with wage regulations) difficult to track and verify.
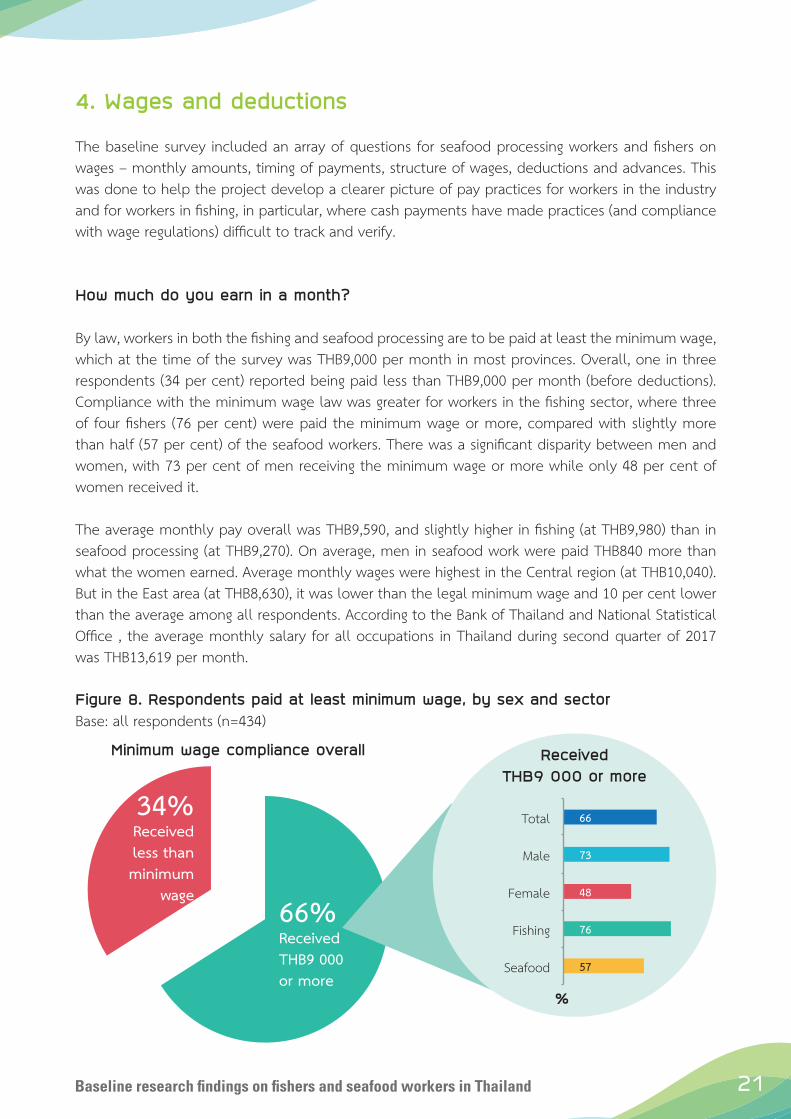
How much do you earn in a month?
By law, workers in both the fishing and seafood processing are to be paid at least the minimum wage, which at the time of the survey was THB9,000 per month in most provinces. Overall, one in three respondents (34 per cent) reported being paid less than THB9,000 per month (before deductions). Compliance with the minimum wage law was greater for workers in the fishing sector, where three of four fishers (76 per cent) were paid the minimum wage or more, compared with slightly more than half (57 per cent) of the seafood workers. There was a significant disparity between men and women, with 73 per cent of men receiving the minimum wage or more while only 48 per cent of women received it.
The average monthly pay overall was THB9,590, and slightly higher in fishing (at THB9,980) than in seafood processing (at THB9,270). On average, men in seafood work were paid THB840 more than what the women earned. Average monthly wages were highest in the Central region (at THB10,040). But in the East area (at THB8,630), it was lower than the legal minimum wage and 10 per cent lower than the average among all respondents. According to the Bank of Thailand and National Statistical Office , the average monthly salary for all occupations in Thailand during second quarter of 2017 was THB13,619 per month.
Figure 8. Respondents paid at least minimum wage, by sex and sectorBase: all respondents (n=434)
ReceivedTHB9 000 or more
%
Total
Male
Female
Fishing
Seafood
66
73
48
76
57
Minimum wage compliance overall
34%Received less than minimum
wage66%Received THB9 000 or more

Ship to shore rights22
How were you paid?
As noted, the fishing and seafood processing sectors have quite different pay structures. The most common type was a fixed monthly wage combined with a piece rate (seafood sector) or “share of catch” (fishing sector). Thus, a higher wage was dependent on the worker or crew producing outputs beyond certain targets. Around 53 per cent of the respondents were compensated this way, and it was more commonly reported by seafood workers.
In some cases, wages were completely dependent on the worker’s performance (piece rate or share of the catch only, with no fixed wage), a practice more common in fishing (at 22 per cent, compared with 3 per cent in seafood work).
Slightly more than half of all respondents (52 per cent) were paid monthly. But withholding of wages was common in fishing, for which 24 per cent of the fishers were subjected to delayed and partial (lump-sum) payments. Among the 46 fishers who received a lump-sum payment, the average payout was THB112,000 – paid on average after 11 months of working and waiting. In nearly all cases (94 per cent), it was the boat owner who withheld the salary.
Table 6. Type of wage payments, by sex and sector
Salary Totaln=434(%)
Menn=300(%)
Womenn=134(%)
Fishingn=196(%)
Seafoodn=238(%)
Average salary per month 9 590 9 850 9 010 9 980 9 270
Payment frequency
Daily 2 1 6 1 4
Weekly 3 2 4 2 4
Monthly 52 52 51 51 53
Lump sum 11 15 - 24 -
Other 33 30 39 24 40
Wage structure
Fixed salary 23 30 8 39 10
Partly fixed salary + piece rate or share of catch
53 50 60 39 64
Piece rate or share of catch only 12 15 5 22 3
Other 12 5 29 - 23

23Baseline research findings on fishers and seafood workers in Thailand
Some of the pay data allows for comparisons with findings on pay for fishers from the ILO 2013 survey. For example, the makeup of payments to fishers has shifted significantly since the 2013 study, in which 41 per cent of the surveyed fishers reported being paid with a share of the catch only. But that figure declined to 22 per cent in this survey, and the percentage of fishers paid a fixed wage climbed from 10 per cent in 2013 to 39 per cent in this survey.
This shift from variable pay based on a share of the amount of fish caught to a promised minimum daily or monthly wage has been driven in large part by the extension of minimum wages to fishers. This change has helped to push up average monthly gross wages among fishers from THB6,483 in 2013 to THB9,980 in this survey for an inflation-adjusted increase of approximately 66 per cent over four years.
The shift has helped to push up average monthly gross wages among fishers from THB6,483 in 2013 to THB9,980 (before deductions) in this survey for an inflation-adjusted increase of 50 per cent over four years.
But the increase has coincided with a doubling of wage withholding – an ILO indicator of forced labour – in the last four years as well as an increase in the number of fishers who reported deductions from their wages from 42 per cent in 2013 to 48 per cent in 2017, and average monthly wages after deductions for fishers in this survey was THB7,730 – below the legal minimum wage.
Were deductions taken from your wages?
For the 53 per cent of respondents who reported some form of wage deduction, fees for the pink card (13 per cent) and payment for advances on salary or debts (15 per cent) were most common. The Thai Labour Protection Act makes clear that only deductions for income tax payment, labour union dues, debts owed to savings cooperatives, damages caused to the workplace and provident fund contributions are legal. All other deductions – including for accommodation, food, water, clothing, equipment and identity document fee – are illegal. Some penalties and advances on pay or debts are legal under Thai law.
Table 7. Type of wage deductionsTotal n=434 (percentage)
Illegal deductions Legal deductions Summary
Accommodation 7 Penalties* 5 Illegal deductions 20–37
Food 3Advance or debt on pay* 15 Legal deductions 16–33
Clothing or equipment 8
Cost for pink card 13 Other* (can be legal or illegal)
16 No deductions made 47Unknown deductions 2
Note: * can be legal or illegal. The ranges for illegal wage deductions include food, accommodation, pink card, clothing, equipment and unknown deductions as well as possibly illegal deductions for worker penalties and repayment of advances.

Ship to shore rights24
Overall, the average monthly deduction of THB2,990 left respondents with an average of THB6,600 each month (figure 8). Minimum wage violations are compounded in the East region with the largest deductions, at THB4,740 per month on average. Workers in the Central region had the smallest deductions, at THB1,610 per month.
The average salary for workers who reported deductions was significantly below the minimum wage and significantly lower than the pay for workers who did not have deductions. In fishing work, the 48 per cent of respondents who reported deductions were left with THB5,430 per month on average after the deductions. That works out to 45 per cent less pay than those fishers without deductions, who earned an average of THB9,980 per month.
In seafood work, the difference was less but still sizeable: The 56 per cent of respondents with deductions were left with THB7,480 a month on average, while seafood workers without any deductions were left with 19 per cent more–or THB9,230 per month.
Figure 9. Wage deductions for all respondentsBase: all respondents (n=434)
9 590Avg. salary
None
Pink card
Advance money
Clothing or equipment
47%
13%
15%
8%
Accommodation
Food
Penalty or punishment
Unknown deduction
7%
3%
5%
2%
2 990Avg. deduction
6 600Avg. balance
These new findings on wages can be compared with the findings in the ILO 2013 survey. In that survey, 47 per cent of fishers reported that a portion of their pay was deducted by their employer for: debt incurred or repayment of wage advances (15.4 per cent), food and drinking water (5.4 per cent), worker card fees (1.7 per cent), leave days (0.8 per cent), accommodation (0.5 per cent) and unknown deductions (18.3 per cent).

25Baseline research findings on fishers and seafood workers in Thailand
Figure 10. Wage deductions, by sectorBase: all respondents (n=434)
Did you receive an advance on your salary?
More than half (52 per cent) of the respondents in fishing reported receiving loans or an advance against their monthly salary. The practice was less common in seafood processing, where 24 per cent of the respondents reported receiving an advance.
During the additional interviews, few respondents could produce pay slips from their employers showing earnings, hours and deductions. The lack of pay records for workers was more pronounced in fishing than in seafood processing, where employers are more likely to have a modern payroll system.
Do you send money home?
The vast majority of respondents (84 per cent) remitted money home. On average, they sent THB3,620 per month. The average remittance amount barely differed between the two sectors. Slightly more men (at 88 per cent) than women (at 76 per cent) remitted money and slightly more money on average, at THB3,640, compared with THB3,580. Workers in the Andaman and the upper Gulf areas sent more money than workers elsewhere, at slightly more than THB4,000 on a monthly average, while workers in the East area sent the smallest average amount, at THB2,830 per month. The most common (at 80 per cent) channel used was the hundi, or broker, system.
FishingAvg. salary per month (before deductions) THB9 980
SeafoodAvg. salary per month (before deductions) THB9 270
48% Deductions madeTHB4 640
56% Deductions madeTHB1 820
Take-home salaryTHB5 430
Take-home salaryTHB7 480
52%No deductions
THB 0
44% No deductions
THB 0
Take-home salaryTHB9 900
Take-home salaryTHB9 230

Ship to shore rights26
5. Working and living conditions
In addition to the findings on recruitment and wages, baseline measures of working and living conditions in fishing and seafood processing – hours of work and rest, leave time, safety on the job, health care and quality of accommodations – were collected to help gauge progress in the months to come.
What are your work hours?
Workers in both sectors were asked about the length of their work day and how many days they worked each week. In the seafood sector, respondents worked an average of 6.1 days per week, and the average work day was nine hours long. Around 29 per cent worked more than 10 hours per day, and 21 per cent said they routinely worked 11- or 12-hour shifts.
Fishermen were also asked if they had 10 hours of rest in each 24-hour period at sea as a check on compliance with the 2015 change in Thai law. In the fishing sector, respondents worked an average of 6.2 days per week and the average working day was 11 hours. Around 22 per cent of the fishers said they typically worked more than 14 hours per day – most of these respondents reported that they worked around 16-hour days or longer. Some 13 per cent reported they had fewer than seven hours of rest every 24 hours. The fishers reported spending an average of nine days on the water. All respondents said their boat did not stay longer than 30 days, in compliance with requirements in Thai law.
Box 1
Determining hours worked on fishing boats
ILO Work in Fishing Convention, 2007 (No. 188) sets the global standard for rest hours for fishers:
“For fishing vessels regardless of size remaining at sea for more than three days, after consultation and for the purpose of limiting fatigue, establish the minimum hours of rest to be provided to fishers.” The minimum hours of rest are not to be less than 10 hours in any 24-hour period and 77 hours in any seven-day period.
Thai law already reflects this standard but there is no agreement among the Government of Thailand, employers and workers on what constitutes the beginning and end of work on board a vessel. Thai law has not yet defined how to measure work and rest hours for work aboard fishing vessels.
For fishers who remain at sea for several days, it can be difficult to measure a work day for survey purposes or even compliance with the law. Stepping on a boat does not launch the work day, explained fishermen and civil society representatives when interviewed for this baseline research. Rather, the day begins when the nets go down, they said. Thus, for the baseline research, respondents were asked how many hours a day they worked on average. From their replies, an average was calculated. It may be that some workers overestimated a bit and some underestimated. When compared with average working days and hours in other studies in Thailand, the results are not vastly different.
Other work on a fishing boat includes storing fish, cleaning the boat and repairing nets. Days spent travelling were treated as days off which is why the baseline survey also asked respondents how many days they were at sea.

27Baseline research findings on fishers and seafood workers in Thailand
Trans-shipment of fish or workers was not very common. Less than 10 per cent reported that another boat came to pick up fish (6 per cent) or bring food and water (8 per cent) or other workers out at sea (less than 1 per cent).
Were you paid for overtime work?
More than half (55 per cent) of the seafood workers who reported working more than eight hours per day received overtime compensation. However, work in fishing is defined in Thai law in terms of rest, without a legal provision for overtime; hence, a 14-plus-hour day is used here as a measure of overtime.
Not all the overtime hours were voluntary. Overall, 13 per cent of workers said they were forced to work overtime, with more fishers (and men) reporting involuntary overtime than seafood processing workers (and women).
Table 8. Work days and hours
Work days and hours Totaln=434
Menn=300
Womenn=134
Fishingn=196(%)
Seafoodn=238(%)
Average work days 6.2 6.3 6.0 6.3 6.1
Average work hours 10 11 9 11 9
Worked more than 10 hours (%) 41 48 26 57 29
Worked more than 14 hours (%) 12 17 2 22 4
Overtime was paid 31 19 58 2 55
Forced to work overtime 13 15 9 15 11
As highlighted in the interviews with civil society representatives and in the extended interviews with workers, raw materials in seafood processing can come all at once and some workers are required to work all day and all night with no rest. In small seafood processing factories, it is expected by employers that workers perform all duties – including cleaning after working hours – without pay. In addition to excessive working hours, some respondents reported having to work seven days in a week, including over public holidays. In some factories, workers who took a day off had their salary for that day forfeited.

Ship to shore rights28
In the fishing sector, when the Command Centre to Combat Illegal Fishing ordered a fishing vessel to stay docked for maintenance, some workers reported that they were not paid for the days required to make repairs even though there was work for them to do and thus no day off.
Do you have rest days and sick leave? What entitlements do you receive?
Sick leave and having one day off each week are core entitlements in Thai labour law but 54 per cent of all respondents said they did not have paid sick leave, and 52 per cent reported no day off per week. It was worse in the fishing sector, where almost two-thirds (65 per cent) of the fishers reported no day off per week. In seafood processing, 55 per cent of the respondents reported that they did not receive paid holidays and/or annual leave.
Of all the women in seafood work, 28 per cent had been provided maternity leave.
Table 9. Entitlements received, by sex and sector
Work days and hours Totaln=434
Menn=300
Womenn=134
Fishingn=196(%)
Seafoodn=238(%)
Paid holidays or annual leave 34 29 45 20 45
Paid sick leave 46 48 43 47 45
One day off per week 48 41 63 35 59
Paid maternity leave 28 NA 28 NA 28
None 27 33 14 36 20
Average number of entitlements 1.7 1.4 2.4 1.1 2.3
Note: The survey questions did not differentiate between national holidays or annual leave and could be interpreted to cover both.
29Baseline research findings on fishers and seafood workers in Thailand
Do you feel safe in the work you do?
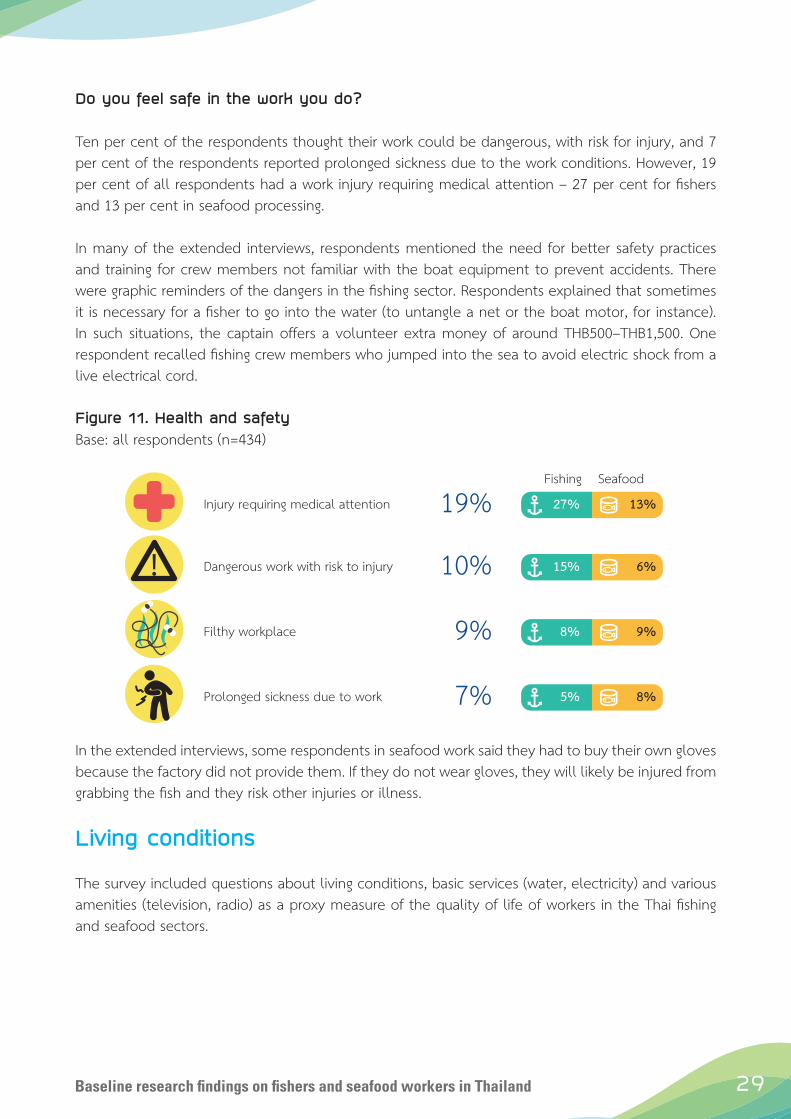
Ten per cent of the respondents thought their work could be dangerous, with risk for injury, and 7 per cent of the respondents reported prolonged sickness due to the work conditions. However, 19 per cent of all respondents had a work injury requiring medical attention – 27 per cent for fishers and 13 per cent in seafood processing.
In many of the extended interviews, respondents mentioned the need for better safety practices and training for crew members not familiar with the boat equipment to prevent accidents. There were graphic reminders of the dangers in the fishing sector. Respondents explained that sometimes it is necessary for a fisher to go into the water (to untangle a net or the boat motor, for instance). In such situations, the captain offers a volunteer extra money of around THB500–THB1,500. One respondent recalled fishing crew members who jumped into the sea to avoid electric shock from a live electrical cord.
Figure 11. Health and safetyBase: all respondents (n=434)
In the extended interviews, some respondents in seafood work said they had to buy their own gloves because the factory did not provide them. If they do not wear gloves, they will likely be injured from grabbing the fish and they risk other injuries or illness.
Living conditions
The survey included questions about living conditions, basic services (water, electricity) and various amenities (television, radio) as a proxy measure of the quality of life of workers in the Thai fishing and seafood sectors.
Injury requiring medical attention
Filthy workplace
Dangerous work with risk to injury
Prolonged sickness due to work
27%
8%
15%
5%
13%
9%
6%
8%
19%
9%
10%
7%
Fishing Seafood

Ship to shore rights30
In what type of accommodation do you live?
Most respondents typically stayed in a room or on a boat (figure 11). Their personal space is either that room or just a bed. Most of the respondents (94 per cent) shared their accommodation with other people; 20 per cent of them shared with other workers but most shared with family or friends. The average number of people sharing one accommodation unit was seven. Among fishers, more than half (58 per cent) reported that they lived on the boat; but all fishers in Rayong and Chonburi areas said they lived on board the boat.
Figure 12. Type of accommodationBase: all respondents (n=434)
Room
TYPE
Shelter
House
Stay on the boat
Other
Apartment
56%
1%
14%
26%
0%
3%
SHARE WITH
Family and relatives
Friends and relatives
Other workers
Live by myself
61%
13%
20%
6%
SPACE
One room
Apartment
House
One bed
None
60%
1%
12%
23%
4%
31Baseline research findings on fishers and seafood workers in Thailand
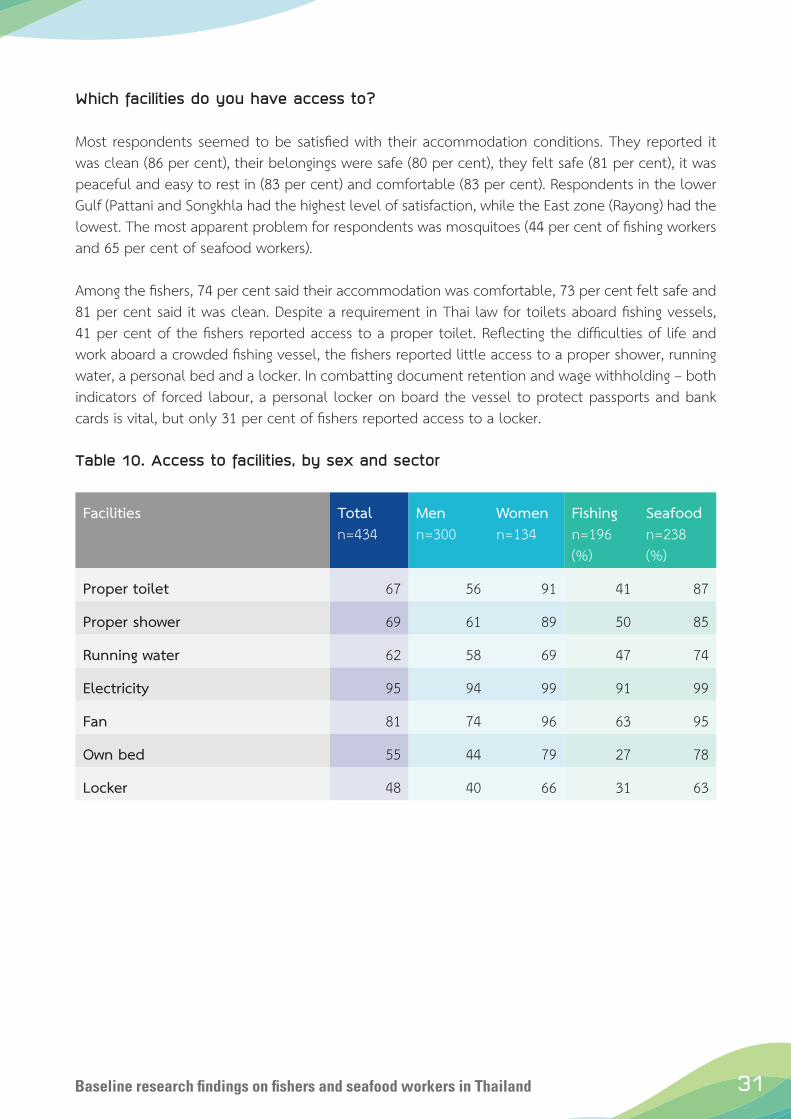
Which facilities do you have access to?
Most respondents seemed to be satisfied with their accommodation conditions. They reported it was clean (86 per cent), their belongings were safe (80 per cent), they felt safe (81 per cent), it was peaceful and easy to rest in (83 per cent) and comfortable (83 per cent). Respondents in the lower Gulf (Pattani and Songkhla had the highest level of satisfaction, while the East zone (Rayong) had the lowest. The most apparent problem for respondents was mosquitoes (44 per cent of fishing workers and 65 per cent of seafood workers).
Among the fishers, 74 per cent said their accommodation was comfortable, 73 per cent felt safe and 81 per cent said it was clean. Despite a requirement in Thai law for toilets aboard fishing vessels, 41 per cent of the fishers reported access to a proper toilet. Reflecting the difficulties of life and work aboard a crowded fishing vessel, the fishers reported little access to a proper shower, running water, a personal bed and a locker. In combatting document retention and wage withholding – both indicators of forced labour, a personal locker on board the vessel to protect passports and bank cards is vital, but only 31 per cent of fishers reported access to a locker.
Table 10. Access to facilities, by sex and sector
Facilities Totaln=434
Menn=300
Womenn=134
Fishingn=196(%)
Seafoodn=238(%)
Proper toilet 67 56 91 41 87
Proper shower 69 61 89 50 85
Running water 62 58 69 47 74
Electricity 95 94 99 91 99
Fan 81 74 96 63 95
Own bed 55 44 79 27 78
Locker 48 40 66 31 63

Ship to shore rights32
33Baseline research findings on fishers and seafood workers in Thailand
6. Forced labour indicators
The 2013 ILO survey on working conditions in Thai fishing found 17 per cent of its respondents were working against their will. Among the Thai nationals in that survey, all were working willingly, but 9 per cent of Cambodian and 26 per cent of Myanmar fishers were working against their will.
The research questions used for this baseline study were not designed to produce estimates of forced labour in the fishing and seafood industry. The questions used in this survey instead allow us to discern indicators of possible forced labour situations. The findings of the baseline research were assessed against the ILO indicators to see where forced labour practices may be happening and to compare experiences of workers between sectors, regions, sex and country of origin.
The ILO indicators derive from theoretical and practical experiences of the ILO and are based on the definition of forced labour in the ILO Forced Labour Convention, 1930 (No. 29), which Thailand ratified in 1969: “All work or service which is exacted from any person under the menace of any penalty and for which the said person has not offered himself voluntarily.”
The ILO forced labour indicators are classified into indicators of “involuntariness” and indicators of “penalty”. The presence of a single forced labour indicator may not imply the existence of forced labour. But several indicators taken together can be viewed as stronger evidence of potential forced labour. Measures of these indicators are useful benchmarks against which future evaluations of work in the industry can be compared to evaluate improvements or deteriorations in conditions for vulnerable workers and the impacts of changes in policy and law enforcement.
This survey’s questions and responses allowed us to measure the seven forced labour indicators in the following table – deception, isolation, intimidation and threats, retention of identity documents, withholding of wages, abusive working conditions8 and excessive overtime. (The remaining four indicators require additional information not collected in this baseline study, so measures are not provided here). Deception is defined as work conditions that were different to what was agreed, and deduction for the pink card is considered a deception to workers.
8 Abusive working conditions can include degrading (humiliating and dirty) or hazardous (difficult or dangerous without protective gear) and in severe breach of labour law. Workers were asked if they had experienced injuries requiring medical attention, prolonged sickness due to work, doing dangerous work with risk of serious injury or working in a very filthy workplace.

Ship to shore rights34
Box 2
Forced Labour Indicators Framework developed
by the International Labour Organization
The 11 ILO indicators of forced labour are intended to help criminal law enforcement officials, labour inspectors, trade union officers, civil society organization staff and others determine which persons are possibly trapped in a forced labour situation and may require assistance. The indicators represent the most common signs or clues that point to the possible occurrence of a forced labour case.
This baseline survey’s findings in relation to the ILO forced labour indicators are based on:
Indicator Classification Description
Deception Involuntariness Work conditions worse than initially agreed or unlawful salary deductions for worker registration (pink card)
Isolation Penalty Being locked up or mobile phone taken away
Intimidation and threats Penalty Experienced intimidation or threats
Retention of identity documents
Penalty ID documents were taken away without consent
Withholding of wages Penalty Wages withheld or paid in lump sum instead of monthly, meaning part of the salary is being withheld
Abusive working conditions Penalty Experienced abusive working conditions
Excessive overtime Involuntariness Being forced to work more than 10 hours in seafood and more than 14 hours in fishing industry
Abuse of vulnerability Not covered in detail in survey
Restriction of movement Not covered in detail in survey
Physical and sexual violence
Not covered in detail in survey
Debt bondage Not covered in detail in survey

35Baseline research findings on fishers and seafood workers in Thailand
Overall, 44 per cent of workers said they had not experienced any of these seven abuses, while 22 per cent experienced one form and 18 per cent experienced two forms. In seafood processing work, 56 per cent of respondents reported no experience with any of these abuses, but 44 per cent reported experience with one or more. The most common indicators cited in seafood processing were deception (23 per cent), abusive working conditions (22 per cent), and intimidation (15 per cent).
Significantly more accounts of forced labour indicators came from the fishing sector than seafood sector. Among the fishers, only about a third (29 per cent) reported no experience of these indica-tors of forced labour in their work over the 12 months prior to the survey. Around 23 per cent of the fishers reported one of these abuses, while another 23 per cent reported two of these abuses, and 12 per cent reported experiences with three of the forced labour indicators.
Figure 13. Forced labour indicators, by sectorBase: all respondents (n=434)
As in seafood processing, deception and abusive working conditions were the most common forced labour indicators found among the fishers, albeit at much higher levels. Around 37 per cent of the fishers reported deception in their recruitment, and 40 per cent described abusive working conditions. Almost a quarter (24 per cent) of the fishers noted that some of their wages were withhold by the vessel owner (as well as skippers and chieu, or crew supervisor). As many as 30 per cent of the fishers reported that they did not have access to their identity document. Intimidation or threats were recounted by 18 per cent of the fishers.
Isolation in fishing is an inherent problem and difficult to define and measure. As noted previously, no respondent reported staying out at sea beyond the 30-day limit in Thai law, and the average number of days at sea per fishing trip was nine.
Seafood (%)
Fishing (%)
No indicator (29%) 1 indicator (23%) 2 (23%)
3 (12%)
3 (6%)
4 (5%)
4 (3%)
5 (7%)
5 (1%)
6 (1%)
No indicator (56%) 1 indicator (21%)
2 (13%)

Ship to shore rights36
Consistent with findings elsewhere in this report, 86 per cent of Eastern zone fishers reported experience of at least one of these abuses. Fishers in the Central (55 per cent) and Andaman zones (51 per cent) noted fewer instances of the forced labour indicators that were analysed.
Between the sexes, there were significantly more reports from men of deception, withholding of documents and abusive working conditions. There were many reports of intimidation, including threats and harassment, from women as well as men. Overall, 12 per cent of the respondents in the fishing and seafood processing sectors experienced some form of harassment or verbal abuse.
Figure 14 Forced labour indicators, by sex and sectorBase: all respondents (n=434)
Indicators Totaln=434(%)
Menn=300(%)
Womenn=134(%)
Fishingn=196(%)
Seafoodn=238(%)
Deception 30 33 22 37 23
Isolation 4 3 4 4 3
Intimidation 16 16 16 18 15
ID retained 19 25 5 33 7
Withheld wages 11 16 0 24 0
Abusive work conditions 32 36 22 40 22
Excessive overtime 10 12 6 11 11
Overall
44%Fishing
29%Seafood
61%Female
60%Male
37%
No labour abuse

37Baseline research findings on fishers and seafood workers in Thailand
When broken out by country of origin, the findings show that the Cambodian and Myanmar respondents had similar experiences of isolation, intimidation, retention of documents and excessive overtime. However, fishers from Cambodia reported significantly higher levels of wage withholding, abusive working conditions and deception than the fishers from Myanmar. This finding could be a reflection of the predominance of Cambodians among migrant fishers in the Eastern zone and the relative lack of migrant worker organizations and networks among Cambodians.
Comparisons of some forced labour indicators in fishing between 2013 and 2017 are possible. As noted in the discussion of pay practices, wage withholding was reported at 12 per cent in the 2013 ILO survey findings. This figure has doubled to 24 per cent of fishers in 2017.
In the 2013 ILO survey findings, 17 per cent of the respondents had been threatened with violence, and 10.1 per cent had been severely beaten by a co-worker on board the boat. Fishers on long-haul vessels (more than 30 days at sea) reported higher levels of violence. Reports of workplace violence (3 per cent) and threats of violence (9 per cent) working in Thailand over the 12 months prior to the survey against fisher respondents in the 2017 survey were both found to be lower. This may be attributable in part to the new requirement that Thai commercial fishing vessels come to port at least once every 30 days.
In the 40 extension interviews focused on forced labour indicators, workers reported that withholding identity cards by the employer was common practice. Some migrant workers were told by employers that the employer keeps worker identity cards as a normal practice and for safety purposes. However, when migrant workers are stopped and arrested by Thai police because they do not have their identity card, they are fined and must pay it out of their pocket – the employer will not reimburse them. Employers may refuse to issue a resignation letter (which is required to switch and re-register with a new employer) or will keep an identity card as a form of bond. Some workers had sought help from local civil society organizations to have their identity cards returned so they could leave the job.
Consistent with the extension interviews, the civil society representatives reported in interviews for this study that they had received many complaints from workers about debt bondage, restriction of movement, withholding of wages, retention of identity documents, isolation and many cases of contract substitution. Some of these complaints were directed at recruitment agencies charging excessive fees.

Ship to shore rights38
Box 3
What type of boat do you work on?
The survey inquired about working conditions by boat type. However, the number of respondents for some boat types – pair trawlers (27 fishers) and squid boats (17 fishers) – are not large enough for the results to be indicative. One in five fishers could not name their boat type.
Reports of abusive or difficult working conditions are spread around among the boat types. Respondents from single trawler boats worked the longest hours – 39 per cent of the respondents on that type of boat typically worked more than 14 hours a day – and faced worse conditions than promised (23 per cent). Taking worker identity documents was most common on purse seiner boats (46 per cent), while 53 per cent of respondents from squid boats reported injuries that required medical attention. Average days at sea were longer for the respondents on pair trawlers, at 12 days. Measures of work hours and injuries, and illness were higher among the workers who were unable to identify their boat types.
Work condition Single trawln=62(%)
Paired trawln=27(%)
Purse trawln=46(%)
Squid boatn=17(%)
Othern=44(%)
Working more than 14 hours/day 39 33 22 - 48
Injured at work requiring medical attention
18 15 24 53 39
Prolonged sickness 5 4 2 - 11
ID documents taken away 27 26 46 6 27
Mobile phone taken away 7 4 2 6 2
Working days and hours
Avg. number days out at sea 8 12 9 9 11
Avg. working hours/day 12 12 10 10 13
Avg. resting hours/day 11 12 12 13 11
Contract
Received written contract 53 44 44 24 36
Understood contract 16 10 13 - 23
Based on what was agreed, work conditions turned out to be...
Worse 23 11 15 - 10
Same 44 63 65 15 15

39Baseline research findings on fishers and seafood workers in Thailand
7. Seeking help and reporting grievances
In addition to questions about workplace safety and health, workers were asked about their use of government or private sector benefits and about whom they seek help from, including family, friends, unions, migrant workers’ associations and government agencies.
Are you enrolled in a government or private sector benefit scheme?
Government health insurance was by far the most common scheme used (79 per cent), and the higher rate among fishers (89 per cent) is likely attributable to the legal requirement for registration in the work permit process. Other benefits were scarcely mentioned, although 27 per cent of the respondents in seafood work said they were enrolled in the social security scheme. Most categories of fishers at the time of the survey were not yet covered in Thai law by the social security programme.
Table 11. Benefit scheme enrolment, by sex and sector
Benefit scheme Totaln=434
Menn=300
Womenn=134
Fishingn=196(%)
Seafoodn=238(%)
Social security 15 11 25 2 27
Workers’ compensation 5 4 6 2 7
Government health insurance 79 82 70 89 70
Private health insurance 6 4 10 2 9
Education or training 3 1 5 - 5
None 11 10 13 8 13
Average number of benefits 1.1 1.0 1.2 1.0 1.2
What support services have you accessed?
Two-thirds (67 per cent) of the respondents said they had accessed some kind of support services – health care, legal support, education of children, training on work skills or labour rights. The most commonly cited service was health care, at 55 per cent of respondents. In most cases, the health care was provided by a government service (62 per cent), but 25 per cent of respondents said their employer had provided health care coverage. Only 10 per cent of the respondents had received training on labour rights.

Ship to shore rights40
Access to health service was found to be limited when migrant workers did not have their pink card – either an employer took it away or it had expired. Hospitals reportedly had limited resources at times and did not want to prioritize migrant workers. The civil society representatives who were interviewed cited this issue and pointed to overlapping responsibility between the Ministry of Health and the Ministry of Labour as part of the problem.
Figure 15. Access to support services and who provided, by sectorBase: all respondents (n=434)
Where did you go for help with labour rights abuses?
Of the 57 per cent of respondents in the survey who reported that they had experienced serious labour abuses, only 26 per cent sought out help for their problem, and nearly three-quarters did not seek help. Of those who sought help, 52 per cent talked with their employer to resolve the problem, 58 per cent went to friends or family members, and 31 per cent went to a civil society organization.
Workers who sought help with labour abuses reported that the problem was resolved in 13 per cent of these cases and partly resolved in another 11 per cent of cases. However, when all workers in the survey were asked where they would seek help with working conditions and labour rights, only 10 per cent reported that they would not seek any help. Workers cited multiple avenues for help: friends or family (42 per cent), followed by civil society organizations (37 per cent), employers (36 per cent), and embassy (14 per cent). Government (9 per cent), police (8 per cent), and unions (6 per cent). Smartphone apps and hotlines were even less likely choices.
Health services Government
Legal services Migrant community
Work skill training Other
None Employer
Education of children
Family or friends
Training on labour rights
Country of origin organization
Union
61%
13%
9%
30%
8%
5%
50%
9%
10%
36%
13%
14%
55% 62%
11% 19%
10% 7%
33% 25%
11% 18%
10% 5%
3%
Have received Who provideFishing Seafood

41Baseline research findings on fishers and seafood workers in Thailand
Table 12. Sources of help
SourceDid go ton=64 (%)
Would go ton=434 (%)
Friends or family 58 42
Employer or manager 52 36
Embassy or consulate 9 14
Recruitment agency or broker 2 4
Community leader 5 6
Government authorities 3 8
Police 11 9
Civil society organizations 31 37
Trade union 6 6
Worker hotline 5 5
Smart phone application - 1
Fisheries association 3 2
Other 2 1
None 6 10
Have you ever spoken with a government official who was monitoring for labour abuses?
Labour inspection of fishing boats and seafood processing plants is among the mandate of Thailand’s Ministry of Labour but is shared in some instances with staff from other agencies. Since 2015 and the establishment of the PIPO inspection process, there has been an increase in government officials checking boats and factories. Hence, the migrant workers in this survey were asked if they could recall ever being approached by a Thai government official about trafficking, their recruitment to the fishing or seafood processing sector, or their working conditions.
Some 18 per cent confirmed that they had been approached by a government official on labour issues. The practice was more common in the fishing sector (24 per cent), compared with 13 per cent in seafood work, and in the East and Lower Gulf regions. Some respondents may have been approached but could not recall or were not aware that a person they spoke with was a government official.
Ship to shore rights42
Are you a member of a union or would you like to be?
Relatively few of the survey respondents (23 per cent) were members of a union or other association. Membership was somewhat larger among seafood sector respondents. The most common membership was in a religious group or migrant worker association. According to the Labour Relations Act, migrant workers may join an existing Thai union but are prohibited from setting up and leading a union.
Aspiration to join a union or other association, however, was found to be quite high, at 61 per cent. The aspiration was stronger among women (69 per cent) and among respondents in the seafood sector (74 per cent). Religious groups and migrant workers’ associations were most popular followed by welfare committees and trade unions. The 2013 ILO survey findings on working conditions in Thai fishing found that half (50.5 per cent) of the fishers were interested in joining a trade union or migrant worker association. In the current survey, the figure is significantly higher, at 69 per cent.
Union and civil society representatives reported during interviews that women have been seen taking on leadership roles in the seafood processing sector. Civil society representatives who were interviewed remarked that women are becoming members of employee welfare committees in their workplaces and volunteering with civil society organizations.
In the same interviews, respondents noted that there are few unions in the industry and that migrant workers would like to build and lead unions. The Labour Protection Act allows for a “management committee in the workplace” but these committees have a limited role. For example, committee members can only negotiate with employers on matters related to the Labour Protection Act but not on issues that fall under the Labour Relations Act, which governs collective bargaining between private sector workers and employers.

43Baseline research findings on fishers and seafood workers in Thailand
Figure 16. Membership in an association or interest in joining oneBase: all respondents (n=434)
Religious
Migrant workers’ association
Trade union
Welfare committee
Other
Women’s group
Migrant workers’ association
Religious group
Welfare committee
Trade union
Women’s group
Other
13%
27%
2%
21%
2%
9%
8%
25%
2%
15%
1%
4%
23%Have joined
61%Want to join
14%
46%
31%
74%
22%
58%
25%
69%
Fishing
Fishing
Male
Male
Seafood
Seafood
Female
Female

Ship to shore rights44

45Baseline research findings on fishers and seafood workers in Thailand
Baseline recommendations
This research provides our first close-up picture of working conditions in both sectors – Thai fishing and seafood processing – together. That picture is decidedly mixed. And because this is baseline research, it is a many ways a preliminary picture. As a result, the research is no litmus test on progress, or the lack of it, in the industry over the last few years.
This is sure to frustrate observers who want to know at a glance which way things are going. But for the ILO and the Ship to Shore Rights Project partners, the findings from the baseline research both confirm key objectives of the project and draw attention to parts of the plan that need greater emphasis.
For example, more intensive enforcement of labour standards by the Ministry of Labour is a core project objective. The findings presented in this report allow us to follow more closely the contours of compliance and enforcement in the fishing and seafood sectors. The data make clear that targeted and strict enforcement of wage regulations – minimum wages, gender pay equity, deductions, written payslips, monthly payment in full – should be a focus of our collective attention in both the fishing and seafood processing sectors.
To respond to the key findings presented in the report's Summary, we outline below recommendations for the project and its partners, organized by the project’s four core objectives. Many of these needs were anticipated in the design of the Ship to Shore Rights Project but are repeated here to emphasize their importance and help to move them up our project partners’ lists of priorities.
Strengthen the legal framework based on the ILO Forced Labour Protocol, 2014, (P. 29) and Work in Fishing Convention, 2007 (No. 188). The Royal Thai Government and Ministry of Labour should, in consultations with workers' and employers' organizations:
• Set adequate and effective penalties for forced labour and clear guidance to help officials identify possible forced labour victims, including migrants both regular and irregular.
• Establish clear standards for work hours, health and safety, and other standards for work in fishing, based on ILO Convention No. 188.
• Propose changes to Thai law for compliance with ILO core labour standards, including worker organizing and collective bargaining rights.
• Collect and publish independent data on working conditions for migrant workers in fishing and seafood processing to measure impact and value of migration agreements between Thailand and countries of origin.

Ship to shore rights46
Ensure effective enforcement of the labour laws and other standards across multiple tiers of seafood supply chains, protecting workers and creating a level industry playing field. The Royal Thai Government and the Ministry of Labour should:
• Re-orient inspectorate to investigate, identify and punish violations of labour laws with a focus on proactive investigation of routine violations of recruitment, wage, hours (including overtime), safety standards, and indicators of forced labour, including document retention and wage withholding.
• Set clear enforcement action targets for labour inspectors and defend inspectors against interference as they act to enforce the law.
• Aggressively enforce wage regulations using new electronic payment records in fishing.
• Connect ministry and inspectorate goals to enforcement results in high-risk fishing and seafood processing enterprises rather than to levels of activity or numbers of inspections.
• Conduct private interviews with workers away from workplaces, and monthly meetings with local unions and civil society organizations to accelerate and focus enforcement actions.
• Restrict access to new migrant workers for employers with unremediated labour law violations.
Establish higher industry standards that move beyond benchmarks to measurable improvements in the Thai industry’s labour practices, especially between tier 2 and fishing vessels. Thai suppliers and industry associations should:
• Treat supplier compliance with labour standards as the floor (minimum level), with support and escalating pressure from industry associations' Good Labour Practices programmes to improve practices or face sanction.
• Reward good labour practices using actual due diligence “from boat to bag” by major buyers, including Wal-Mart, Costco, Tesco, Coles, Simplot, Migros, Mars, Nestlé, CPC Foods and Thai Union.
Enhance workers’ skills, knowledge and welfarewith investments in worker activities through unions and civil society organizations:
• Initiate massive worker education campaigns by unions, civil society organizations and the Government, in light of the small numbers of workers seeking help and the lack of workers’ knowledge about Thai labour standards.
• Establish community support and grievance or complaint channels that are face-to-face for all migrant workers, but Cambodian workers especially.
• Re-orient legal strategies to end widespread and routine violations of wage, work hours and safety standards.

47Baseline research findings on fishers and seafood workers in Thailand
In addition to its support of the Thai government, employers, and worker organizations as they take on the challenges listed above, the ILO proposes to invest through this project in several pieces of research suggested by the findings in this report. One, a technical paper on a transition to electronic payment systems for workers in fishing and other cash-only payment schemes. Two, an evaluation of recruitment channels for work in the industry and the role of labour market failure in violations of labour rights and workplace protections. And finally, given the levels of labour law violations indicated in this baseline research and the fast pace of reform in the industry, the ILO proposes an expanded endline study of working conditions. The project’s partners and Thai seafood buyers will benefit from a survey of working and living conditions in early 2019 to measure the pace, direction and impact of changes in Thai fishing and seafood processing.
Ship to shore rights48

49Baseline research findings on fishers and seafood workers in Thailand
ANNEX IBaseline research methodology
The ILO's partner for this research was Rapid Asia, a Bangkok-based research consulting company, that worked with civil society organizations, Raks Thai Foundation and Stella Maris Seafarers’ Center, both of which have offices in the baseline research areas and staff who are familiar with where workers work, sleep and eat. The researchers did not just go to docks to interview workers; through intercept and snowball approaches, they went to where people pray, have coffee, shop and to their homes to find respondents.
The research employed both qualitative and quantitative methods. The qualitative part allowed for more in-depth data gathering as part of the evaluation process. In this process, semi-structured interviews with 16civil society representatives were conducted. The qualitative part helped to gain more insightful findings from relevant individuals regarding the situation and critical issues about workers in the fishing and seafood industry.
Method item Survey with workers Civil society officer interviews
Targeted participants
Workers in the fishing and seafood processing sectors, including aquaculture, who had worked in the industry for at least six months, held a position as staff or supervisor, Thai and migrant workers from Myanmar and Burma, regular and irregular migrants
• State Enterprises Workers’ Relations Confederation
• Migrant Worker Rights Network• Founda t ion fo r Educa t i on and
Development• Foundation for AIDS Rights• Stella Maris Seafarers’ Center • Raks Thai Foundation• Migrant Working Group• Labour Rights Promotion Network• Human Rights and Development Foundation • Solidarity Centre• Thai Trade Union Congress
Coverage 11 provinces (not in full) in 5 coastal zones: East, Central, upper Gulf, lower Gulf and Andaman
Bangkok, Samut Sakhon, Pattani, Songkhla and Ranong
Survey method Face-to-face interviewing Supervised self-completion on paper questionnaire, checked and transferred to tablet
Data collection period
13 March to 9 April 2017 March and April 2017
Sample size n=434(plus, 40 extension interviews, which were done with the same survey respondents)
n=16
Sampling Combination of intercept and snowball sampling
Selection from target list provided by ILO
Language Thai, Khmer and Burmese Thai

Ship to shore rights50

51Baseline research findings on fishers and seafood workers in Thailand
ANNEX 2Comparative literature
In addition to the 2013 ILO survey on working conditions in fishing in Thailand, the researchers verified results on related issues covered in the 2017 ILO Tripartite Action to Protect the Rights of Migrant Workers Within and From the Greater Mekong Subregion From Labour Exploitation (TRIANGLE) baseline report (Risks and rewards: Outcomes of labour migration in South-East Asia) on returned migrants from Cambodia and Myanmar. Results were found to be similar on recruitment channels used, written work contracts, legal status and recruitment fees.
Further reading on working conditions in the Thai fishing and seafood industry can be found in the studies listed below.
International Labour Organization (ILO) and Asian Research Center for Migration. 2013. Employment practices and working conditions in thailand’s fishing sector (Bangkok, ILO).
The study provides an evidence base of working conditions and employment practices within the commercial fishing sector in four coastal provinces in Samut Sakhon, Rayong, Ranong and Songkhla.
The Asia Foundation and International Labour Organization (ILO). 2015. Migrant and child labour in thailand’s shrimp and other seafood supply chains: labour conditions and the decision to study or work (Bangkok).
The study provides an evidence base on child labour and the labour conditions of migrant workers in Thailand’s shrimp and other seafood supply chains, mainly covering Samut Sakorn, Surat Thani and Nakorn Si Thammarat provinces.
ILO TRIANGLE Project. 2017. Risks and rewards: Outcomes of labour migration in south-east asia (Bangkok).
The TRIANGLE in ASEAN Programme provides a preliminary assessment of workers’ migration experiences in Thailand after returning to Cambodia and Myanmar.
Ship to shore rights52

53Baseline research findings on fishers and seafood workers in Thailand
ANNEX 3Survey questionnaire
Record region, country of origin, industry and sex below
Province Nationality
Check quota
Rayong 1 Thai 1
Chonburi 2 Burmese 2
Samut Sakhon 3 Khmer 3
Chumporn 4 Lao 4
Surat Thani 5 Sector
Pattani 6 Fishing 1
Songkhla 7 Sea food 2
Phang Nga 8 Aquaculture 3
Phuket 9 Sex
Ranong 10 Male 1
Trang 11 Female 2
S1 What is your current work position? (Select one)
General boat crew / staff member 1Continue
Chief of crew / Supervisor 2
Higher position 3 Stop
S2 How many years have you worked in fishing / seafood production in Thailand?
ROUND UP TO THE NEAREST YEAR, IF 1 YEAR AND 6 MONTHS WRITE 2 YEARS
Less than 6 months 1 Stop
WRITE IN HOW MANY YEARS Years

Ship to shore rights54
Recruitment
R1 How did you get your current job? (Select one)
Through a registered recruitment or government agency 1
Through an unregistered recruitment agency 2
Directly with employer 3
Through family or relatives 4
Through friends 5
Other 6
R2 Did you specifically apply for this job? (Select one)
Yes 1
No 2
R3a Did you pay any recruitment fee to a broker or agent in Myanmar/ Cambodia or Thailand?
Yes No
Myanmar or Cambodia 1 2 If no to both Go to R3c
Thailand 1 2
R3b How much did you pay?
IN MYANMAR OR CAMBODIAWRITE IN AMOUNT, IF NONE WRITE ‘0’
Baht
Riel
Kyat
USD
Don’t remember 99
IN THAILAND WRITE IN AMOUNT, IF NONE WRITE ‘0’
Baht
Riel
Kyat
USD
Don’t remember 99
R3c How much money did you have to borrow or take as advance on your salary?
WRITE IN AMOUNT, IF NONE WRITE ‘0’ Baht
Riel
Kyat
USD

55Baseline research findings on fishers and seafood workers in Thailand
R4a Did you receive written work contract for your current job? (Select one)
Yes 1 Continue
No 2 Go to R5
R4b Based on your work contract, which of the following is true? READ OUT ONE BY ONE
Yes No
Is the contract in your native language? 1 2
Do you understand the contract terms? 1 2
Were you given a copy to keep? 1 2
Have you used it in discussion with your employer or other workers? 1 2
R5** When you started this job was the work conditions worse, the same or better compared to what was stated in your work contract or based on what you had been told? (Select one)
Worse 1 Continue
Same 2
Go to R7aBetter 3
Don’t know 4
R6** What work conditions were worse? (Select all that apply)
Salary 1
Work hours / Overtime 2
Work location 3
Work days 4
Safety/danger of the job 5
Housing and living conditions 6
Work tasks 7
Benefits such as sick leave, medical care etc. 8
Freedom of movement 9
Food and water 10
Other 11

Ship to shore rights56
R7a Did you ever work for another employer in Thailand? (Select one)
R7b Is it likely you will change to a different employer in the next 12 months? (Select one)
R7a R7b
No or not sure 1 1 Go to R9
Domestic work 2 2
Continue
Fishing 3 3
Seafood processing 4 4
Agriculture 5 5
Manufacturing 6 6
Construction 7 7
Hospitality/tourism 8 8
Restaurant 9 9
Entertainment 10 10
Other 11 11
R8 What is the reason you may change employer? (Select all that apply)
Earn more income 1
Better accommodation 2
Better benefits 3
Closer or easier to go home 4
Avoid mistreatment 5
End of visa or work permit 6
No more work available 7
Forced to move by employer 8
Other 9
Ask burmese and cambodian onlyR9 How many more years do you plan to stay in Thailand? ROUND UP TO THE NEAREST YEAR, IF 1 YEAR AND 4 MONTHS WRITE 2 YEARS
WRITE IN HOW MANY YEARS
Don’t know 99

57Baseline research findings on fishers and seafood workers in Thailand
R10** Do any of the following apply to you? (Select all that apply)
You need to work because you need to repay debt 1
You need to work to help a family member who is in trouble 2
You need to work to help someone else to get a job 3
You need to work because someone received money to let you work here 4
You need to work because a large part of your salary is being withheld 5
You need to work because you can’t get work elsewhere 6
None 7
Employment Conditions
Fishers onlyE1 How long are you normally out at sea on a usual fishing trip?
Days Weeks Months
Fishers onlyE2 What type of fishing boat are you working on? (Select one)
Single trawl 1
Twin trawl 2
Purse seine 3
Floating seine 4
Squid boat 5
Tour boat 6
Other 7
Fishers onlyE3** While out at sea in the past year, has another boat ever brought or picked up things from your boat to allow your boat to stay out on the water longer? (Select all that apply)
Yes, to bring food / water 1
Yes, to take fish 2
Yes, to bring or change fishers 3
Yes, other reason 4
No 5

Ship to shore rights58
Fishers onlyE4a** How many resting hours per day do you normally have when out at sea?
Hours per day
E4b** How many hours per day do you normally work?
Hours per day
E5** How many days per week do you normally work? (Select one)
1 2 3 4 5 6 7 Days per week
E6 How is your salary determined? (Select one)
Fixed salary 1
FISHERS
Fixed salary plus share of catch 2
Share of catch only 3
SEAFOOD PRODUCTION
Fixed salary plus extra hard working bonus 4
Hard working bonus only 5
Other SPECIFY 6
E7a** How often do you get paid? (Select one)
E7b What is your normal/average monthly income?
E7a E7b
Daily 1
WRITE IN INCOME Baht Go to E9Weekly 2
Monthly 3
Lump sum after a longer period
4WRITE IN AMOUNT Baht
ContinueWRITE IN MONTHS Months
Other (EXPLAIN) 5 Baht Go to E9
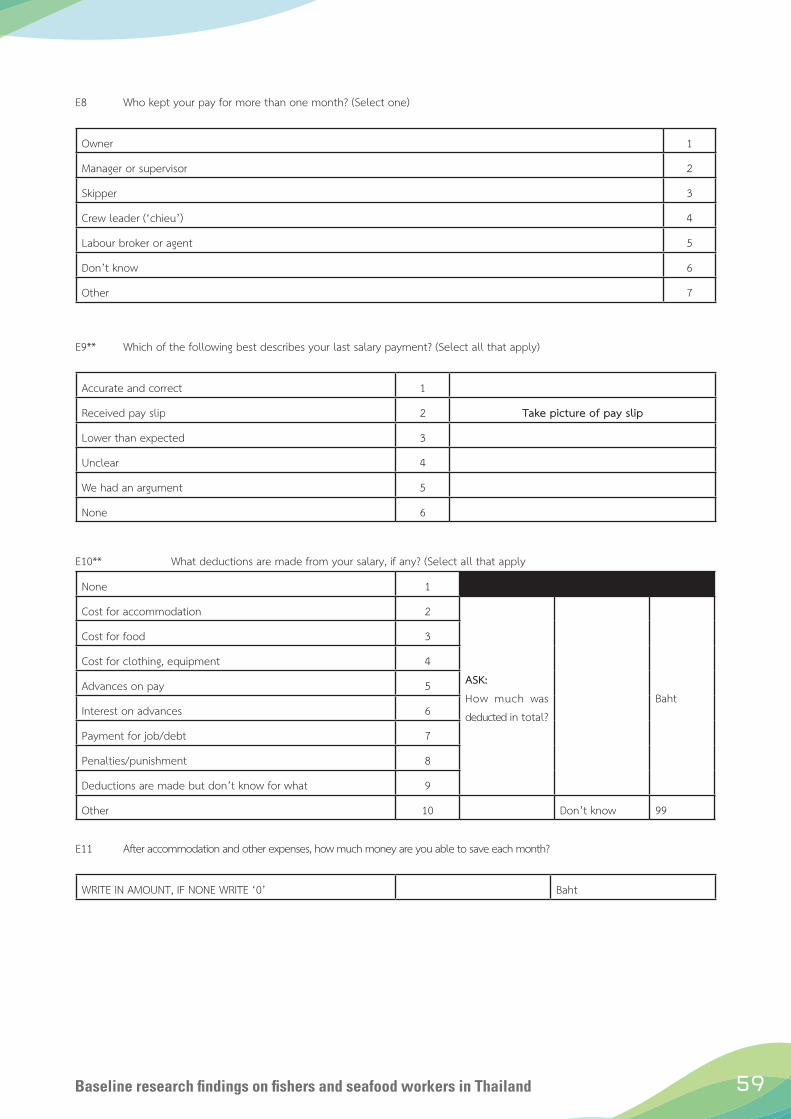
59Baseline research findings on fishers and seafood workers in Thailand
E8 Who kept your pay for more than one month? (Select one)
Owner 1
Manager or supervisor 2
Skipper 3
Crew leader (‘chieu’) 4
Labour broker or agent 5
Don’t know 6
Other 7
E9** Which of the following best describes your last salary payment? (Select all that apply)
Accurate and correct 1
Received pay slip 2 Take picture of pay slip
Lower than expected 3
Unclear 4
We had an argument 5
None 6
E10** What deductions are made from your salary, if any? (Select all that apply
None 1
Cost for accommodation 2
ASK: How much was deducted in total?
Baht
Cost for food 3
Cost for clothing, equipment 4
Advances on pay 5
Interest on advances 6
Payment for job/debt 7
Penalties/punishment 8
Deductions are made but don’t know for what 9
Other 10 Don’t know 99
E11 After accommodation and other expenses, how much money are you able to save each month?
WRITE IN AMOUNT, IF NONE WRITE ‘0’ Baht

Ship to shore rights60
E12 Which of the following have been provided to you in your current job? (Select all that apply)
Paid holidays or annual leave 1
Paid sick leave 2
One-day off per week 3
Paid maternity leave 4
Overtime pay 5
None 6
E13 Are you enrolled in any government or private sector benefit scheme? (Select all that apply)
Social security 1
Workers’ compensation 2
Government health insurance 3
Private health insurance 4
Education or training 5
Other 6
No 7
Ask burmese and cambodian onlyE14 Which of the following documents do you currently have? (Select one)
Passport, visa and work permit (MOU) 1
Continue
Temporary passport/certificate of identity, visa and work permit (NV) 2
Registration card (‘pink card’ or Tor Ror 38/1) 3
Passport and visa only 4
Passport only 5
Other 6
None 7 Go to E16
E15** Do you have access to your documents? (Select one)
Yes, I keep them with me 1
Yes, but someone safe keep them for me 2
No, they were taken from me 3
Ask burmese and cambodian onlyE16a Did you ever work without legal permission while in Thailand?
Yes 1 E16b ASK: How many months?Months
No 2 Continue

61Baseline research findings on fishers and seafood workers in Thailand
E17a Have you ever had to make an informal payment to a government official in Thailand? (Select one)
Yes, I did myself 1
Yes, someone did for me 2
No 3
E17b Have you ever been asked by a Thai government official about human trafficking, how you were recruited or your working conditions?
Yes 1
No 2
E18a In the past 12 months, have you ever heard of anyone experiencing any of the following while working in Thailand? (Select all that apply)
E18b** In the past 12 months, have you ever experience any of the following while working in Thailand? (Select all that apply)
E18a E18b
Salary deductions without reason 1 1
Continue
Working longer than 10 hours on most days 2 2
Been forced/required to work overtime 3 3
Injured at work requiring medical attention 4 4
Prolonged sickness due to work 5 6
Identity documents taken away 6 6
Mobile phone taken away 7 7
Being locked up at work/dormitory 8 8
Different treatment between women and men 9 9
Termination due to pregnancy 10 10
Doing dangerous work where you thought you could get seriously injured 11 11
Doing work that could be illegal 12 12
Being asked or forced to provide sexual services 13 13
Harassment or verbal abuse 14 14
Threats of violence 15 15
Physical violence 16 16
Punished by not getting food, water or sleep 17 17
Being forced to transfer to another employer 18 18
Execution 19 19
Worker killed in an accident 20 20
Workers refusing to work in protest to employer 21 21
Working in a very filthy workplace 22 22
None 23 23 Go to E23
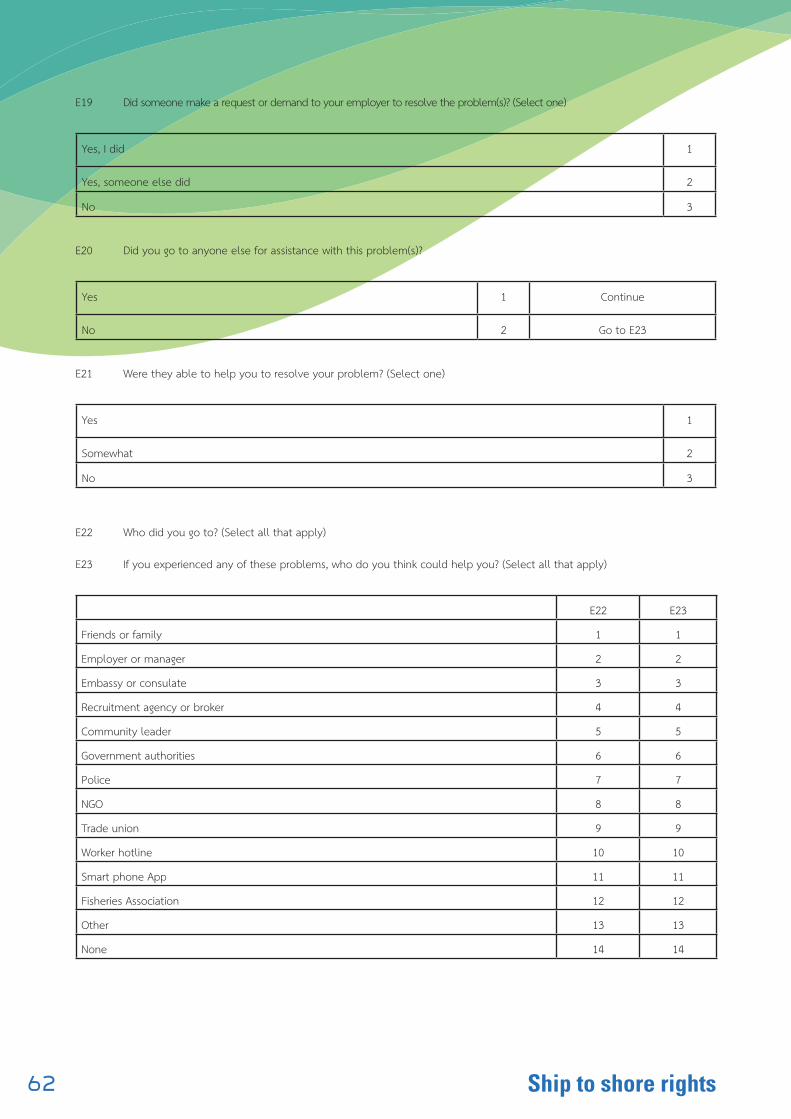
Ship to shore rights62
E19 Did someone make a request or demand to your employer to resolve the problem(s)? (Select one)
Yes, I did 1
Yes, someone else did 2
No 3
E20 Did you go to anyone else for assistance with this problem(s)?
Yes 1 Continue
No 2 Go to E23
E21 Were they able to help you to resolve your problem? (Select one)
Yes 1
Somewhat 2
No 3
E22 Who did you go to? (Select all that apply)
E23 If you experienced any of these problems, who do you think could help you? (Select all that apply)
E22 E23
Friends or family 1 1
Employer or manager 2 2
Embassy or consulate 3 3
Recruitment agency or broker 4 4
Community leader 5 5
Government authorities 6 6
Police 7 7
NGO 8 8
Trade union 9 9
Worker hotline 10 10
Smart phone App 11 11
Fisheries Association 12 12
Other 13 13
None 14 14

63Baseline research findings on fishers and seafood workers in Thailand
Services
M1 Have you joined any union or association? (Select all that apply)
M2 Which ones would you like to join? (Select all that apply)
M1 M2
No 1 1
Trade union 2 2
Migrant worker association 3 3
Women’s group 4 4
Religious group 5 5
Welfare committee 6 6
Other 7 7
M3 What support services have you received in Thailand? (Select all that apply)
M4 What support services would you like to have? (Select all that apply)
M3 M4
Legal services 1 1
Health services 2 2
Educational assistance for your children 3 3
Work skills training 4 4
Training on labor rights 5 5
None 6 6
Ask if M3 selected M5 Who provided the training/ services? (Select all that apply)
Union 1
Migrant community organization 2
Country of origin organization 3
Government 4
Employer 5
Family/friends 6
Other 7

Ship to shore rights64
M6 Do you send money home to your family?
M7 How many times per year do you send money home? (Select one) IF EVERY MONTH CIRCLE 12
M8 How much do you normally send each time? WRITE IN AMOUNT
M6 M7 M8
Yes 1 Continue 1 2 3 4 5 6 7 8 9 10 11 12 Baht
No 2 Go to L1
M9 Which of the following channels do you normally use to send money home? (Select one)
Bank 1 Continue
Money transfer organization (e.g. Western Union, MoneyGram, etc.) 2
Hundi or broker system 3
Hand carry by family or friend 4
Other channel 5
Hand carry by myself 6 Go to L1
M10 How much did you normally pay in fees when sending money home? IF NO FEE PUT ZERO
Baht
Don’t know 99
Living conditions
L1 What type of accommodation do you currently live in? (Select one)
House 1
Apartment 2
Room 3
Stay on the boat 4
Shelter 5
Other 6

65Baseline research findings on fishers and seafood workers in Thailand
L2** How much space do you have for yourself and your family? (Select one)
The whole house 1
The whole apartment 2
One room 3
One bed 4
None 5
L3** Who do you share your accommodation with? (Select one)
None, live by myself 1 L4
Family or relatives 2ASK: How many people in total
including yourself?_________ PeopleFriends 3
Other workers 4
L5 Which of the following facilities do you have access to? (Select all that apply)
Proper toilet 1
Proper shower 2
Running water 3
Electricity 4
Fan 5
Own bed 6
Locker 7 L6 (Select all that apply)
Television 8 Facebook 1
Radio 9 Twitter 2
Regular mobile phone 10 Google+ 3
Smart phone 11 Instagram (IG) 4
Social media subscription 12 Which ones Other 5
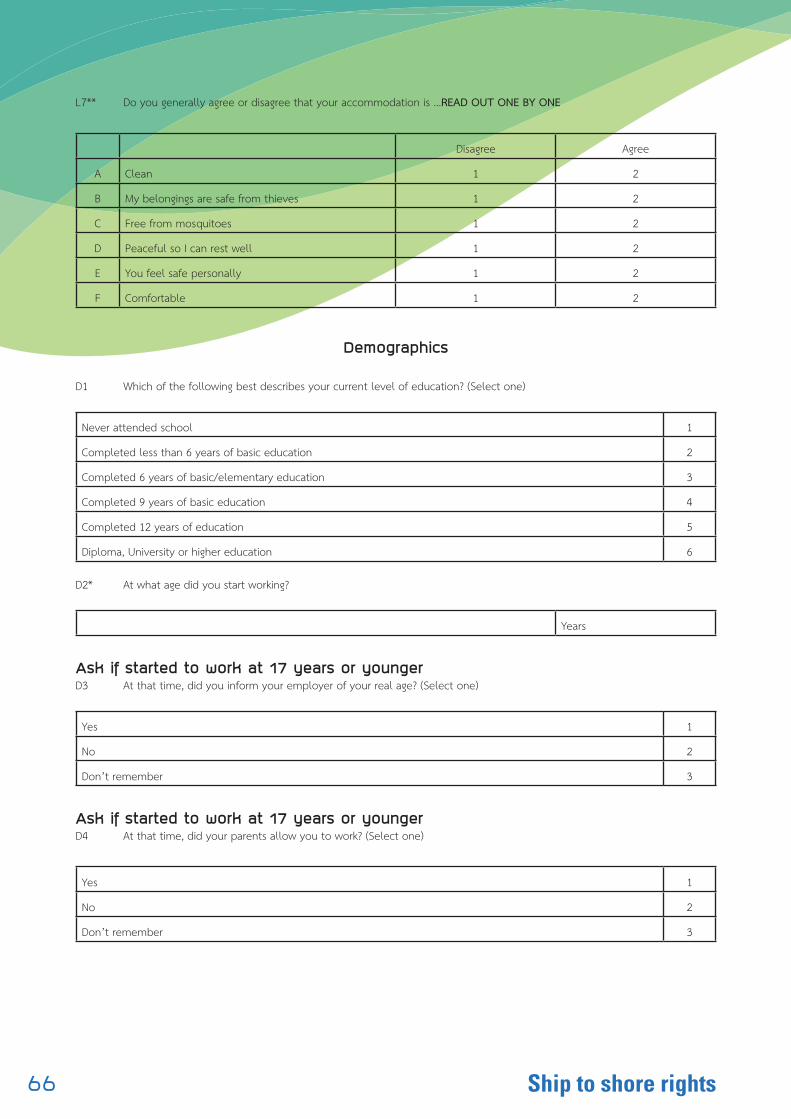
Ship to shore rights66
L7** Do you generally agree or disagree that your accommodation is …READ OUT ONE BY ONE
Disagree Agree
A Clean 1 2
B My belongings are safe from thieves 1 2
C Free from mosquitoes 1 2
D Peaceful so I can rest well 1 2
E You feel safe personally 1 2
F Comfortable 1 2
Demographics
D1 Which of the following best describes your current level of education? (Select one)
Never attended school 1
Completed less than 6 years of basic education 2
Completed 6 years of basic/elementary education 3
Completed 9 years of basic education 4
Completed 12 years of education 5
Diploma, University or higher education 6
D2* At what age did you start working?
Years
Ask if started to work at 17 years or youngerD3 At that time, did you inform your employer of your real age? (Select one)
Yes 1
No 2
Don’t remember 3
Ask if started to work at 17 years or youngerD4 At that time, did your parents allow you to work? (Select one)
Yes 1
No 2
Don’t remember 3

67Baseline research findings on fishers and seafood workers in Thailand
D5* How old are you? WRITE IN AGE AND CIRCLE AGE GROUP BELOW
Current Age Years
Below 13 years 1
Continue13 – 14 years 2
15 – 17 years 3
18 – 19 years 4
20 – 24 years 5
Go to D9
25 - 29 years 6
30 - 34 years 7
35 – 39 years 8
40 years or older 9
D6 Are you still attending school?
Yes 1 Go to D8
No 2 Continue
D7 Why are you not attending school? (Select all that apply)
Disability or illness 1
Can’t afford to go to school 2
School is too far away 3
My parents want me to work 4
Need to support myself or my family 5
Don’t have the required documents 6
Rejected by school 7
Not interested in school 8
Other 9

Ship to shore rights68
D8 How does your work affect your study? (Select all that apply)
You often miss school 1
You often come late 2
Not enough time to do homework 3
Feel too tired to do homework 4
Work allows you to afford school 5
Other 6
None 7
Yes No
D9 Are you married? 1 2
D10 Do you have children? 1 2 If yes, How many children?
Go to survey extension

69Baseline research findings on fishers and seafood workers in Thailand
Survey extension
A IS IT LIKELY THIS PERSON HAS BEEN A VICTIM OF FORCED LABOUR? SEE: QUESTIONS (**)
Yes 1 ASK FOR FOLLOW UP INTERVIEW
No 2
B IS THIS PERSON UNDER 18 NOW OR STARTED TO WORK WHEN UNDER 18? SEE: D2 D5 (*) AND E4b (**)
Yes 1 ASK FOR FOLLOW UP INTERVIEW
No 2
C IF YES TO A ASK: Would you agree if an NGO was to contact you in the future?
Yes 1ASK THEM TO PROVIDE CONTACT NUMBER
Number:
No 2
Supervisor Check List
FORCED LABOR Instruction
Question
R5 Work conditions worse than agreed
R6* Don’t have freedom to move
R10 Debt or withholding wages / Helping someone in trouble
E3* Suspicious trafficking activity at sea (witnessed or trafficked?)
E4a E4b 8 rest hours or less per day / Work 12 hours per day or longer
E5 Work 7 days per week
E7a Paid in lumpsum
E9 Wages paid are lower than expected or unclear
E10 Unknown salary deduction is made
E15* Taken ID documents
E18b* Experienced being locked up, violence or threats
L2 Poor living conditions
L3
L7
*Priority issues of forced labour

Ship to shore rights70
CHILD LABOR Instruction
Question
E4b Work 10 hours per day or longer
D2 Started to work under the age of 18
D5 Is currently under the age of 18
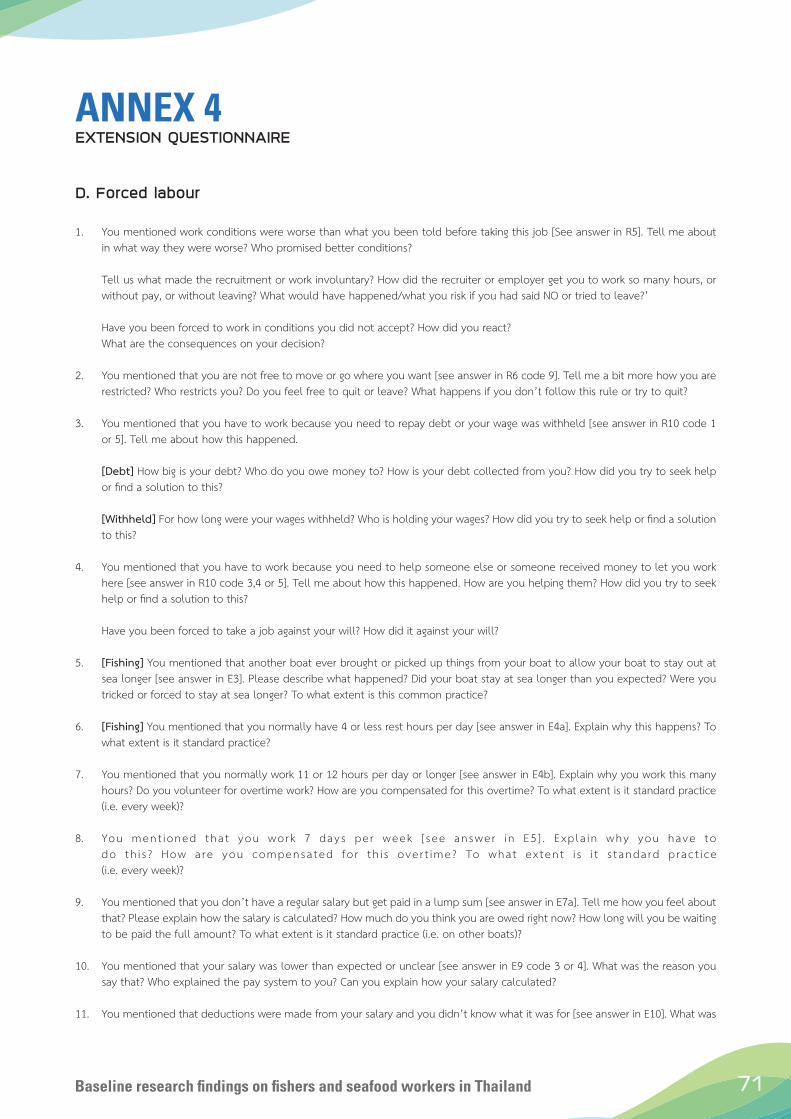
71Baseline research findings on fishers and seafood workers in Thailand
ANNEX 4EXTENSION QUESTIONNAIRE
D. Forced labour
1. You mentioned work conditions were worse than what you been told before taking this job [See answer in R5]. Tell me about in what way they were worse? Who promised better conditions?
Tell us what made the recruitment or work involuntary? How did the recruiter or employer get you to work so many hours, or without pay, or without leaving? What would have happened/what you risk if you had said NO or tried to leave?’
Have you been forced to work in conditions you did not accept? How did you react? What are the consequences on your decision?
2. You mentioned that you are not free to move or go where you want [see answer in R6 code 9]. Tell me a bit more how you are restricted? Who restricts you? Do you feel free to quit or leave? What happens if you don’t follow this rule or try to quit?
3. You mentioned that you have to work because you need to repay debt or your wage was withheld [see answer in R10 code 1 or 5]. Tell me about how this happened.
[Debt] How big is your debt? Who do you owe money to? How is your debt collected from you? How did you try to seek help or find a solution to this?
[Withheld] For how long were your wages withheld? Who is holding your wages? How did you try to seek help or find a solution to this?
4. You mentioned that you have to work because you need to help someone else or someone received money to let you work here [see answer in R10 code 3,4 or 5]. Tell me about how this happened. How are you helping them? How did you try to seek help or find a solution to this?
Have you been forced to take a job against your will? How did it against your will?
5. [Fishing] You mentioned that another boat ever brought or picked up things from your boat to allow your boat to stay out at sea longer [see answer in E3]. Please describe what happened? Did your boat stay at sea longer than you expected? Were you tricked or forced to stay at sea longer? To what extent is this common practice?
6. [Fishing] You mentioned that you normally have 4 or less rest hours per day [see answer in E4a]. Explain why this happens? To
what extent is it standard practice?
7. You mentioned that you normally work 11 or 12 hours per day or longer [see answer in E4b]. Explain why you work this many hours? Do you volunteer for overtime work? How are you compensated for this overtime? To what extent is it standard practice (i.e. every week)?
8. You ment ioned tha t you work 7 days pe r week [ see answer i n E5 ] . Exp la in why you have to do th i s ? How a re you compensa ted fo r th i s ove r t ime? To what ex ten t i s i t s t anda rd p rac t i ce (i.e. every week)?
9. You mentioned that you don’t have a regular salary but get paid in a lump sum [see answer in E7a]. Tell me how you feel about that? Please explain how the salary is calculated? How much do you think you are owed right now? How long will you be waiting to be paid the full amount? To what extent is it standard practice (i.e. on other boats)?
10. You mentioned that your salary was lower than expected or unclear [see answer in E9 code 3 or 4]. What was the reason you say that? Who explained the pay system to you? Can you explain how your salary calculated?
11. You mentioned that deductions were made from your salary and you didn’t know what it was for [see answer in E10]. What was

Ship to shore rights72
the reason you say that? How much salary do you get paid and how much do you think it should be? Who explained the pay system to you? To what extent has this happened to other workers on other boats?
12. You mentioned that your ID documents were taken from you [see answer in E15]. Tell me a bit more about how this happened. If you needed access to your ID documents what would you do? Do you have any concerns about this issue?
Have you been unable to quit a job in normal conditions? What are the reasons you could not quit? How long did you contiue working there after you raised the quit issues. Do anything change after all?
13. You mentioned that you experienced being locked up, violence or threats [see answer in E18b]. Tell me a bit more about what happened. Has this happened to other workers you know? Did you seek help? How or why not?
Follow-up questions
F. Child labour
14. You mentioned you started to work under the age of 18 [see answer in D2]. Please tell me about the type of work you did during that time.a. How many days per week did you work?b. How many hours per day?c. How would you describe the working conditions?
15. You mentioned you are under the age of 18 [see answer in D5]. Please tell me about the job you currently do.a. How old were you when you first started?b. Does the work affect your studies?c. Did your parents allow/ force you to work?d. How would you describe the working conditions?
16. You mentioned that you normally work 10 hours per day or longer [see answer in E4b]. Explain why you work this many hours? How are you compensated for this overtime? To what extent is it standard practice?
Ask the respondent if they have the following documents. Ask the permission to take a photo. Remind them that it is confidential.
Documents HavePhoto
Yes No
A. Pay records
B. Hours records
C. Work contracts (last 2 years)
D. Other, please list
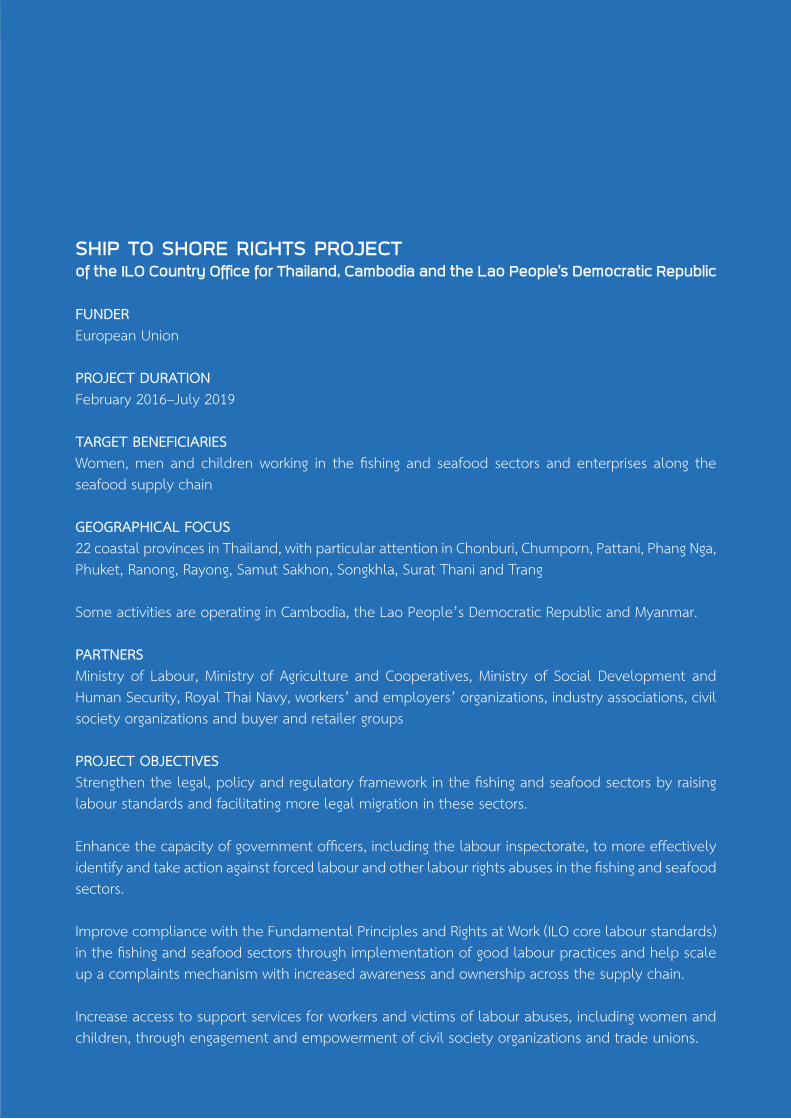
SHIP TO SHORE RIGHTS PROJECT of the ILO Country Office for Thailand, Cambodia and the Lao People’s Democratic Republic
FUNDEREuropean Union
PROJECT DURATIONFebruary 2016–July 2019
TARGET BENEFICIARIESWomen, men and children working in the fishing and seafood sectors and enterprises along the seafood supply chain
GEOGRAPHICAL FOCUS22 coastal provinces in Thailand, with particular attention in Chonburi, Chumporn, Pattani, Phang Nga, Phuket, Ranong, Rayong, Samut Sakhon, Songkhla, Surat Thani and Trang
Some activities are operating in Cambodia, the Lao People’s Democratic Republic and Myanmar.
PARTNERSMinistry of Labour, Ministry of Agriculture and Cooperatives, Ministry of Social Development and Human Security, Royal Thai Navy, workers’ and employers’ organizations, industry associations, civil society organizations and buyer and retailer groups
PROJECT OBJECTIVESStrengthen the legal, policy and regulatory framework in the fishing and seafood sectors by raising labour standards and facilitating more legal migration in these sectors.
Enhance the capacity of government officers, including the labour inspectorate, to more effectively identify and take action against forced labour and other labour rights abuses in the fishing and seafood sectors.
Improve compliance with the Fundamental Principles and Rights at Work (ILO core labour standards) in the fishing and seafood sectors through implementation of good labour practices and help scale up a complaints mechanism with increased awareness and ownership across the supply chain.
Increase access to support services for workers and victims of labour abuses, including women and children, through engagement and empowerment of civil society organizations and trade unions.

ILO Country Office for Thailand, Cambodia and Lao People's Democratic RepublicUnited Nations BuildingRajadamnern NokBangkok 10200, ThailandTel: +662 288 1762Fax: +662 280 1735Email: [email protected]
This project is funded byThe European Union
Baseline research findings on fishers and seafood workers in ThailandThe EU-funded ILO Ship to Shore Rights Project conducted the baseline research on Thai fishing and seafood industry in March and April 2017.
The research surveyed 434 workers in 11 provinces within Chonburi, Chumporn, Pattani, Phang Nga, Phuket, Rayong, Samut Sakhon, Songkla, Surat Thani, Trang and Ranong provinces. Workers surveyed were divided almost evenly between those who work in fishing and seafood processing (which included aquaculture.) The research covered workers recent experience in the industry on recruitment, wages, hours, safety and health, support services, complaint mechanisms, living conditions, forced labour indicators, and legal compliance levels.
ISBN: 978-92-2-030691-8 (print)
978-92-2-030692-5 (web pdf)