BASELINE REPORT ON COASTAL RESOURCES - PCSD SEMP Reports/Coron Baseline… · 26.4 Pattern of Uses...
119
Transcript of BASELINE REPORT ON COASTAL RESOURCES - PCSD SEMP Reports/Coron Baseline… · 26.4 Pattern of Uses...

BASELINE REPORT ON COASTAL RESOURCES for Coron, Municipality
September 2006

Prepared for:
PALAWAN COUNCIL FOR SUSTAINABLE DEVELOPMENT Palawan Center for Sustainable Development
Sta. Monica Heights, Puerto Princesa City, Palawan, Philippines 5300 Email: [email protected]
Tel.: (63-48) 434-4235, Fax: 434-4234
Funded through a loan from :
JAPAN BANK FOR INTERNATIONAL COOPERATION
Prepared by:
PACIFIC CONSULTANTS INTERNATIONAL in association with
ALMEC Corporation CERTEZA Information Systems, Inc.
DARUMA Technologies Inc. Geo-Surveys & Mapping, Inc.
Photo Credits:
Photos by PCSDS and SEMP-NP ECAN Zoning Component Project Management Office
This report can be reproduced as long as the convenors are properly acknowledged as the source of information
Reproduction of this publication for sale or other commercial
purposes is prohibited without the written consent of the publisher.
Printed by:
Futuristic Printing Press, Puerto Princesa City, Philippines
Suggested Citation:
PCSDS. 2006. Baseline Report on Coastal Resources for Coron, Municipality, Palawan Council for Sustainable Development, Puerto Princesa City, Palawan

____________________________________________________________________________________ iii
TABLE OF CONTENTS List of Tables iv List of Figures vii List of Plates x EXECUTIVE SUMMARY xi CHAPTER I: CORAL REEFS 1 1.0 Objectives 1 2.0 Materials and Methods 1 3.0 Results 1 4.0 Discussions 7 5.0 Summary 13 6.0 Recommendations 13 CHAPTER II: REEF FISHES 14 7.0 Introduction 14 8.0 Materials and Methods 14 9.0 Results 14 10.0 Discussions 18 11.0 Conclusions and Recommendations 19 CHAPTER III: SEAGRASS AND SEAWEEDS 20 12.0 Introduction 20 13.0 Materials and Methods 20 14.0 Results 21 15.0 Discussions 56 16.0 Conclusions and Recommendations 57 CHAPTER IV: MARINE MAMMALS AND SEA TURTLES 58 17.0 Introduction 58 18.0 Materials and Methods 58 19.0 Results 60 20.0 Discussions 69 21.0 Conclusions and Recommendations 71

____________________________________________________________________________________ iv
CHAPTER V: MANGROVE FOREST 73 22.0 Introduction 73 23.0 Objectives 73 24.0 Expected Outputs 74 25.0 Methods 74 26.0 Results and Discussions 83 26.1 Biodiversity Assessment 83 26.2 Mangrove Vegetation Structural Analysis 88 26.3 Mangrove Pattern of Uses and Existing Land Use/Forest Condition 90 26.4 Pattern of Uses and Ecological State of Mangrove 96 26.5 Mangrove Management Zoning and Proposed Strategy 100 27.0 Issues and Concerns 102 28.0 Recommendations 104 REFERENCES 105

____________________________________________________________________________________ v
LIST OF TABLES Table No.
Title Page No.
1 Locations of Reef areas with High Hard Coral (HC) Cover of 4 (51-
75%) and 5 (76-100%), Coron, Palawan, 2003 8
2 Locations of Reef areas with High Hard Coral (HC) percentage Cover Surveyed by Werner and Allen (2000), Coron, Palawan, 2003
9
3 Exploited Marine (large) Species Encountered during the Manta Tow Surveys of Coral Reefs, Coron, Palawan, 2003
11
4 Top Ten most Common Target Fish Species, Coron, Palawan, August to September 2004
16
5 Frequency of Occurrence of High-Value Target Fish Species, Coron, Palawan, August to September 2004
17
6 Top Ten most Common Major Fish Species, Coron, Palawan, August to September 2004
17
7 Top Five most Common Indicator Fish Species, Coron, Palawan, August to September 2004
18
8 Locations of the Macrophyte Stations Surveyed in the different Coastal Barangays of Coron (August 2003). Legend: N=sample size; * mean perpendicular distance inhabited by macrophytes, from shore edge to seaweed end; S=sand, R=rubble, DC=dead coral, RCK=rock, and M-mud
22
9 Coron, August 2003-seagrass cover profile (mean% SEM) on the edges (i.e., incidence at shore), within the bed proper, and on the seaweed ends, Legend: *stations with cover ≥ 50% (hight)
32
10 Coron, August 2003 – seaweed cover profile (mean % ± SEM) on the edges (i.e. inshore incidence), within the bed proper, and on the seaweed ends. Legend: * stations with intermediate cover (between 26 and 49%), ** stations with high cover (≥50%)
37
11 Coron, August 2003 – species richness and the relative frequency (%) of seagrasses for each station and for each barangay (pooled means ± SEM). ENHA=Enhalus acoroides, THALI=Thalassia hemprichii, CYRO=Cymodocea rotundata, CYSE=Cymodocea serrulata, SYRI=Syringodium isoetifolium, HUNI=Halodule uninervis, HPIN=Halodule pinifolia, HOVA=Halophila ovalis, HALO=Halophila sp. (minor and/or decipiens)
42
12 Marine Macrobenthic Algae (genera), Genera with asterisks (*) were the most frequency encountered in the surveys, Coron, Palawan, August 2003
55
13 Estimated Number of Fisherfolks in the Municipality of Coron* 59 14 Location and Position of Belt Transects Surveyed by Coron, Palawan,
2003 75

____________________________________________________________________________________ vi
Table No.
Title Page No.
15 List of True and Asssociate Mangrove Species Identified and
Recorded in Coron, Palawan, 2003 83
16 Distribution and Abundance of Top Ten (10) Mangrove Species in Different Sampling Sites of Coron, Palawan, 2003
85
17 The diversity indices of 20 sampling sites in mangrove forest of Coron, Palawan calculated using different diversity formula, Coron, Palawan, 2003
86
18 The Relative Values of the Average Overall Diversity Index and Evenness of Mangroves based on Fernando Biodiversity Scale (1998), Coron, Palawan, 2004
86
19 Comparison of Biodiversity Index of Mangrove Habitat in Other Countries/Sites, 2004
87
20 The RF, RDen, RDom, and IV of Top Fifteen (15 Mangrove Species in Coron, Palawan, 2003
88
21 Average Stocking (H/ha) of Timber and Pole Size Trees/Transect in Coron, Palawan, 2003
89
22 Stand Volume (m3/ha) of Timber and Pole by Transect in Coron, Palawan, 2003
90
23 Area/Extent of Mangroves and Mudflats by Barangay in Coron, Palawan based on SPOT Imageries, 2003
92
24 Stocking of Mangrove Vegetation based on REA and SPOT Imageries by Forest Condition Classification and by Barangay, Coron, Palawan, 2003
93
25 Total Volume of Mangrove Forest based on the Result of REA and Interpretation of SPOT Imageries, Coron, Palawan, 2003
94
26 Species Stocking (N/ha) According to dbh Class with Percentage Distribution of Top Ten (10) Mangrove Species in Coron, Palawan, 2003
95
27 Species Volume (m3/ha) Distribution by dbh Class with Percentage of Top Ten (10) Mangrove Species in Coron, Palawan, 2003
96
28 Mangrove Index of Degradation and Ecological Condition Indices based on Forest Structure and Ecological Diversity, Coron, Palawan, 2003
98
29 Ranking of Mangrove Ecological Indices for ECAN Zoning and Potential Management Options, Coron, Palawan, 2003
100
30 Recommended Management Strategy for Mangrove Areas Evaluated by Transect, Coron, Palawan, 2003
101
31 Listing of PO Awarded with CBFMA, Coron, Palawan 103

____________________________________________________________________________________ vii
LIST OF FIGURES
Figures No.
Title Page No.
1 Baseline Survey Areas of the ECAN Marine Team Using the Manta
Tow Technique around Coron, Palawan are shown in red dots. Survey Data from PCSDS (2000) and Werner and Allen (2000) are shown in dots of green and blue, respectively, Coron, Palawan, 2003
2
2 Manta Tow scores of the areas visited during the Coral Reef Surveys of Coron, Palawan, percent Cover of the scores are as follows: 0=None, 1=up to 10%, 2=11-30%, 3=31-50%, 4=51-75% and 5= 76-100%, Coron, Palawan, 2003
3
3 Coral Reef Areas around Coron, Palawan having Coral Cover of between 31-50%, Coron, Palawan, 2003
4
4 Coral Reef Areas around Coron, Palawan having Coral Cover of between 51-75%, Coron, Palawan, 2003
5
5 Coral Reef Areas around Coron, Palawan having Coral Cover of between 76-100%, Coron, Palawan, 2003
6
6 Candidate Coral Reef Core Zones based on High Percentage Cover of Corals ( 50%), Coron, Palawan, 2003
9
7 Exploited Marine (Large) Species Encountered during the Manta Tow Surveys of Coral Reefs, Coron, Palawan, 2003
10
8 Sampling Points for Reef Fish Observation, Coron, Palawan, August to September 2003
15
9 Distribution of 44 Stations (•) surveyed for baseline data on seagrasses and seaweeds. Numbers next to filled circles are station names, Coron, Palawan, August 2003
20
10 Distribution of the 44 Macrophyte Stations by Bed Width, Coron, Palawn, 2003
25
11 Cross-bed depth profiles and bed widths (both in meters) of the macrophyte stations: A-narrow beds, B-medium-width beds, C-wide beds; the horizontal axes vary from A to C. Stations are arranged by barangay as outlined in Table 1 (top to bottom, left to right column; see also Figure 9 and 10), Coron, Palawan, 2003
26
12 Bottom cover of A-seagrass and B-seaweeds across the bed zones, Circles represent mean values; lines above and below the means are the maxima and minima, respectively. Dotted horizontal line in A= borderline value separating dense and sparse seagrass-covered bottoms (PCSDS, 1994, Coron, August 2003
35
13 Mean Cover of Seaweeds per Stations Range 0.2 to 37% scaled by the size of the Circles, Coron, Palawan, 20003
36
14 Mean cover of seaweeds per stations (range 1 to 63%, scaled by the size of the circles), Coron, Palawan 2003
40

____________________________________________________________________________________ viii
Figures No.
Title Page No.
15 Relative frequency of occurrence (%) of each seagrass species (scaled
by the size of the circles using species-specific data limits), Coron, Palawan, August 2003
50
16 The distribution of the stations by A=seagrass species richness and B=number of seaweed genera, Coron, Palawan, August 2003
51
17 Diversity of the meadows (as species richness N, Range=1 to 9 scaled by the size of the circles), Coron, Palawan, August 2003
52
18 The profile of A=seagrass species richness and B=number of seaweed genera across the bed zones. Circles represent mean values; lines above and below the means are the maxima and minima, respectively, Coron, Palawan August 2003
53
19 Two communities of seagrasses classified by TWINSPAN using the relative occurrence of each species (%) as attribute, green circles – N=5 to 9, with at least 5 species common in the meadows; red circles – N= 1 to 7 with only 2 to 3 frequency encountered species, Coron, Palawan, August 2003
54
20 Reported Dugong Sightings (red squares), Coron, Palawan, 2003 61 21 Reported Turtle Sightings (green circles) and Turtle Nests (circle with
x), Coron, Palawan, 2003 62
22 Reported Dolpin Sightings (blue circles), Coron, Palawan, 2003 63 23 Reported Whale Sightings (black star); Orca Sightings (fish icon),
Coron, Palawan, 2003 64
24 Dugong Sightings, Barangay 1:Bintuan, 2:Borac, 3:Buenavista, 4:Bulalacao, 5:Decabobo, 6:Decalachao, 7:Lajala, 8:Malawig, 9:Marcilla, 10:Tagumpay, 11:Tara, 12:Turda, 13:San Jose, Coron, Palawan, 2003
65
25 Turtle Sightings, Barangay 1:Bintuan, 2:Borac, 3:Buenavista, 4:Bulalacao, 5:Decabobo, 6:Decalachao, 7:Lajala, 8:Malawig, 9:Marcilla, 10:Tagumpay, 11:Tara, 12:Turda, 13:San Jose, Coron, Palawan, 2003
65
26 Dolpin Sightings, Barangay 1:Bintuan, 2:Borac, 3:Buenavista, 4:Bulalacao, 5:Decabobo, 6:Decalachao, 7:Lajala, 8:Malawig, 9:Marcilla, 10:Tagumpay, 11:Tara, 12:Turda, 13:San Jose, Coron, Palawan, 2003
66
27 Whale Sightings, Barangay 1:Bintuan, 2:Borac, 3:Buenavista, 4:Bulalacao, 5:Decabobo, 6:Decalachao, 7:Lajala, 8:Malawig, 9:Marcilla, 10:Tagumpay, 11:Tara, 12:Turda, 13:San Jose, Coron, Palawan, 2003
66
28 Knowledge of Laws, 1-Barangay Captains, 2-BFAR/Fisheries, 3-Coron Municipal Gov’t., 4-Environmental Legal Assistance Center (ELAC), 5-Fellow Fishermen, 6-Posters, 7-Radio, Coron, Palawan, 2003
68
29 Municipality of Coron, Palawan 74

____________________________________________________________________________________ ix
Figures No.
Title Page No.
30 Bintuan Satellite Map, Guadalupe and Lajala, Coron showing the area
and extent of mangrove 91
31 Satellite map of Decalachao and YKR, Coron 91 32 Satellite map of Marcilla and Borac showing extent of mangrove
forest 93

____________________________________________________________________________________ x
LIST OF PLATES Plates
No. Title Page
No.
1 Aftermath of Blast Fishing in Coral Reef of Coron, the Coral Thicket shown here is the Branching Porites
7
2 A View of Coron Municipality (mainland of Busuanga Island) from the Island of Coron
12
3 A Wild Dugong (Dugon dugong) Chanced upon the Manta Tow Survey at the Southern Tip of Cabilauan Island, Coron (witnessed) by ARF Montebon and F. Taguong, Jr.)
12
4 Respondent pointing to possible cetacean species occurring in barangay waters, (Photo: MF Digdigan)
59
5 Cetacean by-catch by purse seiners such as this reportedly occurs in Coron waters. This fishing vessel was docked in barangay Turda (Photo: MF Digdigan)
70
6 Picture showing the lay-outing of transects, Coron, Palawan, 2003 79 7 Picture showing the mangrove regeneration, Coron, Palawan, 2003 79 8 Picture showing Rhizophora apiculata, Coron, Palawan, 2003 85 9 Picture showing mangrove area subjectived for charcoal making,
Coron, Palawan, 2003 97
10 Picture showing mangrove cuttings, Coron, Palawan, 2003 99

_________________________________________________________________________________EXECUTIVE SUMMARY xi
EXECUTIVE SUMMARY
Coron municipality is part of the Calamianes Group of Islands specifically located within 11.7—12.47oN and 120.0—120.4oE at the northern region of Palawan. This municipality shares the large island of Busuanga and has a mandate over the southeast half of it. Coron boasts of 24 barangays and 32 islands (excluding island barangays) occupying total of 628 square kilometers of land area. A major port harbors the town proper where important commerce and trade take place.
Tourism is one of the principal sources of livelihood of the municipality and island
destinations can easily be accessed from the town proper. Motorized boats of different sizes cater to the needs of tourists. Coron is also exposed to reversing monsoons. Small islands are generally located in embayments that dent the northern and southern face of the municipality. Coron Island, the large triangle-shaped island situated at the south features a volcanic lake that tourists also frequent. This island is noteworthy of its indigenous people called the Tagbanua.
Coral reef survey showed that coral reefs of Coron are generally depauperate. Further, blast and poison fishing are the apparent causes of widespread coral reef destruction. Of the coral sites surveyed, Tangat Island, Lajala Island (west), Twin Peaks, Siete Pecados and Dihoran Island are the remaining areas with more than 50% coral cover and are therefore proposed as primary candidate core zones.
The baseline survey of the reef fishes of Coron yielded a relatively high number of reef and reef-associated species. Relatively high species richness was recorded in only 4 of the total of 133 stations surveyed. Although species richness of reef fishes is not a basic criterion to determine core zones, it is suggested that these sites be considered as core zones in order to preserve the biodiversity and gene pool in these sites.
Baseline surveys were conducted in August 2003 to assess the marine macrophyte resources of Coron. The seagrass meadows of Coron were generally mixed and diverse, composed of two (2) to nine (9) species: Enhalus acoroides was cosmopolitan along with Thalassia hemprichii and Halophila ovalis; Syringodium isoetifolium, Halodule uninervis, H. pinifolia, and Cymodocea rotundata were associated with the cosmopolitan species mostly on the relatively exposed beds; Halophila sp. (decipiens and/ or ovalis) was frequent on the southwest beds, and C. serrulata was patchy around Coron. Based on each species’ frequencies of occurrence across the beds, two groups of seagrass communities were differentiated in Coron: (a) communities with least at 5 species distributed on the entire bed, and (b) communities with 2 to 3 species frequent across the bed. The speciose meadows and well-covered bottoms in the north and northeast, which form part of group (a), harbored graze marks of Dugong dugon. These coastal zone sectors, composed of Brgys. San Jose, YKR, Decabobo, Malawig, Buenavista, Turda, and NE Marcilla, are therefore proposed as priority ECAN core zones. Meanwhile, evidence of grazing by dugongs was apparent in San Jose, YKR, Malawig, and Turda, and, again, demonstrated the animal’s affinity to speciose and relatively dense beds. We propose that this northern coastal sector of mainland Coron be candidate ECAN core zones.

_________________________________________________________________________________EXECUTIVE SUMMARY xii
Seaweeds contributed modestly to total vegetative cover within the seagrass beds. Of the 25 genera encountered in Coron, the green algae Halimeda was the most frequent throughout the macrophyte zone, followed by Padina, Sargassum, and Caulerpa. The conspicuous epibenthos common throughout the expanse of the macrophyte zone included black-spined urchins (Diadema setosum), horned seastars (Protereaster nodosus), cone shells (Pinna sp.), and giant clams (Tridacna crocea); the occurrence of other epibenthic and water-column organisms was patchy. Seaweeds contributed minimally to overall vegetative cover.
Marine mammal interview surveys revealed that dugong numbers are in a decline in
the municipality. This is most likely attributed to illegal fishing methods involving direct and indirect takes, absence of specialized dietary requirements of dugongs, and high incidents of boat movement and traffic in the area that causes acoustic disturbances to the animal. On the other hand, unaccounted direct captures of the animals, as well as deaths resulting from interactions with fishing gear might result in serious declines in animal numbers.
Cetaceans, particularly dolphins are a common occurrence in the municipality. Species identification though, needs to be verified through boat surveys. By-catch has been identified as the greatest threat to populations of small cetaceans in Southeast Asia (Perrin et al., 1996), and by-catch fisheries of cetaceans have been identified in Bulalacao island (Santos and Barut 2000).

________________________________________________________________________________CHARTER I: CORAL REEFS 1
CHAPTER I CORAL REEFS
1.0 OBJECTIVES General
• Conduct a coral reef baseline survey for the municipality of Coron vis-à-vis the ECAN zoning as required for in the SEP law
Specific
• Verify status of selected coral reefs identified from literature • Generate primary data from still un-surveyed coral reefs • Identify potential core zones of coral reefs
2.0 MATERIALS AND METHODS Field survey protocols were followed from the Technical Manual which were mainly patterned after English et al. (1997). The manta tow reconnaissance technique was primarily employed in the surveys. The modifications employed in the previous surveys were also used here, i.e., instead of the snorkeller being towed behind the boat, the observer either placed himself on the outrigger of the banca or used the manta board that was secured to the outrigger. This permitted the snorkeller to relay the observations directly to the person on-board who recorded the data and logged the position and depth on the GPS (Garmin GPSMap 168). The stored information on the GPS was later downloaded on a computer using MapSourceTM (Garmin version 4.09, 1999-2002). Tow speed was set at an average of 5 km/hr as gauged from the GPS unit itself.
Scoring categories outlined in the Technical Manual are those of English et al. (1994, 1997) and modified in Montebon (1997) as follows: 0=no cover, 1�10%, 2=11-30%, 3=31-50%, 4=51-75% and 5=76-100%.
The team was deployed in August 2003 and started out to cover the north face of the
municipality and gradually worked its way to the south. There were instances that weather would preclude visiting off-shore areas like Tara Islands and due to constraints in resources, they were no longer visited. The indigenous people of Coron Island also did not allow the team to conduct surveys during that time. Fortunately, good secondary data are available for the areas of Tara and the island of Coron. These were already discussed in the Review of Literature on Marine/Coastal Ecosystems, Municipality of Coron, Palawan (October 2003) and will further be considered in this report. 3.0 RESULTS Areas around Coron municipality visited during the coral reef surveys in August 2003 are shown in Figure 1. Depicted in the same figure are the sites surveyed by PCSDS (2000) and Werner and Allen (2000), which, adequately covered the areas missed out by the team due to bad weather and indigenous people’s claim.

________________________________________________________________________________CHARTER I: CORAL REEFS 2
120.0 120.1 120.2 120.3 120.4East longitude (degrees)
11.8
11.9
12.0
12.1
12.2
12.3
12.4
Nor
th la
titud
e (d
egre
es)
Figure 1. Baseline Survey Areas of the ECAN Marine Team Using the Manta Tow Technique around Coron, Palawan are Shown in Red Dots. Survey Data From PCSDS (2000) and Werner & Allen (2000) are Shown in Dots of Green and Blue, respectively, Coron, Palawan, 2003

________________________________________________________________________________CHARTER I: CORAL REEFS 3
120.0 120.1 120.2 120.3 120.4East longitude (degrees)
11.8
11.9
12.0
12.1
12.2
12.3
12.4
North la
titud
e (deg
rees
)
0 1 2 3 4 5
Figure 2 elaborates on the manta tow survey of coral reefs around Coron municipality (excluding secondary data). The different score categories (=percent cover brackets) of coral reefs are shown relative to each other and allows easy identification of areas with high hard coral cover.
Figure 2. Manta Tow Scores of the Areas Visited During the Coral Reef Surveys of Coron, Palawan, Percent Cover of the Scores are as Follows: 0=None, 1=Up To 10%, 2=11-30%, 3=31-50%, 4=51-75% and 5=76-100%, Coron, Palawan, 2003
This image is further broken down into three (3) figures to emphasize the category
scores of 3, 4 and 5. Figure 3 shows coral reefs around Coron municipality that have a hard coral cover of between 31-50%. Note that most of these areas are located at the south side of the municipality.

________________________________________________________________________________CHARTER I: CORAL REEFS 4
120 120.1 120.2 120.3 120.4East longitude (degrees)
11.8
11.9
12
12.1
12.2
12.3
12.4
Nor
th la
titud
e (d
egre
es)
Category Score 3 = 31-50%
Figure 3. Coral Reef Areas Around Coron, Palawan having Coral Cover of between 31-50%, Coron, Palawan, 2003

________________________________________________________________________________CHARTER I: CORAL REEFS 5
120 120.1 120.2 120.3 120.4East longitude (degrees)
11.8
11.9
12
12.1
12.2
12.3
12.4
Nor
th la
titud
e (d
egre
es)
Category Score 4 = 51-75%
Figure 4 has only two areas that show coral reefs with 51-75% coral cover—west of Lajala Island and Siete Pecados (see Table 1).
Figure 4. Coral Reef Areas around Coron, Palawan having Coral Cover of between 51-75%, Coron, Palawan, 2003

________________________________________________________________________________CHARTER I: CORAL REEFS 6
120 120.1 120.2 120.3 120.4East longitude (degrees)
11.8
11.9
12
12.1
12.2
12.3
12.4
Nor
th la
titud
e (d
egre
es)
Category Score 5 = 76-100%
The area west of Lajala Island and the south section of Dihoran Island have reef tracts with 76-100% coral cover (Figure 5).
Figure 5. Coral Reef Areas around Coron, Palawan having Coral Cover of
between 76-100%, Coron, Palawan, 2003

________________________________________________________________________________CHARTER I: CORAL REEFS 7
4.0 DISCUSSIONS
The municipality of Coron shares its fate with the municipality of Busuanga wherein most of the coral reefs have been devastated. Of the 1960 points sampled in the manta tow survey, only 0.1% obtained a score of 5 (76-100% coral cover), 0.3% with a score of 4 (51-75% coral cover) and 2.8% had a score of 3 (31-50% coral cover). The rest of the sampled points are simply dismal.
Plate 1. Aftermath of Blast Fishing in Coral Reefs of Coron. The Coral Thicket
Shown Here is The Branching Porites.

________________________________________________________________________________CHARTER I: CORAL REEFS 8
Lifeforms Genera
Lajala Island 11.9874 120.1304 4 ACBLajala Island 11.9886 120.1318 4 ACB, CBLajala Island 11.9893 120.1322 4 CB PoritesLajala Island 11.9899 120.1322 4 CB, ACB PoritesSiete Pecados 11.9838 120.2286 4 ACBSiete Pecados 11.9836 120.2287 4 ACBLajala Island 11.9878 120.1310 5 CB PoritesDihoran Island 12.0315 120.3595 5 CB
Locality ProminentHCE_LongitudeN_Latitude
As described in Figures 4 and 5, reef areas with more than 50% coral cover are limited to very few places (also outlined in Table 1) in the south section of the municipality. Apparently, these remaining areas have some form of protection that prevents their total degradation. Siete Pecados, for example, is quite proximal to the town proper and can easily be viewed from barangay Tagumpay. Destructive fishers would think twice before rampaging in this reef. SCUBA diving enthusiasts also frequent this site so that visitors are more often expected to pass by the reef. Lajala is also close to the town proper and is proximal to human settlements that may discourage illegal fishers. The area at Dihoran Island has been spared presumably due to the marine sanctuary model situated at the embayment of barangay Marcilla.
Table 1. Locations of Reef Areas with High Hard Coral (HC) Cover of 4 (=51-75%) and 5 (76-100%), Coron, Palawan, 2003
The north side of Coron municipality seems to have suffered from the “tragedy of the
commons”. Having no strong police efforts to regulate fishing in whatever form, the open-access situation has made its effects apparent on the coral reef. This can be supported from the fact that when the team stayed at base camp because of bad weather, several fishing boats entered Maricaban Bay for shelter and many were not registered from Palawan.
Since the team experienced rains during the survey, it gave a perspective as to which
areas are prone or have heavy sedimentation during downpours. Runoffs were evident in the waters of the town proper so that surrounding reef areas are indeed affected. Tributaries in barangay Guadalupe make the embayment there also silty. Up north, a large river system spews sediment-laden water in Maricaban Bay during heavy rains. All of these are symptomatic of an unsound land management program in the area, which directly affects coral reef systems.
Apart from the coral reef areas with high coral cover that were identified in this study
(Table 1), Werner and Allen (2000) also identified three areas with more than 50% hard coral cover (Table 2). These sites are plotted in Figure 6 and may be considered as candidate coral reef core zones based on high coral cover. Superposition of other criteria from the other components of the study may bring about other candidate coral reef core zones.

________________________________________________________________________________CHARTER I: CORAL REEFS 9
Locality N_Latitude E_Longitude HC %Cover Remarks
Twin Peak Island 11.9567 120.2095 90 Black coralsTangat Island SW tip 11.9598 120.0593 50 Bleaching on ACBSiete Pecados Is. 11.9843 120.2245 100 Crinoids, black corals
120.0 120.1 120.2 120.3 120.4
East longitude (degrees)
11.8
11.9
12.0
12.1
12.2
12.3
12.4
Nor
th la
titud
e (d
egre
es)
Tara Is
San Jose
Decalachao
YKR
Buenavista
San Nicolas
Malawig
Decabobo
Turda
Borac
Marcilla
Cabugao
Banuang Daan
Guadalupe
Bintuan
Lajala Is
TagumpayPoblacion vi
v i
iiiii
iv
Bulalacao Is
Delian Is
Dimaquiat Is
Tangat Is
Lusong IsDibatuc Is
Dihoran Is
Cabilauan Is
Bantac Is
7 Pecados
Napuscul Is
Depangal Is
ECAN 2003
Werner & Allen 2000
Table 2. Locations of Reef Areas with High Hard Coral (HC) Percentage Cover Surveyed By Werner and Allen (2000), Coron, Palawan, 2003
Figure 6. Candidate Coral Reef Core Zones based on High Percentage Cover of Corals (�50%), Coron, Palawan, 2003

________________________________________________________________________________CHARTER I: CORAL REEFS 10
Dugong
Ray
Reef shark
Bumphead parrotfish
Marine turtle
Marine snake
120 120.1 120.2 120.3 120.4East longitude (degrees)
11.8
11.9
12.0
12.1
12.2
12.3
12.4
Nor
th la
titud
e (d
egre
es)
Important marine organisms, especially those considered endangered or protected, were also noted in the manta tow surveys whenever encountered. Sightings of these organisms are shown in Figure 7 and listed with geographic reference in Table 3.
Figure 7. Exploited Marine (Large) Species Encountered During the Manta Tow
Surveys of Coral Reefs, Coron, Palawan, 2003

________________________________________________________________________________CHARTER I: CORAL REEFS 11
Table 3. Exploited Marine (Large) Species Encountered during the Manta Tow Surveys of Coral Reefs, Coron, Palawan, 2003
One dugong was seen grazing on a seagrass tract near the south end of Cabilauan Island (Plate 2 and 3). This area can automatically be considered a protected area or core zone. Marine turtles were also encountered many times in the surveys. Interestingly, most of the turtles seen around the south side were the hawksbill type while those sighted north of the municipality were mostly the green sea turtle (see Table 3). This suggests that each species of marine turtle favors a particular kind of habitat. An ecological study of each species will uncover this obscurity. Other organisms sighted include the bumphead parrotfish, sharks and rays (elasmobranchs), and marine snakes.
Scientific Name Common Name
Cabilauan Island 12.1558 120.1988 Dugon dugong DugongDepangal Island 12.1699 120.2558 Bolbometopon muricatum Bumphead parrotfishTurda 12.0960 120.3304 Bolbometopon muricatum Bumphead parrotfishCabilauan Island 12.1698 120.1703 Chelonia mydas Green turtleCabilauan Island 12.1711 120.1693 Chelonia mydas Green turtleCabilauan Island 12.1719 120.1686 Chelonia mydas Green turtleCabilauan Island 12.1744 120.1473 Chelonia mydas Green turtleCabilauan Island 12.1815 120.1431 Chelonia mydas Green turtleCabilauan Island 12.1949 120.1464 Chelonia mydas Green turtleHadyibulac Island 12.1414 120.1819 Chelonia mydas Green turtleLauit Island 12.1578 120.1597 Chelonia mydas Green turtleLauit Island 12.1608 120.1693 Chelonia mydas Green turtleLiatu Island 12.1494 120.1552 Chelonia mydas Green turtleMalawig 12.1926 120.2399 Chelonia mydas Green turtleSan Nicolas 12.1237 120.1663 Chelonia mydas Green turtleSan Nicolas 12.1348 120.1779 Chelonia mydas Green turtleTurda 12.1442 120.2746 Chelonia mydas Green turtleTurda 12.1455 120.2707 Chelonia mydas Green turtleBatunan Island 11.9628 120.1056 Eretmochelys imbricata Hawksbill TurtleCabilauan Island 12.1813 120.1444 Eretmochelys imbricata Hawksbill turtleLajala Island 11.9604 120.1586 Eretmochelys imbricata Hawksbill TurtleLajala Island 11.9649 120.1769 Eretmochelys imbricata Hawksbill TurtleLajala Island 11.9686 120.1572 Eretmochelys imbricata Hawksbill turtlePiñas Island 11.9968 120.1441 Eretmochelys imbricata Hawksbill turtlePiñas Island 11.9994 120.1428 Eretmochelys imbricata Hawksbill turtleSan Jose 12.2030 120.0976 Eretmochelys imbricata Hawksbill turtleSiete Pecados 11.9842 120.2296 Eretmochelys imbricata Hawksbill turtleTangat Island 11.9813 120.0806 Eretmochelys imbricata Hawksbill turtleBintuan 11.9702 120.1053 Marine turtleCabilauan Island 12.1594 120.1959 Marine turtleCabilauan Island 12.1645 120.1871 Marine turtleCabilauan Island 12.1903 120.1441 Marine turtleLajala Island 11.9695 120.1616 Marine turtleUson Island 11.9854 120.1999 Laticauda sp. SeasnakeCabilauan Island 12.1780 120.1627 StingrayMalawig 12.1940 120.2399 StingrayMarcilla 11.9899 120.3348 StingrayMarcilla 11.9959 120.3246 StingrayCabilauan Island 12.1659 120.1765 Whitetip sharkDecabobo 12.1379 120.1882 Blacktip shark
SightingsLocality N_Latitude E_Longitude

________________________________________________________________________________CHARTER I: CORAL REEFS 12
Plate 2. A View of Coron Municipality (Mainland of Busuanga Is) from the Island of Coron.
Plate 3. A Wild Dugong (Dugon Dugong) Chanced upon the Manta Tow Survey
at the Southern Tip of Cabilauan Island, Coron (Witnessed By ARF Montebon and F Tabugon, Jr.).

________________________________________________________________________________CHARTER I: CORAL REEFS 13
5.0 SUMMARY
• Coral reefs of Coron are generally depauperate • Blast and poison fishing are the apparent causes of widespread coral reef
destruction • Tangat Island, Lajala Island (west), Twin Peaks, Siete Pecados and Dihoran
Island are the remaining areas with more than 50% coral cover (Table 1 and 2, Figure 6)
• Presence of a dugong was verified at the south end of Cabilauan Island (Table 3, Figure 7)
• Survey photos are presented in plates one (1) to three (3).
6.0 RECOMMENDATIONS
• Candidate core zones are those at Sangat Island, Lajala Island (west), Twin Peaks, Siete Pecados and Dihoran Island based on high coral cover (>50%)
• The presence of a dugong at the south end of Cabilauan Island warrants the area to be zoned as a core zone

____________________________________________________________________________________CHAPTER II: REEF FISHES 14
CHAPTER II REEF FISHES
7.0 INTRODUCTION
The survey of reef and reef-associated fishes in Northern Palawan is a sub-component of the Marine and Coastal Resources Survey and Research Component of the SEMP-ECAN Zoning Project. Data on fish communities in the coral reefs and islands surrounding the Municipality of Coron will augment the data on habitat and help describe the coral reef resources in the area.
Only the baseline survey was conducted in Coron. This survey is rapid and qualitative
in nature. It aims to list down reef fish species that occur in specific sites around the area and identify sites with the highest species richness as potential core zones. 8.0 MATERIALS AND METHODS
The baseline survey method was a modification of the manta-tow technique (English et al., 1997). An outrigger boat was used to tow an observer along the reef crest. Each tow lasted for 15 minutes, after which the observer listed down all species observed during the tow.
A Garmin GPS/Map 168 recorded the positions of the start and end of the tows. The survey method limited the observations and subsequent species listing to numerically dominant and visually obvious species of fish. Cryptic and small species of reef fishes were difficult to detect and identify with this technique. Furthermore, abundances and biomass of fish were not determined. 9.0 RESULTS
A total of 133 stations were surveyed around the Municipality of Coron (Figure 8). Survey stations were at least approximately 1.5 km each. Tows were conducted in a variety of reef zones (i.e. reef flat, crest, slope) and reef types (i.e. coral, sandy, rocky, rubble, etc.). The differences in the stations allowed the observer list down the different species of fish that occur in these different habitats features.
A total of 342 species distributed among 47 families of reef and reef-associated fish were recorded throughout the survey. Included were an unidentified species of rabbitfish (Siganidae), eagle ray (Myliobatidae), snapper (Lutjanidae), bream (Lethrinidae), soldierfish (Holocentridae), sweetlips (Haemulidae), anchovy (Engraulidae), pufferfish (Tetraodontidae), filefish (Monacanthidae), wrasse (Labridae), cardinalfish (Apogonidae); and several species of parrotfishes (Scaridae, n = 5), jacks (Carangidae, n = 2) and damselfishes (Pomacentridae, n = 3).

____________________________________________________________________________________CHAPTER II: REEF FISHES 15
Of the 47 fish families represented, the most speciose were Pomacentridae (53 species),
Labridae (49 species), Chaetodontidae (27 species), Scaridae (24 species), and Acanthuridae and Serranidae with 18 species each. Dominant families in terms of frequency of occurrence (the number of stations where they were recorded) include parrotfishes (Scaridae, 100% of the stations), damselfishes (Pomacentridae, 95%), wrasses (Labridae, 88%), butterflyfishes (Chaetodontidae, 83%), and snappers (Lutjanidae, 81%).
Figure 8. Sampling Points for Reef Fish Observations, Coron, Palawan, August to September 2003
The most common and frequently recorded species were the spiny chromis Acanthochromis polyacanthus (Pomacentridae, 86% of the stations), the staghorn damselfish Amblyglyphidodon curacao (Pomacentridae, 80%), the Pacific longnose parrotfish Hipposcarus longiceps (Scaridae, 75%), the barhead spinefoot Siganusvirgatus (Siganidae, 71%), and the small-toothed whiptail Pentapodus caninus (Nemipteridae) and vermiculated angelfish Chaetodontoplus mesoleucus (Pomacanthidae) which both occurred in 66% of the stations .
The fish species listed were composed of 165 target species, 156 major species and 21
indicator species. Target fish species are those with commercial value and are exploited in local
____________________________________________________________________________________CHAPTER II: REEF FISHES 16
fisheries. These are often carnivores, herbivores or benthic invertebrate feeders. Major species are fish with no significant commercial value in fisheries. However, they play important roles and occupy specialized niches in the marine environment, thus making them integral members of fish communities. Indicator species are fish that are highly associated with their environment (i.e. coral feeding chaetodontids) and their presence or absence in an area may be indicative of the present conditions of the habitat.
In terms of frequency of occurrence, 94% (n = 321 species) of the species recorded were observed in less than 50% (range of 1 - 66 stations) of the stations. While only 6% (n = 21 species) were observed in more than 50% of the stations (range of 67 to 113 stations). Target and major species of fish were commonly observed, occurring in most stations ranging from 1 to 99 stations for target species and 1 to 113 stations for major species. Indicators species, however, were observed in less than 50% of the stations surveyed (range of 1 to 55 stations).
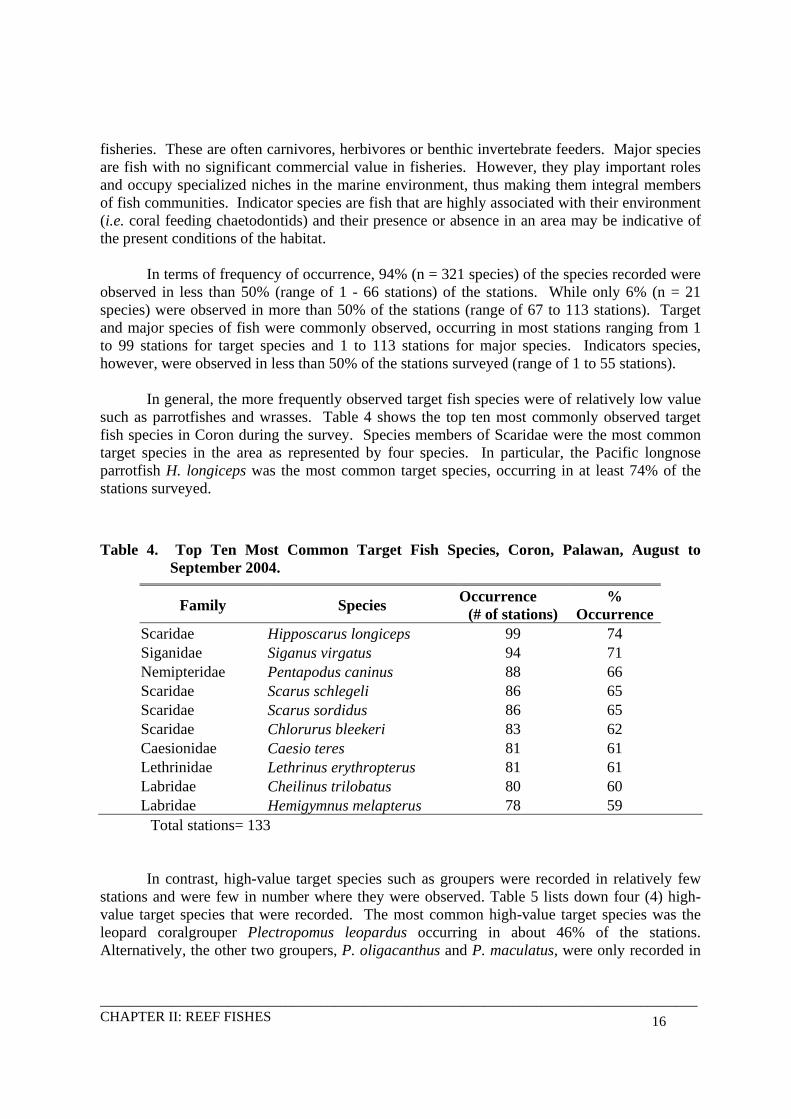
In general, the more frequently observed target fish species were of relatively low value such as parrotfishes and wrasses. Table 4 shows the top ten most commonly observed target fish species in Coron during the survey. Species members of Scaridae were the most common target species in the area as represented by four species. In particular, the Pacific longnose parrotfish H. longiceps was the most common target species, occurring in at least 74% of the stations surveyed.
Table 4. Top Ten Most Common Target Fish Species, Coron, Palawan, August to September 2004.
Family Species Occurrence (# of stations)
% Occurrence
Scaridae Hipposcarus longiceps 99 74 Siganidae Siganus virgatus 94 71 Nemipteridae Pentapodus caninus 88 66 Scaridae Scarus schlegeli 86 65 Scaridae Scarus sordidus 86 65 Scaridae Chlorurus bleekeri 83 62 Caesionidae Caesio teres 81 61 Lethrinidae Lethrinus erythropterus 81 61 Labridae Cheilinus trilobatus 80 60 Labridae Hemigymnus melapterus 78 59 Total stations= 133 In contrast, high-value target species such as groupers were recorded in relatively few
stations and were few in number where they were observed. Table 5 lists down four (4) high-value target species that were recorded. The most common high-value target species was the leopard coralgrouper Plectropomus leopardus occurring in about 46% of the stations. Alternatively, the other two groupers, P. oligacanthus and P. maculatus, were only recorded in

____________________________________________________________________________________CHAPTER II: REEF FISHES 17
2 and 4 stations, respectively. Only juveniles of the humphead wrasse Cheilinus undulatus were observed. These four species are highly prized in the live fish trade.
Table 5. Frequency of Occurrence of High-Value Target Fish Species, Coron, Palawan, August to September 2004
Family Species Occurrence (# of stations)
% Occurrence
Serranidae Plectropomus oligacanthus 2 2 Serranidae Plectropomus maculatus 4 3 Labridae Cheilinus undulates 17 13 Serranidae Plectropomus leopardus 61 46 Total stations = 133 Most commonly observed major fish species are listed in Table 6. Pomacentridae was
the predominant major fish group in the area with four species among the top 10 most commonly observed major fish. Most members of this fish group are planktivores and benthic carnivores and are of no importance to the local fisheries. However, aside from playing important roles in the marine ecosystem (i.e. trophic chain), most of these species are valued in the aquarium fish industry. Thus, if effectively conserved, they may have unrealized but significant economic benefits to the local fishing community.
Table 6. Top Ten Most Common Major Fish Species, Coron, Palawan, August to September 2004.
Family Species Occurrence (# of stations)
% Occurrence
Pomacentridae Acanthochromis polyacanthus 113 85 Pomacentridae Amblyglyphidodon curacao 106 80 Pomacanthidae Chaetodontoplus mesoleucus 88 66 Balistidae Balistoides viridescens 79 59 Tetraodontidae Arothron nigropunctatus 77 58 Zanclidae Zanclus cornutus 76 57 Labridae Thalassoma lunare 61 46 Pomacentridae Pomacentrus coelestis 61 46 Chaetodontidae Heniochus varius 56 42 Pomacentridae Abudefduf sexfasciatus 56 42
Total stations = 133 The least number of species recorded were the indicator species (21 species). Table 7
lists the top five indicator species in terms of their occurrence. It was shown that even the most

____________________________________________________________________________________CHAPTER II: REEF FISHES 18
common butterflyfish Chaetodon octofasciatus occurred in less than half of the total survey stations.
Table 7. Top Five Most Common Indicator Fish Species, Coron, Palawan, August to September 2004.
Family Species Occurrence (# of stations)
% Occurrence
Chaetodontidae Chaetodon octofasciatus 55 41 Chaetodontidae Chaetodon trifasciatus 40 30 Chaetodontidae Chaetodon auriga 34 26 Chaetodontidae Chaetodon baronessa 31 23 Chaetodontidae Chaetodon vagabundus 28 21
Total stations = 133 None of the 133 stations surveyed recorded more than half of the total species listed.
The highest total species recorded within a survey station was in Station 114 with only 140 species of fish or 41% of the total species count (Appendix 2). Station 123, Station 103 and Station 132 followed this with 128, 110 and 110 fish species, respectively. Nearly 97% or 129 of the stations surveyed yielded less than one third of the total species recorded (n = 114). 10.0 DISCUSSIONS
The fish fauna observed during the baseline survey of Coron was characteristic of low sheltered silty lagoons. Species often found in clear waters with good circulation (i.e. Pseudanthias) were notably absent. This observation is consistent with the observations made by Allen and Werner (2000).
In terms of species richness, the damselfishes Pomacentridae and wrasses Labridae were the most speciose of the fish families represented. This was not surprising since these fishes are often conspicuous in reefs as they often form large aggregations and are usually brightly color. Similarly, the high number of species of butterflyfishes Chaetodontidae recorded was also due to their bright coloration making them easily detectable.
The parrotfishes Scaridae, on the other hand, were the dominant family in terms of frequency of occurrence. Member species of this family were recorded in all stations surveyed. The Pacific longnose parrotfish H. longiceps, in particular, was the most common member species of Scaridae. Parrotfishes are grazing herbivores feeding on algae on the surface of corals, and their relatively predominance in the area may indicate that there may be a high percentage of algal growth in the coral reefs around Coron. The relatively low occurrence of butterflyfishes also supports this suggestion.

____________________________________________________________________________________CHAPTER II: REEF FISHES 19
The apparent scarcity of high-value target fishes such as groupers was not surprising.
These species are top predators on the reef and naturally do not occur in great numbers within an area (i.e. except during spawning seasons when some species form large aggregations in a specific site). However, it may also be indicative of the intense fishing pressure on these species as they are targeted for the live fish trade in the area. It is unfortunate, however, that data that might support this suggestion was not gathered in this baseline survey. 11.0 CONCLUSIONS AND RECOMMENDATIONS
The baseline survey of the reef fishes of Coron yielded a relatively high number of reef and reef-associated species. It must be noted, however, that the method employed in the study was limited to observing visually obvious species of fish and was not sensitive enough to record small and highly cryptic species such as blennies (Blenniidae) and gobies (Gobiidae). Hence, the species listing from this study must be treated as the minimum number recorded and that the actual number of species in the area may be more than double the number recorded in this study.
Relatively high species richness was recorded in only 4 of the total of 133 stations surveyed. Although species richness of reef fishes is not a basic criterion to determine core zones, it is suggested that these sites be considered as core zones in order to preserve the biodiversity and gene pool in these sites.

________________________________________________________________________________CHAPTER III: SEAGRASS AND SEAWEEDS 20
567
11
12
1718
20
24
13
15
27
3132
35
39
4042
46
48
50
53
55
60757779
10580
9192
94
99
106
107111
113 114115
83
8590
102
104
120 120.1 120.2 120.3 120.4
E longitude
120 120.1 120.2 120.3 120.4
11.9
12
12.1
12.2
12.3
N la
titud
e
11.9
12
12.1
12.2
12.3
CHAPTER III SEAGRASS AND SEAWEEDS
12.0 INTRODUCTION
This report presents the results of the baseline survey of seagrasses and seaweeds and their environments in the municipality of Coron, one of the second–priority municipalities for the ECAN-Zoning exercise. The survey was carried out in the shallow coastal zone of the mainland (1) to gather geo-referenced primary data needed for the subsequent classification of shallow coastal zones into various ECAN zones, and (2) to augment the existing macrophyte database from only 5 sites (see Review of Secondary Information, Seagrasses and Seaweeds of Coron). Background information from the few reports and database have been considered in the survey plan, and the field campaign was conducted in August 2003, about 3 years following the most recent available report. 13.0 MATERIALS AND METHODS
Sampling stations (Figure 9) were systematically allocated along the coastline from San Jose to Bintuan on mainland Coron (28 stations about 2 km. no stations in Borac): on portions of eight (8) islands where macrophyte cover was assumed to be most representative (16 stations) and no stations set in far-off Tara and Bulalacao, and in Cabugao and Banwang Daan within Coron Island.
Figure 9. Distribution of 44 stations (•) surveyed for baseline data on seagrasses and seaweeds. Numbers next to filled circles are station names, Coron, Palawan, August 2003

________________________________________________________________________________CHAPTER III: SEAGRASS AND SEAWEEDS 21
In each station, transects from shore to sea were established (bearings due north noted) then marked with buoys. Observations were made on ten (10) m2 plots (five (5) m swathe x 2.5 m front radius) from the macrophytes’ incidence on the shore (edge) then at intervals of 10 or 20 (freestyle) swimming ‘kicks’ along the transects up to the macrophytes’ seaward end, as indicated by bottom substrate shifts – bare of vegetation or live coral cover ≥ 5%. Substrates beyond this zone of corals were inspected for the occurrence of small seagrasses, e.g., Halophila and/ or Halodule. Bottom depths were measured in one of the observed transects following the intervals set for the station. The positions of the edges and ends were marked as new coordinates in the GPS configured to the Luzon datum; the ‘kicks’ interval was standardized to distance in meters for every observer.
Within the observation plots, the following habitat and macrophyte parameters were gathered: bottom type (mud, sand, rubble/ rock), bottom cover of seagrasses and of seaweeds (%, modified from the categories used by SeagrassNet, Short et al., 2002), taxonomic composition (seagrasses – species level identification; seaweeds – usually up to genus level), and other bottom features (the presence of feeding craters/ trenches of dugongs, small and bare sand patches, sand mounds/ ‘volcanoes’, and conspicuous invertebrates). Site features were photo-documented whenever possible.
All data were transcribed by each observer then later encoded as a database. All data records were reviewed, after which summaries of macrophyte cover, taxonomic composition, and habitat features were extracted for each station, pooled into various meadow zones, and then pooled for each barangay. The distributions of each seagrass species, species richness and of macrophyte cover were each plotted on a map to evaluate municipality level spatial patterns. Local (= station) seagrass species distributions (as relative frequencies, %) were classified using Two-Way Indicator SPecies ANalysis (TWINSPAN; Hill, 1979) to determine larger-scale forces that structure seagrass communities. Candidate core zones were proposed based on the criteria set for seagrass habitats. 14.0 RESULTS
Bed Widths/Cross-Bed Bottom Depths
More than half of the stations harbored shallow macrophyte beds that extended to widths up to 200 m (average ≈ 160 ± 29 m SEM) (Table 8, Figure 10). As further indicated, broader beds of up to 400 m were found in sever (7) barangays (10 stations) on the mainland, i.e., in YKR (Stns. 17, 24), San Nicolas (Stn. 13), Malawig (Stn. 31), Turda (Stn. 48), Marcilla (Stn. 50), Poblacion 1 (Stn. 77), and Bintuan (Stns. 104, 106, 115) the narrow ones were associated with either exposure to waves (Stn. 18, Cabilauan Island, YKR; 27, Decabobo; 60, Marcilla), wave-protected areas but with silty waters (7, San Jose; 107, Bintuan) or with settlements on the coast (80 Poblacion VI; 102, Lajala Island).

_____________________________________________________________________________________________________________________________ CHAPTER III: SEAGRASS AND SEAWEEDS 22
Table 8. Locations of the Macrophyte Stations Surveyed in the different Coastal Barangays of Coron (August 2003). Legend: n = sample size; * mean perpendicular distance inhabited by macrophytes, from shore edge to seaward end; S = sand, R = rubble, DC = dead coral, RCK = rock, M = mud.
Barangay Site Station N Latitude E Longitude ntransects nplots Substratum Bed width*, m San Jose NE coastline San Jose 5 12.1923333 120.1070000 3 41 S-R 193
Marina 6 12.1944722 120.0916389 3 53 S-R-DC/RCK-M
139
Across Marina 7 12.1844722 120.0963056 3 33 S-DC/RCK 94
YKR Mid-Maricaban Bay 11 12.1437500 120.1402500 3 41 S-DC/RCK 107 Mid-Maricaban Bay 12 12.1298833 120.1567833 3 39 S-R-DC/RCK 111 ESE Cabilauan Is 17 12.1473167 120.2008167 3 45 S-DC/RCK 242 ESE Cabilauan Is 18 12.1583333 120.1932167 3 37 S-R-DC/RCK 94 NNW Cabilauan Is 20 12.1818056 120.1473333 2 23 S 174 EcoFarm 24 12.1581944 120.1708056 2 38 S-DC/RCK-M 321
San Nicolas Inner Maricaban Bay 13 12.1199167 120.1821111 2 34 S-R-DC/RCK-
M 252
Inner Maricaban Bay 15 12.1390000 120.1805000 2 29 S-M 108
Decabobo NW coastline Decabobo 27 12.1828611 120.2141944 1 8 S-DC/RCK 67
Malawig N coastline Malawig 31 12.1986333 120.2331333 1 14 S-R 216 W Simol Is 32 12.2057500 120.2404722 3 24 S-DC/RCK 122

_____________________________________________________________________________________________________________________________ CHAPTER III: SEAGRASS AND SEAWEEDS 23
Table 8 continued . . . Buenavista NE coastline Buenavista 35 12.1694167 120.2426667 3 24 S-R 128
N Napuscol Is 39 12.1557500 120.2614167 2 20 S-R-DC/RCK 120
Turda N coastline Turda 40 12.1318889 120.2784444 3 33 S-R-DC/RCK 171 Middle coastline Turda 42 12.1194444 120.2974722 3 23 S-R-DC/RCK 109 S coastline Turda 46 12.0860833 120.3282500 3 24 S 123 S coastline Turda 48 12.0649717 120.3368617 2 42 S-R-DC/RCK 354
Marcilla NE coastline Marcilla 50 12.0320283 120.3231400 2 39 S-M 372
SSE coastline Marcilla 53 12.0010283 120.3164167 2 21 S-R-DC/RCK 168 SW Dihoran Is 55 12.0338617 120.3547817 2 24 S-R-DC/RCK 140 SSW coastline Marcilla 60 11.9843333 120.2907500 2 17 S-DC/RCK 78
Tagumpay Middle coastline
Tagumpay 75 11.9948056 120.2308333 2 12 S-DC/RCK-M 103
Poblacion I Middle coastline Pob I 77 11.9967222 120.2031111 2 29 S-DC/RCK 278
Poblacion V Middle coastline Pob V 79 12.0007222 120.1804722 2 16 S-R-DC/RCK 144
NNW coastline Baquit Is 105 12.0137833 120.1505833 2 22 S-DC/RCK-M 105
Poblacion VI SE coastline Pob VI 80 12.0038611 120.1638889 2 13 S-DC/RCK 62
Guadalupe SW coastline Guadalupe 91 12.0267778 120.1370556 2 36 S-DC/RCK 146

_____________________________________________________________________________________________________________________________ CHAPTER III: SEAGRASS AND SEAWEEDS 24
Table 8 continued . . . Bintuan NNE coastline Bintuan 92 12.0209667 120.1252500 1 16 -M 125
E coastline Bintuan 94 11.9916944 120.1226667 2 27 S-DC/RCK-M 217 S coastline Bintuan 99 11.9668500 120.1017000 2 28 S-DC/RCK 112 SW coastline Bintuan 106 11.9809333 120.0844333 2 26 S 208 mouth of mangrove inlet 107 11.9964500 120.0875667 2 22 S-M 86 W coastline Bintuan 111 11.9945000 120.0304833 2 19 S-DC/RCK-M 147 E Danglet Is 113 11.9787167 120.0219333 2 30 S-M 120 W Tangat Is 114 11.9830833 120.0626833 2 42 S-DC/RCK-M 174 E <island, Culion na ! > 115 11.9962500 120.0739667 2 36 S-DC/RCK 293
Lajala NE of island 83 11.9871167 120.1900000 2 20 156
SSE of island 85 11.9710667 120.1831000 2 19 S-R 138 W <islet> 90 11.9594833 120.1620500 2 39 S 160 SSW of island 102 11.9873000 120.1439000 2 12 S-R-M 87 W of island 104 11.9735167 120.1351833 2 19 S-DC/RCK 147
Nbarangays = 15 Nstations = 44 Ntransects = 97 Nplots = 1,209

________________________________________________________________________________CHAPTER III: SEAGRASS AND SEAWEEDS 25
0
10
20
30
< 100 200 300 400 500 > 500
bed width, m
n st
atio
ns
Figure 10. Distribution of the 44 Macrophyte Stations by Bed Width, Coron, Palawan, 2003
Cross-bed bottom depths, depicted in Figure 11, were 0.7 ± 0.1 (edges, n = 42 observations), 1.0 ± 0.1 (inner, n = 146), 1.3 ± 0.1 (middle, n = 171), 1.6 ± 0.1 (outer, n = 134), and 2.5 ± 0.1 m (end, n = 42; one transect in Stn. 5 was unique because the meadow continued up to 21 m). Sand, the major component of the bed substrata, was often mixed with dead coral, rubble, and rock (Table 8). Muddy sediments were encountered in 11 stations (Table 8), most of which were associated with the presence of mangroves or settlements.

_____________________________________________________________________________________________________________________________CHAPTER III: SEAGRASS AND SEAWEEDS 26
A. narrow beds, < 100 m
Station 7
01234
0 25 50 75 100 125
distance from shore, m
dept
h, m
Station 11
01234
Station 18
01234
Station 42
01234
Station 15
01234
Station 46
01234
0 25 50 75 100 125
Station 60
01234
Station 80
01234
Station 107
01234
Station 104
01234
Figure 11. Cross-bed depth profiles and bed widths (both in meters) of the macrophyte stations: A, narrow beds, B- medium-width beds, C- wide, beds; the horizontal axes vary from A to C. Stations are arranged by barangay as outlined in Table 1 (top to bottom, left to right column; see also Figs. 9 and 10). Coron, Palawan, 2003

_____________________________________________________________________________________________________________________________CHAPTER III: SEAGRASS AND SEAWEEDS 27
(Figure 11 continued)
B. m edium -width beds, up to 250 m
Station 6
01234
0 50 100 150 200 250
Station 17
01234
Station 35
01234
Station 24a (Eco Farm )
01234
Station 24b (Eco Farm )
01234
Station 32
01234
Station 13
01234
0 50 100 150 200 250
Station 20
01234
Station 27
01234
Station 31
01234

_____________________________________________________________________________________________________________________________CHAPTER III: SEAGRASS AND SEAWEEDS 28
(Figure 11B continued)
Station 40
01234
Station 79
01234
Station 92
01234
Station 99
01234
Station 39
01234
0 50 100 150 200 250
Station 55
01234
Station 77
01234
Station 83
01234
0 50 100 150 200 250
Station 90
01234
Station 102
01234

_____________________________________________________________________________________________________________________________CHAPTER III: SEAGRASS AND SEAWEEDS 29
(Figure 11 continued)
Station 113
01234
0 50 100 150 200 250
Station 114
01234
Station 115
01234
Station 91
01234
0 50 100 150 200 250
Station 94
01234
Station 106
01234
Station 111
01234

_____________________________________________________________________________________________________________________________CHAPTER III: SEAGRASS AND SEAWEEDS 30
(Figure 11 continued) C. wide beds, > 250 m
Station 5 (sea horse)
0
4
8
12
16
20
24
0 100 200 300 400
Station 048
01234
Station 050
01234
Station 053
01234

________________________________________________________________________________CHAPTER III: SEAGRASS AND SEAWEEDS 31
Benthic Cover Seagrasses dominated the marine vegetation in Coron, i.e., from the edges up to the
outer borders (Table 9). The trend for mean cover across the meadows appeared slightly parabolic (Figure 12), with intermediate cover at the edges and peaks on the inner and middle sections of the meadows, which, thereafter, decreased towards the edges (11 ± 3%). For the meadows in YKR and Decabobo, however, cover was already high inshore (Table 9). Overall, pooled cover was low at 29 ± 1% because extremely low (≤ 5%) and high cover estimates (up to ≈ 95%) were common in all the zones (Table 9, Figure 12).
A few stations on the northern coast, however, maintained high cover despite pooling
(≥ 50%; Table 9, Figure 13) – Stns. 5 (San Jose) 67 ± 8%, 17 (YKR) 50 ± 7%, 20 (YKR) 50 ± 8%, 31 (Malawig) 51 ± 7%, and 40 (Turda) 52 ± 8%. Low-cover meadows (≤ 25%) occurred mostly on the mainland’s south (Bintuan except Stn. 94, Guadalupe, Poblacion I, Tagumpay) and included a few northern stations next to tributaries (Stns. 6 and 7, San Jose; 11, YKR). Cover in the rest of the meadows was intermediate, i.e., between 26 and 49% (Figure 13).
Seagrass-associated seaweeds were patchy in distribution inshore and, hence, did not
cover a significant area (5 ± 2 to 11 ± 2%; Table 10, Figure 12). These were conspicuous components farther off and covered 16 ± 2 and 17 ± 1% of the outer borders and the edges, respectively. Estimates of bottom cover by seaweeds, like the seagrasses, also ranged from low (≤ 5%) to high (up to ≈ 95%) across the zones (Table 10) so that the overall mean cover was also low (12 ± 1%).
Following cover categories above, high seaweed cover was found only in Station 27
(Decabobo, 63 ± 11%) and intermediate in Stations 31 (Malawig) 36 ± %, 39 (Buenavista) 45 ± %, 53 (Marcilla) 33 ± %, 55 (Marcilla) 27 ± %, and 104 (Lajala) 34 ± % (Table 3, Figure 6). Seaweeds in the other beds barely contributed to pooled macrophyte cover (Table 3, Figure 6).

_____________________________________________________________________________________________________________________________CHAPTER III: SEAGRASS AND SEAWEEDS
32
Table 9. Seagrass cover profile (mean % SEM) on the edges (i.e., incidence at shore), within the bed proper, and on the seaward ends. Legend: * stations with cover ≥ 50% (high), Coron, August 2003
Bed zone Barangay Site (Station) Edge Inner Middle Outer End
Mean SEM Mean SEM Mean SEM Mean SEM Mean SEM
San Jose NE coastline San Jose (5) * 92 (3) 87 (6) 77 (11) 53 (19) 25 (14) Marina (6) 2 (2) 10 (4) 14 (6) 2 (1) 1 (1) Across Marina (7) 6 (2) 15 (9) 20 (6) 17 (7) 9 (9)
San Jose pooled 33 (44) 37 (37) 33 (29) 23 (29) 12 (18)
YKR Mid-Maricaban Bay (11) 8 (6) 27 (13) 40 (17) 39 (20) 8 (6) Mid-Maricaban Bay (nu 12) 37 (9) 35 (15) 33 (9) 37 (11) 15 (13) ESE Cabilauan Is (17) * 58 (10) 49 (11) 63 (16) 73 (6) 8 (6) ESE Cabilauan Is (18) 58 (15) 32 (12) 24 (10) 20 (18) 18 (16) NNW Cabilauan Is (20) * 65 (14) 48 (12) 59 (20) 44 (13) 33 (19) EcoFarm (24) 60 (19) 71 (6) 6 (22) 45 (5) 24 (12)
YKR pooled 46 (26) 45 (27) 35 (29) 39 (31) 16 (21)
San Nicolas Inner Maricaban Bay (13) 2 (8) 54 (15) 50 (13) 23 (16) 13 (8) Inner Maricaban Bay (15) 28 (13) 42 (1) 51 (7) 57 (10) 23 (7)
San Nicolas pooled 15 (15) 45 (24) 46 (18) 33 (30) 18 (12)
Decabobo NW coastline Decabobo (27) 65 40 33 (11) 30 (35) 3
Malawig N coastline Malawig (31) * 50 (3) 53 (10) 61 (14) 64 (15) 25 (24) W Simol Is (32) 35 (6) 63 (7) 63 (11) 54 (12) 27 (5)
Malawig pooled 39 (9) 56 (15) 58 (17) 56 (21) 26 (34) Buenavista NE coastline Buenavista (35) 23 (11) 27 (10) 37 (12) 38 (10) 20 (11)
N Napuscol Is (39) 13 (7) 84 (12) 64 (10) 10 (18) 10 (17)

_____________________________________________________________________________________________________________________________CHAPTER III: SEAGRASS AND SEAWEEDS
33
Bed zone Barangay Site (Station) Edge Inner Middle Outer End
Mean SEM Mean SEM Mean SEM Mean SEM Mean SEM
Buenavista pooled 19 (13) 50 (33) 44 (28) 19 (21) 16 (11)
Turda N coastline Turda (40) * 77 (2) 74 (12) 66 (21) 33 (23) 13 (20) Middle coastline Turda (42) 38 (33) 43 (5) 48 (4) 29 (10) 17 - S coastline Turda (46) 22 (28) 30 (2) 46 (3) 52 (1) 45 - S coastline Turda (48) 33 (15) 61 (7) 43 (18) 10 (3) - -
Turda pooled 43 (29) 56 (20) 48 (23) 24 (25) 20 (28)
Marcilla NE coastline Marcilla (50) - (8) 36 (19) 72 (28) 59 (16) - - SSE coastline Marcilla (nu 53) 33 (8) 53 (5) 27 (11) 17 (8) - (5) SW Dihoran Is (55) 70 (3) 61 (10) 37 (3) 23 (10) - (13) SSW coastline Marcilla (60) 18 (18) 15 (12) 16 (5) 18 - 10 (8)
Marcilla pooled 30 (33) 41 (26) 43 (29) 36 (30) 3 (5)
Tagumpay Middle coastline Tagumpay (75)
18 35 23 30 18
Poblacion I Middle coastline Pob I (77) 28 38 34 15 13
Poblacion V Middle coastline Pob V (79) 43 (20) 71 (11) 45 (8) 28 (13) 28 (18)
NNW coastline Baquit Is (105A)
45 (25) 55 (13) 51 (1) 24 (7) 3 (3)
Poblacion V pooled 44 (22) 64 (24) 48 (20) 26 (16) 15 (20)
Poblacion VI SE coastline Pob VI (80) 25 43 62 (12) 45 (20) 13
Guadalupe SW coastline Guadalupe (91) - - - - 1 (0.1) - - - -

_____________________________________________________________________________________________________________________________CHAPTER III: SEAGRASS AND SEAWEEDS
34
Bed zone Barangay Site (Station) Edge Inner Middle Outer End
Mean SEM Mean SEM Mean SEM Mean SEM Mean SEM
Bintuan NNE coastline Bintuan (92) 7 - 28 (33) 9 (0.1) 1 - - (8)
E coastline Bintuan (94) 13 (13) 50 (6) 47 (13) 36 (8) 2 - S coastline Bintuan (99) 15 (10) 26 (2) 22 (0.3) 4 (4) - (2) SW coastline Bintuan (nu 106) 3 - 28 (8) 41 (11) 31 (11) - - Mouth of mangrove inlet (107) 2 (2) 2 (1) 8 (4) 3 (2) - - W coastline Bintuan (111) 13 (13) 13 (2) 17 (1) 11 (1) - - E Danglet Is (Z113) 14 (11) 28 (3) 38 (13) 34 (7) 2 - W Tangat Is (Z114) - - 2 (2) 24 (1) 17 (0) - (2) E <island> (Z115) - - 32 (6) 27 (6) 26 (12) 3 -
Bintuan pooled 7 (10) 23 (19) 27 (17) 20 (20) 1 (1)
Lajala NE of island (83) 13 (13) 26 (8) 23 (3) 4 (1) - (3) SSE of island (85) 2 (2) 18 (3) 36 (11) 44 (1) 13 - W <islet> (90) 4 (1) 37 (7) 28 (3) 18 (3) 3 (13) SSW of island (102) 3 (3) 15 (10) 23 (18) 25 - 2 (3) W of island (104) 15 (10) 10 (5) 11 (1) 6 (6) - (2)
Lajala pooled 7 (10) 24 (17) 25 (16) 18 (17) 3 (8)

_________________________________________________________________________________CHAPTER III: SEAGRASS AND SEAWEEDS
35
Figure 12. Bottom cover of A, seagrasses and B, seaweeds across the bed zones. Circles represent mean values; lines above and below the means are the maxima and minima, respectively. Dotted horizontal line in A = borderline value separating dense and sparse seagrass-covered bottoms (PCSDS, 1994). Coron, August 2003
0
20
40
60
80
100
edge inner mid outer end
bed zone
seag
rass
cov
er, %
max
min
mean
0
20
40
60
80
100
edge inner mid outer end
bed zone
seaw
eed
cove
r, %

_________________________________________________________________________________CHAPTER III: SEAGRASS AND SEAWEEDS
36
Figure 13. Mean Cover of Seaweeds per Station Range 0.2 to 67% Scaled by the Size of the Circles, Coron, Palawan, 2003
120 120.1 120.2 120.3 120.4
E Longitude
11.9
12
12.1
12.2
12.3
N L
atitu
de

______________________________________________________________________________________________________________________________CHAPTER III: SEAGRASS AND SEAWEEDS
37
Table 10. Seaweed cover profile (mean % ± SEM) on the edges (i.e., inshore incidence), within the bed proper, and on the seaward ends. Legend: * stations with intermediate cover (between 26 and 49%), ** stations with high cover (≥50%), Coron, August 2003
Bed zone
Barangay Site (Station) Edge Inner Middle Outer End Mean SEM Mean SEM Mean SEM Mean SEM Mean SEM
San Jose NE coastline San Jose (5) 1 (1) 3 (1) 2 (1) 5 (3) 3 (2) Marina (6) 2 (2) 8 (2) 25 (12) 17 (5) 10 (8) Across Marina (7) 0 (0) 1 (1) 3 (0) 1 (1) 6 (5)
San Jose pooled 1 (2) 5 (7) 14 (19) 10 (11) 6 (8)
YKR Mid-Maricaban Bay (11) 1 (1) 2 (1) 3 (2) 11 (10) 12 (7) Mid-Maricaban Bay (nu 12) 9 (8) 8 (6) 6 (3) 9 (3) 5 - ESE Cabilauan Is (17) 3 (2) 11 (5) 5 (1) 4 (2) 14 (10) ESE Cabilauan Is (18) 2 (2) 17 (12) 17 (9) 23 (16) 12 (4) NNW Cabilauan Is (20) 3 (3) 1 (0) 2 (1) 0 (0) 1 (1) EcoFarm (24) - - 11 (0) 31 (6) 11 (7) 3 (3)
YKR pooled 3 (6) 8 (12) 11 (19) 14 (18) 8 (10)
San Nicolas Inner Maricaban Bay (13) 4 (1) 6 (3) 4 (4) 8 (7) 20 (20) Inner Maricaban Bay (15) 2 (2) 9 (6) 6 (5) 2 (1) 2 (2)
San Nicolas pooled 3 (2) 8 (10) 5 (9) 7 (16) 11 (20)
Decabobo NW coastline Decabobo (27) **
25 - 60 - 68 - 65 - 95 -
Malawig N coastline Malawig (31) * 50 - 41 - 15 - 10 - 62 -
W Simol Is (32) 4 (3) 5 (3) 5 (3) 6 (4) 11 (5) Malawig pooled 15 (24) 19 (21) 9 (9) 7 (8) 24 (27)
(continued)

______________________________________________________________________________________________________________________________CHAPTER III: SEAGRASS AND SEAWEEDS
38
Bed zone Barangay Site (Station) Edge Inner Middle Outer End
Mean SEM Mean SEM Mean SEM Mean SEM Mean SEM
Buenavista NE coastline Buenavista (35) - - 3 (3) 2 (0) 2 (1) 4 (3) N Napuscol Is (39) * 70 (5) 7 (3) 24 (14) 64 (16) 60 (20)
Buenavista pooled 28 (39) 4 (5) 15 (19) 28 (31) 26 (34) Turda N coastline Turda (40) 5 (3) 5 (3) 6 (3) 16 (9) 20 (9)
Middle coastline Turda (42) 4 (3) 2 (2) 5 (3) 8 (4) 13 (6) S coastline Turda (46) 2 (2) 2 (2) 2 (2) 1 (1) 3 (3) S coastline Turda (48) - - 20 (14) 38 (15) 52 (10) 45 (40)
Turda pooled 3 (4) 9 (13) 15 (21) 27 (26) 18 (25)
Marcilla NE coastline Marcilla (50) 2 (2) 11 (1) 9 (3) 22 (13) 50 (45) SSE coastline Marcilla (nu 53) *
- - 13 (5) 43 (8) 60 - 48 (48)
SW Dihoran Is (55) * 15 (10) 18 (1) 25 (8) 45 (31) 35 (30) SSW coastline Marcilla (60) - - - - - - - - - -
Marcilla pooled 5 (8) 13 (9) 20 (20) 30 (28) 41 (41)
Tagumpay Middle coastline Tagumpay (75)
3 (4) 8 (14) 5 (9) 8 (11) 25 -
Poblacion I Middle coastline Pob I (77) - - 2 (2) 1 (2) 2 (2) 5 (7)
Poblacion V Middle coastline Pob V (79) - - 2 (2) 1 (1) 2 (2) 5 (5)
NNW coastline Baquit Is (105A)
3 (3) 2 (2) 2 (2) 3 (3) 13 (13)
Poblacion V pooled 1 (3) 2 (2) 1 (2) 2 (2) 13 (14)
(continued)

______________________________________________________________________________________________________________________________CHAPTER III: SEAGRASS AND SEAWEEDS
39
Bed zone Barangay Site (Station) Edge Inner Middle Outer End
Mean SEM Mean SEM Mean SEM Mean SEM Mean SEM
Poblacion VI SE coastline Pob VI (80) - - 2 (2) 1 (1) 2 (2) 4 (1) Guadalupe SW coastline Guadalupe (91) 3 (4) 31 (28) 47 (27) 25 (13) 15 (21) Bintuan NNE coastline Bintuan (92) 3 (3) 29 (9) 47 (3) 25 (5) 15 (15)
E coastline Bintuan (94) - - - - 13 - 38 - 25 - S coastline Bintuan (99) 13 (13) 4 (1) 6 (4) 4 (1) - - SW coastline Bintuan (nu 106) 18 (13) 16 (11) 16 (7) 69 (5) 28 (3) Mouth of mangrove inlet (107) 2 (2) 8 (4) 6 (1) 8 (4) 3 - W coastline Bintuan (111) 15 (10) 11 (8) 2 (1) 8 (8) 13 (13) E Danglet Is (Z113) - - 7 (4) 21 (18) 57 (16) 42 (39) W Tangat Is (Z114) 3 (3) - - - - 10 (7) 15 (10) E <island> (Z115) - - 1 (0) 5 (2) 11 (5) 13 (13)
Bintuan pooled 6 (10) 5 (8) 7 (11) 20 (28) 16 (20)
Lajala NE of island (83) - - 2 - 3 (1) 4 (1) 4 (1) SSE of island (85) 2 (2) 3 (1) 8 (4) 23 (5) 4 (1) W <islet> (90) 3 - 3 - 3 (0) 3 (1) 2 (2) SSW of island (102) - - 3 (2) - - 7 (4) 3 (3) W of island (104) 4 (1) 35 (17) 33 (2) 64 (4) 34 (31)
Lajala pooled 2 (2) 7 (15) 9 (14) 16 (25) 9 (20)

_________________________________________________________________________________CHAPTER III: SEAGRASS AND SEAWEEDS
40
Figure 14. Mean Cover of Seaweeds Per Station (range 1 to 63%, Scaled by the Size of the Circles), Coron, Palawan, 2003
120 120.1 120.2 120.3 120.4
E Longitude
11.9
12
12.1
12.2
12.3
N L
atitu
de

_________________________________________________________________________________CHAPTER III: SEAGRASS AND SEAWEEDS
41
Species Composition and Distribution Nine species of seagrasses were found in Coron (Table 11, Fig. 15): Enhalus
acoroides was the most ubiquitous (with some populations bearing flowers and fruits), followed by Thalassia hemprichii, and Halophila ovalis (Halophila minor was subsumed under H. ovalis because recent literature indicates the former as a conspecific of the latter; Green and Short, 2003). Syringodium isoetifolium and Halodule pinifolia were mixed with these 3 species but were restricted to wave-exposed stations. Cymodocea rotundata (also most frequent in Malawig), C. serrulata and Halodule uninervis, also mixed with the first three species mentioned, occurred mostly on the south of the mainland. Halophila sp. was encountered only in 8 stations also south of the mainland (Fig. 15). Except for the monospecific stands of E. acoroides (2 stations in Bintuan) and of T. hemprichii (Guadalupe) (Table 11), the meadows were mixes of 2 to 9 species. Combinations of 3 and 8 were modal and half of the stations were inhabited by 4 to 7 species (Figs. 16, 17). The trend for mean species richness from inshore to seaward is, again, slightly parabolic (Fig. 18). Using local (= station) species distribution frequencies (%), TWINSPAN indicated two communities of seagrasses in Coron: (a) communities with at least 5 species common in the meadows ; and (b) communities with 2 to 3 frequently occurring species (Fig. 11).
There were 25 genera of seaweeds encountered in Coron (Table 12) but mixes were
limited to only 16 per station (Fig. 16). The green algae Halimeda was the most frequently associated genus and even formed narrow beds in Station 91 (Guadalupe, Table 10). Incidences of Halimeda within the meadows were also 4 times greater than the edges and ends. The brown algae Padina and Sargassum occurred across the bed in half of the records with Halimeda and with peaks in frequencies on the outer borders, as expected. Caulerpa (green algae) was generally more associated within the canopy of seagrasses rather than on the exposed borders. In turbid Station 92 (Bintuan), the preponderance of C. peltata populations was noted. The number of genera associated with seagrasses increased from inshore to the outer border (peaks up to 16), then diminished at the seaward end where corals predominated (Fig. 18).

______________________________________________________________________________________________________________________________CHAPTER III: SEAGRASS AND SEAWEEDS
42
Table 11. Species richness and the relative frequency (%) of seagrasses for each station and for each barangay (pooled means ± SEM). ENHA = Enhalus acoroides, THALI = Thalassia hemprichii, CYRO = Cymodocea rotundata, CYSE = Cymodocea serrulata, SYRI = Syringodium isoetifolium, HUNI = Halodule uninervis, HPIN = Halodule pinifolia, HOVA = Halophila ovalis, HALO = Halophila sp. (minor and/or decipiens), Coron, August 2003
Relative frequency (%) Barangay Site (Station) Species richness ENHA THALI CYRO CYSE SYRI HUNI HPIN HOVA HALO
San Jose NE coastline San Jose (5) 8 1 17 18 5 15 20 6 18 -
Marina (6) 3 91 5 - - - - - 5 - Across Marina (7) 6 38 25 4 - - 8 4 22 -
San Jose pooled 8 43 16 7 2 5 9 3 15 - (26) (6) (5) (2) (5) (6) (2) (5) -
YKR Mid-Maricaban Bay (11) 7 25 17 19 - 10 7 14 10 - Mid-Maricaban Bay (nu 12) 8 39 20 6 14 1 5 1 15 - ESE Cabilauan Is (17) 8 17 17 13 5 12 15 7 15 - ESE Cabilauan Is (18) 8 14 23 15 4 11 11 6 15 - NNW Cabilauan Is (20) 8 21 20 14 2 11 10 6 15 - EcoFarm (24) 7 38 25 3 6 - 4 1 23 -
YKR pooled 8 25 20 12 5 7 9 6 16 - (4) (1) (2) (2) (2) (2) (2) (2) -
San Nicolas Inner Maricaban Bay (13) 2 91 - - - - - - 9 - Inner Maricaban Bay (15) 5 33 32 6 - - 7 - 21 -
San Nicolas pooled 5 62 10 13 - - 1 - 5 - (29) (2) (10) - - (1) - (0.04) -
Decabobo NW coastline Decabobo (27) 3 12 47 41 - - - - - - (continued)

______________________________________________________________________________________________________________________________CHAPTER III: SEAGRASS AND SEAWEEDS
43
Relative frequency (%) Barangay Site (Station) Species richness ENHA THALI CYRO CYSE SYRI HUNI HPIN HOVA HALO
Malawig N coastline Malawig (31) 6 22 22 22 - 17 8 - 11 -
W Simol Is (32) 7 - 19 23 1 14 12 13 19 - Malawig pooled 8 11 20 22 1 15 10 6 15 -
(11) (1) (1) (1) (1) (2) (6) (4) -
Buenavista NE coastline Buenavista (35) 4 59 20 2 - - - - 20 - N Napuscol Is (39) 6 19 21 21 - 14 14 - 11 -
Buenavista pooled 6 39 20 12 - 7 7 - 15 - (20) (1) (9) - (7) (7) - (4) -
Turda N coastline Turda (40) 7 25 27 23 1 18 2 - 4 - Middle coastline Turda (42) 6 6 35 33 - 21 2 2 - - S coastline Turda (46) 8 20 18 17 2 12 12 2 17 - S coastline Turda (48) 9 22 21 20 1 14 7 3 12 1
Turda pooled 9 18 25 23 1 16 6 2 8 0.2 (4) (4) (4) (0.4) (2) (3) (1) (4) (0.2)
Marcilla NE coastline Marcilla (50) 7 26 21 7 7 9 6 - 24 - SSE coastline Marcilla (nu 53) 9 23 23 11 3 4 8 4 23 1 SW Dihoran Is (55) 8 15 14 14 13 14 14 3 14 - SSW coastline Marcilla (60) 6 33 17 6 - - 10 2 31 -
Marcilla pooled 9 24 19 11 8 9 9 2 20 0.5 (4) (2) (2) (3) (3) (2) (1) (3) (0.5)
Tagumpay Middle coastline Tagumpay (75)
3 55 41 - - - - - 5 -
(continued)

______________________________________________________________________________________________________________________________CHAPTER III: SEAGRASS AND SEAWEEDS
44
Relative frequency (%) Barangay Site (Station) Species richness ENHA THALI CYRO CYSE SYRI HUNI HPIN HOVA HALO
Poblacion I Middle coastline Pob I (77) 2 97 3 - - - - - - -
Poblacion V Middle coastline Pob V (79) 3 54 43 4 - - - - - -
NNW coastline Baquit Is (105A)
3 81 15 - - - - - 4 -
Poblacion V pooled 4 67 29 2 - - - - 2 - (14) (14) (2) - - - - (2) -
Poblacion VI SE coastline Pob VI (80) 2 67 33 - - - - - - -
Guadalupe SW coastline Guadalupe (91) 1 - 100 - - - - - - - Bintuan NNE coastline Bintuan (92) 1 100 - - - - - - - -
E coastline Bintuan (94) 3 40 32 - - - - - 27 - S coastline Bintuan (99) 8 25 32 7 7 - 2 2 22 3 SW coastline Bintuan (nu 106) 5 34 34 2 - - 3 - 26 - Mouth of mangrove inlet (107) 1 100 - - - - - - - - W coastline Bintuan (111) 8 20 20 15 5 5 15 - 17 2 E Danglet Is (Z113) 8 42 16 7 6 4 9 - 13 3 W Tangat Is (Z114) 8 27 18 6 4 7 9 - 22 7 E <island> (Z115) 6 41 36 3 7 - - - 11 3
Bintuan pooled 9 48 21 4 3 2 4 0.2 15 2 (10) (5) (2) (1) (1) (2) (0.2) (3) (1)
Lajala NE of island (83) 4 74 17 4 - - - - 4 - SSE of island (85) 7 34 21 4 - 11 9 - 19 2 W <islet> (90) 8 25 23 15 2 2 9 - 23 1 SSW of island (102) 3 83 8 - - - - - 8 - W of island (104) 7 16 37 16 - - 3 13 13 3 (continued)

______________________________________________________________________________________________________________________________CHAPTER III: SEAGRASS AND SEAWEEDS
45
Relative frequency (%) Barangay Site (Station) Species richness ENHA THALI CYRO CYSE SYRI HUNI HPIN HOVA HALO
Lajala pooled 9 46 21 8 0.4 3 4 3 14 1 (14) (5) (3) (0.4) (2) (2) (3) (3) (1)

______________________________________________________________________________________________________________________________CHAPTER III: SEAGRASS AND SEAWEEDS
46
120 120.1 120.2 120.3 120.4
E Longitude
11.9
12
12.1
12.2
12.3
N L
atitu
de
Enhalus acoroides Thalassia hemprichii
120 120.1 120.2 120.3 120.4
E Longitude
11.9
12
12.1
12.2
12.3N
Lat
itude

______________________________________________________________________________________________________________________________CHAPTER III: SEAGRASS AND SEAWEEDS
47
120 120.1 120.2 120.3 120.4
E Longitude
11.9
12
12.1
12.2
12.3
N L
atitu
de
120 120.1 120.2 120.3 120.4
E Longitude
11.9
12
12.1
12.2
12.3
N L
atitu
de
Halophila ovalis Syringodium isoetifolium

______________________________________________________________________________________________________________________________CHAPTER III: SEAGRASS AND SEAWEEDS
48
Halodule pinifolia Cymodecea rotundata
120 120.1 120.2 120.3 120.4
E Longitude
11.9
12
12.1
12.2
12.3N
Lat
itude
120 120.1 120.2 120.3 120.4
E Longitude
11.9
12
12.1
12.2
12.3
N L
atitu
de

______________________________________________________________________________________________________________________________CHAPTER III: SEAGRASS AND SEAWEEDS
49
Cymodocea serrulata Halodule uninervis
120 120.1 120.2 120.3 120.4
E Longitude
11.9
12
12.1
12.2
12.3
N L
atitu
de
120 120.1 120.2 120.3 120.4
E Longitude
11.9
12
12.1
12.2
12.3
N L
atitu
de

_________________________________________________________________________________CHAPTER III: SEAGRASS AND SEAWEEDS
50
Halophila sp Figure 15. Relative frequency of occurrence (%) of each seagrass species (scaled by the size of the circles using species-specific data limits). Coron, August 2003
120 120.1 120.2 120.3 120.4
E Longitude
11.9
12
12.1
12.2
12.3N
Lat
itude

_________________________________________________________________________________CHAPTER III: SEAGRASS AND SEAWEEDS
51
Figure 16. The distribution of the stations by A, seagrass species richness and B,
number of seaweed genera. Coron, August 2003
0
4
8
1 2 3 4 5 6 7 8 9
n species
n st
atio
ns
0
4
8
1 3 5 7 9 11 13 15
n genera
n st
atio
ns

_________________________________________________________________________________CHAPTER III: SEAGRASS AND SEAWEEDS
52
Figure 17. Diversity of the meadows (as species richness N, range = 1 to 9, scaled by the size of the circles). Coron, August 2003
120 120.1 120.2 120.3 120.4
E Longitude
11.9
12
12.1
12.2
12.3
N L
atitu
de

_________________________________________________________________________________CHAPTER III: SEAGRASS AND SEAWEEDS
53
Figure 18. The profile of A, seagrass species richness and B, number of seaweed genera across the bed zones. Circles represent mean values; lines above and below the means are the maxima and minima, respectively, Coron, August 2003
0
2
4
6
8
10
edge inner mid outer end
bed zone
n sp
ecie
s, s
eagr
asse
s
0
4
8
12
16
20
edge inner mid outer end
bed zone
n ge
nera
, sea
wee
ds

_________________________________________________________________________________CHAPTER III: SEAGRASS AND SEAWEEDS
54
Figure 19. Two communities of seagrasses classified by TWINSPAN using the relative occurrence of each species (%) as attribute. Green circles – N = 5 to 9, with at least 5 species common in the meadows; red circles – N = 1 to 7 with only 2 to 3 frequently encountered species. Coron, August 2003
120 120.1 120.2 120.3 120.4
E Longitude

_________________________________________________________________________________CHAPTER III: SEAGRASS AND SEAWEEDS
55
Table 12. Marine Macrobenthic Algae (genera). Genera with asterisks (*) were the most frequently encountered in the surveys. Coron, August 2003.
Class Chlorophyceae (green algae) Class Rhodophyceae (red algae) Order Cladophorales Order Bonnemaisoniales Family Cladophoracea Family Galaxauraceae
• Chaetomorpha • Actinotrichia fragilis • Galaxaura Order Siphonocladales Family Valoniaceae Order Gelidiales
• Valonia Family Gelidiaceae • Gelidiella acerosa Order Bryopsidales Family Caulerpaceae Order Cryptonemiales
• Caulerpa Family Cryptonemiaceae Family Codiaceae • Halymenia
• Codium Family Halimedaceae Order Corallinales
• Halimeda *** Family Corallinaceae Family Udoteaceae • Amphiroa
• Avrainvillea • Chlorodesmis Order Gigartinales • Tydemania Family Gracilariaceae • Udotea • Gracilaria
Family Solieraceae Order Dascycladales • Kappaphycus Family Dascycladaceae
• Neomeris Order Ceramiales Family Rhodomelaceae • Acanthopora Class Phaeophyceae (brown algae) • Laurencia Order Dictyotales Family Dictyotaceae
• Dictyota * • Padina **
Order Scytosiphonales Family Scytosiphonaceae
• Colpomenia • Hydroclathrus
Order Fucales Family Sargassaceae
• Sargassum ** • Turbinaria *
Other Bottom Features
Feeding tracks/ trenches of the marine mammal Dugong dugon were observed in the seagrass meadows of four barangays: San Jose (Stns. 5 and 7), YKY (Stns. 11, 18, and 20), Malawig (Stn. 32), and Turda (Stns. 40, 42, and 46). Small sand patches and mounds from turbative activities of burrowing shrimps were common in most of the meadows. Among the conspicuous epibenthos were, in decreasing order of frequencies, (a) echinoderms – mostly aggregations of black-spined urchins Diadema setosum, a few individuals of Tripneustes
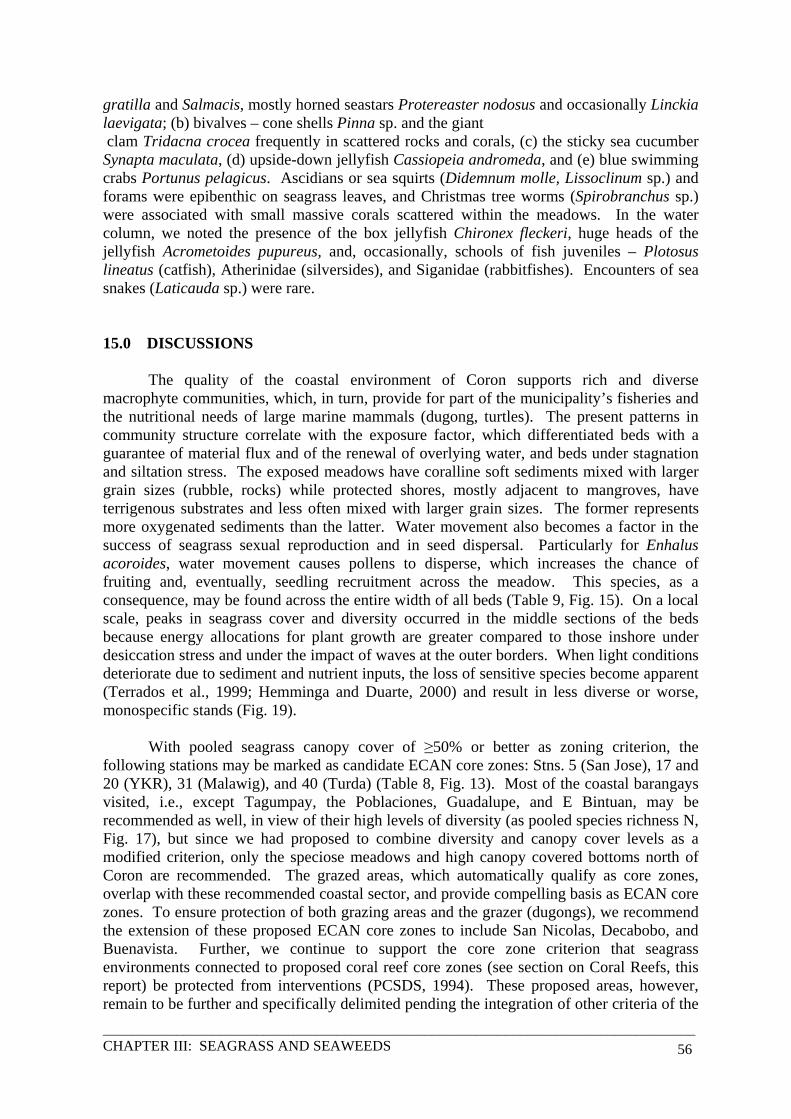
_________________________________________________________________________________CHAPTER III: SEAGRASS AND SEAWEEDS
56
gratilla and Salmacis, mostly horned seastars Protereaster nodosus and occasionally Linckia laevigata; (b) bivalves – cone shells Pinna sp. and the giant clam Tridacna crocea frequently in scattered rocks and corals, (c) the sticky sea cucumber Synapta maculata, (d) upside-down jellyfish Cassiopeia andromeda, and (e) blue swimming crabs Portunus pelagicus. Ascidians or sea squirts (Didemnum molle, Lissoclinum sp.) and forams were epibenthic on seagrass leaves, and Christmas tree worms (Spirobranchus sp.) were associated with small massive corals scattered within the meadows. In the water column, we noted the presence of the box jellyfish Chironex fleckeri, huge heads of the jellyfish Acrometoides pupureus, and, occasionally, schools of fish juveniles – Plotosus lineatus (catfish), Atherinidae (silversides), and Siganidae (rabbitfishes). Encounters of sea snakes (Laticauda sp.) were rare. 15.0 DISCUSSIONS
The quality of the coastal environment of Coron supports rich and diverse macrophyte communities, which, in turn, provide for part of the municipality’s fisheries and the nutritional needs of large marine mammals (dugong, turtles). The present patterns in community structure correlate with the exposure factor, which differentiated beds with a guarantee of material flux and of the renewal of overlying water, and beds under stagnation and siltation stress. The exposed meadows have coralline soft sediments mixed with larger grain sizes (rubble, rocks) while protected shores, mostly adjacent to mangroves, have terrigenous substrates and less often mixed with larger grain sizes. The former represents more oxygenated sediments than the latter. Water movement also becomes a factor in the success of seagrass sexual reproduction and in seed dispersal. Particularly for Enhalus acoroides, water movement causes pollens to disperse, which increases the chance of fruiting and, eventually, seedling recruitment across the meadow. This species, as a consequence, may be found across the entire width of all beds (Table 9, Fig. 15). On a local scale, peaks in seagrass cover and diversity occurred in the middle sections of the beds because energy allocations for plant growth are greater compared to those inshore under desiccation stress and under the impact of waves at the outer borders. When light conditions deteriorate due to sediment and nutrient inputs, the loss of sensitive species become apparent (Terrados et al., 1999; Hemminga and Duarte, 2000) and result in less diverse or worse, monospecific stands (Fig. 19).
With pooled seagrass canopy cover of ≥50% or better as zoning criterion, the following stations may be marked as candidate ECAN core zones: Stns. 5 (San Jose), 17 and 20 (YKR), 31 (Malawig), and 40 (Turda) (Table 8, Fig. 13). Most of the coastal barangays visited, i.e., except Tagumpay, the Poblaciones, Guadalupe, and E Bintuan, may be recommended as well, in view of their high levels of diversity (as pooled species richness N, Fig. 17), but since we had proposed to combine diversity and canopy cover levels as a modified criterion, only the speciose meadows and high canopy covered bottoms north of Coron are recommended. The grazed areas, which automatically qualify as core zones, overlap with these recommended coastal sector, and provide compelling basis as ECAN core zones. To ensure protection of both grazing areas and the grazer (dugongs), we recommend the extension of these proposed ECAN core zones to include San Nicolas, Decabobo, and Buenavista. Further, we continue to support the core zone criterion that seagrass environments connected to proposed coral reef core zones (see section on Coral Reefs, this report) be protected from interventions (PCSDS, 1994). These proposed areas, however, remain to be further and specifically delimited pending the integration of other criteria of the

_________________________________________________________________________________CHAPTER III: SEAGRASS AND SEAWEEDS
57
ECAN-Zoning framework, of which socio-economics and resource use are the most direct contributors.
The seagrass habitats of Coron are particularly more vulnerable to eutrophication and siltation. Unmanaged domestic waste disposal in coastal areas with settlements (the Poblaciones) can lead to increased nutrient levels that favor algal blooms and significantly reduce the light environment of seagrasses. Siltation may eventually reduce the extent of seagrass communities and the community biomass when closely associated with mangroves. This may be exacerbated by uncontrolled deforestation and subsequent rapid conversions to rice plantations in the same areas. When small seagrass patches and wide meadows decline often following water quality and habitat deterioration, become an open space, succession events through time are inevitable.
16.0 CONCLUSIONS AND RECOMMENDATIONS
The nearshore environment of Coron supports seagrass-dominated macrophytes on shallow soft bottoms. Most of the sites had incidences of canopy cover that exceeded 50% and the mixed beds were typically composed of two (2) to nine (9) species. Seaweeds contributed minimally to vegetative cover overall. Evidence of grazing by dugongs was apparent in San Jose, YKR, Malawig, and Turda, and, again, demonstrated the animal’s affinity to speciose and relatively dense beds. It is proposed that this northern coastal sector of mainland Coron be candidate ECAN core zones.

____________________________________________________________________________________CHAPTER IV: MARINE MAMMALS AND SEA TURTLES 58
CHAPTER IV MARINE MAMMALS AND SEA TURTLES
17.0 INTRODUCTION
Marine mammals and sea turtles are the least studied among the more visible animal groups in Philippine waters. In Coron, available information is limited to animal sightings from very few secondary literature of which details are largely unknown.
This baseline survey was conducted with the objective of obtaining data on dugong habitats, turtle nesting sites, and cetacean distribution. Although this assessment is largely based on anecdotal information, data when verified shall provide important inputs to address the preservation of biological diversity and protection of rare and endangered species and its habitat, as stipulated in the Inception Report. 18.0 MATERIALS AND METHODS
Key informant interviews (KII) were done in thirteen (13) coastal and island barangays of Coron using a standardized questionnaire designed to document the knowledge, occurrence, group size, threats, and conservation awareness of marine mammals and sea turtles in the municipality.
Due to the absence of data from the municipal agricultural office (MAO) in Coron, the total number of fisherfolks came from the barangay captains and kagawads in the areas. One thousand eight hundred forty (1,840) fisherfolks were reported (Table 13) and ten (10%) percent of the said population (184) was supposed to be taken as respondents. However, only one hundred forty four (144, ± 78%) respondents were interviewed given the constraints of the activity. Limitations of the survey included unavailability of fishermen upon arrival of the survey team, and refusal of several fisherfolks to be interviewed. This however, is believed to have no affect on survey data for the reason that since only one municipality was surveyed, respondents from the thirteen (13) barangays generally had the same information on dugong habitats, turtle nesting sites, and cetacean distribution. Given this, it was assumed that the remaining target respondents (n=40, ± 22%) would eventually furnish the same information. The objective of the survey then was still met.
The reported locations of marine mammals and sea turtles, as well as turtle nesting sites, were recorded on a 1:250,000 base map of the municipality. The data were then processed using the software Garmin Map Source to illustrate animal distribution together with the estimated coordinates. Identification of cetacean species occurring in the area was determined using photographs (Plate 4). Descriptive statistics (Trochim 2002) were used to describe the results in this survey.

____________________________________________________________________________________CHAPTER IV: MARINE MAMMALS AND SEA TURTLES 59
Table 13. Estimated Number of Fisherfolks in the Municipality of Coron*
Barangay Number La Jala** 150 Malawig 120 Buenavista 200 Bulalacao** 500 Maricaban 20 Decalachao 15 Turda 50 Marcilla 100 Borac 35 Bintuan 150 Tagumpay 200 Tara** 100 Decabobo 200
TOTAL 1840 *Source: Barangay Captains and Kagawads, August 2003 **Island Barangay
Plate 4. Respondent pointing to possible cetacean species occurring in barangay waters. (Photo: MF Digdigan)

____________________________________________________________________________________CHAPTER IV: MARINE MAMMALS AND SEA TURTLES 60
19.0 RESULTS Respondent Background
Respondents comprised of full-time male fisherfolks, majority (54.2%) of whom were in their 30’s and 40’s. Most (53.5%) were natives from various areas in the Palawan Province, although fisherfolks from the Visayas (29.9%) were also dominant in several island barangays. Respondents have been fishing in barangay waters for 15 to 20 years, and commonly used fishing gears were hook & line, and fishnet. Fishing frequencies ranged from everyday and thrice weekly. Educational attainment was generally elementary level. Knowledge on Marine Wildlife Dugongs. 86.11% of the respondents have seen dugongs and were mostly familiar with the animals’ morphological characteristics. Only 17.74% of them said that dugongs have dorsal fins. Common behaviors observed were swimming and feeding. All respondents believe that dugongs are fish. Sea Turtles. All respondents have seen sea turtles. However, 59.72% knew of only one species, “pawikan”. 27.78% reported two species,. “pawikan” and “kara”, while 8.33% reported three species, “pawikan”, “kara”, and “katuan” or “balimbing”. Animal behaviors observed were breathing, swimming, and floating. Indigenous knowledge on turtles included egg laying during the full moon, and that when eaten, sickness will befall the person.
Most turtle descriptions fit the Chelonia mydas, the Eretmochelys imbricata, and the Dermochelys coriacea. Cetaceans. Almost all respondents (99.31%) have seen dolphins and of this number, 14% reported that dolphins have 2 dorsal fins. 77.78% reportedly have seen whales and 17.86% of them again said that whales also have 2 dorsal fins. Common dolphin behaviors reported were swimming and porpoising, while swimming and breathing were reported for whales. Indigenous knowledge on cetaceans reported were dolphins and dugongs are friends, the larger the cetacean the older it is, and, cetaceans voluntarily strand when it is their time to die due to old age. All respondents stated that cetaceans are ‘another kind of fish’.
Respondents through photo-identification identified cetacean species occurring in municipal waters as Tursiops truncatus, Stenella longirostris, Stenella attenuata, and Grampus griseus. Globicephala macrorhynchus are often referred to as dolphins due to their pod size. Some respondents also reported the Orcinus orca as occurring in their waters.

____________________________________________________________________________________CHAPTER IV: MARINE MAMMALS AND SEA TURTLES 61
Animal Distribution Dugongs, though rarely sighted, reportedly occur at near shore waters of Decabobo,
Tara, Malawig, Turda, Marcilla, and Bulalacao (Figure 20).
Figure 20. Reported Dugong Sightings (red squares), Coron, Palawan, 2003

____________________________________________________________________________________CHAPTER IV: MARINE MAMMALS AND SEA TURTLES 62
Sea turtles likewise occur at near shore waters in most of the barangyays (Figure 21). Leatherback sightings occur mostly offshore in the island barangays Reported turtle nests (Figure 21) present in the municipality were mostly found on islands in the northeastern part, namely Malpagalen, Deboyoyan, Dimampalic, Camanga, Lagat and Tinul. Delian Island in the south was also reported to have turtle nests.
Figure 21. Reported Turtle Sightings (green circles) and Turtle Nests (circle with x), Coron, Palawan, 2003

____________________________________________________________________________________CHAPTER IV: MARINE MAMMALS AND SEA TURTLES 63
Dolphins were common sights in offshore waters of most island barangays, and near shore coastal waters particularly within Cabilauan Island in the northern part (Figure 22). Whales were mostly found in deep, offshore waters between Tara, Malawig, and Turda (Figure 23).
Figure 22. Reported Dolphin Sightings (blue circles), Coron, Palawan, 2003

____________________________________________________________________________________CHAPTER IV: MARINE MAMMALS AND SEA TURTLES 64
Figure 23. Reported Whale Sightings (black star); Orca sighting (fish icon), Coron, Palawan, 2003
Seasonality of Animal Occurrence
Sighting frequencies for dugongs were limited from once a year to rare, opportunistic chance sightings. Frequent time of the day when seen ranges before ten in the morning and three to five in the afternoon. Chance sightings for whales throughout the year were reported but were commonly seen during the summer months of April to May. Turtles are commonly seen at any time of the day, all year round as well as with dolphins.
Survey results revealed that during the first and second quarter of 2003, most dugong sightings (Figure 24) occur in Decabobo (25.64%, s.d. ± 3.16), turtle (22.83%, s.d. ± 5.60,

____________________________________________________________________________________CHAPTER IV: MARINE MAMMALS AND SEA TURTLES 65
Dugong Sightings: 1st & 2nd Quarter 2003
0
2
4
6
8
10
12
1 2 3 4 5 6 7 8 9 10 11 12 13
Barangay
Num
ber o
f Sig
htin
gs
Turtle Sightings: 1st & 2nd Quarter 2003
0
5
10
15
20
25
1 2 3 4 5 6 7 8 9 10 11 12 13
Barangay
Num
ber o
f Sig
htin
gs
Figure 25) and dolphin (25%, s.d. ± 4.55, Figure 26) sightings in Bulalacao, and waters between Turda & Tara for whale sightings (28.57%, s.d. ± 1.85, Figure 27).
Figure 24. Dugong Sightings. Barangay 1: Bintuan, 2: Borac, 3: Buenavista, 4: Bulalacao, 5: Decabobo, 6: Decalachao, 7: Lajala, 8: Malawig, 9: Marcilla, 10: Tagumpay, 11: Tara, 12: Turda, 13: San Jose. Coron, Palawan, 2003
Figure 25. Turtle Sightings. Barangay 1: Bintuan, 2: Borac, 3: Buenavista, 4: Bulalacao, 5: Decabobo, 6: Decalachao, 7: Lajala, 8: Malawig, 9: Marcilla, 10: San Jose 11: Tagumpay, 12: Tara, 13: Turda, Coron, Palawan, 2003

____________________________________________________________________________________CHAPTER IV: MARINE MAMMALS AND SEA TURTLES 66
Figure 26. Dolphin Sightings. Barangay 1: Bintuan, 2: Borac, 3: Buenavista, 4: Bulalacao, 5: Decabobo, 6: Decalachao, 7: Lajala, 8: Malawig, 9: Marcilla, 10: San Jose 11: Tagumpay, 12: Tara, 13: Turda., Coron, Palawan, 2003
Figure 27. Whale Sightings. Barangay 1: Bintuan, 2: Borac, 3: Buenavista, 4: Bulalacao, 5: Decabobo, 6: Decalachao, 7: Lajala, 8: Malawig, 9: Marcilla, 10: San Jose 11: Tagumpay, 12: Tara, 13: Turda., Coron, Palawan, 2003
Dolphin Sightings: 1st & 2nd Quarter 2003
02468
1012141618
1 2 3 4 5 6 7 8 9 10 11 12 13
Barangay
Num
ber o
f Sig
htin
gs
Whale Sightings: 1st & 2nd Quarter 2003
0
1
2
3
4
5
6
7
1 2 3 4 5 6 7 8 9 10 11 12 13
Barangay
Num
ber o
f Sig
htin
gs

____________________________________________________________________________________CHAPTER IV: MARINE MAMMALS AND SEA TURTLES 67
Abundance in Terms of Group Size
No aggregates were reported for dugongs, turtles, and whales. Most sightings were limited to individual animals. In the case of dolphins, groups ranging from ten (10) to 50 were reported. Clusters and species association were unknown, and species identified are subject to verification. Local Perception on Trends in the Number of Animals Dugongs. Almost twenty nine percent (28.87%) of the respondents stated that dugong numbers were decreasing due to illegal fishing. Other reasons were attributed to rare sightings, and the animals’ slow reproduction rate. 26.05% were unsure whether the numbers were increasing or decreasing while 24.65% stated that numbers were increasing since the animal is not hunted in the area. 20.43% reported that numbers remain the same. Sea Turtles. Majority (64.14%) reported that turtle numbers were increasing because the animal lays eggs by the numbers and therefore, hundreds of turtles were being hatched. 13.79% said that they are decreasing because the animal is hunted. 12.41% reported that numbers remain the same, and 9.66% were unsure. Dolphins. A considerable percentage (60.84%) of the respondents stated that the dolphin numbers were increasing since they were always often seen in groups composed of many individuals. 14.69% stated that numbers remain the same and 12.59% reported numbers were decreasing because the animal is being hunted, and some fishermen use the meat as shark bait..More or less 11.88% were unsure. Whales. Around one third (35.42%) stated that numbers for whales remain the same; 26.39% were unsure; 21.53% thinks numbers were decreasing since the animal is rarely seen; and 16.66% said numbers were increasing since they are not hunted. Threats
Although majority of the respondents have reportedly not captured marine mammals and sea turtles, direct takes of these animals occur in the area. A small percentage (4.17%) of the respondents have captured dugongs, 32.64% have captured turtles, and 5.56% have captured dolphins. Fishnets were the major implements of capture, and animals caught were used for food consumption, while dolphin captures were also used for shark bait. Occasional stranding of marine mammals and sea turtles were reported in several areas. No incident however, happened for the first and second quarter of 2003. Identified threats to marine wildlife in the area were cyanide and dynamite fishing. Conservation Awareness Fisherfolk Behavior on Captured Animals. 92.86% of the respondents stated that they will release the animal if it is alive since catching is illegal, they are helpful to man, and, that these animals have no economic value at all. 7.14% stated that they will eat the animal, others will

____________________________________________________________________________________CHAPTER IV: MARINE MAMMALS AND SEA TURTLES 68
Knowledge of Laws
02468
10121416
1 2 3 4 5 6 7
Source
Perc
enta
ge
keep the animal as pet, and the rest will sell the animal for profit. If the animal is dead, 57.86% will release it since they are not eating such animals, 22.14% will eat the animal, while the remaining 20% stated they would bury the animals or report to their barangay officials. Others gave no answers at all. Animal Protection. 94.37% thinks that marine mammals and sea turtles need to be protected since they are helpful to man specifically during sea accidents. Dolphins and turtles were reported to save people who are drowning. 5.63% thinks that these animals need not be protected since they are always mobile and protection is difficult. Knowledge of Laws. Majority (76.43%) knew of laws that prohibit the catching of dugongs, sea turtles, dolphins, and whales from their barangay captain (Figure 28), while 23.57% have not heard of any law at all. When asked if such laws were implemented in their areas, 51.39% said yes as evidenced by the immediate release of animals when caught; 36.80% were unsure; 11.81% said no as evidenced by the ongoing hunting of animals and the presence of cyanide and dynamite fishing.
Figure 28. Knowledge of Laws. 1 – Barangay Captains, 2 – BFAR / Fisheries, 3 – Coron Municipal Gov’t, 4 – Environmental Legal Assistance Center (ELAC), 5 – Fellow Fishermen, 6 – Posters, 7 – Radio, Coron, Palawan, 2003

____________________________________________________________________________________CHAPTER IV: MARINE MAMMALS AND SEA TURTLES 69
20.0 DISCUSSIONS Distribution and Abundance
According to interview results, dugongs are no longer common in the municipality of Coron. Aerial surveys conducted by WWF & Toba (1998, unpub) revealed extremely low numbers of dugongs sighted in the area. Reasons for such are unknown; however, it is likely that aside from the reported illegal fishing in the area, the very low numbers may be attributed to low nutrient quality of available seagrass in the area, and acoustic disturbance due to high boat traffic. Dugong sightings were higher in Decabobo compared to other coastal barangays. A protected bay, with mangrove channels are characteristics of the area – sites where dugongs usually tend to occur (Heinsohn et.al. 1979). Further, seagrasses found are characteristic preferences of dugongs, Cymodocea serrulata and Halodule uninervis (Uri et.al. 1998).
Turtles commonly occur near shore in the coastal and island barangays. Although stranding reports, incidental takes, and interviews made may suggest a viable population of sea turtles in the municipality, it is difficult to assess their numbers since no research is focused on the assessment of their abundance. It is interesting to note that most respondents reported high sighting incidences of Dermochelys coriacea in their areas. These incidents further affirm that the Calamianes is a migration corridor for such turtle species. The Dermochelys coriacea is currently listed on the 10 marine species on the brink of extinction (IUCN 2003), with less than 100 nesting colonies worldwide. Thus, efforts should be made in the conservation of this species such as the control of fisheries that capture the animal directly and indirectly. Nesting sites reported were located mostly offshore in the northeastern area of the municipality and are characterized by small, solitary, uninhabited islands except Delian, an island reportedly populated by illegal fishermen from the Visayas.
Small cetaceans reported are widely distributed over the areas surveyed. Sightings in relatively shallow waters can be attributed to the abundance of shrimps in the area particularly during the months of October to February. Although local perceptions regarding dolphin numbers are increasing, there is no basis for assessment of such trend due to the absence of data on estimates of abundance in the municipality.
Secondary literature suggests that Globicephala macrorhynchus are common in Palawan based on stranding reports (CFI and DENR; Perrin and Dolar 1996). Further, two sighting incidents of Orcinus orca have been observed in 2001 in the Dumaran Strait, and in 2003 in offshore Araceli waters (Digdigan, personal observation). Given the proximities of the survey areas to deep waters, it is likely that more whale species occur in Coron waters. Threats
Although the identified threats by most respondents focus on dynamite and cyanide fishing, emphasis on another equally serious threat throughout the municipality should be given attention: direct captures of animals.

____________________________________________________________________________________CHAPTER IV: MARINE MAMMALS AND SEA TURTLES 70
Near shore areas where dugongs and turtles occur in the survey areas have become an easy and convenient source of food and income. Dugong meat peddled in Barangay Turda was encountered and was being sold at PHP 40.00 per kilo. The extent of dugong captures for food remains undocumented not only in Coron but for the rest of the Palawan province. Dugong numbers from aerial survey data revealed low counts and if no control on direct takes and hunting continues, there is a danger that dugongs will become locally extinct in the area.
Likewise, the extent of direct takes of turtles in the municipality are unknown, results for this survey however, provides documented preliminary indication of turtle utilization, notwithstanding the undisclosed takes of the rest of the fisherfolks in most areas. It is emphasized that if direct captures in the area include adults and sub-adults, then the turtle population is in critical condition for these individuals are most needed in maintaining the population.
The proximity to human activity exposes small cetaceans to numerous threats, and specific to Coron are dynamite fishing, direct takes, and commercial fisheries through net entanglement. Santos and Barut (2002) identified Bulalacao Island as one of the areas in the Philippines involved in cetacean by-catch. In the same area, blasts were encountered during the conduct of the survey and effects of such can be deteriorating to cetaceans’ sensory abilities should they be somewhere near the vicinity. Respondents from barangay Turda reported dolphin by-catch through entanglements by purse seiners (Plate 5) docked in their waters; and direct captures for use as shark baits. Estimated dolphin takes however, were unknown. By-catch affects nearly every cetacean species, whether odontocete or mysticete, large or small, riverine, inshore, or offshore. In addition to its population consequences, death from entanglement in fishing gear is often likely to be slow and painful.
Plate 5. Cetacean by-catch by purse seiners such as this reportedly occurs in Coron waters. This fishing vessel was docked in barangay Turda. (Photo: MF Digdigan)

____________________________________________________________________________________CHAPTER IV: MARINE MAMMALS AND SEA TURTLES 71
Local Knowledge and Conservation Awareness
Clearly, respondents in general are ignorant of the basic biology and ecology of marine mammals and sea turtles, and the impacts of human activities on such animals. Dugongs and cetaceans are perceived as fish, and thus, as reported by some respondents, they lay eggs. Cetaceans are often confused with sharks. Misconceptions on the nesting and reproductive behaviors of turtles led to the belief that the numbers of turtles in the municipality are countless and that captures for food consumption are negligible.
While respondents in general have an indifferent attitude to developments affecting dugongs and whales in their localities, the opposite holds true for turtles and dolphins. They believe that these animals need protection for turtles and dolphins will save them when in distress at sea. Ironically, a significant number of respondents involved in direct captures for food consumption also stated that the animals need protection for the same reason.
Implementation of laws on marine mammals and sea turtles in the municipality are lacking. The presence of commercial fishing vessels operating in some areas, incidents of compressor fishing and blast fishing encountered by the survey team in broad daylight are indications that marine patrols are either absent or lax in the municipality. 21.0 CONCLUSIONS AND RECOMMENDATIONS
Previous aerial survey results and current interview surveys revealed that dugong numbers are in a decline in the municipality. This is most likely attributed to illegal fishing methods involving direct and indirect takes, absence of specialized dietary requirements of dugongs, and high incidents of boat movement and traffic in the area that causes acoustic disturbances to the animal.
Although stranding reports and very high incidence of turtle sightings may indicate a viable population in the area, unaccounted direct captures of the animals, as well as deaths resulting from interactions with fishing gear can result in serious decline in animal numbers. The high incidents of Leatherback sightings in most areas affirm that the Calamianes region is a migration route of such turtle species. Since this particular species is listed in the IUCN red list of marine animals on the brink of extinction, efforts should be made in the conservation of the animal such as the control of fisheries that capture it directly and indirectly.
Cetaceans, particularly dolphins are a common occurrence in the municipality. Species identification though, needs to be verified through boat surveys. Local perceptions revealed increasing numbers of dolphins due to pod size yet unknown numbers of direct takes and by-catch from such pod sizes are largely undocumented. By-catch has been identified as the greatest threat to populations of small cetaceans in Southeast Asia (Perrin et al., 1996), and by-catch fisheries of cetaceans has been identified in Bulalacao island (Santos and Barut 2000). To understand the full impact of fisheries interactions with marine mammals as well as sea turtles, efforts to estimate the mortality caused by fisheries should be undertaken.

____________________________________________________________________________________CHAPTER IV: MARINE MAMMALS AND SEA TURTLES 72
Direct threats involving destructive and commercial fishing creates an atmosphere of
desperation that places marine mammals & sea turtles and its’ habitat at risk. Unless human values change dramatically, it will be impossible to reduce anthropogenic impacts particularly on dugongs and sea turtles.
It is strongly recommended that a marine wildlife conservation program be established as a start to address the issues confronting marine mammals and sea turtles. This program should include an environmental awareness component to include a multi-species environmental education program for local schools and villagers in the coastal barangays emphasizing the importance of marine and species conservation stressing its socio-economic benefits and the sustainable use of their resources. Likewise, a monitoring & evaluation component is essential, with the fisherfolks playing active roles in the process.
As with interview surveys, results are anecdotal in nature and an in-depth survey is recommended to address species diversity, estimates of abundance, and relative distribution. Turtle nesting sites need to be verified in order to come up with conservation and management plans. Research should be done to address the seriousness of by-catch and its effect on the population of cetaceans, turtles, and dugongs.

____________________________________________________________________________________CHAPTER V: MANGROVE FORESTS 73
CHAPTER V MANGROVE FOREST
22.0 INTRODUCTION
The estimated mangrove area of Palawan is 26,086 hectares which represents about 35% of the total conservation or mangrove reservation of the country. As per Presidential Proclamation (P.P.) 2152, said whole mangrove area has been declared as mangrove swamp forest reserve. In mangrove forest reserves, small-scale sustainable utilization of forest resources is allowed but commercial and large-scale utilization and conversion to other land uses such as fishponds are strictly prohibited.
Recent surveys and studies however, showed that mangrove forest inside the reservation are continuously subjected to cutting and worst, cleared and developed into fishponds. The depletion of stock of old growth mangrove forests is primarily due to commercial large scale cutting for timber, fuelwood, charcoal and direct conversion into fishponds. Likewise, the stock depletion in second growth is largely due to continuous cutting for sustenance/subsistence use as poles and piles and fuelwood and some local industrial requirements such as bakery, construction materials, and fish trap poles and low-cost housing materials (Bennagen and Cabahug, 1991). The previously densed mangrove forests are now sparsely vegetated second growth and became reproductive-brush.
The mangrove forest in Coron had been subjected into commercial cutting during the 1970s to the early 1980s. The issuance of concession for mangrove cutting during this period primarily caused the clear cutting of mangrove forest. Most of the workers of the concessionaire settled in the area after the expiration of the concession. They continued with the cutting of mangrove for charcoal and for household uses. The influx of people to Coron due to in-migration and high population growth rate geometrically increased the demand for mangrove products for low cost housing construction materials, firewood, fish trap poles, fences, etc. which contributed to the rapid degradation of mangrove forest.
23.0 OBJECTIVES
The study aims to:
1. Determine the forest structure, condition and ecological diversity of mangroves in Coron; 2. Determine the patterns of uses and existing land uses of mangroves; and
3. Determine the appropriate management zoning of mangroves.

____________________________________________________________________________________CHAPTER V: MANGROVE FORESTS 74
24.0 EXPECTED OUTPUTS
• Characterization of the status of mangrove habitats in terms of forest conditions, structures, and ecological diversity; and
• Classification and zoning of mangroves for strict protection or preservation,
conservation or community-based sustainable small-scale utilization, and for restoration or rehabilitation.
25.0 METHODS
Date and Place of Survey and Location of Transects
Location of transects is presented in Figure 29.
Guadalupe
Decalachao
San Jose
YKR San Nicolas
Decabobo Buenavista
Turda
Borac
Pob V l
Pob V Bintuan
Lajata
Coron
Tagumpay
Marcilla
Figure 29. Municipality of Coron, Palawan

____________________________________________________________________________________CHAPTER V: MANGROVE FORESTS 75
Resource and Ecological Assessment (REA) of mangrove in Coron, Palawan was conducted from May 10 to May 14, 2003. Table 14 shows the location of transects surveyed. Table 14. Location and Position of Belt Transects Surveyed, Coron, Palawan, 2003.
Survey Sites GPS Readings Length of the transects (m)
Size of the transects (m)
1. Coron So. Yurucan, Brgy. Bintuan N 11 159.922 and E 120 05.57
Transect 1 250 250 x10 Plot 1 50 50 x10 Plot 2 50 50 x10
So. Malbato, Brgy. Bintuan N 12 01.687 and E 120 07.01 Transect 2 450 450 x10
Plot 1 50 50 x10 Plot 2 50 50 x10 Plot 3 50 50 x10 Plot 4 50 50 x10 Plot 5 50 50 x10 Plot 6 50 50 x10 Plot 7 50 50 x10 Plot 8 50 50 x10 Plot 9 50 50 x10
So. Malbato, Brgy. Bintuan N 12*01.455 and E 120*07.496 *Transect 3 275 275 x10
Plot 1 50 50 x10 Plot 2 50 50 x10 Plot 3 50 50 x10 Plot 4 50 50 x10 Plot 5 50 50 x10 Plot 6 25 25 x10
Ruyucan River, Brgy. Bintuan
N 11*59 59.170 and E 120*05 20.615
Transect 4 500 500 x10 Plot 1 50 50 x10 Plot 2 50 50 x10 Plot 3 50 50 x10 Plot 4 50 50 x10 Plot 5 50 50 x10 Plot 6 50 50 x10 Plot 7 50 50 x10 Plot 8 50 50 x10 Plot 9 50 50 x10 Plot 10 50 50 x10
Apocan River, Brgy. Bintuan N 11*59.919"and E 120*05.406"
Transect 5 100 100 x10

____________________________________________________________________________________CHAPTER V: MANGROVE FORESTS 76
Table 14 continued . . . Plot 1 50 50 x10 Plot 2 50 50 x10
So. Inlalakay, Brgy. Decalachao N 12*09.053"and E 120*06.009" Transect 6 400 400 x10
Plot 1 50 50 x10 Plot 2 50 50 x10 Plot 3 50 50 x10 Plot 4 50 50 x10 Plot 5 50 50 x10 Plot 6 50 50 x10 Plot 7 50 50 x10 Plot 8 50 50 x10
So. Depanlupot, Brgy. Decalachao N 12*09.057"and E 120*05.998' Transect 7 117 117 x10
Plot 1 50 50 x10 Plot 2 50 50 x10 Plot 3 17 17 x10
So. Depanlupot, Brgy. Decalachao N12*09.356"and E 120*05.831" *Transect 8 100 100x10
Plot 1 50 50 x 10 Plot 2 50 50 x 10
So. Decalingab, Brgy. Decalachao
N 12*08.489"and E 120*06.140’'
Transect 9 227 227 x10 Plot 1 50 50 x10 Plot 2 50 50 x10 Plot 3 50 50 x10 Plot 4 50 50 x10 Plot 5 27 27x10
So. Decalingab, Brgy. Decalachao
N 12*08.489"and E 120*06.149’'
Transect 10 100 100 x10 Plot 1 50 50 x10 Plot 2 50 51 x10
So. Depanlupot, Brgy. Decalachao N12*09.056"and E 120*05.337" Transect 11 575 575x10
Plot 1 50 50 x 10 Plot 2 50 50 x 10 Plot 3 50 50 x 10 Plot 4 50 50 x 10 Plot 5 50 50 x 10 Plot 6 50 50 x 10 Plot 7 50 50 x 10 Plot 8 50 50 x 10

____________________________________________________________________________________CHAPTER V: MANGROVE FORESTS 77
Table 14 continued . . . Plot 9 50 50 x 10 Plot 10 50 50 x 10 Plot 11 50 50 x 10 Plot 12 25 25 x 10
So. Delantuan, Brgy. Decalachao N 12*18.10"and E 120*15.103’' Transect 12 500 500 x 10
Plot 1 50 50 x 10 Plot 2 50 50 x 10 Plot 3 50 50 x 10 Plot 4 50 50 x 10 Plot 5 50 50 x 10 Plot 6 50 50 x 10 Plot 7 50 50 x 10 Plot 8 50 50 x 10 Plot 9 50 50 x 10 Plot 10 50 50 x 10
So. Depanlupot, Brgy. Decalachao " Transect 13 300 300 x 350
Plot 1 50 50 x 10 Plot 2 50 50 x 10 Plot 3 50 50 x 10 Plot 4 50 50 x 10 Plot 5 50 50 x 10 Plot 6 50 50 x 10
So. Tarata, Brgy. San Jose N 12*11.501"and E 120*05.09” Transect 14 162 162 x10
Plot 1 50 50 x 10 Plot 2 50 50 x 10 Plot 3 50 50 x 10 Plot 4 12 12 x 10
So. Bakud, Brgy. San Jose Transect 15 38 38 x 10
Plot 1 38 50 x 10
So. Talisay, Brgy. San Jose N 12*11.618"and E
120*05.598”
Transect 16 135 135 x 10 Plot 1 50 50 x 10 Plot 2 50 50 x 10 Plot 3 35 50 x 10
So. Canibong, Brgy. San Jose
Transect 17 385 385 x 10 Plot 1 50 50 x 10 Plot 2 50 50 x 10 Plot 3 50 50 x 10 Plot 4 50 50 x 10

____________________________________________________________________________________CHAPTER V: MANGROVE FORESTS 78
Table 14 continued . . . Plot 5 50 50 x 10 Plot 6 50 50 x 10 Plot 7 50 50 x 10 Plot 8 35 35 x 10
So. Palpal, Brgy. San Jose N 12*10.000"and E
120*03.586”
Transect 18 325 325 x 10 Plot 1 50 50 x 10 Plot 2 50 50 x 10 Plot 3 50 50 x 10 Plot 4 50 50 x 10 Plot 5 50 50 x 10 Plot 6 50 50 x 10 Plot 7 25 25 x 10
So. Makipiluen, Brgy. San Jose N 12*12.475"and E 120 03.245”
Transect 19 100 100 x 10 Plot 1 50 50 x 10 Plot 2 50 50 x 10
So. Makipiluen, Brgy. San Jose N 12*12.330"and E 120 03.143”
Transect 20 100 100 x 10 Plot 1 50 50 x 10 Plot 2 50 50 x 10
Sampling Procedure
Transects were laid out in the base map taking into consideration the different land uses, forest conditions and extent of mangrove areas. Mangrove areas in Coron, Palawan were delineated and classified into three (3) forest covers such as dense, sparse, and open/clear area using SPOT 5 imageries. Reconnaissance was conducted to validate the mangrove forest conditions and the result was considered in the final selection of the sampling sites. The belt transect of 10 meter width traversed the different mangrove forest conditions perpendicular to the shorelines and riverbanks.
Field Methods
The study areas were demarcated into transects running perpendicular to the seashore up to the inland using GPS to ascertain the direction and avoid overlapping or intersection of transects toward the landward area. Each transect was divided into 10m x 50m size plot. In each transect, trees inside the plot larger than 5cm in diameter were recorded per plot for (Plate 6) total height and/or merchantable height; and diameter at breast height (DBH/diameter above bud-root (DAB).

____________________________________________________________________________________CHAPTER V: MANGROVE FORESTS 79
A 2m x 50m subplot was laid out for the measurement of regeneration. Saplings, (with diameter smaller than 5cm and height more than 2m) were identified and the number of individuals by species was determined. Counts of seedlings (height lower than 2m) by species were recorded as number of individuals (Plate 7).
Plate 6. Picture showing the lay-outing of transects, Coron, Palawan, 2003
Plate 7. Picture showing the mangrove regeneration, Coron, Palawan, 2003

____________________________________________________________________________________CHAPTER V: MANGROVE FORESTS 80
Within each plot in the different transects, mangrove species were identified and classified into:
1. Timber size trees (> 15cm DBH/DAB) 2. Pole size trees (> 5cm up to 15cm in DBH/DAB) 3. Regeneration
Saplings (5cm DBH/DAB and 2m in height)
Seedlings (height below 2m)
For timber size trees, the following parameters were assessed:
1. Merchantable height (to the nearest 0.5m)- the height from stump (0.3m above the budroot in Rhizophora spp. or ½m above the ground in non-Rhizophora spp up to the first major branch or 10 cm top diameter limit).
2. Total Height (to the nearest 0.5m) 3. DAB/DBH (to the nearest 0.5cm)
For pole-size trees, only the total height and DBH/DAB were measured. Due to some difficulties in site conditions, which hindered the work, the height was measured directly using calibrated poles as guide for small to medium size trees. For large size trees (more than 10m high), height was estimated.
Initially, the diameter was measured accurately using a diameter tape, and as the work progressed, the diameter was already estimated directly. In all species, except for Rhizophora, diameter was recorded at 1.3m height from the ground level known as DBH. In Rhizophora spp., because of the presence of stilt roots, the diameter was recorded at height of 0.3m from the topmost stilt roots known as DAB.
In the case of regeneration saplings and seedlings, the density (number present in each plot) in the different transects were recorded by species.
In addition to the above quantitative data, observations were made on the following:
1. Presence of ferns and other non-woody species; 2. Presence of crab mounds; and 3. Presence of avifauna and wildlife
Data Processing and Analysis
Individual tree volume of timber size trees were computed using the volume equations or using the volume tables for each species derived by Cabahug (1986a; 1986b) for timber-producing mangrove species. Based on the computed volume, a stand and stock table was constructed using the suggested format. Other tree parameter variables such as stand volume (SV), stand stock per hectare (N), diameter of the mean basal area of the tree (Dg), stand

____________________________________________________________________________________CHAPTER V: MANGROVE FORESTS 81
dominant height (Ho), mean diameter of dominant height (Dho), stand mean (H) and stand basal area (G) were computed using the formula/equations formulated by FAO, as follows:
Stand volume (SV) SV (m3/ha) = ΣV Plot area
Stand stock per hectare (N) N (tree/ha) = Total no. of live trees on the plot Plot area Mean Diameter (Dg) Dg (cm) = Σd /No. of trees on the plot
where:
d = diameter of each tree
Stand dominant height (Ho) Ho (m) = ΣDh/No. of dominant trees on the plot where: Dh = height of dominant trees Mean diameter of dominant Dho (cm) = ΣDd/No. of dominant trees on the plot height
(Dho) where: Dd = diameter of dominant trees Stand mean height (H) H(m) = ΣTh/No. of trees on the plot
where: Th = tree height Stand basal area (G) G (m2/ha)) = ΣBa/Plot area
where: Ba = 0.007854 (Dbh) 2
The dominant species for each site were determined based on the importance value (IV). The IV is the sum of the relative density, relative frequency, and relative coverage. These are computed using the following formula:
Density = Total number of individuals counted for a given species Total area sampled
Relative density Total number of individuals of a given species x 100 = Total number of individuals of all species

____________________________________________________________________________________CHAPTER V: MANGROVE FORESTS 82
Coverage = Total area covered by a given species Total area sampled Relative coverage = Total coverage of a species x 100 Total coverage of all species Frequency = Number of plots where a given species occur Total number of plots in the site Relative frequency = Frequency of a given species x 100 Total frequency of all species Importance Value = Relative density + Relative coverage + Relative frequency
The diversity indices are computed using the following formula:
Species richness measures
Margalef’s index DMg = (S-1)/ln N Menhinick’s index DMn = S/√ N where S = number of species and N = total number of individuals of all species Shannon diversity index H’ = -Σpi ln pi where pi, the proportional abundance of the ith species = (ni/N) and Ln = natural logarithm function Evenness of the species can now be calculated using the formula: E = H’ /ln S Simpson’s index
(n1(n1- 1)) D = Σ ___________
(N(N-1)) where n1 = the number of individuals in the ith species, and N = the total number of individuals.
Berger-Parker diversity index
The Berger-Parker index is calculated from the equation: d = Nmax/N

____________________________________________________________________________________CHAPTER V: MANGROVE FORESTS 83
where N = total number of individuals and Nmax = number of individuals in the most abundant species. In order to ensure that the index increases with increasing diversity the reciprocal form of the measure is usually adopted.
Similarity measures
Sorenson measure using the qualitative data, the formula: CN = 2jN / (aN + bN)
Where aN = the number of individuals in site A, bN = the number of individuals in site B, and jN = the sum of the lower of the two abundances or species which occur in the two sites.
26.0 RESULTS AND DISCUSSIONS Municipal Level
Coron has an estimated aggregate extent of 634 has of mangrove areas. Out of the total extent of 636.957 has, 382.485 (60%) are close, 197.212 (31%) sparse, 44.915 has (7.0%) open density/canopy, and 12.345 has (2%) islets (Figure 29 and Table 14).
26.1 Biodiversity Assessment
Species Composition and Distribution
There are 18 true and 20 associate mangrove species identified and recorded during the survey belonging to 14 families and 27 genera of vascular plants (Table 15).
Table15. List of True and Associate Mangrove Species Identified and Recorded in Coron, Palawan, 2003.
Scientific Names Code Common Name Existing in Coron
TRUE MANGROVE Aegiceras floridum Af Saging-saging *
Bruguiera gymnorrhiza Bg Busain * Bruguiera sexangula Bs Pototan * Bruguiera cylindrical Bc Pototan lalaki * Bruguiera parviflora Bp Langarai *
Ceriops tagal Ct Tangal * Ceriops decandra Cd Malatangal *
Lumnitzera littorea Ll Tabau * Lumnitzera racemosa Lr Kulasi *
Nypa fruticans Nf Nipa * Rhizophora apiculata Ra Bakauan lalaki *
Rhizophora mucronata Rm Bakauan babae * Rhizophora stylosa Rs Bakauan bato *

____________________________________________________________________________________CHAPTER V: MANGROVE FORESTS 84
Table 15 continued . . . Sonneratia alba Sal Pagatpat *
Sonneratia caseolaris Sc Pedada * Excoecaria agallocha Ea Buta-buta * Xylocarpus granatum Xg Tabigi *
Xylocarpus moluccensis Xm Piagau * MANGROVE ASSOCIATE
Acanthus ebracteatus Aeb Tigbau * Acacia farnesiana Afa Aroma *
Acrostichum aureum Aau Lagolo * Barringtonia asiatica Ba Botong *
Barringtonia racemosa Br Putat * Caesalpinia crista Cc Sapinit *
Cynometra ramiflora Cr Balitbitan * Derris trifoliate Dt Mangasin *
Hibiscus tiliaceus Ht Malubago * Instia bijuga Ib Ipil *
Morinda citrifolia Mc Bangkoro * Osbornia octodonta Oo Tualis * Pandanus tectorius Pt Prickly pandan * Pongamia pinnata Pp Bani *
Scyphiphora hydrophyllacea Sh Nilad * Terminalia catappa Tc Talisai *
Thespesia populneoides Tp Malabanalo * Thespesia populnea Tpo Banalo * Cerbera manghas Cm Baraibai *
Dolichandrone spathacea Dsp Tui *
The most widely distributed species in Coron are Rhizophora apiculata (Plate 8), Rhizophora mucronata, Xylocarpus granatum, Bruguiera gymnorrhiza, Rhizophora stylosa, Bruguiera cylindrica, Lumnitzera littorea, Ceriops tagal, Ceriops decandra and Heritiera littorea which are recorded in 20, 17, 16, 13, 5, 3, 3, 4, 8 and 6 transects. In terms of abundance (total individuals in 20 transects), Rhizophora apiculata, Rhizophora mucronata, Xylocarpus granatum, Bruguiera gymnorrhiza and Rhizophora stylosa species have 3149, 652, 423, 353 and 153 individuals respectively (Table 16). Species diversity depends on species composition, and number of individual species in certain vegetation community.
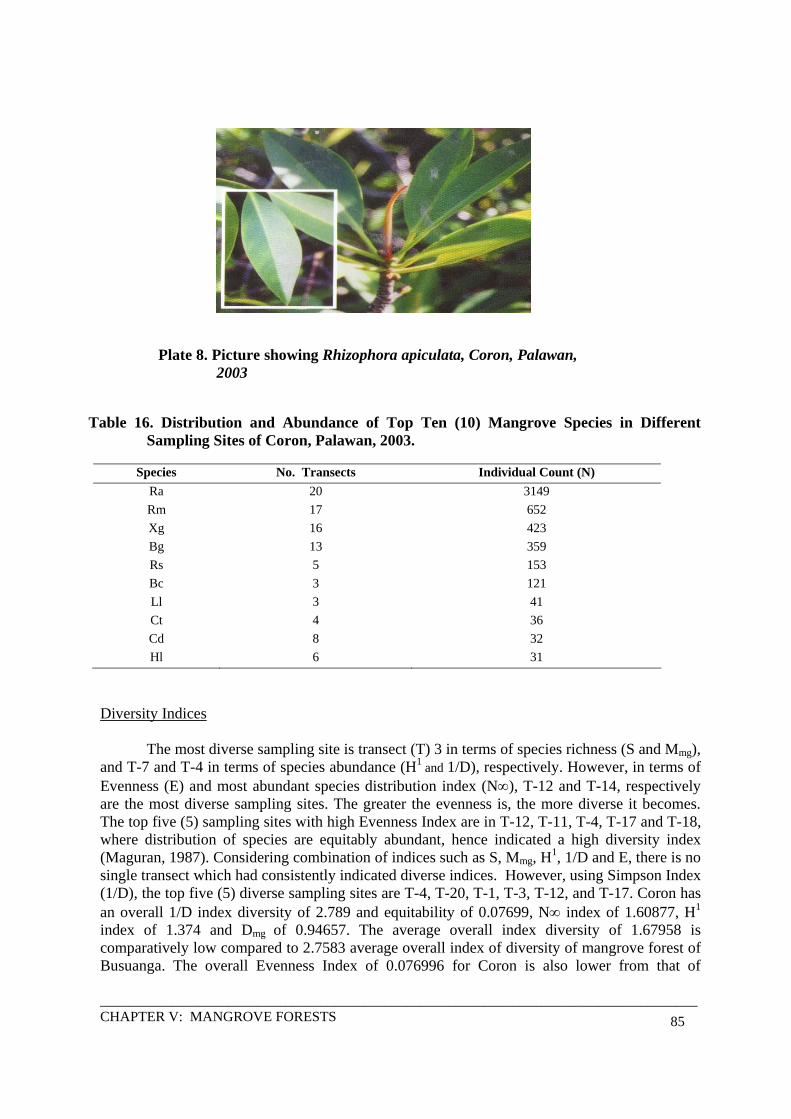
____________________________________________________________________________________CHAPTER V: MANGROVE FORESTS 85
Table 16. Distribution and Abundance of Top Ten (10) Mangrove Species in Different Sampling Sites of Coron, Palawan, 2003.
Species No. Transects Individual Count (N)
Ra 20 3149 Rm 17 652 Xg 16 423 Bg 13 359 Rs 5 153 Bc 3 121 Ll 3 41 Ct 4 36 Cd 8 32 Hl 6 31
Diversity Indices
The most diverse sampling site is transect (T) 3 in terms of species richness (S and Mmg), and T-7 and T-4 in terms of species abundance (H1 and 1/D), respectively. However, in terms of Evenness (E) and most abundant species distribution index (N∞), T-12 and T-14, respectively are the most diverse sampling sites. The greater the evenness is, the more diverse it becomes. The top five (5) sampling sites with high Evenness Index are in T-12, T-11, T-4, T-17 and T-18, where distribution of species are equitably abundant, hence indicated a high diversity index (Maguran, 1987). Considering combination of indices such as S, Mmg, H1, 1/D and E, there is no single transect which had consistently indicated diverse indices. However, using Simpson Index (1/D), the top five (5) diverse sampling sites are T-4, T-20, T-1, T-3, T-12, and T-17. Coron has an overall 1/D index diversity of 2.789 and equitability of 0.07699, N∞ index of 1.60877, H1
index of 1.374 and Dmg of 0.94657. The average overall index diversity of 1.67958 is comparatively low compared to 2.7583 average overall index of diversity of mangrove forest of Busuanga. The overall Evenness Index of 0.076996 for Coron is also lower from that of
Plate 8. Picture showing Rhizophora apiculata, Coron, Palawan,2003

____________________________________________________________________________________CHAPTER V: MANGROVE FORESTS 86
Busuanga’s Evenness Index of 0.3974, which indicates that mangrove of Busuanga has moderately high relative value of biodiversity compared to Coron’s index of diversity based on 1998 Fernando Biodiversity Scale (Table 17). Table 17. The diversity indices of 20 sampling sites in mangrove forest of Coron, Palawan calculated using different diversity formula, Coron, Palawan, 2003
Transect Species richness
(S)
Individuals (N)
Margalef (Dmg)
Shannon (H')
Shannon evenness
(E)
Simpson (1/D)
Berger-Parker (N∞ )
Over-all 1.374 0.07699 2.789 1.60877 T1 4 116 0.6311 0.65209 0.06238 0.66027 1.24731 T2 6 288 0.8829 1.30067 0.09098 0.34367 1.97260 T3 10 245 1.636 0.79493 0.06362 0.65202 1.25000 T4 7 538 0.9542 0.63268 0.12238 0.71913 1.18502 T5 8 103 1.5103 1.20604 0.03809 0.43823 1.56061 T6 9 411 1.3292 1.33027 0.09274 0.34318 1.92958 T7 8 104 1.5072 1.42549 0.03836 0.29649 2.47619 T8 5 177 0.7728 1.22774 0.07281 0.3664 1.82474 T9 5 187 0.7647 1.24688 0.07567 0.35426 1.85149
T10 6 104 1.0766 1.04836 0.04452 0.51083 1.42466 T11 7 779 0.9012 1.36302 0.14795 0.33636 1.92346 T12 5 684 0.6127 0.78906 0.16798 0.56221 1.40164 T13 6 269 0.8937 0.97658 0.08700 0.43464 2.13492 T14 5 159 0.7891 1.20281 0.06750 0.32275 2.52381 T15 3 24 0.6293 0.79237 0.02308 0.48188 1.60000 T16 5 114 0.8446 0.81258 0.05305 0.52476 1.50000 T17 5 325 0.6916 0.90115 0.10948 0.55041 1.37712 T18 5 267 0.7159 1.10714 0.09638 0.38537 1.85417 T19 6 106 1.0722 1.02483 0.04516 0.52022 1.41333 T20 4 66 0.716 0.62325 0.04079 0.70023 1.2000
Based on the average index of diversity (species richness, abundance dominance and
evenness), all sampling sites in Coron had very low relative values of biodiversity indices using the scale of Fernando Biodiversity (1998). Likewise, in terms of evenness of distribution of species abundances, all transects had low relative values of biodiversity scale (Table 18).
Table 18. The Relative Values of the Average Overall Diversity Index and Evenness of Mangroves Based on Fernando Biodiversity Scale (1998), Coron, Palawan, 2003
Transect Ave. Value of
H', Dmg, 1/D and N∞
Relative Values Shannon Evenness (E) Relative Values
1 0.797693 Very Low 0.06238 Low 2 1.12496 Very Low 0.09098 Low
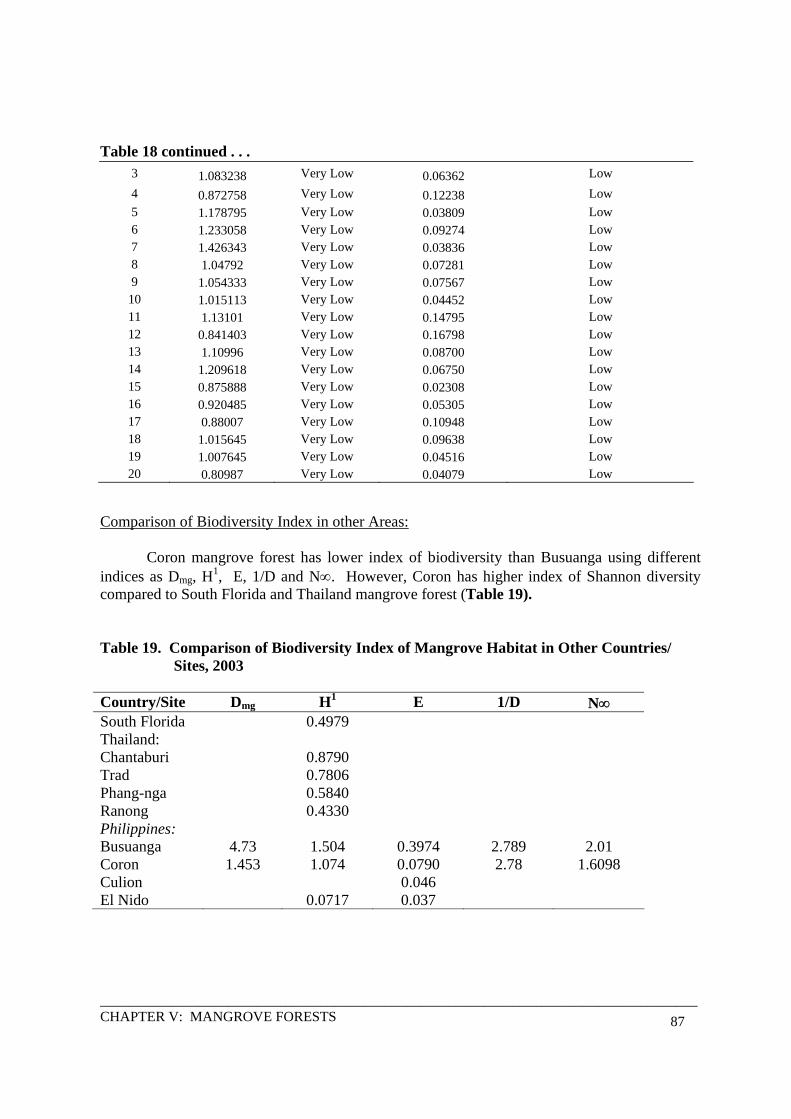
____________________________________________________________________________________CHAPTER V: MANGROVE FORESTS 87
Table 18 continued . . . 3 1.083238 Very Low 0.06362 Low 4 0.872758 Very Low 0.12238 Low 5 1.178795 Very Low 0.03809 Low 6 1.233058 Very Low 0.09274 Low 7 1.426343 Very Low 0.03836 Low 8 1.04792 Very Low 0.07281 Low 9 1.054333 Very Low 0.07567 Low 10 1.015113 Very Low 0.04452 Low 11 1.13101 Very Low 0.14795 Low 12 0.841403 Very Low 0.16798 Low 13 1.10996 Very Low 0.08700 Low 14 1.209618 Very Low 0.06750 Low 15 0.875888 Very Low 0.02308 Low 16 0.920485 Very Low 0.05305 Low 17 0.88007 Very Low 0.10948 Low 18 1.015645 Very Low 0.09638 Low 19 1.007645 Very Low 0.04516 Low 20 0.80987 Very Low 0.04079 Low
Comparison of Biodiversity Index in other Areas:
Coron mangrove forest has lower index of biodiversity than Busuanga using different indices as Dmg, H1, E, 1/D and N∞. However, Coron has higher index of Shannon diversity compared to South Florida and Thailand mangrove forest (Table 19). Table 19. Comparison of Biodiversity Index of Mangrove Habitat in Other Countries/ Sites, 2003 Country/Site Dmg H1 E 1/D N∞ South Florida 0.4979 Thailand: Chantaburi 0.8790 Trad 0.7806 Phang-nga 0.5840 Ranong 0.4330 Philippines: Busuanga 4.73 1.504 0.3974 2.789 2.01 Coron 1.453 1.074 0.0790 2.78 1.6098 Culion 0.046 El Nido 0.0717 0.037

____________________________________________________________________________________CHAPTER V: MANGROVE FORESTS 88
Habitat diversity is more useful than ecosystem diversity since habitats are easy to envisage and often have clear boundaries. There are three measures of habitat diversity namely, alpha or within habitat diversity; beta or between habitat diversity; and gamma or landscape diversity which can be defined as a mosaic of habitats.
As practiced, it is always the high diversity areas that are selected for conservation. But it is often in low diversity areas that productivity is highest and people usually exploit these areas for food and other uses. Thus, one cannot set priorities for diversity conservation based simply on habitats with high diversity. The best way to conserve species diversity is to conserve habitats. For instance, certain aquatic species use the coral reef during morning and migrate into the sea-grass beds or mangrove at night. There are at least 20 fish species documented that breeds, spawns and nurses in coral reef, sea-grass beds, estuaries and mangrove areas dependent to this coastal ecosystem in a cyclical pattern of their life cycles. Thus, it is the mosaic of habitats that must be protected if a complete protection of biodiversity is to be achieved. It is primarily the loss of habitat that leads to the loss of both genetic and species diversity.
26.2 Mangrove Vegetation Structural Analysis Relative Frequency (RF), Relative Density (RDen), Relative Dominance (RDom) and Importance Value (IV)
Rhizophora apiculata (Ra) is the most dominant and important mangrove species in Coron. It is also the most frequent and dense mangrove species recorded. It has consistently recorded the highest value of RF, RDen, RDom and IV of 28.46; 62.09; 53.592 and 144.145, respectively. Rhizophora mucronata (Rm) followed second in ranking to R. apiculata with RF, RDen, RDOm, and IV of 17.289, 12.9108, 10.073 and 40.273, respectively. The other top 15 important mangrove species in decreasing order are: Bruguiera gymnorhiza (Bg), Xylocarpus granatum (Xg), Rhizophora stylosa (Rs), Bruguiera cylindrica (Bc), Ceriops decandra (Cd), Lumnitzera littorea (Ll), Ceriops tagal (Ct), Bruguiera sexangula (Bs), Caesalpinea cristea (Cc), Bruguiera parviflora (Bp), Sonneratia caseolaris (Sc) and Xylocarpus mollucensis (Table 20).
Table 20. The RF, RDen, RDom, and IV of Top Fifteen (15) Mangrove Species in Coron,
Palawan, 2003 Species RF Rden Rdom IV Rank
Bc 3.99 2.3814 2.2055 8.5769 6th Bg 14.628 7.1246 15.605 37.3576 3rd Bp 1.0644 0.1771 0.396 1.6375 13th Bs 1.329 0.2362 0.3184 1.8836 11th Cc 1.0644 0.3346 0.2874 1.6864 12th Cd 4.2547 0.6298 0.3717 5.2562 7th Ct 2.1287 0.7085 0.5591 3.3963 10th Hl 2.3934 0.6101 0.457 3.4605 9th Ll 2.1287 0.8069 1.3965 4.3321 8th

____________________________________________________________________________________CHAPTER V: MANGROVE FORESTS 89
Table 20 continued . . . Ra 28.4592 62.0941 53.5917 144.145 1st Rm 17.289 12.9108 10.0734 40.2732 2nd Rs 3.1903 3.0112 4.6005 10.802 5th Sc 1.0644 0.2362 0.3142 1.6148 14th Xg 13.5637 8.3645 9.2017 31.1299 4th Xm 0.7969 0.1181 0.1033 1.0183 15th
Average Stocking
Following the DENR stocking classification, almost all transects had an open/cleared
stocking of 24 to 538 trees/ha. Only transects 11 and 12 had inadequate stocking of 684 and 779 trees/ha. On the overall, mangroves of Coron have an open stocking of 253 trees/ha. (Table 21).
Table 21. Average Stocking (N/ha) of Timber and Pole Size Trees/Transect in Coron, Palawan, 2003.
Transect Timber Pole Total DENR Stocking Class 1 13 103 116 Open/Cleared 2 64 224 288 Open/Cleared 3 76 169 245 Open/Cleared 4 39 499 538 Open/Cleared 5 7 96 103 Open/Cleared 6 105 306 411 Open/Cleared 7 47 57 104 Open/Cleared 8 48 129 177 Open/Cleared 9 58 129 187 Open/Cleared
10 43 61 104 Open/Cleared 11 114 665 779 Inadequate 12 33 651 684 Inadequate 13 22 247 269 Open/Cleared 14 48 111 159 Open/Cleared 15 3 21 24 Open/Cleared 16 15 99 114 Open/Cleared 17 109 216 325 Open/Cleared 18 103 164 267 Open/Cleared 19 35 71 106 Open/Cleared 20 16 50 66 Open/Cleared
Average 49.9 203.4 253.3 Open/Cleared

____________________________________________________________________________________CHAPTER V: MANGROVE FORESTS 90
Stand Volume Generally, mangrove forest of Coron has an average stand volume of 15.1129 m3/ha which is classified by DENR and FAO as low volume forest stand. All mangrove stands sampled in Coron had low stand volume (Table 22). Table 22. Stand Volume (m3/ha) of Timber and Pole by Transect in Coron, Palawan, 2003
Stand Volume (SV) Transect Timber Pole Total SV Classes
1 2.383 2 4.383 Low volume 2 8.228 6.21 14.438 Low volume 3 11.412 5.957 17.369 Low volume 4 4.993 9.36 14.353 Low volume 5 1.835 1.642 3.477 Low volume 6 23.33 8.86 32.19 Low volume 7 13.817 1.485 15.302 Low volume 8 11.252 4.252 15.504 Low volume 9 18.238 3.989 22.227 Low volume
10 7.934 2.3 10.234 Low volume 11 18.51 18.522 37.032 Low volume 12 7.748 11.248 18.996 Low volume 13 4.019 5.263 9.282 Low volume 14 8.92 1.879 10.799 Low volume 15 0.311 0.496 0.807 Low volume 16 5.326 3.53 8.856 Low volume 17 21.728 6.249 27.977 Low volume 18 22.595 4.842 27.437 Low volume 19 6.067 2.47 8.537 Low volume 20 1.696 1.361 3.057 Low volume
Ave. 10.0171 5.09575 15.11285 Low volume 26.3 Mangrove Pattern of Uses and Existing Land Use/Forest Condition Existing Mangrove Condition Area and Extent
Bintuan consists of the largest extent of mangrove areas in Coron having 151.579 ha --- classified as 73.616 ha close, 53.275 ha sparse, and 17.195 ha open canopy and an islet of 7.493 ha (Figure 30 and Table 23). This was followed by Decalachao and YKR with a total mangrove area of 83.23 ha and 65.898 ha, respectively. Decalachao has 44.10 ha close and 39.13 ha sparse with no identified open canopy, while YKR has 33.824 ha close, 26.497 ha sparse, 3.388 ha open canopy and an islet of 2.189 ha (Figure 31).

____________________________________________________________________________________CHAPTER V: MANGROVE FORESTS 91
F
Figure 31. Satellite map of Decalachao and YKR, Coron
Figure 30. Bintuan Satellite Map, Guadalupe and Lajala, Coron showingthe area and extent of mangrove

____________________________________________________________________________________CHAPTER V: MANGROVE FORESTS 92
Table 23. Area/Extent of Mangroves and Mudflats by Barangay in Coron, Palawan Based on SPOT Imageries, 2003
Barangay/Island Total (ha) Close (ha)
Sparse (ha) Open (ha) Islet (ha)
1. Baquit Island 2. 852 1. 567 1. 285 0 0 2. Bintuan 151.579 73. 616 53. 275 17. 195 7.493 3. Borac 14. 282 9. 820 1. 999 2. 463 0 4. Buenavista 17. 172 14. 553 1. 827 0 0. 792 5. Cabilauan Island 11. 954 6. 205 5. 216 0.533 0 6. Cabugao 9. 537 0 8. 253 0. 735 0. 549 7. Chinodonan Island 11. 955 11. 673 0. 282 0 0 8. Decabobo 8. 006 7. 908 0 0 0. 098 9. Decalachao 83. 230 44. 100 39. 130 0 0 10.Depagal Island 5. 208 2. 600 0 2. 608 0 11.Guadalupe 45. 396 34. 508 7. 570 2. 822 0. 496 12.Lajala 33. 281 27. 877 4. 893 0. 511 0 13.Marcilla 42. 285 29. 284 10. 393 2. 608 0 14.Mayanpayan Island 1. 448 1. 448 0 0 0 15.Napuscud Island 0. 353 0. 353 0 0 0 16.Poblacion 5 15. 319 8. 599 3. 254 3. 466 0 17.Poblacion 6 22. 984 13. 878 5. 881 3. 225 0 18.San Jose 19. 209 7. 524 11. 075 0. 610 0 19.San Nicolas 15. 126 9. 962 3. 529 1. 635 0 20.Tagumpay 17. 644 12. 970 3. 846 0. 828 0 21.Tara Island 3. 09 2. 620 0 0 0. 470 22.Turda 39. 149 27. 596 9. 007 2. 288 0. 258 23.YKR 65. 898 33. 824 26. 497 3. 388 2. 189 TOTAL 636.957 382.485 197.212 42. 307 12. 345
Guadalupe (Figure 30) and Marcilla (Figure 32) had a total mangrove forest area of
45.396 has and 42.285 has, respectively. Guadalupe covered 34.508 ha close, 7.570 ha sparse, 2.822 ha open canopy, and 496 ha islet. On the other hand, Marcilla had 29.284 ha close, 10.393 sparse and 2.6 ha open.

____________________________________________________________________________________CHAPTER V: MANGROVE FORESTS 93
Over all Stocking
Mangrove forest in barangay Bintuan had the highest stocking of 285,886 trees which was primarily contributed by its extent and forest condition, followed by barangay Decalachao and YKR. The total stocking of Coron’s mangrove forest is 1,297,869 trees wherein 74% is shared by the close density/canopy with an adequate stocking of 2,500 trees/ha (Table 24). Table 24. Stocking of Mangrove Vegetation Based on REA and SPOT Imageries by Forest Condition Classification and by Barangay Coron, Palawan , 2003
Barangay/Island Total (trees/ha)
Close (trees/ha)
Sparse (trees/ha)
Open (trees/ha)
Islet (trees/ha)
1. Baquit Island 5,894 3,968 1,926 0 0 2. Bintuan 285,886 184,040 79,859 10,747 11,240 3. Borac 29,086 24,550 2,997 1,539 0 4. Buenavista 39,617 36,383 2,739 0 495 5. Cabilauan Island 23,665 15,513 7,819 333 0
Figure 32. Satellite map of Marcilla and Borac showing extent ofmangrove forest

____________________________________________________________________________________CHAPTER V: MANGROVE FORESTS 94
Table 24 continued . . . 6. Cabugao 13,653 0 12,371 459 823 7. Chinodonan Island 29,606 29,183 423 0 0 8. Decabobo 19,917 19,770 0 0 147 9. Decalachao 168,906 110,250 58,656 0 0 10. Depagal Island 8,130 6,500 0 1,630 0 11. Guadalupe 100,125 86,270 11,347 1,764 744 12. Lajala 77,347 69,693 7,335 319 0 13. Marcilla 90,419 73,210 15,579 1630 0 14. Mayanpayan Island 3,620 3,620 0 0 0 15. Napuscud Island 883 883 0 0 0 16. Poblacion 5 28,540 21,496 4,878 2,166 0 17. Poblacion 6 45,527 34,695 8,816 2,016 0 18. San Jose 35,792 18,810 16,601 381 0 19. San Nicolas 31,217 24,905 5,290 1,022 0 20. Tagumpay 38,708 32,425 5,765 518 0 21. Tara Island 7,255 6,550 0 0 705 22. Turda 84,398 68,990 13,591 1,430 387 23. YKR 129,678 84,560 39,719 2,118 3,281 TOTAL 1,297,869 956,264 295,711 28,072 17,822
Mangrove Forest Volume
The total wood volume of Coron’s mangrove forest is 246,158.64 m3 which is largely contributed (78%) by close density/canopy forest. The close canopy mangrove has an aggregate stocking of 956,264 trees containing an aggregate wood volume of 191,252.5 m3. The sparse canopy mangrove has an aggregate wood volume of 49,303 m3 while the open canopy has 2,699.02 m3 (Table 25).
Table 25. Total Volume of Mangrove Forest Based on the Result of REA and
Interpretation of SPOT Imageries. Coron, Palawan, 2003
Barangay /Island Total (m3/ha)
Close (m3/ha)
Sparse (m3/ha)
Open ) (m3/ha)
Islet (m3/ha)
1. Baquit Island 1,114. 75 793.5 321.25 0 0 2. Bintuan 53,031.70 36,808 13,318.75 1,031.70 1,873.25 3. Borac 5,557.53 4,910 499.75 147.78 0 4. Buenavista 7,749.10 7,276.50 456.75 0 15.84 5. Cabilauan Island 4,438.48 3,102.50 1,304.00 31.98 0 6. Cabugao 2,244.60 0 2,063.25 44.1 137.25 7. Chinodonan Island 5,907.00 5,836.50 70.5 0 0 8. Decabobo 3,978.50 3,954 0 0 24.5

____________________________________________________________________________________CHAPTER V: MANGROVE FORESTS 95
Table 25 continued . . . 9. Decalachao 31,832.50 22,050 9,782.50 0 0 10.Depagal Island 1,456.48 1,300 0 156.48 0 11.Guadalupe 19,439.82 17,254 1,892.50 169.32 124 12.Lajala 15,192.41 13,938.50 1,223.25 30.66 0 13. Marcilla 17,396.73 14,642 2,598.25 156.48 0 14. Mayanpayan Island 724 724 0 0 0 15. Napuscud Island 176.5 176.5 0 0 0 16. Poblacion 5 5,320.96 4,299.50 813.5 207.96 0 17. Poblacion 6 8,602.75 6,939 1,470.25 193.5 0 18. San Jose 6,567.35 3,762 2,768.75 36.6 0 19. San Nicolas 5,961.35 4,981 882.25 98.1 0 20. Tagumpay 7,500.32 6,485 961.5 53.82 0 21. Tara Island 1,427.50 1,310 0 0 117.5 22. Turda 16,251.53 13,798 2,251.75 137.28 64.5 23. YKR 24,286.78 16,912 6,624.25 203.28 547.25 TOTAL 246,158.64 191,252.50 49,303 2,699.02 2,904.09
Species-Stocking Distribution In terms of species-stocking distribution by dbh class, the top 10 species are Ra, Rm, Xg, Bg, Rs, Bc, Ll, Ct, Cd, and Hl which are abundantly distributed in 10cm dbh classes of 44%, 47%, 42%, 40%, 31%, 46%, 29%, 36%, 66%, and 29%, respectively. More than 70% of the stocking of Cd (88%), Rm (77%), Ct (75%), Ra (74%), Xg and Hl (71%) are in pole size which is within the dbh classes of 5cm and 10cm. Cd and Ct are small size trees which usually reach an average dbh of 10cm when matured. Rs, Xg, Bc, and Bg are medium size trees which normally attain an average dbh of 30cm upon maturity, while Ra, Rm, Hl, and Ll are large size trees which may attain an average dbh of 50cm at maturity. More than 50% of the vegetation extent of Ra, Rm, Rs, Xg, Bg, Bc, Ll, Ct, Cd and Hl are considered in reproduction stage or pole size which are mostly in dbh class of 5cm and 10cm. Rs and Ll mangrove stands are mostly in timber size within the dbh class from 15cm to 30cm (Table 26). Table 26. Species Stocking (N/ha) According to Dbh Class with Percentage Distribution of Top Ten Mangrove Species in Coron, Palawan, 2003.
Spp 5 % 10 % 15 % 20 % 25-65 % Total Ra 1874 30 2744 44 936 15 438 7 290 5 6,282 Rm 390 30 598 47 142 11 104 8 46 4 1,280 Xg 248 29 358 42 94 11 88 10 58 7 846 Bg 96 13 290 40 132 18 48 7 152 21 718 Rs 56 18 94 31 68 22 50 16 38 12 306 Bc 46 19 112 46 62 26 16 7 6 2 242 Ll 16 20 24 29 20 24 6 7 16 20 82 Ct 28 39 26 36 14 19 2 3 2 3 72 Cd 14 22 42 66 8 13 0 0 0 0 64 Hl 26 42 18 29 10 16 6 10 2 3 62

____________________________________________________________________________________CHAPTER V: MANGROVE FORESTS 96
Stand Volume by Diameter Class and Species
In terms of volume distribution to dbh class by species, the timber size trees (15cm dbh and above) shared an average of 85% of the stand volume. The pole size stand contributed only an average of 15% of the total stand volume. Ra stand volume shared 59% of the total mangrove forest volume, followed by Rm mangrove stand with 25%. Forty three percent (43%) of the timber size mangrove stand was contributed by diameter class of 25cm to 65cm of most species sampled in Coron, Palawan (Table 27). Table 27. Species Volume (m3/ha.) Distribution by Dbh Class with Percentage of Top Ten
(10) Mangrove Species in Coron, Palawan, 2003.
Species 5 % 10 % 15 % 20 % 25-65 % Total % Ra 8.28 0.97 53.13 6.23 71.58 8.40 64.66 7.58 260.4 30.55 458.05 58.82 Rm 3.8 0.45 41.83 4.91 58.01 6.80 52.33 6.14 35.48 4.16 191.45 24.58 Xg 0.34 0.04 2.11 0.25 3.14 0.37 2.8 0.33 10.24 1.20 18.63 2.39 Cd 0.44 0.05 2.21 0.26 1.03 0.12 0.77 0.09 3.79 0.44 8.24 1.06 Rs 0.28 0.03 1.64 0.19 1.77 0.21 2.54 0.30 1.61 0.19 7.84 1.01 Ct 0.31 0.04 1.58 0.19 1.37 0.16 2.76 0.32 2.02 0.24 8.04 1.03 Hl 0.2 0.02 1.33 0.16 1.87 0.22 1.83 0.21 6.68 0.78 11.91 1.53 Bc 0.13 0.02 0.86 0.10 2.92 0.34 2.59 0.30 1.69 0.20 8.19 1.05 Ll 0.09 0.01 0.52 0.06 1.02 0.12 1.89 0.22 18.39 2.16 21.91 2.81 Bg 0.06 0.01 0.68 0.08 1.06 0.12 1.4 0.16 22.67 2.66 25.87 3.32
26.4 Pattern of Uses and Ecological State of Mangrove
Mangrove Resource and Uses
Most mangrove areas in Coron has been continuously subjected to cutting for charcoal, poles and piles which resulted to the low stature, open canopy and state of regeneration of mangroves (Plate 9). Mangroves in Bintuan, Decalachao and San Jose are in a state of initial regeneration with loosely distributed remnants of timber size trees. There are still intact pure stands of Bruguiera and Xylocarpus spp along the river of Decalachao, but most of the mangrove stands along the landward zones are girdled and cleared cut. Mangrove stand in Makinit although being subjected to the discharge of hot water from an adjacent hot spring is still able to withstand the sulfuric hot water discharge.

____________________________________________________________________________________CHAPTER V: MANGROVE FORESTS 97
Although all mangrove forests in Coron are proclaimed as mangrove swamp forest reserve per P.P. 2152, cutting had continuously been done both for household uses and for local commercial uses. There is an approximately 2 has. of fishpond in barangay Guadalupe and in barangay Bintuan, particularly in Ruyukan where cutting and/or clearing is on-going, for fishpond development. Charcoal production has also been observed in barangays Bintuan and Decalachao.
Mangrove Ecological State and Index of Degradation
Table 28 shows the values of different ecological indicators and index of degradation. In terms of stocking, transect 11 had the highest (779 trees/ha), median value of 411 in transect 6, and lowest stocking of 24 in transect 15. Transects 11, 9 and 15 had the highest, median and lowest basal areas of 17.50, 8.675 and 0.4523 m2 /ha, respectively. In terms of stand volume, transects 11, 12 and 15 had the highest, median and lowest values with stand volume of 37.032, 18.996 and 0.807 m3/ha, respectively. The highest, median and lowest mean diameter at breast height was recorded in transects 16, 6 and 2, respectively. Transects 8, 10, and 4 had the highest, median and lowest mean heights. The mean regeneration count in transects 9, 13 and 20 were the highest, median and lowest values respectively. Importance Value (IV) was highest, median, and lowest in transects 1, 15 and 20; 10; and 6, respectively. In terms of average diversity indices (Dmg, H1, 1/D, and N∞), transect 7 had the highest average while transect 20 had the lowest average value of composite diversity indices. Transects 12 and 15 had the highest and lowest average indices of Evenness. The highest absolute values of different indicators mean that the mangrove is still in good ecological condition and the lowest aggregate values indicate
Plate 9. Picture showing mangrove area subjected for charcoal making, Coron, Palawan, 2003

____________________________________________________________________________________CHAPTER V: MANGROVE FORESTS 98
the worst ecological state of mangrove. In terms of growth parameters (stocking, basal area and volume) transect 11 had a comparatively good ecological condition, with transect 15 having the most degraded mangrove area (Table 28) in Coron, Palawan.
Table 28. Mangrove Index of Degradation and Ecological Condition Indices Based on Forest Structure and Ecological Diversity, Coron, Palawan, 2003
ECOLOGICAL CRITERIA Pole and Timber Barangay
Tran No.
Stock- ing
Basal Area Vol Mean
DBH Mean
Height Mean Reg IV Dmg H' E 1/D N∞ Endemism
So. Yurucan, Brgy. Bintuan 1 116 1.9679 4.383 13.8947 8.72666
134
75.00 0.6311 0.6521 0.0624 0.6603 1.24731 1
So. Malbato, Brgy. Bintuan 2 288 6.59076 14.438 13.56362 8.344195
766
37.5 0.8829 1.3007 0.0910 0.3437 1.97260 1
So. Malbato, Brgy. Bintuan 3 245 7.36254 17.369 14.55814 9.118455
252
29.99 1.636 0.7949 0.0636 0.6520 1.25000 1
Ruyucan River, Brgy. Bintuan 4 538 10.40217 14.353 14.78743 5.48196
309
42.86 0.9542 0.6327 0.1224 0.7191 1.18502 1
Apocan River, Brgy. Bintuan 5 103 1.95263 3.477 17.34524 6.99978
230
37.49 1.5103 1.2060 0.0381 0.4382 1.56061 1
So. Inlalakay, Brgy.
Decalachao 6 411 13.51933 32.19 15.84302 8.476705
1760
25.00 1.3292 1.3303 0.0927 0.3432 1.92958 1
So. Depanlupot, Brgy.
Decalachao 7 104 6.13774 15.302 17.55991 7.94326
329
33.33 1.5072 1.4255 0.0384 0.2965 2.47619 0
So. Depanlupot, Brgy.
Decalachao 8 177 5.89254 15.504 15.62985 9.72069
335
59.99 0.7728 1.2277 0.0728 0.3664 1.82474 0
So. Decalingab, Brgy.
Decalachao 9 187 8.67521 22.227 17.39301 9.527935
830
42.86 0.7647 1.2469 0.0757 0.3543 1.85149 0
So. Decalingab, Brgy.
Decalachao 10 104 4.83009 10.234 16.63468 7.72541
230
49.99 1.0766 1.0484 0.0445 0.5108 1.42466 0
So. Depanlupot, Brgy.
Decalachao 11 779 17.47758 37.032 14.43897 8.27256
354 42.86
0.9012 1.3630 0.1480 0.3364 1.92346 0
So. Delantuan, Brgy.
Decalachao 12 684 10.58297 18.996 17.24011 7.08455
159 60.00
0.6127 0.7891 0.1680 0.5622 1.40164 0
So. Depanlupot, Brgy.
Decalachao 13 269 5.09726 9.282 15.24099 6.976985
403 50.00
0.8937 0.9766 0.0870 0.4346 2.13492 0
So. Tarata, Brgy. San Jose 14 159 6.09798 10.799 16.52453 6.54664
88 59.99 0.7891 1.2028 0.0675 0.3228 2.52381 2
So. Bakud, Brgy. San Jose 15 24 0.45225 0.807 13.62858 7.31667
36 75.00 0.6293 0.7924 0.0231 0.4819 1.60000 2
So. Talisay, Brgy. San Jose 16 114 3.49059 8.856 18.15303 8.997475
271 37.50 0.8446 0.8126 0.0531 0.5248 1.50000 2

____________________________________________________________________________________CHAPTER V: MANGROVE FORESTS 99
Table 28 continued . . . So. Canibong, Brgy. San Jose 17 325 12.02643 27.977 15.76299 8.40141
139 37.49 0.6916 0.9012 0.1095 0.5504 1.37712
So. Palpal, Brgy. San Jose 18 267 11.66559 27.437 15.74281 8.356335
544 50.00 0.7159 1.1071 0.0964 0.3854 1.85417 2
So. Makipiluen, Brgy. San Jose 19 106 4.20491 8.537 16.37053 7.757545
194 49.99 1.0722 1.0248 0.0452 0.5202 1.41333 2
So. Makipiluen, Brgy. San Jose 20 66 1.76079 3.057 14.394 6.797375 5 75.00 0.716 0.6233 0.0408 0.7002 1.2000 2
The cutting/harvesting of mangrove has been going on due to accessibility, ready market, high demand and preference of charcoal from mangrove trees and very lax enforcement of mangrove cutting ban. Mangrove-dependent families are basically fishermen but heavily dependent on mangrove for livelihood because they have no capital to invest in deep-sea fishing. They have low comparative advantage to other fishermen who have motorized boats. Most of them have only small non-motorized boats for fishing along estuaries and rivers. Bintuan mangrove stand is threatened for conversion to fishpond.
Plate 10. Picture showing mangrove cuttings, Coron, Palawan, 2003

____________________________________________________________________________________CHAPTER V: MANGROVE FORESTS 100
26.5 Mangrove Management Zoning and Proposed Strategy Ranking of Mangrove Sites for ECAN Zoning The forest structure and ecological diversity indices are used in ranking potential sites for strictly protected areas, conservation sites for community small scale management and sites for restoration or reforestation. Rank 1 to 4 is proposed for strict protection areas, rank 5 to 10 for community-based small scale management while rank 11 to 20 is proposed for immediate restoration or reforestation. The strict protection or preservation area is delineated as core zone while the conservation area is considered as regulated multiple use zone. The restoration zone is potential expansion area for core zone or regulated multiple use zone once the desired structure and condition is attained. The area adjacent to the transition zone towards the lowland/terrestrial area is suggested as buffer zone. The ecotone zone (area between mangroves and terrestrial flora) has higher diversity indices in terms of species richness, abundance and dominance. Mangrove areas with similar forest structure and conditions to transects 6, 9, 11 and 18 are proposed for preservation or strictly protected area while areas with similar forest structure and conditions like transects 2, 3, 7, 8, 12 and 17 are suitable for community small scale management. In addition, transects 1, 4, 5, 10, 13, 14, 15, 16, 19, and 20 are proposed for immediate restoration/rehabilitation, either through assisted natural regeneration (ANR) or reforestation. Table 29 shows the ranking of mangrove for ECAN zoning. Table 29. Ranking of Mangrove Ecological Indices for ECAN Zoning and Potential
Management Options, Coron, Palawan, 2003
Tran-sect
Stocking
Mean Ht
Mean DBH
Basal Area Vol
Mean Reg IV Dmg H' E 1/D N� Total Rank
1 13 5 18 17 17 16 1 19 18 13 3 18 158 18 2 6 9 20 9 10 3 7 10 4 7 16 4 105 5 3 9 3 15 8 7 11 10 1 15 12 4 17 112 10 4 3 20 14 6 11 9 6 7 19 3 1 20 119 11 5 17 16 4 18 18 12 8 2 7 19 11 11 143 17 6 4 6 9 2 2 1 11 4 3 6 17 5 70 1 7 16 11 2 10 8 8 9 3 1 18 20 2 108 9 8 11 1 12 12 9 7 3 13 6 10 14 9 107 7 9 10 2 3 7 5 2 6 14 5 9 15 8 86 3
10 16 13 6 14 13 12 5 5 10 16 9 13 132 14 11 1 10 16 1 1 6 6 8 2 2 18 6 77 2 12 2 15 5 5 6 14 2 20 17 1 5 15 107 6 13 7 17 13 13 14 5 4 9 12 8 12 3 117 12 14 12 19 7 11 12 17 3 12 8 11 19 1 132 15 15 18 14 19 20 20 18 1 18 16 20 10 10 184 19 16 14 4 1 16 15 10 7 11 14 14 7 12 125 13 17 5 7 10 3 3 15 8 17 13 4 6 16 107 8 18 8 8 11 4 4 4 4 16 9 5 13 7 93 4 19 15 12 8 15 16 13 5 6 11 15 8 14 138 16 20 19 18 17 19 19 19 1 15 20 17 2 19 185 20

____________________________________________________________________________________CHAPTER V: MANGROVE FORESTS 101
Proposed Management Strategy
The management strategy recommended is presented in Table 30. The rehabilitation of mangrove areas intended for preservation is prescribed for similar forest structures and conditions with transects 6, 9, 11 and 18. Mangrove areas of similar structures and conditions with those of transect 2, 3, 7, 8, 12 and 17 are recommended for rehabilitation through ANR that is intended for conservation purposes. The community based mangrove forest management (CBMFM) shall be adopted in rehabilitating mangrove areas of similar structures and a condition with those of transects 1, 4, 5, 10, 13, 14, 15, 16, 19 and 20. In transects 1 and 5, the aqua-silviculture is prescribed to rehabilitate areas with clearings and fishpond development while immediate forestation shall be applied to mangrove areas with similar state of degradation of that in transects 4, 10, 13, 14, 15, 16, 19 and 20. Table 30. Recommended Management Strategy for Mangrove Areas Evaluated by
Transect, Coron, Palawan, 2003
Barangay Transect No.
Coordinates Average Stocking
Class
Forest Cover Class
Stand Volume
Class
Biodi Index Class
Threaten Endemic
Spp.
Biodi Hotspots
Management Strategy
So. Yurucan, Brgy. Bintuan 1 N 11 159.922 and
E 120 05.57 Open/ Cleared Logged over Low
Volume Very Low Presence Cutting, Fishpond
CBMFM Aqua-silviculture
So. Malbato, Brgy. Bintuan 2 N 12 01.687 and E
120 07.01 Open/ Cleared Logged over Low
Volume Very Low Presence Cutting, Clearing Conservation-ANR
So. Malbato, Brgy. Bintuan
3 N 12*01.455 and E 120*07.496
Open/ Cleared Logged over Low
Volume Very Low Presence Cutting,
Charcoal Conservation-ANR
Ruyucan River, Brgy. Bintuan
4 N 11*59 59.170 and E 120*05 20.615
Open/ Cleared Logged over Low
Volume Very Low Presence Cutting,
Charcoal
CBMFM-Forestation
Apocan River, Brgy. Bintuan
5 N 11*59.919"and E 120*05.406"
Open/ Cleared Logged over Low
Volume Very Low Presence Clearing,
Fishpond CBMFM Aqua-silviculture
So. Inlalakay, Brgy. Decalachao
6 N 12*09.053"and E 120*06.009"
Open/ Cleared Logged over Low
Volume Very Low Presence Cutting,
Clearing
Preservation- Rehabilitation
So. Depanlupot, Brgy. Decalachao
7 N 12*09.057"and E 120*05.998'
Open/ Cleared Logged over Low
Volume Very Low Absence Cutting,
Clearing Conservation-ANR
So. Depanlupot, Brgy. Decalachao
8 N12*09.356"and E 120*05.831"
Open/ Cleared Logged over Low
Volume Very Low Absence Cutting,
Clearing Conservation-ANR
So. Decalingab, Brgy. Decalachao
9 N 12*08.489"and E 120*06.140’'
Open/ Cleared Logged over Low
Volume Very Low Absence Cutting,
Clearing
Preservation- Rehabilitation
So. Decalingab, Brgy. Decalachao
10 N 12*08.489"and E 120*06.149’'
Open/ Cleared Logged over Low
Volume Very Low Absence
Cutting
CBMFM-Forestation
So. Depanlupot, Brgy. Decalachao
11 N12*09.056"and E 120*05.337"
Inadequate Stock Sparse
Density Low Volume
Very Low Absence Cutting
Preservation- Rehabilitation

____________________________________________________________________________________CHAPTER V: MANGROVE FORESTS 102
Table 30 continued . . . So. Delantuan, Brgy. Decalachao
12 N 12*18.10"and E 120*15.103’'
Inadequate Stock Sparse
Density Low Volume
Very Low Absence Cutting
Conservation-ANR
So. Depanlupot, Brgy. Decalachao
13 "
Open/ Cleared Logged over Low
Volume Very Low Absence
Cutting
CBMFM-Forestation
So. Tarata, Brgy. San Jose
14 N 12*11.501"and E 120*05.09”
Open/ Cleared Logged over Low
Volume Very Low Presence
Cutting CBMFM-Forestation
So. Bakud, Brgy. San Jose
15
Open/ Cleared Logged over Low
Volume Very Low Presence
Cutting CBMFM-Forestation
So. Talisay, Brgy. San Jose
16 N 12*11.618"and E 120*05.598”
Open/ Cleared Logged over Low
Volume Very Low Presence
Cutting CBMFM-Forestation
So. Canibong, Brgy. San Jose
17
Open/ Cleared Logged over Low
Volume Very Low Presence
Cutting Conservation-ANR
So. Palpal, Brgy. San Jose
18 N 12*10.000"and E 120*03.586”
Open/ Cleared Logged over Low
Volume Very Low Presence
Cutting Preservation- Rehabilitation
So. Makipiluen, Brgy. San Jose 19 N 12*12.475"and
E 120 03.245” Open/ Cleared Logged over Low
Volume Very Low Presence Cutting CBMFM-Forestation
So. Makipiluen, Brgy. San Jose 20 N 12*12.330"and
E 120 03.143” Open/ Cleared Logged over Low
Volume Very Low Presence Cutting CBMFM-Forestation
27.0 ISSUES AND CONCERNS
1. Selection of barangays Bintuan, Decalachao and San Jose, out of the 23 barangays with mangroves to represent the total mangrove structures and conditions of Coron.
There were 4 four main factors considered in the selection of sampling sites:
a. The transect or sampling site should traverse (if possible) the different forest conditions of close density/canopy, sparse density/canopy, and open/clear area;
b. The sampling site should represent the different mangrove formations that capture different species composition, distribution and zonation. Thus, the sampling area has fringing, riverine, basin, and over wash type of mangrove formation;
c. The sampling area should capture different mangrove structure of high, middle and low stature and/or high, middle and low stand volume;
d. Accessibility ; and e. The constraint of time and resources that led to the adoption of an effective method
for attaining the purpose of the mangrove survey in relation to ECAN zoning.
2. Policy Issue on the Appropriateness of Issuances of CBFMA or other tenurial arrangement in mangrove areas.
The entire province of Palawan is declared as mangrove swamp forest reserve pursuant to P. P. 2152. The implementing rules and regulations of PP 2152 as embodied in DAO 1250 allows sustainable community based small-scale utilization and community management of mangrove areas. The SEP Law (RA 7611) defines ECAN zoning and

____________________________________________________________________________________CHAPTER V: MANGROVE FORESTS 103
provides a grading system of protection and development of the whole province of Palawan. The definition of various ECAN zones is provided in PCSDS Resolution No. 99-144 which describes the different zones in coastal/marine component. Based on said PCSDS Resolution, all mangrove areas of Palawan are included in the core zone category primarily because they were proclaimed as Mangrove Swamp Forest Reserve in 1981 regardless of their current habitat/forest condition and structure, land uses, biodiversity status, potential for ecological tourist destination, habitation/settlement of indigenous people (i.e. “taga-bakawan" in Sinamay as cited by LGU Coron).
Most of the technical staff of PCSDS adopted the “purest position of no take or no human activity in the core zone". As defined in the PCSDS Resolution No. 99-144 (implementing guidelines in the operationalization of ECAN for coastal/marine component that include the mangrove ecosystems), the core zone is strictly protected and free from any human activity. Mangrove is currently considered as core zone. All areas with standing mangrove forest cover pursuant to PP 2152 in the entire province of Palawan are classified as Core Zone, except areas allocated for MSA, CBFMA and ISF. PCSD gives clearance before DENR issue CBFMA as provided in the Memorandum of Agreement between DENR and PCSDS dated December 1994. However, it is not clear if the exception covers only MSA, CBFMA, ISF issued after the effectivity of the SEP Law or both after and before the said law. It must be noted that until now the issue has not been resolved. There was a suggestion though that core zones should not be subjected to CBFMA, MSA, ISF until such time that the issue is resolved. It was likewise observed that the PCSD issued clearances to at least 4 applicants of CBFMA for mangrove. The various CBFMAs issued last year are CBFMA No. RIV-PAL-2003-33, RIV-PAL-2003-34, RIV-PAL-2003-35 and RIV-PAL-2003-36 with corresponding PCSDS Clearances Nos. CRM 061203-02-08, CBFM 081803-02-02, CBFM 081803-02-03 and CBFM 100703-02-03 (See Table 31)
Table 31. Listing of PO Awarded with CBFMA, Coron, Palawan
Name of PO Area (has) Date Awarded
Location
1) Kamuning Coastal Dev’t Association, Inc. (KCRDAI)
886.15 6-30-03 Sitio Kabaryawan, Brgy. Kamuning, Puerto Princesa
2) Bacungan Coastal Residence Dev’t. Ass’n. Inc (BCRDAI)
378.96 8-21-03 So. San Carlos, Brgy. Bacungan, Puerto Princesa
3) Samahan ng Mangingisda ng Honda Bay (SAMAHOBA)
123.85 8-21-03 So. Honda Bay, Brgy. Sta. Lourdes, Puerto Pricesa
4) Tagburos Aqua- Venture Multi-Purpose Coop (TAVEMCO)
272.80 8-21-03 Brgy. Tagburos, Puerto Princesa

____________________________________________________________________________________CHAPTER V: MANGROVE FORESTS 104
3. Issue of zoning the mangrove into core zone, restoration zone, and regulated multiple use zone.
It is suggested that the zoning of mangrove areas into core, restoration and regulated multiple use zones be based on current habitat/forest condition and structure, land uses, biodiversity status, potential for ecological tourist destination, habitation/settlement and source of living of indigenous people. The core zone shall cover mangrove areas with high relative values of biodiversity, medium to high stand volume, adequately stocked and free from settlement or utilization by indigenous people. On one hand, restoration zone shall include mangrove areas with low relative diversity values, open/denuded to inadequately stocked, low stand volume and subjected to cutting. The regulated multiple use zone may consist of abandoned and/or unproductive fishpond areas.
28.0 RECOMMENDATIONS
The scoring and ranking is primarily based on qualitative description of the mangrove areas such as stand growth, density, stature and existing pattern of utilization which are supported with quantitative based on stand volume, stocking, mean diameter, mean height, mean basal area, stand and stock and mean regeneration (seedlings and saplings). This qualitative and quantitative information provide the basis for recommending an effective scheme of rehabilitating and sustaining the mangrove ecosystem as a renewable resource.
Immediate rehabilitation should be undertaken in heavily exploited and degraded mangrove areas, either through adoption of enrichment planting (EP) or assisted natural regeneration (ANR), and by using species which had been chosen based on species distribution and zonation. Due to their economic and ecological values, R. apiculata, R. mucronata, and R. stylosa have so far been the preferred species in most reforestation efforts of the country. The mangrove-dependent households should be organized to undertake the rehabilitation, management, and protection, of mangrove forest.
The community organizing (CO) strategies are supposed to be integral components of the development and rehabilitation efforts on mangrove areas i. e. they should all be geared towards addressing some socio-economic and environmental concerns/needs. Specific activities shall be more community focused, rather than environmental centered. The local institutions should be developed and the capabilities of mangrove-dependent households should be particularly strengthened and enhanced for them to become effective stewards and de facto managers of their given resources. Likewise, they should be enjoined to undertake rehabilitation, and conservation of the coastal resources in order to sustain the provision of goods and services and protect the base of their economic activities, thereby reducing poverty incidence. The CBMFM/CBRMP concept of restoring the coastal resources may be adopted to generate local participation and to ensure the sustainability of whatever interventions implemented.

REFERENCES 105
REFERENCES Literature Cited Allen, G.R. 1991. Damselfishes of the World. Mergus Publishers Han A. Baensch, Melle,
Germany. 271 p. Bellwood, D.R. and J.H. Choat. 1990. A functional analysis of grazing in parrotfishes
(family Scaridae): the ecological implications. Environ. Biol. Fishes, 28: 189-214. Conservation International. 2003. Palawan Corridor Strategy Development Project Database.
Palawan Local Government, Palawan Council for Sustainable Development, Department of Natural Resources, Palawan NGO Network, Inc., and Conservation International.
English, S., C. Wilkinson and V. Baker (eds.). 1997. Survey manual for tropical marine
resources. Second Edition. Australian Institute of Marine Science, Townsville. 390 pp
Froese, R. and D. Pauly, Editors. 2000. FishBase 2000: concepts, design and data sources. ICLARM, Los Baños, Laguna, Philippines. 344 p.
Green EP, Short FT, 2003. World atlas of seagrasses. Prepared by the UNEP World Conservation Monitoring Center, University of California Press, Berkeley, USA
IUCN-World Conservation Union. 2003. 10 Marine Species on the Brink. Defying Ocean’s
End: An Agenda for Action. Gordon and Betty Moore Foundation, Mexico. Heinsohn, G.E., H. Marsh, and P.K. Anderson. 1979. Australian dugong. Oceans 12 (3):48-
52. Hemminga MA, Duarte CM, 2000. Seagrass ecology. Cambridge University Press,
Cambridge, UK, 298 p Hill MO, 1979. TWINSPAN, TWo Way INdicator SPecies ANalysis. Lieske, E and R. Myers. 2001. Coral Reef Fishes, Indo-Pacific and Caribbean. Princeton
University Press, Princeton, New Jersey. 400 p. McKenzie LJ, Finkbeiner MA, Kirkman H, 2001. Methods for mapping seagrass
distribution. In Short FT, Coles RG (eds), Global seagrass research methods, pp 101-121. Elsevier Science BV, Amsterdam, The Netherlands
Montebon, A.R.F. 1997. Status of coral reefs in Negros Oriental, central Philippines. Proc.
8th Int’l Coral Reef Symp., Panama. 1:295-300.

REFERENCES 106
Palawan Council for Sustainable Development Staff (PCSDS), 1994. PCSD Resolution #94-44, Resolution adopting the guidelines in implementing the Environmentally Critical Areas Network (ECAN), the main strategy of the Strategic Environmental Plan (SEP) for Palawan. (Pamphlet)
Perrin, W.F., M.L.L. Dolar, and M.N.R. Alava, 1996. Report of the workshop on the biology
and conservation of small cetaceans and dugongs of Southeast Asia. Bangkok, UNEP:101.
Short FT, McKenzie LJ, Coles RG, Vidler KP, 2002. SeagrassNet: Manual for scientific
monitoring of seagrass habitat. QDPI, QFS, Cairns, 56p Santos, M.D. and Barut, N.C. 2002. A review of the Philippine Cetacean By-Catch Fisheries.
CMS/SEAMAM II/Doc. 19. Trochim, W.M.K. 2000. Research Methods Knowledge Base. Cornell University. 30 p. Werner, T.B. and G.R. Allen (eds.). 2000. A Rapid Marine Biodiversity Assessment of the
Calamianes Islands, Palawan Province, Philippines. RAP Bulletin of Biological Assessment 17. Washington, D.C.: Conservation International.