Baseline Macroinvertebrate Monitoring Report 2016-2017 … · Baseline Macroinvertebrate Monitoring...
39
Madison River Project Baseline Aquatic Surveys Montana Biological Survey June 2017 Baseline Macroinvertebrate Monitoring Report 2016-2017 for the Upper Madison River, MT Prepared for: Liz Davis Executive Director Madison River Foundation Ennis Office Madison River looking upstream from HWY 87 Macroinvertebrate Monitoring Station Prepared by: David Stagliano, Aquatic Ecologist Montana Biological Survey Helena, Montana June 2017
Transcript of Baseline Macroinvertebrate Monitoring Report 2016-2017 … · Baseline Macroinvertebrate Monitoring...
Madison River Project Baseline Aquatic Surveys Montana Biological Survey June 2017
Baseline Macroinvertebrate Monitoring Report 2016-2017 for the Upper Madison River, MT
Prepared for:
Liz Davis
Executive Director Madison River Foundation
Ennis Office
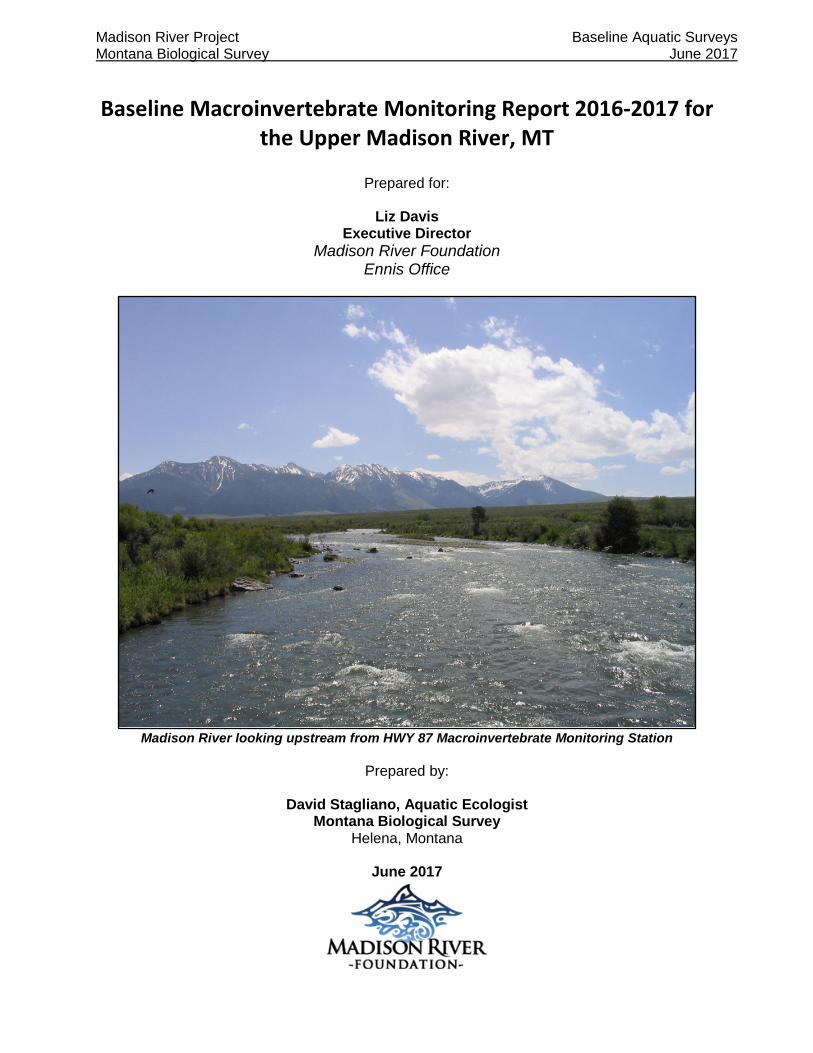
Madison River looking upstream from HWY 87 Macroinvertebrate Monitoring Station
Prepared by:
David Stagliano, Aquatic Ecologist
Montana Biological Survey Helena, Montana
June 2017
MRF Madison River Project Baseline Aquatic Surveys Montana Biological Survey June 2017
2
Table of Contents Acknowledgements .................................................................................................................................... 3
Executive Summary ................................................................................................................................... 4
1.0 Introduction ...................................................................................................................................... 6
2.0 Methods ................................................................................................................................................ 6
2.1 Habitat and Physical Water Sampling .......................................................................................... 6
2.2 Macroinvertebrate Sampling .......................................................................................................... 7
2.3 Taxonomic Analysis ........................................................................................................................ 8
2.4 Sample Sites .................................................................................................................................... 8
3.0 Results ................................................................................................................................................ 11
3.1 Madison River below Hebgen Dam ............................................................................................ 19
3.2 Madison River downstream of the HWY 87 Bridge .................................................................. 21
3.3 Madison River upstream of the Lyons Bridge (Kirby) .............................................................. 21
3.4 Madison River near the South Madison Campground ............................................................. 22
3.5 Madison River at McAtee Bridge ................................................................................................. 23
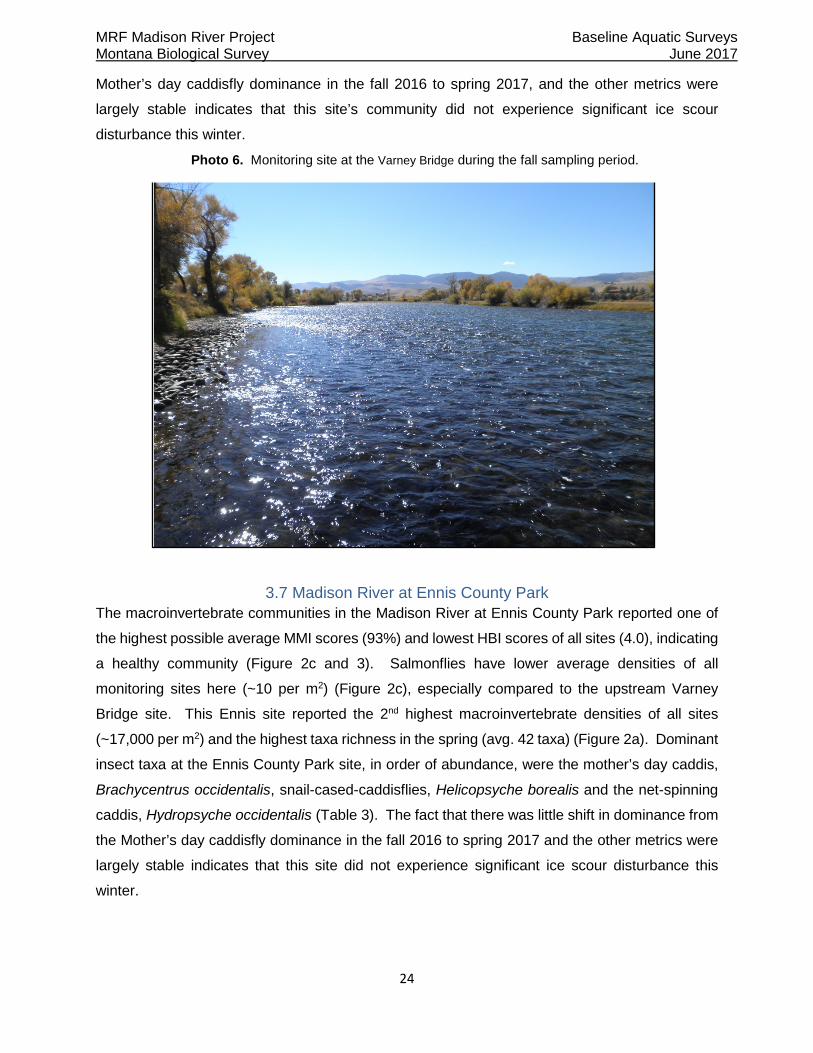
3.6 Madison River at Varney Bridge.................................................................................................. 23
3.7 Madison River at Ennis County Park .......................................................................................... 24
4.0 Conclusions ........................................................................................................................................ 25
5.0 Literature Cited................................................................................................................................... 27
Tables
Table 1. Madison River Study Reach locations .......................................................................... 9
Table 2. Cumulative mayfly, stonefly and caddisfly (EPT) species occurrences ....................... 12
Table 3. Dominant Seasonal Macroinvertebrate Taxa at sites ................................................. 15
Figures
Photo 1. Hess sampling procedure in a riffle area ...................................................................... 7
Map 1. Madison River Hebgen Dam sampling locations overview............................................ 10
Figure 1. USGS Madison River streamflow graph for the sampling period ............................... 10
Photo 2. Hebgen Dam site #1 during the spring sampling period … ......................................... 11
Figure 2a. Macroinvertebrate densities, total taxa and EPT taxa.. ............................................. 13
Figure 2b. Macroinvertebrate metrics for all sample sites by season. ........................................ 14
MRF Madison River Project Baseline Aquatic Surveys Montana Biological Survey June 2017
3
Figure 2c. Macroinvertebrate metrics for all sample sites by season. ....................................... 15
Figure 3. Hilsenhoff Biotic Index metric for 2016-2017 MRF sample sites. ............................... 16
Figure 4. Macroinvertebrate comparisons between the MRF Hebgen sites vs. NWE. .............. 19
Photo 3. HWY 87 Bridge site during the fall sampling period … ............................................... 21
Photo 4. Lyons Bridge (Kirby) site during the spring sampling period … .................................. 22
Photo 5. McAtee Bridge site during the fall sampling period …. ............................................... 23
Photo 6. Varney Bridge site during the fall sampling period … ................................................. 24
Photo 7. Ennis County Park during the fall sampling period … ................................................. 25
APPENDICES
Appendix A Seasonal Macroinvertebate taxa list and abundance
Appendix B Habitat and Physical Site Conditions
Acknowledgements
We would like to thank Liz Davis and the Madison River Foundation Board for funding this project through Montana Biological Survey (MBS). Report review and editing was provided by Braden Lewis. Field survey assistance from Victoria Silva and Becca Troianos was invaluable. Additional sample processing during the winter was provided by Braden Lewis.
All photos in the report were taken by MBS, unless otherwise noted

MRF Madison River Project Baseline Aquatic Surveys Montana Biological Survey June 2017
4
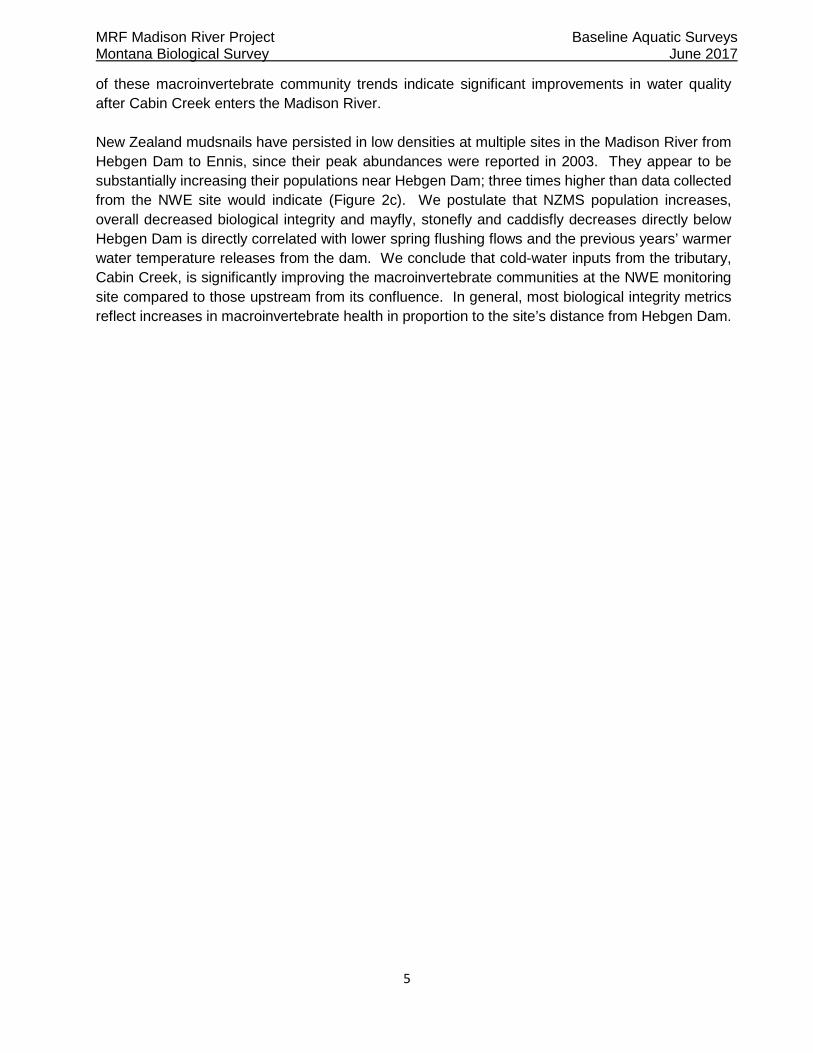
Executive Summary The Madison River Foundation (MRF) began the upper Madison River Baseline Monitoring program in the fall of 2016 by establishing eight long-term, monitoring stations between Hebgen Dam and Ennis for seasonal sampling of benthic macroinvertebrates. This study was initiated to supplement and augment the existing Northwestern Energy (NWE) monitoring program. Seasonal sampling can elucidate macroinvertebrate population or taxa trends that may go unnoticed when sampling once in middle of summer. This study also establishes two sites nearer Hebgen Dam, upstream from the NWE site which lies downstream of Cabin Creek. Therefore, the project goals of MRF’s program are: 1) to conduct standardized and quantitative macroinvertebrate surveys to serve as baseline standards for future monitoring efforts within this Madison River section 2) to establish seasonal macroinvertebrate population estimates and community characteristics to assess aquatic biointegrity and 3) to understand the macroinvertebrate dynamics in relation to Hebgen Dam’s retro-fits and differential temperature flow patterns. In late-September of 2016 and May 2nd, 2017, we collected quantitative, replicated macroinvertebrate samples, habitat data and water chemistry measurements at eight Madison River sites. Macroinvertebrate populations reached their highest reported densities in the fall at the HWY 87 Bridge (avg. 19,300 individuals per m2) and steadily decreased downstream to Varney Bridge, then increased downstream to Ennis. Relatively high average densities (~11,000 per m2) were reported across all sites which trended slightly higher in the spring 2017 samples. We observed lower densities than the average at both Madison River Hebgen sites and at the Varney Bridge site (~7,000 per m2) (Figure 1). Mayfly, stonefly and caddisfly taxa (EPT taxa) dominated most sampling sites on the Madison River, averaging 62% of the invertebrate community, except at the Hebgen Dam sites where they averaged 22% (Figure 1). Salmonflies gradually increased their densities from their lowest numbers below Hebgen Dam site #2 (avg. 5 individuals per m2) to peak density at Varney Bridge (avg. ~35 ind. per m2); this is a sevenfold increase. Lower than average (~13 per m2) salmonfly numbers are also reported near Ennis, at McAtee Bridge and HWY 87 Bridge, especially in the spring. The Hilsenhoff Biotic Index (HBI) indicated the highest macroinvertebrate tolerance values near Hebgen Dam (>5.5, significant nutrient impairment) and decreasing downstream to the HWY 287 Bridge and Kirby Ranch (>4.5 moderate nutrient impairment) to below impairment thresholds (<4.5) at the lower four sites downstream to Ennis (Figure 1). The macroinvertebrate multi-metric index (MMI) showed a similar spatial pattern with impaired rankings close to Hebgen Dam and improving as you proceed downstream; highest MMI scores >90% were reported at McAtee Bridge, Varney and Ennis County Park. We compared the macroinvertebrate metric results from two MRF Hebgen Dam sites against the NWE site that were collected in 2016. We found significant differences in macroinvertebrate communities between Hebgen Dam sites above and below Cabin Creek across all metrics analyzed (Figure 2). The HBI exhibited the largest disparity between the sites declining >2 points from 5.9 (avg.) near the dam to 3.8 below Cabin Creek; this reflected a change in impairment ranking from significant to slightly nutrient enriched in less than a mile (Figure 2). The multi-metric index, % EPT per sample and salmonfly densities all increased significantly below Cabin Creek, while % Chironomidae, % sediment tolerant taxa and NZMS densities decreased significantly (Figure 2). All
MRF Madison River Project Baseline Aquatic Surveys Montana Biological Survey June 2017
5
of these macroinvertebrate community trends indicate significant improvements in water quality after Cabin Creek enters the Madison River. New Zealand mudsnails have persisted in low densities at multiple sites in the Madison River from Hebgen Dam to Ennis, since their peak abundances were reported in 2003. They appear to be substantially increasing their populations near Hebgen Dam; three times higher than data collected from the NWE site would indicate (Figure 2c). We postulate that NZMS population increases, overall decreased biological integrity and mayfly, stonefly and caddisfly decreases directly below Hebgen Dam is directly correlated with lower spring flushing flows and the previous years’ warmer water temperature releases from the dam. We conclude that cold-water inputs from the tributary, Cabin Creek, is significantly improving the macroinvertebrate communities at the NWE monitoring site compared to those upstream from its confluence. In general, most biological integrity metrics reflect increases in macroinvertebrate health in proportion to the site’s distance from Hebgen Dam.

MRF Madison River Project Baseline Aquatic Surveys Montana Biological Survey June 2017
6
1.0 Introduction The Madison River Foundation (MRF) contracted Montana Biological Survey (MBS) to begin the
upper Madison River Baseline Monitoring program in the fall of 2016 by establishing eight long-
term, monitoring stations between Hebgen Dam and Ennis for seasonal sampling of benthic
macroinvertebrates. This study was initiated to supplement and augment the existing
Northwestern Energy (NWE) macroinvertebrate monitoring program. Seasonal sampling can
elucidate macroinvertebrate population or taxa trends that may go unnoticed when sampling just
one time in the middle of summer. Some stonefly taxa remain in the egg stage (not collected in
the samples) through the summer until water temperatures cool to hatch in the fall. This study
also establishes two new sites nearer Hebgen Dam than the NWE site which is downstream from
and may be influenced by Cabin Creek. Benthic macroinvertebrates have been monitored at this
one NWE site about 0.8 miles below Hebgen Dam annually since 1995 (McGuire 2015). This is
a regulated stream reach with dampened seasonal and short-term flow fluctuations, modified
temperature regime, minimal flushing of sediment loads, and tremendous inputs of plankton and
nutrients from the upstream reservoir. During normal operations, the dam releases consistently
cold (hypolimnetic) water; however, warmer surface water has been discharged from 2009
through 2015. This resulted in a ~5° F increase in maximum summer water temperatures. August
benthic macroinvertebrates density estimates at this site typically range from 4 to 5 thousand per
square meter (McGuire 2016). Our 2016-2017 results corroborate and are slightly higher than
these macroinvertebrate densities below Hebgen, averaging ~7,000 organisms per m2 across
both seasons. Mayflies, stoneflies and caddisflies (i.e. Ephemeroptera, Plecoptera and
Trichoptera {EPT taxa}) are of particular interest to fly fisherman, and are typical focal points of
benthic invertebrate analysis because these orders also contain some of the more sediment and
“pollution” sensitive species of insects (Barbour et al 1999). Project goals are: 1) to conduct
standardized and quantitative macroinvertebrate surveys to serve as the baseline standard
against future monitoring efforts, 2) to assess aquatic biointegrity with key community indicators
and comparing these against previously collected qualitative samples by NWE (2015), 3) to
understand the insect dynamics in relation to differential temperature releases from Hebgen Dam.
2.0 Methods 2.1 Habitat and Physical Water Sampling Temperature and basic physical water parameters (Total Dissolved Solids, pH, and Conductivity)
were recorded at each site prior to macroinvertebrate sampling using an Oakton 10 water quality
multi-meter, calibrated for the lower conductivity range (Appendix B). A 25 m survey tape was
staked from the green-line on the stream bank to record sampling distances into the stream
MRF Madison River Project Baseline Aquatic Surveys Montana Biological Survey June 2017
7
channel where samples were taken. Stream channel depths at each bug sample point (n=3) were
recorded at the time of sampling (Appendix B).
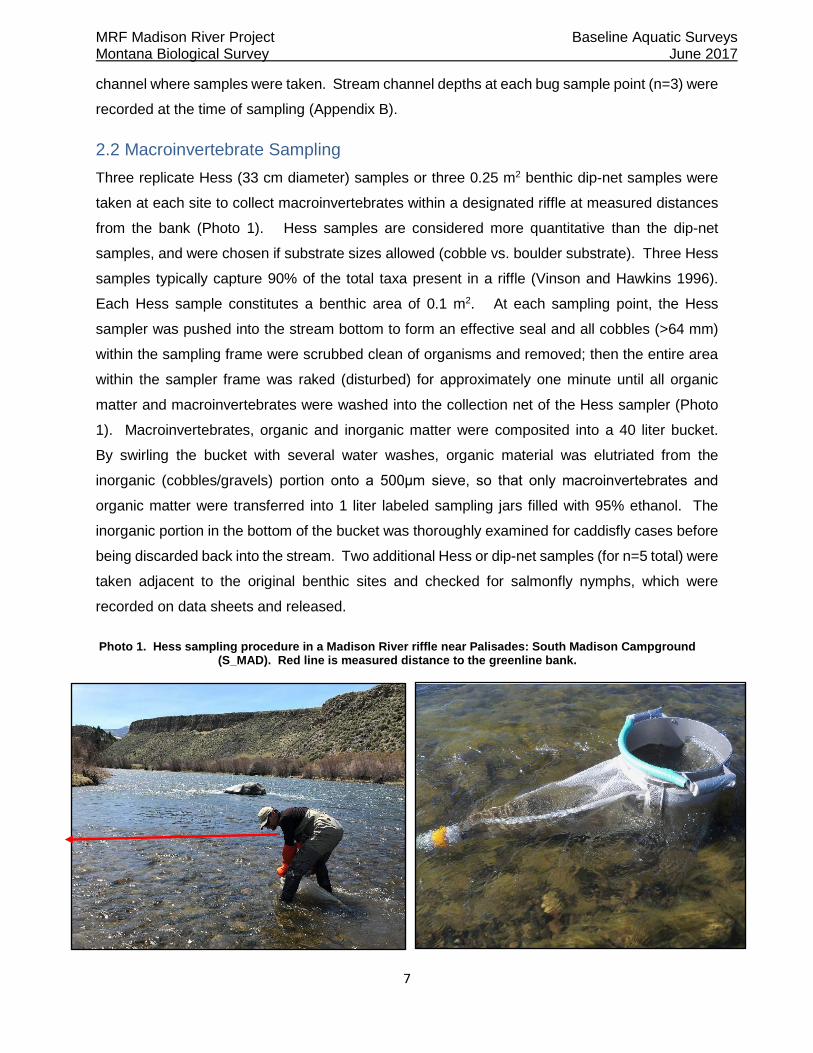
2.2 Macroinvertebrate Sampling Three replicate Hess (33 cm diameter) samples or three 0.25 m2 benthic dip-net samples were
taken at each site to collect macroinvertebrates within a designated riffle at measured distances
from the bank (Photo 1). Hess samples are considered more quantitative than the dip-net
samples, and were chosen if substrate sizes allowed (cobble vs. boulder substrate). Three Hess
samples typically capture 90% of the total taxa present in a riffle (Vinson and Hawkins 1996).
Each Hess sample constitutes a benthic area of 0.1 m2. At each sampling point, the Hess
sampler was pushed into the stream bottom to form an effective seal and all cobbles (>64 mm)
within the sampling frame were scrubbed clean of organisms and removed; then the entire area
within the sampler frame was raked (disturbed) for approximately one minute until all organic
matter and macroinvertebrates were washed into the collection net of the Hess sampler (Photo
1). Macroinvertebrates, organic and inorganic matter were composited into a 40 liter bucket.
By swirling the bucket with several water washes, organic material was elutriated from the
inorganic (cobbles/gravels) portion onto a 500μm sieve, so that only macroinvertebrates and
organic matter were transferred into 1 liter labeled sampling jars filled with 95% ethanol. The
inorganic portion in the bottom of the bucket was thoroughly examined for caddisfly cases before
being discarded back into the stream. Two additional Hess or dip-net samples (for n=5 total) were
taken adjacent to the original benthic sites and checked for salmonfly nymphs, which were
recorded on data sheets and released.
Photo 1. Hess sampling procedure in a Madison River riffle near Palisades: South Madison Campground (S_MAD). Red line is measured distance to the greenline bank.

MRF Madison River Project Baseline Aquatic Surveys Montana Biological Survey June 2017
8
2.3 Taxonomic Analysis Samples were processed and analyzed at the MBS laboratory in Helena. Macroinvertebrates
were randomly picked from the samples spread on various-sized, grided trays (9"x12" to 14"x
20") until 500 individuals were collected, and identified to the lowest taxonomic level possible
(genus/species) with a dissecting microscope (10-40x) following Montana Department of
Environmental Quality protocols (MDEQ 2012). We converted macroinvertebrate densities to per
meter squared by multiplying the total number of bugs in the Hess sampler by 10 and by the total
# of bugs in the dip-net samples by four. Numerous metrics and the MDEQ MMI were calculated
from the data after it was entered into an EDAS database (Jessup et al. 2006), including EPT
taxa, % EPT, % Non-insect, % Chironomidae and the Hilsenhoff Biotic Index (HBI) modified for
Montana (Jessup et al 2006). The combined mayfly, caddisfly and stonefly species (EPT taxa)
and the percentage of these in the sample (% EPT) are always useful metrics, as EPT taxa
contain some of the more intolerant aquatic insects, usually requiring clean substrates. These are
also the insects that most fly-fisherman are concerned about matching the hatch. Thus, EPT
metrics typically decrease with increasing sediment in the benthic substrates (Barbour et al.
1999); although, Tricos (Tricorythodes) are silt tolerant and can increase in numbers with
increasing siltation. Another biointegrity score used was developed by McGuire (1998) is a
composite value based on six metrics and has a theoretical range of 0 to 100%. High scores are
characteristic of minimally impacted stream reaches and scores >75% of maximum are
considered unimpaired. Metrics and rating criteria for estimating biointegrity (Table 2) were
established using data collected from 1994-1998 (McGuire 1999). MDEQ tolerance values
(Bukantis 1997) were used to calculate the Biotic Index. One informative stand-alone metric is
the Hilsenhoff Biotic Index (HBI) which measures the tolerance of a macroinvertebrate community
to organic enrichment (Hilsenhoff 1987), but has also been interpreted as a surrogate for sediment
(Jessup et al. 2006). Tolerance values are based on a 0-10 scale, where zero-ranked taxa are
most sensitive and 10-ranked taxa are most tolerant to pollutants. Values of 0.0-3.5 indicate no
apparent organic pollution (excellent), 3.5-4.5 possible slight organic pollution (very good), 4.5-
5.5 moderate pollution, 5.5-6.5 fairly significant pollution, 6.5-7.5 significant pollution (fairly poor),
7.5-8.5 very significant organic pollution 8.5-10 severe organic pollution.
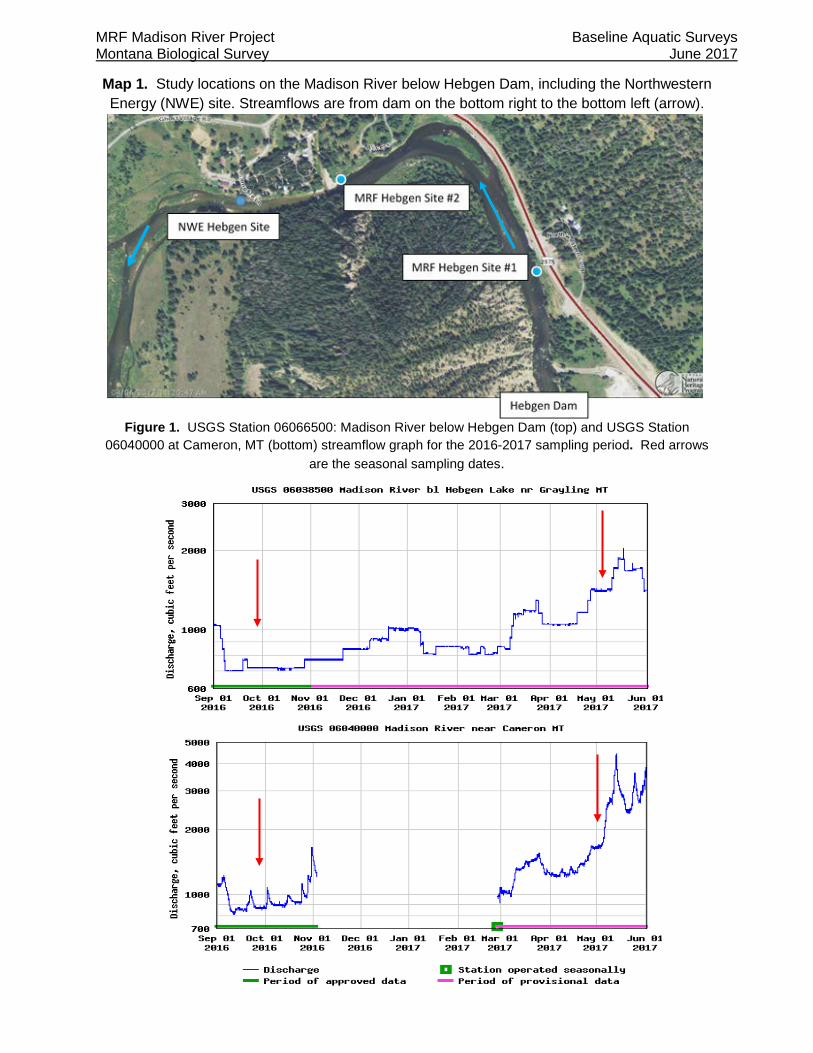
2.4 Sample Sites We sampled macroinvertebrates at eight established monitoring sites between Hebgen Dam and
Ennis (Table 1) during the fall baseflow and pre-runoff, spring monitoring periods. In total, we
collected 24 quantitative Hess samples and 24 semi-quantitative 0.25 m2 kick-net samples (at
sites to deep or bouldery to effectively use the Hess) on September 27th and 28th, 2016 and May

MRF Madison River Project Baseline Aquatic Surveys Montana Biological Survey June 2017
9
2nd, 2017 (Figure 1). Stream flows on the Madison River during the fall sampling period were
~720 cfs at Hebgen and 860 cfs at Cameron, while the spring sampling occurred during Hebgen
flows of 1280 cfs and below Cameron of 1620 cfs (Table 1, Figure 1).
Table 1. Madison River study sites, date sampled, water parameters measured and flows (Q) on that date. *Sites not currently sampled by NWE. D/S=downstream, U/S=upstream
SITE #
Site Name Latitude Longitude Date Coll.
H2O Temp
°C Cond.
(µs/cm) pH Q (cfs)
1* Madison River D/S Hebgen Dam #1
44.86732 -111.3386 9/28/16 11.3 363 8.2 720
5/02/17 4.4 301 7.9 1280
2* Madison River D/S Hebgen Dam #2
44.86907 -111.3444 9/28/16 12.5 386 8.2 720
5/02/17 5.0 297 7.9 1280
3* Madison River @ HWY 287/87 Bridge
44.82629 -111.4855 9/27/16 11.7 212 7.9 720 5/02/17 6.0 287 7.9 1280
4* Madison River U/S Lyons Bridge 44.89935 -111.5919
9/27/16 12.1 230 8.0 825 5/02/17 7.8 260 7.9 1500
5* Madison River @ S. Madison Campgrd. 44.99887 -111.6602
9/27/16 14.6 244 8.0 825 5/02/17 8.8 285 7.8 1580
6* Madison River U/S McAtee Bridge FAS 45.09543 -111.6621
9/27/16 18.8 282 7.9 860
5/02/17 8.8 285 7.8 1580
7* Madison River U/S Varney Bridge FAS
45.23216 -111.7513 9/27/16 18.7 286 8.0 860
5/02/17 9.5 275 7.8 1620
8 Madison River @ Ennis County Park
45.3456 -111.7236 9/27/16 17.4 301 8.0 860
5/02/17 9.7 266 7.8 1620
MRF Madison River Project Baseline Aquatic Surveys Montana Biological Survey June 2017
10
Map 1. Study locations on the Madison River below Hebgen Dam, including the Northwestern Energy (NWE) site. Streamflows are from dam on the bottom right to the bottom left (arrow).
Figure 1. USGS Station 06066500: Madison River below Hebgen Dam (top) and USGS Station 06040000 at Cameron, MT (bottom) streamflow graph for the 2016-2017 sampling period. Red arrows
are the seasonal sampling dates.
MRF Madison River Project Baseline Aquatic Surveys Montana Biological Survey June 2017
11
3.0 Results Overall, 108 unique macroinvertebrate taxa were reported from the 48 seasonal macroinvertebrate
assessment samples collected between Hebgen Dam and Ennis in 2016-2017 (Appendix A).
Densities of benthic macroinvertebrates varied significantly spatially and seasonally with the
overall trend of higher densities from HWY 87 Bridge and decreasing downstream to Varney then
increasing densities at Ennis (Figure 2a). The Madison River at the HWY 87 Bridge reported the
highest benthic invertebrate densities of all sites, averaging ~19,000 individuals per m2 in the fall,
but then significantly decreased in the spring to ~8,000 per m2 (Figure 2a). Relatively high average
densities (~11,000 per m2) were reported across all sites, which trended slightly higher in the spring
2017 samples. We observed lower than average densities at both Madison River Hebgen sites
and at the Varney Bridge site (~7,000 per m2) (Figure 2a). Lower macroinvertebrate population
densities did not necessarily equate to lower taxa richness, as Varney Bridge reported the lowest
densities, but also had the 2nd highest taxa richness and EPT richness in the spring (Figure 2a).
Reach-wide average macroinvertebrate taxa richness per site was 34.3 taxa in the fall and 36.5
taxa in the spring with no significant difference between seasons (T-test, p>0.05) (Appendix A).
The most taxa rich macroinvertebrate community (42 taxa) was reported at both Kirby in the fall
and Ennis in the spring (Figure 1). The combined mayfly, caddisfly and stonefly (EPT) taxa
richness for the entire sampled section totaled 46 taxa and averaged 14.9 species per site in the
fall and 15.6 species in the spring with no differences between seasons (T-test, p>0.05) (Table
2). Mayfly and caddisfly taxa were more diverse and abundant than stonefly taxa at all sites
(Table 2), and caddisflies dominated the EPT taxa present (~40%) at the 5 sites downstream of
HWY 87. There were 15 species of mayflies recorded throughout the study section with the
dominant three being, BWO’s (Baetis tricaudatus), Pale Morning Duns (Ephemerella excrucians),
and the Green Drake, Drunella coloradensis. BWO’s and PMDs often exchanged dominance as
the most abundant mayfly at a site depending on the season (Table 2). Of the 21 species of
caddisflies that were collected across all sites, the net spinning caddis, Hydropsyche occidentalis
and Cheumatopsyche spp, Saddle-cased, Glossosoma spp. and the long-horned caddis, Oecetis
were usually the most prevalent (Table 2). Populations of other net-spinning caddis (Arctopsyche
grandis, H. morosa group), micro-caddis (Hydroptila) and snail-cased caddis (Helicopsyche
borealis) were also common to abundant (Table 2). The mother’s day caddisfly, Brachycentrus
occidentalis becomes much more abundant closer to Ennis (Table 2). Ten different stonefly
(Plecoptera) species were collected across the 8 study reaches (Table 2). The salmonfly
(Pteronarcys californica) was detected during all sampling visits, except at HWY 87 Bridge in the
spring. The Chloroperlidae stoneflies (Sweltsa/Suwallia/Paraperla {Yellow Sallys}) and

MRF Madison River Project Baseline Aquatic Surveys Montana Biological Survey June 2017
12
Perlodidae (Skwala and Isoperla {Green-winged Stoneflies}) were detected at ~50% of the sites,
while the Golden Stones, Hesperoperla pacifica and Claassenia sabulosa were present in low
numbers to common across all sites (Table 2).
Photo 2. Monitoring site below Hebgen Dam #1 during the spring sampling period.

MRF Madison River Project Baseline Aquatic Surveys Montana Biological Survey June 2017
13
Table 2. The combined mayfly, stonefly and caddisfly (EPT) taxa occurrences and dominance for the entire study reach sampled. x=rare, X=common, XX=abundant, XXX=dominant at site.
Order Species
Hebg
an 1
Hebg
en 2
HWY
87 B
R.
Kirb
y/Ly
ons
S. M
adis
on
McA
tee
Br.
Varn
ey B
r.
Enni
s
Mayflies EphemeropteraBaetidae Acentrella turb ida X x X x x X XBaetidae Baetis tricaudatus X XX XXX XX XXX XX XX XXBaetidae Diphetor hageni x x XLeptophlebiidae Paraleptophleb ia sp. x x x x XLeptohyphidae Tricorythodes explicatus X Ephemerellidae Caudatella heterocaudata x x x x x Ephemerellidae Attenella margarita x XEphemerellidae Ephemerella excrucians X X XXX XX X XXX XX XEphemerellidae Drunella coloradensis/flaviliena X X X X X xEphemerellidae Drunella grandis x x x xHeptageniidae Epeorus albertae x xHeptageniidae Epeorus deceptivus x x Heptageniidae Epeorus longimanus x Heptageniidae Heptagenia X X x xHeptageniidae Rhithrogena sp. x x X X x x XStoneflies PlecopteraPerlodidae Isoperla x x x x x xPerlodidae Isoperla fulva x x x Perlodidae Skwala x x x Chloroperlidae Paraperla xChloroperlidae Suwallia x x x xChloroperlidae Sweltsa x x xChloroperlidae Chloroperinae x x x xPteronarcidae Pteronarcys californica x x x X x X X xPerlidae Hesperoperla pacifica XX x x X x xPerlidae Claassenia sabulosa x x x X x xCaddisflies TrichopteraBrachycentridae Amiocentrus aspilus XX X X x x x xBrachycentridae Brachycentrus americanus X X Brachycentridae Brachycentrus occidentalis x x x x x XXX XXXHydropsychidae Arctopsyche grandis x X X x X XHydropsychidae Parapsyche almota x xHydropsychidae Cheumatopsyche x x XXX XX X x XXX XXHydropsychidae Hydropsyche occidentalis x XX XX XXX XX XX X XXXHydropsychidae Hydropsyche morosa gr. x X x x X x XHydroptilidae Hydroptila X x X X x x xHydroptilidae Leucotrichia pictipes x x x Hydroptilidae Ochrotrichia x Lepidostomatidae Lepidostoma x x X X XXX XXX X XXLeptoceridae Ceraclea X XX x x x x x xLeptoceridae Oecetis avara x x XX X X X X XGlossosomatidae Glossosoma X x XX x XX XX XX XXGlossosomatidae Protoptila x xUneonidae Neophylax splendans xHelicopsychidae Helicopsyche borealis x x x XX XX XX XXXPhilopotamidae Psychomyia flavida x X x x x XRhyacophilidae Rhyacophila brunnea grp. x x x x x xRhyacophilidae Rhyacophila coloradensis grp. x x x x
Total EPT per site 20 27 25 36 32 31 30 24

MRF Madison River Project Baseline Aquatic Surveys Montana Biological Survey June 2017
14
Figure 2a. Average Macroinvertebrate metrics for fall 2016 and spring 2017 sample sites (n=3). Error bars are SE. Blue arrows are tributaries entering the Madison River. Sites arranged in upstream (l) to
downstream orientation. * = significant difference.
0
5,000
10,000
15,000
20,000
Heb 1 Heb 2 HWY 87 Kirby S MAD McAtee Varney Ennis
Tota
l Num
ber p
er m
2 Fall 2016
Spring 2017
*

MRF Madison River Project Baseline Aquatic Surveys Montana Biological Survey June 2017
15
Figure 2b. Macroinvertebrate metrics for fall 2016 and spring 2017 MRF sample sites. Error bars are
SE. Blue arrows are tributaries. Sites arranged in upstream (l) to downstream orientation. * = significant
difference.
*
*
*
*
* *
*
*
*
* *
*

MRF Madison River Project Baseline Aquatic Surveys Montana Biological Survey June 2017
16
Figure 2c. Macroinvertebrate metrics for fall 2016 and spring 2017 sample sites. Error bars are SE.
Arrows are tributaries entering the Madison River. Sites arranged in upstream (l) to downstream
orientation. * = significant difference.
*
* *
*
*
MRF Madison River Project Baseline Aquatic Surveys Montana Biological Survey June 2017
17
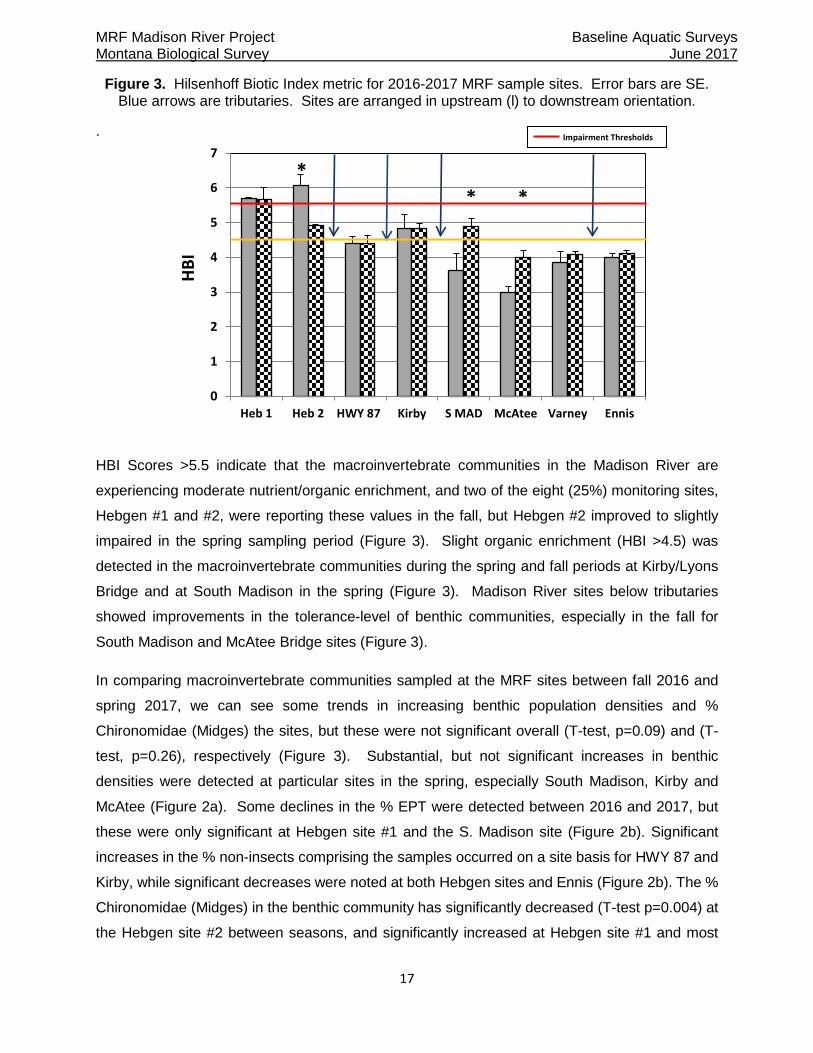
Figure 3. Hilsenhoff Biotic Index metric for 2016-2017 MRF sample sites. Error bars are SE. Blue arrows are tributaries. Sites are arranged in upstream (l) to downstream orientation.
.
HBI Scores >5.5 indicate that the macroinvertebrate communities in the Madison River are
experiencing moderate nutrient/organic enrichment, and two of the eight (25%) monitoring sites,
Hebgen #1 and #2, were reporting these values in the fall, but Hebgen #2 improved to slightly
impaired in the spring sampling period (Figure 3). Slight organic enrichment (HBI >4.5) was
detected in the macroinvertebrate communities during the spring and fall periods at Kirby/Lyons
Bridge and at South Madison in the spring (Figure 3). Madison River sites below tributaries
showed improvements in the tolerance-level of benthic communities, especially in the fall for
South Madison and McAtee Bridge sites (Figure 3).
In comparing macroinvertebrate communities sampled at the MRF sites between fall 2016 and
spring 2017, we can see some trends in increasing benthic population densities and %
Chironomidae (Midges) the sites, but these were not significant overall (T-test, p=0.09) and (T-
test, p=0.26), respectively (Figure 3). Substantial, but not significant increases in benthic
densities were detected at particular sites in the spring, especially South Madison, Kirby and
McAtee (Figure 2a). Some declines in the % EPT were detected between 2016 and 2017, but
these were only significant at Hebgen site #1 and the S. Madison site (Figure 2b). Significant
increases in the % non-insects comprising the samples occurred on a site basis for HWY 87 and
Kirby, while significant decreases were noted at both Hebgen sites and Ennis (Figure 2b). The %
Chironomidae (Midges) in the benthic community has significantly decreased (T-test p=0.004) at
the Hebgen site #2 between seasons, and significantly increased at Hebgen site #1 and most
0
1
2
3
4
5
6
7
Heb 1 Heb 2 HWY 87 Kirby S MAD McAtee Varney Ennis
HBI
Impairment Thresholds
* * *

MRF Madison River Project Baseline Aquatic Surveys Montana Biological Survey June 2017
18
sites downstream from HWY 87 Bridge (Figure 2b). The only significant change in the MMI
between 2016 and 2017 was a significant increase in biological health at the Hebgen site #2
(Figure 2c); likewise we see a significant improvement in the HBI for this site (Figure 3).
Table 3. The three (1,2,3) dominant taxa at each site in the fall 2016 and Spring 2017 seasons.
Order Species
Fall Spr Fall Spr Fall Spr Fall Spr Fall Spr Fall Spr Fall Spr Fall Spr
Ephemeroptera Baetis tricaudatus (BWO) 2 2 1 2 3 1Ephemerella excrucians (PMD) 2
Trichoptera Brachycentrus occidentalis 1 1 1 2Cheumatopsyche spp. 1 3 3Hydropsyche occidentalis 2 2 3Glossosoma sp. 2 3 2 3Lepidostoma sp. 1 1 1 2Helicopsyche borealis 2 3 2 2 1Hydroptila spp. 3
ColeopteraOptioservus quadrimaculatus 3 3
Diptera Cricotopus spp. 1 1 2 1 Cricotopus (Nostococladius) 3
Diamesa spp. 3 Eukiefferiella spp. 1
Pagastia sp 3 Simulium spp. 2 1Gastropoda Fossaria sp. 1
Physella sp. 3Isopoda Caecidotea sp. 3 Oligochaeta Tubificidae 2 Lumbricidae 3
Heb
gen
2
Heb
gen
1
Enni
s
Varn
ey B
r.
McA
tee
Br.
S. M
adis
on
Kirb
y/Ly
ons
HW
Y 87
BR
.
MRF Madison River Project Baseline Aquatic Surveys Montana Biological Survey June 2017
19
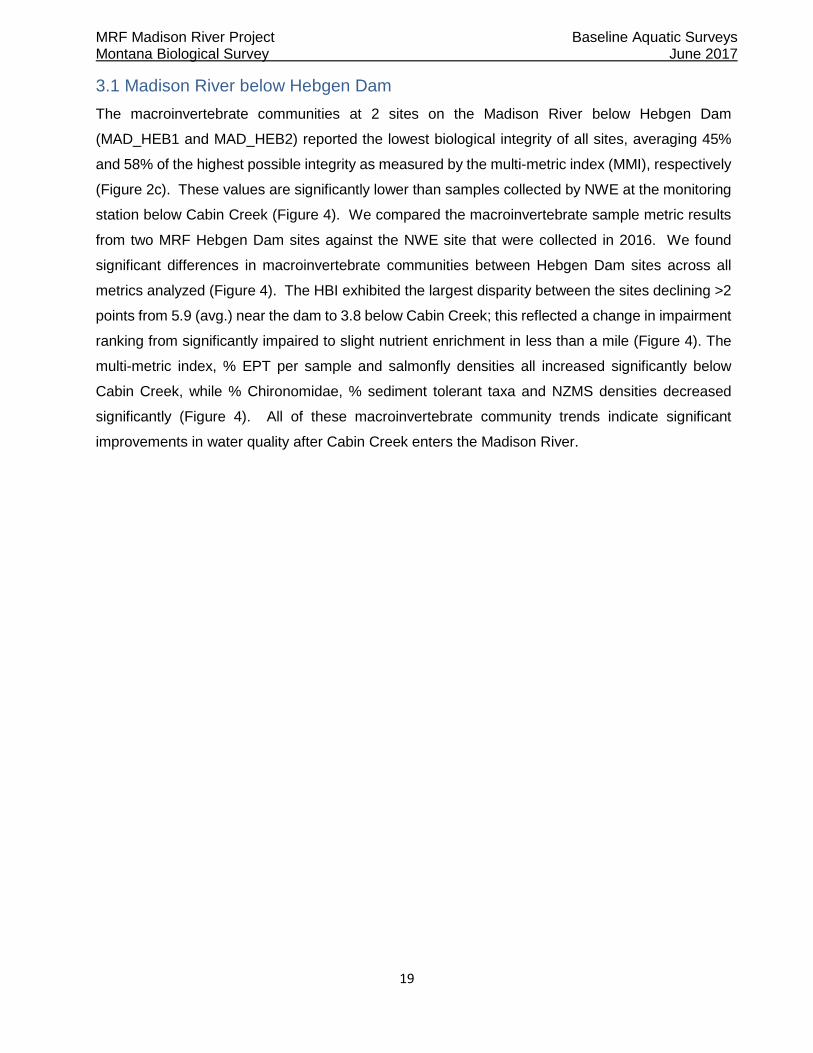
3.1 Madison River below Hebgen Dam The macroinvertebrate communities at 2 sites on the Madison River below Hebgen Dam
(MAD_HEB1 and MAD_HEB2) reported the lowest biological integrity of all sites, averaging 45%
and 58% of the highest possible integrity as measured by the multi-metric index (MMI), respectively
(Figure 2c). These values are significantly lower than samples collected by NWE at the monitoring
station below Cabin Creek (Figure 4). We compared the macroinvertebrate sample metric results
from two MRF Hebgen Dam sites against the NWE site that were collected in 2016. We found
significant differences in macroinvertebrate communities between Hebgen Dam sites across all
metrics analyzed (Figure 4). The HBI exhibited the largest disparity between the sites declining >2
points from 5.9 (avg.) near the dam to 3.8 below Cabin Creek; this reflected a change in impairment
ranking from significantly impaired to slight nutrient enrichment in less than a mile (Figure 4). The
multi-metric index, % EPT per sample and salmonfly densities all increased significantly below
Cabin Creek, while % Chironomidae, % sediment tolerant taxa and NZMS densities decreased
significantly (Figure 4). All of these macroinvertebrate community trends indicate significant
improvements in water quality after Cabin Creek enters the Madison River.
MRF Madison River Project Baseline Aquatic Surveys Montana Biological Survey June 2017
20
Figure 4. Macroinvertebrate parameter comparisons between the MRF Hebgen sites vs. NWE site fall of 2016. Error bars are SE. Redline is the impairment threshold. Blue line is Cabin Creek.
Dominant insect taxa at the MRF Hebgen Dam sites, in order of abundance, were the midges
(Chironomidae; Cricotopus, Pagastia and Cricotopus (Nostococladius), black fly larvae
(Simulium) and aquatic isopods, Caecidotea sp. (Table 3). The snail, Fossaria dominated the
Hebgen site #2 in the fall, but not in the spring (Table 3).

MRF Madison River Project Baseline Aquatic Surveys Montana Biological Survey June 2017
21
3.2 Madison River downstream of the HWY 87 Bridge The Madison River benthic macroinvertebrate densities downstream of the bridge exhibited
significant decreases in May 2017 compared to 2016 (Figure 2a). This 58% density reduction,
the lack of salmonflies and other EPT taxa in the spring samples with a subsequent reduction in
the MMI may have been due to massive ice scour. Dominant insect taxa at the MRF HWY 87
Bridge site, in order of abundance, were the mayflies, BWO’s (Baetis tricaudatus) and Pale
Morning Duns (Ephemerella excrucians, previously Ephemerella inermis/infrequens), and the net-
spinning caddisflies, Cheumatopsyche spp. (Table 3). The aquatic worm, Lumbricidae was a
dominant taxa in the spring, but not in the fall (Table 3) another indicator of some disturbance.
3.3 Madison River upstream of the Lyons Bridge (Kirby) The macroinvertebrate community collected at this cobble/boulder riffle of the Madison River
upstream from Lyons Bridge near Historical Kirby reported one of the highest average EPT taxa
richness scores across all sites (19 taxa) (Figure 2a). Cumulative total EPT for this site was the
highest at 36 species (Table 2), but EPT species other than BWO’s, PMD’s and the net-spinning
caddisflies, Cheumatopsyche spp. & Hydropsyche occidentalis were low in abundance (Table 3).
Photo 3. Hess sampling at the HWY 87 Bridge during the fall sampling period.
MRF Madison River Project Baseline Aquatic Surveys Montana Biological Survey June 2017
22
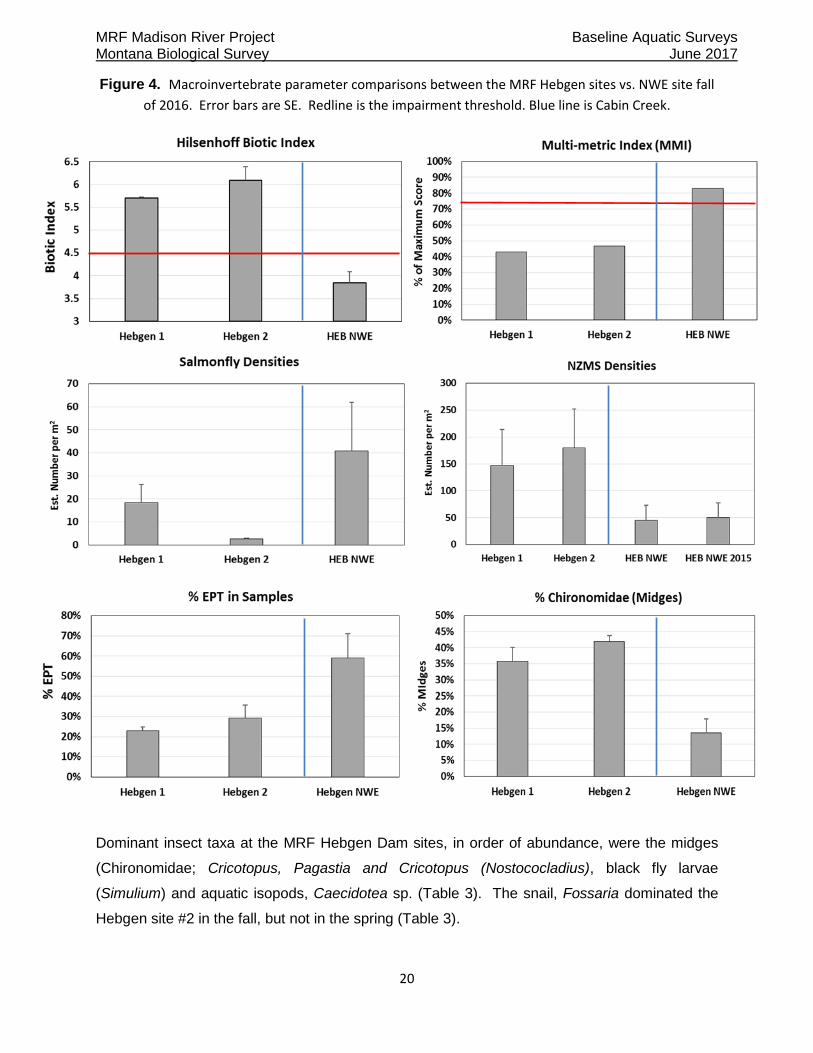
Despite this, the dominant benthic taxa at this site were the midges, Eukiefferiella and Cricotopus,
in the spring and fall (Table 3). Due to the larger substrate in this riffle, the Rocky mountain
sculpin (Cottus bondi) were readily collected in the bug samples and averaged 1.0 and 0.75
individuals per m2, for the fall and spring, respectively.
3.4 Madison River near the South Madison Campground The macroinvertebrate communities collected at the Madison River near the South Madison
Campground (Palisades) (see Photo 1) were the most diverse (averaging 38.5 total taxa) and
also reported one of the highest average EPT taxa richness (avg. EPT taxa = 14.7 species)
(Figure 2b). Cumulative EPT taxa richness for both seasons was the 2nd highest reported at 32
species (Table 2). A significant decline in the % EPT and increase in % Chironomidae was
detected at this site between 2016 and 2017 (Figure 2b), and this had the effect of increasing the
HBI (>4.5) indicating slight organic pollution (Figure 3). No exotic New Zealand mudsnail
(Potamopyrgus antipodarum) was collected here during the 2016 or 2017 seasonal samples.
Photo 4. Monitoring site upstream of the Lyons Bridge during the spring sampling period.
MRF Madison River Project Baseline Aquatic Surveys Montana Biological Survey June 2017
23
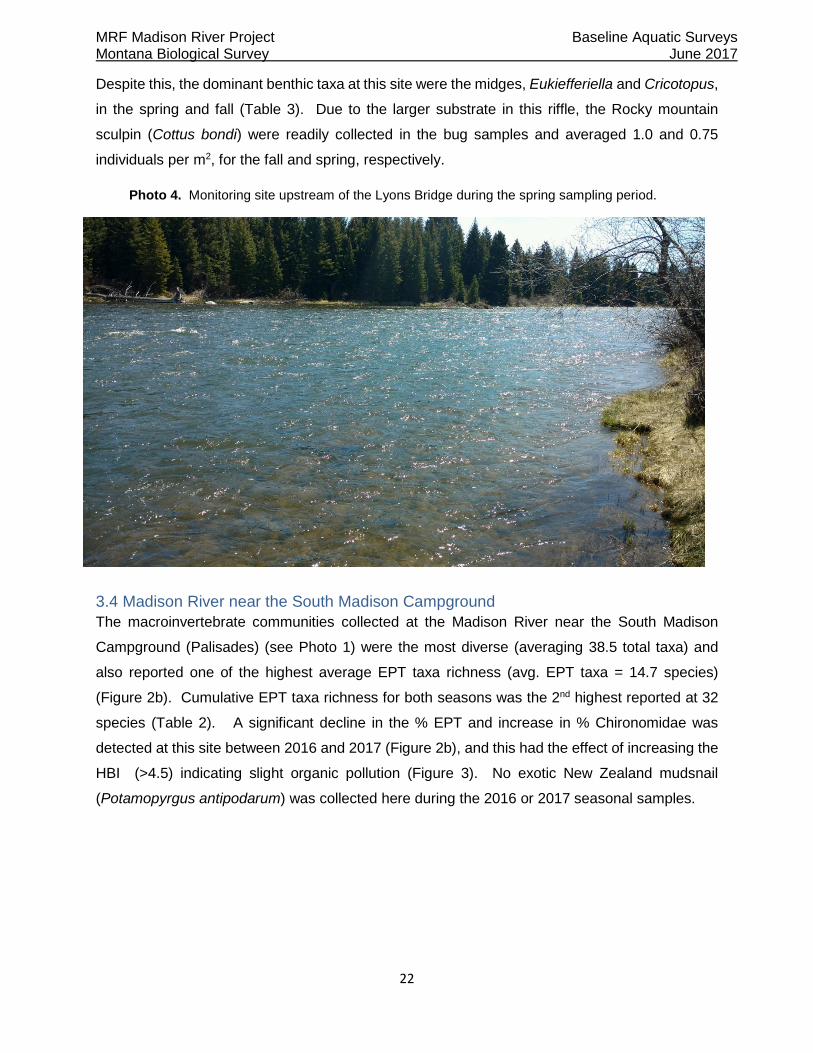
3.5 Madison River at McAtee Bridge The macroinvertebrate communities at Madison River at McAtee Bridge reported one of the
highest possible average MMI scores (91%) and lowest HBI scores of all sites (2.9 in the fall),
indicating a healthy community (Figure 2c and 3). This HBI score increased by almost a point in
the spring 2017 sample to 3.9 largely due to an increase in % Chironomids in the samples (Figure
2c). Dominant insect taxa at the McAtee Bridge site, in order of abundance, were the BWO mayfly,
(Baetis tricaudatus) and the cased-caddisflies, Lepidostoma, Helicopsyche borealis and
Glossosoma (Table 3). The shift from cased-caddis dominance in the fall 2016 to mayfly
dominance in the spring 2017 coupled with significant increases of midges in the samples, may
indicate that this site also experienced significant ice scour disturbance this winter.
3.6 Madison River at Varney Bridge The macroinvertebrate communities at Madison River at Varney Bridge also reported one of the
highest possible average MMI scores (95%) and lowest HBI scores of all sites (3.9), indicating a
healthy community (Figure 2c and 3). Salmonflies attain the highest average densities of all
monitoring sites here (35 per m2) (Figure 2c). Although, there was a significant increase in the
NZMS numbers in the spring 2017 compared to the fall 2016 samples (Figure 2c). Dominant
insect taxa at the Varney Bridge site, in order of abundance, were the mother’s day caddis,
Brachycentrus occidentalis, the net-spinning caddis, Cheumatopsyche and the cased-caddisflies,
Helicopsyche borealis and Glossosoma (Table 3). The fact that there was no shift from the
Photo 5. Monitoring site at the McAtee Bridge during the fall sampling period.
MRF Madison River Project Baseline Aquatic Surveys Montana Biological Survey June 2017
24
Mother’s day caddisfly dominance in the fall 2016 to spring 2017, and the other metrics were
largely stable indicates that this site’s community did not experience significant ice scour
disturbance this winter.
3.7 Madison River at Ennis County Park
The macroinvertebrate communities in the Madison River at Ennis County Park reported one of
the highest possible average MMI scores (93%) and lowest HBI scores of all sites (4.0), indicating
a healthy community (Figure 2c and 3). Salmonflies have lower average densities of all
monitoring sites here (~10 per m2) (Figure 2c), especially compared to the upstream Varney
Bridge site. This Ennis site reported the 2nd highest macroinvertebrate densities of all sites
(~17,000 per m2) and the highest taxa richness in the spring (avg. 42 taxa) (Figure 2a). Dominant
insect taxa at the Ennis County Park site, in order of abundance, were the mother’s day caddis,
Brachycentrus occidentalis, snail-cased-caddisflies, Helicopsyche borealis and the net-spinning
caddis, Hydropsyche occidentalis (Table 3). The fact that there was little shift in dominance from
the Mother’s day caddisfly dominance in the fall 2016 to spring 2017 and the other metrics were
largely stable indicates that this site did not experience significant ice scour disturbance this
winter.
Photo 6. Monitoring site at the Varney Bridge during the fall sampling period.
MRF Madison River Project Baseline Aquatic Surveys Montana Biological Survey June 2017
25
4.0 Conclusions This 2016-2017 dataset represents the first seasonal sampling of the most comprehensive study
evaluating the macroinvertebrate communities in the upper Madison River. It provides a
significant baseline dataset for future monitoring efforts. Very important spatial and temporal
information concerning the macroinvertebrate communities has been generated, including peaks
and troughs of benthic insect density and diversity across the 8 sites, and the important role
tributary streams have on the Madison River insect communities. Additional factors driving
documented changes to macroinvertebrate communities and benthic habitat in this section are
significant winter ice scour events. Tolerance scores of the benthic communities calculated with
the HBI indicate slight to significant organic enrichment across some sites, especially closer to
Hebgen Dam. Warmer summer outflows from Hebgen dam over the last few years (2009-2015)
has caused increases of non-insect taxa, such as sowbugs (Caecidotea), scuds (Gammarus and
Hyalella), aquatic worms (Lumbricidae, Tubificidae), pouch snails (Physella acuta) and the New
Zealand mudsnails. A substantial reduction of EPT taxa and % EPT (compared to the Madison
River averages) in the benthic substrates has occurred at the Hebgen sites 1 and 2 (Figure 2a).
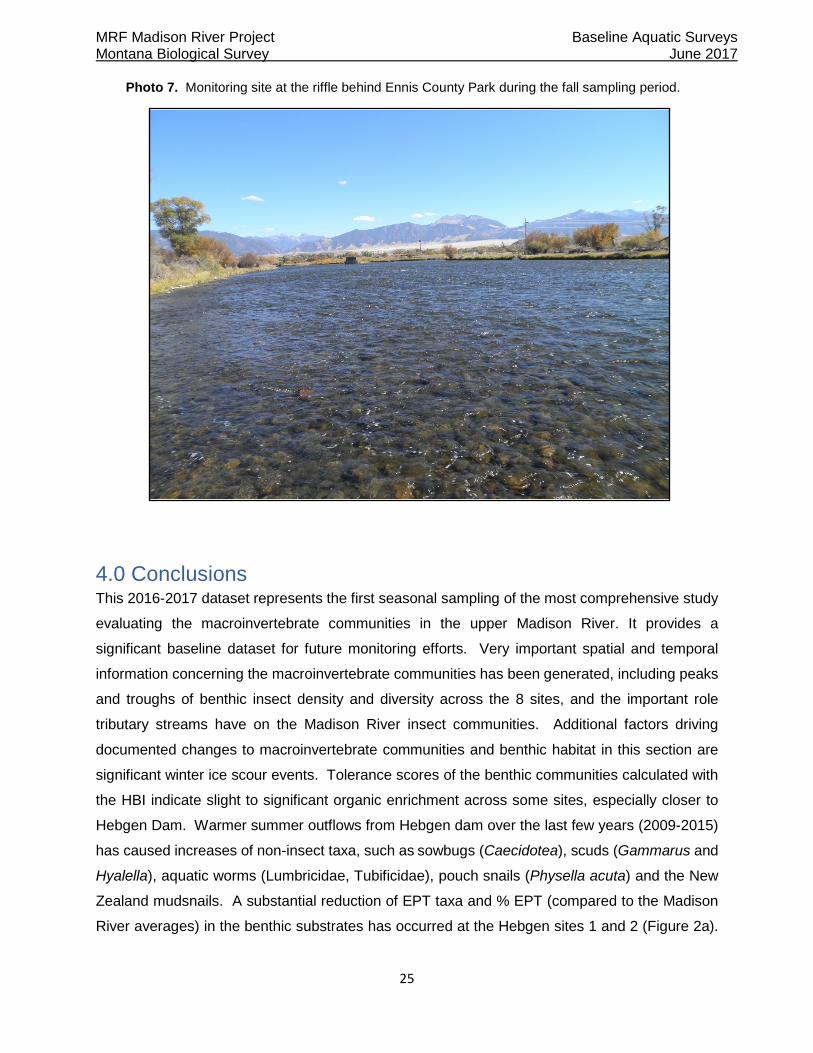
Photo 7. Monitoring site at the riffle behind Ennis County Park during the fall sampling period.
MRF Madison River Project Baseline Aquatic Surveys Montana Biological Survey June 2017
26
Macroinvertebrate communities with the highest total taxa richness, EPT richness and % EPT
were reported at sites least affected by the dam, particularly at the Madison River at Kirby/Lyons,
S. Madison, McAtee Bridge and Varney Bridge. These sites reflect the more natural character of
the river and acquire the original compliment of macroinvertebrates, although some natural
events, such as winter ice scour, can shape the communities seasonally. We postulate that
NZMS population increases, overall decreased biological integrity, increased % non-insects and
decreased % mayfly, stonefly and caddisfly below Hebgen Dam is directly correlated with lower
spring flushing flows and the previous years’ warmer water temperature releases from the dam.
We conclude that cold-water inputs from the tributary, Cabin Creek, is significantly improving the
macroinvertebrate communities at the NWE Hebgen monitoring site compared to those upstream
from its confluence. In general, most macroinvertebrate metrics reflect increases in biological
integrity (stream health) in proportion to the site’s distance from Hebgen Dam.

MRF Madison River Project Baseline Aquatic Surveys Montana Biological Survey June 2017
27
5.0 Literature Cited
Barbour, M., J. Gerritsen, B.D. Snyder, and J.B. Stribling. 1999. Rapid Bioassessment Protocols for Use in Streams and Wadable Rivers: Periphyton, Benthic Macroinvertebrates and Fish, Second Edition. EPA 841-B-99-002. United States Environmental Protection Agency; Office of Water: Washington, D.C.
Jessup, B. 2006. Ecological Data Application System (EDAS) Version MT 3.3.2k A User’s Guide. Tetra Tech, Inc.
Jessup, B. K., C. Hawkins and J. B. Stribling. 2006. Biological indicators of stream condition in Montana using benthic macroinvertebrates. Prepared by Tetra Tech, Inc. for the Department of Environmental Quality, Helena, Montana.
McGuire, D.L. 2016. Madison and Missouri River Macroinvertebrate Biomonitoring: 2015 Data Summary. Report to Northwestern Energy, Butte, Montana.
MDEQ 2012. Sample Collection, Sorting, and Taxonomic Identification of Benthic Macroinvertebrates Standard Operating Procedure. Helena, MT: Montana Department of Environmental Quality. WQPBWQM-012. http://deq.mt.gov/wqinfo/qaprogram/PDF/SOPs/WQPBWQM-009rev2_final_web.pdf
Montana Department of Environmental Quality. 2012b. Water Quality Planning Bureau Field Procedures Manual for Water Quality Assessment Monitoring Version 3.0. Helena, MT
MDEQ 2007. Water Quality and Biological Characteristics of Montana Streams in a Statewide Monitoring Network, 1999-2005. Water Quality Planning Bureau. Helena, MT
Stagliano, D. 2015. UMOWA Baseline Macroinvertebrate Monitoring Report 2015 for the Upper Missouri River, MT. 21 pages + appendices.
Vinson, M.R. and C.P. Hawkins. 1996. Effects of sampling area and subsampling procedure on comparisons of taxa richness among streams. Journal of the North American Benthological Society 15:393-400
MRF Madison River Project Baseline Aquatic Surveys Montana Biological Survey June 2017
28
Appendix A. Macroinvertebate taxa list and abundance.
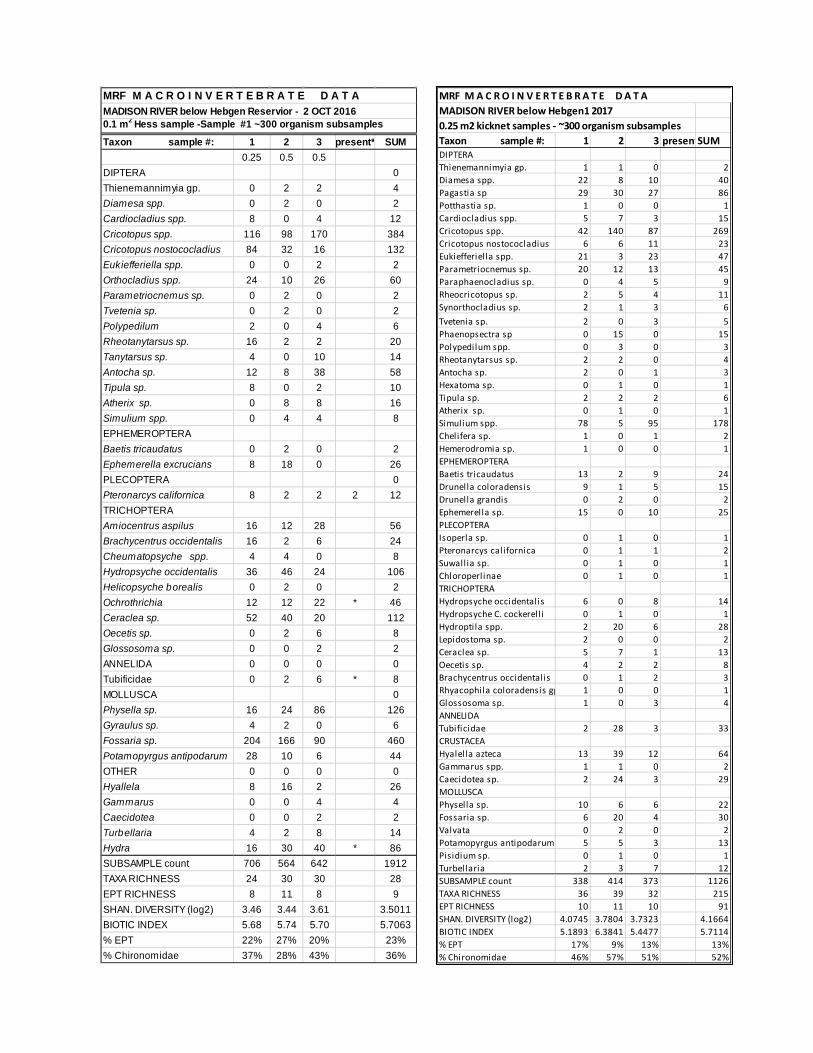
MRF M A C R O I N V E R T E B R A T E D A T A MADISON RIVER below Hebgen1 2017 0.25 m2 kicknet samples - ~300 organism subsamplesTaxon sample #: 1 2 3 presentSUMDIPTERAThienemannimyia gp. 1 1 0 2Diamesa spp. 22 8 10 40Pagastia sp 29 30 27 86Potthastia sp. 1 0 0 1Cardiocladius spp. 5 7 3 15Cricotopus spp. 42 140 87 269Cricotopus nostococladius 6 6 11 23Eukiefferiella spp. 21 3 23 47Parametriocnemus sp. 20 12 13 45Paraphaenocladius sp. 0 4 5 9Rheocricotopus sp. 2 5 4 11Synorthocladius sp. 2 1 3 6Tvetenia sp. 2 0 3 5Phaenopsectra sp 0 15 0 15Polypedilum spp. 0 3 0 3Rheotanytarsus sp. 2 2 0 4Antocha sp. 2 0 1 3Hexatoma sp. 0 1 0 1Tipula sp. 2 2 2 6Atherix sp. 0 1 0 1Simulium spp. 78 5 95 178Chelifera sp. 1 0 1 2Hemerodromia sp. 1 0 0 1EPHEMEROPTERABaetis tricaudatus 13 2 9 24Drunella coloradensis 9 1 5 15Drunella grandis 0 2 0 2Ephemerella sp. 15 0 10 25PLECOPTERAIsoperla sp. 0 1 0 1Pteronarcys californica 0 1 1 2Suwallia sp. 0 1 0 1Chloroperlinae 0 1 0 1TRICHOPTERAHydropsyche occidentalis 6 0 8 14Hydropsyche C. cockerell i 0 1 0 1Hydroptila spp. 2 20 6 28Lepidostoma sp. 2 0 0 2Ceraclea sp. 5 7 1 13Oecetis sp. 4 2 2 8Brachycentrus occidentalis 0 1 2 3Rhyacophila coloradensis gp 1 0 0 1Glossosoma sp. 1 0 3 4ANNELIDATubificidae 2 28 3 33CRUSTACEAHyalella azteca 13 39 12 64Gammarus spp. 1 1 0 2Caecidotea sp. 2 24 3 29MOLLUSCAPhysella sp. 10 6 6 22Fossaria sp. 6 20 4 30Valvata 0 2 0 2Potamopyrgus antipodarum 5 5 3 13Pisidium sp. 0 1 0 1Turbellaria 2 3 7 12SUBSAMPLE count 338 414 373 1126TAXA RICHNESS 36 39 32 215EPT RICHNESS 10 11 10 91SHAN. DIVERSITY (log2) 4.0745 3.7804 3.7323 4.1664BIOTIC INDEX 5.1893 6.3841 5.4477 5.7114% EPT 17% 9% 13% 13%% Chironomidae 46% 57% 51% 52%
0.1 m2 Hess sample -Sample #1 ~300 organism subsamplesTaxon sample #: 1 2 3 present* SUM
0.25 0.5 0.5DIPTERA 0Thienemannimyia gp. 0 2 2 4Diamesa spp. 0 2 0 2Cardiocladius spp. 8 0 4 12Cricotopus spp. 116 98 170 384Cricotopus nostococladius 84 32 16 132Eukiefferiella spp. 0 0 2 2Orthocladius spp. 24 10 26 60Parametriocnemus sp. 0 2 0 2Tvetenia sp. 0 2 0 2Polypedilum 2 0 4 6Rheotanytarsus sp. 16 2 2 20Tanytarsus sp. 4 0 10 14Antocha sp. 12 8 38 58Tipula sp. 8 0 2 10Atherix sp. 0 8 8 16Simulium spp. 0 4 4 8EPHEMEROPTERA Baetis tricaudatus 0 2 0 2Ephemerella excrucians 8 18 0 26PLECOPTERA 0Pteronarcys californica 8 2 2 2 12TRICHOPTERA Amiocentrus aspilus 16 12 28 56Brachycentrus occidentalis 16 2 6 24Cheumatopsyche spp. 4 4 0 8Hydropsyche occidentalis 36 46 24 106Helicopsyche borealis 0 2 0 2Ochrothrichia 12 12 22 * 46Ceraclea sp. 52 40 20 112Oecetis sp. 0 2 6 8Glossosoma sp. 0 0 2 2ANNELIDA 0 0 0 0Tubificidae 0 2 6 * 8MOLLUSCA 0Physella sp. 16 24 86 126Gyraulus sp. 4 2 0 6Fossaria sp. 204 166 90 460Potamopyrgus antipodarum 28 10 6 44OTHER 0 0 0 0Hyallela 8 16 2 26Gammarus 0 0 4 4Caecidotea 0 0 2 2Turbellaria 4 2 8 14Hydra 16 30 40 * 86SUBSAMPLE count 706 564 642 1912TAXA RICHNESS 24 30 30 28EPT RICHNESS 8 11 8 9SHAN. DIVERSITY (log2) 3.46 3.44 3.61 3.5011BIOTIC INDEX 5.68 5.74 5.70 5.7063% EPT 22% 27% 20% 23%% Chironomidae 37% 28% 43% 36%
MRF M A C R O I N V E R T E B R A T E D A T A MADISON RIVER below Hebgen Reservior - 2 OCT 2016

MRF M A C R O I N V E R T E B R A T E D A T A MADISON RIVER below Hebgen2 2017 0.25 m2 kicknet samples - ~300 organism subsamplesTaxon sample 1 2 3 present*SUMDIPTERADiamesa spp. 34 27 12 73Pagastia sp 10 5 13 28Potthastia sp. 1 3 5 9Cardiocladius spp. 5 4 0 9Cricotopus spp. 11 23 14 48Cricotopus nostococlad 1 1 1 3Eukiefferiella spp. 5 4 8 17Paraphaenocladius sp. 12 7 5 24Synorthocladius sp. 0 1 0 1Tvetenia sp. 0 0 2 2Cryptochironomus sp. 1 0 0 1Microtendipes sp 0 0 2 2Rheotanytarsus sp. 14 6 8 28Tanytarsus sp. 6 4 2 12Antocha sp. 1 0 0 1Hexatoma sp. 0 1 0 1Tipula sp. 1 1 1 3Atherix sp. 0 1 1 2Simulium spp. 156 191 274 621EPHEMEROPTERABaetis tricaudatus 72 78 28 178Caudatella heterocauda 5 0 0 5Drunella coloradensis 6 6 0 12Drunella grandis 1 1 0 2Ephemerella sp. 12 11 3 26Rhithrogena sp. 0 3 1 4Paraleptophlebia sp. 0 0 5 5PLECOPTERAClaassenia sabulosa 0 0 1 1Isoperla sp. 2 1 0 3Pteronarcys californica 1 0 1 2Sweltsa sp. 1 0 0 1Suwallia sp. 1 1 0 2Chloroperlinae 0 1 0 1
6TRICHOPTERAHydropsyche occidenta 1 1 1 3Ceratopsyche spp. 0 0 1 1Hydropsyche C. cockere 0 1 0 1Hydroptila spp. 3 1 0 4Ceraclea sp. 1 1 1 3Oecetis sp. 4 1 1 6Amiocentrus sp. 0 1 0 1Rhyacophila coloraden 1 0 0 1Glossosoma sp. 1 1 0 2ANNELIDATubificidae 2 2 4 8CRUSTACEAHyalella azteca 10 5 9 24Caecidotea sp. 4 10 2 16MOLLUSCAGyraulus sp. 2 0 0 2Fossaria sp. 0 2 1 3Stagnicola sp. 0 1 0 1Valvata 0 2 0 2Potamopyrgus antipoda 7 6 2 15SUBSAMPLE count 395 416 410 1221TAXA RICHNESS 34 37 30 218EPT RICHNESS 15 15 10 94SHAN. DIVERSITY (log2) 3.28439 3.00295 2.25995 2.95408BIOTIC INDEX 4.88354 4.92788 4.98537 4.93284% EPT 28% 26% 10% 22%% Chironomidae 25% 20% 18% 21%
Taxon sample #: 1 2 3 present* SUM
1/2 3/8 1/2
DIPTERA
Thienemannimyia gp. 1 0 2 3
Diamesa spp. 8 1 6 15
Pagastia sp 2 6 3 11
Potthastia 5 2 3 10
Cardiocladius spp. 8 11 12 31
Cricotopus spp. 70 85 72 227
Cricotopus nostococladius 1 1 0 2
Cricotopus trifasciata 5 7 2 14
Eukiefferiella spp. 7 4 2 13
Orthocladius spp. 8 10 14 32
Parametriocnemus sp. 1 4 0 5
Paraphaenocladius sp. 1 3 0 4
Dicrotendipes sp. 0 2 0 2
Rheotanytarsus sp. 5 5 12 22
Tanytarsus sp. 3 1 2 6
Antocha sp. 1 1 3 5
Tipula sp. 4 1 1 6
Atherix sp. 4 0 2 6
Simulium spp. 11 3 5 19
Hemerodromia 1 1 0 2
EPHEMEROPTERA
Acentrella sp. 1 4 5 10
Baetis tricaudatus 20 1 16 37
Ephemerella excrucians 10 0 11 21
Tricorythodes minutus 0 0 0 0
PLECOPTERA 0
Pteronarcys californica 2 0 0 2
0
TRICHOPTERA 0
Brachycentrus occidentalis 1 0 0 0 1
Cheumatopsyche spp. 1 0 0 1
Hydropsyche occidentalis 74 33 54 161
Hydroptila 3 5 0 8
Ceraclea sp. 1 2 0 3
Oecetis sp. 0 2 0 2
Rhyacophila brunnea gp. 0 1 0 * 1
Rhyacophila coloradensis gp. 1 0 0 * 1
Glossosoma sp. 5 2 13 20
ANNELIDA 0
Tubi ficidae 1 2 0 * 3
MOLLUSCA
Physella sp. 0 3 0 3
Gyraulus sp. 0 1 0 1
Potamopyrgus antipodarum 4 12 7 23
Pisidium sp. 1 1 0 2
Stagnicola 0 4 0 4
OTHER
Hyalel la 12 44 27 83
Caecidotea 32 49 28 109
Turbel laria 1 0 1 2
Hydra 2 3 2 * 7
SUBSAMPLE count 318 317 305 940
TAXA RICHNESS 37 35 25 32.333
EPT RICHNESS 11 8 5 8
SHAN. DIVERSITY (log2) 3.70 3.50 3.62 3.6099
BIOTIC INDEX 5.76 6.68 5.81 6.0855
% EPT 38% 17% 33% 29%
% Chironomidae 39% 45% 43% 42%
MRF M A C R O I N V E R T E B R A T E D A T A
MADISON RIVER below Hebgen Reservoir #2 2 OCT 2016
0.1 m2 Hess sample -Sample #1 ~300 organism subsamples
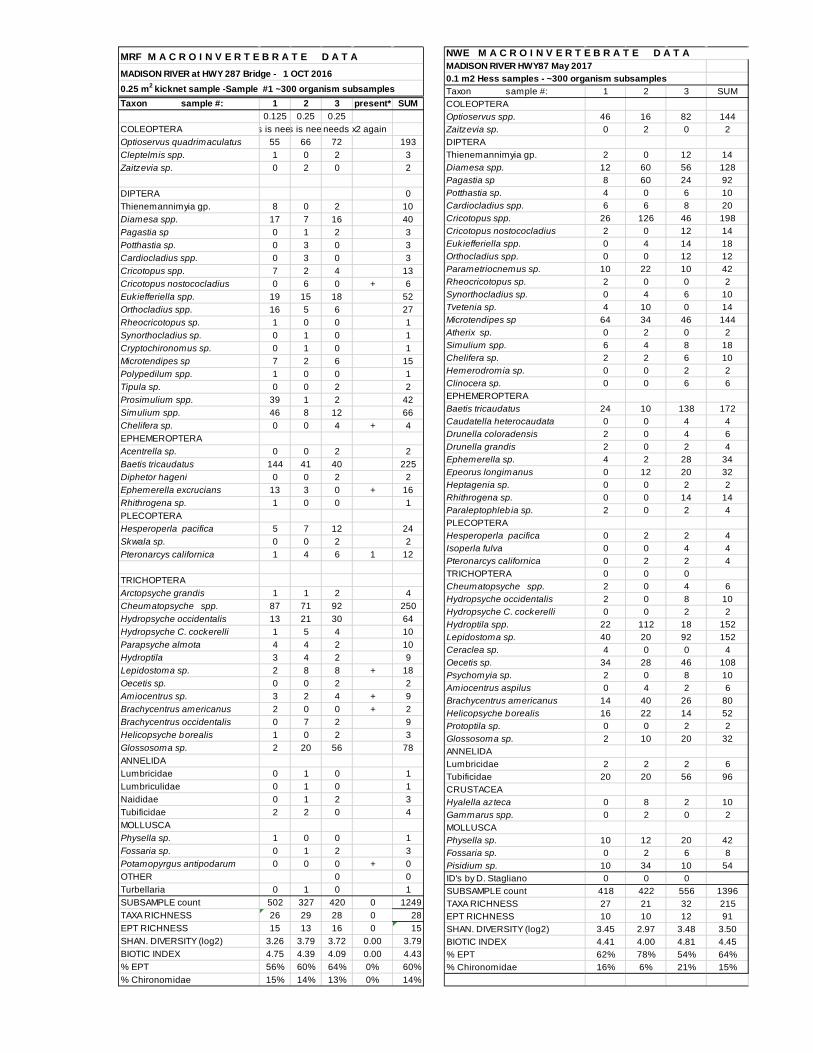
NWE M A C R O I N V E R T E B R A T E D A T A MADISON RIVER HWY87 May 2017 0.1 m2 Hess samples - ~300 organism subsamplesTaxon sample #: 1 2 3 SUMCOLEOPTERAOptioservus spp. 46 16 82 144Zaitzevia sp. 0 2 0 2DIPTERA Thienemannimyia gp. 2 0 12 14Diamesa spp. 12 60 56 128Pagastia sp 8 60 24 92Potthastia sp. 4 0 6 10Cardiocladius spp. 6 6 8 20Cricotopus spp. 26 126 46 198Cricotopus nostococladius 2 0 12 14Eukiefferiella spp. 0 4 14 18Orthocladius spp. 0 0 12 12Parametriocnemus sp. 10 22 10 42Rheocricotopus sp. 2 0 0 2Synorthocladius sp. 0 4 6 10Tvetenia sp. 4 10 0 14Microtendipes sp 64 34 46 144Atherix sp. 0 2 0 2Simulium spp. 6 4 8 18Chelifera sp. 2 2 6 10Hemerodromia sp. 0 0 2 2Clinocera sp. 0 0 6 6EPHEMEROPTERA Baetis tricaudatus 24 10 138 172Caudatella heterocaudata 0 0 4 4Drunella coloradensis 2 0 4 6Drunella grandis 2 0 2 4Ephemerella sp. 4 2 28 34Epeorus longimanus 0 12 20 32Heptagenia sp. 0 0 2 2Rhithrogena sp. 0 0 14 14Paraleptophleb ia sp. 2 0 2 4PLECOPTERA Hesperoperla pacifica 0 2 2 4Isoperla fulva 0 0 4 4Pteronarcys californica 0 2 2 4TRICHOPTERA 0 0 0Cheumatopsyche spp. 2 0 4 6Hydropsyche occidentalis 2 0 8 10Hydropsyche C. cockerelli 0 0 2 2Hydroptila spp. 22 112 18 152Lepidostoma sp. 40 20 92 152Ceraclea sp. 4 0 0 4Oecetis sp. 34 28 46 108Psychomyia sp. 2 0 8 10Amiocentrus aspilus 0 4 2 6Brachycentrus americanus 14 40 26 80Helicopsyche borealis 16 22 14 52Protoptila sp. 0 0 2 2Glossosoma sp. 2 10 20 32ANNELIDA Lumbricidae 2 2 2 6Tubificidae 20 20 56 96CRUSTACEA Hyalella azteca 0 8 2 10Gammarus spp. 0 2 0 2MOLLUSCA Physella sp. 10 12 20 42Fossaria sp. 0 2 6 8Pisidium sp. 10 34 10 54ID's by D. Stagliano 0 0 0SUBSAMPLE count 418 422 556 1396TAXA RICHNESS 27 21 32 215EPT RICHNESS 10 10 12 91SHAN. DIVERSITY (log2) 3.45 2.97 3.48 3.50BIOTIC INDEX 4.41 4.00 4.81 4.45% EPT 62% 78% 54% 64%% Chironomidae 16% 6% 21% 15%
Taxon sample #: 1 2 3 present* SUM0.125 0.25 0.25
COLEOPTERA s is nee s is nee needs x2 againOptioservus quadrimaculatus 55 66 72 193Cleptelmis spp. 1 0 2 3Zaitzevia sp. 0 2 0 2
DIPTERA 0Thienemannimyia gp. 8 0 2 10Diamesa spp. 17 7 16 40Pagastia sp 0 1 2 3Potthastia sp. 0 3 0 3Cardiocladius spp. 0 3 0 3Cricotopus spp. 7 2 4 13Cricotopus nostococladius 0 6 0 + 6Eukiefferiella spp. 19 15 18 52Orthocladius spp. 16 5 6 27Rheocricotopus sp. 1 0 0 1Synorthocladius sp. 0 1 0 1Cryptochironomus sp. 0 1 0 1Microtendipes sp 7 2 6 15Polypedilum spp. 1 0 0 1Tipula sp. 0 0 2 2Prosimulium spp. 39 1 2 42Simulium spp. 46 8 12 66Chelifera sp. 0 0 4 + 4EPHEMEROPTERA Acentrella sp. 0 0 2 2Baetis tricaudatus 144 41 40 225Diphetor hageni 0 0 2 2Ephemerella excrucians 13 3 0 + 16Rhithrogena sp. 1 0 0 1PLECOPTERA Hesperoperla pacifica 5 7 12 24Skwala sp. 0 0 2 2Pteronarcys californica 1 4 6 1 12
TRICHOPTERA Arctopsyche grandis 1 1 2 4Cheumatopsyche spp. 87 71 92 250Hydropsyche occidentalis 13 21 30 64Hydropsyche C. cockerelli 1 5 4 10Parapsyche almota 4 4 2 10Hydroptila 3 4 2 9Lepidostoma sp. 2 8 8 + 18Oecetis sp. 0 0 2 2Amiocentrus sp. 3 2 4 + 9Brachycentrus americanus 2 0 0 + 2Brachycentrus occidentalis 0 7 2 9Helicopsyche borealis 1 0 2 3Glossosoma sp. 2 20 56 78ANNELIDA Lumbricidae 0 1 0 1Lumbriculidae 0 1 0 1Naididae 0 1 2 3Tubificidae 2 2 0 4MOLLUSCAPhysella sp. 1 0 0 1Fossaria sp. 0 1 2 3Potamopyrgus antipodarum 0 0 0 + 0OTHER 0 0Turbellaria 0 1 0 1SUBSAMPLE count 502 327 420 0 1249TAXA RICHNESS 26 29 28 0 28EPT RICHNESS 15 13 16 0 15SHAN. DIVERSITY (log2) 3.26 3.79 3.72 0.00 3.79BIOTIC INDEX 4.75 4.39 4.09 0.00 4.43% EPT 56% 60% 64% 0% 60%% Chironomidae 15% 14% 13% 0% 14%
MRF M A C R O I N V E R T E B R A T E D A T A MADISON RIVER at HWY 287 Bridge - 1 OCT 2016 0.25 m2 kicknet sample -Sample #1 ~300 organism subsamples


NWE M A C R O I N V E R T E B R A T E D A T A MADISON RIVER us McAtee Bridge 2 May 2017 0.25 m2 kicknet samples - ~300 organism subsamplesTaxon sample #: 1 2 3 present*SUM
COLEOPTERAOptioservus spp. 1 1 17 19DIPTERADiamesa spp. 19 3 3 25Pagastia sp 0 2 0 2Cricotopus spp. 4 3 10 17Cricotopus nostococlad 6 8 3 17Eukiefferiella spp. 6 3 2 11Orthocladius spp. 42 22 11 75Parametriocnemus sp. 12 3 4 19Rheocricotopus sp. 1 1 1 3Synorthocladius sp. 1 2 2 5Cryptochironomus sp. 1 0 0 1Microtendipes sp 0 0 2 2Atherix sp. 0 0 2 2Simulium spp. 2 4 2 8EPHEMEROPTERABaetis tricaudatus 101 151 61 313Caudatella heterocauda 1 0 0 1Drunella coloradensis 0 0 4 4Drunella grandis 1 1 0 2Ephemerella sp. 5 15 33 53Epeorus albertae 1 0 3 4Heptagenia sp. 0 0 1 1Rhithrogena sp. 0 3 1 4Paraleptophlebia sp. 0 0 5 5PLECOPTERAClaassenia sabulosa 0 0 1 1Isoperla sp. 2 1 0 3Pteronarcys californica 1 0 1 3Sweltsa sp. 1 0 0 1Suwallia sp. 1 1 0 2Chloroperlinae 0 1 0 1TRICHOPTERAHydropsyche occidental 1 1 2 4Hydropsyche C. cockere 0 0 2 2Lepidostoma sp. 67 53 100 220Ceraclea sp. 1 0 1 2Oecetis sp. 5 3 5 13Psychomyia sp. 0 0 3 3Brachycentrus occident 5 2 25 32Rhyacophila brunnea gp 0 1 0 1Rhyacophila coloradens 1 0 0 1Helicopsyche borealis 18 34 64 116Glossosoma sp. 3 1 0 4
ANNELIDALumbriculidae 11 5 11 27Tubificidae 22 3 4 29MOLLUSCAPhysella sp. 10 27 23 60Gyraulus sp. 0 1 0 1Fossaria sp. 5 2 1 8Stagnicola sp. 0 1 0 1Radix sp. 0 0 7 7Pisidium sp. 5 2 30 37
SUBSAMPLE count 363 361 447 1172
TAXA RICHNESS 33 32 35 215
EPT RICHNESS 17 14 17 91
SHAN. DIVERSITY (log2) 3.60196 3.11763 3.8317 3.7819
BIOTIC INDEX 4.30854 4.02493 3.63311 3.9616
% EPT 59% 74% 70% 68%
% Chironomidae 25% 13% 9% 15%
Taxon sample #: 1 2 3 present* SUM0.25 0.50 0.50
COLEOPTERAOptioservus spp. 19 60 14 93Zaitzevia 1 2 0 3DIPTERA Cardiocladius spp. 0 4 2 6Cricotopus nostococladius 5 34 20 + 59Cricotopus spp. 1 6 6 13Diamesa spp. 1 2 2 5Eukiefferiella spp. 1 20 2 23Microtendipes sp 11 0 2 13Polypedilum spp. 0 2 2 4Potthastia sp. 0 2 0 2Thienemannimyia gp. 1 0 0 1Hemerodromia sp. 0 0 2 2Simulium spp. 1 4 0 5EPHEMEROPTERA 0 0 Acentrella sp. 0 0 2 2Baetis tricaudatus 15 4 18 37Ephemerella excrucians 3 0 0 + 3Heptagenia sp. 7 0 0 7Rhithrogena sp. 0 6 8 14Paraleptophleb ia sp. 4 0 0 4Tricorythodes minutus 63 0 0 63PLECOPTERA Claassenia sabulosa 0 10 0 10Hesperoperla pacifica 0 0 2 2Pteronarcys californica 1 6 0 0 7Paraperla 0 2 0 2TRICHOPTERA Arctopsyche grandis 1 4 0 5Cheumatopsyche spp. 0 4 0 4Hydropsyche occidentalis 12 32 8 52Hydropsyche C. cockerelli 0 2 2 4Lepidostoma sp. 123 100 46 + 269Ceraclea sp. 3 2 0 + 5Oecetis sp. 2 0 4 6Psychomyia sp. 3 2 0 5Rhyacophila coloradensis gr. 1 6 0 7Brachycentrus occidentalis 33 46 82 161Helicopsyche borealis 98 18 24 140Glossosoma sp. 8 100 94 202ANNELIDA Lumbricidae 2 24 10 36Lumbriculidae 24 12 18 54Tubificidae 3 6 2 11Helobdella stagnalis 2 0 0 2CRUSTACEA Gammarus 0 4 0 4MOLLUSCA Physella sp. 10 8 4 22Fossaria sp. 6 6 2 14Potamopyrgus antipodarum 0 0 0 + 0Pisidium sp. 10 10 4 24Sphaerium 15 2 4 21OTHER Turbellaria 4 8 6 18SUBSAMPLE count 496 570 414 0 1480TAXA RICHNESS 36 38 29 0 209EPT RICHNESS 17 17 12 0 91SHAN. DIVERSITY (log2) 3.69 4.11 3.67 0.00 4.16BIOTIC INDEX 3.27 3.06 2.67 0.00 3.08% EPT 76% 61% 71% 0% 71%% Chironomidae 4% 13% 9% 0% 8%
MRF M A C R O I N V E R T E B R A T E D A T A MADISON RIVER at McAtee Bridge - 28 SEPT 2016 0.25 m2 kicknet sample -Sample #1 ~300 organism subsamples
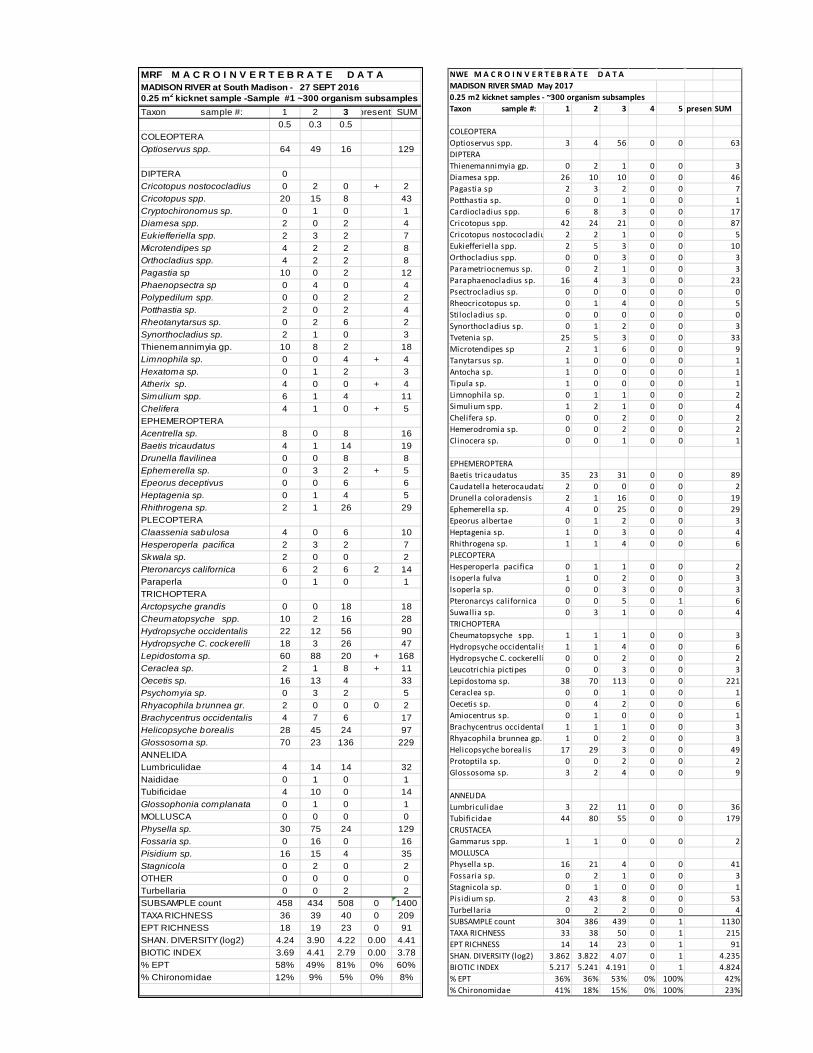
NWE M A C R O I N V E R T E B R A T E D A T A MADISON RIVER SMAD May 2017 0.25 m2 kicknet samples - ~300 organism subsamplesTaxon sample #: 1 2 3 4 5 presentSUM
COLEOPTERAOptioservus spp. 3 4 56 0 0 63DIPTERAThienemannimyia gp. 0 2 1 0 0 3Diamesa spp. 26 10 10 0 0 46Pagastia sp 2 3 2 0 0 7Potthastia sp. 0 0 1 0 0 1Cardiocladius spp. 6 8 3 0 0 17Cricotopus spp. 42 24 21 0 0 87Cricotopus nostococladiu 2 2 1 0 0 5Eukiefferiella spp. 2 5 3 0 0 10Orthocladius spp. 0 0 3 0 0 3Parametriocnemus sp. 0 2 1 0 0 3Paraphaenocladius sp. 16 4 3 0 0 23Psectrocladius sp. 0 0 0 0 0 0Rheocricotopus sp. 0 1 4 0 0 5Stilocladius sp. 0 0 0 0 0 0Synorthocladius sp. 0 1 2 0 0 3Tvetenia sp. 25 5 3 0 0 33Microtendipes sp 2 1 6 0 0 9Tanytarsus sp. 1 0 0 0 0 1Antocha sp. 1 0 0 0 0 1Tipula sp. 1 0 0 0 0 1Limnophila sp. 0 1 1 0 0 2Simulium spp. 1 2 1 0 0 4Chelifera sp. 0 0 2 0 0 2Hemerodromia sp. 0 0 2 0 0 2Clinocera sp. 0 0 1 0 0 1
EPHEMEROPTERABaetis tricaudatus 35 23 31 0 0 89Caudatella heterocaudata 2 0 0 0 0 2Drunella coloradensis 2 1 16 0 0 19Ephemerella sp. 4 0 25 0 0 29Epeorus albertae 0 1 2 0 0 3Heptagenia sp. 1 0 3 0 0 4Rhithrogena sp. 1 1 4 0 0 6PLECOPTERAHesperoperla pacifica 0 1 1 0 0 2Isoperla fulva 1 0 2 0 0 3Isoperla sp. 0 0 3 0 0 3Pteronarcys californica 0 0 5 0 1 6Suwallia sp. 0 3 1 0 0 4TRICHOPTERACheumatopsyche spp. 1 1 1 0 0 3Hydropsyche occidentalis 1 1 4 0 0 6Hydropsyche C. cockerell i 0 0 2 0 0 2Leucotrichia pictipes 0 0 3 0 0 3Lepidostoma sp. 38 70 113 0 0 221Ceraclea sp. 0 0 1 0 0 1Oecetis sp. 0 4 2 0 0 6Amiocentrus sp. 0 1 0 0 0 1Brachycentrus occidental 1 1 1 0 0 3Rhyacophila brunnea gp. 1 0 2 0 0 3Helicopsyche borealis 17 29 3 0 0 49Protoptila sp. 0 0 2 0 0 2Glossosoma sp. 3 2 4 0 0 9
ANNELIDALumbriculidae 3 22 11 0 0 36Tubificidae 44 80 55 0 0 179CRUSTACEAGammarus spp. 1 1 0 0 0 2MOLLUSCAPhysella sp. 16 21 4 0 0 41Fossaria sp. 0 2 1 0 0 3Stagnicola sp. 0 1 0 0 0 1Pisidium sp. 2 43 8 0 0 53Turbellaria 0 2 2 0 0 4SUBSAMPLE count 304 386 439 0 1 1130TAXA RICHNESS 33 38 50 0 1 215EPT RICHNESS 14 14 23 0 1 91SHAN. DIVERSITY (log2) 3.862 3.822 4.07 0 1 4.235BIOTIC INDEX 5.217 5.241 4.191 0 1 4.824% EPT 36% 36% 53% 0% 100% 42%% Chironomidae 41% 18% 15% 0% 100% 23%
Taxon sample #: 1 2 3 present* SUM0.5 0.3 0.5
COLEOPTERAOptioservus spp. 64 49 16 129
DIPTERA 0 Cricotopus nostococladius 0 2 0 + 2Cricotopus spp. 20 15 8 43Cryptochironomus sp. 0 1 0 1Diamesa spp. 2 0 2 4Eukiefferiella spp. 2 3 2 7Microtendipes sp 4 2 2 8Orthocladius spp. 4 2 2 8Pagastia sp 10 0 2 12Phaenopsectra sp 0 4 0 4Polypedilum spp. 0 0 2 2Potthastia sp. 2 0 2 4Rheotanytarsus sp. 0 2 6 2Synorthocladius sp. 2 1 0 3Thienemannimyia gp. 10 8 2 18Limnophila sp. 0 0 4 + 4Hexatoma sp. 0 1 2 3Atherix sp. 4 0 0 + 4Simulium spp. 6 1 4 11Chelifera 4 1 0 + 5EPHEMEROPTERA Acentrella sp. 8 0 8 16Baetis tricaudatus 4 1 14 19Drunella flavilinea 0 0 8 8Ephemerella sp. 0 3 2 + 5Epeorus deceptivus 0 0 6 6Heptagenia sp. 0 1 4 5Rhithrogena sp. 2 1 26 29PLECOPTERA Claassenia sabulosa 4 0 6 10Hesperoperla pacifica 2 3 2 7Skwala sp. 2 0 0 2Pteronarcys californica 6 2 6 2 14Paraperla 0 1 0 1TRICHOPTERA Arctopsyche grandis 0 0 18 18Cheumatopsyche spp. 10 2 16 28Hydropsyche occidentalis 22 12 56 90Hydropsyche C. cockerelli 18 3 26 47Lepidostoma sp. 60 88 20 + 168Ceraclea sp. 2 1 8 + 11Oecetis sp. 16 13 4 33Psychomyia sp. 0 3 2 5Rhyacophila brunnea gr. 2 0 0 0 2Brachycentrus occidentalis 4 7 6 17Helicopsyche borealis 28 45 24 97Glossosoma sp. 70 23 136 229ANNELIDA Lumbriculidae 4 14 14 32Naididae 0 1 0 1Tubificidae 4 10 0 14Glossophonia complanata 0 1 0 1MOLLUSCA 0 0 0 0Physella sp. 30 75 24 129Fossaria sp. 0 16 0 16Pisidium sp. 16 15 4 35Stagnicola 0 2 0 2OTHER 0 0 0 0Turbellaria 0 0 2 2SUBSAMPLE count 458 434 508 0 1400TAXA RICHNESS 36 39 40 0 209EPT RICHNESS 18 19 23 0 91SHAN. DIVERSITY (log2) 4.24 3.90 4.22 0.00 4.41BIOTIC INDEX 3.69 4.41 2.79 0.00 3.78% EPT 58% 49% 81% 0% 60%% Chironomidae 12% 9% 5% 0% 8%
MRF M A C R O I N V E R T E B R A T E D A T A MADISON RIVER at South Madison - 27 SEPT 2016 0.25 m2 kicknet sample -Sample #1 ~300 organism subsamples

MRF M A C R O I N V E R T E B R A T E D A T A MADISON RIVER Varney Spring 2017 0.25 m2 kicknet samples - ~300 organism subsamplesTaxon sample #: 1 2 3 present* SUM
COLEOPTERAOptioservus spp. 12 6 9 27Zai tzevia sp. 1 3 2 6
DIPTERAThienemannimyia gp. 0 2 1 3Diamesa spp. 3 4 9 16Potthastia sp. 1 0 0 1Cricotopus spp. 7 10 14 31Cricotopus nostococladius 11 18 9 38Eukiefferiel la spp. 2 3 1 6Paraphaenocladius sp. 12 7 5 24Rheocricotopus sp. 2 1 0 3Synorthocladius sp. 0 1 0 1Tvetenia sp. 0 0 2 2Microtendipes sp 2 1 2 5Polypedi lum spp. 2 2 2 6Tanytarsus sp. 1 0 0 1Antocha sp. 1 0 0 1Tipula sp. 1 0 0 1Simul ium spp. 4 2 1 7Chel i fera sp. 0 1 0 1Hemerodromia sp. 1 0 0 1
EPHEMEROPTERAAcentrel la sp. 3 4 1 8Baetis tricaudatus 5 11 7 23Ephemerel la sp. 7 11 15 33Rhithrogena sp. 2 3 1 6Para leptophlebia sp. 0 2 5 7
PLECOPTERAClaassenia sabulosa 0 0 1 1Hesperoperla paci fica 2 3 1 6Pteronarcys ca l i fornica 3 3 2 17Sweltsa sp. 1 2 2 5Suwal l ia sp. 1 1 0 2Chloroperl inae 0 1 0 1
TRICHOPTERAArctopsyche grandis 2 2 0 4Cheumatopsyche spp. 25 33 29 87Hydropsyche occidenta l i s 15 22 11 48Hydropsyche C. cockerel l i 2 4 7 13Hydropti la spp. 1 1 0 2Lepidostoma sp. 7 12 5 24Ceraclea sp. 2 1 1 4Nectopsyche sp. 0 0 0 0Oecetis sp. 12 7 8 27Psychomyia sp. 2 3 0 5Amiocentrus sp. 0 1 0 1Brachycentrus occidenta l i s 67 44 53 164Rhyacophi la brunnea gp. 1 0 0 1Hel icopsyche boreal i s 25 33 40 98Glossosoma sp. 21 15 11 47
ANNELIDALumbricul idae 12 22 17 51Tubi ficidae 5 4 1 10CRUSTACEAGammarus spp. 1 1 0 2MOLLUSCAPhysel la sp. 21 16 33 70Fossaria sp. 0 2 1 3Stagnicola sp. 0 1 0 1Potamopyrgus antipodarum 1 1 2 4OTHER Turbel laria 0 2 0 2SUBSAMPLE count 309 329 311 958TAXA RICHNESS 42 45 35 215EPT RICHNESS 21 23 18 91SHAN. DIVERSITY (log2) 4.34 4.56 4.17 4.47BIOTIC INDEX 3.96 4.01 4.24 4.05% EPT 67% 67% 64% 66%% Chironomidae 14% 15% 14% 14%
Taxon sample #: 1 2 3 present* SUM0.5 0.3 0.5
COLEOPTERAOptioservus spp. 10 36 20 66Zaitzevia 4 0 4 8DIPTERA Cricotopus nostococladius 16 8 8 + 32Cricotopus spp. 4 6 2 12Diamesa spp. 2 2 2 6Eukiefferiella spp. 2 2 0 4Microtendipes sp 2 0 4 6Polypedilum spp. 0 0 2 2Rheocricotopus sp. 2 0 0 2Thienemannimyia gp. 2 2 0 4Hemerodromia sp. 0 0 2 2Simulium spp. 2 0 0 2Chelifera 0 2 0 + 2EPHEMEROPTERA Acentrella sp. 2 0 2 4Baetis tricaudatus 4 0 0 4Ephemerella excrucians 8 6 8 + 22Rhithrogena sp. 2 2 0 4Paraleptophleb ia sp. 0 6 0 6PLECOPTERA 0 0 0 0Hesperoperla pacifica 0 6 2 8Pteronarcys californica 8 4 10 2 22Sweltsa 2 0 0 2Paraperla 0 2 0 2TRICHOPTERA Arctopsyche grandis 0 0 8 8Cheumatopsyche spp. 40 18 90 148Hydropsyche occidentalis 18 16 50 84Hydropsyche C. cockerelli 0 6 16 22Leucotrichia pictipes 0 0 2 2Lepidostoma sp. 2 10 0 + 12Neophylax 2 0 0 + 2Ceraclea sp. 6 2 0 + 8Oecetis sp. 4 36 2 42Parapsyche elsis 2 2 0 4Psychomyia sp. 0 2 2 4Brachycentrus occidentalis 84 110 88 282Helicopsyche borealis 30 58 10 98Glossosoma sp. 46 28 90 164ANNELIDA Lumbriculidae 32 20 4 56Tubificidae 2 14 0 16CRUSTACEA Gammarus 0 4 0 4MOLLUSCA Physella sp. 50 70 24 144Fossaria sp. 0 6 0 6Potamopyrgus antipodarum 2 2 0 + 4Pisidium sp. 2 10 0 12OTHER Turbellaria 4 4 2 10SUBSAMPLE count 400 504 466 0 1370TAXA RICHNESS 30 33 27 0 30EPT RICHNESS 14 17 15 0 15.333SHAN. DIVERSITY (log2) 3.89 3.96 3.51 0.00 3.7864BIOTIC INDEX 3.91 4.35 3.33 0.00 3.87% EPT 62% 62% 83% 0% 69%% Chironomidae 8% 4% 4% 0% 5%
NWE M A C R O I N V E R T E B R A T E D A T A MADISON RIVER at Varney Bridge - 27 SEPT 2016 0.25 m2 kicknet sample -Sample #1 ~300 organism subsamples

NWE M A C R O I N V E R T E B R A T E D A T A MADISON RIVER Ennis May 2017 0.1 m2 HESS samples - ~300 organism subsamplesTaxon sample #: 1 2 3 present*SUMCOLEOPTERAOptioservus spp. 33 35 42 110Zaitzevia sp. 25 16 19 60DIPTERADiamesa spp. 11 15 12 38Potthastia sp. 1 0 0 1Cardiocladius spp. 4 7 3 14Cricotopus spp. 22 17 14 53Cricotopus nostococladius 6 11 9 26Eukiefferiella spp. 2 3 5 10Orthocladius spp. 1 2 1 4Paraphaenocladius sp. 1 2 0 3Tvetenia sp. 4 5 2 11Polypedilum spp. 2 1 2 5Rheotanytarsus sp. 2 3 1 6Simulium spp. 8 9 5 22Hemerodromia sp. 1 0 0 1EPHEMEROPTERAAcentrella sp. 5 4 0 9Baetis tricaudatus 22 11 15 48Diphetor hageni 15 11 22 48Attenella margarita 3 6 5 14Ephemerella sp. 7 11 15 33Rhithrogena sp. 2 5 1 8Paraleptophlebia sp. 2 2 7 11LEPIDOPTERAPetrophila sp. 26 32 12 70PLECOPTERAClaassenia sabulosa 0 1 1 2Hesperoperla pacifica 0 0 1 1Pteronarcys californica 0 1 2 3TRICHOPTERAArctopsyche grandis 2 2 4 8Cheumatopsyche spp. 44 33 29 106Hydropsyche occidentalis 41 48 31 120Hydropsyche C. cockerell i 2 4 5 11Hydroptila spp. 1 1 0 2Lepidostoma sp. 12 22 30 64Ceraclea sp. 0 0 1 1Oecetis sp. 11 8 15 34Psychomyia sp. 1 1 5 7Amiocentrus sp. 0 1 0 1Brachycentrus occidentalis 47 58 64 169Rhyacophila brunnea gp. 1 0 0 1Helicopsyche borealis 66 75 55 196Glossosoma sp. 11 12 7 30ANNELIDALumbricidae 2 2 5 9Lumbriculidae 17 12 17 46Tubificidae 3 4 1 8CRUSTACEAGammarus spp. 1 1 0 2MOLLUSCAPhysella sp. 4 8 1 13Ferrissia sp. 20 12 6 38Fossaria sp. 0 0 1 1Pisidium sp. 6 7 2 15OTHER 0 0 0Turbellaria 21 12 35 68SUBSAMPLE count 519 533 508 1562TAXA RICHNESS 44 43 40 215EPT RICHNESS 19 21 19 91SHAN. DIVERSITY (log2) 4.5483 4.5673 4.4909 4.609BIOTIC INDEX 4.2794 4.1201 3.9567 4.1172% EPT 57% 59% 62% 59%% Chironomidae 11% 12% 10% 11%
Taxon sample #: 1 2 3 resent SUM0.25 0.25 0.25
COLEOPTERAOptioservus spp. 52 22 36 110Zaitzevia sp. 28 13 14 55
DIPTERADiamesa spp. 3 2 1 6Cricotopus spp. 8 5 5 18Cricotopus nostococladius 3 6 5 14Eukiefferiella spp. 4 4 4 12Cardiocladius sp. 1 6 4 11Orthocladius spp. 3 0 1 4Tvetenia sp. 2 1 0 3Polypedilum spp. 1 0 0 1Rheotanytarsus sp. 0 0 1 1Simulium spp. 4 1 2 7EPHEMEROPTERA 0Acentrella sp. 3 2 1 6Baetis tricaudatus 10 6 2 18Diphetor hageni 29 1 0 30Attenella margarita 4 2 5 11Ephemerella 7 1 9 + 17Rhithrogena sp. 0 4 1 5Paraleptophlebia sp. 3 1 4 + 8LEPIDOPTERA Petrophila sp. 35 32 9 76
PLECOPTERA Claassenia sabulosa 0 0 1 1Hesperoperla pacifica 0 0 0 + 0Skwala sp. 0 0 0 0Pteronarcys californica 2 1 2 2 7Kathroperla sp. 0 0 0 + 0
0TRICHOPTERA 0Arctopsyche grandis 2 1 1 4Cheumatopsyche spp. 34 38 20 92Hydropsyche occidentalis 37 40 45 122Hydropsyche C. cockerelli 2 3 1 6Lepidostoma sp. 7 12 34 53Ceraclea sp. 0 0 0 0Oecetis sp. 10 5 12 27Psychomyia sp. 2 1 1 4Brachycentrus occidentalis 79 48 78 205Helicopsyche borealis 63 30 81 174Glossosoma sp. 5 5 2 12ANNELIDA Lumbriculidae 48 5 21 74Lumbricidae 6 1 3 10Tubificidae 0 0 1 1MOLLUSCA Physella sp. 2 0 3 5Pisidium sp. 10 0 2 12Ferrissia 15 9 20 44OTHER Gammarus 1 0 1 2Turbellaria 36 14 32 82SUBSAMPLE count 565 321 464 0 1350TAXA RICHNESS 38 31 36 0 35.0EPT RICHNESS 17 17 18 0 17.3SHAN. DIVERSITY (log2) 4.26 4.03 3.97 0.00 4.09BIOTIC INDEX 4.15 4.05 3.77 0.00 3.99% EPT 53% 62% 65% 0% 60%% Chironomidae 5% 7% 5% 0% 6%
0.1 m2 Hess sample - ~300 organism subsamples
MADISON RIVER at Ennis CG - 28 SEP 2016 NWE M A C R O I N V E R T E B R A T E D A T A


MRF Madison River Project Baseline Aquatic Surveys Montana Biological Survey June 2017
29
Appendix B. Site Habitat and Physical Conditions
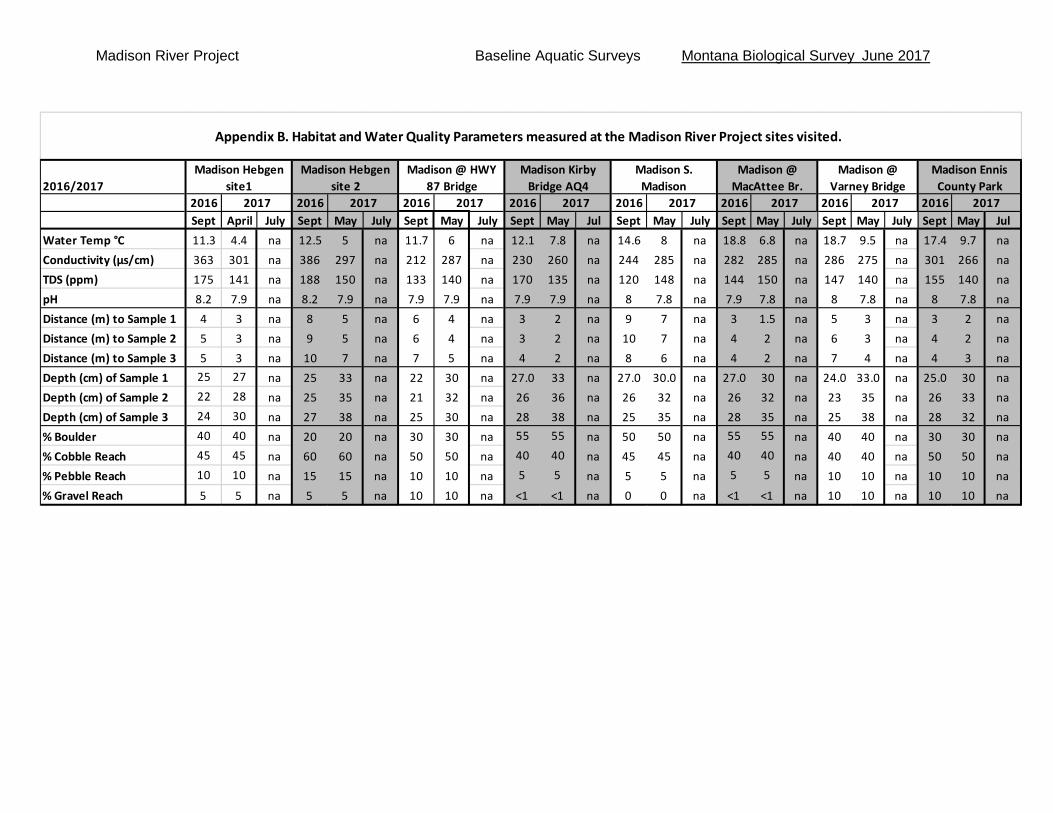
Madison River Project Baseline Aquatic Surveys Montana Biological Survey June 2017
2016/20172016 2016 2016 2016 2016 2016 2016 2016Sept April July Sept May July Sept May July Sept May Jul Sept May July Sept May July Sept May July Sept May Jul
Water Temp °C 11.3 4.4 na 12.5 5 na 11.7 6 na 12.1 7.8 na 14.6 8 na 18.8 6.8 na 18.7 9.5 na 17.4 9.7 naConductivity (µs/cm) 363 301 na 386 297 na 212 287 na 230 260 na 244 285 na 282 285 na 286 275 na 301 266 naTDS (ppm) 175 141 na 188 150 na 133 140 na 170 135 na 120 148 na 144 150 na 147 140 na 155 140 napH 8.2 7.9 na 8.2 7.9 na 7.9 7.9 na 7.9 7.9 na 8 7.8 na 7.9 7.8 na 8 7.8 na 8 7.8 naDistance (m) to Sample 1 4 3 na 8 5 na 6 4 na 3 2 na 9 7 na 3 1.5 na 5 3 na 3 2 naDistance (m) to Sample 2 5 3 na 9 5 na 6 4 na 3 2 na 10 7 na 4 2 na 6 3 na 4 2 naDistance (m) to Sample 3 5 3 na 10 7 na 7 5 na 4 2 na 8 6 na 4 2 na 7 4 na 4 3 naDepth (cm) of Sample 1 25 27 na 25 33 na 22 30 na 27.0 33 na 27.0 30.0 na 27.0 30 na 24.0 33.0 na 25.0 30 naDepth (cm) of Sample 2 22 28 na 25 35 na 21 32 na 26 36 na 26 32 na 26 32 na 23 35 na 26 33 naDepth (cm) of Sample 3 24 30 na 27 38 na 25 30 na 28 38 na 25 35 na 28 35 na 25 38 na 28 32 na% Boulder 40 40 na 20 20 na 30 30 na 55 55 na 50 50 na 55 55 na 40 40 na 30 30 na% Cobble Reach 45 45 na 60 60 na 50 50 na 40 40 na 45 45 na 40 40 na 40 40 na 50 50 na% Pebble Reach 10 10 na 15 15 na 10 10 na 5 5 na 5 5 na 5 5 na 10 10 na 10 10 na% Gravel Reach 5 5 na 5 5 na 10 10 na <1 <1 na 0 0 na <1 <1 na 10 10 na 10 10 na
Appendix B. Habitat and Water Quality Parameters measured at the Madison River Project sites visited.
2017 20172017 2017 2017
Madison @ MacAttee Br.
Madison @ Varney Bridge
Madison Kirby Bridge AQ4
Madison S. Madison
Madison Ennis County Park
2017
Madison Hebgen site1
Madison Hebgen site 2
Madison @ HWY 87 Bridge
2017 2017


![Community Water Quality Monitoring Biomonitoring Approach ... and clear so everyone can hear.] “Water Quality Monitoring by Macroinvertebrate Assessment”. [Encourage participants](https://static.fdocuments.in/doc/165x107/5ccdda3388c9934c718c066d/community-water-quality-monitoring-biomonitoring-approach-and-clear-so-everyone.jpg)