Baseline Indicators for Disaster Resilient Communities · Baseline Indicators for Disaster ......
22
Susan L. Cutter, Christopher T. Emrich, and Christopher G. Burton Hazards & Vulnerability Research Institute University of South Carolina Columbia, SC USA [email protected] Baseline Indicators for Disaster Resilient Communities CARRI Workshop July 14-15 Broomfield, CO
Transcript of Baseline Indicators for Disaster Resilient Communities · Baseline Indicators for Disaster ......

Susan L. Cutter, Christopher T. Emrich, and Christopher G. BurtonHazards & Vulnerability Research Institute
University of South CarolinaColumbia, SC USA
Baseline Indicators for Disaster Resilient Communities
CARRI WorkshopJuly 14-15Broomfield, CO
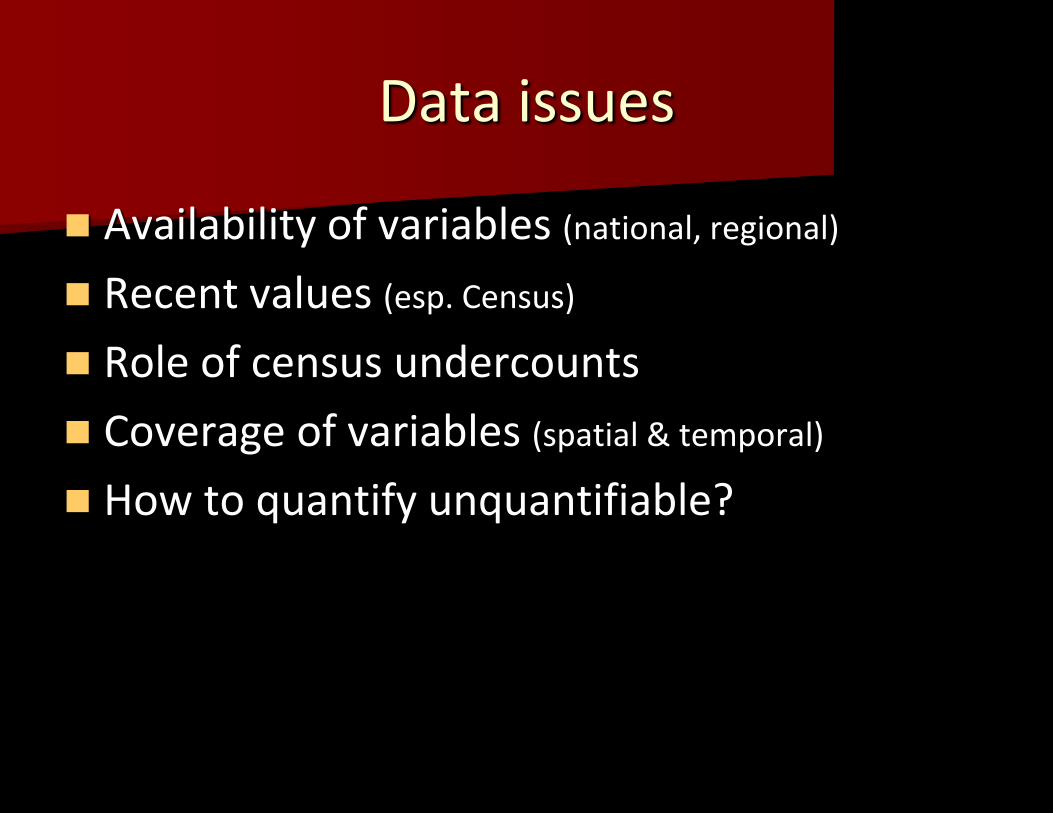
Data issues
Availability of variables (national, regional)
Recent values (esp. Census)
Role of census undercounts
Coverage of variables (spatial & temporal)
How to quantify unquantifiable?

Example: Reliance on old socio-demographic data: SoVI
SoVI for SC uses 32 variables based on 2000 Census
American Community Survey provides more recent information (~2005)– Places >65,000
– Four variables unavailable (nursing home residents/capita; % rural farm populations; % social security recipients; % populations living in urban areas
– Only 20/46 SC counties have ACS updates

SoVI 2000/SoVI ACS comparisons SoVI score not significantly different Spatial representation changes: function of changes in % native
American; % Asian, % Hispanic, median age, people per housing unit; % renters, % unemployment, per capita income, % rich, % poverty, % agricultural employment, median contract rent; median housing value

Creating the Baseline: Steps Theoretical or conceptual framework Indicator selection criteria
– Assessment of measurement error– Imputation of missing data
Index structure (inductive or statistical vs. deductive or theory)
Data transformation (per capita; density, absolute)
Normalization (scaling & standardization)
Multivariate analysis Weighting (for each component or variable)
Aggregation (how combine into final product)
Sensitivity analysis

Resilience Indicators:Components for Baseline
Ecological
Social
Economic
Infrastructure
Institutional capacity (mitigation)
Community competence
CARRI white papers; Norris et al. 2008; Cutter et al. 2008
Theoretical framework

Ecological
Variable Source Effect on Resilience
% Land area in 100-year flood plain Cutter et al. 2008 negative
% Land area subject to SLR Cutter et al. 2008 negative
% Soil erosion Cutter et al. 2008 negative
% Green space/undisturbed land Cutter et al. 2008 positive
% Urban (access variable) Cutter et al. 2008 positive
% Forested land cover (wildfire potential)
Cutter et al. 2008 negative
% Land with hydric soils (liquefaction) Cutter et al. 2008 negative
% Wetland loss (ecosystem services) Gunderson 2009 negative
Indicator selection

SocialVariable Source Effect on
Resilience
Racial/ethnic inequality (Abs. value of difference in % black & % white)
Norris et al. 2008; Cutter et al 2008
negative
Educational inequality (Abs. value of difference less than 9th grade & college)
Norris et al. 2008; Morrow 2008
negative
Physicians/10,000 (health access) Norris et al. 2008 positive
Elderly (%) Morrow 2008 negative
Social vulnerability index (SoVI) Morrow 2008; Cutter et al. 2008; Tierney 2009
negative
Transport challenged (% no vehicle) Tierney 2009 negative
Communication challenged (% no phone) Colten et al. 2008 negative
Language competency (% ESL) Morrow 2008 negative
Crime rate (per 10,000) Colten et al. 2008 negative
Special needs (% pop with disabilities) Heinz Center 2002 negative
Health coverage (% pop with coverage) Heinz Center 2002 positive
Population wellness (% black infant mortality rate)
Norris et al. 2002, 2008 negative
Variable Transformations

Economic
Variable Source Effect on Resilience
Housing capital ( difference % white homeowner and % black homeowner)
Norris et al. 2008 negative
Homeowners (%) Norris et al. 2008; Cutter et al. 2008
positive
Employment (%) Mileti 1999 positive
Median household income Norris et al. 2008; Cutter et al. 2008
positive
Poverty (%) Norris et al. 2008; Morrow 2008; Enarson2007
negative
Single sector employment (% primary sector + tourism)
Berke & Campanella2006
negative
Female labor force participation (%) NRC 2006 positive
Business size (% large >100 employees) Norris et al. 2008 positive

Institutional
Variable Source Effect on Resilience
Recent hazard mitigation plan (yes/no)
Burby et al. 2000; Godshalk 2007
positive
NFIP policies (per occupied housing unit)
Tierney et al . 2001 positive
Storm Ready participation (yes/no) Multi-hazard Mitigation Council 2005; Tierney et al . 2001
positive
Municipal expenditures (fire, police, emergency services as a %)
Sylves 2007 positive

Infrastructure
Variable Source Effect on Resilience
Mobile homes (%) Cutter et al. 2003 negative
Shelter capacity (% rental vacancy) Tierney 2009 positive
Medical capacity (hospital beds/10,000) Auf der Heide and Scanlon2007
positive
Building permits for new construction (#) NRC 2006 negative
Evacuation potential (arterial miles/mi2) NRC 2006 positive
Evacuation potential (# highway bridges) General knowledge negative
Housing age (% built 1970-1994) Mileti 1999 negative

Community Competence
Variable Source Effect on Resilience
Political fragmentation (# local governments and special districts)
Norris et al. 2008 negative
Previous disaster experience (PDD, yes or no)
Cutter et al. 2008 positive
Social connectivity (VOADs yes or no) Morrow 2008; Norris et al. 2005
positive
Dependency ratio (debt/revenue) Cutter et al. 2003 negative
International migration (%) Morrow 2008 negative
Sense of place (% borne in state and still live here)
Vale & Campanella 2005 positive
Social capital (churches/capita) Morrow 2008; Tierney 2009
positive
Social capital (% registered votersvoting in 2004 election)
Cutter et al. 2003 positive
Internal migration (% outmigration) Vale and Campanella2005
negative

Scaling Example
=
=
=
=Common scaling techniques:Z-scoresLinear scaling, Min-max transformationLinear scaling, maximum value transformation
Normalization

Putting it all together
Linear min-max scaling: X-min/max-min
Purpose: scale values from 0 to 1 where 0 reduces resilience; 1 increases resilience
Scores theoretically range from -27 to +21; actually range from -3.54 to +4.71
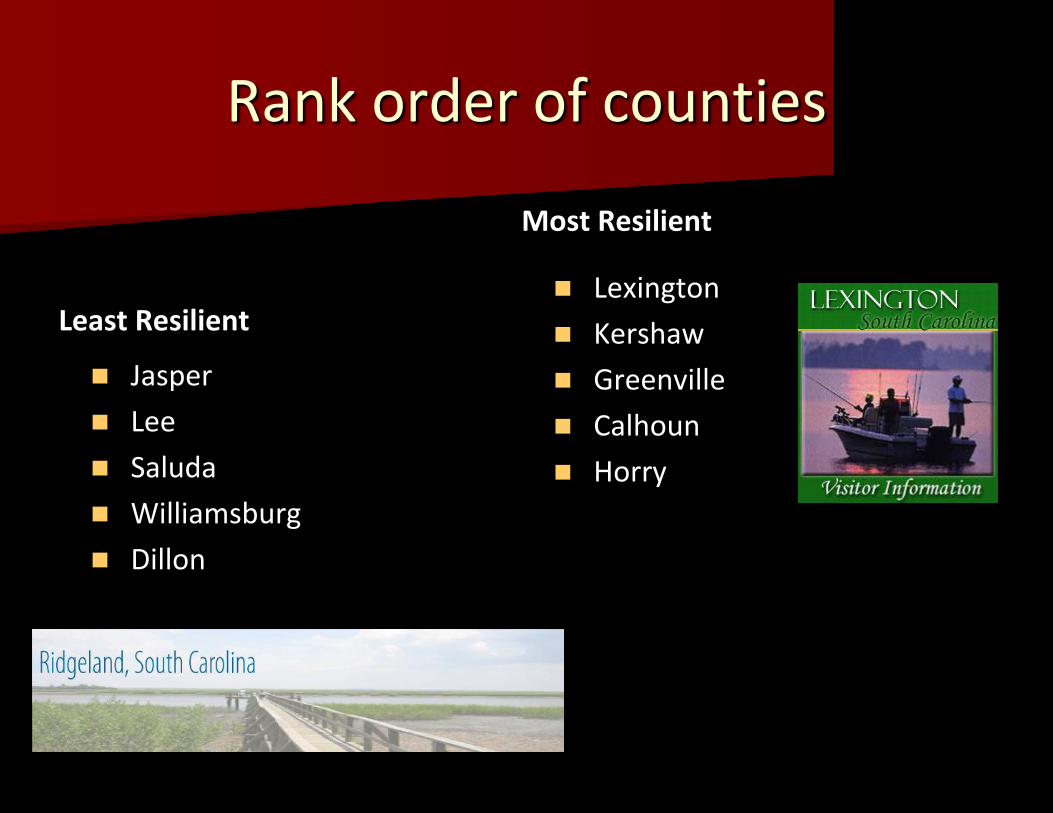
Rank order of counties
Most Resilient
Jasper
Lee
Saluda
Williamsburg
Dillon
Least Resilient Lexington
Kershaw
Greenville
Calhoun
Horry

Mapping Results
46
4544
43
42
1
2
3
4
5

Category Weighting
Common weighting schemes:Equal weightsUnequal weights
Weighting
Ecological17%
Social25%
Economic17%Institutional
8%
Infrastructure14%
Community competence
19%
Unequal Weights
Ecological16%
Social16%
Economic17%
Institutional17%
Infrastructure17%
Community competence
17%
Equal Weights

New map with equal weights

Components of Resilience

Identifying the dimensional drivers
County Ecological Social Economic Infrastructure Institutional Community Competence
Score
Lexington 0.07 -0.13 0.33 -0.17 0.65 0.18 0.93
Greenville 0.08 -0.16 0.24 -0.17 0.71 0.10 0.80
Charleston -0.28 -0.13 0.15 -0.15 0.65 0.21 0.45
Beaufort -0.40 -0.18 0.22 -0.16 0.86 -0.10 0.24
Lee -0.13 -0.42 0.02 -0.16 0.50 0.35 0.16
Mean values for each dimension
SC strong on institutionalIllustrates opportunities for intervention

Next steps
Refine present methodology (variables, analytical techniques)
Different aggregation schemes (PCA)
National comparisons (coastal counties, other regions)
Downscale to sub-county (communities, census tracts)
Couple baseline indicators with process-oriented capacity building for disaster resilience

Thanks and come for a visithttp://webra.cas.sc.edu/hvri/