Baseline Data for Evaluating Reef Fish Populations in the...
63
NOAA Technical Memorandum NMFS-SEFSC-427 Baseline Data for Evaluating Reef Fish Populations in the Florida Keys, 1979-1998 James A. Bohnsack, David B. McClellan, Douglas E. Harper, Guy S. Davenport, George J. Konoval, Anne-Marie Eklund, Joseph P. Contillo, Stephania K. Bolden, Peter C. Fischel, G. Scott Sandorf, Joaquin C. Javech, Michael W. White, Matthew H. Pickett, Mark W. Hulsbeck, and James L. Tobias U.S. Department of Commerce National Oceanic and Atmospheric Administration National Marine Fisheries Service Southeast Fisheries Science Center 75 Virginia Beach Drive Miami, Florida 33149 and Jerald S. Ault, Geoffrey A. Meester, Steven G. Smith, and Jiangang Luo Rosenstiel School of Marine and Atmospheric Sciences University of Miami 4600 Rickenbacker Causeway Miami, FL 33149 September 1999
Transcript of Baseline Data for Evaluating Reef Fish Populations in the...
NOAA Technical Memorandum NMFS-SEFSC-427
Baseline Data for Evaluating Reef Fish Populationsin the Florida Keys, 1979-1998
James A. Bohnsack, David B. McClellan, Douglas E. Harper, Guy S. Davenport, George J. Konoval,Anne-Marie Eklund, Joseph P. Contillo, Stephania K. Bolden, Peter C. Fischel, G. Scott Sandorf,
Joaquin C. Javech, Michael W. White, Matthew H. Pickett, Mark W. Hulsbeck, and James L. Tobias
U.S. Department of CommerceNational Oceanic and Atmospheric Administration
National Marine Fisheries ServiceSoutheast Fisheries Science Center
75 Virginia Beach DriveMiami, Florida 33149
and
Jerald S. Ault, Geoffrey A. Meester, Steven G. Smith, and Jiangang Luo
Rosenstiel School of Marine and Atmospheric SciencesUniversity of Miami
4600 Rickenbacker CausewayMiami, FL 33149
September 1999
NOAA Technical Memorandum NMFS-SEFSC-427
Baseline Data for Evaluating Reef Fish Populationsin the Florida Keys, 1979-1998
James A. Bohnsack, David B. McClellan, Douglas E. Harper, Guy S. Davenport, George J. Konoval,Anne-Marie Eklund, Joseph P. Contillo, Stephania K. Bolden, Peter C. Fischel, G. Scott Sandorf,
Joaquin C. Javech, Michael W. White, Matthew H. Pickett, Mark W. Hulsbeck, James L. Tobias, JeraldS. Ault, Geoffrey A. Meester, Steven G. Smith, and Jiangang Luo
U.S. DEPARTMENT OF COMMERCEWilliam M. Daley, Secretary
National Oceanic and Atmospheric AdministrationD. James Baker, Undersecretary for Oceans and Atmosphere
National Marine Fisheries ServicePenelope D. Dalton, Assistant Administrator for Fisheries
Southeast Fisheries Science CenterMiami, Florida
September 1999
This technical memorandum series is used for documentation and timely communication of preliminary results, interimreports, or special purpose information, and has not undergone external scientific review.
Jack Javech
Jack Javech
NOTICE
The National Marine Fisheries Service (NMFS) does not approve, recommend, or endorse any proprietary product ormaterial mentioned in this publication. No reference shall be made to the NMFS, or to this publication furnished by NMFS,in any advertising or sales promotion which would indicate or imply that NMFS approves, recommends, or endorses anyproprietary product or proprietary material mentioned herein or which has as its purpose any intent to cause directly orindirectly the advertised product to be used or purchased because of NMFS publication.
This report should be cited as follows:
James A. Bohnsack, David B. McClellan, Douglas E. Harper, Guy S. Davenport, George J. Konoval, Anne-Marie Eklund,Joseph P. Contillo, Stephania K. Bolden, Peter C. Fischel, G. Scott Sandorf, Joaquin C. Javech, Michael W. White,Matthew H. Pickett, Mark W. Hulsbeck, James L. Tobias, Jerald S. Ault, Geoffrey A. Meester, Steven G. Smith, andJiangang Luo. Baseline Data for Evaluating Reef Fish Populations in the Florida Keys, 1979-1998. NOAA TechnicalMemorandum NMFS-SEFSC-427. 61 p.
Copies may be obtained by writing:
National Marine Fisheries Service or National Technical Information ServiceSoutheast Fisheries Science Center 5258 Port Royal Road75 Virginia Beach Drive Springfield, Virginia 22161Miami, Florida 33149
Jack Javech
1
EXECUTIVE SUMMARY
Reef fishes are an essential andconspicuous component of the South FloridaMarine Ecosystem that support importantcommercial, recreational, and aestheticfisheries. Fishes are the ultimate downstreamintegrators of environmental conditions andhuman activities. Factors that increasemortality, such as fishing, loss of habitat, andpollution are eventually reflected in adultpopulation abundance, individual size andcondition. Over the last two decades, theFlorida reef tract ecosystems and Florida Bayhave undergone dramatic environmentalchanges from human and natural forces. These changes are a general concern and thefocus of an intensive effort to restore theecosystem by altering the hydrology to a morenatural condition. Fishes are a direct publicconcern and obvious measure of restorationsuccess. Success of restoration andmanagement changes should be reflected inreef fish communities in terms of the speciescomposition, the size/age structure of fishes,and in fisheries. Fishery resources areregulated by several state and federal agenciesunder different levels of spatial protection. Understanding and modeling the dynamics ofphysical and biological processes of FloridaBay and the Florida reef tract requires a gooddatabase on fish composition by habitat.
The Florida Keys National MarineSanctuary (FKNMS) final management planbecame effective on 1 July 1997 creating thefirst planned network of 'no-take' marinereserves in North America. These reservesincluded 18 'no-take' Sanctuary ProtectedAreas (SPAs) and one large 'no-take'ecological reserve. This action provides aunique research opportunity to examine theprocesses and effects of reserve protection atreplicated sites of different size. Animportant goal of the FKNMS managementplan is to evaluate changes resulting fromestablishing no-take marine reserves five
years after they became established. Inaddition, new ecological reserves are beingproposed for the Tortugas region.
Biological data on reef fishbiodiversity have been collected continuouslysince 1979 by highly trained and experienceddivers using open circuit SCUBA and visualmethods. Visual methods are ideal forassessing reef fishes in the Florida Keysbecause of prevailing good visibility andmanagement concerns requiring the use ofnondestructive assessment methods. Datawere collected from randomly selected 7.5 mradius plots using a standard fishery-independent, stationary plot method(Bohnsack and Bannerot 1986). Datacollected show reef fish species composition,abundance (density per plot), frequency-of-occurrence, and individual sizes of fishes atreef sites extending from Miami through theTortugas. These data can be used to assesschanges in reef fish communities in theFlorida Keys as the result of changes inzoning, regional fishery managementpractices, and restoration efforts in FloridaBay.
This report provides a summary of a20 year historical data base that will form thebaseline for assessing future changes in reeffish communities in the FKNMS. A total of263 fish taxa from 54 families were observedfrom 118 sites in the Florida Keys from 6,673visual stationary plot samples from 1979through 1998. The ten most abundant speciesaccounted for 59% of all individualsobserved. Ten species had a frequency-of-occurrence in samples greater than 50% andonly ten species accounted for 55% of thetotal observed biomass.
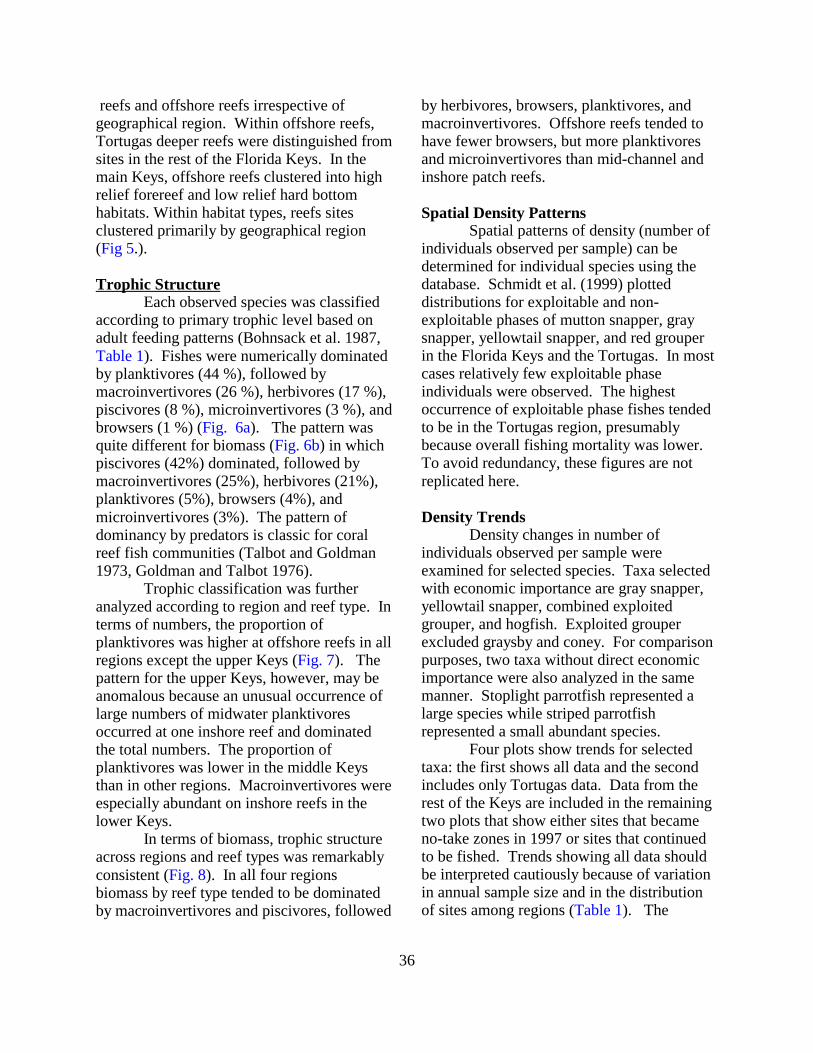
Bray-Curtis similarity analysis of 90reef sites was conducted to analyze spatialdistribution patterns. The analysis showedthat reef sites clustered primarily betweeninshore patch reefs and offshore reefsirrespective of region. Within offshore reefs,Tortugas deeper reefs were distinguished from
2
sites in the rest of the Florida Keys. In themain Keys, offshore reefs clustered into highrelief forereef and low relief hard bottomhabitats. Within habitat types, reef sitesclustered primarily by geographical region.
Trophic composition of fishes differedgreatly in terms of number of individuals andtotal biomass. Fishes were numericallydominated by planktivores (44%) followed bymacroinvertivores (26%), herbivores (17%),piscivores (8%), microinvertivores (3%), andbrowsers (1%). In terms of biomass,piscivores (42%) dominated, followed bymacroinvertivores (25%), herbivores (21%),planktivores (5%), browsers (4%), andmicroinvertivores (3%).
Data collected from 1994-1997 form abaseline for assessing changes at study sitesduring the first five years of protection underthe FKNMS management plan. Annual meandensity (number of fish observed per plotsample) with 95% confidence intervals werecalculated for selected species and projectedthrough 2002 as a prediction of futureperformance based on the assumption of nochanges in population parameters over time.
Since only one full year of data wereavailable following the establishment of no-take zones, it is premature to make conclusionabout the impacts of marine reserves onchanges in abundance or sizes of multispeciesreef fish stocks. It is encouraging, however,that after only one year of no-take protection,the annual mean densities of exploited speciesin no-take sites were the highest observed foryellowtail snapper, combined grouper, andhogfish and the second highest for graysnapper compared to the baseline period. Incomparison, similar uniform responses werenot observed for the same species at fishedsites nor for two species without directeconomic importance (striped and stoplightparrotfish).
Size of reef fishes are also beingmonitored to assess population changes. Mean fish size in exploitable and non-
exploitable phases for stocks of economicallyimportant species were examined as baselinestatistics for evaluating future communitychanges in response to management actions. Because adult growth rates are relatively slow,size changes were unlikely to change muchafter only one year of protection and may lagother parameters.
The 20 year data set provides anexcellent long-term baseline for assessingfuture changes in reef fish biodiversity,population abundance, and average sizes inthe Florida Keys resulting from changes inFlorida Keys National Marine Sanctuaryzoning, regional fishery managementpractices, and restoration efforts involvingFlorida Bay.
3
TABLE OF CONTENTS
EXECUTIVE SUMMARY . . . . . . . . . . . . . . . . . . . . . . . . . . . . . . . . . . . . . . . . . . . . . . . . . . 1.
TABLE OF CONTENTS . . . . . . . . . . . . . . . . . . . . . . . . . . . . . . . . . . . . . . . . . . . . . . . . . . 3.LIST OF TABLES . . . . . . . . . . . . . . . . . . . . . . . . . . . . . . . . . . . . . . . . . . . . . . . . . 4.
LIST OF FIGURES . . . . . . . . . . . . . . . . . . . . . . . . . . . . . . . . . . . . . . . . . . . . . . . . . 5.
INTRODUCTION . . . . . . . . . . . . . . . . . . . . . . . . . . . . . . . . . . . . . . . . . . . . . . . . . . . . . . . 8.
BACKGROUND . . . . . . . . . . . . . . . . . . . . . . . . . . . . . . . . . . . . . . . . . . . . . . . . . . . . . . . . 9.Database History . . . . . . . . . . . . . . . . . . . . . . . . . . . . . . . . . . . . . . . . . . . . . . . . . . 9.Ongoing Activities . . . . . . . . . . . . . . . . . . . . . . . . . . . . . . . . . . . . . . . . . . . . . . . . . . 11.
METHODS . . . . . . . . . . . . . . . . . . . . . . . . . . . . . . . . . . . . . . . . . . . . . . . . . . . . . . . . . . . . 11.Study Area . . . . . . . . . . . . . . . . . . . . . . . . . . . . . . . . . . . . . . . . . . . . . . . . . . . . . . . . 11.Field Methods . . . . . . . . . . . . . . . . . . . . . . . . . . . . . . . . . . . . . . . . . . . . . . . . . . . . . 17.Experimental Design . . . . . . . . . . . . . . . . . . . . . . . . . . . . . . . . . . . . . . . . . . . . . . . . 18.Analytical Methods . . . . . . . . . . . . . . . . . . . . . . . . . . . . . . . . . . . . . . . . . . . . . . . . . 18.
RESULTS AND DISCUSSION . . . . . . . . . . . . . . . . . . . . . . . . . . . . . . . . . . . . . . . . . . . . . . . 20.Sampling Summary . . . . . . . . . . . . . . . . . . . . . . . . . . . . . . . . . . . . . . . . . . . . . . . . . 20.Community Structure . . . . . . . . . . . . . . . . . . . . . . . . . . . . . . . . . . . . . . . . . . . . . . . . . 21.
Site Comparisons . . . . . . . . . . . . . . . . . . . . . . . . . . . . . . . . . . . . . . . . . . . . . . . 21.Trophic Structure . . . . . . . . . . . . . . . . . . . . . . . . . . . . . . . . . . . . . . . . . . . . . . . 36.
Spatial Density Patterns . . . . . . . . . . . . . . . . . . . . . . . . . . . . . . . . . . . . . . . . . . . . . . . 36.Density Trends . . . . . . . . . . . . . . . . . . . . . . . . . . . . . . . . . . . . . . . . . . . . . . . . . . . . . 36.Density of Size Phases . . . . . . . . . . . . . . . . . . . . . . . . . . . . . . . . . . . . . . . . . . . . . . . . . 45.
CONCLUSIONS . . . . . . . . . . . . . . . . . . . . . . . . . . . . . . . . . . . . . . . . . . . . . . . . . . . . . . . . . . . 50.
ACKNOWLEDGMENTS . . . . . . . . . . . . . . . . . . . . . . . . . . . . . . . . . . . . . . . . . . . . . . . . . . . . 50.
LITERATURE CITED . . . . . . . . . . . . . . . . . . . . . . . . . . . . . . . . . . . . . . . . . . . . . . . . . . . . . . 55.
APPENDIX A: List of Abbreviations . . . . . . . . . . . . . . . . . . . . . . . . . . . . . . . . . . . . . . . . . . 58.
APPENDIX B: Location of sampled reef sites in the FKNMS . . . . . . . . . . . . . . . . . . . . . . . . 59.
4
LIST OF TABLES
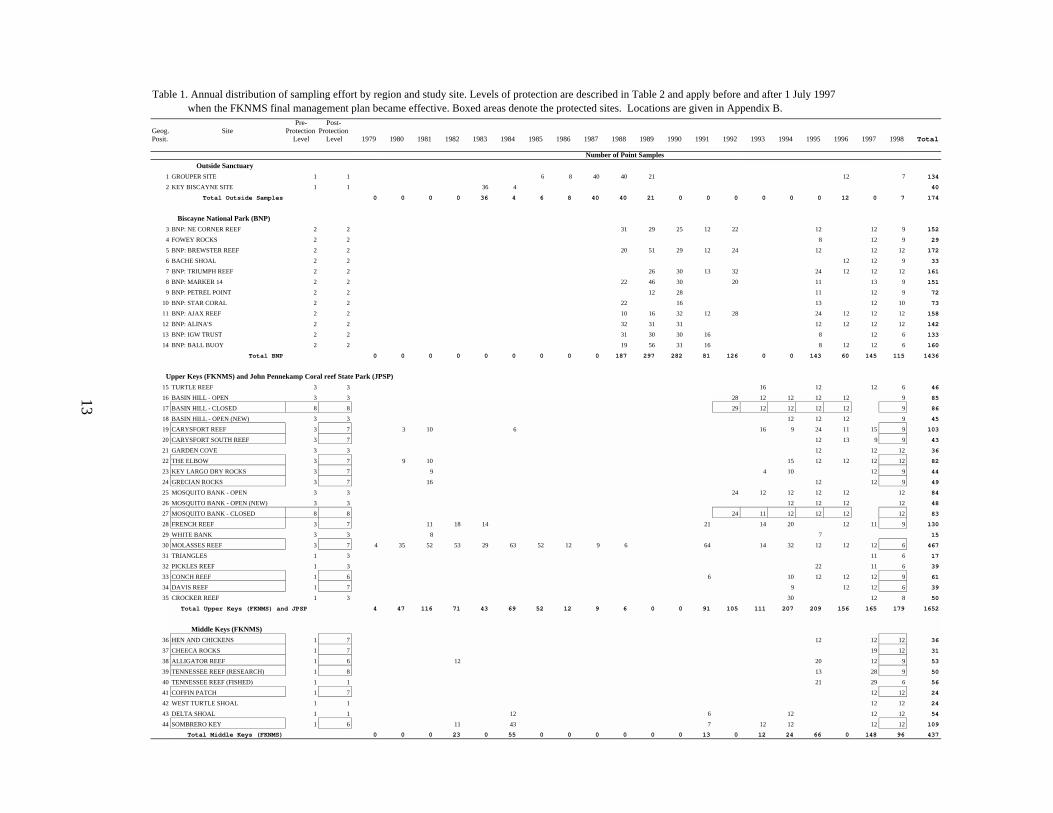
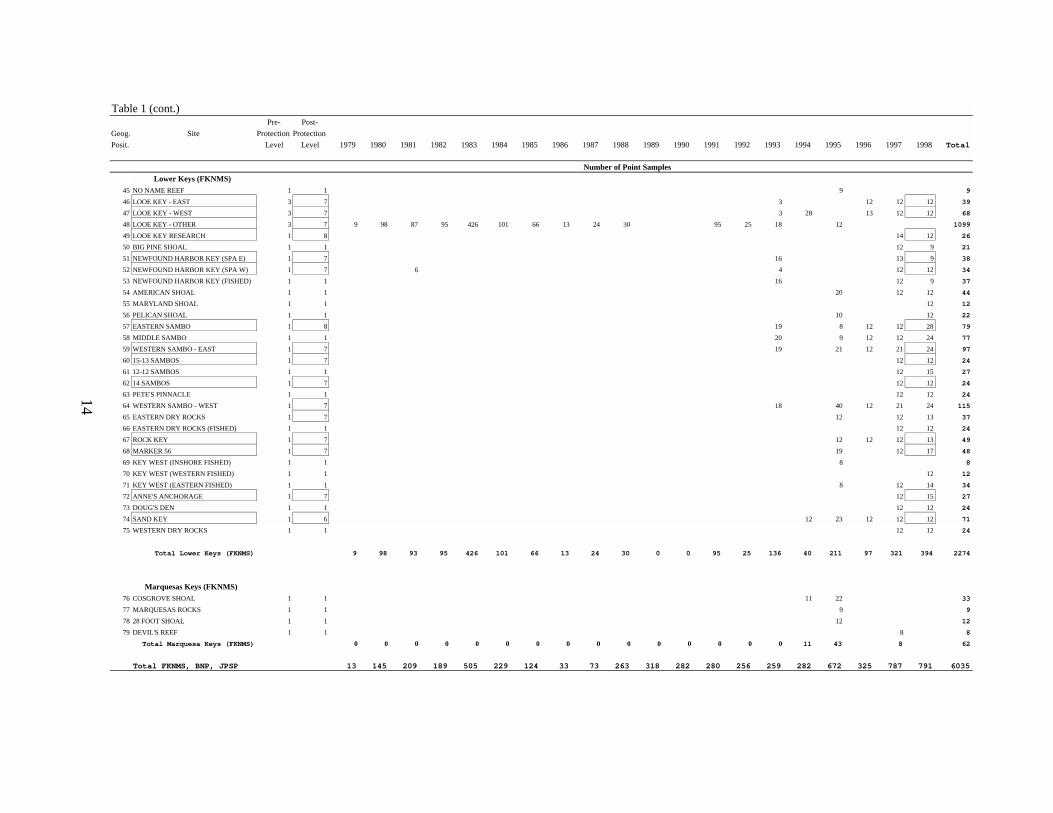
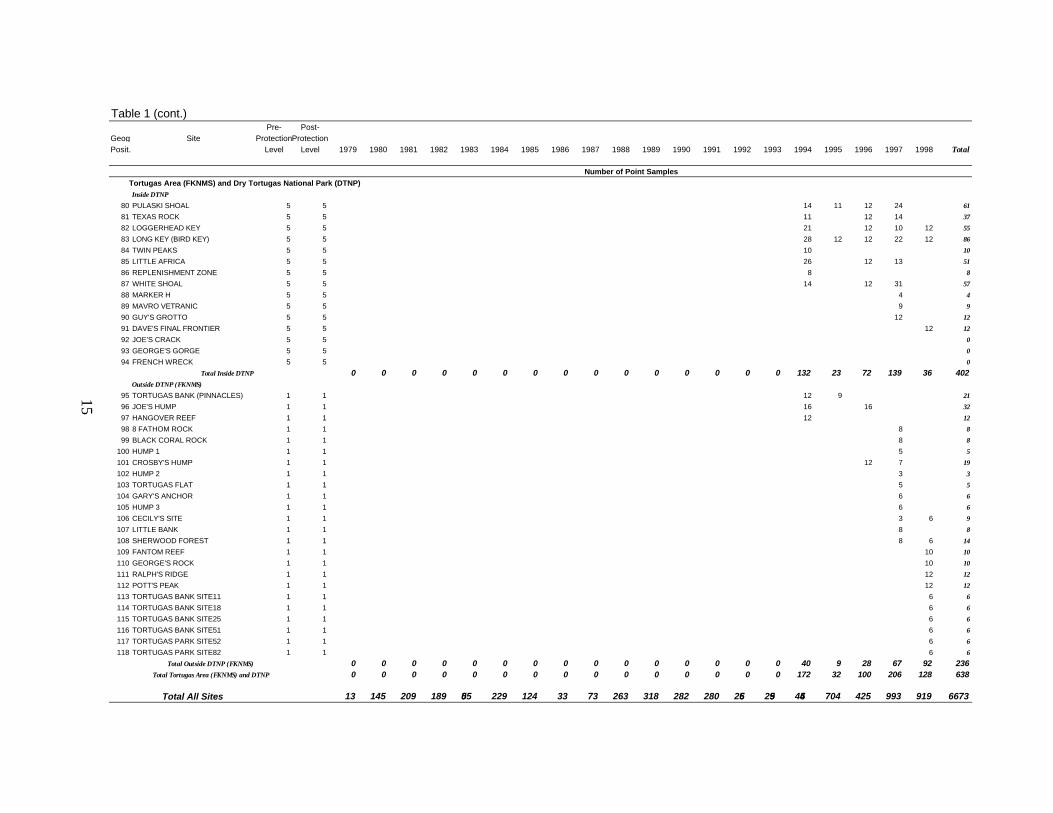
Table 1. Annual distribution of sampling effort by region and study site. Levels of protection aredescribed in Table 2 and apply before and after 1 July 1997 when the FKNMS final managementplan became effective. Boxed areas denote the protected sites. Locations are given in AppendixB.
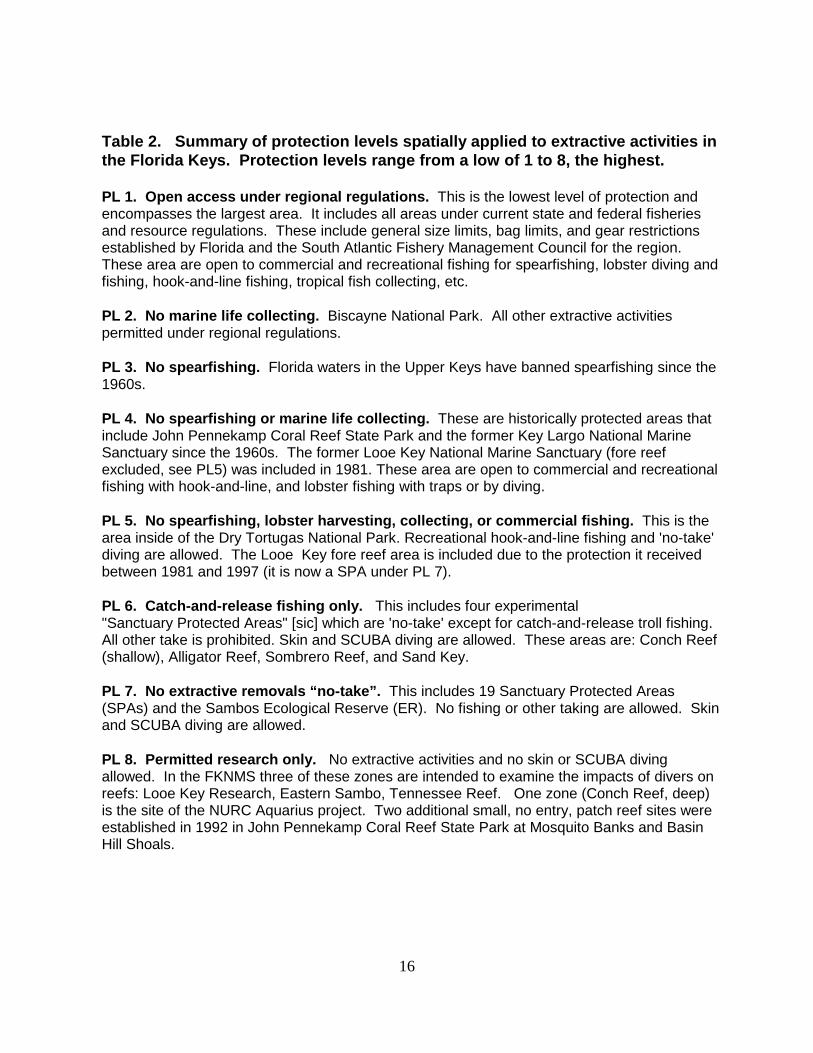
Table 2. Summary of protection levels spatially applied to extractive activities in the FloridaKeys. Protection levels range from a low of 1 to 8, the highest.
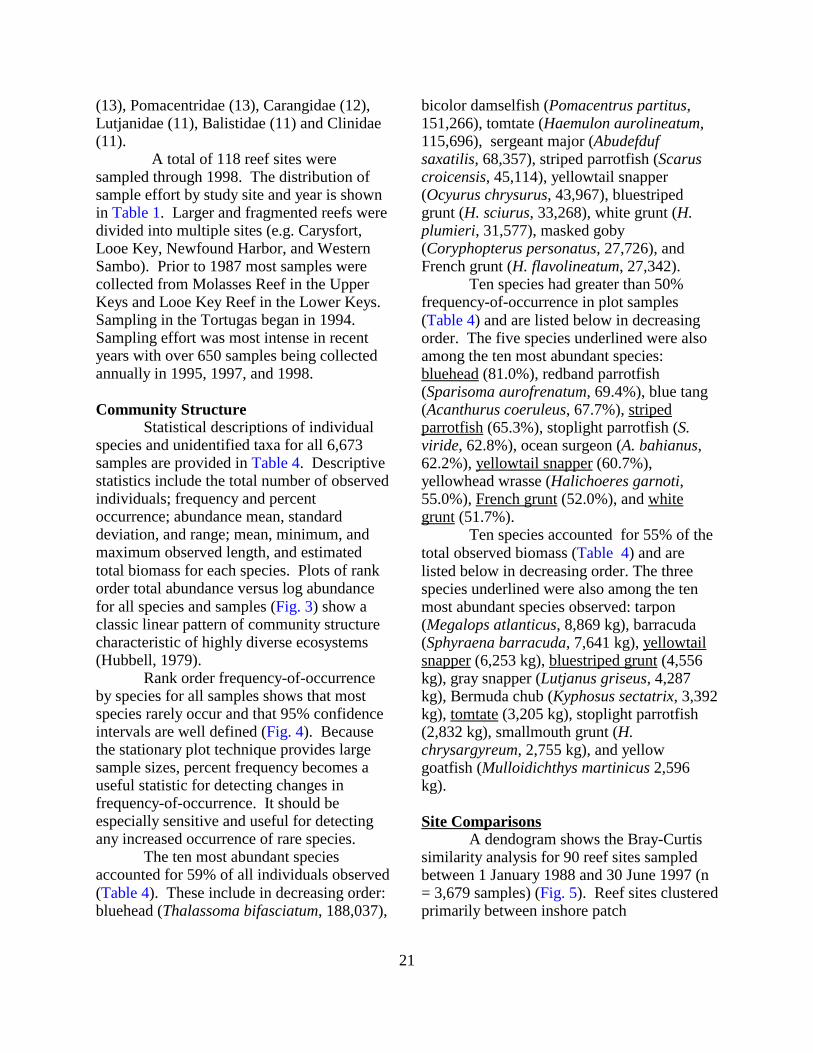
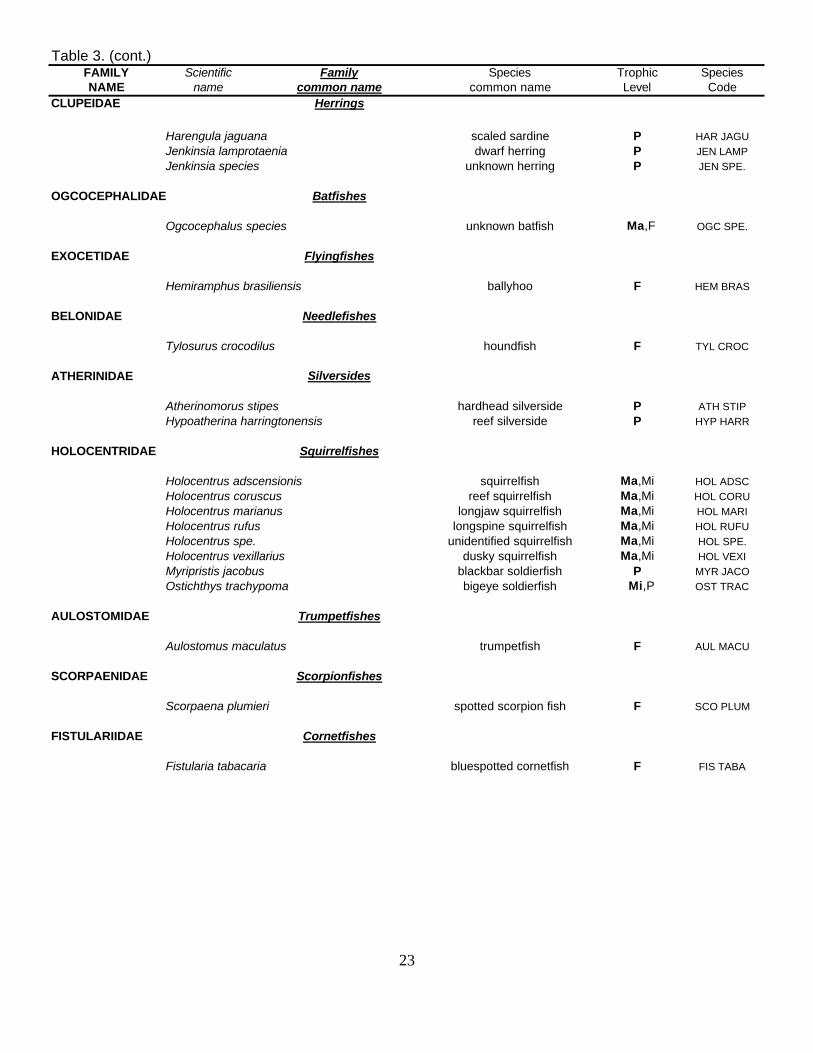
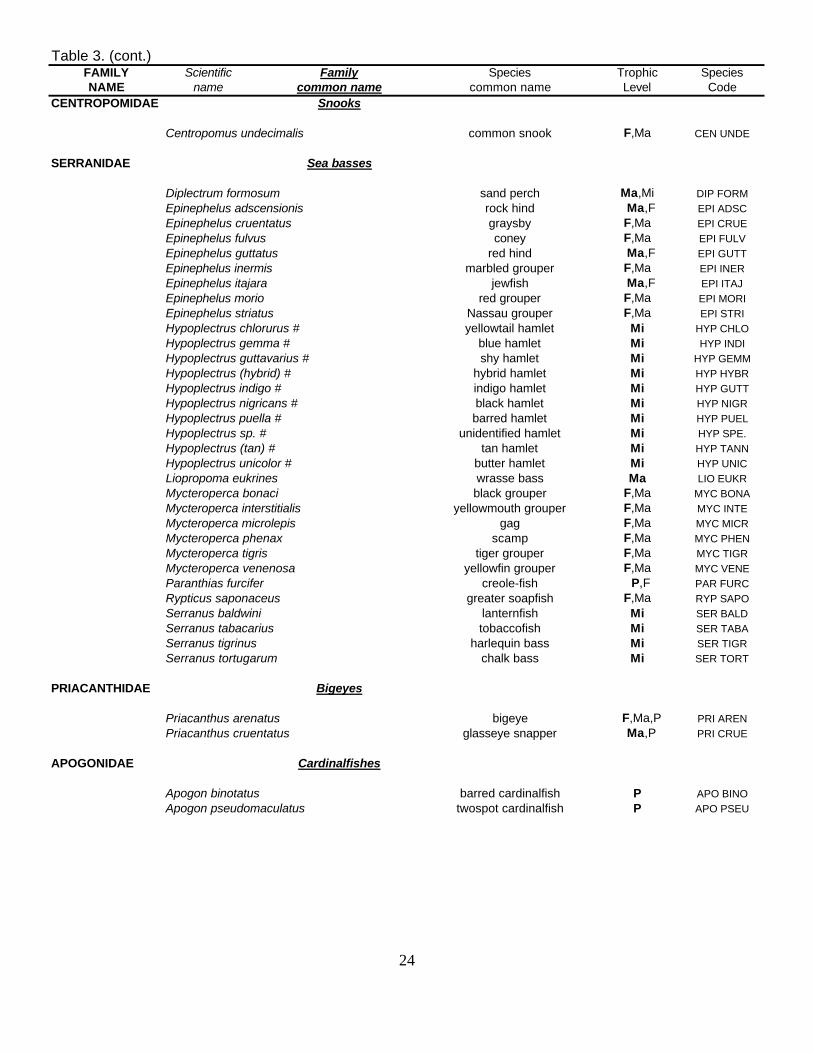
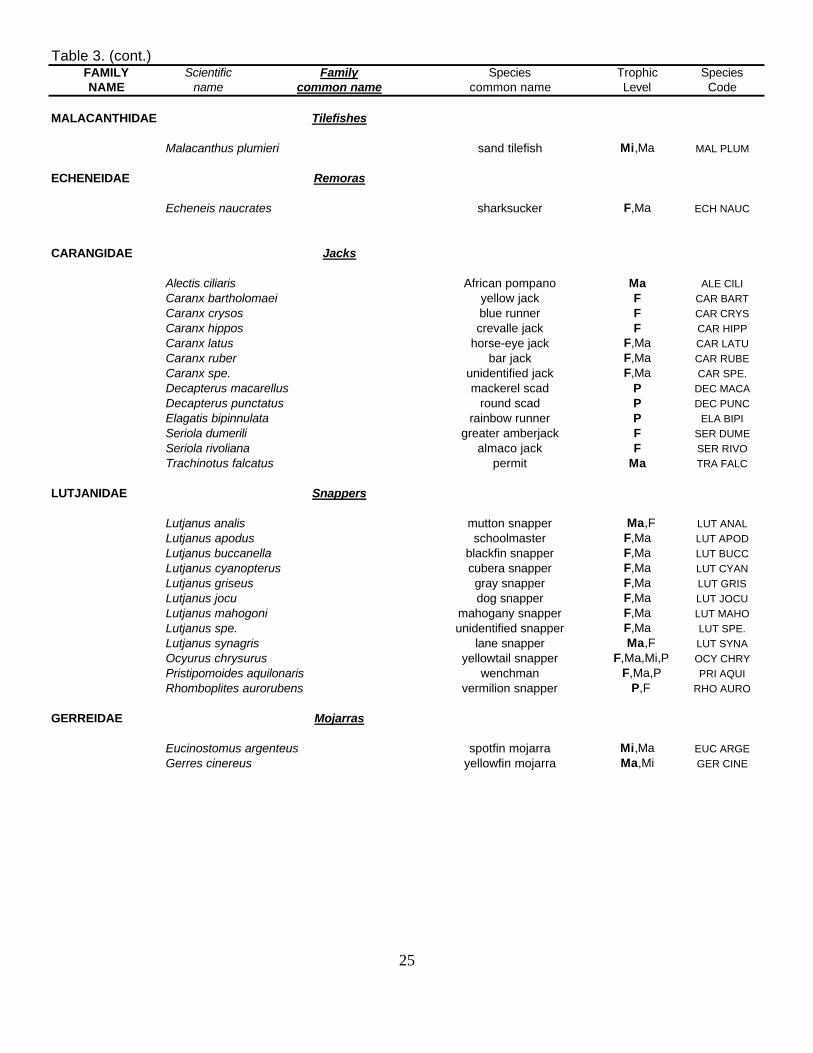
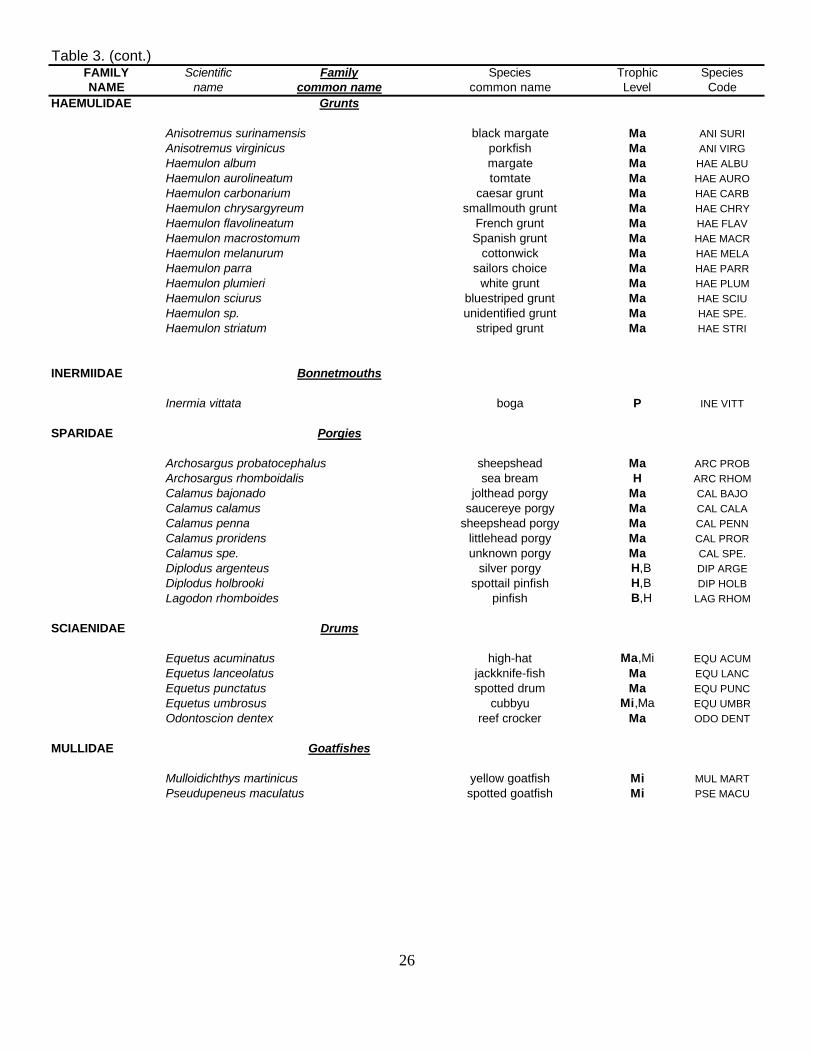
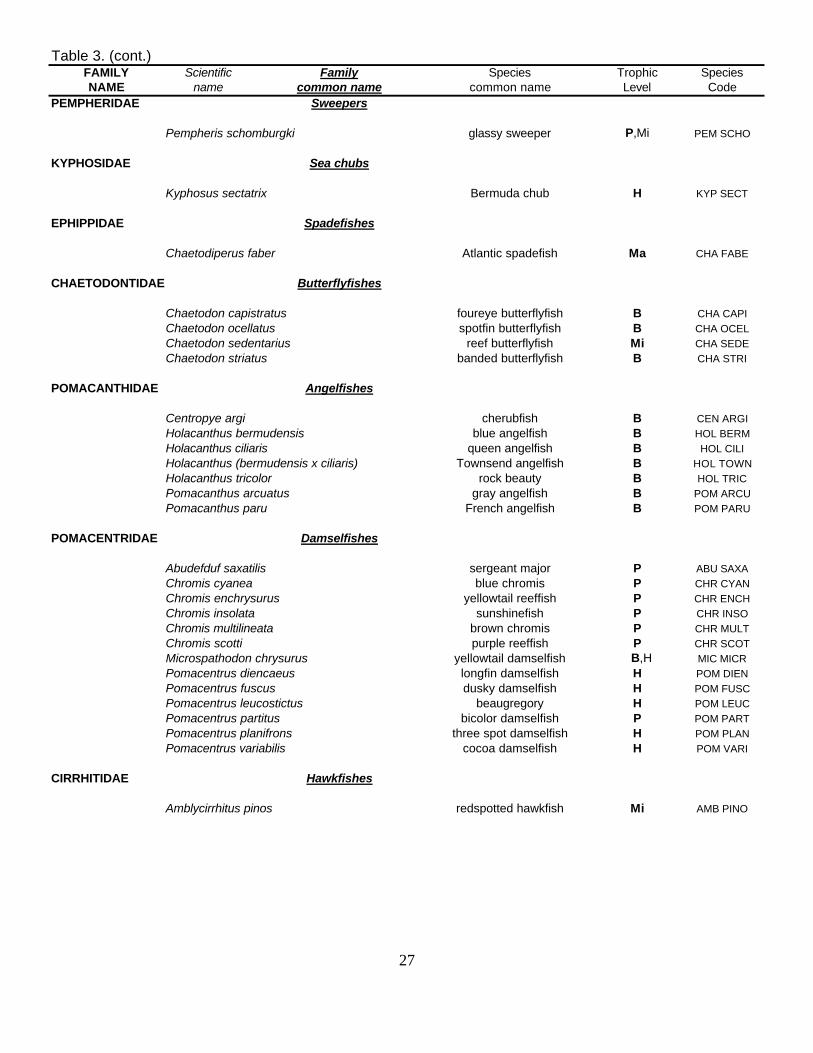
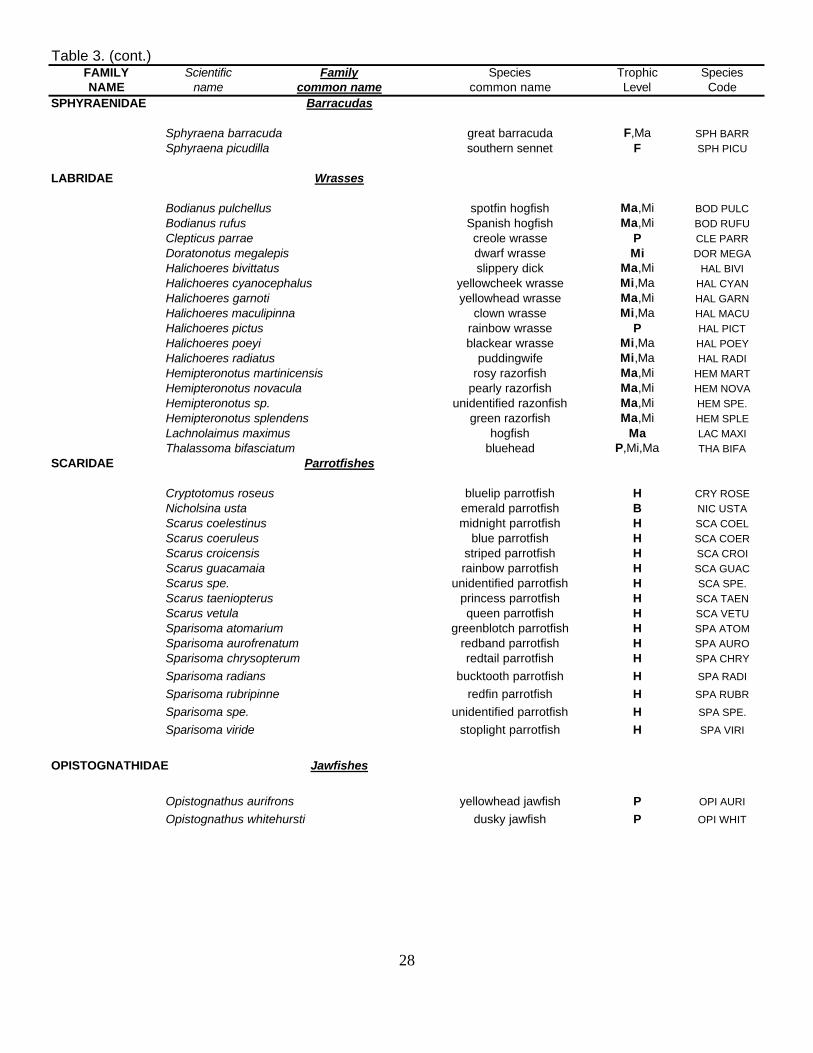
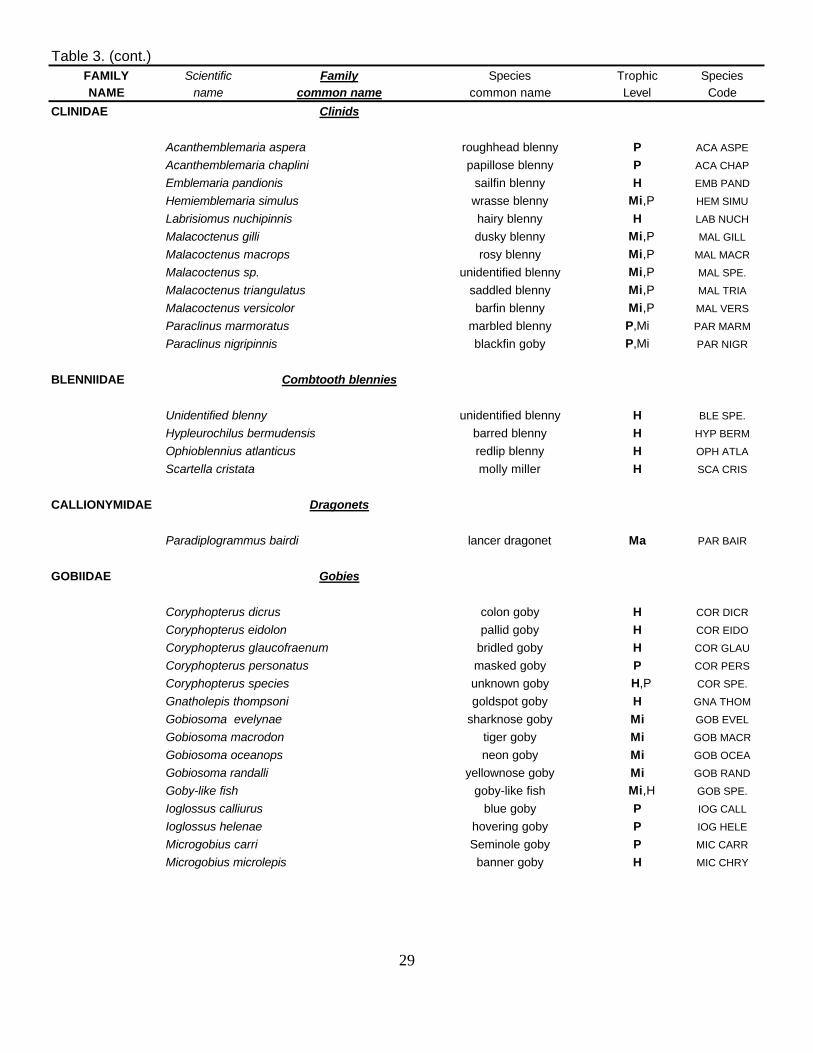
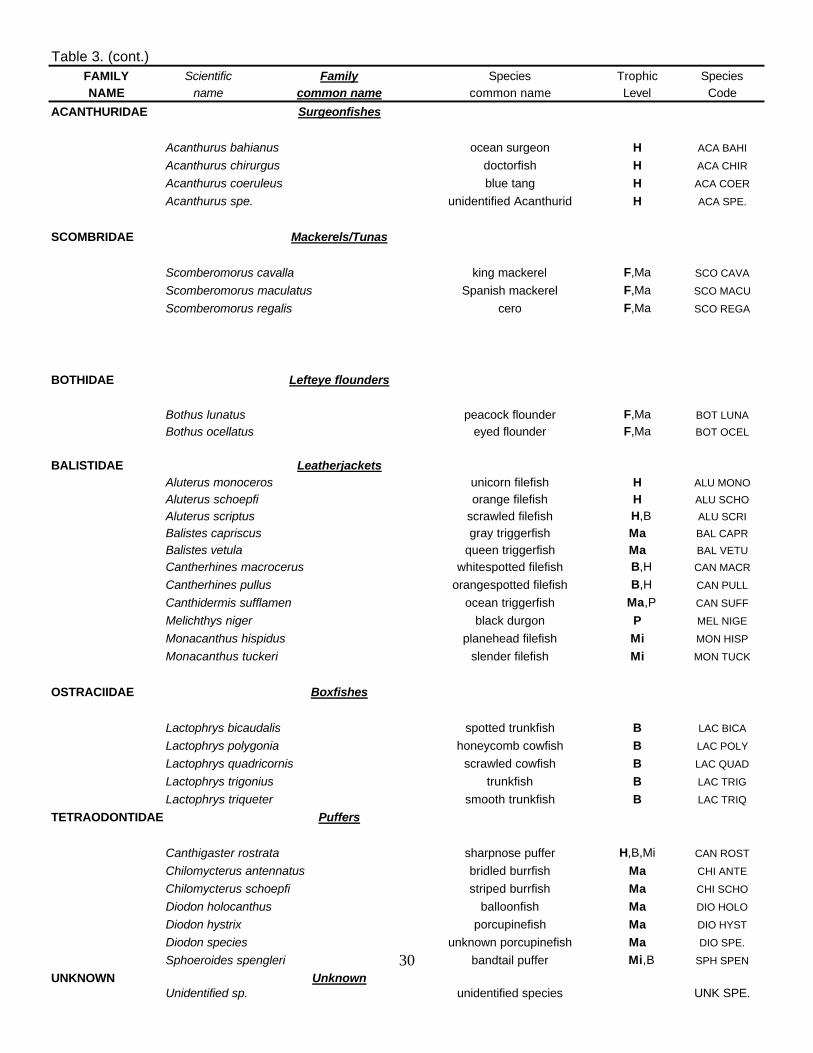
Table 3. Phylogenic listing of families and species observed in visual samples from the FloridaKeys (1979-1998). Names are according to Robins et al. (1986, 1991) with the exception ofHypoplectrus species (denoted by #) which were all listed as H. unicolor in Robins et al. (1991)and are named according to Stokes (1980). The species code was derived from the first three andfour letters, respectively, of the genus and specific name. Trophic level codes: B, browser, F,piscivore; H, herbivore; Ma, macroinvertivore; Mi, microinvertivore; P, planktivore. Predominate adult trophic mode indicated in bold.
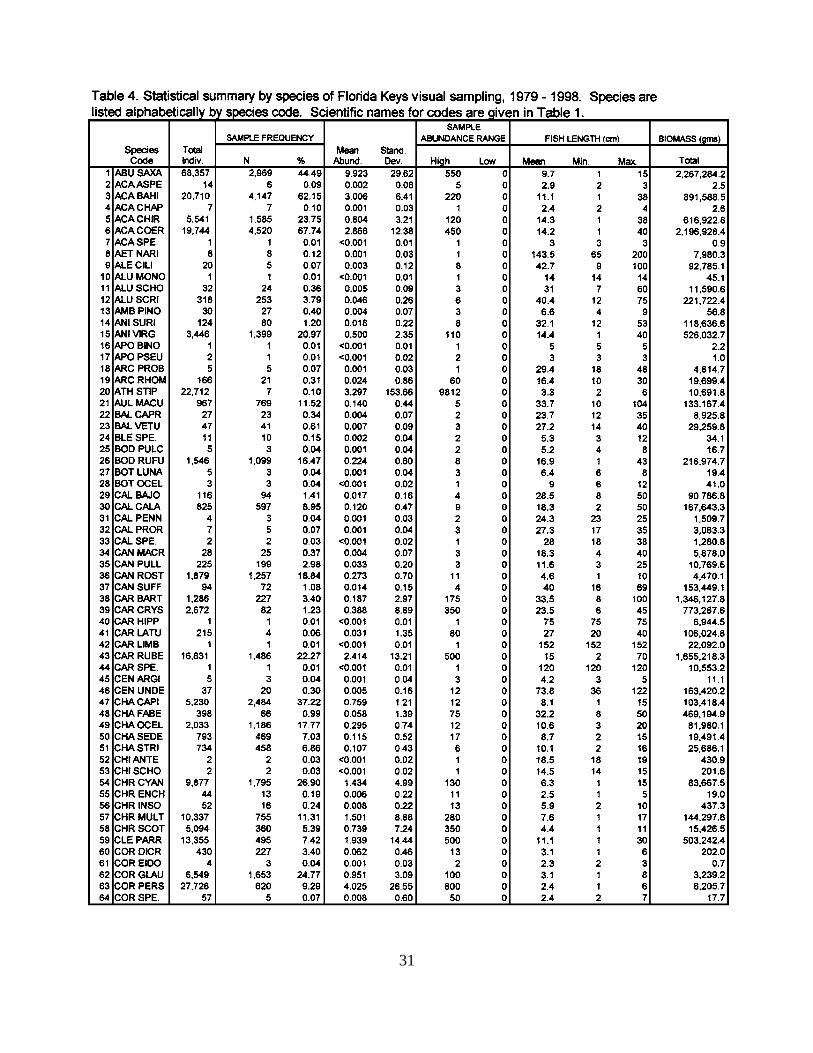
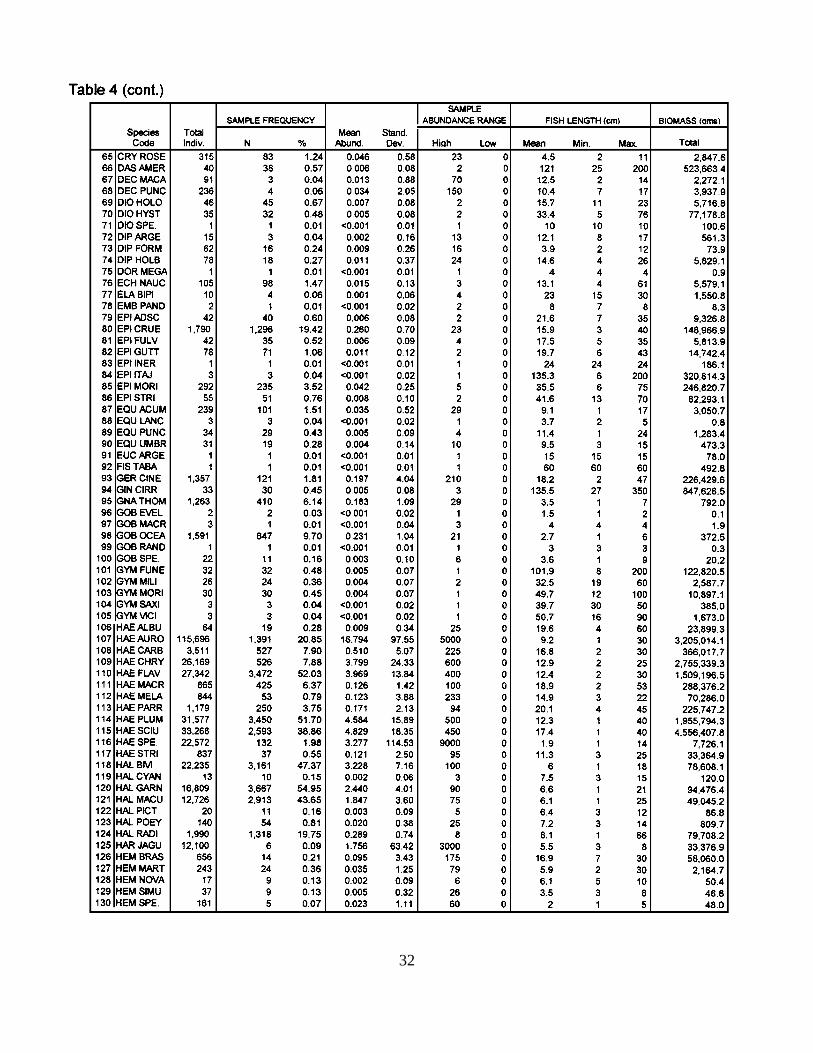
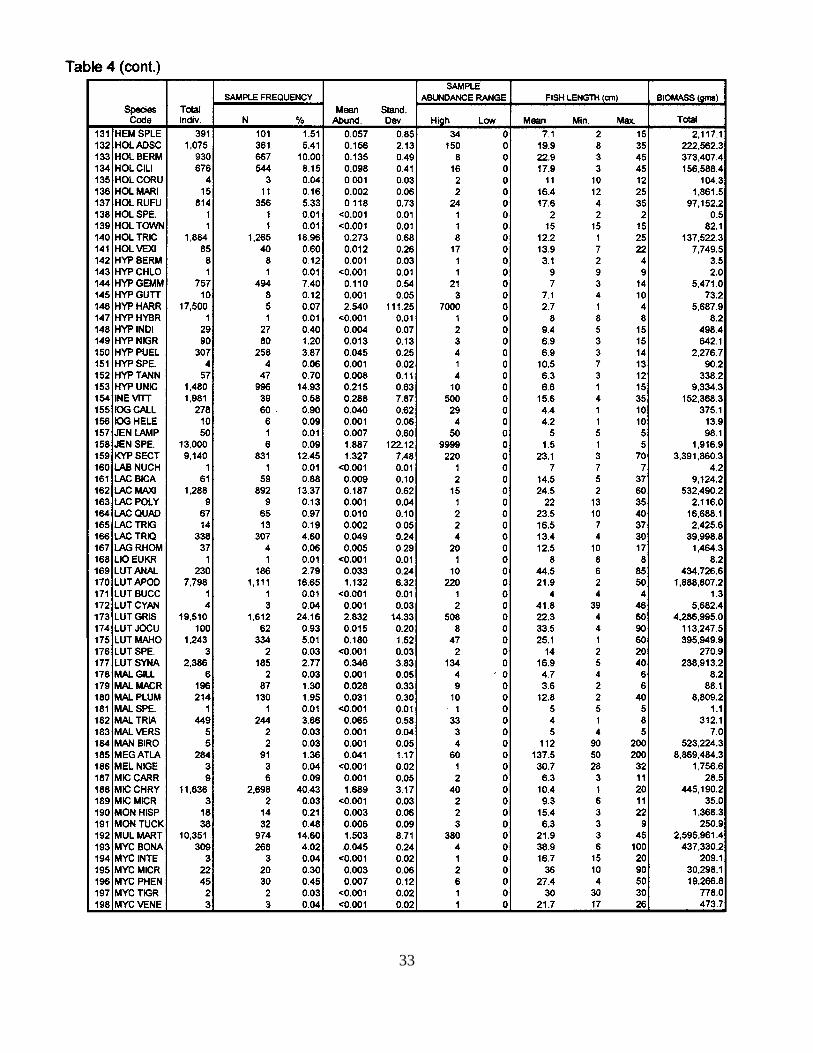
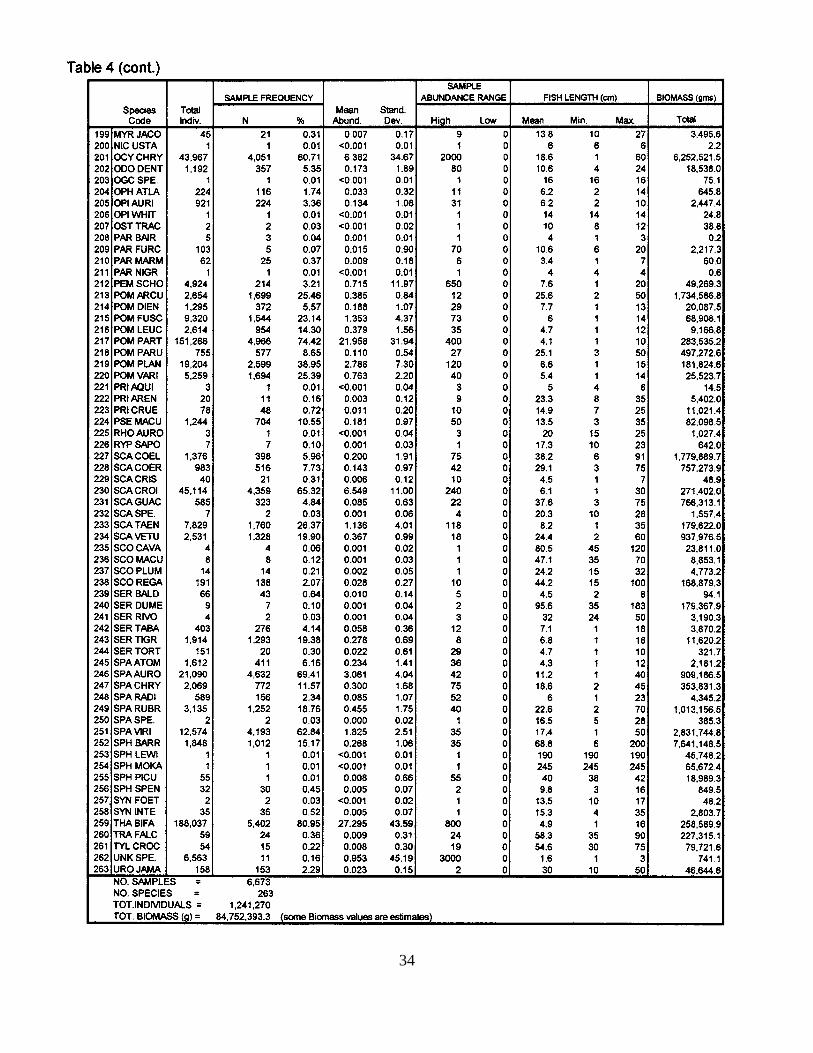
Table 4. Statistical summary by species of Florida Keys visual sampling, 1979-1998. Speciesare listed alphabetically by species code. Scientific names for codes are given in Table 1.
Table 5. Summary statistics for selected species for Figures 9 - 14. Abbreviations: SD =standard deviation; CI = confidence interval.
5
LIST OF FIGURES
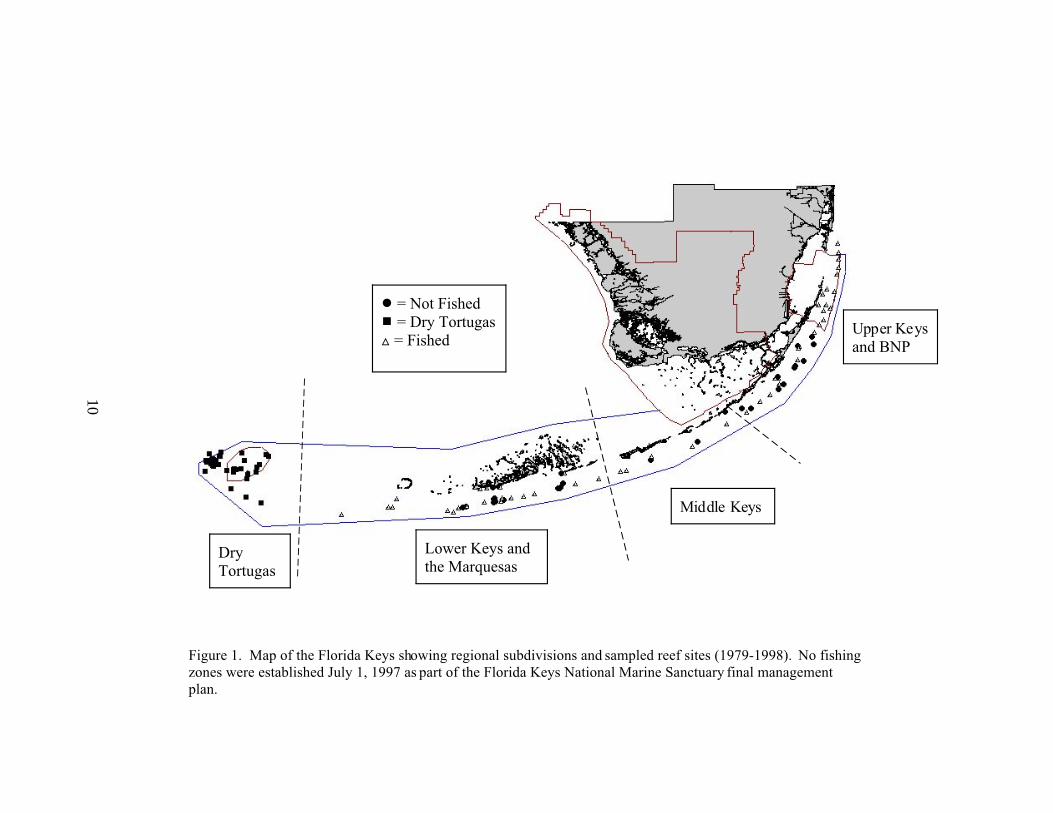
Figure 1. Map of the Florida Keys showing regional subdivisions and sampled reef sites (1979-1998). No fishing zones established July 1, 1997 as part of the Florida Keys National MarineSanctuary final management plan.
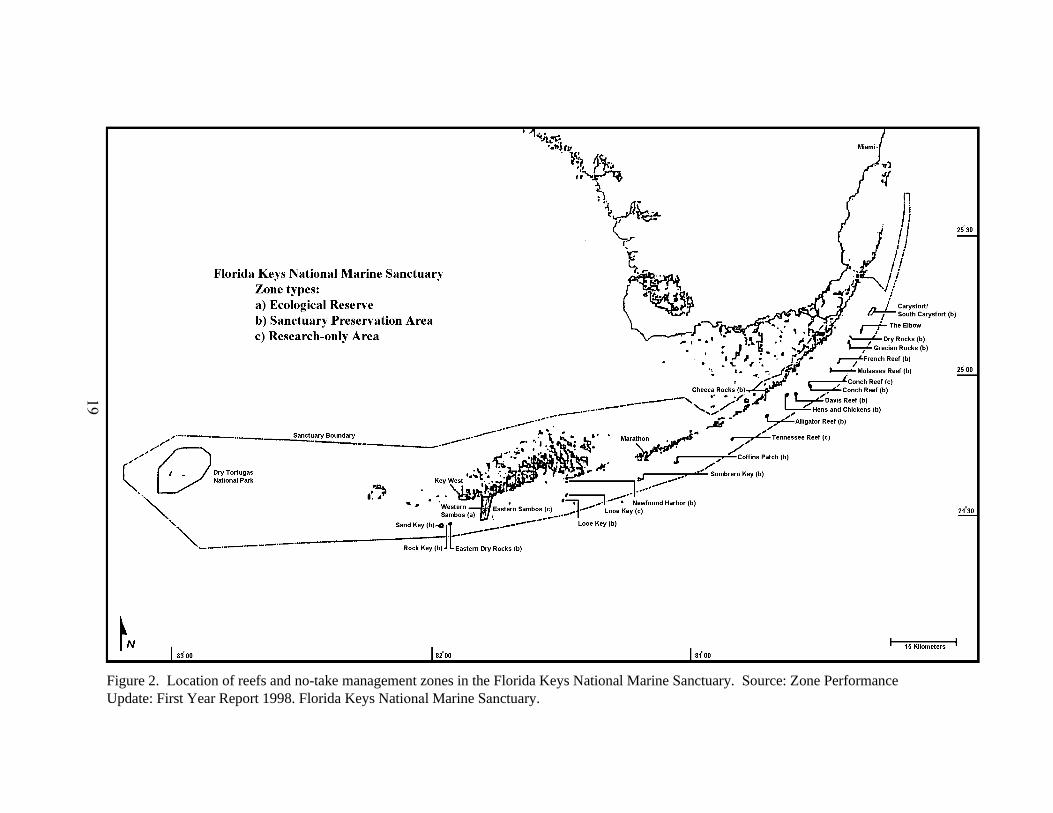
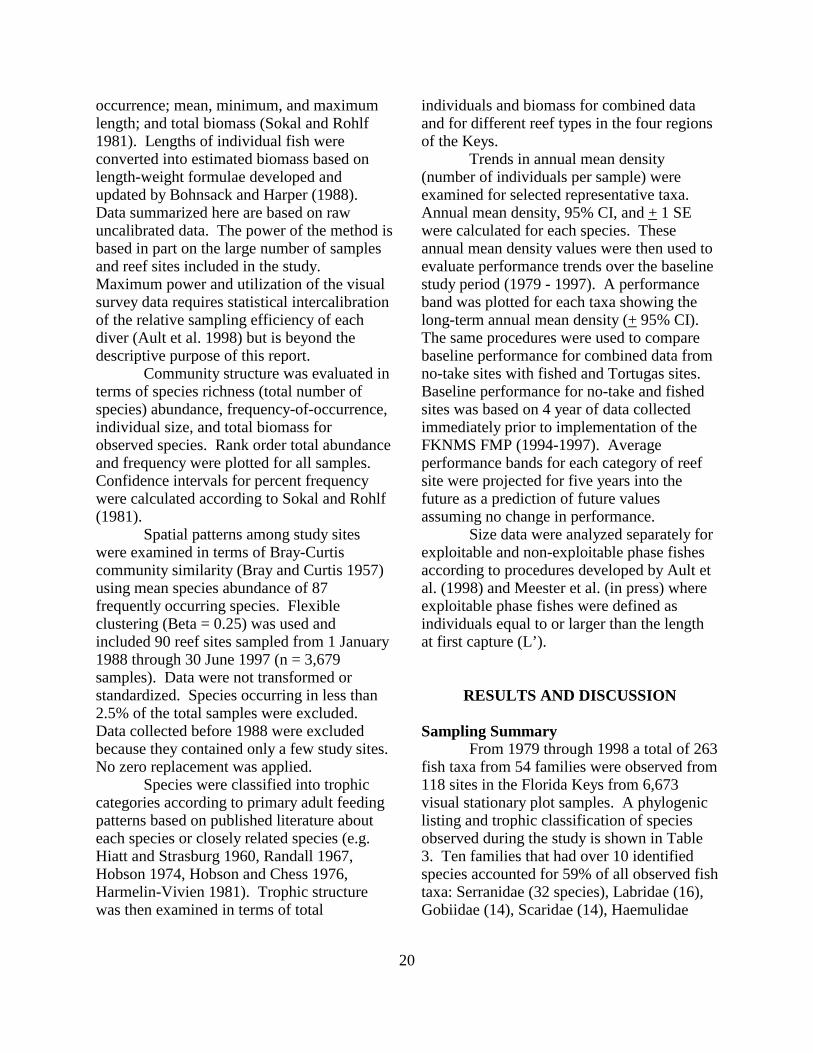
Figure 2. Location of reefs and no-take management zones in the Florida Keys National MarineSanctuary. Source: Zone Performance Update: First Year Report 1998. Florida Keys NationalMarine Sanctuary.
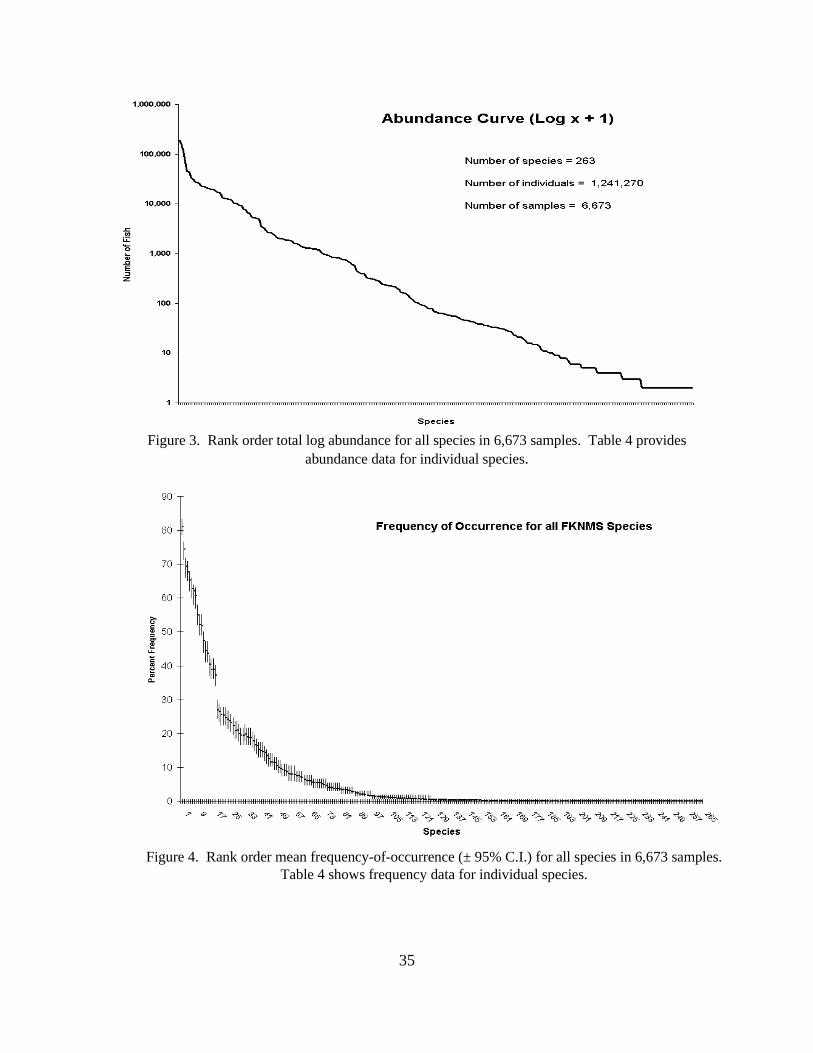
Figure 3. Rank order total log abundance for all species in 6,673 samples. Table 4 providesabundance data for individual species.
Figure 4. Rank order mean frequency-of-occurrence (+ 95% CI) for all species in 6,673 samples. Table 4 provides frequency data for individual species.
Figure 5. Bray-Curtis similarity dendogram of 90 reef sites sampled between 1 January 1988 and30 June 1997 (n = 3,679 samples). Major reef type for major groupings are noted. Transform =none, standardization = none, no zero replacement, and Beta = 0.25.
Figure 6. Mean trophic structure of reef fishes in the Florida Keys as percentages of totalindividuals (6a) and biomass (6b). n = 1,241,270 individuals, 6,673 samples, 118 reef sites. Data were collected from 1979 - 1998.
Figure 7. Reef fish trophic composition in numbers of individuals by reef type and region.
Figure 8. Reef fish trophic composition in biomass by reef type and region.
Figure 9. Changes in gray snapper mean density (total number of individuals observed per plot). (A) all sites; (B) Tortugas sites; (C) unfished sites with no-take protection beginning 1 July 1997;and (D) fished sites excluding the Tortugas. Bars show annual mean + 95% CI. Vertical linesshow annual mean + 1 SE Shaded areas show 95% CI for annual means through 1997 in Fig. Aand for 1994-1997 in Figs. B, C, and D. Shaded areas are projected beyond 1997 to showpredicted performance ranges after 1997. Table 1 shows annual sample size by site.
Figure 10. Changes in yellowtail snapper mean density (total number of individuals observed perplot). (A) all sites; (B) Tortugas sites; (C) unfished sites with no-take protection beginning 1 July1997; and (D) fished sites excluding the Tortugas. Bars show annual mean + 95% CI. Verticallines show annual mean + 1 SE Shaded areas show 95% CI for annual means through 1997 inFig. A and for 1994-1997 in Figs. B, C, and D. Shaded areas are projected beyond 1997 to showpredicted performance ranges after 1997. Table 1 shows annual sample size by site.
Figure 11. Changes in exploited grouper mean density (total number of individuals observed perplot). (A) all sites; (B) Tortugas sites; (C) unfished sites with no-take protection beginning 1 July1997; and (D) fished sites excluding the Tortugas. Bars show annual mean + 95% CI. Verticallines show annual mean + 1 SE Shaded areas show 95% CI for annual means through 1997 in
6
Fig. A and for 1994-1997 in Figs. B, C, and D. Shaded areas are projected beyond 1997 to showpredicted performance ranges after 1997. Table 1 shows annual sample size by site.
Figure 12. Changes in hogfish mean density (total number of individuals observed per plot). (A)all sites; (B) Tortugas sites; (C) unfished sites with no-take protection beginning 1 July 1997; and(D) fished sites excluding the Tortugas. Bars show annual mean + 95% CI. Vertical lines showannual mean + 1 SE Shaded areas show 95% CI for annual means through 1997 in Fig. A andfor 1994-1997 in Figs. B, C, and D. Shaded areas are projected beyond 1997 to show predictedperformance ranges after 1997. Table 1 shows annual sample size by site.
Figure 13. Changes in stoplight parrotfish mean density (total number of individuals observedper plot). (A) all sites; (B) Tortugas sites; (C) unfished sites with no-take protection beginning 1July 1997; and (D) fished sites excluding the Tortugas. Bars show annual mean + 95% CI. Vertical lines show annual mean + 1 SE Shaded areas show 95% CI for annual means through1997 in Fig. A and for 1994-1997 in Figs. B, C, and D. Shaded areas are projected beyond 1997to show predicted performance ranges after 1997. Table 1 shows annual sample size by site.
Figure 14. Changes in striped parrotfish mean density (total number of individuals observed perplot). (A) all sites; (B) Tortugas sites; (C) unfished sites with no-take protection beginning 1 July1997; and (D) fished sites excluding the Tortugas. Bars show annual mean + 95% CI. Verticallines show annual mean + 1 SE Shaded areas show 95% CI for annual means through 1997 inFig. A and for 1994-1997 in Figs. B, C, and D. Shaded areas are projected beyond 1997 to showpredicted performance ranges after 1997. Data for 1998 are plotted but not considered part of thebaseline. Table 1 shows annual sample size by site.
Figure 15. Changes in gray snapper mean density (total number of individuals observed per plot)for (A) exploitable (> 25.4 cm FL) and (B) non-exploitable sizes (< 25.4 cm FL) from all sites(1979-1998). Bars show annual mean + 95% CI. Vertical lines show + 1 SE. Shaded areasshow 95% CI for annual means through 1997. Shaded areas are projected beyond 1997 to showpredicted performance ranges assuming no changes. Data for 1998 are plotted but not consideredpart of the baseline. Table 1 shows annual sample size.
Figure 16. Changes in yellowtail snapper mean density (total number of individuals observed perplot) for (A) exploitable (> 30.5 cm FL) and (B) non-exploitable sizes (< 30.5 cm FL) from allsites (1979-1998). Bars show annual mean + 95% CI. Vertical lines show + 1 SE. Shaded areasshow 95% CI for annual means through 1997. Shaded areas are projected beyond 1997 to showpredicted performance ranges assuming no changes. Data for 1998 are plotted but not consideredpart of the baseline. Table 1 shows annual sample size.
Figure 17. Changes in combined grouper mean density (total number of individuals observed perplot) for (A) exploited sizes and (B) unexploited sizes from all sites (1979-1998). Size at firstcapture varies between species. Bars show annual mean + 95% CI. Vertical lines show + 1 SE. Shaded areas show 95% CI for annual means through 1997. Shaded areas are projected beyond1997 to show predicted performance ranges assuming no changes. Data for 1998 are plotted butnot considered part of the baseline. Table 1 shows annual sample size.
7
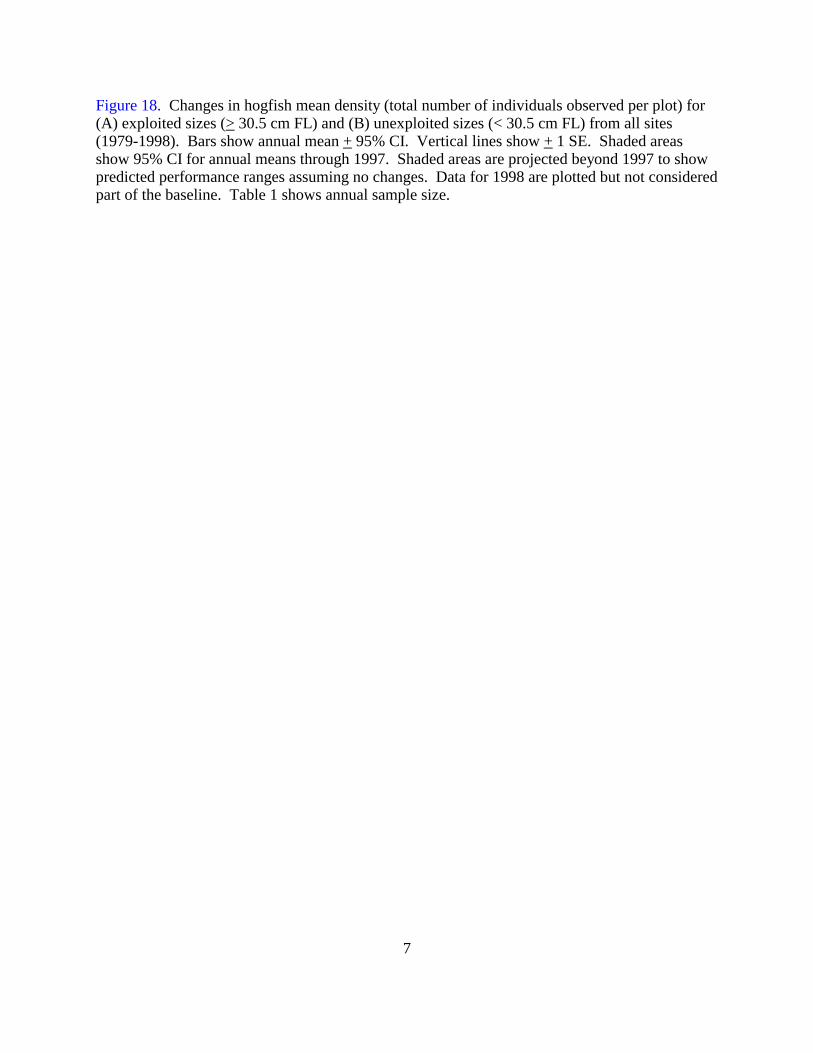
Figure 18. Changes in hogfish mean density (total number of individuals observed per plot) for(A) exploited sizes (> 30.5 cm FL) and (B) unexploited sizes (< 30.5 cm FL) from all sites(1979-1998). Bars show annual mean + 95% CI. Vertical lines show + 1 SE. Shaded areasshow 95% CI for annual means through 1997. Shaded areas are projected beyond 1997 to showpredicted performance ranges assuming no changes. Data for 1998 are plotted but not consideredpart of the baseline. Table 1 shows annual sample size.
8
INTRODUCTIONReef fishes are an essential and
conspicuous component of the South FloridaMarine Ecosystem. They support importantcommercial, recreational, and aestheticfisheries and are the ultimate downstreamintegrators of environmental conditions andhuman activities. Factors that increasemortality, such as pollution, fishing, and lossof habitat, are eventually reflected in adultpopulation abundance, individual size andcondition. The Caribbean and the FloridaKeys have experienced increased human useand resource degradation from coastaldevelopment, increased diving, and expandingrecreational and commercial fishing related toa growing resident and tourist population(Richards and Bohnsack 1990). In responseto these growing threats, the U.S. Congressestablished the Florida Keys National MarineSanctuary (FKNMS) in 1990. The finalmanagement plan (FMP) became effective onJuly 1, 1997. An important change is the useof spatial protection in the FKNMS includingthe establishment of the first planned networkof 'no-take' marine reserves. These included18 'no-take' Sanctuary Protected Areas (SPAs)and one large 'no-take' ecological reserve. This action provides a unique researchopportunity to examine the processes andeffects of reserve protection on restoring reeffish populations (e.g. PDT 1990, Bohnsack1996). An important goal of the FKNMSmanagement plan is to evaluate changesresulting from establishing no-take marinereserves five years after establishment.
Many reef species use inshore habitatsand Florida Bay as nursery and forage areasfor part of their life history before moving outto reef habitats as adults. Examples includebarracuda, hogfish, spiny lobster, mostsnapper and grouper, and many grunts. Florida Bay is a critical nursery habitat forpink shrimp, spiny lobster and many fishspecies in the Florida Keys. Over the last twodecades, Florida Bay has undergone dramatic
environmental changes which are the focus ofan intensive effort to restore the ecosystem byaltering the hydrology to a more naturalcondition1. This restoration program includesa comprehensive effort to understand andmodel the physical and biological processes ofFlorida Bay. Success of restoration andmanagement changes should be reflected inreef fish communities in terms of the speciescomposition, the size/age structure of fishes,and in fisheries. Fishes are a direct publicconcern and obvious measure of restorationsuccess. Understanding and modeling thedynamics of physical and biological processesof Florida Bay and the reef tract requires agood database on fish composition by habitat.
Visual methods are ideal for assessingreef fishes in the Florida Keys because of theprevailing clear water conditions on coralreefs and general management concernsrequiring the use of non-destructiveassessment methods. This report describesthe 20 year Southeast Fisheries ScienceCenter (SEFSC) visual database consisting ofnon-destructive, fishery-independent,stationary plot data on reef fish composition,abundance, and sizes from reefs in the FloridaKeys from Miami through the Tortugas. These data form a historical baseline forassessing future changes in reef fishcommunities in the Florida Keys as the resultof zoning changes in the FKNMSmanagement plan, regional fisherymanagement practices, and restoration effortsin Florida Bay. This research is a cooperativeeffort between investigators at the SEFSCunder the direction of Dr. James Bohnsackand at the University of Miami under thedirection of Dr. Jerald Ault. Support wasprovided by the NOAA South Florida
1Armentano, T.V., J. Hunt, D. Rudnick, N. Thompson, P. Ortner, M. Robblee, and R.Halley. 1997. Strategic Plan for the InteragencyFlorida Bay Science Program. Florida BayProgram Management Committee. 42p.
9
Ecosystem Restoration Prediction andModeling (SFERPM) program.
BACKGROUNDThe distribution and ecology of
southern Florida reef ecosystems (Fig. 1) hasbeen described in terms of geological history(Shinn 1963, Hoffmeister 1974), habitat (Japp1984), and oceanographic processes (Lee etal. 1992, 1994). The complex geology,hydrography, and marine ecology of the Keysand surrounding areas were described inseveral reviews (Jaap 1984; Continental ShelfAssociates, Inc. 1990; NOAA 1996).
Robins (1971) described the regionaldistribution and ecological patterns of fishes. Starck (1968) listed a total of 517 fish speciesin the Florida Keys of which 389 wereconsidered primary or secondary reef species. Limouzy-Paris et al. (1994) described thediversity of fish larvae in the Florida Keys. Other studies have examined fish populationsin mangrove prop roots (Thayer et al. 1987)and among basin and channel habitats inFlorida Bay (Thayer and Chester 1989). Fishand fisheries have been reviewed for southernFlorida (Bannerot, 1990), the Florida Keys(Chiappone and Sluka 1996), and the Tortugas(Longley and Hildebrand 1941, McKenna1997, Schmidt et al., in prep). Bohnsack et al.(1994) described total fish landings in theFlorida Keys. McClellan (1996) used aerialsurveys to describe boating activity patterns inthe Keys.
Database History. In response to limitationsof existing sampling methods, Bohnsack andBannerot (1983, 1986) developed a stationaryplot technique as a new, objective, andreliable method for assessing reef fishcommunity structure in any habitat. Bohnsack and Harper (1988) later developedlength-to-weight conversion formulae forestimating biomass of individual species. Procedures were later developed to
objectively distinguish length-frequencydistributions for exploitable and non-exploitable phases of individual species foruse in multispecies fishery assessments (Aultet al.1998; Meester et al., in press). Otherreports discussed applications for coral reefs(Bohnsack 1997), passive assessments(Bohnsack 1995), and artificial reefs (Bortoneand Bohnsack 1991)2.
The reef fish visual census samplingdatabase described in this report was first usedto assess the effects of spearfishing on reeffish community structure at reefs protectedfrom and exposed to spearfishing (Bohnsack1982). Later, reef fish assemblages wereassessed in different habitats of Looe KeyNational Marine Sanctuary (Bohnsack et al.1987). Preliminary changes in communitystructure in response to management changesat Looe Key Reef were reported by Clark etal. (1989). The database contributed to thedevelopment and location of protection zonesin the FMP for Florida Keys National MarineSanctuary (DOC 1996; Bohnsack 1997,1998). With the creation of the FKNMS, thenumber of sampling sites was expanded toassess regional reef fish biodiversity (Smith-Vanix et al.1995; Bohnsack and Ault, 1996). Ault et al. (1997, 1998) demonstrated thatvisual estimates of fish sizes agreed closelywith measurements obtained independentlyfrom fishery dependent samples of headboatlandings in the Florida Keys. The databasewas also used to assess condition andretrospective changes in reef fish stocks in theFlorida Keys (Ault et al. 1997, 1998). Theyshowed that a total of 13 of 16 groupers, 7 of13 snappers, and 2 of 5 grunts were found to
2Bohnsack, J.A. 1995. Visually basedmethods for monitoring coral reef fishes. Pages45-47 in Proceedings of the reef fish workshopfor the southeast area monitoring and assessmentprogram (Seamap). SEAMAP Reef Fish WorkGroup. Gulf States Marine FisheriesCommission. 76 p.
10
Figure 1. Map of the Florida Keys showing regional subdivisions and sampled reef sites (1979-1998). No fishingzones were established July 1, 1997 as part of the Florida Keys National Marine Sanctuary final managementplan.
Upper Keysand BNP
Middle Keys
Lower Keys andthe Marquesas
DryTortugas
! = Not Fished# = Dry Tortugasª = Fished
11
be below the 30% spawning potential ratio(SPR) federal definition of overfishing andthat some stocks appeared to have beenchronically overfished since the late 1970's. The visual database most recently was used tofacilitate site locations for marine reserves inthe Tortugas region (Schmidt et al. 1999, inprep.) and to assess reef fishes in BiscayneNational Park3.
The stationary plot method also has been usedto assess reef fishes in Broward County,Florida4, the Dry Tortugas (McKenna 1997),the U.S. Virgin Islands (Beets 1993), andother locations (e.g. Bortone et al. 1986). Additional visual monitoring of reef fishes inthe Florida Keys is being conducted by theReef Environmental Education Foundation(REEF) using volunteer divers and a roverdiver technique (Schmitt and Sullivan 1996,Pattengill-Semmens and Semmens1999)5,6,7,8.
Ongoing Activities This report describes data collected
from 1979 through 1998 which will provide abaseline for testing multiple hypothesesconcerning no-take marine reserves. Currentmonitoring is targeted to provide a 5-yearreview of the FKNMS Management Plan andto eventually evaluate changes in fishcommunities as the result of Florida Bayrestoration efforts. Spatial effects will bedirectly tested by comparing fish communitiesin similar habitats inside and outside ofdifferent management zones and areasimpacted by different water quality. Currentresearch under funding from the South FloridaEcosystem Restoration Program (SFERP) ismonitoring marine reserves and surroundingreference areas in the Florida Keys.
METHODSStudy Area
The Florida reef tract extendsapproximately 370 km from Key Biscayne tothe Dry Tortugas (Fig. 1). The Florida Keysare situated parallel to the Straits of Floridaand the Florida current to the south andFlorida Bay to the north. This coastalecosystem encompasses many varied habitats
3Harper, D.E., J.A. Bohnsack and B.Lockwood. (in review) Recreational Fisheries inBiscayne National Park, Florida, 1976-1991.
4Spieler, R.E. 1999. The marine fishesof Broward County, Florida: Report of 1998-99Survey Results. Unpublished Progress Report tothe Southeast Fisheries Science Center(NOAA/NMFS Order # 40GEN800140). 14 p.
5Bohnsack, J.A. 1996. Two visuallybased methods for monitoring coral reef fishes. Pages 31-36 in M.P. Crosby, G.R. Gibson, Jr., andK.W. Potts (eds). A coral reef symposium onpractical, reliable, low cost monitoring methodsfor assessing the biota and habitat conditions ofcoral reefs, January 26-27, 1995. Office of Oceanand Coastal Resource Management, NationalOceanic and Atmospheric Administration, SilverSpring, MD. 80 p.
6Schmitt, E. (Compiler). 1996. Status ofreef fishes in the Florida Keys National MarineSanctuary. The Nature Conservancy, MarineScience Conservation Center, U. of Miami, Coral
Gables, FL. 90 p.
7Schmitt, E., D.W. Feeley, and K.M.Sullivan. 1998. Surveying coral reef fishes: Amanual for data collection, processing, andinterpretation of fish survey information for thetropical northwest Atlantic. The NatureConservancy, Marine Science ConservationCenter, U. of Miami, Coral Gables, FL. 139 p.
8Pattengill-Semmens, C.V. and B.X.Semmens. 1999b. Assessment and monitoringapplications of a community-based monitoringprogram: The Reef Environmental EducationFoundation. A poster presented at the NationalCoral Reef Institute Meeting, April 1999, Ft.Lauderdale. Reef Environmental EducationFoundation, P.O. Box 246, Key Largo, FL. 13 p.
12
including freshwater marshes, estuaries,lagoons, mangrove stands, coral islands, seagrass beds, and coral reefs. Florida Bay andadjacent coastal estuaries serve as nurseryareas for spiny lobster and many juvenilefishes that migrate to reefs as adults. Forreporting purposes, study sites were dividedinto four regions: Upper, Middle, and LowerKeys, and the Tortugas (Table 1, Fig. 1).
Protected areas in the Florida Keyswere described by Smith-Vaniz et al. (1995)and the U.S. Department of Commerce9. TheFlorida Keys National Marine Sanctuary(FKNMS) covers the largest total area, 9,515km2 (3,673 mi2), and extends from Miami inthe east to beyond the Dry Tortugas in thewest. Other protected areas, movingapproximately east to west, include BiscayneNational Park (BNP), Key Largo NationalMarine Sanctuary, John Pennekamp CoralReef State Park, Biscayne Bay and CardSound Aquatic Preserve, and LignumvitaeAquatic Preserve in the Upper Keys. TheLower and Middle Keys include the NationalKey Deer Refuge, Coupon Bight AquaticPreserve, Looe Key National MarineSanctuary, the Great White Heron NationalRefuge, and the Key West Wildlife Refuge. Further west is Dry Tortugas National Park(DTNP). Everglades National Park (ENP)includes aquatic areas in Florida Bay north ofthe Keys.
Fisheries are regulated by state andfederal agencies. The state of Florida isresponsible for managing fisheries withinstate waters which include areas 3 nmioffshore on the Atlantic side and 9 nmioffshore on the Gulf of Mexico side of theKeys. The federal government has
responsibility outside state waters to the 200mi limit of the Exclusive Economic Zone(EEZ). In 1976, the U.S. Congress passed theMagnuson Fishery Conservation andManagement Act that established regionalFishery Management Councils (FMCs) toregulate fisheries in federal waters. TheSouth Atlantic FMC regulates federal waterson the Atlantic side of the Florida Keys whilethe Gulf of Mexico FMC regulates federalwaters on the Gulf side.
Levels of protection for individual reefsites in the Florida Keys have varied in spaceand time. Before July 1, 1997 five levels ofprotection existed (Tables 1 and 2). Since the1960's the most protected sites in the upperKeys were within Pennekamp Coral ReefState Park and the Key Largo National MarineSanctuary which prohibited spearfishing andtropical collecting (level 3). BiscayneNational Park prohibited spearfishing (level2). The lower and middle Keys were onlymanaged solely by regional fishery regulations(level 1). During this time Dry TortugasNational Park offered the highest level ofprotection (level 5) by allowing onlyrecreational hook-and-line. Looe Key Reef inthe lower Keys moved from level 1 to level 3(no spearfishing) in 1981 with theestablishment of the Looe Key NationalMarine Sanctuary.
On July 1, 1997, the FKNMS FMPbecame effective resulting in 8 levels ofprotection with the addition of three zonetypes that further limited extractive usage(Table 2). Catch-and-release trolling (level 6)was the only extractive activity allowed atAlligator, Conch, Sombrero, and Sand Keyreefs. Two kinds of 'no-take' zones were alsoadded. Level 7 'no-take' zones included onelarge (79 km2) marine ecological reserve(MER) in the Sambo region of the LowerKeys and 19 small (range 0.16 - 4 km2)Sanctuary Preservation Areas (SPAs)scattered throughout the Keys. Level 8protection does not allow any extraction or
9USDOC (U.S. Department ofCommerce). 1996. Florida Keys National MarineSanctuary: Final ManagementPlan/Environmental Impact Statement, Vol 1. Sanctuaries and Reserves Division, NationalOceanic and Atmospheric Administration. 319 p.
13
Table 1. Annual distribution of sampling effort by region and study site. Levels of protection are described in Table 2 and apply before and after 1 July 1997 when the FKNMS final management plan became effective. Boxed areas denote the protected sites. Locations are given in Appendix B.
Pre- Post-Geog. Site Protection ProtectionPosit. Level Level 1979 1980 1981 1982 1983 1984 1985 1986 1987 1988 1989 1990 1991 1992 1993 1994 1995 1996 1997 1998 Total
Number of Point SamplesOutside Sanctuary
1 GROUPER SITE 1 1 6 8 40 40 21 12 7 134
2 KEY BISCAYNE SITE 1 1 36 4 40
Total Outside Samples 0 0 0 0 36 4 6 8 40 40 21 0 0 0 0 0 0 12 0 7 174
Biscayne National Park (BNP)3 BNP: NE CORNER REEF 2 2 31 29 25 12 22 12 12 9 152
4 FOWEY ROCKS 2 2 8 12 9 29
5 BNP: BREWSTER REEF 2 2 20 51 29 12 24 12 12 12 172
6 BACHE SHOAL 2 2 12 12 9 33
7 BNP: TRIUMPH REEF 2 2 26 30 13 32 24 12 12 12 161
8 BNP: MARKER 14 2 2 22 46 30 20 11 13 9 151
9 BNP: PETREL POINT 2 2 12 28 11 12 9 72
10 BNP: STAR CORAL 2 2 22 16 13 12 10 73
11 BNP: AJAX REEF 2 2 10 16 32 12 28 24 12 12 12 158
12 BNP: ALINA'S 2 2 32 31 31 12 12 12 12 142
13 BNP: IGW TRUST 2 2 31 30 30 16 8 12 6 133
14 BNP: BALL BUOY 2 2 19 56 31 16 8 12 12 6 160
Total BNP 0 0 0 0 0 0 0 0 0 187 297 282 81 126 0 0 143 60 145 115 1436
Upper Keys (FKNMS) and John Pennekamp Coral reef State Park (JPSP)15 TURTLE REEF 3 3 16 12 12 6 46
16 BASIN HILL - OPEN 3 3 28 12 12 12 12 9 85
17 BASIN HILL - CLOSED 8 8 29 12 12 12 12 9 86
18 BASIN HILL - OPEN (NEW) 3 3 12 12 12 9 45
19 CARYSFORT REEF 3 7 3 10 6 16 9 24 11 15 9 103
20 CARYSFORT SOUTH REEF 3 7 12 13 9 9 43
21 GARDEN COVE 3 3 12 12 12 36
22 THE ELBOW 3 7 9 10 15 12 12 12 12 82
23 KEY LARGO DRY ROCKS 3 7 9 4 10 12 9 44
24 GRECIAN ROCKS 3 7 16 12 12 9 49
25 MOSQUITO BANK - OPEN 3 3 24 12 12 12 12 12 84
26 MOSQUITO BANK - OPEN (NEW) 3 3 12 12 12 12 48
27 MOSQUITO BANK - CLOSED 8 8 24 11 12 12 12 12 83
28 FRENCH REEF 3 7 11 18 14 21 14 20 12 11 9 130
29 WHITE BANK 3 3 8 7 15
30 MOLASSES REEF 3 7 4 35 52 53 29 63 52 12 9 6 64 14 32 12 12 12 6 467
31 TRIANGLES 1 3 11 6 17
32 PICKLES REEF 1 3 22 11 6 39
33 CONCH REEF 1 6 6 10 12 12 12 9 61
34 DAVIS REEF 1 7 9 12 12 6 39
35 CROCKER REEF 1 3 30 12 8 50
Total Upper Keys (FKNMS) and JPSP 4 47 116 71 43 69 52 12 9 6 0 0 91 105 111 207 209 156 165 179 1652
Middle Keys (FKNMS)36 HEN AND CHICKENS 1 7 12 12 12 36
37 CHEECA ROCKS 1 7 19 12 31
38 ALLIGATOR REEF 1 6 12 20 12 9 53
39 TENNESSEE REEF (RESEARCH) 1 8 13 28 9 50
40 TENNESSEE REEF (FISHED) 1 1 21 29 6 56
41 COFFIN PATCH 1 7 12 12 24
42 WEST TURTLE SHOAL 1 1 12 12 24
43 DELTA SHOAL 1 1 12 6 12 12 12 54
44 SOMBRERO KEY 1 6 11 43 7 12 12 12 12 109
Total Middle Keys (FKNMS) 0 0 0 23 0 55 0 0 0 0 0 0 13 0 12 24 66 0 148 96 437
14
Table 1 (cont.)Pre- Post-
Geog. Site Protection ProtectionPosit. Level Level 1979 1980 1981 1982 1983 1984 1985 1986 1987 1988 1989 1990 1991 1992 1993 1994 1995 1996 1997 1998 Total
Number of Point SamplesLower Keys (FKNMS)
45 NO NAME REEF 1 1 9 9
46 LOOE KEY - EAST 3 7 3 12 12 12 39
47 LOOE KEY - WEST 3 7 3 28 13 12 12 68
48 LOOE KEY - OTHER 3 7 9 98 87 95 426 101 66 13 24 30 95 25 18 12 1099
49 LOOE KEY RESEARCH 1 8 14 12 26
50 BIG PINE SHOAL 1 1 12 9 21
51 NEWFOUND HARBOR KEY (SPA E) 1 7 16 13 9 38
52 NEWFOUND HARBOR KEY (SPA W) 1 7 6 4 12 12 34
53 NEWFOUND HARBOR KEY (FISHED) 1 1 16 12 9 37
54 AMERICAN SHOAL 1 1 20 12 12 44
55 MARYLAND SHOAL 1 1 12 12
56 PELICAN SHOAL 1 1 10 12 22
57 EASTERN SAMBO 1 8 19 8 12 12 28 79
58 MIDDLE SAMBO 1 1 20 9 12 12 24 77
59 WESTERN SAMBO - EAST 1 7 19 21 12 21 24 97
60 15-13 SAMBOS 1 7 12 12 24
61 12-12 SAMBOS 1 1 12 15 27
62 14 SAMBOS 1 7 12 12 24
63 PETE'S PINNACLE 1 1 12 12 24
64 WESTERN SAMBO - WEST 1 7 18 40 12 21 24 115
65 EASTERN DRY ROCKS 1 7 12 12 13 37
66 EASTERN DRY ROCKS (FISHED) 1 1 12 12 24
67 ROCK KEY 1 7 12 12 12 13 49
68 MARKER 56 1 7 19 12 17 48
69 KEY WEST (INSHORE FISHED) 1 1 8 8
70 KEY WEST (WESTERN FISHED) 1 1 12 12
71 KEY WEST (EASTERN FISHED) 1 1 8 12 14 34
72 ANNE'S ANCHORAGE 1 7 12 15 27
73 DOUG'S DEN 1 1 12 12 24
74 SAND KEY 1 6 12 23 12 12 12 71
75 WESTERN DRY ROCKS 1 1 12 12 24
Total Lower Keys (FKNMS) 9 98 93 95 426 101 66 13 24 30 0 0 95 25 136 40 211 97 321 394 2274
Marquesas Keys (FKNMS)76 COSGROVE SHOAL 1 1 11 22 33
77 MARQUESAS ROCKS 1 1 9 9
78 28 FOOT SHOAL 1 1 12 12
79 DEVIL'S REEF 1 1 8 8
Total Marquesa Keys (FKNMS) 0 0 0 0 0 0 0 0 0 0 0 0 0 0 0 11 43 8 62
Total FKNMS, BNP, JPSP 13 145 209 189 505 229 124 33 73 263 318 282 280 256 259 282 672 325 787 791 6035
15
Table 1 (cont.)Pre- Post-
Geog. Site ProtectionProtectionPosit. Level Level 1979 1980 1981 1982 1983 1984 1985 1986 1987 1988 1989 1990 1991 1992 1993 1994 1995 1996 1997 1998 Total
Number of Point SamplesTortugas Area (FKNMS) and Dry Tortugas National Park (DTNP)Inside DTNP
80 PULASKI SHOAL 5 5 14 11 12 24 61
81 TEXAS ROCK 5 5 11 12 14 37
82 LOGGERHEAD KEY 5 5 21 12 10 12 55
83 LONG KEY (BIRD KEY) 5 5 28 12 12 22 12 86
84 TWIN PEAKS 5 5 10 10
85 LITTLE AFRICA 5 5 26 12 13 51
86 REPLENISHMENT ZONE 5 5 8 8
87 WHITE SHOAL 5 5 14 12 31 57
88 MARKER H 5 5 4 4
89 MAVRO VETRANIC 5 5 9 9
90 GUY'S GROTTO 5 5 12 12
91 DAVE'S FINAL FRONTIER 5 5 12 12
92 JOE'S CRACK 5 5 0
93 GEORGE'S GORGE 5 5 0
94 FRENCH WRECK 5 5 0
Total Inside DTNP 0 0 0 0 0 0 0 0 0 0 0 0 0 0 0 132 23 72 139 36 402Outside DTNP (FKNMS)
95 TORTUGAS BANK (PINNACLES) 1 1 12 9 21
96 JOE'S HUMP 1 1 16 16 32
97 HANGOVER REEF 1 1 12 12
98 8 FATHOM ROCK 1 1 8 8
99 BLACK CORAL ROCK 1 1 8 8
100 HUMP 1 1 1 5 5
101 CROSBY'S HUMP 1 1 12 7 19
102 HUMP 2 1 1 3 3
103 TORTUGAS FLAT 1 1 5 5
104 GARY'S ANCHOR 1 1 6 6
105 HUMP 3 1 1 6 6
106 CECILY'S SITE 1 1 3 6 9
107 LITTLE BANK 1 1 8 8
108 SHERWOOD FOREST 1 1 8 6 14
109 FANTOM REEF 1 1 10 10
110 GEORGE'S ROCK 1 1 10 10
111 RALPH'S RIDGE 1 1 12 12
112 POTT'S PEAK 1 1 12 12
113 TORTUGAS BANK SITE11 1 1 6 6
114 TORTUGAS BANK SITE18 1 1 6 6
115 TORTUGAS BANK SITE25 1 1 6 6
116 TORTUGAS BANK SITE51 1 1 6 6
117 TORTUGAS PARK SITE52 1 1 6 6
118 TORTUGAS PARK SITE82 1 1 6 6
Total Outside DTNP (FKNMS) 0 0 0 0 0 0 0 0 0 0 0 0 0 0 0 40 9 28 67 92 236Total Tortugas Area (FKNMS) and DTNP 0 0 0 0 0 0 0 0 0 0 0 0 0 0 0 172 32 100 206 128 638
Total All Sites 13 145 209 189 505 229 124 33 73 263 318 282 280 256 259 454 704 425 993 919 6673
16
Table 2. Summary of protection levels spatially applied to extractive activities inthe Florida Keys. Protection levels range from a low of 1 to 8, the highest. PL 1. Open access under regional regulations. This is the lowest level of protection andencompasses the largest area. It includes all areas under current state and federal fisheriesand resource regulations. These include general size limits, bag limits, and gear restrictionsestablished by Florida and the South Atlantic Fishery Management Council for the region. These area are open to commercial and recreational fishing for spearfishing, lobster diving andfishing, hook-and-line fishing, tropical fish collecting, etc.
PL 2. No marine life collecting. Biscayne National Park. All other extractive activitiespermitted under regional regulations.
PL 3. No spearfishing. Florida waters in the Upper Keys have banned spearfishing since the1960s.
PL 4. No spearfishing or marine life collecting. These are historically protected areas thatinclude John Pennekamp Coral Reef State Park and the former Key Largo National MarineSanctuary since the 1960s. The former Looe Key National Marine Sanctuary (fore reefexcluded, see PL5) was included in 1981. These area are open to commercial and recreationalfishing with hook-and-line, and lobster fishing with traps or by diving.
PL 5. No spearfishing, lobster harvesting, collecting, or commercial fishing. This is thearea inside of the Dry Tortugas National Park. Recreational hook-and-line fishing and 'no-take'diving are allowed. The Looe Key fore reef area is included due to the protection it receivedbetween 1981 and 1997 (it is now a SPA under PL 7).
PL 6. Catch-and-release fishing only. This includes four experimental"Sanctuary Protected Areas" [sic] which are 'no-take' except for catch-and-release troll fishing. All other take is prohibited. Skin and SCUBA diving are allowed. These areas are: Conch Reef(shallow), Alligator Reef, Sombrero Reef, and Sand Key.
PL 7. No extractive removals “no-take”. This includes 19 Sanctuary Protected Areas(SPAs) and the Sambos Ecological Reserve (ER). No fishing or other taking are allowed. Skinand SCUBA diving are allowed.
PL 8. Permitted research only. No extractive activities and no skin or SCUBA divingallowed. In the FKNMS three of these zones are intended to examine the impacts of divers onreefs: Looe Key Research, Eastern Sambo, Tennessee Reef. One zone (Conch Reef, deep)is the site of the NURC Aquarius project. Two additional small, no entry, patch reef sites wereestablished in 1992 in John Pennekamp Coral Reef State Park at Mosquito Banks and BasinHill Shoals.
17
entry except for permitted research at ConchReef, Tennessee, Looe Key Research, andEastern Sambo Reefs.
Table 1 shows the classificationchanges for each sampled site by level ofprotection before and after 1 July 1997. Fourreefs moved from level 1 to level 6 and weredistributed in the upper (1), middle (2), andlower (1) Keys. Seven reefs moved fromlevel 3 to level 7 protection; six in the upperand one in the lower Keys. Eleven reef sitesmoved from level 1 to level 7 protection;three in the middle Keys and eight in thelower Keys. Dry Tortugas National Park isclassified at level 5 protection although thelevel of protection changed by prohibitingrecreational lobster harvesting and later byprohibiting headboat fishing within Parkboundaries.
Field MethodsBiological data on reef fish
biodiversity were collected continuously since1979 using visual methods by highly trainedand experienced divers using open circuitSCUBA. Visual methods are ideal forassessing reef fishes in the Florida Keysbecause of prevailing good visibility andmanagement concerns requiring the use ofnon-destructive assessment methods. Datawere collected by a stationary diver centeredin a randomly selected 7.5 m radius circularplot using a standard fishery-independent,stationary plot method (Bohnsack andBannerot 1986). The plot method is non-destructive and provides reliable quantitativeestimates of species composition, abundance(density per plot), frequency-of-occurrence,and individual size composition for the reeffish community. Management concernsrequired non-destructive sampling methodswherever possible. Reef sites were sampledfrom Miami through the Tortugas region.
At study sites, divers first recorded thespecies observed in five min within randomlyselected 7.5 m radius circular plots. Then
data were collected for each species on theirabundance in the plot and the minimum, meanand maximum lengths of each species. Divers attempted to record all fish observedwithin each imaginary cylinder extendingfrom the bottom to the limits of verticalvisibility (usually the surface). Depth, bottomcomposition, and estimated percentage coverwere recorded for each plot from the polarperspective of the centrally located observer. A ruler held out perpendicularly at the end ofa meter stick aided in making size estimatesby reducing apparent magnification errors. Obtaining accurate and precise visualestimates of fish length underwater requireswell-trained and experienced observersbecause objects in water appear magnified andcloser than their actual range (Bell et al. 1985;Bellwood and Alcala 1988, Harvey andShortis 1996). To improve accuracy, diverscontinuously calibrated their length estimatesusing the 30 cm ruler and meter-stick. Diverswith calibration sticks have been shown toobtain a mean accuracy of 86% for lengthestimates (St. John et al., 1990).
A rigorous sampling regime was usedto avoid bias and prevent counting the sameindividuals more than once. Divers beganeach sample by facing in one direction andlisting all species within the field of viewinside the sample radius. When no newspecies were noted, new sectors were scannedby rotating in one direction. New specieswere listed as observed and rotationscontinued for five min. Several completerotations were usually made for each plot. Divers periodically calibrated their estimatesof the sample radius with the meter stick orfiberglass tape. Species with few individuals(e.g. angelfish, barracuda, hogfish) werecounted and size estimated immediately. Species that were highly mobile and unlikelyto remain in the area (e.g. sharks, carangids,Clepticus parrai) were tabulated when firstobserved and then ignored. Common speciesthat were reliably always in the sample area
18
(e.g. damselfish, wrasses, etc.) were initiallylisted only and later tabulated after the initial5 min sample period when divers would makeone 360o rotation for each species by workingback up the list in reverse order of recording. This procedure eliminated potential bias inselecting to count a species when they wereparticularly abundant or obvious. The timerequired to record each sample averaged 15-20 min (range 5 - 30), depending on the plot.
Experimental DesignSampling was conducted at inshore
and offshore reef sites along the Florida reeftract from Miami to the Dry Tortugas (Fig. 2). Different areas of the reef track have haddifferent levels of protection and differenthistorical manage ment policies (Table 2). Sampling has been concentrated in the springand summer when sea conditions aregenerally calm and water conditions mostsuitable for visual sampling (Bohnsack andBannerot 1986, Bohnsack et al., 1987). Actual sampling intensity has varied on ayearly basis as determined by weather,logistics, funding, scheduling, and personnelconsideration. In recent years we have beeninvestigating modifications in the surveydesign to increase the precision in theestimates.
This report describes baselineestimates of the abundance and sizedistributions of all observable reef fishpopulations based on samples takencontinuously from 1979 to 30 June 1996,before the FKNMS FMP became effective. The years 1997 and 1998 are consideredtransition years following changes inmanagement actions for the FKNMS. Theexperimental design was established to testfactors in time and space. Time comparisonscan be made at all sites before and afterzoning changes (increased protection) becameeffective in 1997. Also, spatial comparisonscan be made between sites with differentlevels of protection. The ultimate goal is to
examine the effectiveness of different levelsof management protection along the Keys. Eventually the effectiveness of different sizedprotected areas will be examined.
The null hypotheses is no change forspecific parameters in space or over time. The geographical distribution, sizes, types,and numbers of protected areas in theFKNMS provide opportunities to evaluatetypes and sizes of zone protection. Zonesprovide different treatments in terms of thelevels of protection and often includereplicated sites of different size. Specifichypotheses and alternatives can then be testedto evaluate various levels and spatial scales ofprotection. In order for no-take marinereserves to be effective, for example, it isnecessary (but not sufficient) to show thatreserves increase spawning potential andprotect biodiversity. Spawning potential canbe increased by increasing abundance and sizestructure through differential mortality insideversus outside reserves.
Paired reef sites that differed in levelof protection were selected for monitoringpurposes. Where possible, the two sites werechosen to be in close proximity and as similarin terms of habitat structure and size aspossible. Newly protected SPAs wereapproximately paired (where possible) with alevel 1 or 2 protected site. SPAs areconsidered replicates because they are similarin size. Both SPAs and MER can beconsidered as "controls" for assessing impactsof fishing because they have minimum directhuman extractive impacts even though weexpect them to change over the short andintermediate term. Sites with different levelsof fishing and other extractive activities canbe considered "treatment" sites.
Analytical MethodsStatistical descriptions were made for
each observed species showing mean, totaland standard deviation of abundance;absolute, range, and percent frequency-of-
19
Figure 2. Location of reefs and no-take management zones in the Florida Keys National Marine Sanctuary. Source: Zone PerformanceUpdate: First Year Report 1998. Florida Keys National Marine Sanctuary.
19
20
occurrence; mean, minimum, and maximumlength; and total biomass (Sokal and Rohlf1981). Lengths of individual fish wereconverted into estimated biomass based onlength-weight formulae developed andupdated by Bohnsack and Harper (1988). Data summarized here are based on rawuncalibrated data. The power of the method isbased in part on the large number of samplesand reef sites included in the study. Maximum power and utilization of the visualsurvey data requires statistical intercalibrationof the relative sampling efficiency of eachdiver (Ault et al. 1998) but is beyond thedescriptive purpose of this report.
Community structure was evaluated interms of species richness (total number ofspecies) abundance, frequency-of-occurrence,individual size, and total biomass forobserved species. Rank order total abundanceand frequency were plotted for all samples. Confidence intervals for percent frequencywere calculated according to Sokal and Rohlf(1981).
Spatial patterns among study siteswere examined in terms of Bray-Curtiscommunity similarity (Bray and Curtis 1957)using mean species abundance of 87frequently occurring species. Flexibleclustering (Beta = 0.25) was used andincluded 90 reef sites sampled from 1 January1988 through 30 June 1997 (n = 3,679samples). Data were not transformed orstandardized. Species occurring in less than2.5% of the total samples were excluded. Data collected before 1988 were excludedbecause they contained only a few study sites. No zero replacement was applied.
Species were classified into trophiccategories according to primary adult feedingpatterns based on published literature abouteach species or closely related species (e.g.Hiatt and Strasburg 1960, Randall 1967,Hobson 1974, Hobson and Chess 1976,Harmelin-Vivien 1981). Trophic structurewas then examined in terms of total
individuals and biomass for combined dataand for different reef types in the four regionsof the Keys.
Trends in annual mean density(number of individuals per sample) wereexamined for selected representative taxa. Annual mean density, 95% CI, and + 1 SEwere calculated for each species. Theseannual mean density values were then used toevaluate performance trends over the baselinestudy period (1979 - 1997). A performanceband was plotted for each taxa showing thelong-term annual mean density (+ 95% CI). The same procedures were used to comparebaseline performance for combined data fromno-take sites with fished and Tortugas sites. Baseline performance for no-take and fishedsites was based on 4 year of data collectedimmediately prior to implementation of theFKNMS FMP (1994-1997). Averageperformance bands for each category of reefsite were projected for five years into thefuture as a prediction of future valuesassuming no change in performance.
Size data were analyzed separately forexploitable and non-exploitable phase fishesaccording to procedures developed by Ault etal. (1998) and Meester et al. (in press) whereexploitable phase fishes were defined asindividuals equal to or larger than the lengthat first capture (L’).
RESULTS AND DISCUSSION
Sampling SummaryFrom 1979 through 1998 a total of 263
fish taxa from 54 families were observed from118 sites in the Florida Keys from 6,673visual stationary plot samples. A phylogeniclisting and trophic classification of speciesobserved during the study is shown in Table3. Ten families that had over 10 identifiedspecies accounted for 59% of all observed fishtaxa: Serranidae (32 species), Labridae (16),Gobiidae (14), Scaridae (14), Haemulidae
21
(13), Pomacentridae (13), Carangidae (12),Lutjanidae (11), Balistidae (11) and Clinidae(11).
A total of 118 reef sites weresampled through 1998. The distribution ofsample effort by study site and year is shownin Table 1. Larger and fragmented reefs weredivided into multiple sites (e.g. Carysfort,Looe Key, Newfound Harbor, and WesternSambo). Prior to 1987 most samples werecollected from Molasses Reef in the UpperKeys and Looe Key Reef in the Lower Keys. Sampling in the Tortugas began in 1994. Sampling effort was most intense in recentyears with over 650 samples being collectedannually in 1995, 1997, and 1998.
Community Structure Statistical descriptions of individual
species and unidentified taxa for all 6,673samples are provided in Table 4. Descriptivestatistics include the total number of observedindividuals; frequency and percentoccurrence; abundance mean, standarddeviation, and range; mean, minimum, andmaximum observed length, and estimatedtotal biomass for each species. Plots of rankorder total abundance versus log abundancefor all species and samples (Fig. 3) show aclassic linear pattern of community structurecharacteristic of highly diverse ecosystems(Hubbell, 1979).
Rank order frequency-of-occurrenceby species for all samples shows that mostspecies rarely occur and that 95% confidenceintervals are well defined (Fig. 4). Becausethe stationary plot technique provides largesample sizes, percent frequency becomes auseful statistic for detecting changes infrequency-of-occurrence. It should beespecially sensitive and useful for detectingany increased occurrence of rare species.
The ten most abundant speciesaccounted for 59% of all individuals observed(Table 4). These include in decreasing order:bluehead (Thalassoma bifasciatum, 188,037),
bicolor damselfish (Pomacentrus partitus,151,266), tomtate (Haemulon aurolineatum,115,696), sergeant major (Abudefdufsaxatilis, 68,357), striped parrotfish (Scaruscroicensis, 45,114), yellowtail snapper(Ocyurus chrysurus, 43,967), bluestripedgrunt (H. sciurus, 33,268), white grunt (H.plumieri, 31,577), masked goby(Coryphopterus personatus, 27,726), andFrench grunt (H. flavolineatum, 27,342).
Ten species had greater than 50%frequency-of-occurrence in plot samples(Table 4) and are listed below in decreasingorder. The five species underlined were alsoamong the ten most abundant species:bluehead (81.0%), redband parrotfish(Sparisoma aurofrenatum, 69.4%), blue tang(Acanthurus coeruleus, 67.7%), stripedparrotfish (65.3%), stoplight parrotfish (S.viride, 62.8%), ocean surgeon (A. bahianus,62.2%), yellowtail snapper (60.7%), yellowhead wrasse (Halichoeres garnoti,55.0%), French grunt (52.0%), and whitegrunt (51.7%).
Ten species accounted for 55% of thetotal observed biomass (Table 4) and arelisted below in decreasing order. The threespecies underlined were also among the tenmost abundant species observed: tarpon(Megalops atlanticus, 8,869 kg), barracuda(Sphyraena barracuda, 7,641 kg), yellowtailsnapper (6,253 kg), bluestriped grunt (4,556kg), gray snapper (Lutjanus griseus, 4,287kg), Bermuda chub (Kyphosus sectatrix, 3,392kg), tomtate (3,205 kg), stoplight parrotfish(2,832 kg), smallmouth grunt (H.chrysargyreum, 2,755 kg), and yellowgoatfish (Mulloidichthys martinicus 2,596kg).
Site ComparisonsA dendogram shows the Bray-Curtis
similarity analysis for 90 reef sites sampledbetween 1 January 1988 and 30 June 1997 (n= 3,679 samples) (Fig. 5). Reef sites clusteredprimarily between inshore patch
22
Table 3. Phylogenic listing of families and species observed in visual samples from the Florida Keys (1979-1998). Names are according to Robins et al. (1986, 1991) with the exception that Hypoplectrus species (denoted by #) which were all listed as H. unicolor in Robins et al. (1991) and are named.according to Stokes (1980). The species codes was derived from the first three and four letters, respectively, of the genus and trivial species name. Trophic level codes: B, browser; F, piscivore;H, herbivore; Ma, macroinvertivore; Mi, microinvertivore; P, planktivore. Predominate adult trophic modeindicated in bold.
FAMILY Scientific Family Species Trophic SpeciesNAME name common name common name Level Code
RHINCODONTIDAE Carpet sharks
Ginglymostoma cirratum nurse shark Ma,F GIN CIRR
CARCHARHINIDAE Requiem sharks
Carcharhinus limbatus blacktip shark F CAR LIMB
SPHYRNIDAE Hammerhead sharks
Sphyrna lewini scalloped hammerhead F,Ma SPH LEWI
Sphyrna mokarran great hammerhead F,Ma SPH MOKA
DASYATIDAE Stingrays
Dasyatis americana southern stingray Ma DAS AMER
UROLOPHIDAE Round stingrays
Urolophus jamaicensis yellow stingray Ma,Mi URO JAMA
MYLIOBATIDAE Eagle rays
Aetobatus narinari spotted eagle ray Ma AET NARI
MOBULIDAE Mantas
Manta birostris manta P MAN BIRO
ELOPIDAE Tarpons
Megalops atlanticus tarpon F MEG ATLA
MURAENIDAE Morays
Gymnothorax funebris green moray F,Ma GYM FUNE
Gymnothorax miliaris goldentail moray F,Ma GYM MILI
Gymnothorax moringa spotted moray F GYM MORI
Gymnothorax saxicola honeycomb moray F,Ma GYM SAXIGymnothorax vicinus purplemouth moray F,Ma GYM VICI
23
Table 3. (cont.)FAMILY Scientific Family Species Trophic SpeciesNAME name common name common name Level Code
CLUPEIDAE Herrings
Harengula jaguana scaled sardine P HAR JAGU
Jenkinsia lamprotaenia dwarf herring P JEN LAMP
Jenkinsia species unknown herring P JEN SPE.
OGCOCEPHALIDAE Batfishes
Ogcocephalus species unknown batfish Ma,F OGC SPE.
EXOCETIDAE Flyingfishes
Hemiramphus brasiliensis ballyhoo F HEM BRAS
BELONIDAE Needlefishes
Tylosurus crocodilus houndfish F TYL CROC
ATHERINIDAE Silversides
Atherinomorus stipes hardhead silverside P ATH STIP
Hypoatherina harringtonensis reef silverside P HYP HARR
HOLOCENTRIDAE Squirrelfishes
Holocentrus adscensionis squirrelfish Ma,Mi HOL ADSC
Holocentrus coruscus reef squirrelfish Ma,Mi HOL CORU
Holocentrus marianus longjaw squirrelfish Ma,Mi HOL MARI
Holocentrus rufus longspine squirrelfish Ma,Mi HOL RUFU
Holocentrus spe. unidentified squirrelfish Ma,Mi HOL SPE.
Holocentrus vexillarius dusky squirrelfish Ma,Mi HOL VEXI
Myripristis jacobus blackbar soldierfish P MYR JACO
Ostichthys trachypoma bigeye soldierfish Mi,P OST TRAC
AULOSTOMIDAE Trumpetfishes
Aulostomus maculatus trumpetfish F AUL MACU
SCORPAENIDAE Scorpionfishes
Scorpaena plumieri spotted scorpion fish F SCO PLUM
FISTULARIIDAE Cornetfishes
Fistularia tabacaria bluespotted cornetfish F FIS TABA
24
Table 3. (cont.)FAMILY Scientific Family Species Trophic SpeciesNAME name common name common name Level Code
CENTROPOMIDAE Snooks
Centropomus undecimalis common snook F,Ma CEN UNDE
SERRANIDAE Sea basses
Diplectrum formosum sand perch Ma,Mi DIP FORM
Epinephelus adscensionis rock hind Ma,F EPI ADSC
Epinephelus cruentatus graysby F,Ma EPI CRUE
Epinephelus fulvus coney F,Ma EPI FULV
Epinephelus guttatus red hind Ma,F EPI GUTT
Epinephelus inermis marbled grouper F,Ma EPI INER
Epinephelus itajara jewfish Ma,F EPI ITAJ
Epinephelus morio red grouper F,Ma EPI MORI
Epinephelus striatus Nassau grouper F,Ma EPI STRI
Hypoplectrus chlorurus # yellowtail hamlet Mi HYP CHLO
Hypoplectrus gemma # blue hamlet Mi HYP INDI
Hypoplectrus guttavarius # shy hamlet Mi HYP GEMM
Hypoplectrus (hybrid) # hybrid hamlet Mi HYP HYBR
Hypoplectrus indigo # indigo hamlet Mi HYP GUTT
Hypoplectrus nigricans # black hamlet Mi HYP NIGR
Hypoplectrus puella # barred hamlet Mi HYP PUEL
Hypoplectrus sp. # unidentified hamlet Mi HYP SPE.
Hypoplectrus (tan) # tan hamlet Mi HYP TANN
Hypoplectrus unicolor # butter hamlet Mi HYP UNIC
Liopropoma eukrines wrasse bass Ma LIO EUKR
Mycteroperca bonaci black grouper F,Ma MYC BONA
Mycteroperca interstitialis yellowmouth grouper F,Ma MYC INTE
Mycteroperca microlepis gag F,Ma MYC MICR
Mycteroperca phenax scamp F,Ma MYC PHEN
Mycteroperca tigris tiger grouper F,Ma MYC TIGR
Mycteroperca venenosa yellowfin grouper F,Ma MYC VENE
Paranthias furcifer creole-fish P,F PAR FURC
Rypticus saponaceus greater soapfish F,Ma RYP SAPO
Serranus baldwini lanternfish Mi SER BALD
Serranus tabacarius tobaccofish Mi SER TABA
Serranus tigrinus harlequin bass Mi SER TIGR
Serranus tortugarum chalk bass Mi SER TORT
PRIACANTHIDAE Bigeyes
Priacanthus arenatus bigeye F,Ma,P PRI AREN
Priacanthus cruentatus glasseye snapper Ma,P PRI CRUE
APOGONIDAE Cardinalfishes
Apogon binotatus barred cardinalfish P APO BINO
Apogon pseudomaculatus twospot cardinalfish P APO PSEU
25
Table 3. (cont.)FAMILY Scientific Family Species Trophic SpeciesNAME name common name common name Level Code
MALACANTHIDAE Tilefishes
Malacanthus plumieri sand tilefish Mi,Ma MAL PLUM
ECHENEIDAE Remoras
Echeneis naucrates sharksucker F,Ma ECH NAUC
CARANGIDAE Jacks
Alectis ciliaris African pompano Ma ALE CILI
Caranx bartholomaei yellow jack F CAR BART
Caranx crysos blue runner F CAR CRYS
Caranx hippos crevalle jack F CAR HIPP
Caranx latus horse-eye jack F,Ma CAR LATU
Caranx ruber bar jack F,Ma CAR RUBE
Caranx spe. unidentified jack F,Ma CAR SPE.
Decapterus macarellus mackerel scad P DEC MACA
Decapterus punctatus round scad P DEC PUNC
Elagatis bipinnulata rainbow runner P ELA BIPI
Seriola dumerili greater amberjack F SER DUME
Seriola rivoliana almaco jack F SER RIVO
Trachinotus falcatus permit Ma TRA FALC
LUTJANIDAE Snappers
Lutjanus analis mutton snapper Ma,F LUT ANAL
Lutjanus apodus schoolmaster F,Ma LUT APOD
Lutjanus buccanella blackfin snapper F,Ma LUT BUCC
Lutjanus cyanopterus cubera snapper F,Ma LUT CYAN
Lutjanus griseus gray snapper F,Ma LUT GRIS
Lutjanus jocu dog snapper F,Ma LUT JOCU
Lutjanus mahogoni mahogany snapper F,Ma LUT MAHO
Lutjanus spe. unidentified snapper F,Ma LUT SPE.
Lutjanus synagris lane snapper Ma,F LUT SYNA
Ocyurus chrysurus yellowtail snapper F,Ma,Mi,P OCY CHRY
Pristipomoides aquilonaris wenchman F,Ma,P PRI AQUI
Rhomboplites aurorubens vermilion snapper P,F RHO AURO
GERREIDAE Mojarras
Eucinostomus argenteus spotfin mojarra Mi,Ma EUC ARGE
Gerres cinereus yellowfin mojarra Ma,Mi GER CINE
26
Table 3. (cont.)FAMILY Scientific Family Species Trophic SpeciesNAME name common name common name Level Code
HAEMULIDAE Grunts
Anisotremus surinamensis black margate Ma ANI SURI
Anisotremus virginicus porkfish Ma ANI VIRG
Haemulon album margate Ma HAE ALBU
Haemulon aurolineatum tomtate Ma HAE AURO
Haemulon carbonarium caesar grunt Ma HAE CARB
Haemulon chrysargyreum smallmouth grunt Ma HAE CHRY
Haemulon flavolineatum French grunt Ma HAE FLAV
Haemulon macrostomum Spanish grunt Ma HAE MACR
Haemulon melanurum cottonwick Ma HAE MELA
Haemulon parra sailors choice Ma HAE PARR
Haemulon plumieri white grunt Ma HAE PLUM
Haemulon sciurus bluestriped grunt Ma HAE SCIU
Haemulon sp. unidentified grunt Ma HAE SPE.
Haemulon striatum striped grunt Ma HAE STRI
INERMIIDAE Bonnetmouths
Inermia vittata boga P INE VITT
SPARIDAE Porgies
Archosargus probatocephalus sheepshead Ma ARC PROB
Archosargus rhomboidalis sea bream H ARC RHOM
Calamus bajonado jolthead porgy Ma CAL BAJO
Calamus calamus saucereye porgy Ma CAL CALA
Calamus penna sheepshead porgy Ma CAL PENN
Calamus proridens littlehead porgy Ma CAL PROR
Calamus spe. unknown porgy Ma CAL SPE.
Diplodus argenteus silver porgy H,B DIP ARGE
Diplodus holbrooki spottail pinfish H,B DIP HOLB
Lagodon rhomboides pinfish B,H LAG RHOM
SCIAENIDAE Drums
Equetus acuminatus high-hat Ma,Mi EQU ACUM
Equetus lanceolatus jackknife-fish Ma EQU LANC
Equetus punctatus spotted drum Ma EQU PUNC
Equetus umbrosus cubbyu Mi,Ma EQU UMBR
Odontoscion dentex reef crocker Ma ODO DENT
MULLIDAE Goatfishes
Mulloidichthys martinicus yellow goatfish Mi MUL MART
Pseudupeneus maculatus spotted goatfish Mi PSE MACU
27
Table 3. (cont.)FAMILY Scientific Family Species Trophic SpeciesNAME name common name common name Level Code
PEMPHERIDAE Sweepers
Pempheris schomburgki glassy sweeper P,Mi PEM SCHO
KYPHOSIDAE Sea chubs
Kyphosus sectatrix Bermuda chub H KYP SECT
EPHIPPIDAE Spadefishes
Chaetodiperus faber Atlantic spadefish Ma CHA FABE
CHAETODONTIDAE Butterflyfishes
Chaetodon capistratus foureye butterflyfish B CHA CAPI
Chaetodon ocellatus spotfin butterflyfish B CHA OCEL
Chaetodon sedentarius reef butterflyfish Mi CHA SEDE
Chaetodon striatus banded butterflyfish B CHA STRI
POMACANTHIDAE Angelfishes
Centropye argi cherubfish B CEN ARGI
Holacanthus bermudensis blue angelfish B HOL BERM
Holacanthus ciliaris queen angelfish B HOL CILI
Holacanthus (bermudensis x ciliaris) Townsend angelfish B HOL TOWN
Holacanthus tricolor rock beauty B HOL TRIC
Pomacanthus arcuatus gray angelfish B POM ARCU
Pomacanthus paru French angelfish B POM PARU
POMACENTRIDAE Damselfishes
Abudefduf saxatilis sergeant major P ABU SAXA
Chromis cyanea blue chromis P CHR CYAN
Chromis enchrysurus yellowtail reeffish P CHR ENCH
Chromis insolata sunshinefish P CHR INSO
Chromis multilineata brown chromis P CHR MULT
Chromis scotti purple reeffish P CHR SCOT
Microspathodon chrysurus yellowtail damselfish B,H MIC MICR
Pomacentrus diencaeus longfin damselfish H POM DIEN
Pomacentrus fuscus dusky damselfish H POM FUSC
Pomacentrus leucostictus beaugregory H POM LEUC
Pomacentrus partitus bicolor damselfish P POM PART
Pomacentrus planifrons three spot damselfish H POM PLAN
Pomacentrus variabilis cocoa damselfish H POM VARI
CIRRHITIDAE Hawkfishes
Amblycirrhitus pinos redspotted hawkfish Mi AMB PINO
28
Table 3. (cont.)FAMILY Scientific Family Species Trophic SpeciesNAME name common name common name Level Code
SPHYRAENIDAE Barracudas
Sphyraena barracuda great barracuda F,Ma SPH BARR
Sphyraena picudilla southern sennet F SPH PICU
LABRIDAE Wrasses
Bodianus pulchellus spotfin hogfish Ma,Mi BOD PULC
Bodianus rufus Spanish hogfish Ma,Mi BOD RUFU
Clepticus parrae creole wrasse P CLE PARR
Doratonotus megalepis dwarf wrasse Mi DOR MEGA
Halichoeres bivittatus slippery dick Ma,Mi HAL BIVI
Halichoeres cyanocephalus yellowcheek wrasse Mi,Ma HAL CYAN
Halichoeres garnoti yellowhead wrasse Ma,Mi HAL GARN
Halichoeres maculipinna clown wrasse Mi,Ma HAL MACU
Halichoeres pictus rainbow wrasse P HAL PICT
Halichoeres poeyi blackear wrasse Mi,Ma HAL POEY
Halichoeres radiatus puddingwife Mi,Ma HAL RADI
Hemipteronotus martinicensis rosy razorfish Ma,Mi HEM MART
Hemipteronotus novacula pearly razorfish Ma,Mi HEM NOVA
Hemipteronotus sp. unidentified razonfish Ma,Mi HEM SPE.
Hemipteronotus splendens green razorfish Ma,Mi HEM SPLE
Lachnolaimus maximus hogfish Ma LAC MAXI
Thalassoma bifasciatum bluehead P,Mi,Ma THA BIFA
SCARIDAE Parrotfishes
Cryptotomus roseus bluelip parrotfish H CRY ROSE
Nicholsina usta emerald parrotfish B NIC USTA
Scarus coelestinus midnight parrotfish H SCA COEL
Scarus coeruleus blue parrotfish H SCA COER
Scarus croicensis striped parrotfish H SCA CROI
Scarus guacamaia rainbow parrotfish H SCA GUAC
Scarus spe. unidentified parrotfish H SCA SPE.
Scarus taeniopterus princess parrotfish H SCA TAEN
Scarus vetula queen parrotfish H SCA VETU
Sparisoma atomarium greenblotch parrotfish H SPA ATOM
Sparisoma aurofrenatum redband parrotfish H SPA AURO
Sparisoma chrysopterum redtail parrotfish H SPA CHRY
Sparisoma radians bucktooth parrotfish H SPA RADI
Sparisoma rubripinne redfin parrotfish H SPA RUBR
Sparisoma spe. unidentified parrotfish H SPA SPE.
Sparisoma viride stoplight parrotfish H SPA VIRI
OPISTOGNATHIDAE Jawfishes
Opistognathus aurifrons yellowhead jawfish P OPI AURI
Opistognathus whitehursti dusky jawfish P OPI WHIT
29
Table 3. (cont.)FAMILY Scientific Family Species Trophic SpeciesNAME name common name common name Level Code
CLINIDAE Clinids
Acanthemblemaria aspera roughhead blenny P ACA ASPE
Acanthemblemaria chaplini papillose blenny P ACA CHAP
Emblemaria pandionis sailfin blenny H EMB PAND
Hemiemblemaria simulus wrasse blenny Mi,P HEM SIMU
Labrisiomus nuchipinnis hairy blenny H LAB NUCH
Malacoctenus gilli dusky blenny Mi,P MAL GILL
Malacoctenus macrops rosy blenny Mi,P MAL MACR
Malacoctenus sp. unidentified blenny Mi,P MAL SPE.
Malacoctenus triangulatus saddled blenny Mi,P MAL TRIA
Malacoctenus versicolor barfin blenny Mi,P MAL VERS
Paraclinus marmoratus marbled blenny P,Mi PAR MARM
Paraclinus nigripinnis blackfin goby P,Mi PAR NIGR
BLENNIIDAE Combtooth blennies
Unidentified blenny unidentified blenny H BLE SPE.
Hypleurochilus bermudensis barred blenny H HYP BERM
Ophioblennius atlanticus redlip blenny H OPH ATLA
Scartella cristata molly miller H SCA CRIS
CALLIONYMIDAE Dragonets
Paradiplogrammus bairdi lancer dragonet Ma PAR BAIR
GOBIIDAE Gobies
Coryphopterus dicrus colon goby H COR DICR
Coryphopterus eidolon pallid goby H COR EIDO
Coryphopterus glaucofraenum bridled goby H COR GLAU
Coryphopterus personatus masked goby P COR PERS
Coryphopterus species unknown goby H,P COR SPE.
Gnatholepis thompsoni goldspot goby H GNA THOM
Gobiosoma evelynae sharknose goby Mi GOB EVEL
Gobiosoma macrodon tiger goby Mi GOB MACR
Gobiosoma oceanops neon goby Mi GOB OCEA
Gobiosoma randalli yellownose goby Mi GOB RAND
Goby-like fish goby-like fish Mi,H GOB SPE.
Ioglossus calliurus blue goby P IOG CALL
Ioglossus helenae hovering goby P IOG HELE
Microgobius carri Seminole goby P MIC CARR
Microgobius microlepis banner goby H MIC CHRY
30
Table 3. (cont.)FAMILY Scientific Family Species Trophic SpeciesNAME name common name common name Level Code
ACANTHURIDAE Surgeonfishes
Acanthurus bahianus ocean surgeon H ACA BAHI
Acanthurus chirurgus doctorfish H ACA CHIR
Acanthurus coeruleus blue tang H ACA COER
Acanthurus spe. unidentified Acanthurid H ACA SPE.
SCOMBRIDAE Mackerels/Tunas
Scomberomorus cavalla king mackerel F,Ma SCO CAVA
Scomberomorus maculatus Spanish mackerel F,Ma SCO MACU
Scomberomorus regalis cero F,Ma SCO REGA
BOTHIDAE Lefteye flounders
Bothus lunatus peacock flounder F,Ma BOT LUNA
Bothus ocellatus eyed flounder F,Ma BOT OCEL
BALISTIDAE LeatherjacketsAluterus monoceros unicorn filefish H ALU MONO
Aluterus schoepfi orange filefish H ALU SCHO
Aluterus scriptus scrawled filefish H,B ALU SCRI
Balistes capriscus gray triggerfish Ma BAL CAPR
Balistes vetula queen triggerfish Ma BAL VETU
Cantherhines macrocerus whitespotted filefish B,H CAN MACR
Cantherhines pullus orangespotted filefish B,H CAN PULL
Canthidermis sufflamen ocean triggerfish Ma,P CAN SUFF
Melichthys niger black durgon P MEL NIGE
Monacanthus hispidus planehead filefish Mi MON HISP
Monacanthus tuckeri slender filefish Mi MON TUCK
OSTRACIIDAE Boxfishes
Lactophrys bicaudalis spotted trunkfish B LAC BICA
Lactophrys polygonia honeycomb cowfish B LAC POLY
Lactophrys quadricornis scrawled cowfish B LAC QUAD
Lactophrys trigonius trunkfish B LAC TRIG
Lactophrys triqueter smooth trunkfish B LAC TRIQ
TETRAODONTIDAE Puffers
Canthigaster rostrata sharpnose puffer H,B,Mi CAN ROST
Chilomycterus antennatus bridled burrfish Ma CHI ANTE
Chilomycterus schoepfi striped burrfish Ma CHI SCHO
Diodon holocanthus balloonfish Ma DIO HOLO
Diodon hystrix porcupinefish Ma DIO HYST
Diodon species unknown porcupinefish Ma DIO SPE.
Sphoeroides spengleri bandtail puffer Mi,B SPH SPEN
UNKNOWN UnknownUnidentified sp. unidentified species UNK SPE.
31
32
33
34
35
Figure 3. Rank order total log abundance for all species in 6,673 samples. Table 4 providesabundance data for individual species.
Figure 4. Rank order mean frequency-of-occurrence (± 95% C.I.) for all species in 6,673 samples.Table 4 shows frequency data for individual species.
36
reefs and offshore reefs irrespective ofgeographical region. Within offshore reefs,Tortugas deeper reefs were distinguished fromsites in the rest of the Florida Keys. In themain Keys, offshore reefs clustered into highrelief forereef and low relief hard bottomhabitats. Within habitat types, reefs sitesclustered primarily by geographical region(Fig 5.).
Trophic StructureEach observed species was classified
according to primary trophic level based onadult feeding patterns (Bohnsack et al. 1987,Table 1). Fishes were numerically dominatedby planktivores (44 %), followed bymacroinvertivores (26 %), herbivores (17 %),piscivores (8 %), microinvertivores (3 %), andbrowsers (1 %) (Fig. 6a). The pattern wasquite different for biomass (Fig. 6b) in whichpiscivores (42%) dominated, followed bymacroinvertivores (25%), herbivores (21%),planktivores (5%), browsers (4%), andmicroinvertivores (3%). The pattern ofdominancy by predators is classic for coralreef fish communities (Talbot and Goldman1973, Goldman and Talbot 1976).
Trophic classification was furtheranalyzed according to region and reef type. Interms of numbers, the proportion ofplanktivores was higher at offshore reefs in allregions except the upper Keys (Fig. 7). Thepattern for the upper Keys, however, may beanomalous because an unusual occurrence oflarge numbers of midwater planktivoresoccurred at one inshore reef and dominatedthe total numbers. The proportion ofplanktivores was lower in the middle Keysthan in other regions. Macroinvertivores wereespecially abundant on inshore reefs in thelower Keys.
In terms of biomass, trophic structureacross regions and reef types was remarkablyconsistent (Fig. 8). In all four regionsbiomass by reef type tended to be dominatedby macroinvertivores and piscivores, followed
by herbivores, browsers, planktivores, andmacroinvertivores. Offshore reefs tended tohave fewer browsers, but more planktivoresand microinvertivores than mid-channel andinshore patch reefs.
Spatial Density PatternsSpatial patterns of density (number of
individuals observed per sample) can bedetermined for individual species using thedatabase. Schmidt et al. (1999) plotteddistributions for exploitable and non-exploitable phases of mutton snapper, graysnapper, yellowtail snapper, and red grouperin the Florida Keys and the Tortugas. In mostcases relatively few exploitable phaseindividuals were observed. The highestoccurrence of exploitable phase fishes tendedto be in the Tortugas region, presumablybecause overall fishing mortality was lower. To avoid redundancy, these figures are notreplicated here.
Density TrendsDensity changes in number of
individuals observed per sample wereexamined for selected species. Taxa selectedwith economic importance are gray snapper,yellowtail snapper, combined exploitedgrouper, and hogfish. Exploited grouperexcluded graysby and coney. For comparisonpurposes, two taxa without direct economicimportance were also analyzed in the samemanner. Stoplight parrotfish represented alarge species while striped parrotfishrepresented a small abundant species.
Four plots show trends for selectedtaxa: the first shows all data and the secondincludes only Tortugas data. Data from therest of the Keys are included in the remainingtwo plots that show either sites that becameno-take zones in 1997 or sites that continuedto be fished. Trends showing all data shouldbe interpreted cautiously because of variationin annual sample size and in the distributionof sites among regions (Table 1). The
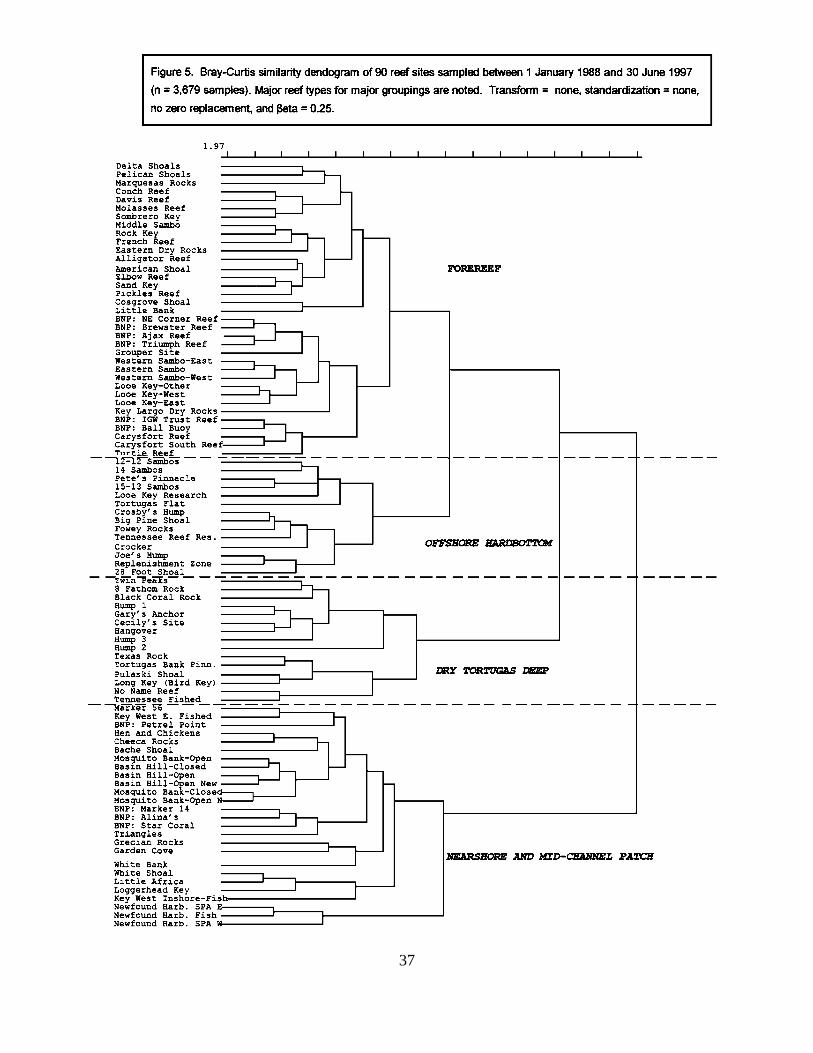
37
38
Planktivore44.2%
Browser1.3%
Herbivore17.3%
Piscivore8.1%
Microinvertivore2.8%
Macroinvertivore26.3%
a)
Macroinvertivore24.7%
Microinvertivore3.4%
Planktivore5.1%
Browser3.8%
Herbivore21.2%
Piscivore41.8%
b)
Figure 6. Mean trophic structure of reef fishes in the Florida Keys as percentage of total individuals (a) andbiomass (b). N = 1,241,270 individuals, 6,673 samples, and 118 reef sites. Data were collected from 1979 - 98.
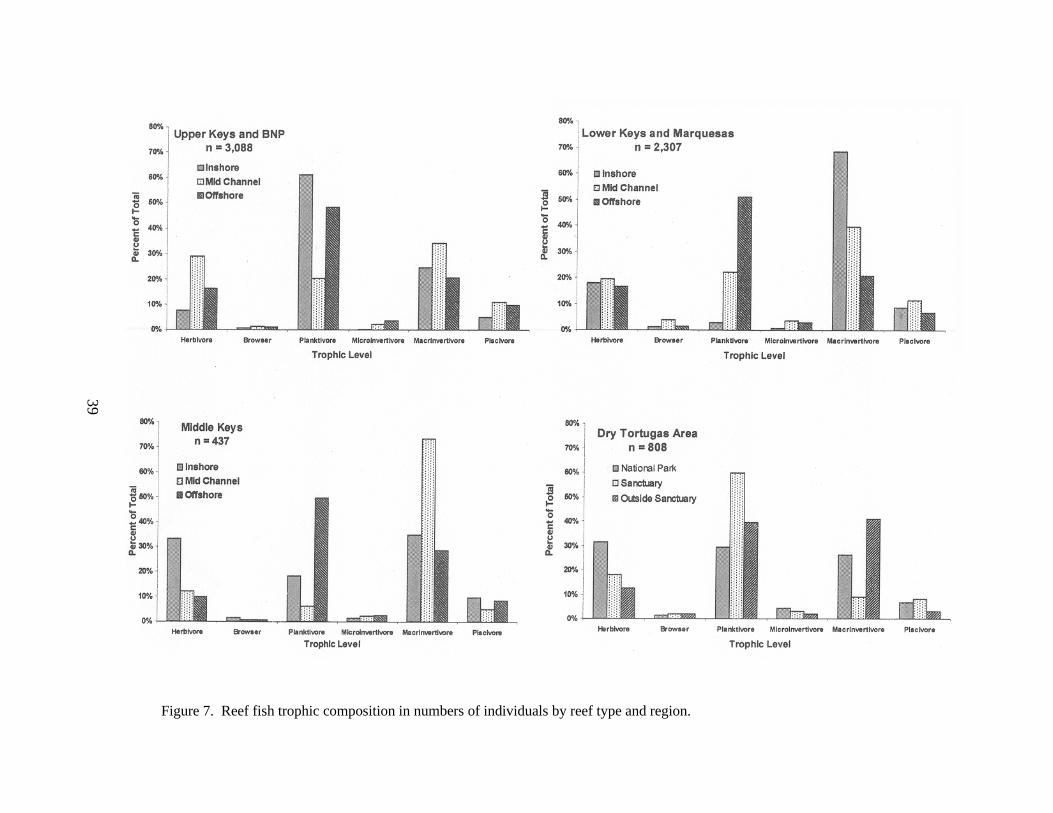
39
Figure 7. Reef fish trophic composition in numbers of individuals by reef type and region.
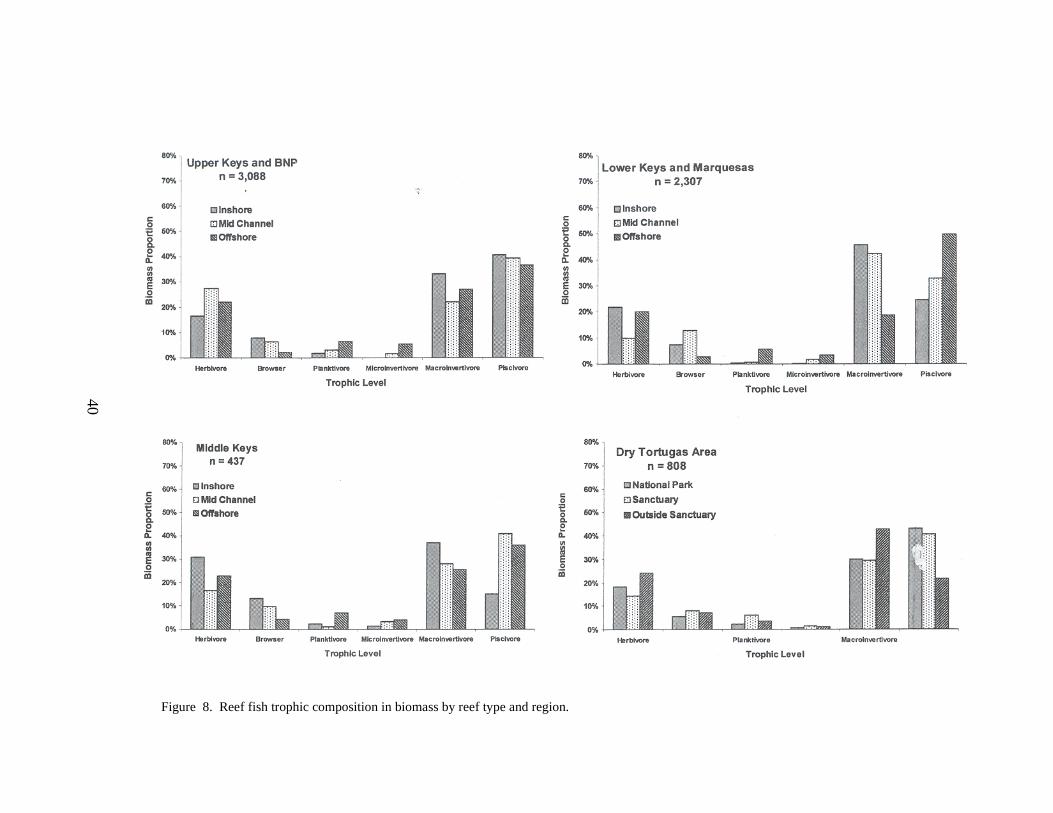
40
Figure 8. Reef fish trophic composition in biomass by reef type and region.
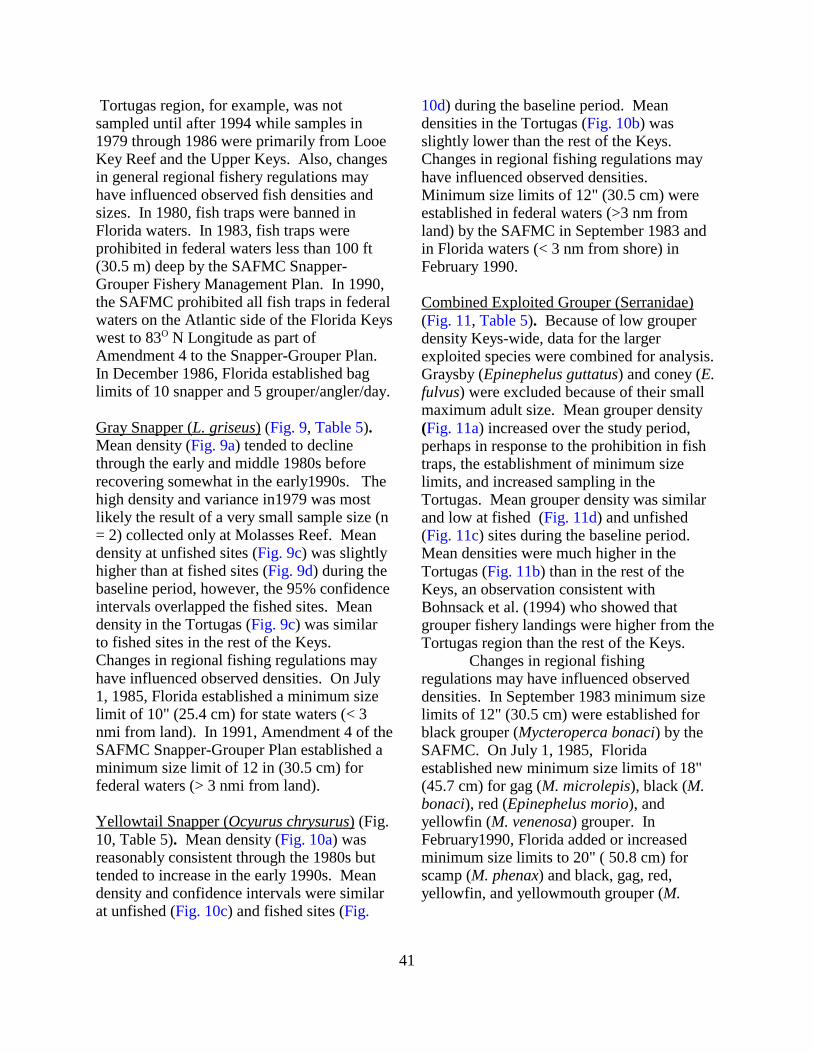
41
Tortugas region, for example, was notsampled until after 1994 while samples in1979 through 1986 were primarily from LooeKey Reef and the Upper Keys. Also, changesin general regional fishery regulations mayhave influenced observed fish densities andsizes. In 1980, fish traps were banned inFlorida waters. In 1983, fish traps wereprohibited in federal waters less than 100 ft(30.5 m) deep by the SAFMC Snapper-Grouper Fishery Management Plan. In 1990,the SAFMC prohibited all fish traps in federalwaters on the Atlantic side of the Florida Keyswest to 83O N Longitude as part ofAmendment 4 to the Snapper-Grouper Plan. In December 1986, Florida established baglimits of 10 snapper and 5 grouper/angler/day.
Gray Snapper (L. griseus) (Fig. 9, Table 5). Mean density (Fig. 9a) tended to declinethrough the early and middle 1980s beforerecovering somewhat in the early1990s. Thehigh density and variance in1979 was mostlikely the result of a very small sample size (n= 2) collected only at Molasses Reef. Meandensity at unfished sites (Fig. 9c) was slightlyhigher than at fished sites (Fig. 9d) during thebaseline period, however, the 95% confidenceintervals overlapped the fished sites. Meandensity in the Tortugas (Fig. 9c) was similarto fished sites in the rest of the Keys. Changes in regional fishing regulations mayhave influenced observed densities. On July1, 1985, Florida established a minimum sizelimit of 10" (25.4 cm) for state waters (< 3nmi from land). In 1991, Amendment 4 of theSAFMC Snapper-Grouper Plan established aminimum size limit of 12 in (30.5 cm) forfederal waters (> 3 nmi from land).
Yellowtail Snapper (Ocyurus chrysurus) (Fig.10, Table 5). Mean density (Fig. 10a) wasreasonably consistent through the 1980s buttended to increase in the early 1990s. Meandensity and confidence intervals were similarat unfished (Fig. 10c) and fished sites (Fig.
10d) during the baseline period. Meandensities in the Tortugas (Fig. 10b) wasslightly lower than the rest of the Keys.Changes in regional fishing regulations mayhave influenced observed densities. Minimum size limits of 12" (30.5 cm) wereestablished in federal waters (>3 nm fromland) by the SAFMC in September 1983 andin Florida waters (< 3 nm from shore) inFebruary 1990.
Combined Exploited Grouper (Serranidae)(Fig. 11, Table 5). Because of low grouperdensity Keys-wide, data for the largerexploited species were combined for analysis. Graysby (Epinephelus guttatus) and coney (E.fulvus) were excluded because of their smallmaximum adult size. Mean grouper density(Fig. 11a) increased over the study period,perhaps in response to the prohibition in fishtraps, the establishment of minimum sizelimits, and increased sampling in theTortugas. Mean grouper density was similarand low at fished (Fig. 11d) and unfished (Fig. 11c) sites during the baseline period. Mean densities were much higher in theTortugas (Fig. 11b) than in the rest of theKeys, an observation consistent withBohnsack et al. (1994) who showed thatgrouper fishery landings were higher from theTortugas region than the rest of the Keys.
Changes in regional fishingregulations may have influenced observeddensities. In September 1983 minimum sizelimits of 12" (30.5 cm) were established forblack grouper (Mycteroperca bonaci) by theSAFMC. On July 1, 1985, Floridaestablished new minimum size limits of 18"(45.7 cm) for gag (M. microlepis), black (M.bonaci), red (Epinephelus morio), andyellowfin (M. venenosa) grouper. InFebruary1990, Florida added or increasedminimum size limits to 20" ( 50.8 cm) forscamp (M. phenax) and black, gag, red,yellowfin, and yellowmouth grouper (M.
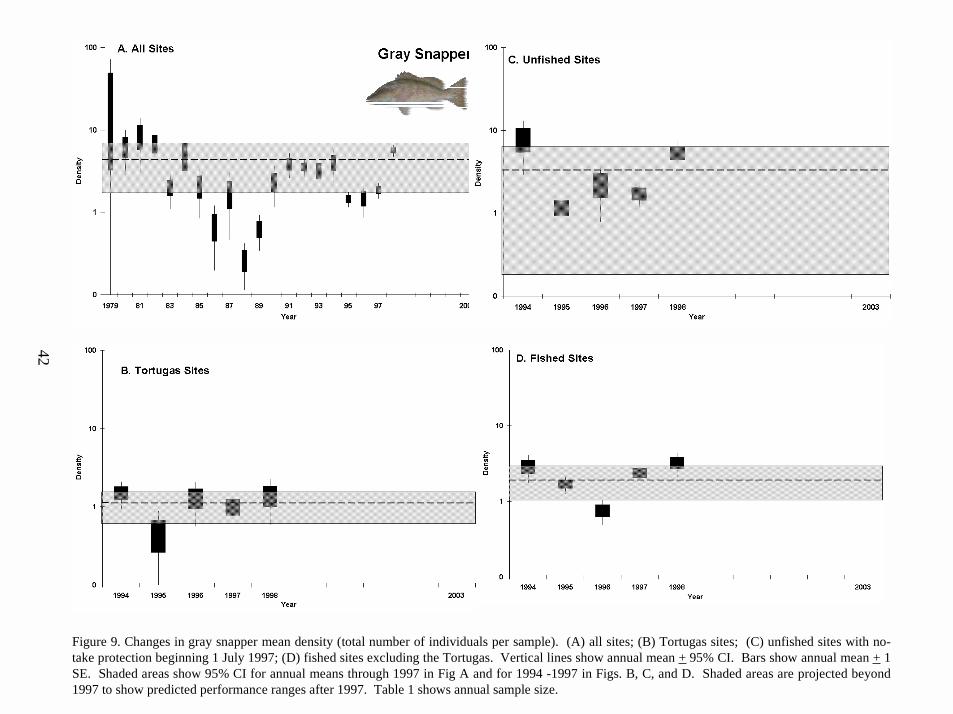
Figure 9. Changes in gray snapper mean density (total number of individuals per sample). (A) all sites; (B) Tortugas sites; (C) unfished sites with no-take protection beginning 1 July 1997; (D) fished sites excluding the Tortugas. Vertical lines show annual mean + 95% CI. Bars show annual mean + 1SE. Shaded areas show 95% CI for annual means through 1997 in Fig A and for 1994 -1997 in Figs. B, C, and D. Shaded areas are projected beyond1997 to show predicted performance ranges after 1997. Table 1 shows annual sample size.
42

Figure 10. Changes in yellowtail snapper mean density (total number of individuals per sample). (A) all sites; (B) Tortugas sites; (C) unfished sites withno-take protection beginning 1 July 1997; (D) fished sites excluding the Tortugas. Vertical lines show annual mean + 95% CI. Bars show annual mean+ 1 SE. Shaded areas show 95% CI for annual means through 1997 in Fig A and for 1994 -1997 in Figs. B, C, and D. Shaded areas are projectedbeyond 1997 to show predicted performance ranges after 1997. Table1 shows annual sample size.
43
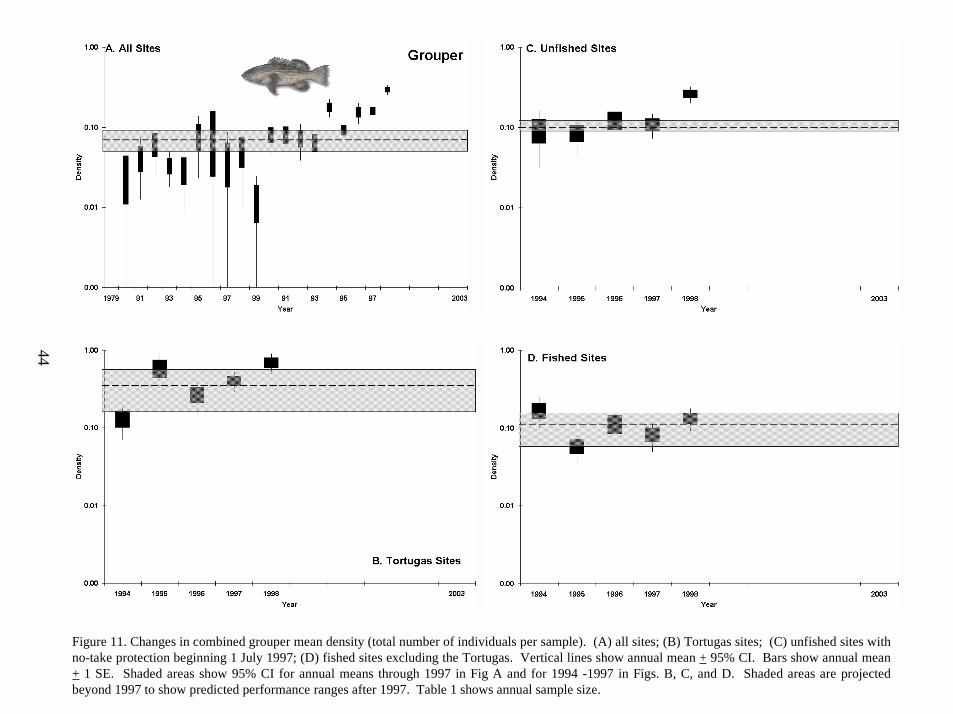
Figure 11. Changes in combined grouper mean density (total number of individuals per sample). (A) all sites; (B) Tortugas sites; (C) unfished sites withno-take protection beginning 1 July 1997; (D) fished sites excluding the Tortugas. Vertical lines show annual mean + 95% CI. Bars show annual mean+ 1 SE. Shaded areas show 95% CI for annual means through 1997 in Fig A and for 1994 -1997 in Figs. B, C, and D. Shaded areas are projectedbeyond 1997 to show predicted performance ranges after 1997. Table 1 shows annual sample size.
44
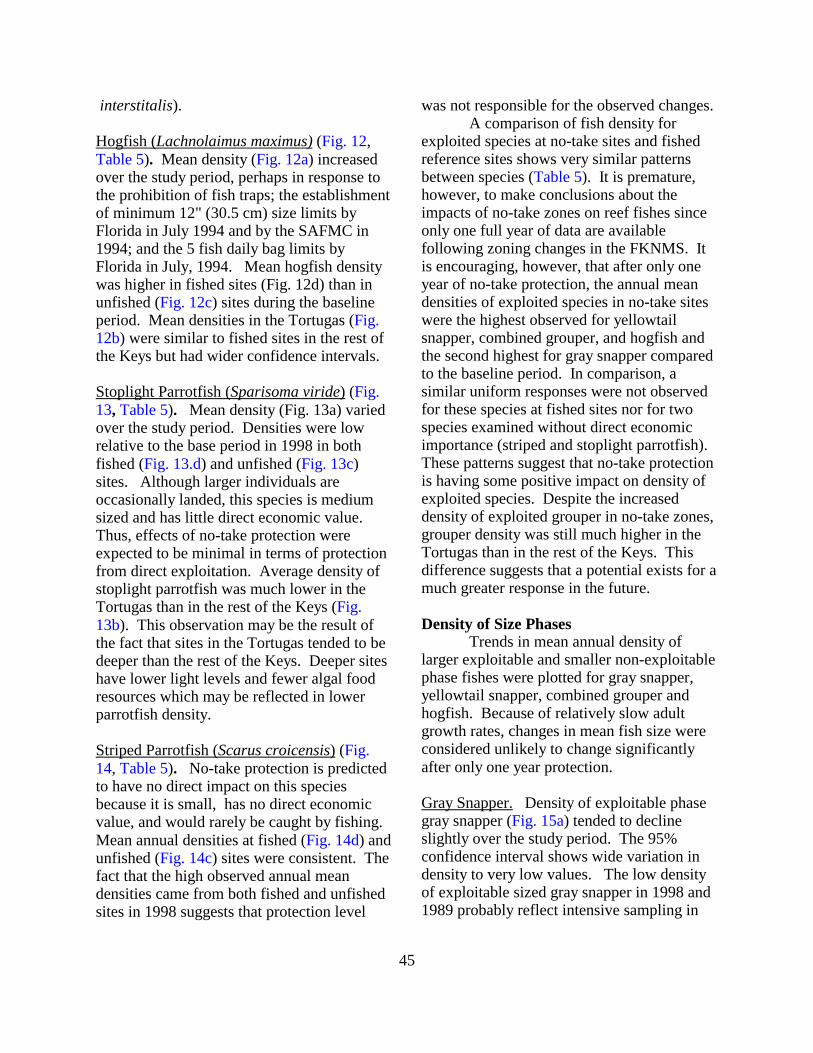
45
interstitalis). Hogfish (Lachnolaimus maximus) (Fig. 12,Table 5). Mean density (Fig. 12a) increasedover the study period, perhaps in response tothe prohibition of fish traps; the establishmentof minimum 12" (30.5 cm) size limits byFlorida in July 1994 and by the SAFMC in1994; and the 5 fish daily bag limits byFlorida in July, 1994. Mean hogfish densitywas higher in fished sites (Fig. 12d) than inunfished (Fig. 12c) sites during the baselineperiod. Mean densities in the Tortugas (Fig.12b) were similar to fished sites in the rest ofthe Keys but had wider confidence intervals.
Stoplight Parrotfish (Sparisoma viride) (Fig.13, Table 5). Mean density (Fig. 13a) variedover the study period. Densities were lowrelative to the base period in 1998 in bothfished (Fig. 13.d) and unfished (Fig. 13c)sites. Although larger individuals areoccasionally landed, this species is mediumsized and has little direct economic value. Thus, effects of no-take protection wereexpected to be minimal in terms of protectionfrom direct exploitation. Average density ofstoplight parrotfish was much lower in theTortugas than in the rest of the Keys (Fig.13b). This observation may be the result ofthe fact that sites in the Tortugas tended to bedeeper than the rest of the Keys. Deeper siteshave lower light levels and fewer algal foodresources which may be reflected in lowerparrotfish density.
Striped Parrotfish (Scarus croicensis) (Fig.14, Table 5). No-take protection is predictedto have no direct impact on this speciesbecause it is small, has no direct economicvalue, and would rarely be caught by fishing. Mean annual densities at fished (Fig. 14d) andunfished (Fig. 14c) sites were consistent. Thefact that the high observed annual meandensities came from both fished and unfishedsites in 1998 suggests that protection level
was not responsible for the observed changes.A comparison of fish density for
exploited species at no-take sites and fishedreference sites shows very similar patternsbetween species (Table 5). It is premature,however, to make conclusions about theimpacts of no-take zones on reef fishes sinceonly one full year of data are availablefollowing zoning changes in the FKNMS. Itis encouraging, however, that after only oneyear of no-take protection, the annual meandensities of exploited species in no-take siteswere the highest observed for yellowtailsnapper, combined grouper, and hogfish andthe second highest for gray snapper comparedto the baseline period. In comparison, asimilar uniform responses were not observedfor these species at fished sites nor for twospecies examined without direct economicimportance (striped and stoplight parrotfish). These patterns suggest that no-take protectionis having some positive impact on density ofexploited species. Despite the increaseddensity of exploited grouper in no-take zones,grouper density was still much higher in theTortugas than in the rest of the Keys. Thisdifference suggests that a potential exists for amuch greater response in the future.
Density of Size PhasesTrends in mean annual density of
larger exploitable and smaller non-exploitablephase fishes were plotted for gray snapper,yellowtail snapper, combined grouper andhogfish. Because of relatively slow adultgrowth rates, changes in mean fish size wereconsidered unlikely to change significantlyafter only one year protection.
Gray Snapper. Density of exploitable phasegray snapper (Fig. 15a) tended to declineslightly over the study period. The 95%confidence interval shows wide variation indensity to very low values. The low densityof exploitable sized gray snapper in 1998 and1989 probably reflect intensive sampling in
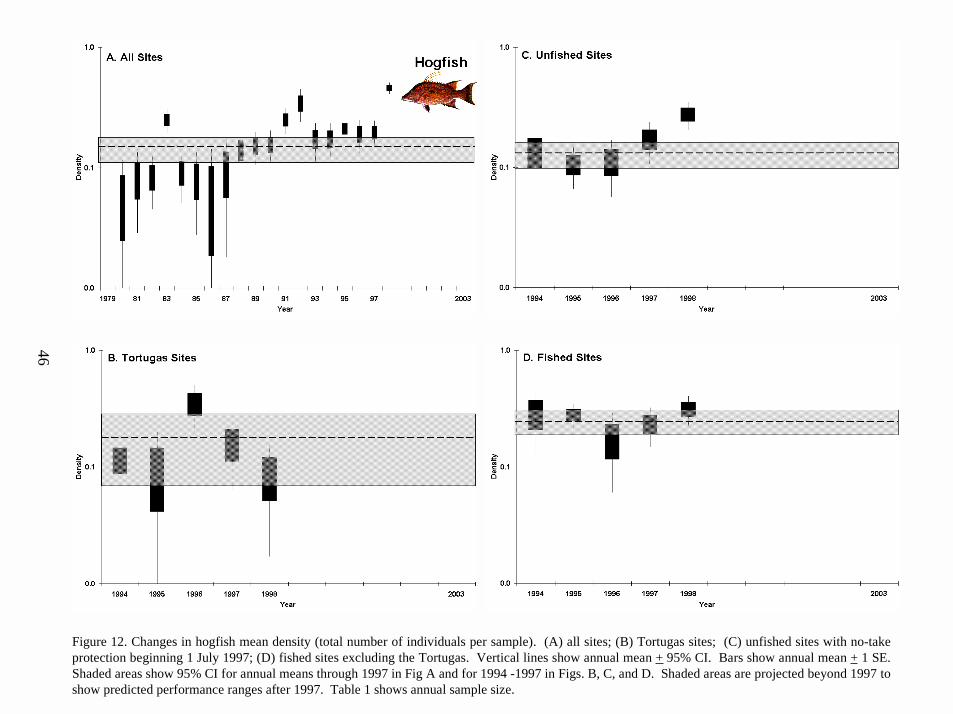
Figure 12. Changes in hogfish mean density (total number of individuals per sample). (A) all sites; (B) Tortugas sites; (C) unfished sites with no-takeprotection beginning 1 July 1997; (D) fished sites excluding the Tortugas. Vertical lines show annual mean + 95% CI. Bars show annual mean + 1 SE.Shaded areas show 95% CI for annual means through 1997 in Fig A and for 1994 -1997 in Figs. B, C, and D. Shaded areas are projected beyond 1997 toshow predicted performance ranges after 1997. Table 1 shows annual sample size.
46
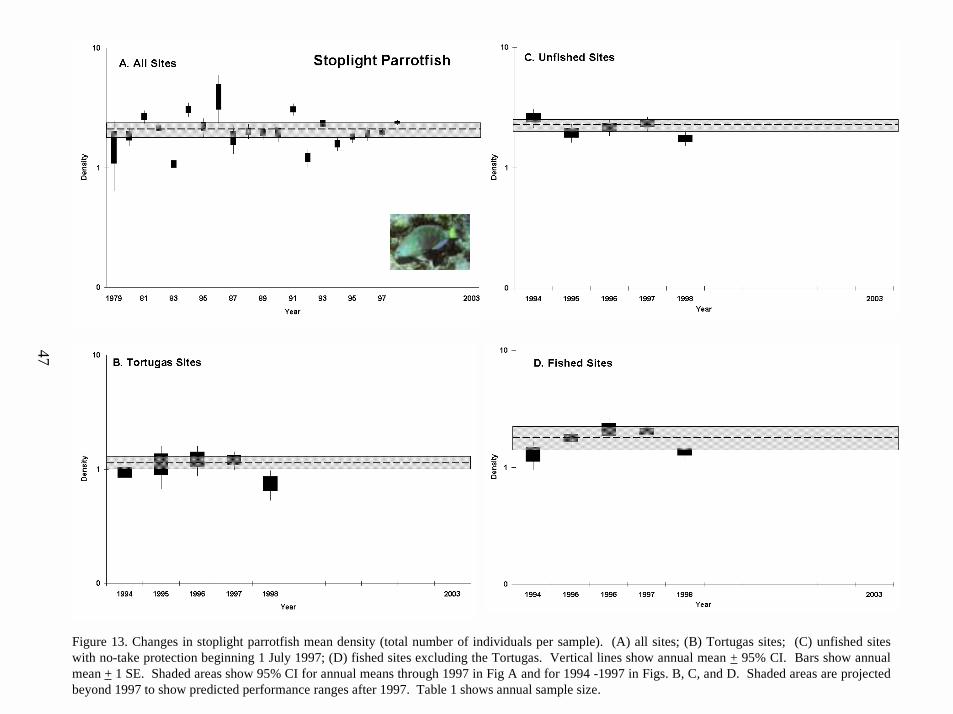
Figure 13. Changes in stoplight parrotfish mean density (total number of individuals per sample). (A) all sites; (B) Tortugas sites; (C) unfished siteswith no-take protection beginning 1 July 1997; (D) fished sites excluding the Tortugas. Vertical lines show annual mean + 95% CI. Bars show annualmean + 1 SE. Shaded areas show 95% CI for annual means through 1997 in Fig A and for 1994 -1997 in Figs. B, C, and D. Shaded areas are projectedbeyond 1997 to show predicted performance ranges after 1997. Table 1 shows annual sample size.
47
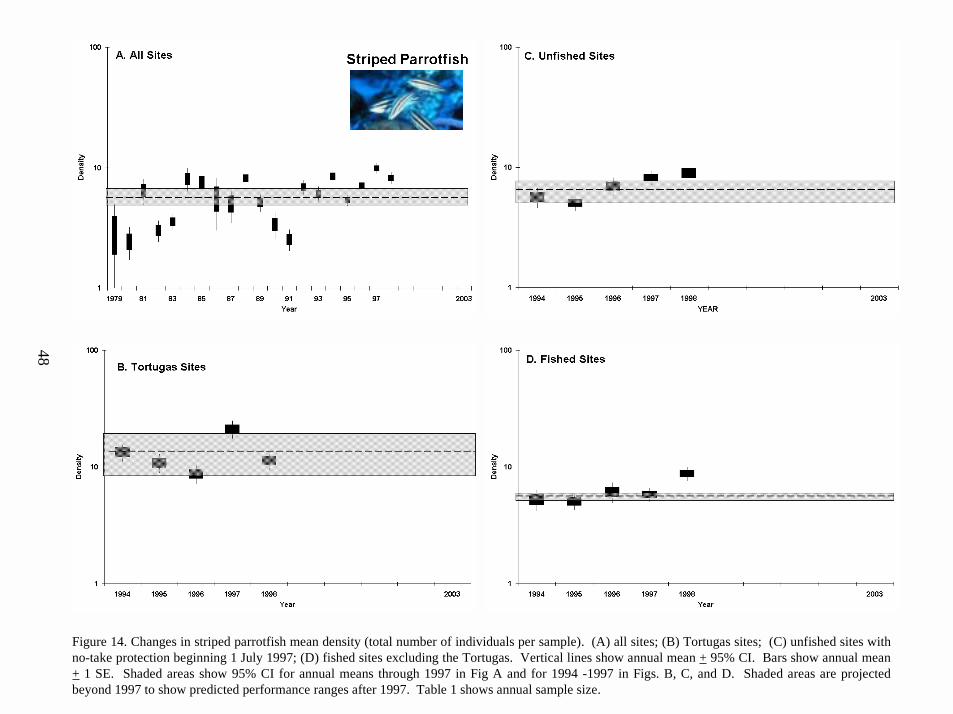
Figure 14. Changes in striped parrotfish mean density (total number of individuals per sample). (A) all sites; (B) Tortugas sites; (C) unfished sites withno-take protection beginning 1 July 1997; (D) fished sites excluding the Tortugas. Vertical lines show annual mean + 95% CI. Bars show annual mean+ 1 SE. Shaded areas show 95% CI for annual means through 1997 in Fig A and for 1994 -1997 in Figs. B, C, and D. Shaded areas are projectedbeyond 1997 to show predicted performance ranges after 1997. Table 1 shows annual sample size.
48
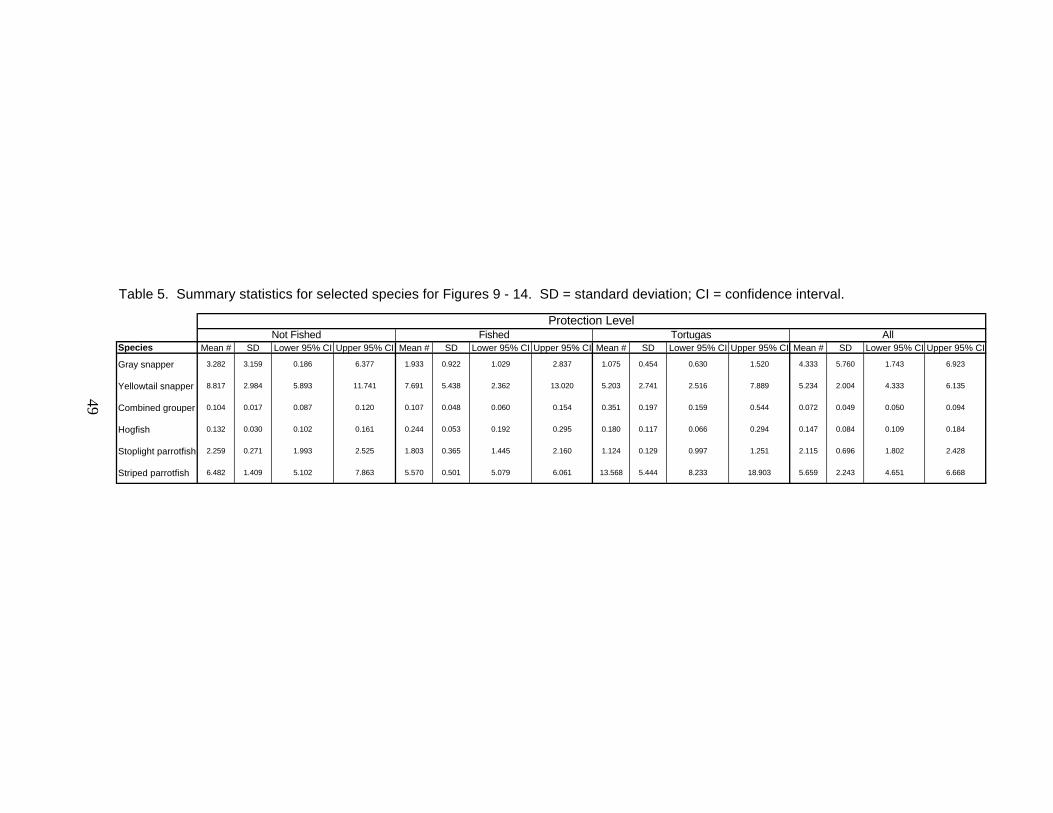
49
Table 5. Summary statistics for selected species for Figures 9 - 14. SD = standard deviation; CI = confidence interval.
Protection LevelNot Fished Fished Tortugas All
Species Mean # SD Lower 95% CI Upper 95% CI Mean # SD Lower 95% CI Upper 95% CI Mean # SD Lower 95% CI Upper 95% CI Mean # SD Lower 95% CI Upper 95% CI
Gray snapper 3.282 3.159 0.186 6.377 1.933 0.922 1.029 2.837 1.075 0.454 0.630 1.520 4.333 5.760 1.743 6.923
Yellowtail snapper 8.817 2.984 5.893 11.741 7.691 5.438 2.362 13.020 5.203 2.741 2.516 7.889 5.234 2.004 4.333 6.135
Combined grouper 0.104 0.017 0.087 0.120 0.107 0.048 0.060 0.154 0.351 0.197 0.159 0.544 0.072 0.049 0.050 0.094
Hogfish 0.132 0.030 0.102 0.161 0.244 0.053 0.192 0.295 0.180 0.117 0.066 0.294 0.147 0.084 0.109 0.184
Stoplight parrotfish 2.259 0.271 1.993 2.525 1.803 0.365 1.445 2.160 1.124 0.129 0.997 1.251 2.115 0.696 1.802 2.428
Striped parrotfish 6.482 1.409 5.102 7.863 5.570 0.501 5.079 6.061 13.568 5.444 8.233 18.903 5.659 2.243 4.651 6.668
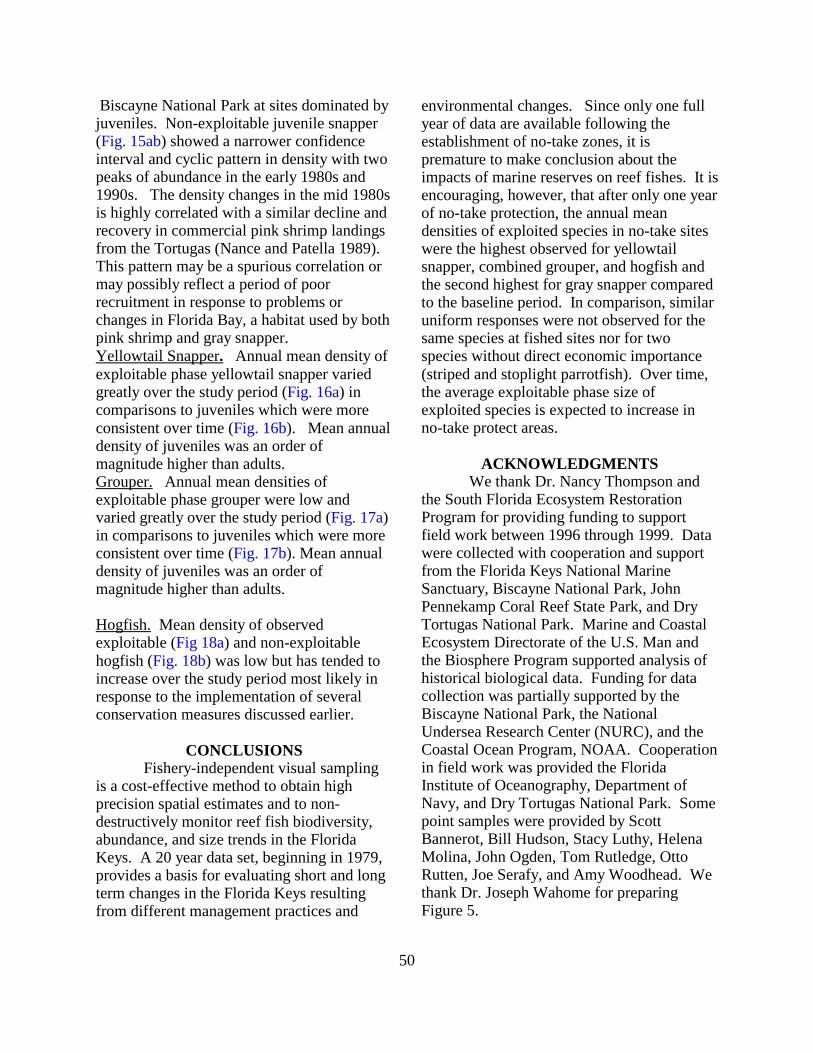
50
Biscayne National Park at sites dominated byjuveniles. Non-exploitable juvenile snapper (Fig. 15ab) showed a narrower confidenceinterval and cyclic pattern in density with twopeaks of abundance in the early 1980s and1990s. The density changes in the mid 1980sis highly correlated with a similar decline andrecovery in commercial pink shrimp landingsfrom the Tortugas (Nance and Patella 1989). This pattern may be a spurious correlation ormay possibly reflect a period of poorrecruitment in response to problems orchanges in Florida Bay, a habitat used by bothpink shrimp and gray snapper. Yellowtail Snapper. Annual mean density ofexploitable phase yellowtail snapper variedgreatly over the study period (Fig. 16a) incomparisons to juveniles which were moreconsistent over time (Fig. 16b). Mean annualdensity of juveniles was an order ofmagnitude higher than adults.Grouper. Annual mean densities ofexploitable phase grouper were low andvaried greatly over the study period (Fig. 17a)in comparisons to juveniles which were moreconsistent over time (Fig. 17b). Mean annualdensity of juveniles was an order ofmagnitude higher than adults.
Hogfish. Mean density of observedexploitable (Fig 18a) and non-exploitablehogfish (Fig. 18b) was low but has tended toincrease over the study period most likely inresponse to the implementation of severalconservation measures discussed earlier.
CONCLUSIONSFishery-independent visual sampling
is a cost-effective method to obtain highprecision spatial estimates and to non-destructively monitor reef fish biodiversity,abundance, and size trends in the FloridaKeys. A 20 year data set, beginning in 1979,provides a basis for evaluating short and longterm changes in the Florida Keys resultingfrom different management practices and
environmental changes. Since only one fullyear of data are available following theestablishment of no-take zones, it ispremature to make conclusion about theimpacts of marine reserves on reef fishes. It isencouraging, however, that after only one yearof no-take protection, the annual meandensities of exploited species in no-take siteswere the highest observed for yellowtailsnapper, combined grouper, and hogfish andthe second highest for gray snapper comparedto the baseline period. In comparison, similaruniform responses were not observed for thesame species at fished sites nor for twospecies without direct economic importance(striped and stoplight parrotfish). Over time,the average exploitable phase size ofexploited species is expected to increase inno-take protect areas.
ACKNOWLEDGMENTSWe thank Dr. Nancy Thompson and
the South Florida Ecosystem RestorationProgram for providing funding to supportfield work between 1996 through 1999. Datawere collected with cooperation and supportfrom the Florida Keys National MarineSanctuary, Biscayne National Park, JohnPennekamp Coral Reef State Park, and DryTortugas National Park. Marine and CoastalEcosystem Directorate of the U.S. Man andthe Biosphere Program supported analysis ofhistorical biological data. Funding for datacollection was partially supported by theBiscayne National Park, the NationalUndersea Research Center (NURC), and theCoastal Ocean Program, NOAA. Cooperationin field work was provided the FloridaInstitute of Oceanography, Department ofNavy, and Dry Tortugas National Park. Somepoint samples were provided by ScottBannerot, Bill Hudson, Stacy Luthy, HelenaMolina, John Ogden, Tom Rutledge, OttoRutten, Joe Serafy, and Amy Woodhead. Wethank Dr. Joseph Wahome for preparingFigure 5.
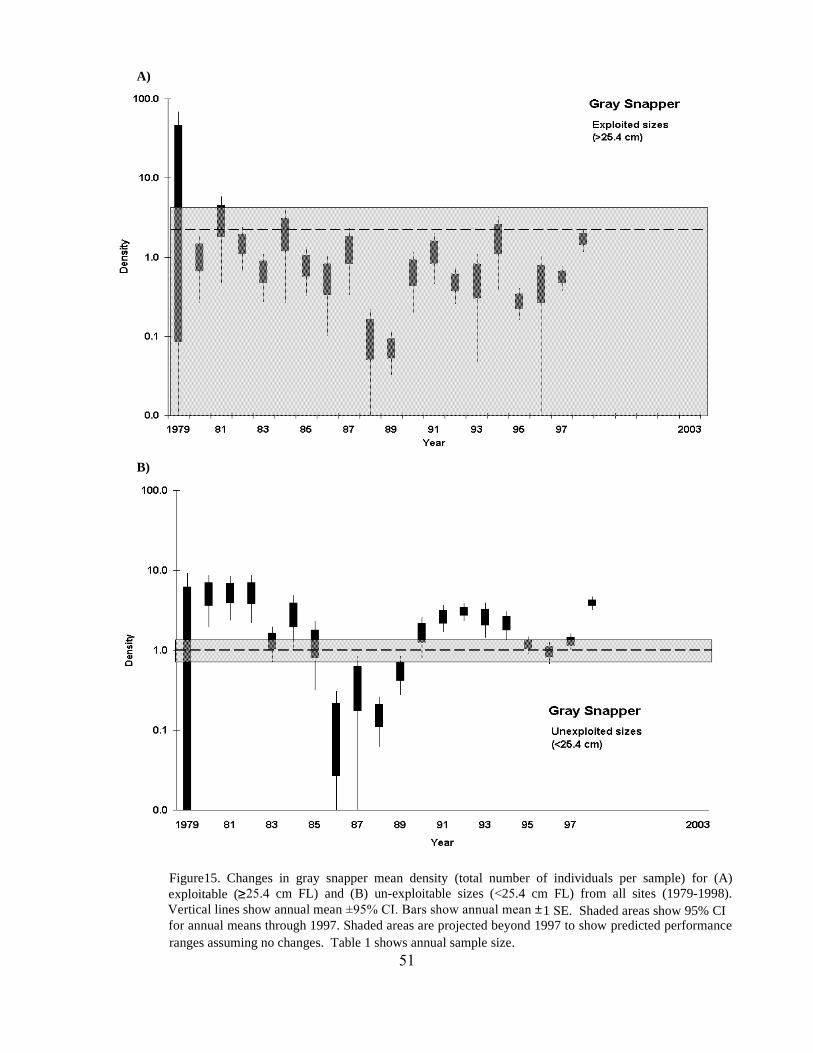
51
1 S E . S haded areas show 95 % C I
ranges assuming no changes. T able 1 shows annual sample siz e.
Figure15 . C hanges in gray snapper mean density (total number of individuals per sample) for (A )ex ploitable (>25.4 cm FL ) and (B ) un-exploitable siz es (< 25.4 cm FL ) from all sites (1979-1998).Vertical lines show annual mean ±95% CI. Bars show annual mean ±for annual means through 1997. Shaded areas are proj ected beyond 1997 to show predicted performance
B)
A)
≥
Jack Javech
Jack Javech
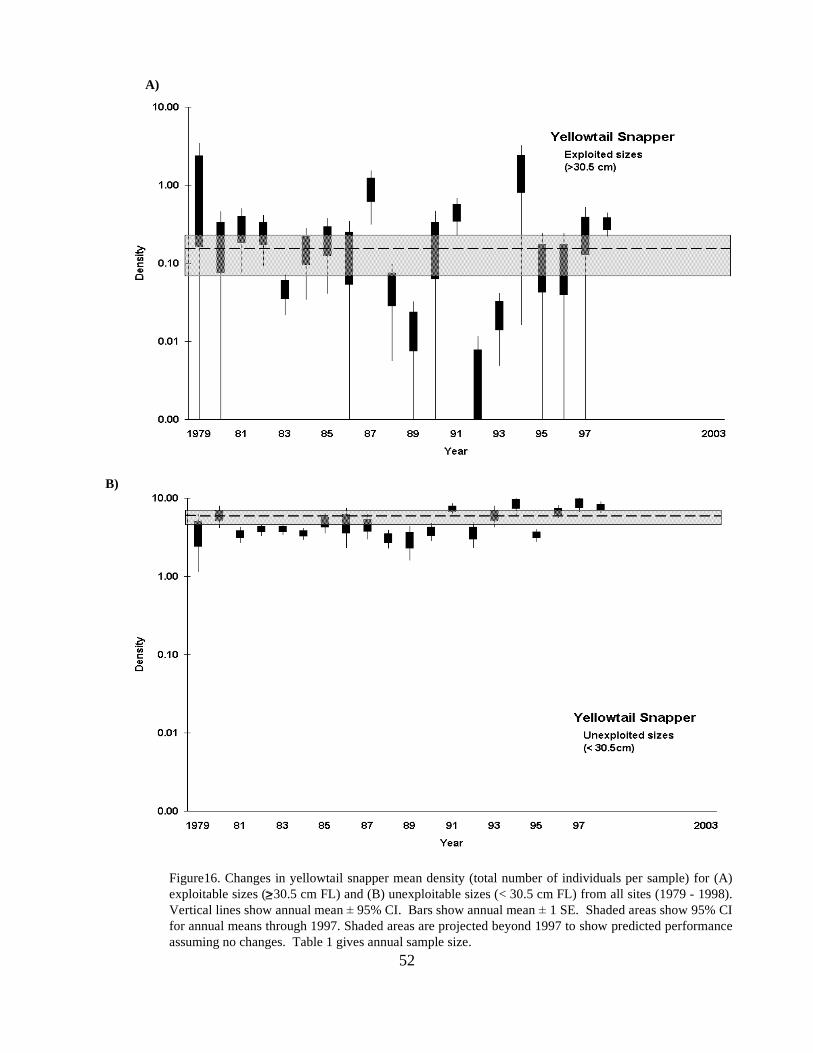
52
1 SE. Shaded areas show 95% CIfor annual means through 1997. Shaded areas are projected beyond 1997 to show predicted performanceassuming no changes. Table 1 gives annual sample size.
A)
B)
Figure16. Changes in yellowtail snapper mean density (total number of individuals per sample) for (A)exploitable sizes (>30.5 cm FL) and (B) unexploitable sizes (< 30.5 cm FL) from all sites (1979 - 1998).Vertical lines show annual mean ± 95% CI. Bars show annual mean ±
≥
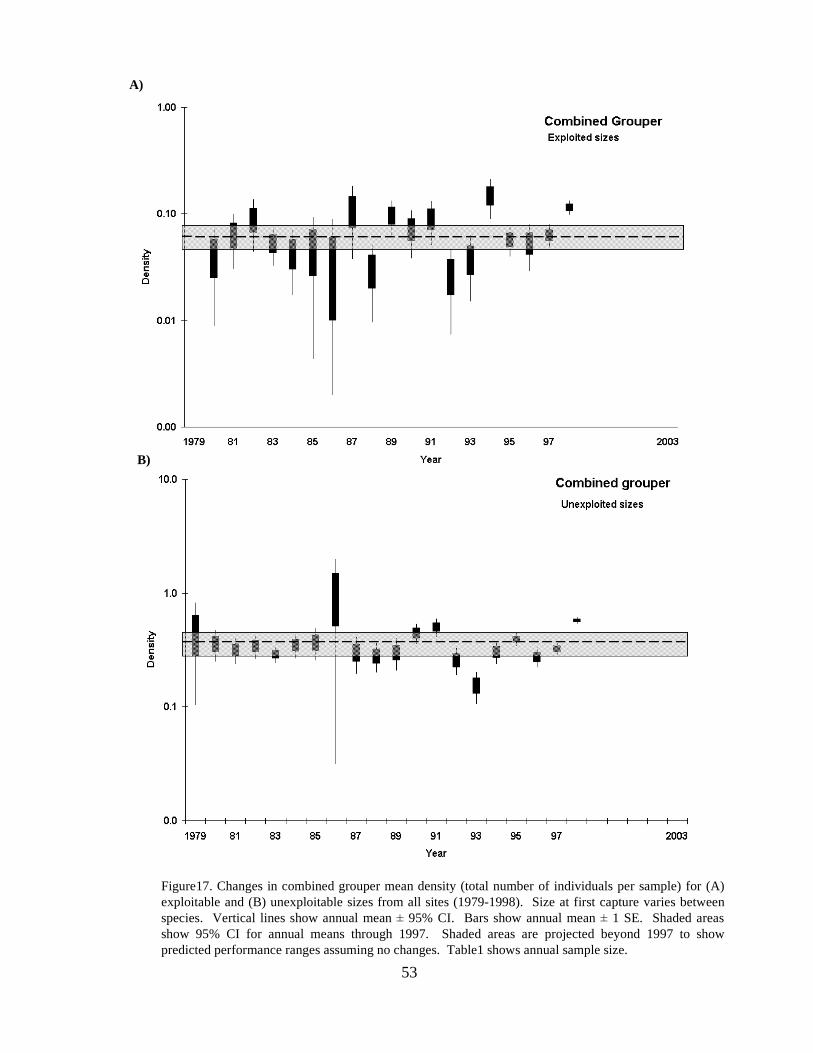
53
A)
B)
Figure17. Changes in combined grouper mean density (total number of individuals per sample) for (A)exploitable and (B) unexploitable sizes from all sites (1979-1998). Size at first capture varies betweenspecies. Vertical lines show annual mean ± 95% CI. Bars show annual mean ± 1 SE. Shaded areasshow 95% CI for annual means through 1997. Shaded areas are projected beyond 1997 to showpredicted performance ranges assuming no changes. Table1 shows annual sample size.
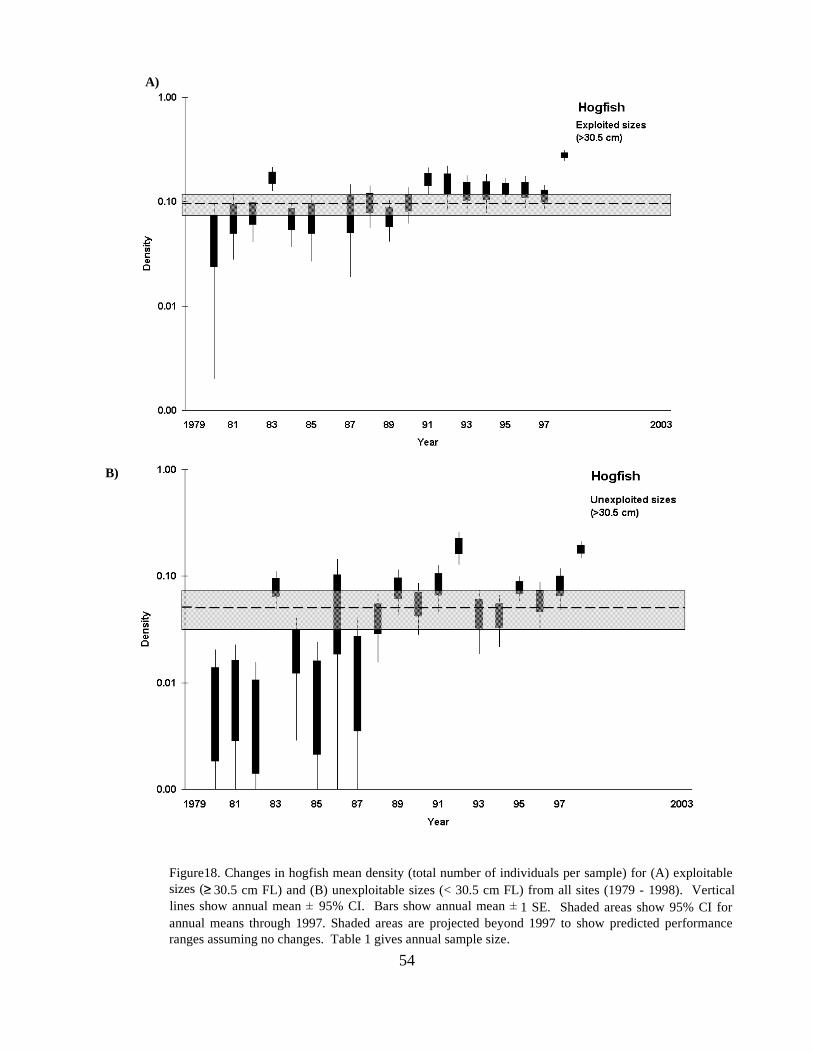
54
1 SE. Shaded areas show 95% CI forannual means through 1997. Shaded areas are projected beyond 1997 to show predicted performanceranges assuming no changes. Table 1 gives annual sample size.
B)
A)
Figure18. Changes in hogfish mean density (total number of individuals per sample) for (A) exploitablesizes (> 30.5 cm FL) and (B) unexploitable sizes (< 30.5 cm FL) from all sites (1979 - 1998). Verticallines show annual mean ± 95% CI. Bars show annual mean ±
≥
55
LITERATURE CITED
Ault, J.S., J.A. Bohnsack, and G. Meester. 1998. A retrospective (1979-1995) multispeciesassessment of coral reef fish stocks in theFlorida Keys. Fish. Bull., U.S. 96(3):395-414.
Ault, J.S., J.A. Bohnsack, and G.A. Meester. 1997. Florida Keys National MarineSanctuary: Retrospective (1979-1995)reef fish assessment and a case forprotected marine areas. In: D.A.Hancock, D.C. Smith, A. Grant and J.P.Beumer (eds.). Developing andsustaining World Fisheries Resources:The State of Science and Management. World Fish. Congr. 2: 415-425.
Bannerot, S.P. 1990. Fish communities andfisheries biology. Pages 231-265 inContinental Shelf Associates, Inc. Synthesis of available biological,geological, chemical, socioeconomic, andcultural resource information for theSouth Florida area. U.S. Dept. InteriorMinerals and Management Service OCSStudy MMS 90-0019. 745 p.
Beets, J. 1993. Baseline data, 1988-1992, withemphasis on the impact of HurricaneHugo. Chapter I in Long-term monitoringof fisheries in Virgin Islands NationalPark. U.S. Nat. Park Serv. Tech. Rep.VINP 1/93. 45 p.
Bell, J.D., G.J.S. Craik, D.A. Pollard, and B.C.Russell. 1985. Estimating lengthfrequency distributions of large reef fishunderwater. Coral Reefs 4:41-44.
Bellwood, D.R. and A.C. Alcala. 1988. Theeffect of minimum length specification onvisual census estimates of density andbiomass of coral reef fishes. Coral Reefs7:23-27.
Bohnsack, J.A. 1982. The effects of piscivorouspredator removal on coral reef fishcommunity structure. Pages 258-267 inG.M. Cailliet and C.A. Simenstad (eds.). Gutshop ‘81: Fish Food Habits Studies. Proceedings of the Third PacificWorkshop. Washington Sea Grant.University of Washington, Seattle.
Bohnsack, J.A. 1995. Passive Assessmenttechniques for shallow water reef
resources. Pages 17-21 in Proceedings ofthe 1987 SEAMAP Passive GearAssessment Workshop at Mayaguez,Puerto Rico. NOAA Tech. Mem. NMFS-SEFSC-365. 177 p.
Bohnsack, J.A. 1996. Maintenance and recoveryof fishery productivity. Chapter 11. Pages 283-313 in N.V.C. Polunin andC.M. Roberts (eds). Tropical ReefFisheries. Fish and Fisheries Series 20. Chapman and Hall. London. 477 p.
Bohnsack, J.A. 1997. Consensus developmentand the use of marine reserves in theFlorida Keys, U.S.A. Proc. 8th Int. CoralReef Symp. 2: 1922-1930.
Bohnsack, J.A. 1998. Consensus developmentand the use of marine reserves in theFlorida Keys National Marine Sanctuary. Pages 67-70. in D. Onysko and R. Usher(eds.). Protected areas in resource-basedeconomies: Sustaining biodiversity &ecological integrity. 14th Annual GeneralMeeting of the Canadian Council onEcological Areas. 1995, Calgary,Alberta, Canada. 85 p.
Bohnsack, J.A. and J.S. Ault. 1996. Managementstrategies to conserve marine biodiversity. Oceanogr. 9: 73-82.
Bohnsack, J.A. and S.P. Bannerot. l983. Arandom point census technique forvisually assessing coral reef fishes. Pages5-7 in C.A. Barans and S.A. Bortone(eds.). The visual assessment of fishpopulations in the southeastern UnitedStates: l982 Workshop. South CarolinaSea Grant Consortium, Tech. Rep. l(SC-SG-TR-0l-83). 52 p.
Bohnsack, J.A., and S.P. Bannerot. 1986. Astationary visual census technique forquantitatively assessing communitystructure of coral reef fishes. NOAATechnical Report NMFS 41: 1-15.
Bohnsack, J.A. and D.E. Harper. 1988.Length-weight relationships of selectedmarine reef fishes from southeasternUnited States and the Caribbean. NOAATech. Mem. NMFS-SEFC-215. 31 p.
Bohnsack, J.A., D.E. Harper and D.B. McClellan. 1994. Fisheries trends from MonroeCounty, Florida. Bull. Mar. Sci. 54: 982-1018.
56
Bohnsack, J.A., D.E. Harper, D.B. McClellan,D.L. Sutherland, and M.W. White. 1987. Resource survey of fishes within LooeKey National Marine Sanctuary. NOAATech. Mem. NOS MEMD 5: 1-108.
Bortone, S.A., R.W. Hastings, and J.L. Oglesby. 1986. Quantification of reef fishassemblages: A comparison of several insitu methods. Northeast Gulf Sci. 8(1):1-22.
Bortone, S. and J. Bohnsack. 1991. Samplingand Studying Fish on Artificial Reefs. Chapter 7. Pages 39-51 in J.G. Halusky(ed.). Artificial Reef Research Diver'sHandbook. Tech. Paper 63. Florida SeaGrant College Program. 198 p.
Bray, J.R. and J.T. Curtis. 1957. An ordinationof the upland forest communities ofsouthern Wisconsin. Ecol. Monogr. 27:325-349.
Chiappone, M. and R. Sluka. 1996. Fish andFisheries. Vol. 6. Site characterizationfor the Florida Keys National MarineSanctuary and environs. Farley CourtPublishers, Zenda, WI. 149 p.
Clark, J.R., B. Causey, and J.A. Bohnsack. 1989. Benefits from coral reef protection: LooeKey Reef, Florida. Coastal Zone '89:Proc. 6th Symp. Coastal Ocean Mgt 4:3076-3086.
Continental Shelf Associates, Inc. 1990. Synthesis of available biological,geological, chemical, socioeconomic, andcultural resource information for thesouth Florida area. Phillips, N. and K.Larson (eds.) OCS Study MMS 90-0019.U.S. Department of the Interior, MineralsManagement Service. Washington, DC:U.S. Government Printing Office. 657 p.+ Appendices.
Goldman, B. and F. Talbot. 1976. Aspects of theecology of coral reef fishes. Pages 125-154 in O.A. Jones and R. Endean (ed.),Biology and geology of coral reefs. Vol.3, Biol. 2. Academic Press, N.Y. 435 p.
Harmelin-Vivien, M.L. 1981. Trophicrelationships of reef fishes in Tulear(Madagascar). Oceanologica ACTA 4(3):365-374.
Haitt, R.W. and D.W. Strasburg. 1960. Ecological relationships of the fish fauna
on coral reefs of the Marshall Islands. Ecol. Monogr. 30: 65-127.
Harvey, E. and M. Shortis, 1996 A system forstereo-video measurement of sub-tidalorganisms. MTS Journal 29:10-22.
Hobson, E.S. 1974. Feeding relationships ofteleostean fishes on coral reefs in Kona,Hawaii. Fish. Bull. U.S. 72: 915-1031.
Hobson, E.S. and J.R. Chess. 1976. Trophicrelationships among fishes and planktonin a lagoon at Enewetak Atoll, MarshallIslands. Fish. Bull. U.S. 74: 567-598.
Hoffmeister, J.E. 1974. Land from the sea, thegeologic story of south Florida. University of Miami Press, Miami, FL143 p.
Hubbell, S.P. 1979. Tree dispersion, abundance,and diversity in a tropical dry forest.Science 203: 1299-1309
Jaap, W.C. 1984. The ecology of the southFlorida coral reefs: A community profile. U.S. Fish Wildl. Serv. FWS/OBS - 82/08.138 p.
Lee, T.N., C. Rooth, E. Williams, M. McGowan,A.F. Szmant, M.E. Clarke. 1992. Influence of Florida Current, gyres andwind-driven circulation on transport oflarvae and recruitment in the FloridaKeys coral reefs. Continental Shelf Res.12: 971-1002.
Lee, T.M., M.E. Clarke, E. Williams, A.F.Szmant, and T. Berger. 1994. Evolutionof the Tortugas gyre and its influence onrecruitment in the Florida Keys. Bull.Mar. Sci. 54: 621-646.
Limouzy-Paris, C., M.F. McGowan, W.J.Richards, J.P. Umaran, and S.S. Cha. 1994. Diversity of fish larvae in theFlorida Keys: Results from SEFCAR. Bull. Mar. Sci. 54: 857-870.
Longley, W.J. and S.F. Hildebrand. 1941. Systematic catalogue of the fishes ofTortugas, Florida; with observations oncolor, habits, and local distribution. Paps.Tortugas Lab. 34: 1-331. CarnegieInstitution of Washington PublicationNumber 535.
McClellan, D.B. 1996. Aerial surveys for seaturtles, marine mammals, and vesselactivity along the southeast Florida Coast,1992-1996. NOAA Tech. Mem. NMFS-
57
SEFSC-390. 42 p.McKenna, J.E., Jr. 1997. Influence of physical
disturbance on the structure of coral reeffish assemblages in the Dry Tortugas. Carib. J. Sci. 33: 82-97.
Meester, G.A., J.S. Ault, and J.A. Bohnsack. (inpress). Visual censussing and theextraction of average length as abiological indicator of stock health. Naturalista Sicil. Vol. (Suppl.): 205-222.
Nance, J.M. and F.J. Patella. 1989. Review ofthe Tortugas pink shrimp fishery fromMay 1987 to January 1989. NOAA Tech.Mem. SEFC-NMFS-238. 24 p.
Pattengill-Semmens, C.V. and B.X. Semmens. 1999. An analysis of fish survey datagenerated by non-expert volunteers in theFlower Garden Banks National MarineSanctuary. Gulf of Mexico Sci. 1998 (2):196-207.
PDT (Plan Development Team). 1990. Thepotential of marine fishery reserves forreef fish management in the U.S. southernAtlantic. NOAA Tech. Mem. NMFS-SEFC-261. 45 p.
Randall, J.E. 1967. Food habits of reef fishes ofthe West Indies. Stud. Trop. Oceanogr. 5:665-847.
Richards, W.J. and J.A. Bohnsack. 1990. TheCaribbean Sea: A large marine ecosystemin crisis. pp. 44-53 in: K. Sherman, L.M.Alexander, and B.D. Gold (eds.). LargeMarine Ecosystems: Patterns Processesand Yields. Am. Assoc. Adv. Sci. Washington, D.C. 242 p.
Robins, C.R. 1971. Distributional patterns offishes from coastal and shallow waters ofthe tropical western Atlantic. F.A.O. Fisheries Rep. 71.2: 249-255.
Robins, C.R., G.C. Ray, J. Douglass, and R.Freund. 1986. A field guide to Atlanticcoast fishes of North America. ThePeterson Field Guide Series. HoughtonMifflin Co., Boston. 354 p.
Robins, C.R., R.M. Bailey, C.E. Bond, J.R.Brooker, E.A. Lachner, R.N. Lea, andW.B. Scott. 1991. Common andscientific names of fishes from the UnitedStates and Canada, Fifth Edition, 1991. Amer. Fish. Soc., Spec. Pub. 20. 183 p.
Schmidt, T.W., J.S. Ault, and J.A. Bohnsack.
1999. Site characterization for the DryTortugas region: Fisheries and essentialhabitats. NOAA Tech. Mem. NMFS-SEFSC-428.
Schmitt, E.F. and K.M. Sullivan. 1996. Analysisof a volunteer method for collecting fishpresence and abundance data in theFlorida Keys. Bull. Mar. Sci. 59: 404-416.
Shinn, E.A. 1963. Spur and groove formation onthe Florida reef tract. J. Sediment. Petrol.3(2): 291-115.
Smith-Vaniz, W.F., J.A. Bohnsack and J.D.Williams. 1995. Reef Fishes of theFlorida Keys. Pages 279-284 in OurLiving Resources. U.S. Department ofthe Interior - National Biological Service.Washington, D.C. 530 p.
Sokal, R.R. and F.J. Rohlf. 1981. Biometry (2nd
ed.). W.J. Freeman, San Francisco. 859p.
Starck, W.A. 1968. A list of fishes of AlligatorReef, Florida with comments on thenature of the Florida reef fauna. Undersea Biol. 1:4-40.
Stokes, F.J. 1980. Handguide to the coral reeffishes of the Caribbean. Lippincott andCrowell, Publ., New York. 160 p.
St. John, J., G.R. Russ, and W. Gladstone. 1990. Accuracy and bias of visual estimates ofnumbers, size structure, and biomass ofcoral reef fish. Mar. Ecol. Prog. Ser.64:253-262.
Talbot, F. and B. Goldman, B. 1973. Apreliminary report on the diversity andfeeding relationships of reef fishes of OneTree Island, Great Barrier Reef System. Pages 425-443 in: Proc. Symp. Coral andCoral Reefs 1969. Mar. Bio. Assoc.India.
Thayer, G.W. and A.J. Chester 1989. Distribution and abundance of fishesamong basin and channel habitats inFlorida Bay. Bull. Mar. Sci. 44(1): 200-219.
Thayer, G.W., D.R. Colby and W.F. Hettler. 1987. Utilization of the red mangroveprop root habitat by fishes in southFlorida. Mar. Ecol Prog. Ser. 35: 25-38.
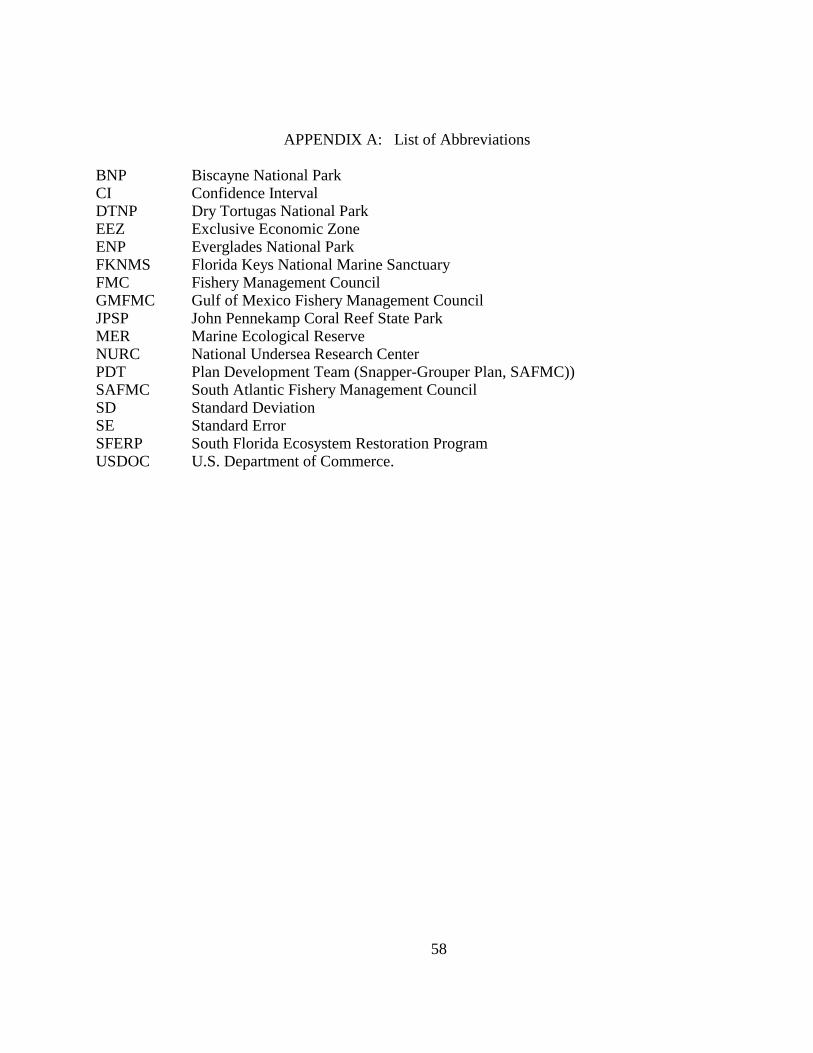
APPENDIX A: List of Abbreviations
BNP Biscayne National ParkCI Confidence IntervalDTNP Dry Tortugas National ParkEEZ Exclusive Economic ZoneENP Everglades National ParkFKNMS Florida Keys National Marine SanctuaryFMC Fishery Management CouncilGMFMC Gulf of Mexico Fishery Management CouncilJPSP John Pennekamp Coral Reef State ParkMER Marine Ecological ReserveNURC National Undersea Research CenterPDT Plan Development Team (Snapper-Grouper Plan, SAFMC))SAFMC South Atlantic Fishery Management CouncilSD Standard DeviationSE Standard ErrorSFERP South Florida Ecosystem Restoration ProgramUSDOC U.S. Department of Commerce.
58
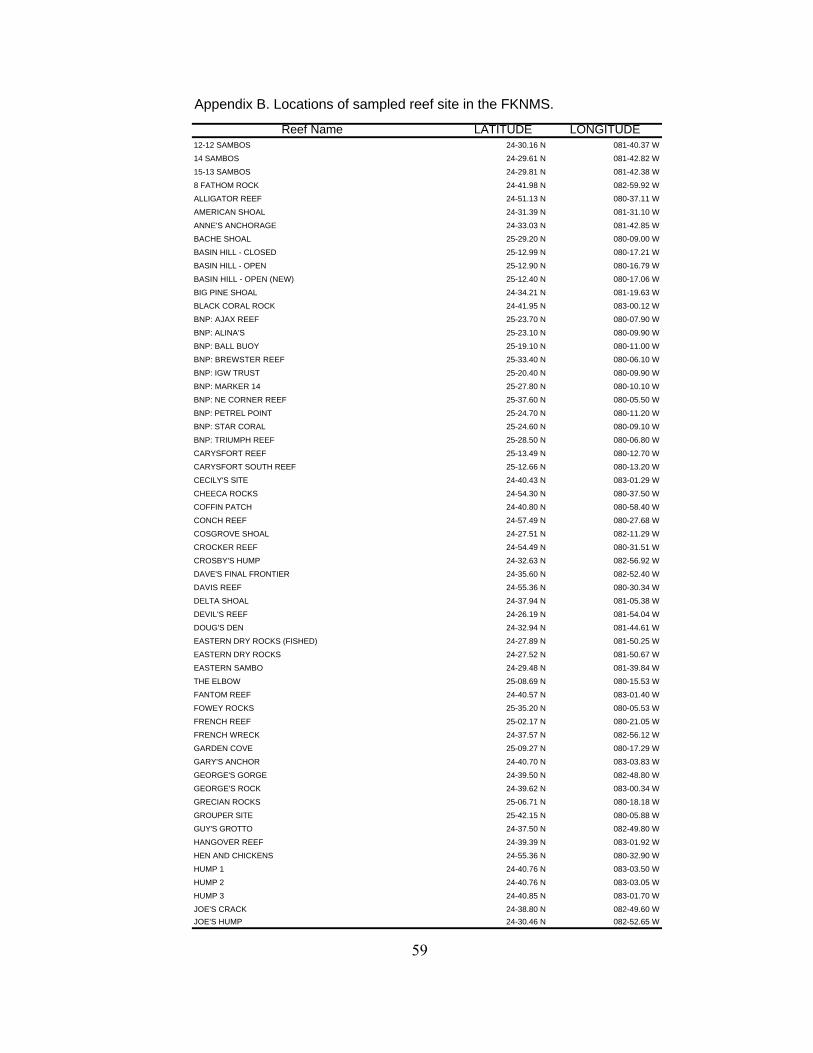
Appendix B. Locations of sampled reef site in the FKNMS.
Reef Name LATITUDE LONGITUDE12-12 SAMBOS 24-30.16 N 081-40.37 W
14 SAMBOS 24-29.61 N 081-42.82 W
15-13 SAMBOS 24-29.81 N 081-42.38 W
8 FATHOM ROCK 24-41.98 N 082-59.92 W
ALLIGATOR REEF 24-51.13 N 080-37.11 W
AMERICAN SHOAL 24-31.39 N 081-31.10 W
ANNE'S ANCHORAGE 24-33.03 N 081-42.85 W
BACHE SHOAL 25-29.20 N 080-09.00 W
BASIN HILL - CLOSED 25-12.99 N 080-17.21 W
BASIN HILL - OPEN 25-12.90 N 080-16.79 W
BASIN HILL - OPEN (NEW) 25-12.40 N 080-17.06 W
BIG PINE SHOAL 24-34.21 N 081-19.63 W
BLACK CORAL ROCK 24-41.95 N 083-00.12 W
BNP: AJAX REEF 25-23.70 N 080-07.90 W
BNP: ALINA'S 25-23.10 N 080-09.90 W
BNP: BALL BUOY 25-19.10 N 080-11.00 W
BNP: BREWSTER REEF 25-33.40 N 080-06.10 W
BNP: IGW TRUST 25-20.40 N 080-09.90 W
BNP: MARKER 14 25-27.80 N 080-10.10 W
BNP: NE CORNER REEF 25-37.60 N 080-05.50 W
BNP: PETREL POINT 25-24.70 N 080-11.20 W
BNP: STAR CORAL 25-24.60 N 080-09.10 W
BNP: TRIUMPH REEF 25-28.50 N 080-06.80 W
CARYSFORT REEF 25-13.49 N 080-12.70 W
CARYSFORT SOUTH REEF 25-12.66 N 080-13.20 W
CECILY'S SITE 24-40.43 N 083-01.29 W
CHEECA ROCKS 24-54.30 N 080-37.50 W
COFFIN PATCH 24-40.80 N 080-58.40 W
CONCH REEF 24-57.49 N 080-27.68 W
COSGROVE SHOAL 24-27.51 N 082-11.29 W
CROCKER REEF 24-54.49 N 080-31.51 W
CROSBY'S HUMP 24-32.63 N 082-56.92 W
DAVE'S FINAL FRONTIER 24-35.60 N 082-52.40 W
DAVIS REEF 24-55.36 N 080-30.34 W
DELTA SHOAL 24-37.94 N 081-05.38 W
DEVIL'S REEF 24-26.19 N 081-54.04 W
DOUG'S DEN 24-32.94 N 081-44.61 W
EASTERN DRY ROCKS (FISHED) 24-27.89 N 081-50.25 W
EASTERN DRY ROCKS 24-27.52 N 081-50.67 W
EASTERN SAMBO 24-29.48 N 081-39.84 W
THE ELBOW 25-08.69 N 080-15.53 W
FANTOM REEF 24-40.57 N 083-01.40 W
FOWEY ROCKS 25-35.20 N 080-05.53 W
FRENCH REEF 25-02.17 N 080-21.05 W
FRENCH WRECK 24-37.57 N 082-56.12 W
GARDEN COVE 25-09.27 N 080-17.29 W
GARY'S ANCHOR 24-40.70 N 083-03.83 W
GEORGE'S GORGE 24-39.50 N 082-48.80 W
GEORGE'S ROCK 24-39.62 N 083-00.34 W
GRECIAN ROCKS 25-06.71 N 080-18.18 W
GROUPER SITE 25-42.15 N 080-05.88 W
GUY'S GROTTO 24-37.50 N 082-49.80 W
HANGOVER REEF 24-39.39 N 083-01.92 W
HEN AND CHICKENS 24-55.36 N 080-32.90 W
HUMP 1 24-40.76 N 083-03.50 W
HUMP 2 24-40.76 N 083-03.05 W
HUMP 3 24-40.85 N 083-01.70 W
JOE'S CRACK 24-38.80 N 082-49.60 W
JOE'S HUMP 24-30.46 N 082-52.65 W
59
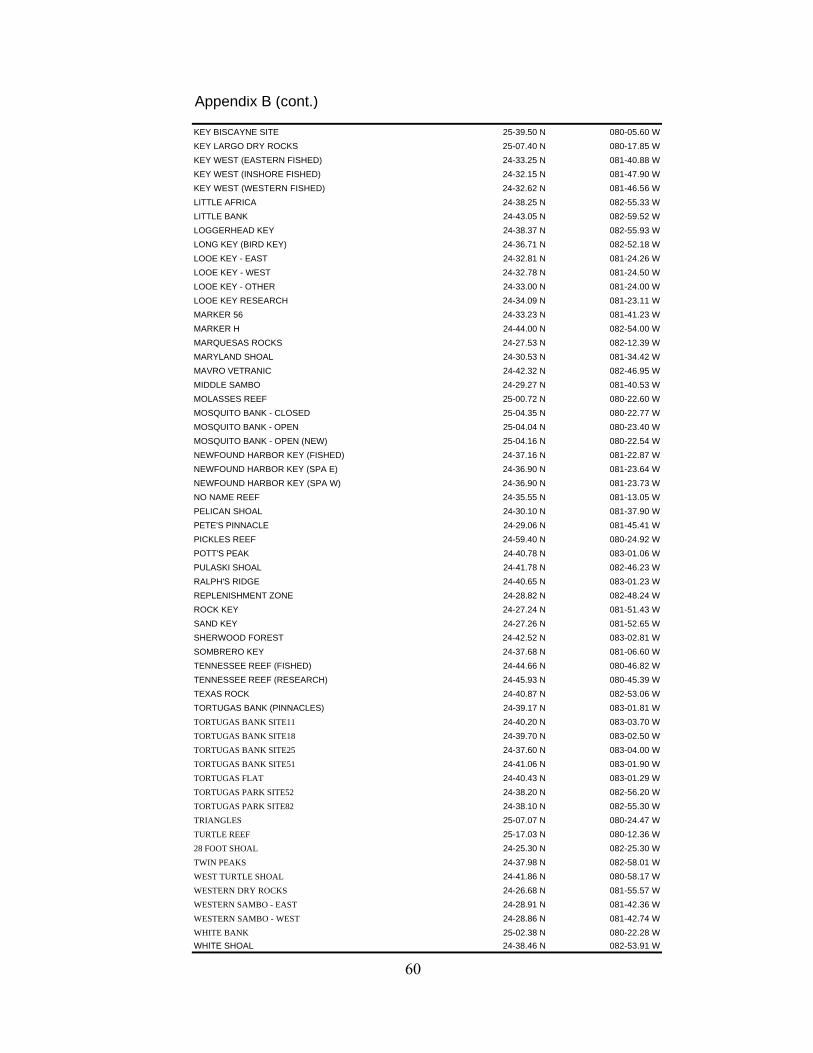
Appendix B (cont.)
KEY BISCAYNE SITE 25-39.50 N 080-05.60 W
KEY LARGO DRY ROCKS 25-07.40 N 080-17.85 W
KEY WEST (EASTERN FISHED) 24-33.25 N 081-40.88 W
KEY WEST (INSHORE FISHED) 24-32.15 N 081-47.90 W
KEY WEST (WESTERN FISHED) 24-32.62 N 081-46.56 W
LITTLE AFRICA 24-38.25 N 082-55.33 W
LITTLE BANK 24-43.05 N 082-59.52 W
LOGGERHEAD KEY 24-38.37 N 082-55.93 W
LONG KEY (BIRD KEY) 24-36.71 N 082-52.18 W
LOOE KEY - EAST 24-32.81 N 081-24.26 W
LOOE KEY - WEST 24-32.78 N 081-24.50 W
LOOE KEY - OTHER 24-33.00 N 081-24.00 W
LOOE KEY RESEARCH 24-34.09 N 081-23.11 W
MARKER 56 24-33.23 N 081-41.23 W
MARKER H 24-44.00 N 082-54.00 W
MARQUESAS ROCKS 24-27.53 N 082-12.39 W
MARYLAND SHOAL 24-30.53 N 081-34.42 W
MAVRO VETRANIC 24-42.32 N 082-46.95 W
MIDDLE SAMBO 24-29.27 N 081-40.53 W
MOLASSES REEF 25-00.72 N 080-22.60 W
MOSQUITO BANK - CLOSED 25-04.35 N 080-22.77 W
MOSQUITO BANK - OPEN 25-04.04 N 080-23.40 W
MOSQUITO BANK - OPEN (NEW) 25-04.16 N 080-22.54 W
NEWFOUND HARBOR KEY (FISHED) 24-37.16 N 081-22.87 W
NEWFOUND HARBOR KEY (SPA E) 24-36.90 N 081-23.64 W
NEWFOUND HARBOR KEY (SPA W) 24-36.90 N 081-23.73 W
NO NAME REEF 24-35.55 N 081-13.05 W
PELICAN SHOAL 24-30.10 N 081-37.90 W
PETE'S PINNACLE 24-29.06 N 081-45.41 W
PICKLES REEF 24-59.40 N 080-24.92 W
POTT'S PEAK 24-40.78 N 083-01.06 W
PULASKI SHOAL 24-41.78 N 082-46.23 W
RALPH'S RIDGE 24-40.65 N 083-01.23 W
REPLENISHMENT ZONE 24-28.82 N 082-48.24 W
ROCK KEY 24-27.24 N 081-51.43 W
SAND KEY 24-27.26 N 081-52.65 W
SHERWOOD FOREST 24-42.52 N 083-02.81 W
SOMBRERO KEY 24-37.68 N 081-06.60 W
TENNESSEE REEF (FISHED) 24-44.66 N 080-46.82 W
TENNESSEE REEF (RESEARCH) 24-45.93 N 080-45.39 W
TEXAS ROCK 24-40.87 N 082-53.06 W
TORTUGAS BANK (PINNACLES) 24-39.17 N 083-01.81 W
TORTUGAS BANK SITE11 24-40.20 N 083-03.70 W
TORTUGAS BANK SITE18 24-39.70 N 083-02.50 W
TORTUGAS BANK SITE25 24-37.60 N 083-04.00 W
TORTUGAS BANK SITE51 24-41.06 N 083-01.90 W
TORTUGAS FLAT 24-40.43 N 083-01.29 W
TORTUGAS PARK SITE52 24-38.20 N 082-56.20 W
TORTUGAS PARK SITE82 24-38.10 N 082-55.30 W
TRIANGLES 25-07.07 N 080-24.47 W
TURTLE REEF 25-17.03 N 080-12.36 W
28 FOOT SHOAL 24-25.30 N 082-25.30 W
TWIN PEAKS 24-37.98 N 082-58.01 W
WEST TURTLE SHOAL 24-41.86 N 080-58.17 W
WESTERN DRY ROCKS 24-26.68 N 081-55.57 W
WESTERN SAMBO - EAST 24-28.91 N 081-42.36 W
WESTERN SAMBO - WEST 24-28.86 N 081-42.74 W
WHITE BANK 25-02.38 N 080-22.28 W
WHITE SHOAL 24-38.46 N 082-53.91 W
60