Baseline and Projected Future Carbon Storage and ... · Baseline and Projected Future Carbon...
40
U.S. Department of the Interior U.S. Geological Survey Professional Paper 1787 Baseline and Projected Future Carbon Storage and Greenhouse-Gas Fluxes in the Great Plains Region of the United States
Transcript of Baseline and Projected Future Carbon Storage and ... · Baseline and Projected Future Carbon...

U.S. Department of the InteriorU.S. Geological Survey
Professional Paper 1787
Baseline and Projected Future Carbon Storage and Greenhouse-Gas Fluxes in the Great Plains Region of the United States
Cover. Agricultural fields and an abandoned farmstead in eastern Montana in the Great Plains region. The Great Plains region of the United States has experienced significant land-use change since European settlement, with vast swaths of grasslands converted to agricultural lands. Access to water, technological changes, a growing biofuels industry, fluctuating demands for agricultural products, and government policies have resulted in periodic historical shifts in land use in the region and may drive major land-use changes in the next several decades. Land use and land management in the region have significant implications for carbon storage and greenhouse-gas fluxes. (Photograph by Terry Sohl.)

Baseline and Projected Future Carbon Storage and Greenhouse-Gas Fluxes in the Great Plains Region of the United States
By Zhiliang Zhu (editor), Michelle Bouchard, David Butman, Todd Hawbaker, Zhengpeng Li, Jinxun Liu, Shuguang Liu, Cory McDonald, Ryan Reker, Kristi Sayler, Benjamin Sleeter, Terry Sohl, Sarah Stackpoole, Anne Wein, and Zhiliang Zhu
The USGS maps how much carbon is stored in ecosystems and projects future changes using streamgage, soil, and natural-resource inventory data; remote-sensing techniques; and computer models
U.S. Department of the InteriorU.S. Geological Survey
Professional Paper 1787

U.S. Department of the InteriorKEN SALAZAR, Secretary
U.S. Geological SurveyMarcia K. McNutt, Director
U.S. Geological Survey, Reston, Virginia: 2011
For more information on the USGS—the Federal source for science about the Earth, its natural and living resources, natural hazards, and the environment, visit http://www.usgs.gov or call 1-888-ASK-USGS
For an overview of USGS information products, including maps, imagery, and publications, visit http://www.usgs.gov/pubprod
To order this and other USGS information products, visit http://store.usgs.gov
Any use of trade, product, or firm names is for descriptive purposes only and does not imply endorsement by the U.S. Government.
Although this report is in the public domain, permission must be secured from the individual copyright owners to reproduce any copyrighted materials contained within this report.
Suggested citation:Zhu, Zhiliang, ed., Bouchard, Michelle, Butman, David, Hawbaker, Todd, Li, Zhengpeng, Liu, Jinxun, Liu, Shuguang, McDonald, Cory, Reker, Ryan, Sayler, Kristi, Sleeter, Benjamin, Sohl, Terry, Stackpoole, Sarah, Wein, Anne, and Zhu, Zhiliang, 2011, Baseline and projected future carbon storage and greenhouse-gas fluxes in the Great Plains region of the United States: U.S. Geological Survey Professional Paper 1787, 28 p. (Also available at http://pubs. usgs.gov/pp/1787/.)

iii
ContentsAcknowledgments .......................................................................................................................................viiExecutive Summary .......................................................................................................................................1Introduction.....................................................................................................................................................3Ecosystems of the Great Plains Region .....................................................................................................3Land-Use and Land-Cover Changes in the Great Plains Region ...........................................................6Projected Climate Change in the Great Plains Region ............................................................................8Wildland Fire and Emissions in the Great Plains Region ........................................................................8Land Management in the Great Plains Region .......................................................................................10Carbon Storage and Greenhouse-Gas Fluxes of Terrestrial Ecosystems
in the Great Plains Region ............................................................................................................11Carbon Fluxes in the Aquatic Ecosystems of the Great Plains Region ...................................................18Integrated Analysis .....................................................................................................................................18References Cited..........................................................................................................................................24
Figures 1. Map showing the spatial extent of this assessment ..............................................................5 2. Graphs showing the distributions of the four primary terrestrial ecosystems
and developed lands of the Great Plains region projected over time for each of the IPCC-SRES scenarios—A1B, A2, and B1 ...........................................................................7
3. Graphs showing the trends of baseline and simulated future burned area due to wildland fires and their emissions for each of the three IPCC-SRES scenarios, by year, in the Great Plains region .............................................................................................9
4. Graphs showing the trends of terrestrial carbon stocks over time in the Great Plains region, for the four primary ecosystems and all lands under each of the three IPCC-SRES scenarios—A1B, A2, and B1—using two biogeochemical models .............13
5. Maps showing the spatial distribution and uncertainty of carbon sequestration and emission in the Great Plains region, by ecosystem between the baseline and 2050 ........................................................................................................................................15
6. Graphs and maps showing temporal trends of projected future greenhouse-gas emissions and their spatial distribution in 2010 in the Great Plains region ......................16
7. Chart showing the minimum through maximum ranges of net flux values (in teragrams of carbon per year) for all of the major components of the estimated baseline (current) carbon budget for the Great Plains region ............................................19
8. Bar charts showing the estimated and projected net changes in the total area and the carbon stocks of the three primary ecosystems in the region (agricultural land, grasslands/shrublands, and forests) between 2005 and 2050, under the three IPCC-SRES scenarios—A1B, A2, and B1 ...............................................................................22
9. Chart showing the net impacts of combined LULC changes on carbon stocks in the Great Plains region ..........................................................................................................23

iv
Conversion Factors
Multiply By To obtain
Lengthcentimeter (cm) 0.3937 inch (in.)meter (m) 3.281 foot (ft)
Area
square meter (m2) 10.76 square foot (ft2)hectare (ha) 2.471 acre
square kilometer (km2) 0.3861 square miles (mi2)Volume
cubic meter (m3) 35.31 cubic foot (ft3)Mass
gram (g) 0.03527 ounce, avoirdupois (oz)kilogram (kg) 2.205 pound avoirdupois (lb)megagram (Mg) [metric ton (t)] 1.102 ton, short (2,000 lb)teragram (Tg) 1.102 × 10⁶ ton, short (2,000 lb)
Temperature in degrees Celsius (°C) may be converted to degrees Fahrenheit (°F) as follows:
°F = (1.8 × °C) + 32
The resolution of pixels in spatial datasets follows the conventions used in the spatial data and modeling communities. The format is “n-meter resolution,” where n is a numerical value for the length. The usage translates into a pixel with a length of n on all sides that covers an area of n meters × n meters.
How Megagrams, Gigagrams, Teragrams, and Petagrams Relate to Metric Tons
1 megagram (Mg) = 1 million grams (106 g) = 1 metric ton (t)
1 gigagram (Gg) = 1 billion grams (109 g) = 1,000 metric tons
1 teragram (Tg) = 1 trillion grams (1012 g) = 1 million metric tons (Mt)
1 petagram (Pg) = 1 quadrillion grams (1015 g) = 1 billion metric tons (Gt)
Tables 1. Assumptions about primary driving forces affecting land-use and
land-cover change .......................................................................................................................7 2. Ranges of annual baseline (observed) values and projected future estimates
for the amount of area burned by wildland fires and their emissions, by IPCC-SRES scenario and assessment year, for the Great Plains region ...............................................10
3. Baseline land area and carbon stock and projected 2050 land area, carbon stock, and annual net flux density, under each of the three IPCC-SRES scenarios for terrestrial ecosystems in the Great Plains region ................................................................12

v
Abbreviations, Acronyms, and Chemical Symbols
ARMS Agricultural Resource Management Survey
C carbon
CCCma CGCM3.1 Canadian Centre for Climate Modelling and Analysis’s Coupled Global Climate Model version 3.1
CH4 methane
CO carbon monoxide
CO2 carbon dioxide
CO2-eq carbon dioxide equivalent
CSIRO–Mk3.0 Australia’s Commonwealth Scientific and Industrial Research Organisation Mark 3.0
DIC dissolved inorganic carbon
EDCM Erosion-Deposition-Carbon Model
EISA Energy Independence and Security Act of 2007
EPA U.S. Environmental Protection Agency
FIA U.S. Forest Service Forest Inventory and Analysis Program
FLM fuel loading model
FOFEM First Order Fire Effects Model
FORE–SCE “forecasting scenarios of land cover change” model
GCM Global Circulation Model
GEMS General Ensemble Modeling System
GHG greenhouse gas
GWP global warming potential
HadCM3 Hadley Centre Coupled Model
HR heterotrophic respiration
HWP harvested wood products
IMAGE 2.2 Netherlands Environmental Assessment Agency’s Integrated Model to Assess the Global Environment version 2.2
IPCC Intergovernmental Panel on Climate Change
IPCC-SRES Intergovernmental Panel on Climate Change’s Special Report on Emission Scenarios
k gas transfer velocity
LANDFIRE Landscape Fire and Resource Management Planning Tools Project
Landsat USGS and NASA Satellite Program
LULC land use and land cover

vi
MIROC 3.2-medres Model for Interdisciplinary Research on Climate version 3.2, medium resolution
MODIS Moderate Resolution Imaging Spectroradiometer
MTBS Monitoring Trends in Burn Severity
N O2 nitrous oxide
NCAR CCSM National Center for Atmospheric Research’s Community Climate System Model
NFDRS National Fire Danger Rating System
NHD National Hydrography Dataset
NLCD National Land Cover Database
NPP net primary productivity
NWIS National Water Information System
PRISM parameter-elevation regressions on independent slopes model
SOC soil organic carbon
TOC total organic carbon
USDA U.S. Department of Agriculture
USGS U.S. Geological Survey

vii
Acknowledgments
Many people helped with the development of the methods and the models, the preparation and analysis of data, and the preparation of this report. We are especially grateful to the following personnel. Guidance on the wildland-fire-model codes and computation was provided by Mark Finney, Matt Jolly, and Robert Keane of the U.S. Department of Agriculture (USDA) Forest Service’s Missoula Fire Sciences Laboratory; Elizabeth Reinhardt of the USDA Forest Service’s Office of the Climate Change Advisor; and Jodi Riegle of the U.S. Geological Survey (USGS). Guidance on the use of the USDA Forest Service forest inventory and assessment data was provided by Samuel Lambert, Elizabeth LaPoint, Patrick Miles, Ronald Piva, Jeffery Turner, and Brad Smith of the USDA Forest Service’s Forest Inventory and Analysis Program. Software, data, and computation support was provided by Stacie Bennett, Devendra Dahal, Brian Davis, Layth Grangaard, Ronald Kanengieter, Jennifer Oeding, Rob Quenzer, and Gail Schmidt of Stinger Ghaffarian Technologies, Inc., and by Claudia Young of Earth Resources Technology, Inc. The development of soil and wetland data was provided by Norman Bliss of Arctic Slope Regional Corporation Research and Technology Solutions and by Kristin Byrd of USGS.
David Clow, Edward Stets, and Robert Striegl of the USGS helped with the development of hydrologic methods and estimates. Greenhouse-gas (GHG) field datasets for model development and calibration and an evaluation of GHG emission factors were provided by Robert Gleason and Brian Tangen of the USGS.
We would like to thank Robert Gleason (USGS), Geoffrey Henebry (South Dakota State University), and Mark Liebig (USDA Agricultural Research Service) for peer review of this report. Finally, special thanks are offered to Christopher Torbert of the USGS for his dedication to managing the project.


Executive SummaryThis assessment was conducted to fulfill the requirements
of section 712 of the Energy Independence and Security Act (EISA) of 2007 and to improve understanding of carbon (C) and greenhouse gas (GHG) fluxes in the Great Plains region in the central part of the United States. The assessment examined carbon storage, carbon fluxes, and other GHG fluxes (methane (CH4 ) and nitrous oxide (N2O)) in all major terrestrial eco -systems (forests, grasslands/shrublands, agricultural lands, and wetlands) and freshwater aquatic systems (rivers, streams, lakes, and impoundments) in two time periods: baseline (generally in the first half of the 2010s) and future (projections from baseline to 2050). The assessment was based on measured and observed data collected by the U.S. Geological Survey (USGS) and many other agencies and organizations and used remote sensing, statistical methods, and simulation models. The major findings are as follows:
• The Great Plains region (2.17 million square kilometers) is predominantly grasslands/shrublands (48 percent of the total area) and agricultural lands (42 percent). Forests (5.35 percent), wetlands (1.4 percent), water bodies (1.16 percent), and other lands (developed and barren lands, 1.73 percent) complete the rest of land cover in the region. Land-use and land-cover (LULC) change is a major driver of changes in carbon storage. Future LULC change in the
region, projected using the Intergovernmental Panel on Climate Change (IPCC) scenarios, is largely driven by the demand for agricultural commodities (including biofuels), resulting in the significant expansion of agricultural land (1.4 to 9.2 percent of the total area by 2050, depending upon which scenario is used in the calculation) at the expense of grasslands/shrublands (–2.2 to –9.3 percent) and forests (0.0 to –0.5 percent).
• Greenhouse-gas emissions from natural and manmade wildland fires are a key component of the assessment. The amount of area burned and the GHG emissions for the Great Plains region are highly variable both spatially and temporally, but the estimates for the amount of area burned are not expected to increase substantially over time, and the resulting GHG emissions are expected to increase just slightly for a range of climate projections. Grassland fires are the most common type of fire in the region, and they yield average GHG emissions (including carbon monoxide (CO), carbon dioxide (CO2 ), and methane (CH4 )) of 0.18 to 24.72 teragrams of carbon-dioxide equivalents per year (TgCO2-eq /yr). Currently, the national GHG inventory report by the U.S. Environmental Protection Agency (EPA) does not include data on the emissions from fires in grasslands/shrublands areas. If included, fire emissions could increase by up to 8 percent of the current reported amount for the Nation.
• The total area covered by aquatic systems in the Great Plains region is small (1.16 percent); however, lateral transfer over the water surface ranged from 0.07 to 0.31 teragrams of carbon per year (TgC/yr) within the region, and vertical evasion into the atmosphere emitted 12.8 to 24.6 TgC/yr as CO2 from rivers, streams, lakes, and impoundments. Because the methods used to estimate aquatic fluxes are not explicitly coupled with methods used to calculate terres-trial estimates, it is uncertain how much of the aquatic fluxes actually may stem from terrestrial sources.
Baseline and Projected Future Carbon Storage and Greenhouse-Gas Fluxes in the Great Plains Region of the United States
By Zhiliang Zhu1 (editor), Michelle Bouchard,2 David Butman,3 Todd Hawbaker,4 Zhengpeng Li,2 Jinxun Liu,5 Shuguang Liu,6 Cory McDonald,7 Ryan Reker,2 Kristi Sayler,6 Benjamin Sleeter,8 Terry Sohl,6 Sarah Stackpoole,4 Anne Wein,8 and Zhiliang Zhu1
1 U.S. Geological Survey, Reston, Va.2 Arctic Slope Regional Corporation Research and Technology Solutions,
Sioux Falls, S.D.3 Yale University, New Haven, Conn.4 U.S. Geological Survey, Denver, Colo.5 Stinger Ghaffarian Technologies, Inc., Sioux Falls, S.D.6 U.S. Geological Survey, Sioux Falls, S.D.7 U.S. Geological Survey, Boulder, Colo.8 U.S. Geological Survey, Menlo Park, Calif.

2 Baseline and Projected Future Carbon Storage and Greenhouse-Gas Fluxes in the Great Plains Region
• The baseline (average of 2001–2005) carbon stock estimate for terrestrial ecosystems in the Great Plains region is approximately 7,500 TgC (only the top 20 centimeters (cm) of the soil layer was considered with regard to soil organic carbon), which is distributed in agricultural lands (45.8 percent), grasslands/shrublands (34.9 percent), forests (15.5 percent), wetlands (2.9 percent), and other lands (0.9 percent). Annual carbon sequestration in the region ranged between 20 and 99 TgC/yr during 2001 to 2005.
• By 2050, the total potential carbon stock for terrestrial ecosystems in the region is projected to increase to a range of 9,665 to 10,228 TgC, depending on the projection scenarios. The increase in carbon stock translates to a potential total sequestration of 2,165 to 2,728 TgC between baseline and 2050, or a mean annual sequestration of 48 to 61 TgC. The projected amount of carbon that would be stored by 2050 for the region is distributed in agricultural lands (47 percent), grasslands/shrublands (29 percent), forests (20.4 percent), wetlands (2.9 percent), and other lands (0.75 percent). Two factors—(1) the projected expansion of agricultural lands and (2) the tendency of croplands in the region to be associated with favorable ecosystem conditions (such as fertile soil and temperate climate, which lead to relatively high soil carbon stock)—explain why agricultural lands may still contain the most carbon stocks by 2050. The increase of forest carbon density and sequestration are projected on existing forests owing to the effects of CO2 fertilization and a projected low level of forest harvesting. Temporally, the rate of sequestration is expected to remain steady and decrease slightly over the projection period as the result of the projected increased LULC change and gradual saturation of carbon storage capacity.
• Methane (CH4 ) emissions from wetlands and nitrous oxide (N2O) emissions from agricultural lands are high for the Great Plains region. When combined, they yield a baseline total of 240 TgCO2-eq /yr (82 TgCO2-eq /yr from CH4 and 158 TgCO2-eq /yr
from N2O). By 2050, N2O emissions are expected to increase by 7 to 11 percent. The expected change of CH4 emissions will range from a slight decrease of 1.6 percent to an increase of 16 percent. Up to 85 percent of the amount of GHG emissions may be offset by carbon sequestration in the region in terms of the impact on atmospheric warming.
• Carbon storage and sequestration are affected by LULC and LULC change in the Great Plains region. Conversions between major ecosystems (for example, converting grasslands/shrublands and forests to agricultural lands) may lead to a cumulative reduction in stored carbon between 26 and 157 TgC from the baseline to 2050 (depending on the scenario), or up to a 4 percent loss of the mean total carbon sequestration of the region during the same time period. Although afforestation in the region may result in a small increase in the total carbon stock, the potential loss of carbon from the conversion of forests to agricultural land is much greater. The loss of carbon storage may be most noticeable in the northern portion of the region because of the relatively low agricultural productivity.
• Climate is another important factor affecting carbon storage and sequestration in the Great Plains region. Although climate projections were simulated for the IPCC scenarios, the effects of climate fluctuations and change have not yet been fully examined. The effects of climate change in the region may include droughts (such as those that occurred between 2002 and 2003), floods (such as those in 2011), as well as extreme fluctuations in temperature and moisture availabilities, which could change the direction of carbon sequestration by the region’s ecosystems.
• Uncertainties in the assessment results remain high because of (1) insufficient input data for various components of the assessment, and (2) inherent uncertainty related to the structure and the param-eterization of methods and models that were used in the assessment. An improved approach that would integrate all the major uncertainty elements is needed for future assessments.
• This assessment provides new data and maps to users showing where carbon storage opportunities and vulnerabilities are located and how they are distributed over time. Within the limits of the resolution of a national assessment, the data and maps may be used to inform climate change mitigation and adaptation decisions while empowering the protection and restoration of other valuable ecological services that are important to society’s welfare and quality of life. Conserving natural land cover (such as forests and grasslands/shrublands) and maintaining agricultural soil sequestration (while finding ways to reduce nitrous oxide and methane emissions) are effective land-management practices for protecting carbon stocks in the region.

Ecosystems of the Great Plains Region 3
IntroductionThis is the first of a series of reports that assess carbon
sequestration and greenhouse-gas (GHG) fluxes in regional ecosystems; this report covers the Great Plains region of the United States. The assessment has two specific objectives: (1) fulfill the requirements of the 2007 Energy Independence and Security Act (EISA; U.S. Congress, 2007), section 712, which directs the Department of the Interior to examine the major ecosystems in all 50 states of the Nation and estimate the amount of and changes in carbon storage and GHG (carbon dioxide (CO2 ), methane (CH4 ), and nitrous oxide (N2O)) fluxes in and out of ecosystems and evaluate the effects of major controlling processes such as climate change, land use, and wildfire on ecosystems; and (2) improve the understanding of the capacity and vulnerability of carbon storage and sequestration in ecosystems in a spatially and temporally meaningful fashion by using the technical capabilities of the U.S. Geological Survey (USGS) and other agencies and organizations
This regional assessment was conducted using the methodology of Zhu and others (2010), which was based on the integrated use of remote sensing, existing resource and soil inventories, data collected specifically for the assessment, statistical analyses, and empirical and process-based modeling. Unless noted specifically in this report or in references cited, the major input datasets, methods, and models are described in the methodology (Zhu and others, 2010). The national assess-ment is organized by five major ecosystems: four terrestrial ecosystems (including forests, grasslands/shrublands, wetlands, and agricultural lands), and one aquatic ecosystem (including rivers, lakes, impoundments, estuaries, and coastal waters9). The thematic definitions of the ecosystems and their spatial boundaries are outlined in Zhu and others (2010).
The assessment accounts for the current (baseline) and future projected changes in carbon and GHG fluxes. Following standard conventions found in the literature on this topic, negative values for carbon fluxes denote carbon uptake, or sequestration, unless noted otherwise. The term “baseline” is defined as the average current annual conditions to be assessed. Different components of the assessment have different baseline years, which are limited by input data characteristics: land use and land cover (LULC, 1992–2005), wildland fires (2001–2008), terrestrial carbon and GHG fluxes (2001–2005), and aquatic carbon fluxes (1970s to present). The input datasets used for the assessment include those developed by the USGS and other agencies and organizations. The output datasets are in the form of either annual digital maps (250-meter (m) resolution) or annual statistics. Because the assessment was conducted at national and broad regional scales, the resulting information and data products should be applied and (or) used only at the regional scale or broader.
9Estuaries and coastal waters are not included in this assessment of the Great Plains region.
Ecosystems of the Great Plains RegionThe Great Plains region is divided into three U.S.
Environmental Protection Agency (EPA) Level II ecoregions: the Temperate Prairies, the West-Central Semi-Arid Prairies, and the South-Central Semi-Arid Prairies (EPA, 1999) (fig. 1). The Great Plains region is characterized by generally flat to gently rolling topography, with a moderately humid climate in the east that gradually transitions to moderately dry conditions in the western Great Plains. A strong temperature gradient also exists; during the winter, bitterly cold temperatures prevail in the north while the south is characterized by mild and pleasant temperatures. The dominant natural vegetation is tied to the precipitation gradient: shortgrass steppe in the dry western part of the region, mixed-grass prairie in the central part, tallgrass prairie in the moderately humid east, and woodlands in the south and east (Burke and others, 1991).
The hydrology of the northern portion of the Great Plains region is dominated by the Missouri River basin, which is the second largest watershed in the United States and drains about one-sixth of the conterminous United States (Galat and others, 2005). The southern portion is dominated by the drainage basins of the Arkansas and the Red Rivers, which flow from the northwest to the southeast and are tributaries to the Mississippi River (Matthews and others, 2005). With some exceptions (for example, the Prairie Pothole region), the vast majority of enclosed water bodies in the Great Plains region are manmade. The main stem of the Missouri River houses the largest reservoir system in North America (Roth, 2005), and the region contains a high density of small ponds and impoundments as well.
The native grasslands of the Great Plains are one of the most endangered ecosystems in North America (Cully and others, 2003; Samson and others, 2004) and have undergone the greatest reduction in size of any ecosystem in North America (Samson and Knopf, 1994). Between 60 and 70 percent of the eastern Great Plains has been plowed and cultivated, compared with slightly less than 30 percent of the western Great Plains (Hartman and others, 2011). Only 1 percent of the original tallgrass prairie remains in the region (Cully and others, 2003). Water availability is the most important driver of land use in the Great Plains. Nearly 20 billion gallons of water are pumped from the High Plains aquifer every day for irrigation and drinking water (Karl and others, 2009). The dramatic growth of irrigated agriculture since 1960 represents a major human-induced hydrologic change in North America (Moore and Rojstaczer, 2001). LULC change and intensive land-management practices have had significant impacts on native plants and animals (Samson and Knopf, 1996; Higgins and others, 2002), nutrient cycling (Fleischner, 1994), and carbon and GHG fluxes (Fuhlendorf and others, 2002).

110° 100° 90°50°
45°
40°
35°
30°
25°
WCBP
NGLP
LAP
NGP
NSH
WHP
ST
WHP
NWGLP
CIP
CGP
FH
COTP
TBP
TBP
EP
STP
NEW MEXICO
COLORADO
WYOMING
ARIZONA
UTAH
IDAHO
TEXAS
KANSAS
OKLAHOMA
NEBRASKA
SOUTHDAKOTA
NORTHDAKOTA
MONTANA
MINNESOTA
IOWA
MISSOURI
ARKANSAS
LOUISIANA
WISCONSIN
MIS
SISS
IPPI
ILLI
NO
IS
CANADA
Gulf of M
exico
Lake Superior
MEXICO
0 100 200 300 MILES
0 100 200 300 400 KILOMETERS
Base from 2001 National Land Cover Database(Homer and others, 2007)
4 Baseline and Projected Future Carbon Storage and Greenhouse-Gas Fluxes in the Great Plains Region

Index map of Level II ecoregionsin the Great Plains region
TemperatePrairies
West-CentralSemi-Arid
Prairies
South-CentralSemi-Arid
Prairies
WaterLand cover
DevelopedLoggingMiningBarrenDeciduous forestEvergreen forestMixed forestGrasslandShrublandCultivated cropsHay/pastureHerbaceous wetlandsWoody wetlands
EXPLANATION
Figure 1.
Level IIEcoregion boundary
Level III
South-Central Semi-Arid Prairies WHP Western High Plains ST Southwest Tablelands CGP Central Great Plains FH Flint Hills COTP Central Oklahoma/Texas Plains EP Edwards Plateau STP Southern Texas Plains TBP Texas Blackland Prairies
Temperate Prairies CIP Central Irregular Plains NGLP Northern Glaciated Plains WCBP Western Corn Belt Plains LAP Lake Agassiz Plain
West-Central Semi-Arid Prairies NWGLP Northwestern Glaciated Plains NGP Northwestern Great Plains NSH Nebraska Sand Hills
Area of enlarged map on facing page
Arkansas
River
River
Missouri River Mississippi
Red River
Ecosystems of the Great Plains Region 5
Estimates of carbon storage, sequestration, and GHG fluxes vary widely by ecosystems in the region. The estimates for the conterminous United States and coastal Alaska provided in the annual national GHG inventory report (EPA, 2011a) suggest an average annual net carbon flux of –2.36 TgC/yr for grasslands remaining as grasslands, –6.56 TgC/yr for lands converted to grasslands, or a combined –8.92 TgC/yr for grasslands. Using data from 15 flux towers variously located in grassland areas of the Great Plains between 2000 and 2008, Zhang and others (2011) showed that the annual net flux density ranged from –10 to –38 grams of carbon per square meter per year (gC/m2/yr); by extrapolating the density value to the total area of grasslands in the region (derived from the USGS National Land Cover Database (NCLD); Homer and others, 2007), the annual total flux ranged from approximately –12.96 to – 49.24 TgC/yr (mean value of –31.1 TgC/yr). For croplands, the EPA estimated an annual net flux of –5.05 TgC/yr (for croplands that remained as croplands), 1.61 TgC/yr (for other lands converted to croplands), or a combined annual net flux of –3.44 TgC/yr. West and others (2010) determined that the net ecosystem carbon balance in 2004 for croplands in the region ranged from a high of –48 gC/m2 on more productive lands to as low as 60 gC/m2 on drier lands.
Using data derived from its forest inventory and accounting for all the major carbon pools in the region, the U.S. Department of Agriculture (USDA) Forest Service reported that (1) carbon stored in the region’s forests in 2010 averaged 471, 279, and 1,346 TgC respectively, for the Temperate Prairies, the West-Central Semi-Arid Prairies, and the South-Central Semi-Arid Prairies; and (2) the average carbon stock density for the region’s forests was 104 megagrams of carbon per hectare (MgC/ha), or 10.4 kilograms of carbon per square meter (kgC/m2) (USDA, 2011). Estimates of regional carbon and GHG flux rates for wetlands generally are not found in existing literature. Studies conducted by the USGS (Gleason and others, 2005; Euliss and others 2006) found that the restoration of Prairie Pothole wetlands from croplands may result in an increase in soil organic carbon sequestration by up to 187 Tg for the region (2.75 MgC/ha) within 10 years of restoration without incurring increased emissions of GHG (CO2, CH4, and N2O) (Gleason and others, 2009). Regional studies reporting CO2 fluxes from aquatic ecosystems in the Great Plains region are not currently available, but a study by Raymond and Oh (2007) reported that the Missouri River yielded from 1.5 to 3.5 gC/m2/yr for dissolved inorganic carbon (DIC) and from 0.2 to 2.0 gC/m2/yr for total organic carbon (TOC).
Figure 1 (pages 4 and 5). Map showing the spatial extent of this assessment. The Great Plains region consists of 3 EPA Level II ecoregions (the Temperate Prairies, the West-Central Semi-Arid Prairies, and the South-Central Semi-Arid Prairies), which in turn consist of 16 Level III ecoregions (modified from EPA, 1999). The total area of the Great Plains region is approximately 2.17 million square kilometers. The land-use and land-cover classes shown on the map represent conditions that existed around 2005.

6 Baseline and Projected Future Carbon Storage and Greenhouse-Gas Fluxes in the Great Plains Region
Land-Use and Land-Cover Changes in the Great Plains Region
As part of the methodology, spatial and temporal distri-butions of current and projected future LULC changes were designed to be a foundation for the assessment (Zhu and others 2010). The baseline LULC data were derived from a slightly modified version of the 1992 NLCD (Vogelmann and others, 2001). The thematic classification framework for LULC nests within the primary ecosystems (Zhu and others 2010) and provide enough within-ecosystem thematic details to better inform the accounting and analysis of carbon stocks and GHG fluxes using biogeochemical models. The LULC from 1992 to 2005 was modeled and calibrated using historical LULC data from the USGS Land Cover Trends project (Loveland and others, 2002) to produce annual maps of LULC change from 1992 to 2000. LULC data from the 2001 and 2006 NLCD (Homer and others, 2007) were used to map LULC change from 2001 to 2005. Mapping of LULC change between 1992 and 2005 also incorporated annual changes to forested areas due to forest harvesting; this information was derived from Landsat data and a vegetation change tracker, (a remote-sensing model) (Huang and others, 2010).
Scenario-based modeling of LULC change (between 2006 and 2050) is designed to provide an overall framework within which to assess projected carbon sequestration capacity and vulnerability, as well as uncertainty. Future scenarios of LULC change were developed through a hierarchical downscaling process using a spreadsheet accounting model (Zhu and others, 2010; Benjamin Sleeter, unpub. data, 2011). The development of future LULC-change scenarios at both the national and regional scales began with (1) scenarios A1B, A2, B1, and B2, which are defined in the Intergovernmental Panel on Climate Change (IPCC) Special Report on Emission Scenarios (SRES) (IPCC-SRES; Nakicenovic and others, 2000) and (2) model simulation results from the Integrated Model to Assess the Global Environment (IMAGE) 2.2 (Strengers and others, 2004). The IMAGE model produced projections of major land-use types, including agriculture and forest harvest. Future projections of developed lands (such as urban areas) and mining lands were estimated through the use of proxy data from IMAGE (population and coal usage, respectively). Other LULC classes were evaluated based on land-use histories and expert judgment.
Because the IPCC-SRES scenarios span a wide range of socioeconomic conditions, the results of the downscaling process produced a wide range of future LULC and corre-sponding ecosystem conditions in the Great Plains region (fig. 2). For this assessment, three of the four available IPCC-SRES scenarios (A1B, A2, and B1) were used. The main assumptions that the IPCC used to develop these three scenarios (and the subsequent modeled results of future climate-change projections) are summarized in table 1.
The regional LULC scenarios, developed using the approach described above, were used to guide a spatially explicit “forecasting scenarios of land-cover change” (FORE-SCE) model to project future LULC distributions (Sohl and others, 2007; Sohl and Sayler, 2008). The FORE-SCE model used logistic regression to quantify empirical relationships between land cover and spatially explicit biophysical and socioeconomic variables. The results were probability surfaces that quantified the suitability for each land-cover type being modeled. A unique landscape-level patch-by-patch modeling procedure was then used to place patches of LULC change in suitable areas on the landscape; historical LULC-change data and other biophysical data were used to generate realistic patch sizes and configurations for each region. Other biophysical datasets included a recently developed potential wetland map (Kristin Byrd, USGS, unpub. data, 2011) using USDA soil survey databases (USDA Natural Resources Conservation Service, 2006, 2009). Each Level III ecoregion in figure 1 was individually parameterized and modeled with FORE-SCE for each of the three IPCC-SRES scenarios. The 1992 to 2005 period was used to present baseline conditions, using as much observed and actual LULC and remotely sensed data as possible, as described above. The 2006 to 2050 modeled LULC provided spatial representations of the IPCC-SRES scenarios. When combined, the baseline and modeled scenarios resulted in a continuous, consistent LULC map database from 1992 to 2050, which was then collapsed to form the primary ecosystems as outlined in Zhu and others (2010) (fig. 2).
The validation of the LULC modeling results for the Great Plains region focused on examining quantity agreement (how well the model represented observed data for baseline and scenario-based prescriptions for future changes), and location agreement (how well the model placed LULC change). Quantity agreement was excellent, with FORE-SCE almost exactly matching the recent 1992 to 2005 LULC proportions as well as the projected scenario LULC proportions through 2050. Quantitatively assessing the location agreement using the recent data from 1992 to 2005 was complicated by thematic resolution differences, the very small amount of LULC change from 1992 to 2005, and the attempt to compare a sampled LULC dataset (USGS Land Cover Trends; Loveland and others, 2000) to a wall-to-wall modeled product. LULC processes are not stationary, which makes the assessment of model performance questionable for LULC projections (Pontius and Neeti, 2010). In lieu of a quantitative assessment, qualitative assessments of model performance were conducted using panel reviews by regional LULC experts. The experts reviewed both the model parameters and the model output for consistency with the scenario-based storylines, after which models were adjusted and iterative model runs were conducted until the model output was judged to adequately reflect the scenario-based storylines.

4.6
4.8
5.0
5.2
5.4
5.6
Perc
enta
ge o
f are
a of
Gre
at P
lain
s re
gion
36
38
40
42
44
46
48
50A. Forests B. Grasslands/shrublands C. Agricultural lands
E. Developed landsD. Wetlands
40
42
44
46
48
50
52
2000
2005
2010
2015
2020
2025
2030
2035
2040
2045
2050
2000
2005
2010
2015
2020
2025
2030
2035
2040
2045
2050
1.2
1.4
1.6
1.8
2.0
2.2
2.4
2000
2005
2010
2015
2020
2025
2030
2035
2040
2045
2050
Year Year
Year
IPCC-SRES scenario
EXPLANATION
Figure 2.
A1B
A2
B11.2
1.4
1.6
1.8
Land-Use and Land-Cover Changes in the Great Plains Region 7
Figure 2. Graphs showing the distributions of the four primary terrestrial ecosystems and developed lands of the Great Plains region projected over time for each of the IPCC-SRES scenarios—A1B, A2, and B1 (from the Intergovernmental Panel on Climate Change’s Special Report on Emission Scenarios (IPCC-SRES); Nakicenovic and others, 2000). A, Forests; B, Grasslands/shrublands. C, Agricultural lands. D, Wetlands. E, Developed lands. The Great Plains region (total area approximately 2.17 million square kilometers) is dominated by the natural land covers of grass and shrubs and the agricultural covers of cultivated crops, hay, and pasture. Agricultural lands are projected to expand significantly under both the A1B and A2 scenarios because of projected increased
Table 1. Assumptions about primary driving forces affecting land-use and land-cover change. These assumptions were used to downscale the A1B, A2, and B1 scenarios of the Intergovernmental Panel for Climate Change’s Special Report on Emission Scenarios (Nakicenovic and others, 2000).
Driving forces A1B A2 B1
Population growth (global and United States)
Medium; 8.7 billion by 2050, then declining; in the United States, 385 million by 2050
High; 15.1 billion by 2100; in the United States, 417 million by 2050
Medium; 8.7 billion by 2050, then declining; in the United States, 385 million by 2050.
Economic growth Very high; U.S. gross domestic product $72,531 by 2050
Medium; U.S. gross domestic product $47,766 by 2050
High; U.S. gross domestic product $59,880 by 2050.
Regional or global orientation Global Regional Global.Technical innovation Rapid Slow Rapid.Energy sector Balanced use Adaptation to local resources Smooth transition to renewable.Environmental protection Active management Local and regional focus Protection of biodiversity.
crop demands (A1B and A2) and hay and pasture demand for cellulosic biofuel (A1B). These expansions are in contrast to the projected declines in the amount of area covered by grasslands/shrublands or forests under the A1B and A2 scenarios. Under the B1 scenario, the amount of area covered by agricultural lands is projected to decrease for the first half of the timeline (baseline years through 2030) and then to increase in the latter half (2030–2050); additionally, (1) the amount of area covered by wetlands is projected to increase, and (2) compared to other scenarios, the amount of area covered by forests and grasslands/shrublands is projected to remain steady throughout the middle of the timeline and decrease toward 2050. Note that the scale of the y-axis is different for each graph.

8 Baseline and Projected Future Carbon Storage and Greenhouse-Gas Fluxes in the Great Plains Region
Projected Climate Change in the Great Plains Region
The projected long-term future climate change in the Great Plains is highly variable but includes the likelihood of higher temperatures, higher precipitation in the north, lower precipitation in the south, and increases in extreme events such as flooding, drought, and heat waves (Karl and others, 2009). Five global circulation models (GCMs) were used in the fire disturbance modeling: (1) Australia’s Commonwealth Scientific and Industrial Research Organization Mark 3.0 (CSIRO-Mk3.0), (2) the Canadian Centre for Climate Model-ling and Analysis’s Coupled Global Climate Model version 3.1 (CCCma CGCM3.1), (3) the (Japanese) National Institute for Environmental Studies’ medium-resolution version of their Model for Interdisciplinary Research on Climate, version 3.2 (MIROC 3.2-medres), (4) the National Center for Atmospheric Research’s Community Climate System Model version 3.0 (NCAR CCSM 3.0), and (5) the United Kingdom’s Hadley Centre Coupled Model version 3 (HadCM3) (Wood and others, 2002, 2004; Maurer, 2007). The MIROC 3.2-medres GCM was used in the biogeochemical modeling of the region. The MIROC 3.2-medres GCM is representative of the above-noted trends for temperature and precipitation changes that are derived by comparing average annual temperatures from 1970 to 2010 and from 2010 to 2050, although the changes are variable across the scenarios. In particular, the MIROC 3.2-medres GCM projects annual average temperature increases of up to 2.4 degrees Celsius (°C) in the central part of the Great Plains region under the B1 scenario. Although there is less change in the annual average precipitation throughout the region under the B1 scenario, the climate under the A2 scenario is projected to be drier throughout the Great Plains region. For each of the three IPCC-SRES scenarios, the MIROC 3.2-medres GCM projects greater reductions in annual precipitation in the southeastern part of the Great Plains region.
Wildland Fire and Emissions in the Great Plains Region
Historically, fire has played a large role in shaping the composition, structure, and function of ecosystems in the Great Plains region (Collins and Wallace, 1990). Fire occurrences have been highly variable through time and are dependent on climate, land-use and land-cover changes, and human activity (Clark, 1990; Umbanhowar, 1996). Before European settlement, fires often were intentionally set by Native Americans, in addition to natural fires caused by lightning. In modern times, wildfires are infrequent, but still occur. Fires that are prescribed as part of land-management activities in both grasslands/shrublands and
agricultural lands are common (McCarty and others, 2009; Tulbure and others, 2011), but data that would accurately characterize prescribed fires are not available; therefore, only wildland fires were analyzed for this assessment.
The baseline (observed) data for the amount of area burned and for emissions by wildfires were derived from the Monitoring Trends in Burn Severity database (MTBS; Eidenshink and others, 2007), which only mapped large fires (202 ha or larger east of the Mississippi River, 405 ha or larger in the western United States and Alaska) derived from Landsat imagery. The MTBS data were selected because of the high degree of confidence in the data: each fire is individually examined. Various versions of Federal fire databases are available but were not used because of the spatial inaccuracies and duplicate records that would have introduced uncertainties into results (Brown and others, 2002). Data on active fires (Giglio and others, 2003) and burned areas (Roy and others, 2008), which were detected by the Moderate Resolution Imaging Spectroradiometer (MODIS) satellite, were consid-ered but were not used because they contained no information about the causes of the fires and they had a coarse spatial resolution that complicated the modeling of future trends.
Fire emissions were calculated for each MTBS fire using the First Order Fire Effects Model (FOFEM; Reinhardt and others, 1997) for each major fire-relevant GHG: CO2, CO, and CH4. FOFEM requires data on weather conditions, fuel-moisture contents, and fuel loads. The fuel moisture content was estimated by using the National Fire Danger Rating System (NFDRS; Bradshaw and others, 1983), which is based on a 12-kilometer (km)-resolution, gridded daily weather dataset that spans the conterminous United States from 1980 to 2000 (Maurer and others, 2002). The fuel-load data were derived from the Landscape Fire and Resource Management Planning Tool Project’s (LANDFIRE’s) Fuel Loading Models layer (FLM; Lutes and others, 2009). Because the LANDFIRE fuels data derived from Landsat imagery reflected conditions around 2001 and after, and the MTBS data cover years between 1985 and 2008, fires occurring between 2001 and 2008 were included as the baseline for fire estimates.
Simulations of the amount of area burned by fire and the corresponding emissions were run for 2001 to 2050 under each of the IPCC-SRES scenarios (A1B, A2, and B1; Nakicenovic and others, 2000). The simulation results for 2001 to 2008 were used for validation or for comparison with baseline information, whereas the results from 2011 to 2050 were used to analyze the projected changes in burned area and emissions under each scenario over time. First, for the simulations, a probability of fire occurrence was calculated using logistic regression as well as the baseline data on daily weather conditions, fuel-moisture content, vegetation types, and fuel types. Next, future daily weather sequences were generated by temporally disaggregating monthly bias-corrected and spatially downscaled climate-change projections from the five GCMs (CSIRO-Mk3.0, CCCma CGCM3.1, MIROC 3.2-medres, NCAR CCSM 3.0,

Wildland Fire and Emissions in the Great Plains Region 9
Figure 3. Graphs showing the trends of baseline and simulated projected future burned area due to wildland fires and their emissions for each of the three IPCC-SRES scenarios (Nakicenovic and others, 2000), by year, in the Great Plains region. A, Area burned under the A1B scenario. B, Area burned under the A2 scenario. C, Area burned under the B1 scenario. D, Emissions from fire under the A1B scenario. E, Emissions from fire under the A2 scenario. F, Emissions from fire under the B1 scenario. The baseline values from Monitoring Trends in Burn Severity (MTBS) data are shown as dashed black lines. Each gray line represents a range of projected future estimates for 25 simulations (5 global change models × 5 replicates). The mean values of the simulated projected future estimates are shown as solid black lines.
and HadCM3) (Wood and others, 2002, 2004; Maurer, 2007) with the historical daily weather data (1980–2000) used for the baseline assessment. The daily weather sequences were processed using the NFDRS algorithms to produce daily fuel moisture contents for each GCM and IPCC-SRES scenario combination. These data were used with the logistic regression to project future patterns of fire ignition. To quantify the future potential burned area, each fire’s spread was simulated using the minimum travel time algorithm (Finney, 2002) with the projected ignition locations, daily weather, and LANDFIRE fuel, and topography layers (Rollins, 2009). In the models, fires were allowed to spread between 1 and 14 days, depending on recent burn durations for each ecoregion. A containment algorithm was also applied to each fire to limit the total fire size (Finney and others, 2009). After the burned area of each fire was established, the emissions were calculated using FOFEM. To quantify uncertainty in the future projected burned area and emissions, five replicate simulations were
run for each IPCC-SRES scenario and GCM combination for a total of 75 simulations (fig. 3, table 2).
Comparisons of the simulated scenario data with the observed data in MTBS on the amount of area burned and resulting fire emissions indicate that the simulated annual burned areas and emissions from 2001 to 2010 were generally lower than the observed annual burned area and emissions from 2001 to 2008. The maximum simulated area burned from 2001 to 2010 was 4,414 square kilometers (km2 ) under the B1 scenario, which was nearly half of the observed maximum of 8,159 km2 (table 2). These differences were primarily because the simulations did not generate burned areas as extreme as that which was observed in 2006, which indicates that the model may underestimate the potential influence of extreme fire years; however, the differences in mean area burned between the observed and simulated values were not substantial based on 2-sided t-tests, with p-values of 0.33, 0.34, and 0.37, for scenarios A1B, A2, and B1, respectively.
Year
8,000
6,000
4,000
2,000
0
20
10
0
Area
bur
ned,
in s
quar
e ki
lom
eter
sEm
issi
ons,
in te
ragr
ams
ofca
rbon
dio
xide
equ
ival
ent
A. A1B B. A2 C. B1
D. A1B E. A2 F. B1
Figure 3.
2000
2005
2010
2015
2020
2025
2030
2035
2040
2045
2050
2000
2005
2010
2015
2020
2025
2030
2035
2040
2045
2050
2000
2005
2010
2015
2020
2025
2030
2035
2040
2045
2050

10 Baseline and Projected Future Carbon Storage and Greenhouse-Gas Fluxes in the Great Plains Region
Land Management in the Great Plains Region
An objective of this assessment is to analyze the effects of land-management activities on carbon storage and GHG fluxes. Land-management activities are defined as those actions that change the way land is used; for instance, land-management activities may help farmers make land more productive, or help ranchers conserve their water resources. For this assessment, land-management activities were aligned with the LULC classes that make up the four terrestrial ecosystems, such as tillage practices for agricultural lands. For the Great Plains regional assessment, land-management variables from agricultural census data and other data sources were downscaled and mapped to pixel scale using a Monte Carlo statistical procedure (G.S. Schmidt, USGS, unpub. data, 2011), as follows:
• Crop production was modeled by each IPCC-SRES scenario (Nakicenovic and others, 2000) using (1) the LULC maps described previously, (2) the Netherlands Environmental Assessment Agency’s Integrated Model to Assess the Global Environment version 2.2 (IMAGE 2.2) (Strengers and others, 2004), and (3) USDA crop data (Padgitt and others, 2000;
Table 2. Ranges of annual baseline (observed) values and projected future estimates for the amount of area burned by wildland fires and their emissions, by IPCC-SRES scenario and assessment year, for the Great Plains region.
[Baseline data is from the Monitoring Trends in Burn Severity (MTBS) database. Projected future estimates were derived from the simu-lation modeling process described above. Carbon-dioxide equivalents include the three major fire-relevant greenhouse gases: CO, CO2, and CH4. IPCC-SRES, Intergovernmental Panel on Climate Change’s Special Report on Emissions Scenarios (Nakicenovic and others, 2000); km2/yr, square kilometers per year; TgCO2-eq /yr, teragrams of carbon-dioxide equivalent per year]
Scenarios YearsArea burned
(minimum to maximum, in km2/yr)
Emissions(minimum to maximum,
in TgCO2-eq /yr)
Baseline (observed) 2001–2008 543–8,159 0.18–24.72
A1B 2001–2010 187–2,614 0.42–10.822011–2020 146–3,041 0.47–16.922021–2030 176–2,474 0.54–10.592031–2040 202–2,493 0.36–9.882041–2050 242–2,373 0.60–11.92
A2 2001–2010 170–2,746 0.33–9.522011–2020 270–2,272 0.62–10.012021–2030 132–3,882 0.27–14.542031–2040 219–3,264 0.45–9.112041–2050 245–2,826 0.59–11.70
B1 2001–2010 264–3,150 0.41–10.632011–2020 197–4,414 0.39–12.932021–2030 195–3,167 0.45–10.892031–2040 169–3,165 0.45–13.412041–2050 211–4,332 0.41–10.40
USDA National Agricultural Statistics Service, 2011). Crop types and rotation probability were derived from the same USDA data and used to downscale the general class of “cropland” from LULC (as part of the agricultural lands ecosystem) to various crops.
• Tillage practices (no tillage, conventional tillage, reduced tillage) were downscaled from the tillage information provided by the USDA’s Agricultural Research Management Survey (ARMS) database (USDA Economic Research Service, 2011b), by crop type. Because of the lack of data on future projections, the projected tillage practice data were assumed to remain the same as the baseline data.
• An irrigation map was derived from MODIS imagery (USGS, 2002). The projected irrigation data were assumed to remain the same as the baseline data.
• Data on fertilizer use were derived from a USDA database (USDA Economic Research Service, 2011a). Fertilization was assumed to be optimal, thus satisfying the requirement for future plant growth. This assump-tion was based on the observation that the current levels of fertilization in the United States can largely satisfy the nutrient needs for crop growth.

Carbon Storage and Greenhouse-Gas Fluxes of Terrestrial Ecosystems in the Great Plains Region 11
• Data on the addition of manure to crops, which directly adds carbon into ecosystems in addition to providing nutrients, were derived from USDA’s ARMS database (USDA Economic Research Service, 2011b) for all crop types.
• There are no national data on rangeland grazing, which would help determine the grazing intensity on grasslands/shrublands. In this assessment, it was assumed that all grasslands/shrublands in the region would be grazed during the summer. An average grazing intensity was calculated based on data from Holland and others (1992) to produce a mean value ranging from 0.2 to 1.4 Animal Unit Month/ha. This range of mean values was comparable with other reported grazing intensity measurements in the literature (Biondini and others, 1998; Schuman and others, 1999; Derner and others, 2006). The total carbon removal by livestock grazing in the region was calculated using a USDA livestock inventory and empirical factors in rangeland management, with the assumption that the carbon removal values would meet about 70 percent of the total carbon consump-tion needs by livestock (Holechek and others, 2000; USDA National Agricultural Statistics Service, 2011).
• Estimates of fire extent and severity, produced as part of the assessment as described previously, were used to assess the effects of fire on carbon sequestration. The effects of fire on carbon sequestration were simulated at annual increments with three burn-severity classes: high, moderate, or low.
• There were no national data available about crop-residue management. Assumptions were made for the amount of aboveground biomass that was removed, by crop type. For example, it was assumed that the crop type “corn for silage” would have 80 to 90 percent of its aboveground biomass (corn plus residue) removed, whereas “corn for grain” would only have the corn removed and all the residue left in the field.
• Information about the age of forests in the region was derived from the U.S. Forest Service’s Forest Inven-tory and Analysis Program (FIA) database (USDA Forest Service, 2011). The data was modeled on an annual basis together with LULC classes that identified both forest types and mechanically disturbed forested land (resulting from forest cutting). Forest thinning was not considered for the region.
Carbon Storage and Greenhouse-Gas Fluxes of Terrestrial Ecosystems in the Great Plains Region
Climate change, LULC change, land management, and ecosystem disturbances are the primary drivers of the changes in carbon storage and GHG fluxes. Classes of annual LULC maps of the three IPCC-SRES scenarios were merged to form four primary terrestrial ecosystems for the assessment, according to the definitions outlined in Zhu and others (2010). In addition to the LULC data, other key data are needed to model baseline and future projected carbon storage and GHG fluxes, including (1) soil data (for example, texture, bulk density, erodibility, and drainage class by soil layers) from the USDA soil survey databases (USDA Natural Resources Conservation Service, 2006, 2009) processed and mapped for soil organic carbon (SOC) content (Bliss and others, 2009; Sundquist and others, 2009; Waltman and others, 2010), (2) historical climate data from Oregon State University’s “parameter-elevation regressions on independent slopes model” (PRISM), and (3) future climate projections from MIROC 3.2-medres. Because of the constraints of the model structure, only the top 20 centimeters (cm) of the soil layer was considered for soil organic carbon data.
The growth curves of coniferous, broadleaf, and mixed forests; forest age; and other forest data (all derived from the USDA’s FIA database; Heath and others, 2009; Miles and Smith, 2009; Woudenberg and others, 2010; USDA Forest Service, 2011) were used to initialize the forested land component of the models. The growth curves also were used to calibrate the biomass accumulation rates simulated by the process-based models. The temporal change of forest growth caused by CO2 fertilization, nutrient availability, and climate change was simulated using the input data described above; however, the temporal change of forest growth due to enhance-ment from genetics and cultivation was not simulated because of insufficient data. Grain yields from the USDA census data for all major crops (USDA Economic Research Service, 2011b) were used to calibrate the production routines of the process-based models. Temporal (historical and future projected) changes in grain yields for all crops were grouped into six distinct Michaelis-Menten growth curves using USDA historical census data and grain-yield projections from IMAGE 2.2 (Strengers and others, 2004). The lateral movements of soil, carbon, and nutrients; their impacts on the regional carbon balance and GHG fluxes; and their linkage to aquatic eco systems were not directly addressed in this assessment.

12 Baseline and Projected Future Carbon Storage and Greenhouse-Gas Fluxes in the Great Plains Region
Carbon dynamics and GHG fluxes between the land and the atmosphere under the LULC, climate change, and land management scenarios (described previously) were simulated using three ecosystem models in the General Ensemble Biogeochemical Modeling System (GEMS) (Liu and others, 2004, in press; Liu, 2009; Zhu and others, 2010). The three models are the Erosion-Deposition-Carbon Model (EDCM) (Liu and others, 2003), the CENTURY model (Parton and others, 1987), and a spreadsheet model described in the methodology document (Zhu and others, 2010). The process-based models EDCM and CENTURY have been tested widely in various ecosystems worldwide (for example, Parton and others, 1993; Tan and others, 2006, 2007; Liu and others, 2003). The use of the three models helps account for inherent uncertainties related to model structure and param-eterizations. Using the above-described datasets for LULC, areas burned by wildland fires, land management, climate, and other biophysical data, the three GEMS-based models were run for the each of three IPCC-SRES scenarios (A1B, A2, and B1; Nakicenovic and others, 2000) and for one GCM
(MIROC 3.2-medres) for a total of nine model runs for each ecosystem. The results for the Great Plains region are shown in figures 4 and 5 and in table 3 below.
The emissions of N2O and CH4 from the region were estimated using the spreadsheet model. Spatial and temporal changes in CH4 and N2O were estimated using the spreadsheet model with data about LULC, fire, and emission factors derived from the literature (Robertson and others, 2000; Gleason and others, 2009; EPA, 2011a). Baseline emissions (expressed as “CO2 equivalent,” or CO2-eq ) were 82 TgCO2-eq for CH4 and 158 TgCO2-eq for N2O. By 2050, emissions were estimated to range from 81 to 94 TgCO2-eq and from 169 to 186 TgCO2-eq, respectively, for CH4 and N2O, depending on projection scenario. Changes in carbon stocks in ecosystems were simulated by the EDCM and CENTURY models because they were capable of simulating the impacts of various natural processes and disturbances on the carbon cycle. Maps showing the spatial distribution of the total GHG emissions in 2010 in the Great Plains region and graphs showing projected future emissions are presented in figure 6.
Table 3. Baseline land area and carbon stock and projected 2050 land area, carbon stock, and annual net flux density, under each of the three IPCC-SRES scenarios for terrestrial ecosystems in the Great Plains region. Mean annual net flux density and total carbon sequestration projections (changes in carbon stocks from mean baseline to 2050) are also given.
[The area of water bodies is given, but carbon-flux analysis was conducted separately (see discussion in section entitled, “Carbon Fluxes of Aquatic Ecosystems in the Great Plains”). For annual net flux density estimates, negative values indicate sequestration and positive values indicate emission. Figures may not sum to totals because of independent rounding. IPCC-SRES, Intergovernmental Panel on Climate Change’s Special Report on Emissions Scenarios (Nakicenovic and others, 2000); km2, square kilometers; TgC, teragrams of carbon; gC/m2/yr, grams of carbon per square meter per year; —, not applicable]
Variables by timeline ForestsGrasslands/shrublands
Agricultural lands
Wetlands WaterOther lands
Total
Baseline Area (×1,000 km2) 116 1,041 920 30 25 38 2,170Stock (TgC) 1,162 2,614 3,438 216 — 70 7,500
A1B 2050 area (×1,000 km2) 106 840 1,117 28 25 55 2,1702050 stock (TgC) 1,968 2,369 4,990 262 — 78 9,665Annual net flux density
(gC/m2/yr)–191.5 –6.9 –16.2 –51.9 — 10.0 –22.2
(mean)A2 2050 area (×1,000 km2) 106 944 1,011 29 25 55 2,170
2050 stock (TgC) 1,980 3,094 4,668 276 — 80 10,099Annual net flux density
(gC/m2/yr)–190.2 –17.0 –19.6 –55.4 — 8.9 –26.6
(mean)B1 2050 area (×1,000 km2) 115 994 948 37 28 47 2,170
Stock (TgC) 2,163 3,223 4,430 345 — 67 10,228Annual net flux density
(gC/m2/yr)–193.9 –16.2 –20.8 –48.9 — 9.9 –27.9
(mean)Mean annual net flux density
(gC/m2/yr)–192.5 –13.4 –18.8 –52.1 — 9.6 –25.6
(mean)Mean baseline to 2050 stock
change (TgC)875 281 1,258 78 — 5 2,497
Standard error (TgC) 85 197 182 19 — 13 145

2,400
2,200
2,000
1,800
1,600
1,400
1,200
1,000
5,500
5,000
4,500
4,000
3,500
3,000
10,500
10,000
9,500
9,000
8,500
8,000
7,500
7,000
400
350
300
250
200
3,600
3,200
2,800
2,400
2,000
Carb
on s
tock
s, in
tera
gram
s of
car
bon
2000 2010 2020 2030
Year
2040 2050
2000 2010 2020 2030
Year
2040 2050
A. Forests B. Grasslands/shrublands
C. Agricultural lands
E. All lands
D. Wetlands
IPCC-SRES scenario and process-based model
EXPLANATION
A1B-EDCM
A1B-Century
A2-EDCM
A2-Century
B1-EDCM
B1-Century
Figure 4.
Carbon Storage and Greenhouse-Gas Fluxes of Terrestrial Ecosystems in the Great Plains Region 13
Figure 4. Graphs showing the trends of terrestrial carbon stocks over time in the Great Plains region, for the four primary ecosystems and all lands under each of the three IPCC-SRES scenarios (A1B, A2, and B1; Nakicenovic and others, 2000), using two biogeochemical models. A, Forests. B, Grasslands/shrublands. C, Agricultural lands. D, Wetlands. E, All lands. Note that the scale of the y-axis is different for each graph. EDCM, Erosion-Deposition-Carbon Model; IPCC-SRES, Intergovernmental Panel on Climate Change’s Special Report on Emissions Scenarios.

A. Forests B. Grasslands/shrublands
C. Agricultural lands D. Wetlands
110° 100° 90°50°
45°
40°
35°
30°
25°
14 Baseline and Projected Future Carbon Storage and Greenhouse-Gas Fluxes in the Great Plains Region

Total carbon sequestration, in kilograms of carbon per square meter (A–E)
EXPLANATION
Figure 5.
Level II ecoregion boundary
<–5.0
–5.0 to –2.1
–2.0 to –0.6
–0.5 to 0.5
0.6 to 2.0
2.1 to 4.9
≥5.0
≤1.0
1.1 to 2
2.1 to 4.0
4.1 to 8.0
8.1 to 10
>10
Uncertainty of carbon sequestration, in kilograms of carbon per square meter (F)
E. All lands F. Uncertainty
Index map of Level II ecoregionsin Great Plains region
Area of enlarged map
TemperatePrairies
West-CentralSemi-Arid
Prairies
South-CentralSemi-Arid
Prairies
0 100 200 300 400 MILES
0 200 400 KILOMETERS
Base from 2001 National Land Cover Database(Homer and others, 2007)
Carbon Storage and Greenhouse-Gas Fluxes of Terrestrial Ecosystems in the Great Plains Region 15
Figure 5 (pages 14 and 15). Maps showing the spatial distribution and uncertainty of carbon sequestration (negative) and emission (positive) in the Great Plains region, by ecosystem between the baseline and 2050. A, Forests. B, Grasslands/shrublands. C, Agricultural lands. D, Wetlands. E, All lands. F, Uncertainty. The carbon sequestration value represented on the maps is the mean of a total of six simulations performed by the EDCM and CENTURY models under each of the three IPCC-SRES scenarios (A1B, A1, and B1; Nakicenovic and others 2000). Uncertainty is expressed as the standard error of these simulations. EDCM, Erosion-Deposition-Carbon Model; IPCC-SRES, Intergovernmental Panel on Climate Change’s Special Report on Emissions Scenarios; <, less than; ≤, less than or equal to; >, greater than; ≥, greater than or equal to.
–400
–300
–200
–100
0
100
200
Total
–100
0
100
200
300
400
500Methane (CH4 )
78
80
82
84
86
88
90
92
94
96
Nitrous oxide (NO2)
Year2000 2010 2020 2030 2040 2050
Year2000 2010 2020 2030 2040 2050
150
155
160
165
170
175
180
185
190Carbon dioxide (CO2)
Figure 6.
IPCC-SRES scenario(Graphs)
A1B
A2
B1
Mean
Emis
sion
s, in
tera
gram
s of
car
bon-
diox
ide
equi
vale
nt p
er s
quar
e m
eter
per
yea
r
Emissions in 2010, in grams of carbon-dioxide equivalent per square meter per year
(Maps)
EXPLANATION
Level II ecoregion boundary
≤ –250
–250 to –50
– 50 to 50
50 to 250
>250
16 Baseline and Projected Future Carbon Storage and Greenhouse-Gas Fluxes in the Great Plains Region
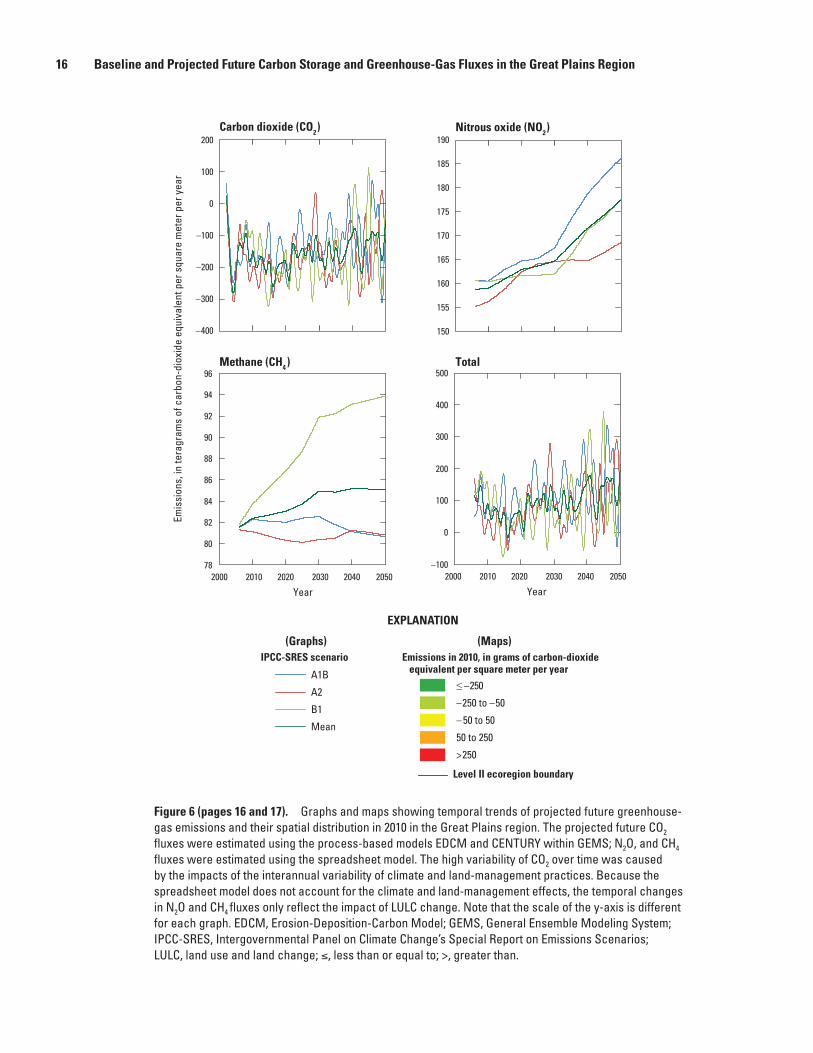
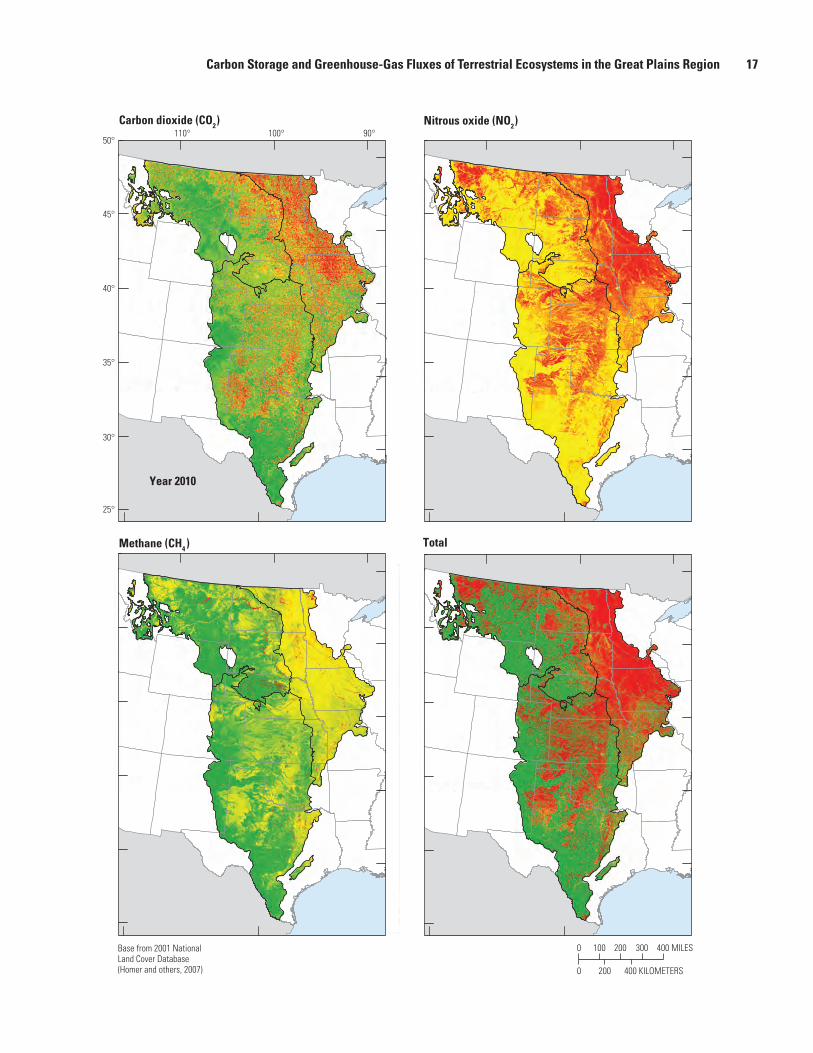
Figure 6 (pages 16 and 17). Graphs and maps showing temporal trends of projected future greenhouse-gas emissions and their spatial distribution in 2010 in the Great Plains region. The projected future CO2 fluxes were estimated using the process-based models EDCM and CENTURY within GEMS; N2O, and CH4
fluxes were estimated using the spreadsheet model. The high variability of CO2 over time was caused by the impacts of the interannual variability of climate and land-management practices. Because the spreadsheet model does not account for the climate and land-management effects, the temporal changes in N2O and CH4 fluxes only reflect the impact of LULC change. Note that the scale of the y-axis is different for each graph. EDCM, Erosion-Deposition-Carbon Model; GEMS, General Ensemble Modeling System; IPCC-SRES, Intergovernmental Panel on Climate Change’s Special Report on Emissions Scenarios; LULC, land use and land change; ≤, less than or equal to; >, greater than.
Methane (CH4 ) Total
Nitrous oxide (NO2) Carbon dioxide (CO2)110° 100° 90°
50°
45°
40°
35°
30°
25°
Year 2010
Base from 2001 National Land Cover Database(Homer and others, 2007)
0 100 200 300 400 MILES
0 200 400 KILOMETERS
Carbon Storage and Greenhouse-Gas Fluxes of Terrestrial Ecosystems in the Great Plains Region 17

18 Baseline and Projected Future Carbon Storage and Greenhouse-Gas Fluxes in the Great Plains Region
Carbon Fluxes in the Aquatic Ecosystems of the Great Plains Region
Aquatic ecosystems in this regional assessment include streams, rivers, perennial ponds, lakes, and impoundments. For this report, the term “riverine” refers to both rivers and streams and “lacustrine” refers to both lakes and impoundments. For aquatic ecosystems, the baseline estimates were calculated using input data that spanned the recent decades (varying between the 1970s and the present, depending on the type of data) and were produced for two major fluxes: lateral carbon flux in riverine systems and CO2 evasion (efflux) from both riverine and lacus-trine systems. Lateral flux describes the transfer of dissolved and particulate carbon by riverine systems from terrestrial landscapes to inland water bodies, major rivers, and coastal areas. Carbon-dioxide evasion occurs when surface water is supersaturated with CO2 relative to the atmosphere. Lateral fluxes can be estimated using concen tration and streamflow data available from the USGS. For this assessment, a multiple regression approach was used, which estimated daily flux as a function of streamflow, seasonality, and time, and where daily fluxes were totaled and expressed on an annual basis. More details on the methods used for calculation of carbon loads (TgC/yr) in lateral flux can be found in Zhu and others (2010).
In this regional assessment, 59 streamgages provided adequate recent water-quality and discharge data that were used to estimate total organic carbon (TOC) fluxes, and 149 streamgages had enough recent data to estimate dissolved inorganic carbon (DIC) flux. These data were collected on streamgages between 2000 and 2010. On average, rivers in the Great Plains region transferred 0.07 to 0.31 TgC/yr (mean = 0.19 TgC/yr) from upland terrestrial systems to inland waters and coastal areas. Annual DIC yield ranged between 1.9 and 2.2 gC/m2 (mean = 2.1 gC/m2) whereas the TOC ranged from 0.57 to 0.92 gC/m2 (mean = 0.73 gC/m2). These values were within the estimated carbon yields for the Missouri River made by Raymond and Oh (2007), who reported 1.5 to 3.5 gC/m2/yr as DIC and 0.2 to 2.0 gC/m2/yr as TOC. Inorganic carbon represented about 60 percent of the total lateral carbon flux. A recent study of carbon fluxes to coastal areas in the United States found that the export of inorganic carbon was three times greater than the export of TOC (Edward G. Stets, USGS, unpub. data, 2011). The processes that contribute to riverine inorganic carbon transport include the oxidation of organic matter, the dissolution of carbonate minerals, and the transfer of products from both terrestrial ecosystems and in-stream respiration.
Partial-pressure CO2 concentrations and CO2 flux were calculated by stream order within each ecoregion and were based on alkalinity, temperature, and pH measurements from 966 stations made between the 1970s and the present and archived in the USGS’s National Water Information System (NWIS) (Butman and Raymond, 2011). For lacustrine systems, the water-to-air CO2 efflux was calculated based on the concentration gradient between dissolved CO2
and overlying atmospheric concentrations. The regional distribution of dissolved CO2 was estimated from calculated values for lacustrine systems in the EPA National Lakes Assessment (EPA, 2011b) (n = 342). The gas transfer velocity (k) of CO2 was calculated for each ecoregion as a function of mean annual wind speed and water temperature. The lacustrine surface areas for each ecoregion were obtained from the USGS’s National Hydrography Dataset (NHD; U.S. Geological Survey, 2011), and ice cover was estimated based on mean monthly skin-surface temperature.
Using the above empirical data and modeling tech-niques, it was possible to scale up CO2 evasion estimates to give a total vertical CO2 flux for the Great Plains region from riverine and lacustrine systems. Although the percent of total surface area of the region that is covered by rivers and streams (0.32 percent) is less than lakes or impoundments (1.26 percent), the estimate of CO2 evasion from riverine systems was higher (37 to 73 TgCO2-eq /yr, mean = 55 TgCO2-eq /yr) than that from lacustrine systems (10 to 17 TgCO2-eq /yr, mean=13 TgCO2-eq /yr). The greater rate of CO2 evasion from riverine systems can be explained by higher transfer velocities and higher dissolved CO2 concen-trations in rivers and streams.
Integrated Analysis By integrating carbon estimates of the four major
terrestrial ecosystems, emissions of wildland fires, and aquatic fluxes, an overall regional baseline carbon budget was constructed, as shown in figure 7. This figure shows relations between carbon fluxes for all of the ecosystems in the region. The range values indicate minimum and maximum estimates of the baseline years for a given component of the assessment. For biomass and soil organic carbon boxes, the minimum and maximum values are from different years of the baseline. The total sequestration is estimated to range from 20 to 99 TgC/yr (mean = 65 TgC/yr). As shown in the figure, there is uncertainty concerning (1) overlaps between terrestrial ecosystems and aquatic ecosystems and (2) the effects of wildland fire on carbon stocks. For example, in the figure, the carbon evasion flux (12.8–24.6 TgC) is attributed to the flux from lacustrine and riverine ecosystems; however, some portion of this evasion may already be accounted for in the terrestrially derived heterotrophic respiration (HR) term. Additionally, not all carbon from the lateral flux process is exported from the region. Riverine or lacustrine systems within the region may store terrestrially derived carbon in sediments; carbon sequestration in sediments is unknown at this point as work is ongoing.
The Great Plains region features extensive grasslands/shrublands and agricultural lands. Both of these ecosystems have undergone intense land-use changes because of agricul-tural practices and urban expansion, which are the primary processes that influence carbon sequestration and GHG fluxes in the Great Plains. Such relations are demonstrated in the results of the assessment.

Integrated Analysis 19
Areas of the LULC classes (and hence ecosystem areas) exhibited modest changes between 1992 and 2005 (the baseline period for LULC analysis) highlighted by distinctive local increases in developed land (particularly in the southern Great Plains), declines in forest cover, and steady trends in overall agricultural lands and grasslands/shrublands. Socioeconomic factors, particularly the demand for agricultural lands, are the primary drivers of changes in LULC in the region, and this is reflected in both the mapped and projected future LULC that make up the ecosystems for this assessment. Under the A1B scenario, a very high demand for biofuels, including cellulosic biofuel, is projected to drive strong increases in both the cultivated crop (traditional biofuels) and hay/pasture (cellulosic biofuels) agricultural classes over time. Under the A2 scenario, the projected increases in cultivated crops are driven by strong population increases, but the overall projected increases in agricultural land are smaller than under scenario A1B. Under both the A1B and A2 scenarios, the projected increases in agricultural land, as well as significant increases in developed land, result in declines in “natural” land covers (grasslands/shrublands, forests, and wetlands) by 2050. Under the environ-mentally focused B1 scenario, the projected initial increases in natural land cover are reversed after 2030 as the population increases; there also is a move towards less intense, more environmentally friendly agricultural practices, which result in a projected need for an increase in agricultural land. Under the B1 scenario, the overall natural land cover is projected to decline only slightly between the baseline years and 2050.
Areas burned and resulting emissions in baseline years demonstrate the large interannual variability in fire activity in the region. Among the three Level II ecoregions included in the Great Plains region, annual burned areas and emis-sions were greatest in the South-Central Semi-Arid Prairies (averaging 1,675 km2 and 5.83 TgCO2-eq ) and lowest in the Temperate Prairies (averaging 63 km2 and 0.41 TgCO2-eq ). When the baseline results were analyzed for the entire Great Plains region, the observed amount of area that burned varied widely, from as much as 8,159 km2 in 2006 to as little as 453 km2 in 2004, which yielded a mean burn rate of 1,713 km2/yr. The vast majority of area burned was grasslands/shrublands. Greenhouse-gas emissions from the fires were strongly related to the area burned: the highest was in 2006 at 24.72 TgCO2-eq and lowest was in 2004 at 0.18 TgCO2-eq, with an average of 5.96 TgCO2-eq.
The simulated projected burned areas and emissions from 2011 to 2050 also have a large interannual variability (table 2, fig. 3), which is similar to the observed MTBS data. Under each of the three scenarios (Nakicenovic and others, 2000), there were projected increases in trends in the simulated burned area and emissions, but differences among them were small; however, the increasing trends in the amount of burned area were not significant based on the Mann-Kendall trend test (Mann, 1945) of area burned versus time (τ = 0.03, 0.03, and 0.00, and p-values = 0.15, 0.14, and 0.94, for scenarios A1B, A2, and B1, respectively, where τ ranges between –1.0 (decreasing trend) and 1.0 (increasing trend) and p-values
Figure 7. Chart showing the minimum through maximum ranges of net flux values (in teragrams of carbon per year, or TgC/yr) for all of the major components of estimated baseline (current) carbon budget for the Great Plains region. The arrows above the top row of boxes show the directions of the net fluxes in relation to the atmosphere. The bottom boxes show the net fluxes within the region. The negative values in the total biomass and soil organic carbon boxes indicate carbon uptake
Figure 7.
Net primaryproductivity
(NPP)601 to 881
Soil organiccarbon(SOC)
16 to –36
Fire0.05 to 6.74
Heterotrophicrespiration
(HR)565 to 727
Total biomass–37 to –83
Harvested woodproducts
(HWP)–0.3 to –0.96
Lateral fluxout of region
(not available)
Sediment burial(not available)
Lacustrineevasion
2.8 to 4.6
Lateral fluxwithin region0.07 to 0.31
Methane2.91 to 2.94
Riverineevasion
10.1 to 20.7
or sequestration; positive values indicate carbon emission. The dashed lines indicate uncertainty in delineating boundaries between related components, such as between terrestrial and aquatic fluxes, because the methods are not fully coupled. The heterotrophic respiration values account for both ecosystem respiration and consumption (both grain consumption and grazing by livestock). Both lacustrine and riverine evasion refers to CO2 evasion, with the value converted to carbon.

20 Baseline and Projected Future Carbon Storage and Greenhouse-Gas Fluxes in the Great Plains Region
indicate the degree to which τ is significantly different than 0, or no trend). The projected trends for emissions were slightly different. Under all three scenarios, emissions increased but only by slightly varying amounts when CO2-eq versus time was analyzed (τ = 0.04, 0.05, and 0.03 and p-values = 0.0226, 0.0039, and 0.0978, for scenarios A1B, A2, and B1, respec-tively). The slightly increasing trends in burned area and emissions are a conservative estimate of the potential change in the Great Plains as the simulations underestimated the influence of extreme fire years; extreme events are expected to increase in occurrence under a warming climate (IPCC, 2007). The effects of fire on carbon sequestration were modeled using both the EDCM and CENTURY process-based models. The findings were similar to those in the recent literature (Ansley and others, 2002); the effects of fire on carbon sequestration (reducing the amount of carbon stored in ecosystems in the region) were small, averaging 0.08, 0.11, 0.12 and 0.12 TgC/yr for the baseline assessment years (2001–2005) and under the A1B, A2, and B1 scenarios (2006–2050), respectively.
A unique feature of this assessment was the examination of the movement of carbon through aquatic systems. The results for the baseline period showed that, although the total area covered by aquatic ecosystems in the region is small (less than 2 percent of the total land surface), aquatic systems are active sites of carbon transfer and cycling. In addition, these results demonstrate that riverine systems are not closed “pipe-lines” that transfer carbon from upland ecosystems to coastal areas (Cole and others, 2007). Instead, there is considerable loss of carbon as water and sediments move laterally through the system. Climate conditions are projected to be wetter in the north and drier in the south (Karl and others, 2009), and these projected increases in temperature, evaporation, and drought will have impacts on water resources. Given the strong link between water flow and lateral carbon fluxes (Schlesinger and Melack, 1981; Schindler, 1997; Runkel and others, 2004), in areas where lower precipitation and higher evaporation are projected, lower carbon fluxes may be possible.
Work to develop a region-specific estimate of carbon sequestration in sediments is ongoing; however, the dominance of small, artificial impoundments combined with the high prevalence of agricultural lands in the Great Plains suggests that sediment burial of organic carbon represents a significant carbon sink in this region. Downing and others (2008) measured organic carbon burial rates of between 148 and 17,000 gC/m2/yr in agriculturally eutrophic impoundments in Iowa. If burial rates are similarly high throughout the Great Plains region, sediments could be sequestering at least as much carbon as is lost by means of CO2 efflux from aquatic ecosystems.
Estimates of CH4 and N2O emissions were calculated by using the spreadsheet model, which relied on LULC change as the primary data without considering other land-management activities. Emissions of CH4 were estimated at an average rate of 82 TgCO2-eq /yr from 2005 to 2010 and increase in future years (81 to 94 TgCO2-eq /yr by 2050, or a –1.62 to 16 percent change) (fig. 6). The CH4 emission rate
estimated by this study is higher than the EPA estimates for the entire Nation, which vary from 15 to 27 TgCO2-eq /yr (EPA, 2011a) and for which EPA only considered CH4 emissions from forests and rice cultivation but not from other major emitters such as wetlands. Under the B1 scenario, wetland areas in the region are projected to increase and decrease under the A1B and A2 scenarios (fig. 2). The projected trends in CH4 emissions reflect those changes in wetland areas (fig. 6); however, it should be noted that the CH4 uptake by grasslands/shrublands and agricultural lands was not considered in the assessment. For N2O, a mean annual emission of approximately 158 TgCO2-eq from 2005 to 2010 was estimated. This estimate is comparable to the EPA estimates (EPA, 2011a), which reported that the national N2O emissions from agricultural soils and forests varied from 210 to 226 TgCO2-eq /yr. Future N2O emissions are projected to increase (169 to 186 TgCO2-eq /yr by 2050 or a 6.7 to 11 percent increase) as a function of the increase in agricultural land areas. About 85 percent of the total global warming potential (GWP) of CH4 and N2O may be offset by carbon sequestration in the Great Plains region. Nevertheless, the net GWP would still emit about 100 TgCO2-eq /yr in the region (fig. 6). Greenhouse-gas emissions and their uncertainty (indicated by a wider spread among scenarios) are projected to increase under all three of the IPCC-SRES scenarios. These increases only reflect the changes in LULC (especially wetlands) because CH4 and N2O emissions were estimated by considering only LULC change using the spreadsheet model.
Between 2001 and 2005 (baseline years for the carbon sequestration and GHG flux assessment), grasslands/shrublands covered 48 percent of the Great Plains region but stored 35 percent of the total carbon (table 3). Agricultural lands covered 42 percent of the land area and stored 46 percent of the region’s carbon because of their extensive land area and the relatively high carbon density (3.74 kgC/m2). Forests, wetlands, and other lands cover 5.35, 1.4, and 1.73 percent of the region’s land areas and stored 15.5, 2.9, and 0.93 percent of the total carbon, respectively. Between the carbon uptake by biomass and by soil, the region featured a total sequestration rate that ranged between 20 and 99 TgC/yr, which is approximately 3 to 13 percent of the region’s net primary productivity (NPP). The net ecosystem carbon production rate, when evaluated as CO2 equivalents, is approximately 1.16 to 6.58 percent of total GHG emissions of the United States in 2009 (EPA, 2011a). In addition to carbon sequestration, other key processes in the region included heterotrophic respiration (82 to 94 percent of NPP) and aquatic lateral and vertical fluxes (approximately 13 to 26 TgC/yr). Following recommendations from Lovett and others (2006) and Chapin and others (2006), the baseline estimate of carbon loss resulting from the effects of grazing was included in the total heterotrophic respiration estimate. The loss of soil organic carbon (SOC) (16 TgC) is the result of the severe drought in the region between 2002 and 2003. By comparison, carbon loss resulting from fire emissions was a relatively small portion of the overall carbon budget in the region (fig. 7).

Integrated Analysis 21
Overall, the assessment projects that the Great Plains region will remain an overall carbon sink, with projected sequestered carbon ranging from 2,165 to 2,728 TgC (mean 2,497 TgC) between the baseline years and 2050, depending on the scenarios (table 3). These projections translate into an annual carbon sequestration of 48.12 to 60.62 TgC (176.5 to 222.3 TgCO2-eq ), which is about 2.66 to 3.35 percent of total GHG emissions of the U.S. in 2009 (EPA, 2011a); however, the overall strength of sequestration by all major ecosystems is expected to decrease over time (see carbon-dioxide graph in figure 6). Agricultural lands would increase in area but maintain carbon stocks, grasslands/shrublands would lose land area and carbon stocks, and forests would lose land area but gain carbon stocks. On an annual averaged basis, all of the major ecosystems in the region are projected to be carbon sinks, with forests possessing the highest averaged per-area carbon sequestration (192.5 gC/m2/yr), followed by wetlands, agricultural lands, and grasslands/shrublands (52.1, 18.8, and 13.4 gC/m2/yr, respectively). Over the 50 years between 2001 and 2050, forests would sequester the most carbon per unit of land, followed by wetlands, agricultural land, and grasslands/shrublands.
In the Great Plains region, grasslands/shrublands are projected to lose 246 TgC under the A1B scenario or projected to gain 480 and 609 TgC under the A2 and B1 scenarios, respectively, depending on the projected changes in land areas (fig. 2). These projections translate into an annual net flux density ranging from –6.9 to –17 gC/m2 from 2001 to 2050. The grasslands/shrublands estimates are lower than an estimate by Zhang and others (2011) but higher than the EPA estimate (EPA, 2011a). For the effect of grazing on carbon flux, model runs were initialized based on limited data and assumptions, as described previously. The results show that the effects of grazing on carbon flux in grasslands/shrublands could be considerable. The mean annual carbon removal estimates from grasslands/shrublands (assuming moderate grazing) are approximately 107, 99, 104, and 107 TgC, for the baseline (2001–2005) assessment and under the A1B, A2, and B1 scenarios (2006–2050), respectively. These carbon flux results are lower than the 150 TgC/yr reported by Holechek and others (2000), which was based on USDA livestock inventory data (USDA National Agricultural Statistics Service, 2011).
Using the USDA inventory data, West and others (2010) estimated that the total net ecosystem carbon balance on all agricultural lands in the United States was 7 TgC in 2004. The EPA (2011a) estimated that croplands in the United States acted as a carbon sink, with a storage rate of between 4.75 and 5.37 TgC/yr from 2005 to 2009. Biogeochemical models, however, showed higher estimates than the inventory approach. Using the CENTURY model, Ogle and others (2010) found that croplands in the United States sequestered soil carbon at a rate of 14.6 TgC/yr from 1990 to 1995 and a rate of 17.5 TgC/yr from 1995 to 2000. Nevertheless, this assessment projects an increase in the density of carbon stocks in agricultural lands (from 3.74 kgC/m2 for the baseline estimate to 4.47 to 4.67 kgC/m2 by 2050) and an estimated overall mean annual sequestration of 27.95 TgC.
For the baseline years, the carbon storage in forest ecosys-tems of the Great Plains region was estimated to be 1,162 Tg for a total forested area of 116,196 km2, or a carbon stock density of 10.0 kgC/m2 (table 3). This estimate for total carbon storage is lower than a 2010 USDA Forest Service forest inventory estimate of 2,096 TgC for a forested area of 234,162 km2, with a carbon density value of 8.95 kgC/m2 (Brad Smith, USDA Forest Service, unpub. data, 2010). The difference in total carbon storage was likely caused by the difference between the definitions of forested land used in this assessment and the definition used by the USDA Forest Service; a proportion of land that the Forest Service defined as forested lands was identified as grasslands/shrublands in the NLCD dataset, which was used as the basis for forested lands in this assessment. The comparable carbon density estimates (slightly higher in this assessment compared to the Forest Service estimate) provide further evidence of this analysis. When projected to 2050, the assessment results suggest that forest ecosystems will remain a strong carbon sink, despite the projected loss of forested lands over time, and that the carbon stock density in forested lands increases from an average of 10 kgC/m2 during the baseline years (2001–2005) to between 18.62 and 18.76 kgC/m2 by 2050.
Spatially, most carbon sequestration opportunities are projected to occur in the southern and eastern parts of the Great Plains region, where productive soil and favorable climate conditions are found (fig. 5). The assessment also projects the potential for wetland restoration in the Prairie Pothole region of the study area. On the other hand, a projected loss of carbon storage is possible in agricultural lands of the northern prairies as the result of reduced agricultural productivity and increased soil drying. For the entire Great Plains region, all of the major ecosystems except for grasslands/shrublands are projected to increase their storage of carbon through 2050. Grasslands/shrublands are expected to lose carbon toward the second half of the assessment timeline because of the projected loss of land areas of the ecosystem. When these projections are combined, a moderately sized carbon sink is present for most of the timeline, but the strength of the sink is expected to decrease over time, as noted previously.
Carbon storage and stock changes in the region are significantly affected by LULC changes. This assessment indicates that the projected net changes in carbon storage are closely related to the projected net changes in ecosystem areas in the region, but the relationship varies between the three major ecosystems: agricultural land, grasslands/shrublands, and forests (fig. 8). The size and direction of the projected net changes in carbon stored in agricultural lands are directly related to the projected net changes in the size and direction of the agricultural lands. For the grasslands/shrublands and forests, the size and direction of the projected net changes in their land areas have a smaller impact on the size and direction of the projected carbon storage than that of agricultural lands. The projected loss of land areas tended to reduce the projected carbon sequestration but did not tend to change its direction, unless the loss in area became large enough, such as the projected loss of grasslands/shrublands that exists under scenario A1B (fig. 8).

–60,000
–40,000
–20,000
0
20,000
40,000
60,000
Area
, in
squa
re k
ilom
eter
sCa
rbon
sto
cks,
in te
ragr
ams
of c
arbo
n
–200
–100
0
100
200
300
400
2005
–2010
2010
–2015
2015
–2020
2020
–2025
2025
–2030
2030
–2035
2035
–2040
2040
–2045
2045
–2050
2005
–2010
2010
–2015
2015
–2020
2020
–2025
2025
–2030
2030
–2035
2035
–2040
2040
–2045
2045
–2050
2005
–2010
2010
–2015
2015
–2020
2020
–2025
2025
–2030
2030
–2035
2035
–2040
2040
–2045
2045
–2050
A1B A2 B1
EcosystemEXPLANATION
Agricultural lands
Grasslands/shrublands
Forests
22 Baseline and Projected Future Carbon Storage and Greenhouse-Gas Fluxes in the Great Plains Region
The transitions of land use between the major ecosystems are projected over time as the result of projected LULC changes, as discussed previously and shown in figure 2. These transitions (for example, forests transitioning to agricultural lands) would result in changes in the projected amount of carbon stored in biomass and soils and thus in the projected gains or losses in stored carbon (fig. 9). When considering the effects of land-use transitions alone (without including the effects of land-management activities such as fertilization or grazing in the analysis), the results from all three models (CENTURY, EDCM, and the spreadsheet model in GEMS) for the three IPCC-SRES scenarios suggest overall negative impacts on projected carbon storage in the Great Plains region (fig. 9A), with varying ranges of projected carbon losses between the baseline years and 2050: 59 to 157 TgC using EDCM, 48 to 122 TgC using CENTURY, and 26 to 118 TgC using the spreadsheet model. It should be noted that the spreadsheet model accounted for changes in carbon storage only in vegetation, whereas the CENTURY and EDCM models accounted for changes in all major carbon pools in ecosystems. Among the three IPCC-SRES scenarios, the projected cumulative total loss between the baseline years and 2050 is the largest under the A1B scenario (119 to 157 TgC), followed by A2 (84 to 142 TgC) and B1 (26 to 59 TgC); this order of impact among the scenarios is consistent across all of the models. Given that the mean total carbon sequestration of the Great Plains region is projected to be 2,500 TgC during the study period (table 3), LULC change in the region could potentially reduce the total by about 4 percent.
Among the individual transitions between the major eco systems, the conversion of forests to agricultural
lands was found to be the dominant factor contributing to the greatest projected negative impact on carbon stocks (fig. 9B). Forest-to-agriculture conversion accounted for half of the carbon loss induced by LULC changes, followed by conversion of forests to other lands (which explains 20 percent of the projected carbon loss). The conversion of grasslands/shrublands to agricultural lands and vice versa had a variable effect on the change in carbon storage, depending on the model that was used (see the bar for G2A versus the bar for A2G in figure 9B); the results indicated that there was structure-related uncertainty in the models. Con versions from wetlands to agricultural lands (W2A), and from forests to grasslands/shrublands (F2G) also lead to a considerable projected loss of carbon stocks. The only consistent projected gains of carbon stocks were from the conversions of grass-lands/shrublands to forests (G2F), agricultural lands to forests (A2F), other lands to forest (O2F), and other lands to grass-lands/shrublands (O2G); however, these projected gains were much smaller than the projected losses, as shown in figure 9.
Finally, because of time and resource constraints, there are processes and effects that are related to the Great Plains region’s carbon cycle that were not addressed in this report, including: (1) individual effects of modeled land management, (2) modeling of natural vegetation succession, (3) GHG emissions from live-stock feedlots, (4) the effects of cover crops on agricultural lands, (5) carbon dynamics in deep soil layers, (6) an estimate of carbon sequestration in aquatic systems such as lakes and impoundments, and (7) a spatially explicit delineation of carbon flux resulting from the lateral movements of soil, carbon, and other materials and its impact on both aquatic and terrestrial ecosystems.
Figure 8. Bar charts showing the estimated and projected net changes in the total area and the carbon stocks of the three primary ecosystems in the region (agricultural lands, grasslands/shrublands, and forests) between 2005 and 2050, under the three IPCC-SRES scenarios (A1B, A2, and B1; Nakicenovic and others, 2000). IPCC-SRES, Intergovernmental Panel on Climate Change’s Special Report on Emissions Scenarios.

Land-cover change
BScenario and model
Carb
on s
tock
cha
nge,
in te
ragr
ams
of c
arbo
nCa
rbon
sto
ck c
hang
e, in
tera
gram
s of
car
bon
–80
–60
–40
–20
0A
F2F F2G F2A F2W F2O G2F G2G G2A G2W G2O A2F A2G A2A A2W A2O W2FW2G W2A
W2W W2O O2F O2G O2A O2W O2O
20
–80
–60
–40
–20
0
A1B andEDCM
A1B andspreadsheet
A2 andspreadsheet
B1 andspreadsheet
A1B andCENTURY
A2 andEDCM
A2 andCENTURY
B1 andEDCM
B1 andCENTURY
Baseline–2010
EXPLANATION
2010–20202020–20302030–20402040–2050
Decade
CENTURY
Model
Error bar—One standard deviation of the mean carbon change
EDCM
Spreadsheet
EXPLANATION
Integrated Analysis 23
Figure 9. Bar chart showing the net impacts of combined LULC changes on carbon stocks in the Great Plains region. A, Carbon stocks by decade as estimated using each of the three biogeochemical models (CENTURY, EDCM, and spreadsheet) in GEMS under each of the IPCC-SRES scenarios (A1B, A2, and B1; Nakicenovic and others, 2000). B, Changes in carbon stocks resulting from the transition of one land-use type to another between the baseline and 2050, using each of the three biogeochemical models (CENTURY, EDCM, and spreadsheet) in GEMS. On part B, for the individual transitions from one land-cover class to another
(x-axis labels), the letters F, G, A, W, and O denote forests, grasslands/shrublands, agricultural lands, wetlands, and other lands, respectively, and the “2” between two letters means “transition to.” For example, F2G refers to “forests transitioning to grasslands/shrublands.” The error bar in part B is one standard deviation of the mean carbon change for each of the three IPCC-SRES scenarios. EDCM, Erosion-Deposition-Carbon Model; GEMS, General Ensemble Modeling System; IPCC-SRES, Intergovern-mental Panel on Climate Change’s Special Report on Emissions Scenarios; LULC, land use and land change.

24 Baseline and Projected Future Carbon Storage and Greenhouse-Gas Fluxes in the Great Plains Region
References Cited
Ansley, R.J., Dugas, W.A., Heuer, M.L., and Kramp, B.A., 2002, Bowen ratio/energy balance and scaled leaf measure-ments of CO2 flux over burned Prosopix savanna: Ecological Applications, v. 12, no. 4, p. 948–961, doi:10.1890/1051-0761(2002)012[0948:BREBAS]2.0.CO;2.
Biondini, M.E., Patton, B.D., and Nyren, P.E., 1998, Grazing intensity and ecosystem processes in a northern mixed-grass prairie, USA: Ecological Applications, v. 8, no. 2, p. 469–479.
Bliss, N.B., Waltman, S.W., and West, L., 2009, Detailed mapping of soil organic carbon stocks in the United States using SSURGO: Eos, v. 90, no. 52, Abstract B51F–0367.
Bradshaw, L.S., Deeming, J.E., Burgan, R.E., and Cohen, J.D., comps., 1983, The 1978 National Fire-Danger Rating System; technical documentation: Ogden, Utah, U.S. Forest Service Intermountain Forest and Range Experiment Sta-tion, General Technical Report GTR INT–169, 44 p. (Also available at http://www.treesearch.fs.fed.us/pubs/29615.)
Brown, T.J., Hall, B.L., Mohrle, C.R., and Reinbold, H.J., 2002, Coarse assessment of Federal wildland fire occur-rence data; Report for the National Wildfire Coordinating Group: Desert Research Institute Program for Climate, Ecosystem and Fire Applications (CEFA) Report 02–04, 31 p. (Also available at http://cefa.dri.edu/Publications/fireoccurrencereport.pdf.)
Burke, I.C., Kittel, T.G.F., Lauenroth, W.K., Snook, P., Yonker, C.M., and Parton, W.J., 1991, Regional analysis of the central Great Plains; Sensitivity to climate variability: BioScience, v. 41, no. 10, p. 685–692. (Also available at http://www.jstor.org/stable/1311763.)
Butman, David, and Raymond, P.A., 2011, Significant efflux of carbon dioxide from streams and rivers in the United States: Nature Geoscience, advance online letter published October 16, 2011, doi:10.1038/ngeo1294.
Chapin, F.S., Woodwell, G.M., Randerson, J.T., Rastetter, E.B., Lovett, G.M., Baldocchi, D.D., Clark, D.A., Harmon, M.E., Schimel, D.S., Valentini, R., Wirth, C., Aber, J.D., Cole, J.J., Goulden, M.L., Harden, J.W., Heimann, M., Howarth, R.W., Matson, P.A., McGuire, A.D., Melillo, J.M., Mooney, H.A., Neff, J.C., Houghton, R.A., Pace, M.L., Ryan, M.G., Running, S.W., Sala, O.E., Schlesinger, W.H., and Schulze, E.-D., 2006, Reconciling carbon-cycle concepts, terminology, and methods: Ecosystems, v. 9, p. 1041–1050, doi:10.1007/s10021-005-0105-7.
Clark, J.S., 1990, Fire and climate change during the last 750 yr in northwestern Minnesota: Ecological Monographs, v. 60, no. 2, p. 135–159.
Cole, J.J., Prairie, Y.T., Caraco, N.F., McDowell, W.H., Tranvik, L.J., Striegl, R.G., Duarte, C.M., Kortelainen, P., Downing, J.A., Middelburg, J.J., and Melack, J., 2007, Plumbing the global carbon cycle; integrating inland waters into the terrestrial carbon budget: Ecosystems, v. 10, no. 1, p. 172–185, doi:10.1007/s10021-006-9013-8.
Collins, S.L., and Wallace, L.L., 1990, Fire in North American tallgrass prairies: Norman, Okla., University of Oklahoma Press, 175 p.
Cully, A.C., Cully, J.F., Jr., and Hiebert, R.D., 2003, Invasion of exotic plant species in tallgrass prairie fragments: Conservation Biology, v. 17, no. 4, p. 990–998, doi:10.1046/j.1523-1739.2003.02107.x.
Derner, J.D., Boutton, T.W., and Briske, D.D., 2006, Grazing and ecosystem carbon storage in the North American Great Plains: Plant and Soil, v. 280, no. 1–2, p. 77–90, doi:10.1007/s11104-005-2554-3.
Downing, J.A., Cole, J.J., Middelburg, J.J., Striegl, R.G., Duarte, C.M., Kortelainen, P., Prairie, Y.T., and Laube, K.A., 2008, Sediment organic carbon burial in agriculturally eutrophic impoundments over the last century: Global Biogeochemical Cycles, v. 22, GB1018, doi:10.1029/2006GB002854.
Eidenshink, Jeff, Schwind, Brian, Brewer, Ken, Zhu, Zhi-Liang, Quayle, Brad, and Howard, Stephen, 2007, A project for monitoring trends in burn severity: Fire Ecol-ogy, v. 3, no. 1, p. 3–21, doi:10.4996/fireecology.0301003.
Euliss, N.H., Jr., Gleason, R.A., Olness, A., McDougal, R.L., Murkin, H.R., Robarts, R.D., Bourbonniere, R.A., and Warner, B.G., 2006, North American prairie wetlands are important nonforested land-based carbon storage sites: Science of the Total Environment, v. 361, nos. 1–3, p. 179–188, doi:10.1016/j.scitotenv.2005.06.007.
Finney, M.A., 2002, Fire growth using minimum travel time methods: Canadian Journal of Forest Research, v. 32, no. 8, p. 1420–1424, doi:10.1139/x02-068.
Finney, Mark, Grenfell, I.C., and McHugh, C.W., 2009, Mod-eling containment of large wildfires using generalized linear mixed-model analysis: Forest Science, v. 55, no. 3, p. 249–255. (Also available at http://saf.publisher.ingentaconnect.com/content/saf/fs/2009/00000055/00000003/art00007.)
Fleischner, T.L., 1994, Ecological costs of livestock grazing in western North America: Conservation Biology, v. 8, no. 3, p. 629–644, doi:10.1046/j.1523-1739.1994.08030629.x.
Fuhlendorf, S.D., Woodward, A.J.W., Leslie, D.M., Jr., and Shackford, J.S., 2002, Multi-scale effects of habitat loss and fragmentation on lesser prairie-chicken populations of the US southern Great Plains: Landscape Ecology, v. 17, no. 7, p. 617–628, doi:10.1023/A:1021592817039.

References Cited 25
Galat, D.L., Berry, C.R., Jr., Peters, E.J., and White, R.G., 2005, Missouri River basin, in Benke, A.C., and Cushing, C.E., eds., Rivers of North America: Burlington, Mass., Elsevier Academic Press, p. 427–479. (Also avail-able at http://www.sciencedirect.com/science/article/pii/B9780120882533500134.)
Giglio, Louis, Descloitres, Jacques, Justice, C.O., and Kaufman, Y.J., 2003, An enhanced contextual fire detection algorithm for MODIS: Remote Sensing of Environment, v. 87, no. 2–3, p. 273–282, doi:10.1016/S0034-4257(03) 00184-6.
Gleason, R.A., Euliss, N.H., Jr., McDougal, R.L., Kermes, K.E., Steadman, E.N., and Harju, J.A., 2005, Potential of restored prairie wetlands in the glaciated North American prairie to sequester atmospheric carbon: Grand Forks, N.D., University of North Dakota, Energy and Environmental Research Center, 17 p.
Gleason, R.A., Tangen, B.A., Browne, B.A., and Euliss, N.H., Jr., 2009, Greenhouse gas flux from cropland and restored wetlands in the Prairie Pothole Region: Soil Biology and Biochemistry, v. 41, no. 12, p. 2501–2507, doi:10.1016/j.soilbio.2009.09.008.
Hartman, M.D., Merchant, E.R., Parton, W.J., Gutmann, M.P., Lutz, S.M., and Williams, S.A., 2011, Impact of historical land-use changes on greenhouse gas exchange in the U.S. Great Plains, 1883–2003: Ecological Applications, v. 21, no. 4, p. 1105–1119, doi:10.1890/10-0036.1.
Heath, L.S., Hansen, Mark, Smith, J.E., Miles, P.D., and Smith, B.W., 2009, Investigation into calculating tree biomass and carbon in the FIADB using a biomass expan-sion factor approach, in McWilliams, Will, Moisen, Gretchen, and Czaplewski, Ray, comps., Proceedings, Forest Inventory and Analysis (FIA) Symposium 2008, Park City, Utah, October 21–23, 2008: U.S. Department of Agriculture, Forest Service, Rocky Mountain Research Sta-tion Publication RMRS–P–56CD, 1 CD–ROM disc. (Also available at http://www.treesearch.fs.fed.us/pubs/33351.)
Higgins, K.F., Naugle, D.E., and Forman, K.J., 2002, A case study of changing land use practices in the northern Great Plains, U.S.A.; An uncertain future for waterbird conser-vation: Waterbirds: The International Journal of Waterbird Biology, v. 25, special publication 2, p. 42–50. (Also avail-able online at http://www.jstor.org/stable/info/1522450.)
Holechek, J.L., Pieper, R.D., and Herbel, C.H., 2000, Range management; principles and practices (4th ed.): Upper Saddle River, N.J., Prentice-Hall, 587 p.
Holland, E.A., Parton, W.J., Detling, J.K., and Coppock, D.L., 1992, Physiological responses of plant populations to herbivory and their consequences for ecosystem nutrient flow: The American Naturalist, v. 140, no. 4, p. 685–706. (Also available at http://www.jstor.org/stable/2462920.)
Homer, Collin, Dewitz, Jon, Fry, Joyce, Coan, Michael, Hossain, Nazmul, Larson, Charles, Herold, Nate, McKerrow, Alexa, Van Driel, J.N., and Wickham, James, 2007, Completion of the 2001 National Land Cover Data-base for the conterminous United States: Photogrammetric Engineering and Remote Sensing, v. 73, no. 4, p. 337–341. (Also available online at http://www.asprs.org/a/publications/ pers/2007journal/april/highlight.pdf.)
Huang, Chengquan, Goward, S.N., Masek, J.G., Thomas, Nancy, Zhu, Zhiliang, and Vogelmann, J.E., 2010, An automated approach for reconstructing recent forest disturbance history using dense Landsat time series stacks: Remote Sensing of Environment, v. 114, no. 1, p. 183–198, doi:10.1016/j.rse.2009.08.17
Intergovernmental Panel on Climate Change, 2007, Climate change 2007 [Fourth assessment report (AR4) of the IPCC]: Cambridge, United Kingdom, Cambridge University Press, The AR4 synthesis report and 3 v. (The physical science basis, by Working Group I; Impacts, adaptation, and vulner-ability, by Working Group II; Mitigation of climate change, by Working Group III), accessed November 14, 2011, at http://www.ipcc.ch/publications_and_data/publications_and_data_reports.htm.
Karl, T.R., Melillo, J.M., and Peterson, T.C., eds., 2009, Global climate change impacts in the United States [A State of Knowledge Report from the U.S. Global Change Research Program]: New York, N.Y., Cambridge University Press, 189 p. (Also available at http://downloads.globalchange.gov/usimpacts/pdfs/climate-impacts-report.pdf.)
Liu, Shuguang, 2009, Quantifying the spatial details of carbon sequestration potential and performance, in McPherson, B.J., and Sundquist, E.T., eds., Carbon sequestration and its role in the global carbon cycle: American Geophysical Union Monograph 183, p. 117–128, doi:10.1029/2006GM000524.
Liu, Shuguang, Bliss, Norman, Sundquist, Eric, and Huntington, T.G., 2003, Modeling carbon dynamics in vegetation and soil under the impact of soil erosion and deposition: Global Biogeochemical Cycles, v. 17, no. 2, p. 1074, doi:10.1029/2002GB002010.
Liu, Shuguang, Bond-Lamberty, Ben, Hicke, J.A., Vargas, Rodrigo, Zhao, Shuqing, Chen, Jing, Edburg, S.L., Hu, Yueming, Liu, Jinxun, McGuire, A.D., Xiao, Jingfeng, Keane, Robert, Yuan, Wenping, Tang, Jianwu, Luo, Yiqi, Potter, Christopher, and Oeding, Jennifer, 2011, Simulating the impacts of disturbances on forest carbon cycling in North America; processes, data, models, and challenges: Journal of Geophysical Research, v. 116, G00K08, 22 p., doi:10.1029/2010JG001585.
Liu, Shuguang, Loveland, T.R., and Kurtz, R.M., 2004, Contemporary carbon dynamics in terrestrial ecosystems in the southeastern plains of the United States: Environ-mental Management, v. 33, supplement 1, p. S442–S456, doi:10.1007/s00267-003-9152-z.

26 Baseline and Projected Future Carbon Storage and Greenhouse-Gas Fluxes in the Great Plains Region
Liu, S., Tan, Z., Chen, M., Liu, J., Wein, A., Li, Z., Huang, S., Oeding, J., Young, C., Verma, S.B., Suyker, A.E., Faulkner, S., and McCarty, G.W., in press, The General Ensemble Biogeochemical Modeling System (GEMS) and its applica-tions to agricultural systems in the United States: Journal of Geophysical Research—Biogeosciences.
Loveland, T.R., Sohl, T.L., Stehman, S.V., Gallant, A.L., Sayler, K.L., and Napton, D.E., 2002, A strategy for esti-mating the rates of recent United States land-cover changes: Photogrammetric Engineering and Remote Sensing, v. 68, p. 1091–1099.
Lovett, G.M., Cole, J.J., and Pace, M.L., 2006, Is net ecosystem production equal to ecosystem carbon accumulation?: Ecosys-tems, v. 9, nos. 1–4, 4 p., doi:10.1007/s10021-005-0036-3.
Lutes, D.C., Keane, R.E., and Caratti, J.F., 2009, A surface fuel classification for estimating fire effects: International Journal of Wildland Fire, v. 18, no. 7, p. 802–814, doi:dx.doi.org/10.1071/WF08062.
Mann, H.B., 1945, Nonparametric tests against trend: Econometrica, v. 13, no. 3, p. 245–259. (Also available at http://www.jstor.org/pss/1907187.)
Matthews, W.J., Vaughn, C.C., Gido, K.B., and Marsh-Matthews, Edie, 2005, Southern Plains rivers, in Benke, A.C., and Cushing, C.E., eds., Rivers of North America: Burlington, Mass., Elsevier Academic Press, p. 283–311. (Also available at http://www.sciencedirect.com/science/article/pii/B9780120882533500109.)
Maurer, E.P., 2007, Uncertainty in hydrologic impacts of climate change in the Sierra Nevada, California, under two emissions scenarios: Climatic Change, v. 82, nos. 3–4, p. 309–325, doi:10.1007/s10584-006-9180-9.
Maurer, E.P., Wood, A.W., Adam, J.C., Lettenmaier, D.P., and Nijssen, B., 2002, A long-term hydrologically based dataset of land surface fluxes and states for the contermi-nous United States: Journal of Climate, v. 15, no. 22, p. 3237–3251, doi:10.1175/1520-0442(2002)015<3237: ALTHBD>2.0.CO;2.
McCarty, J.L., Korontzi, Stefania, Justice, C.O., and Loboda, Tatiana, 2009, The spatial and temporal distribution of crop residue burning in the contiguous United States: Science of the Total Environment, v. 407, no. 21, p. 5701–5712, doi:10.1016/j.scitotenv.2009.07.009.
Miles, P.D., and Smith, W.B., 2009, Specific gravity and other properties of wood and bark for 156 tree species found in North America: U.S. Department of Agriculture, Forest Ser-vice, Northern Research Station, Research Note NRS–38, 35 p. (Also available at http://nrs.fs.fed.us/pubs/34185.)
Moore, Nathan, and Rojstaczer, Stuart, 2001, Irrigation-induced rainfall and the Great Plains: Journal of Applied Meteorology, v. 40, no. 8, p. 1297–1309, doi:10.1175/ 1520-0450(2001)040<1297:IIRATG>2.0.CO;2.
Nakicenovic, Nebojsa, Alcamo, Joseph, Davis, Gerald, de Vries, Bert, Fenhann, Joergen, Gaffin, Stuart, Gregory, Kenneth, Grübler, Arnulf, Jung, T.Y., Kram, Tom, La Rovere, E.L., Michaelis, Laurie, Mori, Shunsuke, Morita, Tsuneyuki, Pepper, William, Pitcher, Hugh, Price, Lynn, Riahi, Keywan, Roehrl, Alexander, Rogner, H.-H., Sankovski, Alexei, Schlesinger, Michael, Shukla, Priyararshi, Smith, Steven, Swart, Robert, van Rooijen, Sascha, Victor, Nadejda, and Dadi, Zhou, 2000, Special report on emissions scenarios; A special report of Working Group III of the Intergovernmental Panel on Climate Change [IPCC]: Cambridge, United Kingdom, Cambridge University Press, 599 p., accessed November 15, 2011, at http://www.grida.no/publications/other/ipcc%5Fsr/?src=/climate/ipcc/emission/index.htm.
Ogle, S.M., Breidt, F.J., Easter, Mark, Williams, Steve, Killian, Kendrick, and Paustian, Keith, 2010, Scale and uncertainty in modeled soil organic carbon stock changes for US croplands using a process-based model: Global Change Biology, v. 16, no. 2, p. 810–822, doi:10.1111/j.1365-2486.2009.01951.x.
Padgitt, Merritt, Newton, Doris, Penn, Renata, and Sandretto, Carmen, 2000, Production practices for major crops in U.S. agriculture, 1990–97: U.S. Department of Agriculture, Economic Research Service Statistical Bulletin 969, 110 p. (Also available at http://www.ers.usda.gov/ Publications/SB969.)
Parton, W.J., Schimel, D.S., Cole, C.V., and Ojima, D.S., 1987, Analysis of factors controlling soil organic matter levels in Great Plains grasslands: Soil Science Society of America Journal, v. 51, no. 5, p. 1173–1179, doi:10.2136/sssaj1987.03615995005100050015x.
Parton, W.J., Scurlock, J.M.O., Ojima, D.S., Gilmanov, T.G., Scholes, R.J., Schimel, D.S., Kirchner, T., Menaut, J.-C., Seastedt, T., Garcia Moya, E., Kamnalrut, Apinan, and Kinyamario, J.I., 1993, Observations and modeling of biomass and soil organic matter dynamics for the grassland biome worldwide: Global Biogeochemical Cycles, v. 7, no. 4, p. 785–809, doi:10.1029/93GB02042.
Pontius, R.G., Jr., and Neeti, Neeti, 2010, Uncertainty in the difference between maps of future land change scenarios: Sustainability Science, v. 5, no. 1, p. 39–50, doi:10.1007/s11625-009-0095-z.
Raymond, P.A., and Oh, N.-H., 2007, An empirical study of climatic controls on riverine C export from three major U.S. watersheds: Global Biogeochemical Cycles, v. 21, GB2022, 9 p., doi:10.1029/2006GB002783.
Reinhardt, E.D., Keane, R.E., and Brown, J.K., 1997, First Order Fire Effect Model; FOFEM 4.0 user’s guide: Ogden, Utah, U.S. Forest Service Intermountain Research Station Gen-eral Technical Report INT–GTR–344, 65 p. (Also available online at http://www.fs.fed.us/rm/pubs_int/int_gtr344.pdf.)

References Cited 27
Robertson, G.P., Paul, E.A., and Harwood, R.R., 2000, Greenhouse gases in intensive agriculuture; contributions of individual gases to the radiative forcing of the atmosphere: Science, v. 289, no. 5486, p. 1922–1925, doi:10.1126/ science.289.5486.1922.
Rollins, M.G., 2009, LANDFIRE; A nationally consistent vegetation, wildland fire, and fuel assessment: Interna-tional Journal of Wildland Fire, v. 18, no. 3, p. 235–249, doi:10.1071/WF08088.
Roth, M.S., 2005, Missouri River mainstem system is North America’s largest reservoir system: Water Current, v. 37, no. 4, 16 p. (Also available at http://digitalcommons.unl.edu/water_currentnews/7/.)
Roy, D.P., Boschetti, L., Justice, C.O., and Ju, J., 2008, The collection 5 MODIS burned area product—Global evaluation by comparison with the MODIS active fire product: Remote Sensing of Environment, v. 112, no. 9, p. 3690–3707, doi:10.1016/j.rse.2008.05.013.
Runkel, R.L., Crawford, C.G., and Cohn, T.A., 2004, Load Estimator (LOADEST); A FORTRAN program for estimating constituent loads in streams and rivers: U.S. Geological Survey Techniques and Methods, Book 4, Chapter A5, 69 p., accessed November 14, 2011, at http://pubs.usgs.gov/tm/2005/tm4A5/.
Samson, Fred, and Knopf, Fritz, 1994, Prairie conservation in North America: BioScience, v. 44, no. 5, 418–442. (Also available at http://www.jstor.org/stable/view/1312365.)
Samson, F.B., and Knopf, F.L., 1996, Prairie conservation; Preserving North America’s most endangered ecosystem: Washington, D.C., Island Press, 351 p.
Samson, F.B., Knopf, F.L., and Ostlie, W.R., 2004, Great Plains ecosystems; Past, present, and future: Wildlife Society Bulletin, v. 32, no. 1, p. 6–15. (Also available at http://www.jstor.org/stable/3784538.)
Schindler, D.W., 1997, Widespread effects of climatic warm-ing on freshwater ecosystems in North America: Hydro-logical Processes, v. 11, no. 8, p. 1043–1067, doi:10.1002/(SICI)1099-1085(19970630).
Schlesinger, W.H., and Melack, J.M., 1981, Transport of organic carbon in the world’s rivers: Tellus, v. 33, no. 2, p. 172–187, doi:10.1111/j.2153-3490.1981.tb01742.x.
Schuman, G.E., Reeder, J.D., Manley, J.T., Hart, R.H., Manley, W.A., 1999, Impact of grazing management on the carbon and nitrogen balance of a mixed-grass rangeland: Ecological Applications, v. 9, no. 1, p. 65–71. (Also avail-able at http://www.jstor.org/stable/2641168.)
Sohl, Terry, and Sayler, Kristi, 2008, Using the FORE-SCE model to project land-cover change in the southeastern United States: Ecological Modelling, v. 219, nos. 1–2, p. 49–65, doi:10.1016/j.ecolmodel.2008.08.003.
Sohl, T.L., Sayler, K.L., Drummond, M.A., and Loveland, T.R., 2007, The FORE-SCE model; A practical approach for projecting land use change using scenario-based modeling: Journal of Land Use Science, v. 2, no. 2, p. 103–126, doi:10.1080/17474230701218202.
Strengers, Bart, Leemans, Rik, Eickhout, Bas, de Vries, Bert, and Bouwman, Lex, 2004, The land-use projections and resulting emissions in the IPCC SRES scenarios as simu-lated by the IMAGE 2.2 model: GeoJournal, v. 61, no. 4, p. 381–393, doi:10.1007/s10708-004-5054-8.
Sundquist, E.T., Ackerman, K.V., Bliss, N.B., Kellndorfer, J.M., Reeves, M.C., and Rollins, M.G., 2009, Rapid assessment of U.S. forest and soil organic carbon storage and forest biomass carbon sequestration capacity: U.S. Geological Survey Open-File Report 2009–1283, 15 p., available at http://pubs.usgs.gov/ofr/2009/1283.
Tan, Zhengxi, Liu, Shuguang, Johnston, C.A., Liu, Jinxun, and Tieszen, L.L., 2006, Analysis of ecosystem controls on soil carbon source-sink relationships in the northwest Great Plains: Global Biogeochemical Cycles, v. 20, p. GB4012, 9 p., doi:10.1029/2005GB002610.
Tan, Zhengxi, Liu, Shuguang, Li, Zhengpeng, and Loveland, T.R., 2007, Simulated responses of soil organic carbon stock to tillage management scenarios in the northwest Great Plains: Carbon Balance and Management, v. 2, no. 7, doi:10.1186/1750-0680-2-7.
Tulbure, M.G., Wimberly, M.C., Roy, D.P., and Henebry, G.M, 2011, Spatial and temporal heterogeneity of agricultural fires in the central United States in relation to land cover and land use: Landscape Ecology, v. 26, no. 2, p. 211–224, doi:10.1007/s10980-010-9548-0.
Umbanhowar, C.E., Jr., 1996, Recent fire history of the northern Great Plains: American Midland Naturalist, v. 135, no. 1, p. 115–121. (Also available at http://www.jstor.org/stable/2426877.)
U.S. Congress, 2007, Energy Independence and Security Act— Public Law 110–140: U.S. Congress, 311 p., available at http://frwebgate.access.gpo.gov/cgi-bin/getdoc.cgi?dbname= 110_cong_public_laws&docid=f:publ140.110.pdf.
U.S. Department of Agriculture, 2011, USDA agriculture and forestry greenhouse gas inventory; 1990–2008: U.S. Department of Agriculture, Office of the Chief Economist, Climate Change Program Office Technical Bulletin 1930, 162 p. (Also available at http://www.usda.gov/oce/climate_change/AFGGInventory1990_2008.htm.)
U.S. Department of Agriculture, Economic Research Service, 2011a, Fertilizer use and price: U.S Department of Agriculture, Economic Research Service database, accessed November 15, 2011, at http://www.ers.usda.gov/Data/FertilizerUse.
U.S. Department of Agriculture, Economic Research Service, 2011b, ARMS farm financial and crop production practices; Tailored reports: U.S Department of Agriculture, Economic Research Service database, accessed November 15, 2011, at http://www.ers.usda.gov/Data/ARMS/app/.

28 Baseline and Projected Future Carbon Storage and Greenhouse-Gas Fluxes in the Great Plains Region
U.S. Department of Agriculture, Forest Service, 2011, Forest inventory and analysis national program: U.S. Department of Agriculture, Forest Service database, accessed November 15, 2011, at http://www.fia.fs.fed.us/tools-data.
U.S. Department of Agriculture, National Agricultural Statistics Service, 2011, Quick Stats: U.S. Department of Agriculture, National Agricultural Statistics Service data-base accessed November 15, 2011, at http://www.nass.usda.gov/Data_and_Statistics/Quick_Stats/index.asp.
U.S. Department of Agriculture, Natural Resources Conser-vation Service, 2006, U.S. General soil map (STATSGO2): U.S. Department of Agriculture, Natural Resources Conser-vation Service database accessed November 17, 2011, at http://soildatamart.nrcs.usda.gov/Default.aspx.
U.S. Department of Agriculture, Natural Resources Conser-vation Service, 2009 Soil survey geographic (SSURGO) database for the United States: U.S. Department of Agri-culture, Natural Resources Conservation Service database accessed November 17, 2011, at http://soildatamart.nrcs.usda.gov/Default.aspx.
U.S. Environmental Protection Agency, 1999, Level III ecoregions of the continental United States: Corvallis, Ore., U.S. Envi-ronmental Protection Agency, National Health and Environ-mental Effects Research Laboratory, scale 1:7,500,000.
U.S. Environmental Protection Agency, 2011a, Inventory of U.S. greenhouse gas emissions and sinks; 1990–2009: U.S. Environmental Protection Agency, Office of Atmospheric Programs, Report EPA 430–R–11–005, April 2011, 848 p. (Also available at http://epa.gov/climatechange/emissions/usinventoryreport.html.)
U.S. Environmental Protection Agency, 2011b, National Lakes Assessment: U.S. Environmental Protection Agency data-base accessed November 17, 2011, at http://water.epa.gov/type/lakes/lakessurvey_index.cfm.
U.S. Geological Survey, 2002, Moderate resolution imaging spectroradiometer (MODIS) irrigated agriculture dataset for the United States (MIrAD-US): U.S. Geological Survey dataset accessed on November 15, 2011, at http://earlywarning.usgs.gov/USirrigation.
U.S. Geological Survey, 2011, National Hydrography Dataset: U.S. Geological Survey database accessed November 15, 2011, at http://nhd.usgs.gov/.
Vogelmann, J.E., Howard, S.M., Yang, Limin, Larson, C.R., Wylie, B.K., and Van Driel, Nick, 2001, Completion of the 1990s National Land Cover Data Set for the conterminous United States: Photogrammetric Engineering and Remote Sensing, v. 67, no. 6, p. 650–652. (Also available at http://www.asprs.org/PE-RS-Journals-Past-Issues/PE- RS-Journals/PE-RS-Past-Issues/PE-RS-Journals-2001/ PE-RS-June-2001.html.)
Waltman, S.W., Olson, Carolyn, West, Larry, Moore, Amanda, and Thompson, James, 2010, Preparing a soil organic carbon inventory for the United States using soil surveys and site measurements; Why carbon stocks at depth are important, in Gilkes, R.J., and Prakongkep, Nattaporn, eds., Proceedings, 19th World Congress of Soil Science, Soil Solutions for a Changing World, Brisbane, Australia, August 1–6, 2010: Brisbane, Australia, International Union of Soil Scientists, 1 CD-ROM disc. (Also available at http://www.iuss.org/19th%20WCSS/Symposium/pdf/0111.pdf.)
West, T.O., Brandt, C.C., Baskaran, L.M., Hellwinckel, C.M., Mueller, Richard, Bernacchi, C.J., Bandaru, Varaprasad, Yang, Bai, Wilson, B.S., Marland, Gregg, Nelson, R.G., De La Torre Ugarte, D.G., and Post, W.M., 2010, Cropland carbon fluxes in the United States; increasing geospatial reso-lution of inventory-based carbon accounting: Ecological Applications, v. 20, no. 6, p. 1074–1086, doi:10.1890/08-2352.1.
Wood, A.W., Leung, L.R., Sridhar, V., and Lettenmaier, D.P., 2004, Hydrologic implications of dynamical and statistical approaches to downscaling climate model outputs: Cli-matic Change, v. 62, nos. 1–3, p. 189–216, doi:10.1023/B:CLIM.0000013685.99609.9e.
Wood, A.W., Maurer, E.P., Kumar, Arun, and Lettenmaier, D.P., 2002, Long-range experimental hydrologic forecast-ing for the eastern United States: Journal of Geophysical Research—Atmospheres, v. 107, no. D20, 4429, 15 p., doi:10.1029/2001JD000659.
Woudenberg, S.W, Conkling, B.L. ,O’Connell, B.M., LaPoint, E.B., Turner, J.A., and Waddell, K.L., 2010, The Forest Inventory and Analysis Database; Database descrip-tion and user manual version 4.0 for Phase 2: U.S. Depart-ment of Agriculture, Forest Service, General Technical Report RMRS–GTR–245, 336 p. (Also available at http://treesearch.fs.fed.us/pubs/37446.)
Zhang, Li, Wylie, B.K., Ji, Lei, Gilmanov, T.G., Tieszen, L.L., and Howard, D.M., 2011, Upscaling carbon fluxes over the Great Plains grasslands; Sinks and sources: Journal of Geophysical Research—Biogeosciences, v. 116, G00J03, 13 p., doi:10.1029/2010JG001504.
Zhu, Zhiliang, ed., Bergamaschi, Brian, Bernknopf, Richard, Clow, David, Dye, Dennis, Faulkner, Stephen, Forney, William, Gleason, Robert, Hawbaker, Todd, Liu, Jinxun, Liu, Shuguang, Prisley, Stephen, Reed, Bradley, Reeves, Matthew, Rollins, Matthew, Sleeter, Benjamin, Sohl, Terry, Stackpoole, Sarah, Stehman, Stephen, Striegl, Robert, Wein, Anne, and Zhu, Zhiliang, 2010, A method for assessing carbon stocks, carbon sequestration, and greenhouse-gas fluxes in ecosystems of the United States under present conditions and future scenarios: U.S. Geological Survey Scientific Investigations Report 2010–5233, 188 p. (Also available at http://pubs.usgs.gov/sir/2010/5233/.) (Supersedes U.S. Geological Survey Open-File Report 2010–1144.)

Manuscript approved on November 21, 2011
Edited by Elizabeth D. Koozmin
Illustrations and layout by Caryl J. Wipperfurth
For more information concerning the research in this report, contact
Geographic Analysis and Monitoring ProgramU.S. Geological Survey12201 Sunrise Valley DriveMS 519A National CenterReston, Virginia 20192
http://gam.usgs.gov/

Zhu and others—B
aseline and Projected Future Carbon Storage and Greenhouse-G
as Fluxes in the Great Plains Region of the U
nited States—Professional Paper 1787Printed on recycled paper