Introduction Hitting the Baseball The Flight of the Baseball Pitching the Baseball Summary
Upload
truongngocCategory
view
212download
0
Baseball Pay and Performance
MIS 480/580
October 22, 2015
Mikhail Averbukh
Scott Brown
Brian Chase
ABSTRACT
Major League Baseball (MLB) is the only professional sport in the United States that is a legal monopoly by act of Congress. As such MLB does not need to fear competition from another baseball league in the United States. Since baseball is unique in salary structure, we explore the factors that drive salary for players. The research determined a relationship between player’s performance and salary, assessed strategies different MLB teams use determining salary levels for their players, and created a formula for determining a salary for a player based on the player’s past performance.
Table of Contents
ABSTRACT .................................................................................................................................................. 2
RESEARCH OBJECTIVE ........................................................................................................................... 3
ROLES .......................................................................................................................................................... 3
LITERATURE REVIEW ............................................................................................................................. 3
DATA SOURCE AND COLLECTION METHODS ................................................................................... 4
SELECTION CRITERIA ............................................................................................................................. 5
FINDINGS .................................................................................................................................................... 6
CONCLUSIONS......................................................................................................................................... 14
REFERENCES ........................................................................................................................................... 15
RESEARCH OBJECTIVE
Several questions were posed for this research project:
What is the best indicator of pay?
What factors are used to determine the “best” players?
How do teams spend their money?
How can team and players predict salary offers based on a player’s performance?
ROLES
Mikhail Averbuck – SQL queries, Java scripts, Salary vs. OBP, and Budget vs. Pay analysis
Scott Brown - Team vs. Player Performance statistics, experience attributes vs. pay
Brian Chase - Excel Sheet and Minitabs, performance vs. pay analsysis
LITERATURE REVIEW
The relationship between performance and salary in baseball has been extensively researched. Several
researches have attempted to make a prediction for a salary levels in MLB.
Turner (2007) , using panels of player pay and performance from Major League Baseball (MLB),
examined trends in player productivity and salaries as players age. Turner discovered that free agents
are paid proportionately with their production at all ability levels, whereas young players’ salaries are
suppressed by similar amounts.
Meltzer (2005) investigated the ways that various measures of player performance have different
impacts on the outcomes of salary determination and contract length in Major League Baseball using
contract data from 2002. Maltzer discovered that the average salary and contract length seem to
diverge notably in the cases of young improving players, who are likely to get long contracts at low
salaries, and chronically injured players, who are likely to get short contracts at a salary in keeping with
their performance.
Dinerstein (2007) explored how teams deal with uncertainty of a player’s true value and whether their
approaches toward high-risk free agent signings and low-risk contract option decisions differ. Dinerstein
estimated the relationships between past performance and future performance and between past
performance and free agent salaries and found that in determining free agent salary offers, teams
undervalue past performance relative to its power in predicting future performance. For the low-risk

option decisions Dinerstein determined that teams are much less cautious and follow no discernible
pattern in exercising options; overall, teams thus use very different approaches in making free agent and
contract option decisions.
Moorehand (2007) states that salaries are related to the willingness of fans to pay. Likewise, owners
gladly pay for the players because it is less than the revenue the individual produces for them. Baseball
players are not paid large sums of money just to play a child's game; instead, they are paid to make
money for their bosses and, like any other employee, deserving of their share of the profit.
Law ( 2007) explains why general managers of MLB teams often trade prospects or young players for
"proven" veterans, signing well-known free agents whose name value exceeds their on-field value and
back-loading deals to maximize disposable payroll in the current year without regard to the payroll
consequences for future years. Law states that trading away young talent, eliminating long-term payroll
flexibility and alienating a portion of the fan base can set the team back several years. Law explains this
phenomenon by pointing out that General Managers, in order to keep their job, are not motivated in
developing young players but rather are motivated in producing results short term.
DATA SOURCE AND COLLECTION METHODS
This research is based on the data from the Baseball Archive database available for download at
baseball1.com. The database contains pitching, hitting, and fielding statistics for Major League Baseball
from 1871 through 2007. The database, version 5.5, contains season-by-season data on player
performance, salaries, and many other variables that would serve as useful controls in a structural
analysis. It includes data from the two current leagues (American and National), the four other "major"
leagues (American Association, Union Association, Players League, and Federal League), and the
National Association of 1871-1875. The database is an Microsoft Access database.
This database was created by Sean Lahman, who pioneered the effort to make baseball statistics freely
available to the general public. What started as a one man effort in 1994 has grown tremendously, and
now a team of researchers have collected their efforts to make this the largest and most accurate
source for baseball statistics available anywhere. We also have considered other data sources for the
research ( for example, www.baseball-reference.com, www.baseball-almanac.com), but found the
Lahman database to be the most comprehensive.
We used Java to execute SQL queries to extract data from the database and insert it into another Access
database. Each player is assigned a unique number (playerID). All of the information relating to that
player is tagged with his playerID. The playerIDs are linked to names and birthdates in the MASTER
table. The database is comprised of the following main tables:

MASTER - Player names, DOB
Batting - batting statistics
Pitching - pitching statistics
Fielding - fielding statistics
Salaries - player salary data
The data that we were extracting for the Lahman database was limited to 2000-2007 for salary and
player statistics. We discovered that due to the high level of inflation in baseball salaries, we had to limit
the number of years we need to be looking it to ensure that the data is accurate. We discovered that the
median salary in Major League baseball does up $100k a year making it’s hard to compare salary levels
that are more that several years apart.
After the data has been extracted, it was imported in Microsoft Excel for further analysis. We have also
utilized Minitabs, a statistical package, in our research.
SELECTION CRITERIA
For this project only two positions were considered: Pitchers and Batters. Batters includes all fielding
positions that hit, as well as the designated hitter position. Fielding statistics were not relevant to this
project, thus the position that a batter plays is irrelevant.
For pitchers we considered several statistics:
Earned Run Average (ERA) - is the mean of earned runs given up by a pitcher per nine
innings pitched. This was derived field from the database on based on OutsPitched and
EarnedRuns.
Wins – the number of games credited to the pitcher as a win.
Losses – the number of games credited to the pitcher as a loss.
Strike Outs – the number of players the pitcher has struck out.
Statistics considered for Batters included:
Hits – the sum of singles, doubles, triples and home runs that batter has earned
Home Runs – the number of balls the batter has hit out of the field that were ruled home
runs.
Batting Average – the average number of hits over the number of at bats. This field was
derived from other fields in the database.
Runs Batted In (RBI) – the number of players that have been able to score a run based on a
hit from the batter.
On Base Percentage (OBP) – how often a batter reaches base compared to how often they
are at bat.
Other factors that were considered was how long a player has been in the major league, what teams
they have played for, and their person history with those teams.
FINDINGS
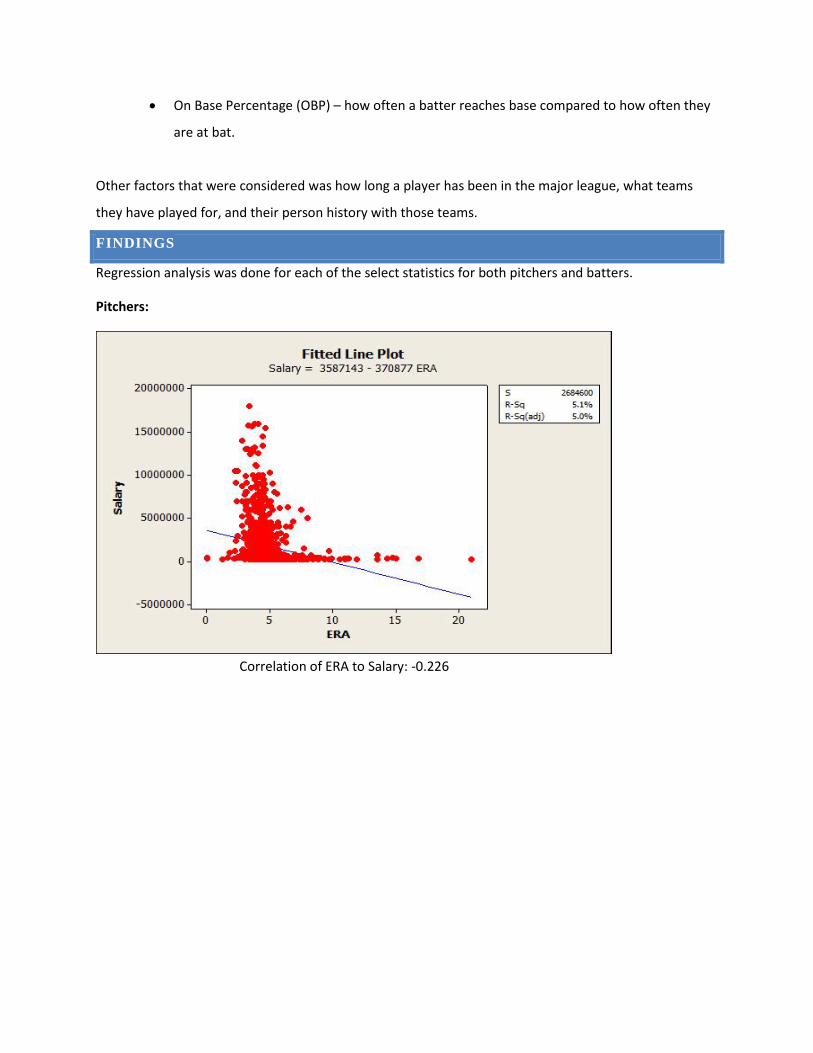
Regression analysis was done for each of the select statistics for both pitchers and batters.
Pitchers:
Correlation of ERA to Salary: -0.226

Correlation of Wins to Salary: 0.657
Correlation of Strike Outs to Salary: 0.671

Correlation of Losses to Salary: 0.525
Of all of the pitching statistics, Strike Outs had the best correlation to salary. It is not surprising that this
correlation was better than that of Wins and Losses due to varying types of pitchers such as starters,
relief pitchers, and closers. Starters are far more likely to get wins and losses than relief pitchers or
closers, however, starting pitchers do not always make significantly more money than closers. The low
correlation of ERA to salary was surprising and this could be due to errors within the database that was
used as ERA was not directly saved in the tables.
Batters:

Correlation of Batting Average to Salary: 0.427
Correlation of Hits to Salary: 0.672

Correlation of RBIs to Salary: 0.737
Correlation of Home Runs to Salary: 0.722
RBIs to Salary had the best correlation of all of the batting statistics. Since scoring runs is how a team wins a game, and RBIs is an indicator of how many runs a player can drive in, it is not surprising that there is a strong correlation between RBIs and Salary. It is surprising that batting average has a weak correlation to salary as batting average is one of the most talked about statistics in baseball.
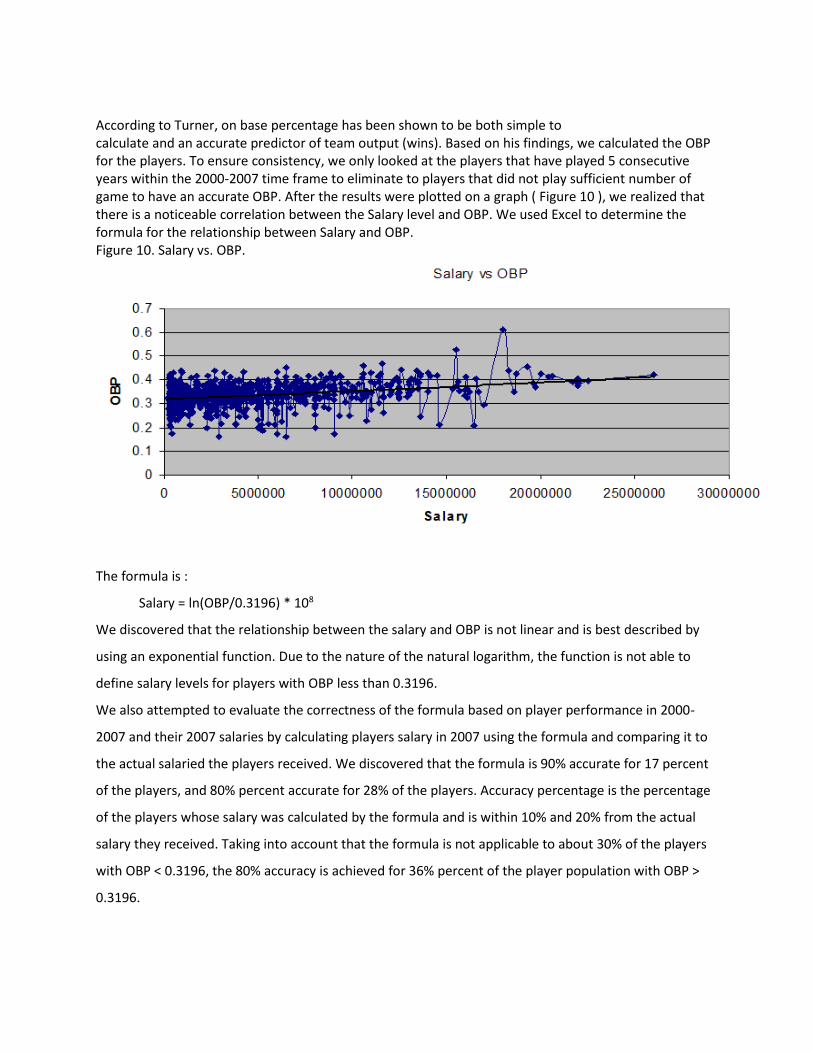
According to Turner, on base percentage has been shown to be both simple to calculate and an accurate predictor of team output (wins). Based on his findings, we calculated the OBP for the players. To ensure consistency, we only looked at the players that have played 5 consecutive years within the 2000-2007 time frame to eliminate to players that did not play sufficient number of game to have an accurate OBP. After the results were plotted on a graph ( Figure 10 ), we realized that there is a noticeable correlation between the Salary level and OBP. We used Excel to determine the formula for the relationship between Salary and OBP. Figure 10. Salary vs. OBP.
The formula is :
Salary = ln(OBP/0.3196) * 108
We discovered that the relationship between the salary and OBP is not linear and is best described by
using an exponential function. Due to the nature of the natural logarithm, the function is not able to
define salary levels for players with OBP less than 0.3196.
We also attempted to evaluate the correctness of the formula based on player performance in 2000-
2007 and their 2007 salaries by calculating players salary in 2007 using the formula and comparing it to
the actual salaried the players received. We discovered that the formula is 90% accurate for 17 percent
of the players, and 80% percent accurate for 28% of the players. Accuracy percentage is the percentage
of the players whose salary was calculated by the formula and is within 10% and 20% from the actual
salary they received. Taking into account that the formula is not applicable to about 30% of the players
with OBP < 0.3196, the 80% accuracy is achieved for 36% percent of the player population with OBP >
0.3196.
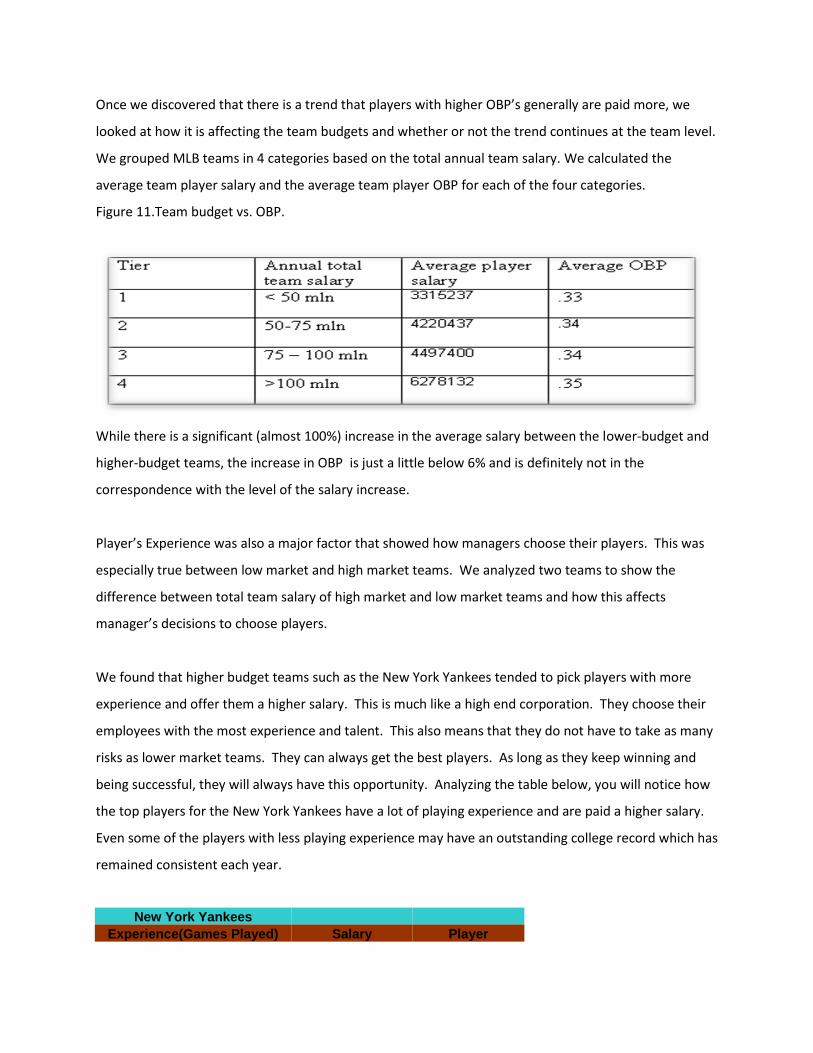
Once we discovered that there is a trend that players with higher OBP’s generally are paid more, we
looked at how it is affecting the team budgets and whether or not the trend continues at the team level.
We grouped MLB teams in 4 categories based on the total annual team salary. We calculated the
average team player salary and the average team player OBP for each of the four categories.
Figure 11.Team budget vs. OBP.
While there is a significant (almost 100%) increase in the average salary between the lower-budget and
higher-budget teams, the increase in OBP is just a little below 6% and is definitely not in the
correspondence with the level of the salary increase.
Player’s Experience was also a major factor that showed how managers choose their players. This was
especially true between low market and high market teams. We analyzed two teams to show the
difference between total team salary of high market and low market teams and how this affects
manager’s decisions to choose players.
We found that higher budget teams such as the New York Yankees tended to pick players with more
experience and offer them a higher salary. This is much like a high end corporation. They choose their
employees with the most experience and talent. This also means that they do not have to take as many
risks as lower market teams. They can always get the best players. As long as they keep winning and
being successful, they will always have this opportunity. Analyzing the table below, you will notice how
the top players for the New York Yankees have a lot of playing experience and are paid a higher salary.
Even some of the players with less playing experience may have an outstanding college record which has
remained consistent each year.
New York Yankees
Experience(Games Played) Salary Player

238 11,070,423 mussimi01
1288 12,000,000 posadjo01
1704 13,000,000 damonjo01
538 13,000,000 matsuhi01
1485 15,000,000 abreubo01
201 16,000,000 pettian01
1679 21,600,000 jeterde01
1746 22,708,525 rodrial01
1622 23,428,571 giambja01
Total 147,807,519
Lower market teams have more of a disadvantage. Because they win less games and are therefore more
unsuccessful compared to higher market teams, the way they choose their players is different. The
experience level is down much more for lower market teams. This means that lower market teams are
taking more chances on players with less experience. The following graph shows the highest paid
players for the Tampa bay Ray Devils. You can see from this table that many of the top paid players do
not have much playing experience. They also may not have the consistency talent that higher market
teams are looking for. However, they may be very talented which is why the player accepts the salary
and tries to continue to advance his career to eventually player for higher market teams that will pay
him more.
Tampa Bay Ray Devils
Experience(Games Played) Salary Player
281 750,000 reyesal01
820 800,000 nortogr01
507 800,000 penaca01
109 1,200,000 seoja01
30 1,340,000 youngde03
1,800,000 iwamuak01
525 2,700,000 wiggity01
107 2,725,000 fossuca01
673 4,125,000 crawfca02
Total 16,240,000

CONCLUSIONS
Pay in baseball only remotely relates to player’s performance. There is no single factor that can predict a
player’s pay. While better performance generally leads to higher pay, it is difficult to predict how much a
player will earn. Other factors, such as teams willingness to pay higher amounts, popularity of a team
and a player are important in determining salary. Experience seems to have a significant impact on a
players salary. Those players who have been in the league longer tend to make more money and
gravitate to teams with large pay rolls. Teams with smaller pay rolls tend to higher younger players who
they can play less. Due to the vast difference in salary and team pay roles it is difficult to create a one
size fits all approach to determine player salaries.
According to the article Desperate GM can cripple a franchise, general managers tend to make decisions
that focus on the short term. Often managers need to make decisions that impact just this season, or
even just the next game to ensure they keep their own jobs. So players will be offered longer and higher
paid contracts than their performance indicates they should earn. This explains a lot of the results that
were found where players were making considerably more money than their peers with similar
performance history.
Due to this discrepancy between salary and performance, along with the general managers short term
views, team owners should watch out for wasteful spending. Teams could get the small level of
performance out of a younger player for millions less than they could get from an experienced, well
known player. Wasteful spending is more of a concern for small market teams who can not afford big
name players. If a small market team follows the performance of younger players closely they may be
able to sign players who have promising performance for relatively low salaries. Big market teams can
afford to spend their money on players with a proven consistent performance and will be less concerned
about getting a play with similar performance for less money.
REFERENCES
Turner, C. and Hakes, J. (2007). Pay, Productivity and Aging in Major League Baseball. Retrieved
May 1, 2007, from University Library of Munich, Germany Web site http://mpra.ub.uni-
muenchen.de/4326/
Meltzer, J.(2005). Average Salary and Contract Length in Major League Baseball. Retrieved May 1,
2007 , from Stanford University Web site www-
econ.stanford.edu/academics/Honors_Theses/Theses_2005/Meltzer.pdf
Dinerstein, M. (2007).Free Agency And Contract Options:How Major League Baseball Teams Value
Players. Retrieved May 1, 2007 from Stanford University Web site http://www-
econ.stanford.edu/academics/Honors_Theses/Theses_2007/Dinerstein2007.pdf
Moorehand, T.(2007). Are baseball players paid too much?. Retrieved May 1, 2007 from Helium Web
site http://www.helium.com/items/154172-imagine-which-employees-could
Law, K. (2007). Desperate GM can cripple a franchise. Retrieved May 1, 2007 from ESPN Web site
http://insider.espn.go.com/mlb/hotstove06/insider/columns/story?columnist=law_keith&id=2728948&uni
vLogin02=stateChanged