Base Metals Mining: Costs, Margins & Hedging - … · Base Metals Mining: Costs, Margins & Hedging...
23
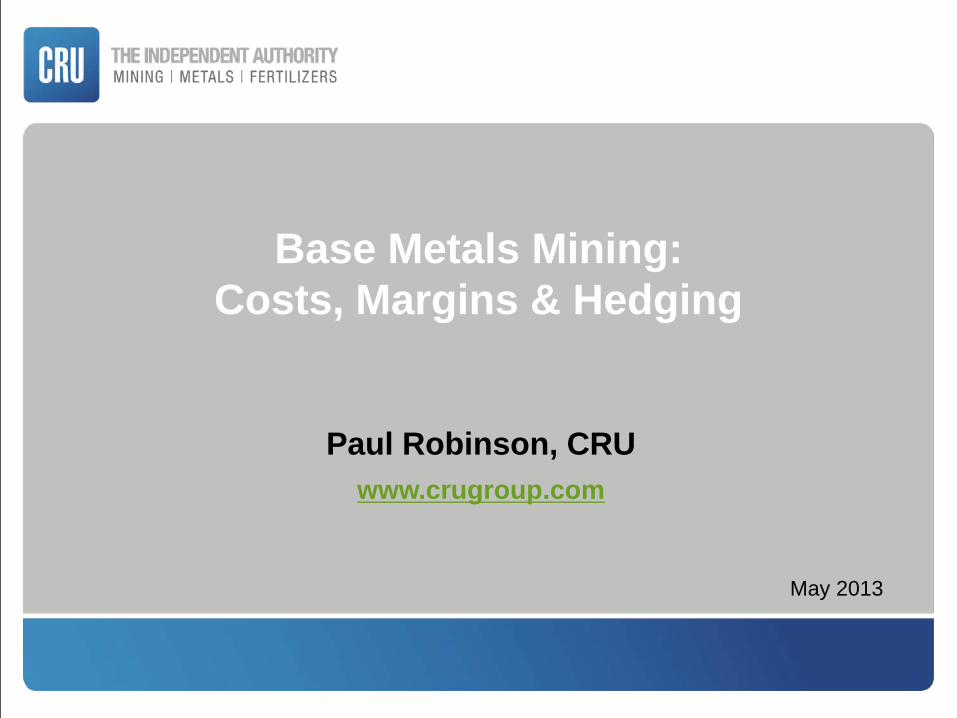
Paul Robinson, CRU www.crugroup.com Base Metals Mining: Costs, Margins & Hedging May 2013
Transcript of Base Metals Mining: Costs, Margins & Hedging - … · Base Metals Mining: Costs, Margins & Hedging...
Paul Robinson, CRU www.crugroup.com
Base Metals Mining:
Costs, Margins & Hedging
May 2013

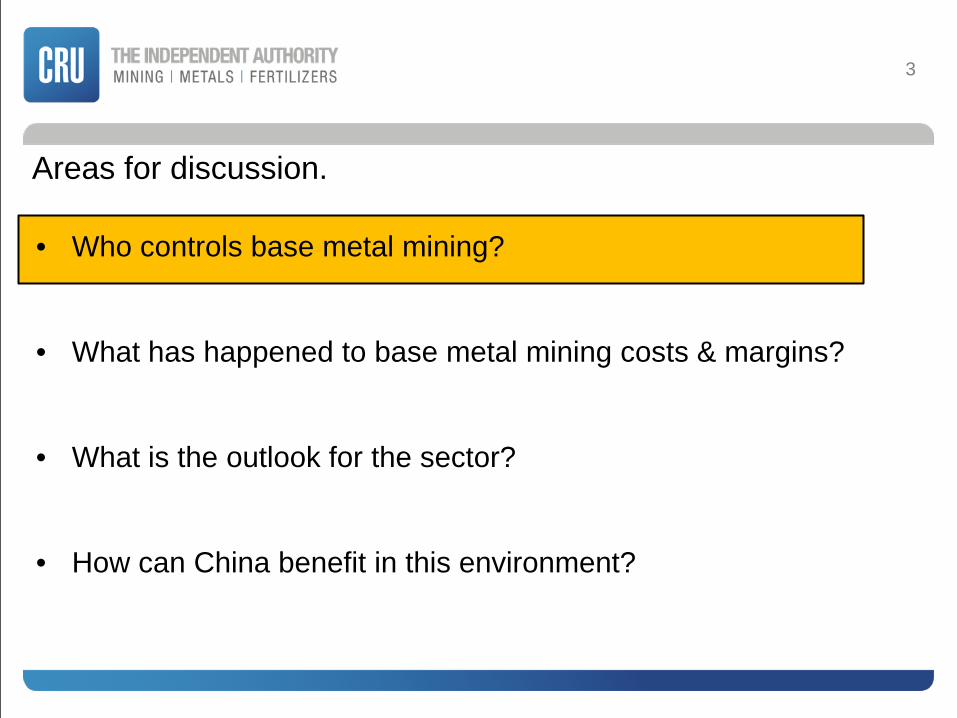
Areas for discussion.
• Who controls base metal mining?
• What has happened to base metal mining costs & margins?
• What is the outlook for the sector?
• How can China benefit in this environment?
2
Areas for discussion.
• Who controls base metal mining?
• What has happened to base metal mining costs & margins?
• What is the outlook for the sector?
• How can China benefit in this environment?
3
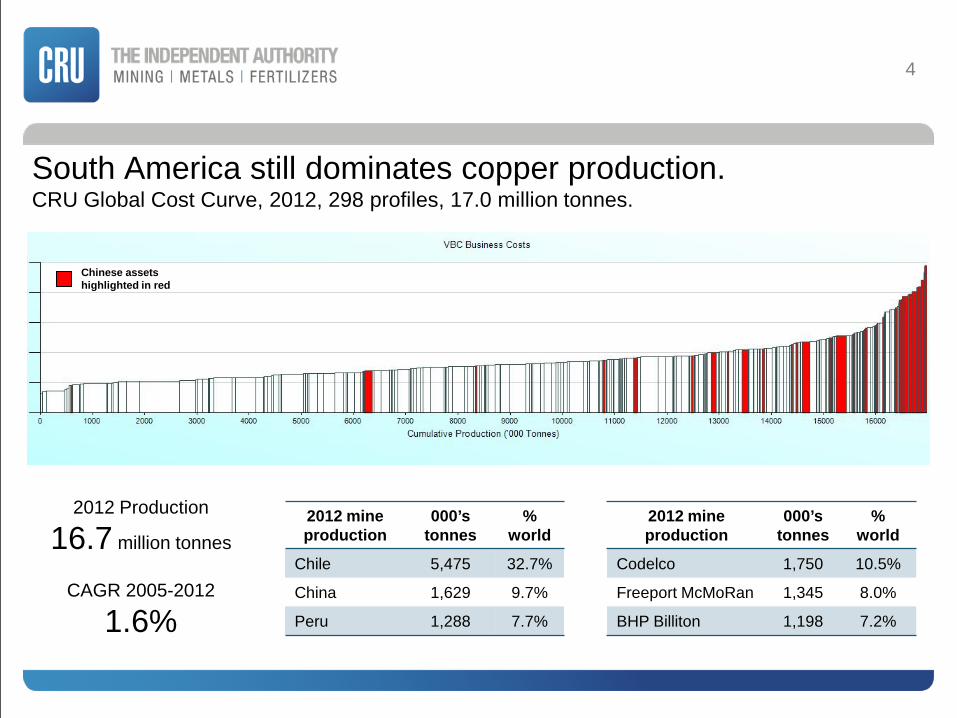
Chinese assets highlighted in red
4
South America still dominates copper production. CRU Global Cost Curve, 2012, 298 profiles, 17.0 million tonnes.
2012 Production
16.7 million tonnes
CAGR 2005-2012
1.6%
2012 mine production
000’s tonnes
% world
Codelco 1,750 10.5%
Freeport McMoRan 1,345 8.0%
BHP Billiton 1,198 7.2%
2012 mine production
000’s tonnes
% world
Chile 5,475 32.7%
China 1,629 9.7%
Peru 1,288 7.7%

Chinese assets highlighted in red
China is the world’s largest zinc miner… CRU Global Cost Curve, 2012, 146 profiles, 11.3 million tonnes.
5
2012 Production
12.3 million tonnes
CAGR 2005-2012
3.3%
2012 mine production
000’s tonnes
% world
Glencore Xstrata* 1,482 11.8%
Hindustan Zinc 1,080 8.6%
MMG 623 5.0%
2012 mine production
000’s tonnes
% world
China 4,025 32.7%
Peru 1,179 9.6%
United States 745 6.0%

Chinese assets highlighted in red
…and the world’s largest lead miner. CRU Global Cost Curve, 2012, 124 profiles, 4.3 million tonnes.
6
2012 Production
4.7 million tonnes
CAGR 2005-2012
4.1%
2012 mine production
000’s tonnes
% world
Glencore Xstrata* 325 6.9%
BHP Billiton 228 4.8%
Doe Run 206 4.3%
2012 mine production
000’s tonnes
% world
China 2,425 51.2%
Australia 610 12.9%
United States 360 7.6%

Areas for discussion.
• Who controls base metal mining?
• What has happened to base metal mining costs & margins?
• What is the outlook for the sector?
• How can China benefit in this environment?
7

-25%
0%
25%
50%
75% Copper Lead Zinc
8
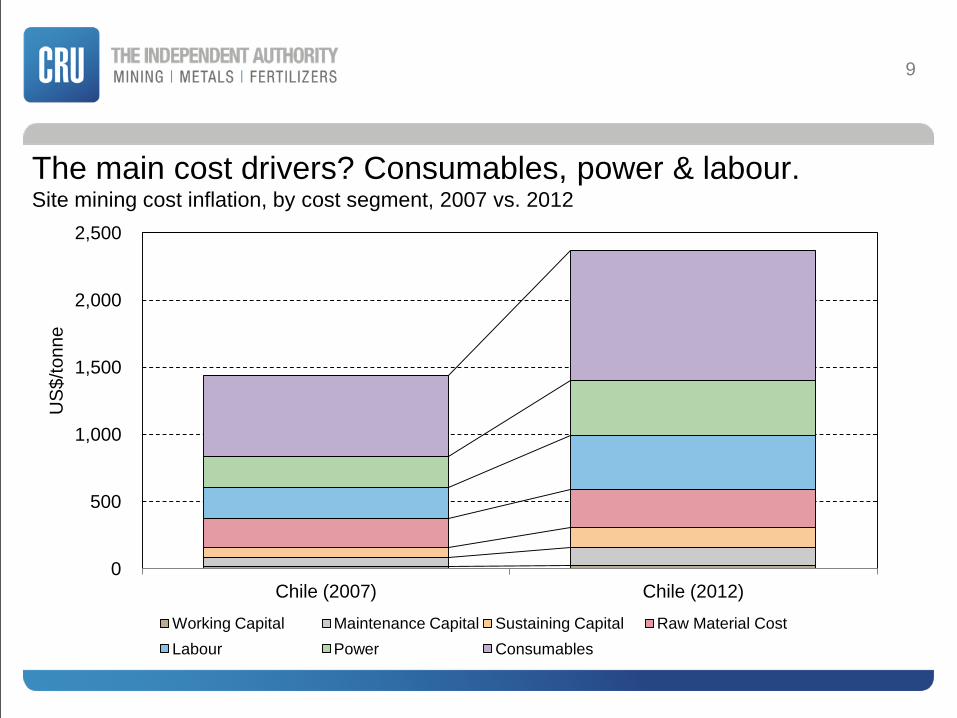
The cost of mining has increased in recent years. Site mining cost inflation, selected countries & commodities, 2007 vs. 2012
% in
crea
se 2
012
/ 200
7
0
500
1,000
1,500
2,000
2,500
Chile (2007) Chile (2012)
Working Capital Maintenance Capital Sustaining Capital Raw Material Cost Labour Power Consumables
9 U
S$/
tonn
e
The main cost drivers? Consumables, power & labour. Site mining cost inflation, by cost segment, 2007 vs. 2012

-2,000
-1,500
-1,000
-500
0 2008 2009 2010 2011 2012
Start-up delays Ore grade Strikes Technical issues Unexpected closures Govt intervention Natural hazards Other
10 00
0’s
tonn
es
Start-up delays have also increased mine costs. Unplanned losses to copper mine production during 2008-2012.
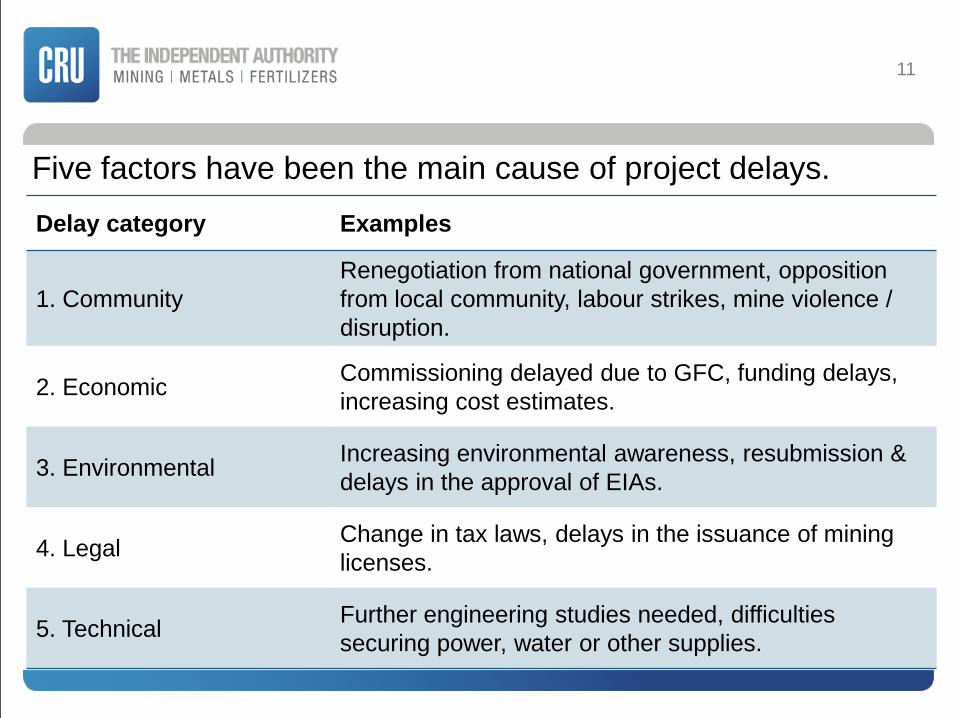
Delay category Examples
1. Community Renegotiation from national government, opposition from local community, labour strikes, mine violence / disruption.
2. Economic Commissioning delayed due to GFC, funding delays, increasing cost estimates.
3. Environmental Increasing environmental awareness, resubmission & delays in the approval of EIAs.
4. Legal Change in tax laws, delays in the issuance of mining licenses.
5. Technical Further engineering studies needed, difficulties securing power, water or other supplies.
11
Five factors have been the main cause of project delays.

0
2,000
4,000
6,000
8,000
10,000
12,000
Community delays Economic Delays Environmental delays Legal delays Technical delays
12
With ‘community challenges’ causing the greatest damage. Comparison of initial & current commissioning dates for largest 50 Cu projects.
Tonn
e ye
ars*
del
ay
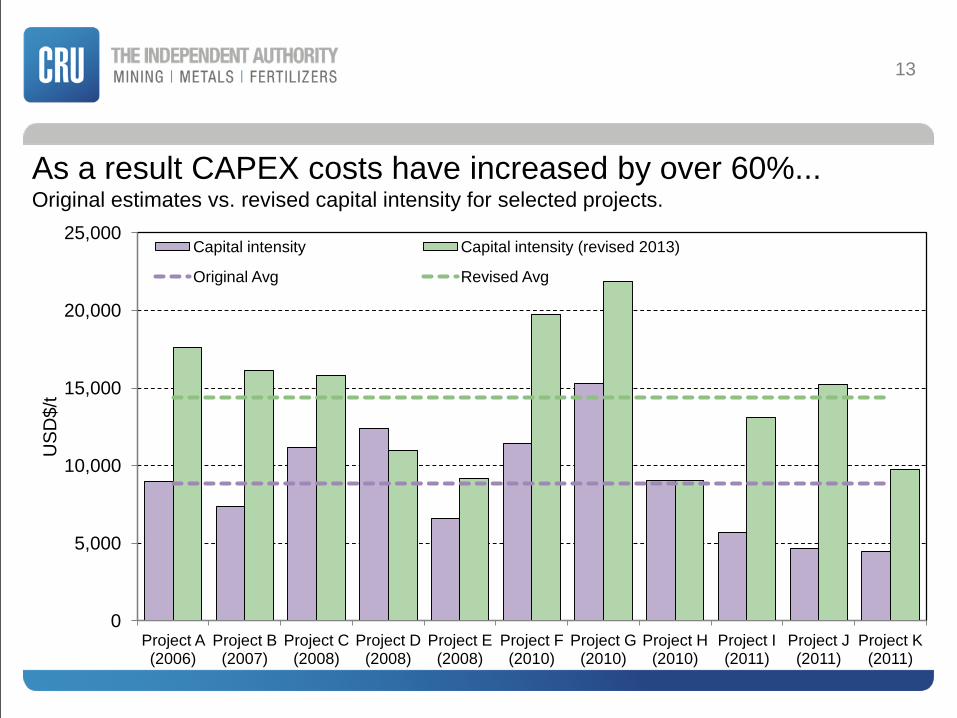
As a result CAPEX costs have increased by over 60%... Original estimates vs. revised capital intensity for selected projects.
0
5,000
10,000
15,000
20,000
25,000
Project A (2006)
Project B (2007)
Project C (2008)
Project D (2008)
Project E (2008)
Project F (2010)
Project G (2010)
Project H (2010)
Project I (2011)
Project J (2011)
Project K (2011)
US
D$/
t
Capital intensity Capital intensity (revised 2013)
Original Avg Revised Avg
13

…and OPEX and CAPEX cost escalations have hurt margins. ...and this has been compounded by recent market events.
14
We need a new captain
Areas for discussion
• Who controls base metal mining?
• What has happened to base metal mining costs & margins?
• What is the outlook for the sector?
• How can China benefit in this environment?
15

50
100
150
200
250
300
350
2004 2005 2006 2007 2008 2009 2010 2011 2012 2013 fc 2014fc 2015fc
LME
Pric
e In
dex
2004
Cos
t = 1
00
Copper Zinc Lead Aluminium Nickel
CRU expects market prices to remain flat… LME metal price forecast index to 2004 annual average.
16

0.4%
0.5%
0.6%
0.7%
0.8%
0.9%
1.0%
2002 2004 2006 2008 2010 2012 2014 2016 2018 2020
Milling ore grade Leaching ore grade
17 %
Cop
per
…and ore grades to continue to fall, increasing costs. Average global copper grades of milling ore and leaching ore; % Cu; 2002-2012.

• Miners do not have the tools to effectively hedge volume & price.
• Hedging output when input costs are unknown can lock in losses.
• Hedging can tie up a lot of cash through margins & guarantees.
• Shareholders are fickle on this issue.
Expect lots of talk, limited action, some option buying.
18
Hedging is a topical subject but there will be limited activity.

11%
8%
8%
7%
6%
5% 4% 4%
47%
Codelco Rio Tinto BHP Billiton Glencore Xstrata Anglo American Southern Copper Antofagasta Teck Others
Total potential production capacity = 15.9Mt/y
Projects will continue to be controlled by the majors… Ownership of CRU’s 91 selected copper projects (‘000t/y Cu).
19

…and the new captains suggest investments will slow.
• “capital and exploration expenditure
for the 2014 financial year will decline significantly” (BHP Billiton CEO, Andrew Mackenzie, May 2013)
• “...invest only in projects that deliver returns well above our cost of capital” (Rio Tinto CEO, Sam Walsh, May 2013)
• “They built, they didn’t get the returns for their shareholders. It’s time to stop building.” (Glencore International CEO, Ivan Glasenberg, Feb 2013)
20

Conclusions.
• Who controls base metal mining?
China is self reliant in lead, needs some zinc imports and is very dependant on others for copper.
• What has happened to base metal mining costs & margins?
Costs have increased, projects are delayed, margins have suffered.
• What is the outlook for base metals mining?
Flat revenues, higher operating costs, lower margins. Further project delays, and fewer mining investments.
21

How can China benefit in this environment?
1. Determine the volume of global projects needed to meet Chinese economic growth targets. Shortfalls will damage China the most.
2. Invest in mining engineers and learn how to mine more efficiently than international miners. Or seek international partners.
3. Find international companies who are seeking Chinese partners.
4. Negotiate with international companies looking for a new owner or to divest assets.
5. Prioritise countries that offer partnership and want Chinese mining FDI.
22
Thank you for your attention.
Director Multi Commodity Projects CRU London Tel: +44 20 7903 2221 [email protected]
Paul Robinson
23
Manager-China Nonferrous Metals CRU International Beijing Representative Office 517, Tower 2 Bright China Chang an Building Tel: +86 10 6510 2183 [email protected]
Wan Ling
谢谢