BART exemption summary report for PCS Nitrogen 10 13 EXEMPTION MODELING SUMMARY REPORT FOR PCS...
25
BART EXEMPTION MODELING SUMMARY REPORT FOR PCS Nitrogen AUGUSTA, GEORGIA Submitted to: GEORGIA ENVIRONMENTAL PROTECTION DIVISION Prepared for: Prepared by: MACTEC Engineering and Consulting, Inc. Kennesaw, Georgia Project No. 6306-06-0034 October 2006
Transcript of BART exemption summary report for PCS Nitrogen 10 13 EXEMPTION MODELING SUMMARY REPORT FOR PCS...

BART EXEMPTION MODELING SUMMARY REPORT FOR
PCS Nitrogen
AUGUSTA, GEORGIA
Submitted to:
GEORGIA ENVIRONMENTAL PROTECTION DIVISION
Prepared for:
Prepared by:
MACTEC Engineering and Consulting, Inc.
Kennesaw, Georgia
Project No. 6306-06-0034
October 2006
BART Exemption Summary Report October, 2006
PCS Nitrogen. – Augusta, GA
MACTEC Project No. 6306-06-0034
Source-Specific Modeling Protocol Summary Report ii
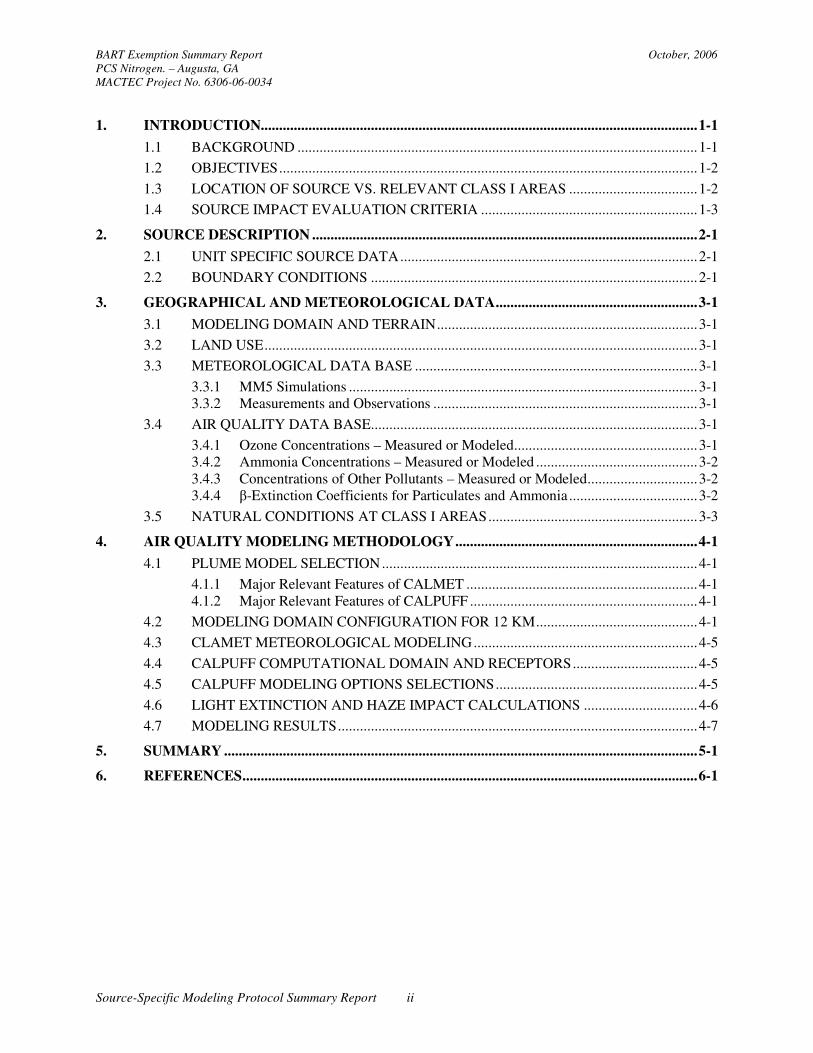
1. INTRODUCTION.......................................................................................................................1-1
1.1 BACKGROUND .............................................................................................................1-1
1.2 OBJECTIVES..................................................................................................................1-2
1.3 LOCATION OF SOURCE VS. RELEVANT CLASS I AREAS ...................................1-2
1.4 SOURCE IMPACT EVALUATION CRITERIA ...........................................................1-3
2. SOURCE DESCRIPTION .........................................................................................................2-1
2.1 UNIT SPECIFIC SOURCE DATA.................................................................................2-1
2.2 BOUNDARY CONDITIONS .........................................................................................2-1
3. GEOGRAPHICAL AND METEOROLOGICAL DATA.......................................................3-1
3.1 MODELING DOMAIN AND TERRAIN.......................................................................3-1
3.2 LAND USE......................................................................................................................3-1
3.3 METEOROLOGICAL DATA BASE .............................................................................3-1
3.3.1 MM5 Simulations ...............................................................................................3-1 3.3.2 Measurements and Observations ........................................................................3-1
3.4 AIR QUALITY DATA BASE.........................................................................................3-1
3.4.1 Ozone Concentrations – Measured or Modeled..................................................3-1 3.4.2 Ammonia Concentrations – Measured or Modeled ............................................3-2 3.4.3 Concentrations of Other Pollutants – Measured or Modeled..............................3-2 3.4.4 β-Extinction Coefficients for Particulates and Ammonia...................................3-2
3.5 NATURAL CONDITIONS AT CLASS I AREAS.........................................................3-3
4. AIR QUALITY MODELING METHODOLOGY..................................................................4-1
4.1 PLUME MODEL SELECTION......................................................................................4-1
4.1.1 Major Relevant Features of CALMET ...............................................................4-1 4.1.2 Major Relevant Features of CALPUFF ..............................................................4-1
4.2 MODELING DOMAIN CONFIGURATION FOR 12 KM............................................4-1
4.3 CLAMET METEOROLOGICAL MODELING.............................................................4-5
4.4 CALPUFF COMPUTATIONAL DOMAIN AND RECEPTORS..................................4-5
4.5 CALPUFF MODELING OPTIONS SELECTIONS.......................................................4-5
4.6 LIGHT EXTINCTION AND HAZE IMPACT CALCULATIONS ...............................4-6
4.7 MODELING RESULTS..................................................................................................4-7
5. SUMMARY .................................................................................................................................5-1
6. REFERENCES............................................................................................................................6-1
BART Exemption Summary Report October, 2006
PCS Nitrogen. – Augusta, GA
MACTEC Project No. 6306-06-0034
Source-Specific Modeling Protocol Summary Report iii
LIST OF TABLES
Table 1: PCS Location and Distance to Class I Areas ..............................................................................1-3
Table 2: PCS Modeled Stack Parameters and emissions rates ..................................................................2-2
Table 3: Relative Humidity Factor Data ...................................................................................................4-1
Table 4: Modeling Domain Coordinates for 12 Km grid..........................................................................4-1
Table 5: Modeling Domain Coordinates for 4 Km grid............................................................................4-2
Table 6: Modeling Results for 12 Km grid…………………………………………………………… 4-5
Table 7: Modeling Results for 4 Km grid…………………………………………………………….. 4-6
LIST OF FIGURES
Figure 1 PCS Location and Corresponding Class I areas
Figures 2a & 2b: Modeling Domains
EXIBIT A
Exhibit A: CD diskette of model runs
BART Exemption Summary Report October, 2006
PCS Nitrogen. – Augusta, GA
MACTEC Project No. 6306-06-0034
Source-Specific Modeling Protocol Summary Report 1-1
1. INTRODUCTION
MACTEC Engineering and Consulting, Inc. (MACTEC) is submitting the following Best Available
Retrofit Technology (BART) Exemption Modeling summary report on behalf of the PCS Nitrogen Inc.
(PCS) located in Augusta, Georgia. This summary report demonstrates that the PCS facility can be
excluded from any additional assessment under the BART rule since modeling demonstrates that the
facilities emissions have an insignificant impact on all surrounding Class I areas.
1.1 BACKGROUND
BART represents EPA’s first regulatory step towards eliminating any visible impairments from industrial
sources of pollutions by the year 2064. It is aimed at reducing emissions from old “grandfathered”
sources of emissions of pollutants that impact visibility. There are three criteria to determine if a source
is part of the BART group of sources:
1. Is a source within the 26 listed industrial categories?
2. Was the source constructed within the time frame of August 1962 to August 1977?
3. Does the source emit more than 250 TPY of any visual impairment pollutant?
It is that select group that EPA has decided to focus attention on. Of that select group if modeling shows
that the facility does not have a significant impact on a Class I area (meaning less than 0.5 deciview
change in visibility on a Class I area receptor) then the unit need not go through the BART process.
Otherwise a BART assessment must be completed which must look at adding controls to reduce
emissions and evaluate their overall impact on the Class I area(s). The conclusion of a BART analysis is
an optimum solution of controls versus impact and the implementation of this solution written into the
state regulations by Dec 2007. In PCS’s case, for the most part the entire facility qualifies under all three
criteria, and all emission sources must be evaluated.
BART Exemption Summary Report October, 2006
PCS Nitrogen. – Augusta, GA
MACTEC Project No. 6306-06-0034
Source-Specific Modeling Protocol Summary Report 1-2
1.2 OBJECTIVES
Once a particular source and emission unit is determined to be BART eligible the first step is to determine
whether a BART-eligible source can be excluded from BART controls by demonstrating that the source
cannot be reasonably expected to cause or contribute to visibility impairment in a Class I area. The
preferred approach is an assessment with an air quality model such as CALPUFF or other appropriate
model followed by comparison of the estimated 24-hr visibility impacts against a threshold above
estimated natural conditions to be determined by the States. The threshold to determine whether a single
source “causes” visibility impairment is set at 1.0 deciview change from natural conditions over a 24-hour
averaging period in the final BART rule (70 FR 39118). The guidance also states that the proposed
threshold at which a source may “contribute” to visibility impairment should not be higher than 0.5
deciviews (perhaps lower for some particular Class I area). EPA recommends that the 98th percentile
value from the modeling be compared to the contribution threshold of 0.5 deciviews to determine if a
source does not contribute to visibility impairment, and therefore is not subject to BART. Whether or not
the 98th percentile value exceeds the threshold must be determined at each Class I area. Over an annual
period, this implies the 8th highest 24-hr value at a particular Class I area is compared to the contribution
threshold. Over a 3-year modeling period, the 98th percentile value may be interpreted as the highest of
the three annual 98th percentile values at a particular Class I area or the 22nd highest value in the
combined three year record, whichever is more conservative. The objective of this modeling summary
report is to demonstrate that the PCS site located in August, Georgia does not contribute to visibility
impairment in any Class I area and further assessment under BART is not required.
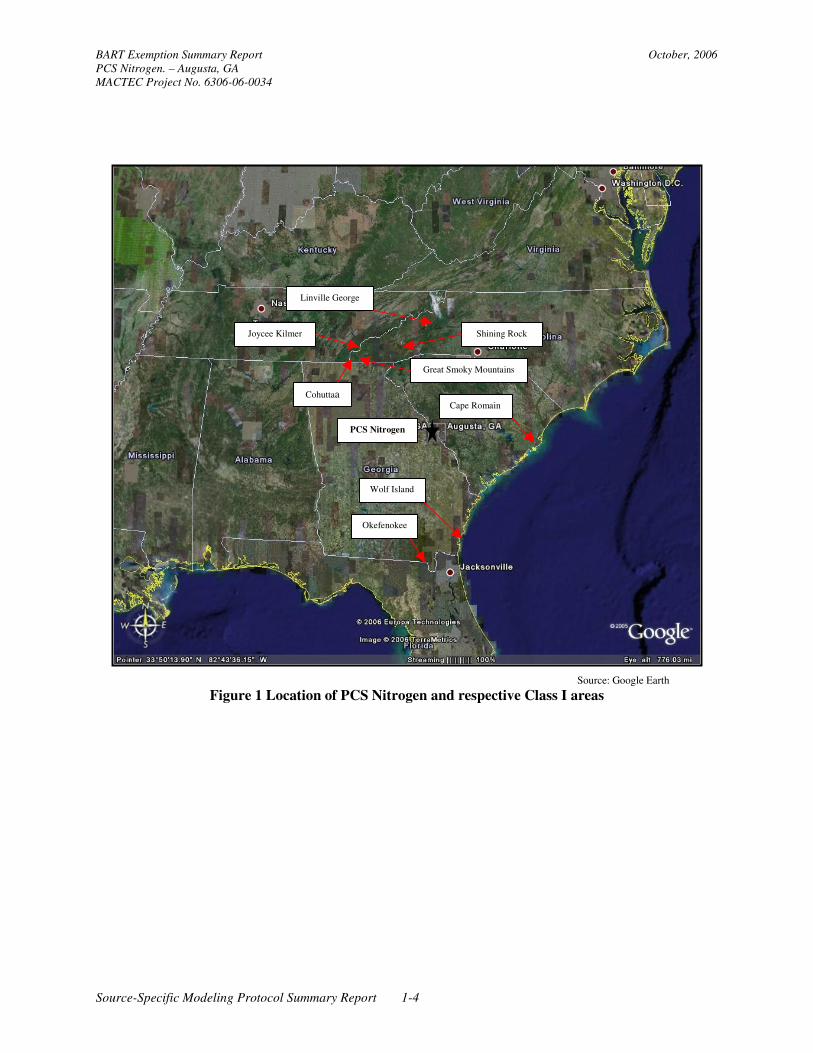
1.3 LOCATION OF SOURCE VS. RELEVANT CLASS I AREAS
Table 1 below provides the location of the PCS facility and the Class I areas near the site. The distance
from PCS to the nearby class I areas was determined by calculating the distance from the modeled stack
at the site to each of the receptor locations, which represent the Class I area boundary. These boundary
receptors (taken from the National Park Service website) were used to determine the shortest distance
between the PCS Nitrogen site to the nearby Class I areas. As shown in Table 1, and Figure 1, PCS site is
within 300 km of eight Class I areas. All eight Class I areas were evaluated as part of the exemption
modeling.

BART Exemption Summary Report October, 2006
PCS Nitrogen. – Augusta, GA
MACTEC Project No. 6306-06-0034
Source-Specific Modeling Protocol Summary Report 1-3
Table 1: PCS Location and Distance to Class I Areas
Site/ Class I Area
LCC
(Easting) –
km
LCC (Northing)
– km
Shortest Distance to
Flomaton (km)
PCS 1390.6 -610.4 --
Cape Romain 1610.2 -627.0 220
Cohutta 1131.5 -484.1 288
Wolf Island 1485.8 -828.1 238
Great Smokey Mountains 1241.2 -400.0 258
Joyce Kilmer - Slickrock 1177.1 -429.2 280
Shining Rock Wilderness 1276.4 -416.0 225
Okeefenokee 1401.4 -877.3 267
Linville Gorge 1349.5 -350.9 263
1.4 SOURCE IMPACT EVALUATION CRITERIA
The maximum 24 hour results from the CALPOST model for each modeled year using a 12 km
meteorological grid spacing were compared to the 0.5 deciview (DV) significant impact level. If the
results of this CALPOST analysis show that the impact is below this level, then the site qualifies as an
exempted source and no additional evaluation is needed. If this criteria is not meet, then the model is
rerun using a finer meteorological grid spacing (4 km) and the 98th percentile result for each year is
compared to the 0.5 dv value. For this assessment, the 98th percentile level is the 8
th highest deciview
value of all receptors. If this second criteria is meet, then the facility is determined to be an exempted
source, otherwise a full BART analysis is required.
BART Exemption Summary Report October, 2006
PCS Nitrogen. – Augusta, GA
MACTEC Project No. 6306-06-0034
Source-Specific Modeling Protocol Summary Report 1-4
Source: Google Earth
Figure 1 Location of PCS Nitrogen and respective Class I areas
PCS Nitrogen
Okefenokee
Wolf Island
Cape Romain
Cohuttaa
Joycee Kilmer
Linville George
Shining Rock
Great Smoky Mountains
BART Exemption Summary Report October, 2006
PCS Nitrogen. – Augusta, GA
MACTEC Project No. 6306-06-0034
Source-Specific Modeling Protocol Summary Report 2-1
2. SOURCE DESCRIPTION
PCS owns and operates a nitrogenous fertilizer manufacturing facility in Augusta, Georgia. The plant
produces ammonia, nitric acid, urea, carbon dioxide, ammonium nitrate, and urea-ammonium nitrate
solutions. In the ammonia plant, natural gas is reformed and mixed with atmospheric air to form
ammonia in a series of reaction steps. The plant operates two nitric acid plants, which combust the
ammonia in the presence of air to form NOx, which is routed through absorption columns to form nitric
acid. Ammonium nitrate is formed at the plant by mixing gaseous ammonia with nitric acid. The
neutralized solution is then concentrated in prill towers to form a solid. The plant also operates a Urea
production facility which combines carbon dioxide (produced from the ammonia plant) with ammonia to
form urea. The urea is then concentrated in a Prill Tower. The ammonia plant, nitric acid plants,
ammonium nitrate operations, and urea plant were built between the eligibility dates of August 1962 to
August 1977; the processes are on the list of 26 listed processes (chemical plants); and the units have the
potential NOx emissions greater than 250 tpy. All these units are therefore BART eligible. The boilers
on site were not built during the BART eligibility dates, however, they are in place to support the
chemical plant operations (in terms of supplying steam), therefore they are conservatively included as
BART eligible sources to be modeled even though some interpretations state that just supplying steam is
not considered supporting the operation.
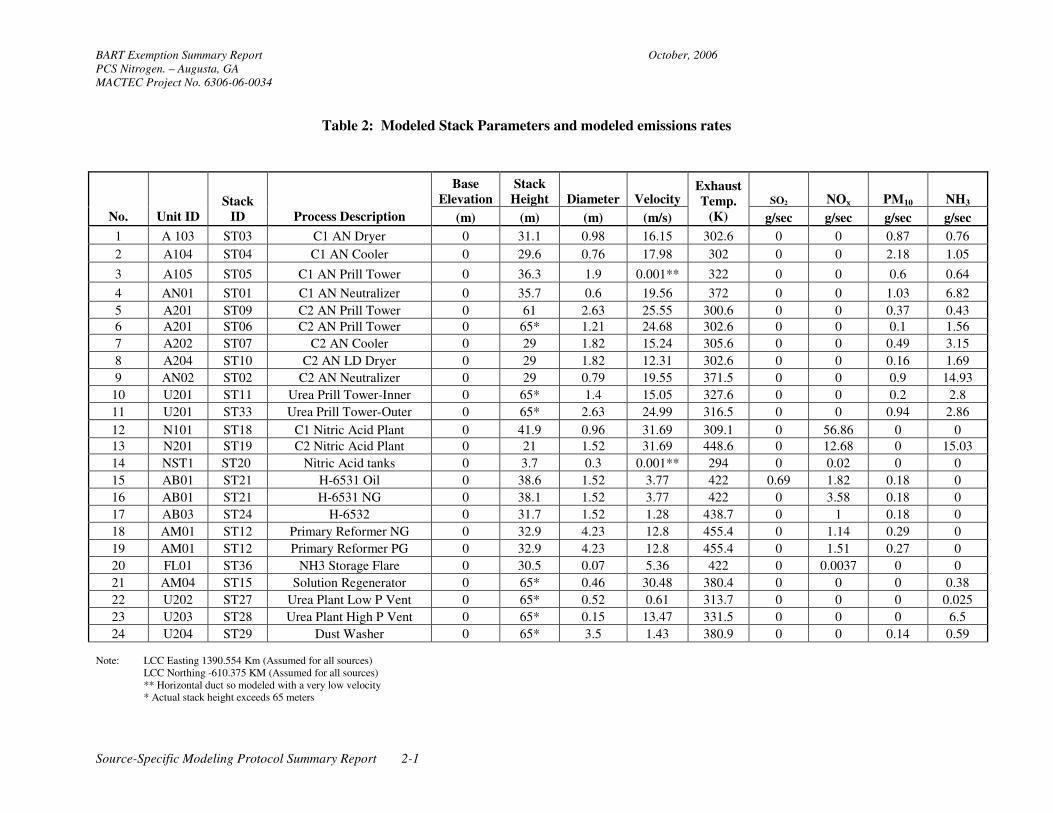
2.1 UNIT SPECIFIC SOURCE DATA
The exemption modeling used the stacks parameters for the PCS plant as summarized in Table 2. The
stack exhaust gas velocities and exhaust temperatures are based on results from recent stack tests
conducted on the individual stacks. The modeled emission rates were based on emission factors that were
derived from either stack testing or preferably CEM data multiplied by the maximum production day that
occurred for the particular process unit during the study period. Where neither stack data nor CEM data
was available engineering judgment was used to generate an emission limit that corresponded to the
expected maximum emission rate.
BART Exemption Summary Report October, 2006
PCS Nitrogen. – Augusta, GA
MACTEC Project No. 6306-06-0034
Source-Specific Modeling Protocol Summary Report 2-1
Table 2: Modeled Stack Parameters and modeled emissions rates
Base
Elevation
Stack
Height Diameter Velocity SO2 NOx PM10 NH3
No. Unit ID
Stack
ID Process Description (m) (m) (m) (m/s)
Exhaust
Temp.
(K) g/sec g/sec g/sec g/sec
1 A 103 ST03 C1 AN Dryer 0 31.1 0.98 16.15 302.6 0 0 0.87 0.76
2 A104 ST04 C1 AN Cooler 0 29.6 0.76 17.98 302 0 0 2.18 1.05
3 A105 ST05 C1 AN Prill Tower 0 36.3 1.9 0.001** 322 0 0 0.6 0.64
4 AN01 ST01 C1 AN Neutralizer 0 35.7 0.6 19.56 372 0 0 1.03 6.82
5 A201 ST09 C2 AN Prill Tower 0 61 2.63 25.55 300.6 0 0 0.37 0.43
6 A201 ST06 C2 AN Prill Tower 0 65* 1.21 24.68 302.6 0 0 0.1 1.56
7 A202 ST07 C2 AN Cooler 0 29 1.82 15.24 305.6 0 0 0.49 3.15
8 A204 ST10 C2 AN LD Dryer 0 29 1.82 12.31 302.6 0 0 0.16 1.69
9 AN02 ST02 C2 AN Neutralizer 0 29 0.79 19.55 371.5 0 0 0.9 14.93
10 U201 ST11 Urea Prill Tower-Inner 0 65* 1.4 15.05 327.6 0 0 0.2 2.8
11 U201 ST33 Urea Prill Tower-Outer 0 65* 2.63 24.99 316.5 0 0 0.94 2.86
12 N101 ST18 C1 Nitric Acid Plant 0 41.9 0.96 31.69 309.1 0 56.86 0 0
13 N201 ST19 C2 Nitric Acid Plant 0 21 1.52 31.69 448.6 0 12.68 0 15.03
14 NST1 ST20 Nitric Acid tanks 0 3.7 0.3 0.001** 294 0 0.02 0 0
15 AB01 ST21 H-6531 Oil 0 38.6 1.52 3.77 422 0.69 1.82 0.18 0
16 AB01 ST21 H-6531 NG 0 38.1 1.52 3.77 422 0 3.58 0.18 0
17 AB03 ST24 H-6532 0 31.7 1.52 1.28 438.7 0 1 0.18 0
18 AM01 ST12 Primary Reformer NG 0 32.9 4.23 12.8 455.4 0 1.14 0.29 0
19 AM01 ST12 Primary Reformer PG 0 32.9 4.23 12.8 455.4 0 1.51 0.27 0
20 FL01 ST36 NH3 Storage Flare 0 30.5 0.07 5.36 422 0 0.0037 0 0
21 AM04 ST15 Solution Regenerator 0 65* 0.46 30.48 380.4 0 0 0 0.38
22 U202 ST27 Urea Plant Low P Vent 0 65* 0.52 0.61 313.7 0 0 0 0.025
23 U203 ST28 Urea Plant High P Vent 0 65* 0.15 13.47 331.5 0 0 0 6.5
24 U204 ST29 Dust Washer 0 65* 3.5 1.43 380.9 0 0 0.14 0.59
Note: LCC Easting 1390.554 Km (Assumed for all sources)
LCC Northing -610.375 KM (Assumed for all sources)
** Horizontal duct so modeled with a very low velocity
* Actual stack height exceeds 65 meters
BART Exemption Summary Report October, 2006
PCS Nitrogen. – Augusta, GA
MACTEC Project No. 6306-06-0034
Source-Specific Modeling Protocol Summary Report 2-2
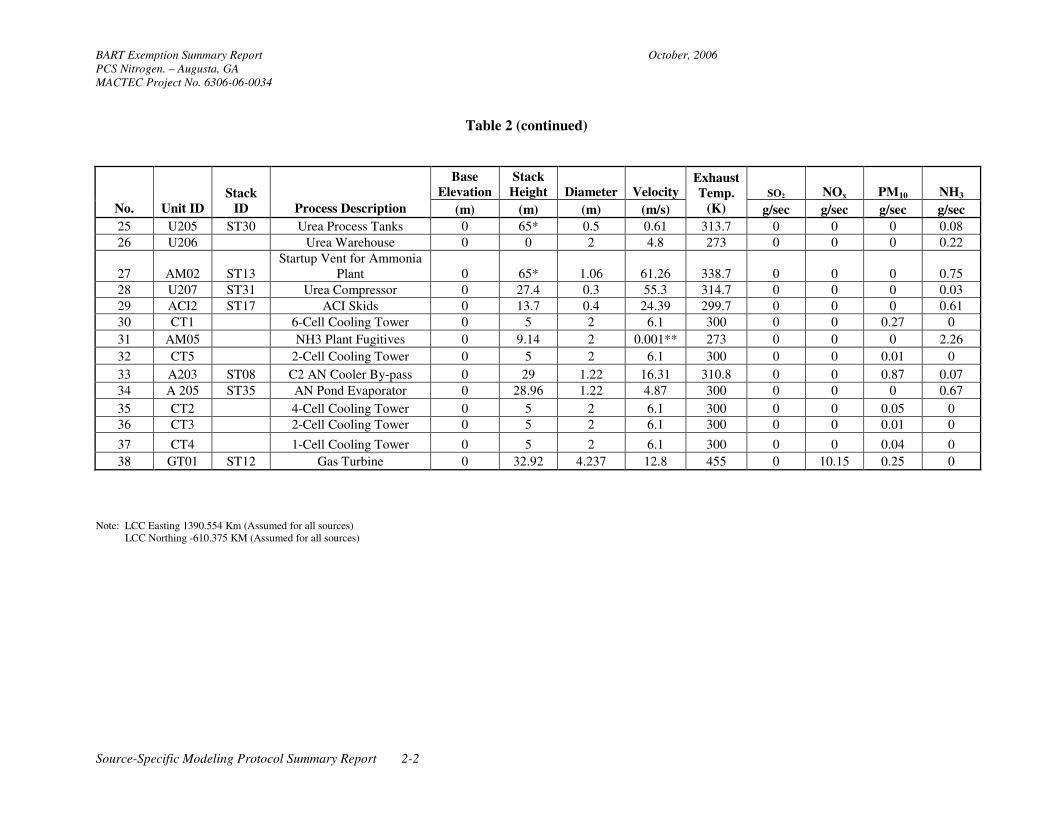
Table 2 (continued)
Base
Elevation
Stack
Height Diameter Velocity SO2 NOx PM10 NH3
No. Unit ID
Stack
ID Process Description (m) (m) (m) (m/s)
Exhaust
Temp.
(K) g/sec g/sec g/sec g/sec
25 U205 ST30 Urea Process Tanks 0 65* 0.5 0.61 313.7 0 0 0 0.08
26 U206 Urea Warehouse 0 0 2 4.8 273 0 0 0 0.22
27 AM02 ST13
Startup Vent for Ammonia
Plant 0 65* 1.06 61.26 338.7 0 0 0 0.75
28 U207 ST31 Urea Compressor 0 27.4 0.3 55.3 314.7 0 0 0 0.03
29 ACI2 ST17 ACI Skids 0 13.7 0.4 24.39 299.7 0 0 0 0.61
30 CT1 6-Cell Cooling Tower 0 5 2 6.1 300 0 0 0.27 0
31 AM05 NH3 Plant Fugitives 0 9.14 2 0.001** 273 0 0 0 2.26
32 CT5 2-Cell Cooling Tower 0 5 2 6.1 300 0 0 0.01 0
33 A203 ST08 C2 AN Cooler By-pass 0 29 1.22 16.31 310.8 0 0 0.87 0.07
34 A 205 ST35 AN Pond Evaporator 0 28.96 1.22 4.87 300 0 0 0 0.67
35 CT2 4-Cell Cooling Tower 0 5 2 6.1 300 0 0 0.05 0
36 CT3 2-Cell Cooling Tower 0 5 2 6.1 300 0 0 0.01 0
37 CT4 1-Cell Cooling Tower 0 5 2 6.1 300 0 0 0.04 0
38 GT01 ST12 Gas Turbine 0 32.92 4.237 12.8 455 0 10.15 0.25 0
Note: LCC Easting 1390.554 Km (Assumed for all sources)
LCC Northing -610.375 KM (Assumed for all sources)
BART Exemption Summary Report October, 2006
PCS Nitrogen. – Augusta, GA
MACTEC Project No. 6306-06-0034
Source-Specific Modeling Protocol Summary Report 2-1
As per the common VISTAS modeling protocol (page 42), the modeling evaluation did not included
building downwash, because all Class 1 areas being evaluated are greater than 50 km away from the site.
The following stacks have actual stack heights that exceed 65 meters and were installed after 1970:
• ST09
• ST11
• ST33
• ST15
• ST27
• ST28
• ST29
• ST30
• ST13
Therefore in the modeling these stacks were given the height 65 meters rather than the true height (as
shown in the table) which exceeded the allowable GEP height according to 40 CFR 51.100.
2.2 BOUNDARY CONDITIONS
Model options and switches were used as set in the example models as provided on the Earth Tech
website (www.src.com).
BART Exemption Summary Report October, 2006
PCS Nitrogen. – Augusta, GA
MACTEC Project No. 6306-06-0034
Source-Specific Modeling Protocol Summary Report 3-1
3. GEOGRAPHICAL AND METEOROLOGICAL DATA
3.1 MODELING DOMAIN AND TERRAIN
The modeling data to be utilized for the modeling evaluation is the CALMET data provided by VISTAS
via Georgia EPD. The modeling domain consists of the area which includes the site, all eight class 1
areas being evaluated, with an additional 50 km buffer around this area. The area around the site is
primarily flat terrain.
3.2 LAND USE
The area around the site is rural and is primarily agricultural land use.
3.3 METEOROLOGICAL DATA BASE
All the met data used was provided by the VISTAS.
3.3.1 MM5 Simulations
As provided by VISTAS.
3.3.2 Measurements and Observations
None.
3.4 AIR QUALITY DATA BASE
3.4.1 Ozone Concentrations – Measured or Modeled
The ozone concentrations were modeled using the three years of ozone data as provided by Earth Tech on
their website (http://www.src.com/verio/download/download.htm ). The OZONE.DAT file used in each
year of the model runs was extracted from the corresponding year data taken from the Earth Tech website.
The CALPRO GUI was used to extract the data by providing the domain being used for the CALPUFF
model.
BART Exemption Summary Report October, 2006
PCS Nitrogen. – Augusta, GA
MACTEC Project No. 6306-06-0034
Source-Specific Modeling Protocol Summary Report 3-2
3.4.2 Ammonia Concentrations – Measured or Modeled
As noted in the VISTAS common protocol (page 42) a constant ammonia background concentration of
0.5 ppb was used for the CALPUFF modeling. For modeling ammonia emissions from the plant, physical
properties of ammonia inserted in the model were taken from University of South Florida professor Dr.
Noreen Poor, who provided the following data which we have confirmed as being representative:
Diffusivity - (cm^2/s) = 0.234,
Alpha Star=176,
Reactivity =30,
Mesophyll Resistance. =0 s/cm,
Henry’s Law =7.20 x 10⁻⁴,
Wet (liquid) scavenging coefficient (1/s) = 7 x 10⁻⁴
These are dry and wet deposition parameters of which only the wet deposition values were used.
3.4.3 Concentrations of Other Pollutants – Measured or Modeled
Per the “Federal Land Managers’ Air Quality Related Values Workgroup (FLAG) Phase I report
(December 2000)” the background SO4 concentration (BKSO4) was calculated based on the reported
hygroscopic value for each of the Class I areas divided by 3. The hygroscopic value for all of the Class I
areas being studied is 0.9 (taken from the FLAG document), therefore a 0.3 value was used for the
BKSO4 variable for all months. The soil background (BKSOIL) concentration was set to the
non-hygroscopic value as set by the FLAG document. This value is 8.5 for all eight of the Class 1 areas.
3.4.4 β-Extinction Coefficients for Particulates and Ammonia
The modeling was completed using two worst case assumptions. First, it was assumed that all the
particulate emitted from the facility is fine particulate which has a β extinction coefficient of 1.0 (versus
0.6 for larger particulate). Second, it was assumed that all the ammonia emitted from the facility that is
transported to the Class I area is converted into either ammonium sulfate or nitrate. To accomplish this in
the ammonia species was given in CALPOST run was given a β extension coefficient equivalent to those
compounds of 3.0 which is the second worst case assumption.

BART Exemption Summary Report October, 2006
PCS Nitrogen. – Augusta, GA
MACTEC Project No. 6306-06-0034
Source-Specific Modeling Protocol Summary Report 3-3
Month Cape Romain Cohutta Wolf Island
Great Smokey
Mountains Joyce Kilmer
Shining Rock
Wilderness Okefenokee Linville Gorge
January 2.9 3 3.1 3 3 2.9 3.2 2.9
February 2.9 3 3.1 3 3 2.9 3.2 2.9
March 3.3 3.1 3.3 3.1 3.1 3.1 3.4 3.1
April 3.3 3.1 3.3 3.1 3.1 3.1 3.4 3.1
May 3.3 3.1 3.3 3.1 3.1 3.1 3.4 3.1
June 3.9 3.6 3.9 3.6 3.6 3.7 3.9 3.7
July 3.9 3.6 3.9 3.6 3.6 3.7 3.9 3.7
August 3.9 3.6 3.9 3.6 3.6 3.7 3.9 3.7
September 3.3 3.3 3.6 3.2 3.2 3.2 3.6 3.1
October 3.3 3.3 3.6 3.2 3.2 3.2 3.6 3.1
November 3.3 3.3 3.6 3.2 3.2 3.2 3.6 3.1
December 2.9 3 3.1 3 3 2.9 3.2 2.9
3.5 NATURAL CONDITIONS AT CLASS I AREAS
The relative humidity used for each Class I area being modeled was based on data taken from the FLAG
document. Table 3 below provides the monthly relative humidity that was used for each of the eight
Class I areas.
Table 3: Relative Humidity Factor Data
BART Exemption Summary Report October, 2006
PCS Nitrogen. – Augusta, GA
MACTEC Project No. 6306-06-0034
Source-Specific Modeling Protocol Summary Report 4-1
4. AIR QUALITY MODELING METHODOLOGY
4.1 PLUME MODEL SELECTION
The modeling was completed using the VISTAS recommended CALPUFF version 5.754 for BART
modeling as posted on the Earth Tech website. The modeling was completed using the 12-km and 4-Km
meteorological data files provided by VISTAS (via Georgia EPD). The sample CALPUFF model and
CALPOSTL input files posted on the Earth Tech website was used for the modeling assessment.
4.1.1 Major Relevant Features of CALMET
CALMET was not run for this application as all met data has been provided by VISTAS. VISTAS
supplied met data was generated using CALMET version 5.7.
4.1.2 Major Relevant Features of CALPUFF
The modeling utilized the MESOPUFF II module for chemical mechanism portion of the model. The
integrated puff sampling methodology options were chosen. For running the CALPOST processor, the
visibility Method 6 option was used using the monthly relative humidity values identified above. The
species considered in the visibility analysis included SO4, NO3, EC, SOA, soil, and coarse PM.
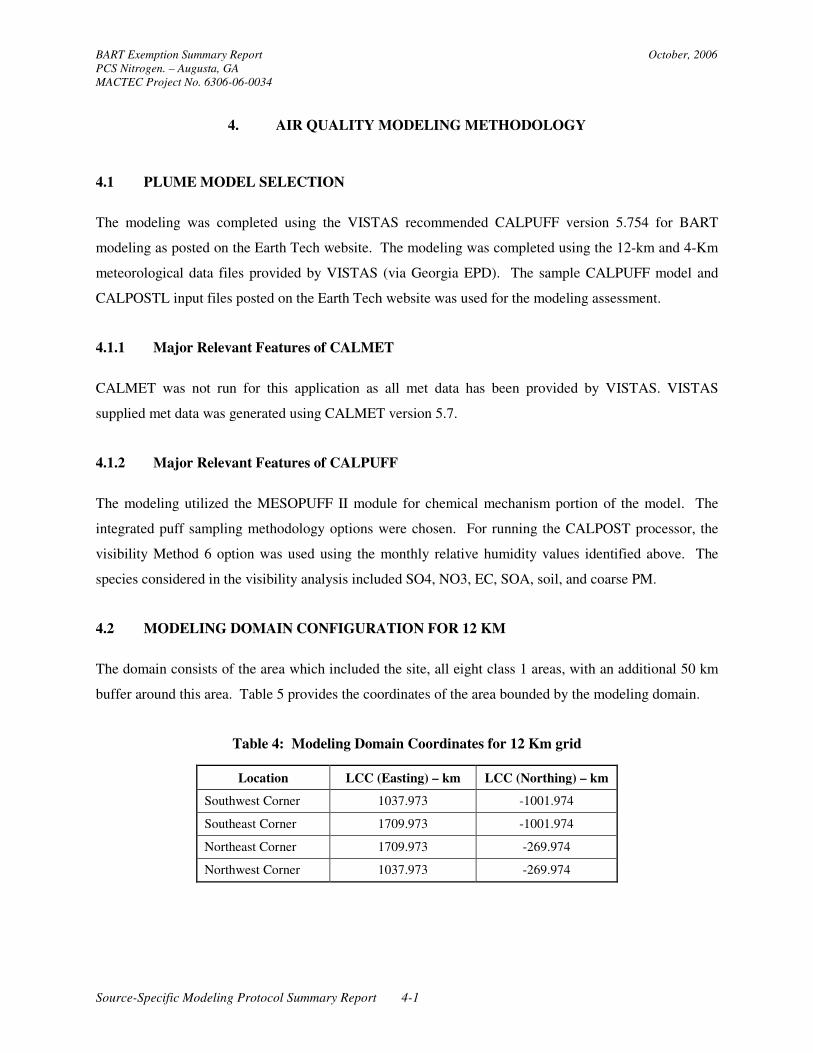
4.2 MODELING DOMAIN CONFIGURATION FOR 12 KM
The domain consists of the area which included the site, all eight class 1 areas, with an additional 50 km
buffer around this area. Table 5 provides the coordinates of the area bounded by the modeling domain.
Table 4: Modeling Domain Coordinates for 12 Km grid
Location LCC (Easting) – km LCC (Northing) – km
Southwest Corner 1037.973 -1001.974
Southeast Corner 1709.973 -1001.974
Northeast Corner 1709.973 -269.974
Northwest Corner 1037.973 -269.974
BART Exemption Summary Report October, 2006
PCS Nitrogen. – Augusta, GA
MACTEC Project No. 6306-06-0034
Source-Specific Modeling Protocol Summary Report 4-2
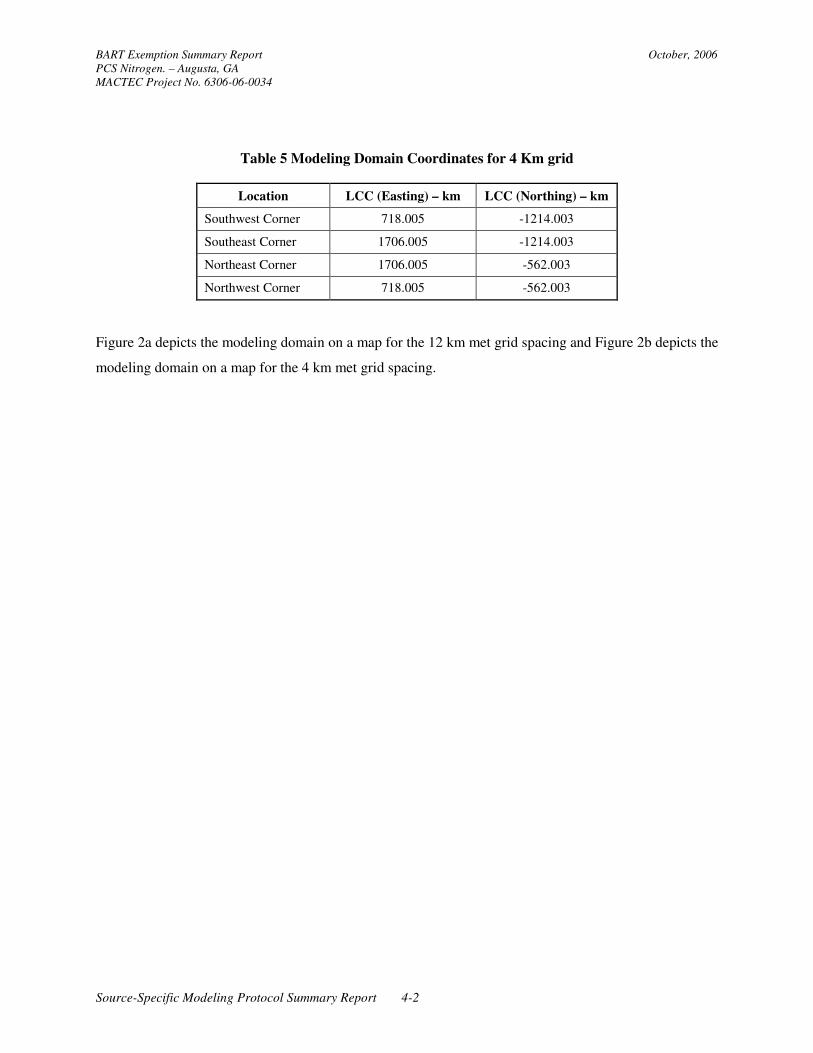
Table 5 Modeling Domain Coordinates for 4 Km grid
Location LCC (Easting) – km LCC (Northing) – km
Southwest Corner 718.005 -1214.003
Southeast Corner 1706.005 -1214.003
Northeast Corner 1706.005 -562.003
Northwest Corner 718.005 -562.003
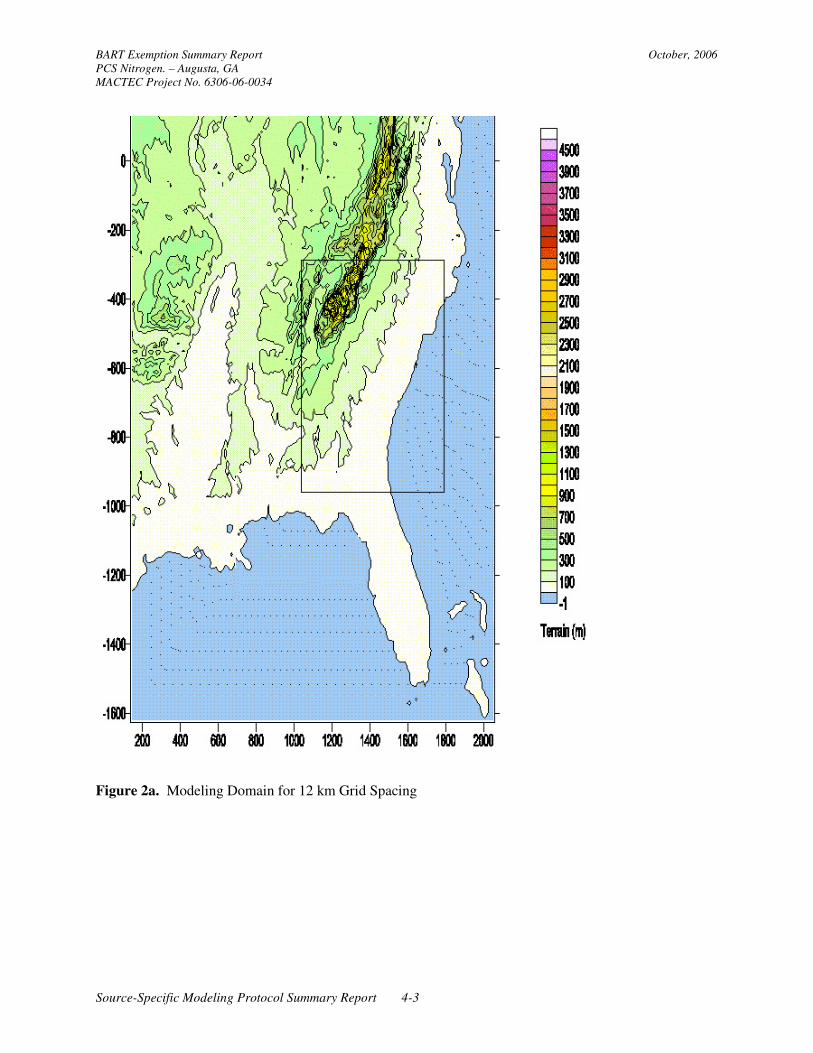
Figure 2a depicts the modeling domain on a map for the 12 km met grid spacing and Figure 2b depicts the
modeling domain on a map for the 4 km met grid spacing.
BART Exemption Summary Report October, 2006
PCS Nitrogen. – Augusta, GA
MACTEC Project No. 6306-06-0034
Source-Specific Modeling Protocol Summary Report 4-3
Figure 2a. Modeling Domain for 12 km Grid Spacing

BART Exemption Summary Report October, 2006
PCS Nitrogen. – Augusta, GA
MACTEC Project No. 6306-06-0034
Source-Specific Modeling Protocol Summary Report 4-4
Figure 2b. Modeling Domain for 4 km Grid Spacing

BART Exemption Summary Report October, 2006
PCS Nitrogen. – Augusta, GA
MACTEC Project No. 6306-06-0034
Source-Specific Modeling Protocol Summary Report 4-5
4.3 CLAMET METEOROLOGICAL MODELING
No CALMET modeling was completed since VISTAS has provided the meteorological data used in the
CALPUFF modeling. The CALMET modeling has already been completed by the Earth Tech.
4.4 CALPUFF COMPUTATIONAL DOMAIN AND RECEPTORS
The computational domain is the same as the modeling domain as indicated above. The CALPUFF
model included the Class I receptors for each site as taken from the National Park Service Website. The
website conversion program was used to convert the receptor set into Lambert Conformal Coordinates
(LCC) for use in the CALPUFF model.
4.5 CALPUFF MODELING OPTIONS SELECTIONS
The CALPUFF model was run using model options listed in Section 4.3.3 of the VISTA’s Final Protocol
The following list discusses the primary option selections:
- The CALPUFF model configuration for the regional CALPUFF follow the recommended
IWAQM guidance (EPA, 1998; Pages B-1 through B-8), except as noted below:
- CALPUFF domain configured to include the source and all Class I areas within 300km of
the source plus 50km buffer zone in each direction. CALPUFF is recommended for all
source-receptor distances to be considered in the BART analyses.
- Chemical mechanism: MESOPUFF II module
- Background ammonia concentration: In CALPUFF, use constant (0.5 ppb) value for ammonia.
- Puff representation: integrated puff sampling methodology.
- Use IWAQM (EPA, 1998) default guidance, including Pasquill-Gifford dispersion coefficients.
- Ozone dataset – use observed ozone data for 2001-2003 from CASTNet and AIRS stations.
Only non-urban ozone stations should be used in the OZONE.DAT file. Monthly average
ozone (backup) background values are to be computed based on daytime average ozone
concentrations from the OZONE.DAT file (6am-6pm average ozone concentrations
computed by month).

BART Exemption Summary Report October, 2006
PCS Nitrogen. – Augusta, GA
MACTEC Project No. 6306-06-0034
Source-Specific Modeling Protocol Summary Report 4-6
4.6 LIGHT EXTINCTION AND HAZE IMPACT CALCULATIONS
The light extinction and haze impact calculations were computed using the CALPUFF post processor
CALPOST adhering to the model options listed in Section 4.3.3 of the VISTAs Final Protocol. The major
options listed as follows:.
- Species considered in visibility analysis: SO4, NO3, soil, fine PM, NH3 (modeled as NO3)
- Natural background light extinction: calculated by CALPOST under Method 6, based on annual
average default natural conditions component concentrations and monthly average f(RH) values
for the Class I area taken from the FLAG document. , from Table A-3 in the natural conditions
guidance document,
- Light extinction efficiencies: Use of EPA (2003a) values.
BART Exemption Summary Report October, 2006
PCS Nitrogen. – Augusta, GA
MACTEC Project No. 6306-06-0034
Source-Specific Modeling Protocol Summary Report 4-7
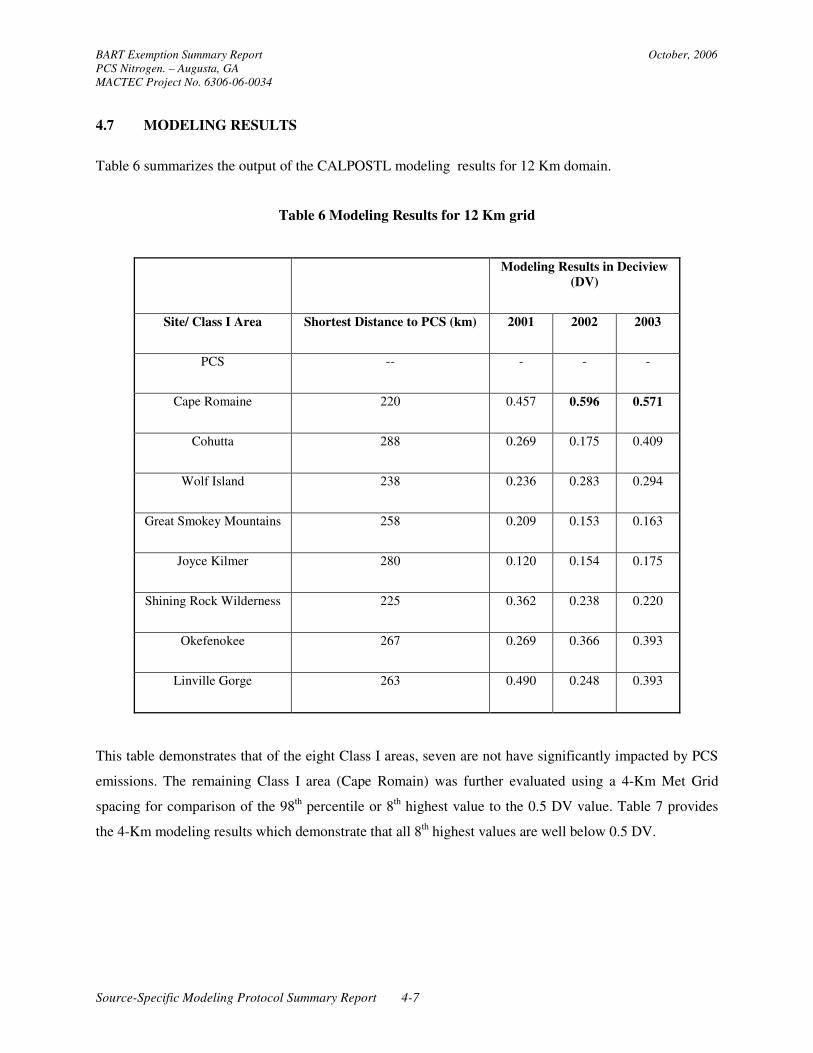
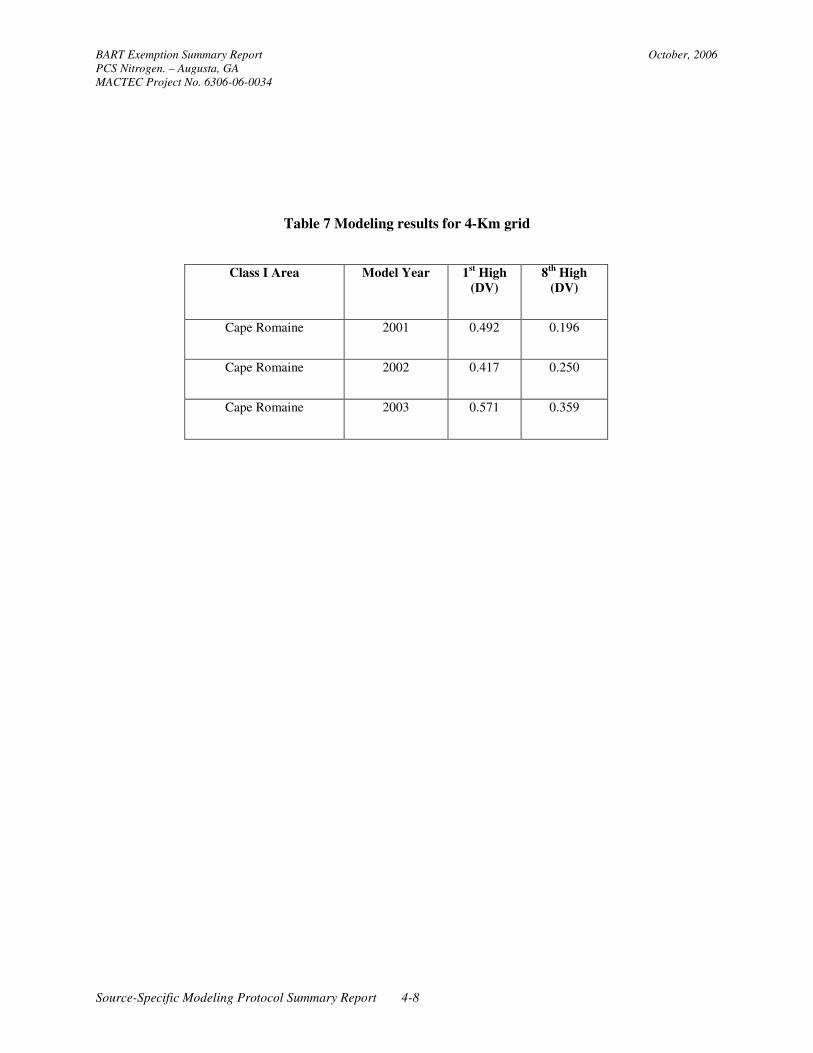
4.7 MODELING RESULTS
Table 6 summarizes the output of the CALPOSTL modeling results for 12 Km domain.
Table 6 Modeling Results for 12 Km grid
This table demonstrates that of the eight Class I areas, seven are not have significantly impacted by PCS
emissions. The remaining Class I area (Cape Romain) was further evaluated using a 4-Km Met Grid
spacing for comparison of the 98th percentile or 8
th highest value to the 0.5 DV value. Table 7 provides
the 4-Km modeling results which demonstrate that all 8th highest values are well below 0.5 DV.
Modeling Results in Deciview
(DV)
Site/ Class I Area Shortest Distance to PCS (km) 2001 2002 2003
PCS -- - - -
Cape Romaine 220 0.457 0.596 0.571
Cohutta 288 0.269 0.175 0.409
Wolf Island 238 0.236 0.283 0.294
Great Smokey Mountains 258 0.209 0.153 0.163
Joyce Kilmer 280 0.120 0.154 0.175
Shining Rock Wilderness 225 0.362 0.238 0.220
Okefenokee 267 0.269 0.366 0.393
Linville Gorge 263 0.490 0.248 0.393
BART Exemption Summary Report October, 2006
PCS Nitrogen. – Augusta, GA
MACTEC Project No. 6306-06-0034
Source-Specific Modeling Protocol Summary Report 4-8
Table 7 Modeling results for 4-Km grid
Class I Area Model Year 1st High
(DV)
8th
High
(DV)
Cape Romaine 2001 0.492 0.196
Cape Romaine 2002 0.417 0.250
Cape Romaine 2003 0.571 0.359
BART Exemption Summary Report October, 2006
PCS Nitrogen. – Augusta, GA
MACTEC Project No. 6306-06-0034
Source-Specific Modeling Protocol Summary Report 5-1
5. SUMMARY
Based on the modeling results provided in Tables 6 and 7, it can be concluded that PCS does not have a
significant visibility impairment on any Class I area and can be excluded from further BART analysis.
This modeling was completed under very conservative assumptions:
1) All ammonia reacts to form ammonium sulfate or nitrate,
2) All particulate emitted from the site is fine particulate with a β extinction value of 1.0 and
3) Includes emissions from the facilities boilers which just provide steam to the BART eligible units.
4) Includes highest emissions from different days for each emission unit instead of the single highest
emission day.
Even with these conservative assumptions the modeling clearly demonstrates that visibility impacts on all
Class I areas are insignificant (<0.5 DV). PCS therefore plans no further submittals regarding this BART
rule.
BART Exemption Summary Report October, 2006
PCS Nitrogen. – Augusta, GA
MACTEC Project No. 6306-06-0034
6. REFERENCES
Protocol for the Application of the CALPUFF Model for Analyses of Best Available Retrofit Technology
(BART)” December 22, 2005 revised March 9th, 2006.
Federal Land Managers’ Air Quality Related Values Workgroup (FLAG) Phase I report (December
2000).
BART Exemption Summary Report October, 2006
PCS Nitrogen. – Augusta, GA
MACTEC Project No. 6306-06-0034
EXHIBIT A