Barriers and Opportunities for Sustainable Food Systems in Northeastern Kansas
20
Sustainability 2010, 2, 232-251; doi:10.3390/su2010232 sustainability ISSN 2071-1050 www.mdpi.com/journal/sustainability Article Barriers and Opportunities for Sustainable Food Systems in Northeastern Kansas Hikaru Hanawa Peterson 1, *, Theresa Selfa 2 and Rhonda Janke 3 1 Department of Agricultural Economics, Kansas State University, Manhattan, KS, 66506, USA 2 Department of Sociology, Anthropology, and Social Work, Kansas State University, Manhattan, KS, 66506, USA; E-Mail: [email protected] 3 Department of Horticulture, Forestry, and Recreation Resources, Kansas State University, Manhattan, KS, 66506, USA; E-Mail: [email protected] * Author to whom correspondence should be addressed; E-Mail: [email protected]; Tel.: +1-785-532-1509; Fax: +1-785-532-6925. Received: 19 November 2009 / Accepted: 6 January 2010 / Published: 12 January 2010 Abstract: Survey responses of producers and institutional buyers in northeastern Kansas (United States) were analyzed to understand barriers and opportunities for sustainable food systems in the region where their emergence has been limited. Producers and buyers identified barriers previously noted regarding mismatches of available quantities and prices. Producers’ enthusiasm to supply locally exceeded buyers’ interest to source locally. Transportation was identified as one of the major concerns by producers, and their responses to choice tasks revealed producers’ preferences to sell locally while pricing their products to secure sales revenue and to cover their logistics expenses at least partially. Keywords: barriers; choice tasks; farm-to-institution; survey; sustainable food systems; Great Plains 1. Introduction A food system links producers of food and consumers, involving production, processing, distribution, consumption, and waste disposal processes [1]. The principle of sustainability in food systems in the United States appears to extend from the movement seeking sustainability in agriculture, reflecting concerns for environmental degradation around the 1970s and for distressed rural economies OPEN ACCESS
Transcript of Barriers and Opportunities for Sustainable Food Systems in Northeastern Kansas

Sustainability 2010, 2, 232-251; doi:10.3390/su2010232
sustainability ISSN 2071-1050
www.mdpi.com/journal/sustainability
Article
Barriers and Opportunities for Sustainable Food Systems in
Northeastern Kansas
Hikaru Hanawa Peterson 1,*, Theresa Selfa
2 and Rhonda Janke
3
1 Department of Agricultural Economics, Kansas State University, Manhattan, KS, 66506, USA
2 Department of Sociology, Anthropology, and Social Work, Kansas State University, Manhattan,
KS, 66506, USA; E-Mail: [email protected] 3 Department of Horticulture, Forestry, and Recreation Resources, Kansas State University,
Manhattan, KS, 66506, USA; E-Mail: [email protected]
* Author to whom correspondence should be addressed; E-Mail: [email protected];
Tel.: +1-785-532-1509; Fax: +1-785-532-6925.
Received: 19 November 2009 / Accepted: 6 January 2010 / Published: 12 January 2010
Abstract: Survey responses of producers and institutional buyers in northeastern Kansas
(United States) were analyzed to understand barriers and opportunities for sustainable food
systems in the region where their emergence has been limited. Producers and buyers
identified barriers previously noted regarding mismatches of available quantities and prices.
Producers’ enthusiasm to supply locally exceeded buyers’ interest to source locally.
Transportation was identified as one of the major concerns by producers, and their
responses to choice tasks revealed producers’ preferences to sell locally while pricing their
products to secure sales revenue and to cover their logistics expenses at least partially.
Keywords: barriers; choice tasks; farm-to-institution; survey; sustainable food systems;
Great Plains
1. Introduction
A food system links producers of food and consumers, involving production, processing,
distribution, consumption, and waste disposal processes [1]. The principle of sustainability in food
systems in the United States appears to extend from the movement seeking sustainability in agriculture,
reflecting concerns for environmental degradation around the 1970s and for distressed rural economies
OPEN ACCESS

Sustainability 2010, 2
233
stemming from the 1980s farm crisis [2]. Sustainable agriculture consists of three principles:
economically viable farm operations, social justice, and ecological responsibility [3]. Sustainable food
systems would imply that farming practices would be ecologically sustainable and farm products
would be purchased in ways that promote economic viability of farm operations. Local food systems
have been conceptualized as sustainable food systems that are geographically contained, where the
food is sourced closer to consumption, minimizing fuel use and marketing expenses associated with
distance and providing better returns to farmers [2,4]. The equation of local with sustainable food
systems remains a topic of academic discourse [5,6].
While sustainability of local food systems remains debatable, these geographically focused food
systems have noticeably emerged in many parts of the country in recent years, fueled by increasing
consumer interest in locally grown food [7]. Advocates of local foods call for supporting the local
economy and family farms, while enjoying fresh, better tasting food and minimizing the distance food
travels from field to plate (e.g., FoodRoutes [8]). Interestingly, the attributes consumers seek out in
local foods are not fully understood. Darby et al. [9] found that consumers’ demand for locally
produced foods is independent of other attributes such as freshness, and Pirog [10] found higher
interest among consumers for locally grown foods than for foods with environmental and social
attributes but which were not grown locally. But, other studies reported that local labeling did not yield
any premium for products of equal quality [11] or that attributes such as freshness or appearance were
more important than being local [12]. Moreover, the definition of local appears context-specific and
nowhere unified (e.g., [13-18]).
A map of farms and retail outlets that offer sustainably grown foods according to LocalHarvest, Inc.
shows numerous activities along the western coast and eastern half of the US bordering the Great
Plains region [19]. The Great Plains “stretches westward from the Missouri River at Omaha and
Kansas City to the Rocky Mountains, and northward from the Texas Panhandle into the Canadian
Prairie Provinces” [20]. Along its eastern border, the nascent sustainable food movement can be
observed. In northeastern Kansas, the city of Lawrence is considered a geographical center of local
food networks in Kansas, with an active consumer cooperative grocery store and the downtown district
with several food service operations contributing to the network [21]. Supermarkets in the Kansas City
area are partnering with producers like Good Natured Family Farms, a cooperative of 18 family farms
in Kansas and Missouri [22], to promote their local food programs. These endeavors of localizing food
procurement can be seen as part of advancement towards a larger goal of making the food system
more sustainable.
The existing literature on sustainable food systems has naturally studied regions with relatively
more established sustainable food systems. Indeed, numerous studies have examined cases in
California, the Pacific Northwest, the Northeastern US, and the upper Midwest including Iowa. Yet,
the development of food systems is conditioned by the natural and social environment inherent to their
location [23]. The regions where the sustainable food systems are currently less developed share
several commonalities. In the Great Plains, low population density implies that producers are likely to
be located far from high concentrations of consumers, requiring additional cost to transport the goods
from the farm to consumers. Agriculture in this region is distinctly industrial and relatively more
commoditized than the rest of the country, specializing mostly in large-scale grains and livestock
operations. Producers in regions where agricultural commodities have historically been produced to be

Sustainability 2010, 2
234
exported to areas beyond the region tend to be less interested in producing for local markets [7,16].
Practitioners of alternative agricultural strategies in rural areas often find they must minimize
association with urban “progressive” environmental or social movements in order to make their efforts
more locally palatable to other farmers and consumers, or in many cases, deliver products to urban
markets at great distance [23].
The objective of this study is to examine the barriers and opportunities for greater institutional sales
as part of a sustainable food system in northeastern Kansas. To obtain a more complete picture,
surveys were designed to collect views of both producers and buyers. Among the buyers, we focused
on institutional buyers such as schools, university dining services, and restaurants, given the
significance of the role played by institutions on food consumed in the US food system. Of
$1.14 trillion spent on all foods in 2007, 49% was consumed away from home through institutions,
compared to 0.4% consumed directly from farmers, manufacturers, or wholesalers [24]. Some scholars
have described these institutional marketing arrangements as a vanguard in efforts to create alternative
and more sustainable food systems [25] and as a significant contemporary social movement [26].
While we are aware of the recent discussions about the broader political context of the emergence of
farm-to-school and farm-to-college initiatives [27,28], our paper is not focused on these issues, but
rather uses empirical data to examine the practical and logistical barriers and opportunities for
expanding institutional food procurement in Great Plains.
We also focused our efforts in identifying the barriers faced by producers in participating in local
food systems with a particular emphasis on logistics, which has not been studied extensively. We
conjecture logistics is a critical deterrent to institutional sales and their role in local/sustainable food
systems in many if not all areas, but particularly in vast areas such as the Great Plains region of the US.
The spacious nature of the region implies travel time and fuel cost, which likely further discourages
distribution of smaller, frequent volumes.
In the subsequent section, the literature on factors contributing to success and demise of sustainable
food systems is reviewed. Then, the survey instruments used in the study are described. After
describing the characteristics of the respondents, we proceed to present the survey findings as they
related to the local food system and the barriers faced by producers in terms of logistics.
2. Previous Literature
Within the broad array of efforts at bringing producers and consumers together in more sustainable
food networks, programs to foster the marketing of locally produced food to institutional buyers have
been recognized as novel means to offer a potentially large market for producers. Although
arrangements are diverse, the most common type of institutional purchasing has been through
farm-to-school programs that aim to bring more “local” food into the school food programs. In fact,
these programs have proliferated in the past several years, with estimates of over 1,000 programs
active in 34 states [29]. Interest in farm-to-school has emerged from concerns about the decline in the
viability of local agricultural production in many regions, along with concerns about children’s health
as related to diet and lack of access to fresh foods [30,31]. Unlike other sustainable food system
initiatives, such as farmers’ markets and community supported agriculture (CSA), farm-to-school
programs have received relatively less attention in the academic literature [25].
Sustainability 2010, 2
235
A recent review of research on farm-to-institution marketing highlighted several areas of
convergence in findings on these programs [31]. In particular, the review summarized the current
knowledge on perceived interest, benefits, barriers, and opportunities in farm-to-institution programs.
These authors note that much of the research on farm-to-institution marketing programs has occurred
in Midwestern states, with the greatest number of studies focused on Iowa, followed by Minnesota
and Michigan. The majority of these studies were based on survey research of school food
services directors, with response rates varying widely between 19% for a survey in the four-state
region (IA, KS, NE, and MN) to a 67% response rate among Oklahoma school district food service
directors [31].
Most of the studies only looked at the opportunities and constraints faced by institutional buyers,
although at least one surveyed farmers as well [32]. Although many believe that farm-to-school
programs have potential to improve viability of small scale farms, data on the profitability for
producers of participating in these programs are lacking [31]. Several other studies conducted in
Wisconsin, California and Florida relied on qualitative research methods, especially interviews and
facilitated discussions with stakeholders (both farmers and food buyers). In general, these studies
indicate that farmers appear to be more interested in farm-to-institution marketing than are most
institutional buyers (see references within Vogt and Kaiser [31]).
Factors that were shown to be significant in encouraging buyers to source regional foods were the
type of food service. That is, food service directors, who worked independently with food providers,
more often preferred local sources, as did those who had a clearer connection to agriculture.
College/university food service directors in Iowa preferred local foods more than other buyers, such as
school districts. Overall, however, for institutional buyers, the most important considerations in their
buying decisions were quality, cost, and service, while locally grown was not especially important [31].
The review also found that while some food buyers may be interested in regional sourcing, a key
barrier to regional procurement was the lack of infrastructure needed to locate produce and coordinate
all aspects of distributing farm produce. Other barriers noted were lack of trained staff to process food,
budget constraints, and limited storage and processing facilities. Another recent study which examined
four food distributors involved in farm-to-school initiatives in the Upper Midwest and in the
Northeastern US also pointed to budget constraints as the key obstacles for school districts
incorporating more regional produce [25]. This study found that often school districts were forced to
source produce through a federal government program over local suppliers due to cost.
For farmers, the major obstacle identified was a lack of year round availability of produce [31]. In
response to the constraint posed by the lack of year round availability, farmers in Colorado expressed
interest in the creation of a farmers’ cooperative to organize large scale buying and distribution from
multiple producers [2]. A recent study on consumer demand for extended season produce in Michigan
found that consumers were interested and willing to pay more for local produce at the farmers’ market,
if the growing season for produce could be extended through techniques such as high tunnels [33].
Overall, these findings suggest the need for more logistical support and coordinated distribution
channels to make farm-to-institution marketing more viable for both buyers and producers.

Sustainability 2010, 2
236
3. Producer and Buyer Surveys
The surveys were designed to further our understanding of constraints faced by producers to supply
to local markets and by institutional buyers to procure locally grown farm products. Both surveys
included similar sets of questions to obtain respondent characteristics, their definitions of local markets,
attitudes towards local food systems, and perceived barriers. In addition, the producer survey included
general questions on their marketing practices and choice task questions designed to value the
trade-offs producers faced in supplying to the local market in terms of logistics. The buyer survey
included questions on their food procurement and preparation practices. The target population for our
survey comprised of producers and institutional buyers in northeastern Kansas, which turned out to be
a major challenge to reach.
Given our interest in local food systems, we narrowed our focus on farmers who produced to market
and were interested in alternative marketing, excluding those who produced just for their personal
consumption as well as large-scale, commodity producers. There were multiple overlapping but
independent grower associations in the area, and we compiled contact information from members of
Growing Growers (a new farmer training program in the area), attendees of the Great Plains Vegetable
Growers Conference, and members of Kansas Fruit Growers and Vegetable Growers Associations. In
addition, we also included vendors listed for farmers’ markets in Kansas. The survey recipients would
include growers in the adjacent state of Missouri and non-growers who could be selling non-farm
products at farmers’ markets. The first caveat was deemed irrelevant, since the Missouri producers in
our sample would still be supplying to the Kansas City area, which is included in the study region. The
second caveat was addressed by asking a screening question at the beginning of the survey to ensure
that it was only completed by farmers, who currently produced or were planning to produce
agricultural products to sell or that they would like to sell to local markets.
A total of 1,669 producer surveys were mailed out in November 2007. Over the subsequent month,
the non-respondent recipients whose phone numbers were available were reached by phone with a
request and reminder to mail back the survey. From these phone calls and the negative responses to the
screening question, the maximum number of recipients who were producers was 1,309, which is
probably a high estimate for the target population. According to the 2007 Census of Agriculture, there
were 473 vegetable farms and 432 fruit farms in Kansas [34]. We do not have an estimate of the
number of dairy, meat, and other farmers who direct market, and likely there were more on our mailing
list who were non-growers that sold value added products at farmers’ markets. Ultimately, 192 usable
responses were received (14.7% response rate). Given the uncertainty of the exact number in our target
population, this is a most conservative estimate of our response rate.
The target institutional buyers were limited to those in ten counties in northeastern Kansas along
Kansas River Valley and the interstate highway. The target institution types included school districts,
university dining, daycares, senior and group housing, hospitals, and restaurants. For all types but
restaurants, phone directories and other publicly available lists were used to compile the
list of institutions. For restaurants, the Greater Kansas City Chefs Association directory with
about 400 members was used as a representative sample of independent restaurants in the study region.
The buyer survey was decided to be administered online based on multiple considerations regarding
the research budget, the response rate from the producer survey, and the work environment of the

Sustainability 2010, 2
237
individuals we were trying to reach. To address the difficulty in reaching individuals within each
institution who were responsible for food purchases, initial phone calls were made to the institutions to
identify the individuals and their e-mail addresses. These phone calls were also used as a preliminary
inquiry about local food use by these institutions to ensure relevance of the questions included in the
actual survey.
In the end, the number of institutions compiled exceeded 300, but the number of individual e-mail
addresses remained at 121. The buyer survey was conducted online from February through April
of 2009. Despite numerous follow-up contacts, usable responses were limited to 36 out of 63 total
responses. Relative to the individual e-mail addresses we gathered, 121, the useable response rate
is 29.8%. Considering the chefs’ association listserv which contained about 400 members, the implied
response rate diminishes to 6.9%. For comparison, the previous surveys of institutional buyers by
Gregoire and Strohbehm [35] and Starr et al. [2] had 19% and 24% response rates, respectively.
4. The Producer Survey Respondents
The characteristics of the producers who responded to the survey are summarized in Table 1. They
are presented alongside statistics for the small family, farming-occupation, low-sales farms from
the 2004 Agricultural Resource Management Survey (ARMS) for reference, where small family,
farming-occupation, low sales farms are defined as farms with gross sales under $100,000, whose
operators report farming as their major occupation [36]. The description fits the majority of our sample
farmers, with 87.1% indicating their gross farm sales as under $100,000. While the survey did not
officially ask whether farming was their major occupation, the median work time allocated to farming
was 60.0%.
Almost 40% of the producers responding were female, and 58.2% had completed college education.
The sample had a more equal representation of gender and higher educational attainment than the
ARMS statistics. The age distribution was similar to the ARMS statistics, with the average producer
being 56.4 years old and having 21.4 years of farming experience.
The average number of acres operated was 171, with 62% of the respondents managing less
than 50 acres. The sample farms are quite smaller than the ARMS farms, which likely included
proportionally more grain farmers. Our sample farm size was more similar to that of the
residential/lifestyle farms in the ARMS report, with mean of 163 and median of 67 acres [36, Table 1].
The average percentage of acres that were certified organic was 15.4% including acres in transition,
with 7.8% of the respondents farming certified organic acres exclusively. The farm type by output is
drastically different from that of statewide. With 68.2% and 30.2% respondents growing fresh
vegetables and fruit, respectively, three out of four respondents were produce growers. One in five
respondents produced ornamentals. The shares of producers of eggs, poultry, dairy, pork, and
lamb/goat were much greater than the statewide as well, while there were proportionally less
producing grains, hay, and beef, which are the primary crops of the state. In terms of the degrees of
diversification, our sample distribution resembled that of ARMS closely.

Sustainability 2010, 2
238
Table 1. Characteristics of the Producer Respondents (n = 192).
Sample USa
Gender
Female 38.9% 11.0%
Male 61.1% 89.0%
Education
Less than high school 1.6% 11.2%
High school degree 13.6% 50.6%
Some college work or vocational degree 26.6% 18.9%
College degree 28.8%
19.3%
Some postgraduate work 8.7%
Postgraduate work 20.7%
Age
Mean (years) 56.4 57
% under 35 years 3.9% 4.1%
% 35–44 years 8.4% 9.7%
% 45–54 years 31.8% 20.5%
% 55–64 years 31.3% 40.5%
% over 65 years 24.6% 25.3%
Years of farming experience
Mean (years) 21.4
Median (years) 20.0
% less than 5 years 10.6%
Gross farm sales
Less than $2,500 18.1%
47.1%
$2,500–$4,999 10.5%
$5,000–$9,999 15.2%
$10,000–$24,999 18.7% 29.4%
$25,000–$49,999 14.0%
$50,000–$99,999 10.5% 23.5%
$100,000–$249,999 9.9% na
Over $250,000 2.9% na
Acres operated
Mean (acres) 171.0 413
Median (acres) 40.0 145
% acres that are certified organic
Mean 15.4%
Median 0.0%

Sustainability 2010, 2
239
Table 1. Cont.
Farm products (multiple responses allowed) Sample KSb
Fresh vegetables 68.2% 0.7%
Fresh fruits 30.2% 0.7%
Fruits & vegetables for processing 9.9% na
Grains 14.1% 34.5%
Hay 15.1% 44.7%
Ornamentals 20.8% 0.6%
Eggs 16.2% 4.0%
Poultry 8.9% 0.2%
Dairy products 3.1% 1.2%
Beef 10.4% 39.3%
Pork 5.7% 2.2%
Lamb/goat 7.3% 1.8%
Value-added 20.3% na
Other 18.8% 1.4%
Number of farm productsc
USa
Zerod 10.4% 13.0%
One 27.6% 33.5%
Two 25.5% 31.4%
Three 16.7% 10.0%
Four 9.4%
12.1%
Five 5.2%
Six or more 5.2% a 18.8% of sampled US farms classified as “Small family, farming-occupation,
low-sales farms” in 2004 [36]. b The numbers based on the 2007 Census of Agriculture for Kansas [34]. c The sample numbers are based on the farm products listed. The US numbers are based
on 26 commodity groups, including fruits, vegetables, nursery products, hay, cattle,
hogs, dairy, poultry, and other livestock [36]. d The sample number includes farms with no sales in 2007. The US number includes
farms with no production in 2004 and all croplands in Conservation Reserve or Wetland
Reserve Programs [36].
Table 2 summarizes the types of marketing outlets used by respondents. Our sample reported using
direct sales outlets more than sales through retail outlets or through a broker or cooperative (multiple
responses were allowed). Within the direct sales options, the farmers’ market was the most commonly
used by 67.7% of the respondents, followed by “other direct sales” (43.8%), and “roadside stands/farm
stores” (27.6%). Since one of our mailing lists for the survey sample was the farmers’ market
membership list for Kansas, this result was not surprising. Within the sales-to-retail-outlets category,
sales to grocery stores and restaurants were reported by 20.8% and 27.1% of the respondents,
respectively, with sales to institutions, our interest area, used only by 5.7%. This could indicate lack of
success or room for growth in the future. Food cooperatives were used by 8.9% of the respondents;

Sustainability 2010, 2
240
sales through grower cooperatives were only 4.2%, through retained ownership or commission
merchants 4.7%, and sales to brokers and packers was 9.4%.
Table 2. Marketing Outlets Used by Producers (n = 192).
Direct sales to consumers:
Farmer’s markets 67.7%
CSA or subscription 10.9%
Roadside stands/farm stores 27.6%
U-Pick sales 9.9%
Other direct sales 43.8%
Use of middle persons:
Growers’ cooperatives 4.2%
Wholesale buyers/brokers/packers 9.4%
Retained ownership|commission merchant 4.7%
Sales to retail outlets:
Grocery stores 20.8%
Food cooperatives 8.9%
Restaurants 27.1%
Institutions (such as schools and hospitals) 5.7%
Other 12.5%
5. The Buyer Survey Respondents
The characteristics of the buyer respondents are summarized in Table 3. Group housing and school
districts comprised 58.4% of the responses from the institutional buyers, followed by daycare
centers (11.1%), retirement homes (11.1%), university dining (8.3%), a restaurant (2.8%), and a senior
center (2.8%). The number of meals served varied from 0 to 10,000 breakfasts, 0 to 14,500 lunches,
and 0 to 150 dinners. The 2008 food budget for these institutions varied from $1,000 to $9 million (the
latter was for a school district), with median of $81,500 and totaling $25.4 million. More than 80% of
the individuals responding to this survey on behalf of their institutions were responsible for 100% of
their food budget, with 52.8% of the individuals having more than 10 years of experience in
food purchasing.
Table 3. Characteristics of the Buyer Respondents (n = 36).
Institutional type
Group Housing
30.6%
School District
27.8%
Daycare
11.1%
Retirement Home
11.1%
University Dining
8.3%
Restaurant
2.8%
Senior Center
2.8%

Sustainability 2010, 2
241
Table 3. Cont.
# Meals served Mean
Median
Breakfast 722
50
Lunch 1,346
91
Dinner 53
0
2008 Food budget
Mean $806,934.14
Median $81,500.00
% Budget responsible by the respondent
Mean
83.2%
Median
100.0%
# Years of experience in food purchasing
Mean (years)
12.5
Median (years)
11.0
Table 4. Food Ordering by the Buyer Respondents (n = 36).
Frequency of ordering
Daily
8.3%
Every 2–3 days
25.0%
Once a week
44.4%
Every 2–3 weeks
11.1%
Once a month
2.8%
Other
8.3%
Ordering method (multiple choices allowed)
Face-to-face visits
66.7%
Phone
47.2%
Website
30.6%
25.0%
Fax
16.7%
Time between delivery and use (% respondents)
Same
day
1–2
days
3–6
days
1–2
weeks
1 month
or more
Bread/pasta/rice 11.1% 36.1% 30.6% 16.7% 5.6%
Fruit/vegetable 13.9% 50.0% 25.0% 11.1% 0.0%
Meats/seafood 11.1% 25.0% 38.9% 16.7% 8.3%
Dairy 17.1% 34.3% 45.7% 2.9% 0.0%
Eggs 11.4% 34.3% 40.0% 14.3% 0.0%
Condiments 8.3% 13.9% 25.0% 16.7% 36.1%
Table 4 summarizes the food procurement process used by the buyer respondents. Nearly half of
these institutions placed their food orders once a week (44.4%), followed by every 2–3 days (25.0%),
and every 2–3 weeks (11.1%), with 8.3% of the respondents ordering daily. Most popular ordering
methods were “face-to-face” visits and phone used by 66.7% and 47.2% of the respondents,

Sustainability 2010, 2
242
respectively, followed by online (30.6%) and e-mail (25.0%), with approximately 2 out of 3
respondents using more than one method. The length of time between delivery and use of food items
varied from “same day” to “1 month or more” depending on the institution and food items. Dairy, fruit
and vegetable, and eggs were typically used within six days of delivery by over 85% of the
respondents. Bread/pasta/rice and meats/seafood were used within six days of delivery by about 75%
of the respondents. More than one third of the respondent stored condiments for a month or more
before use.
6. The Local Market for the Respondents
The survey responses revealed a consistency in the definition of a “local” market among most
producers and buyers in our samples (Table 5). Producers were asked in an open-ended question what
a local market meant to them. Three out of four respondents responded in terms of distance,
while 15.8% mentioned their county of residence or neighboring counties. Of those who responded in
terms of distance, 68.5% responded as a radius of 60 miles or within one hour of driving and 18.9%
responded as a radius of between 75 and 100 miles. Buyers were asked to choose from a multiple
choice of definitions. Thirty-six percent chose “within my county” and 47.2% chose “within
a 100-mile radius”. Thus, there was a rough consensus among about 80% of the producers and buyers
to consider a 100-mile radius as local, which is about the same size as our target region: the area along
the Kansas River Valley spanning from Kansas City, Kansas/Missouri in the east to Manhattan,
Kansas in the west.
Table 5. Defining “Local”.
Producer (n = 192)
Distance (one way) 75.8%
Less than 60 miles / within 1 hour
68.5%
75–100 miles
18.9%
150–200 miles / 2 to 5 hours
12.6%
County of residence/neighboring counties 15.8%
Farmers’ markets/city/state 8.5%
Institutional Buyer (n = 36)
Within my county 36.1%
Within a 100 mile radius 47.2%
Within a 5-hour drive one way 5.6%
Within my state 8.3%
Within the 48 contiguous states 2.8%
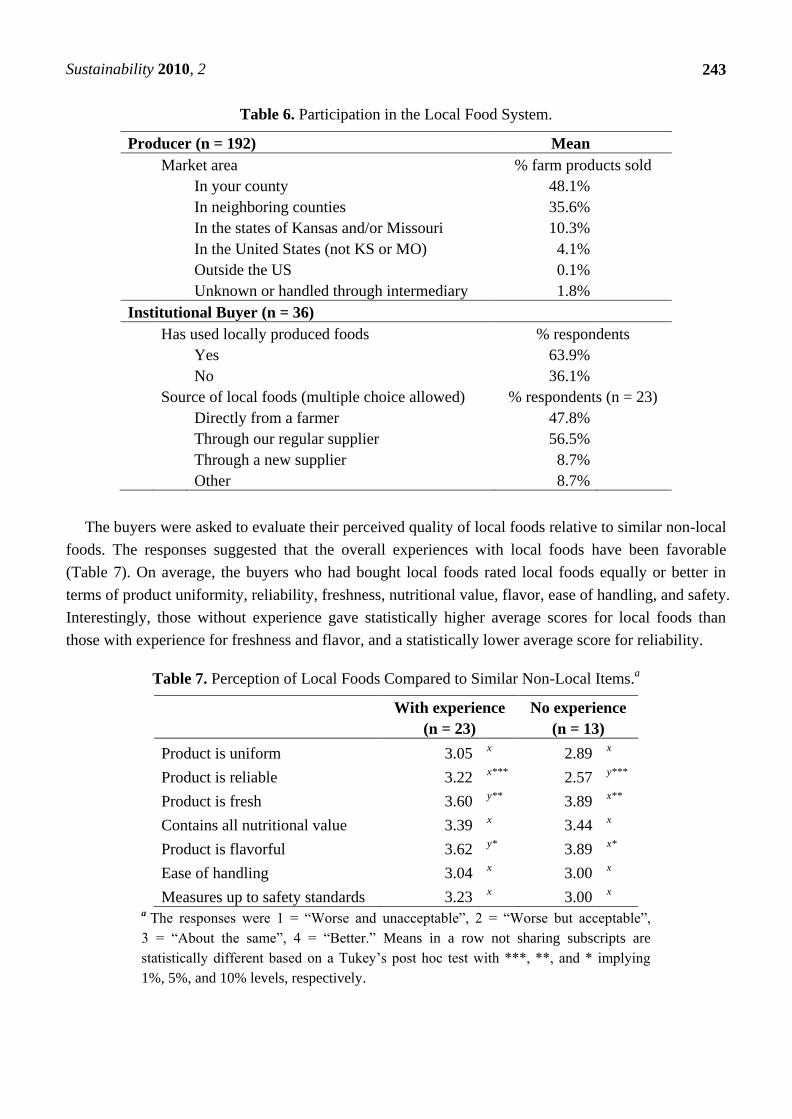
Most respondents were participating in the local food system (Table 6). The average percentage of
farm products producers marketed to the county of their residence was 48.1%, followed by 35.6% to
neighboring counties. Sixty-four percent of the buyers indicated buying “locally produced foods” at
least once. Of these buyers, 56.5% sourced local foods through their regular suppliers, and 47.8%
purchased directly from a farmer.
Sustainability 2010, 2
243
Table 6. Participation in the Local Food System.
Producer (n = 192) Mean
Market area % farm products sold
In your county 48.1%
In neighboring counties 35.6%
In the states of Kansas and/or Missouri 10.3%
In the United States (not KS or MO) 4.1%
Outside the US 0.1%
Unknown or handled through intermediary 1.8%
Institutional Buyer (n = 36)
Has used locally produced foods % respondents
Yes 63.9%
No 36.1%
Source of local foods (multiple choice allowed) % respondents (n = 23)
Directly from a farmer 47.8%
Through our regular supplier 56.5%
Through a new supplier 8.7%
Other 8.7%
The buyers were asked to evaluate their perceived quality of local foods relative to similar non-local
foods. The responses suggested that the overall experiences with local foods have been favorable
(Table 7). On average, the buyers who had bought local foods rated local foods equally or better in
terms of product uniformity, reliability, freshness, nutritional value, flavor, ease of handling, and safety.
Interestingly, those without experience gave statistically higher average scores for local foods than
those with experience for freshness and flavor, and a statistically lower average score for reliability.
Table 7. Perception of Local Foods Compared to Similar Non-Local Items.a
With experience No experience
(n = 23) (n = 13)
Product is uniform 3.05 x 2.89
x
Product is reliable 3.22 x***
2.57 y***
Product is fresh 3.60 y**
3.89 x**
Contains all nutritional value 3.39 x 3.44
x
Product is flavorful 3.62 y*
3.89 x*
Ease of handling 3.04 x 3.00
x
Measures up to safety standards 3.23 x 3.00
x
a The responses were 1 = “Worse and unacceptable”, 2 = “Worse but acceptable”,
3 = “About the same”, 4 = “Better.” Means in a row not sharing subscripts are
statistically different based on a Tukey’s post hoc test with ***, **, and * implying
1%, 5%, and 10% levels, respectively.

Sustainability 2010, 2
244
A series of value statements were included in both the buyers’ and producers’ surveys, which were
intended to measure the level of agreement between buyers and producers on the importance of “local”
food and the relative importance of different attributes to both groups of respondents. The respondents
were asked to indicate their level of accordance with a 5-point scale (1 = strongly disagree,
5 = strongly agree). The only statements on both surveys that elicited similar levels of agreement from
buyers and producers were: “I have a sense of belonging to my local community” for growers and
“Our institution has a sense of belonging to our local community” by institutional food buyers
(Table 8).
Table 8. Value Statements (5 = Strongly Agree, 1 = Strongly Disagree).
Producer:
I have a sense of belonging to my local community. 4.29 c
Knowing individual consumers is important to me. 4.53 b
I want consumers to know if their food came from my farm. 4.73 a
Labeling my products as “local” will make my products more
attractive to consumers.
4.33 c
Selling what I produce to the local community is important to me. 4.54 b
Institutional Buyer:
Our institution has a sense of belonging to our local community. 4.36 c
Knowing the sources of the food we serve is important to
our institution.
4.03 d
We want our clients to know where their food came from. 3.67 f
Products labeled as “local” are more attractive to our institution. 3.58 f
Purchasing what is produced in the local community is important
to our institution.
3.58 f
Supporting local agriculture is important to our institution. 3.86 e
Note: The shared superscripts are statistically not different at the 1% level based on Tukey’s test.
Every other paired statement elicited statistically different responses from growers and buyers
(p-values less than 0.0001), such as: “Knowing individual consumers is important to me” was rated
with a score of 4.33 by producers, while buyers responded with a 4.03 to the following statement:
“Knowing the sources of the food we serve is important to our institution.” Similarly, producers
strongly agreed (4.54) that “Selling what I produce to the local community is important to me,” while
buyers only moderately agreed (3.58) that “Purchasing what is produced in the local community is
important to our institution.” While the producers thought “Labeling my products as “local” will make
my products more attractive to consumers” (a score of 4.33), the institutional buyers’ average score
was only 3.58 regarding the statement “Products labeled as “local” are more attractive to our
institution.” Clearly it appears that while both buyers and producers feel it is important to belong to
their community, buyers do not translate the importance of community ties to the support of local
agriculture and farmers. Indeed, the average score for “Supporting local agriculture is important to our
institution” was 3.86.
Regarding barriers to participating in a local food system, producers and buyers shared a similar
concern suggesting lack of market information and coordination (Table 9). The buyers’ top concerns

Sustainability 2010, 2
245
were not knowing potential suppliers (identified by 63.9% of the respondents allowed to choose
multiple choice), prices being too high or too variable (47.2%), and inconsistent or inadequate
supply (41.7%). These concerns are largely consistent with other studies [25,32,37]. These concerns
could be addressed at least in part by readily available market information on prices and quantities
being exchanged in the local markets, providing more transparency. Several studies suggest that
institutional buyers would be more likely to source regional foods if they were available through
existing vendors and/or if new brokering arrangements could be set up, to allow institutional buyers to
purchase quantities they require [25,31].
Table 9. Barriers to Participating in the Local Food System.
Producers (n = 192)
Too small of a quantity 50.5%
Lack of year-round production 34.4%
Transportation means / time 24.5%
Insufficient time to produce / to contact buyers 24.0%
Low price 21.4%
Don’t know where to find local buyers 14.6%
Buyers backing out 11.5%
Too large of a quantity 9.9%
Buyers want liability insurance 8.3%
Buyers want uniform boxes / packaging 7.8%
Labor 4.2%
Immature market (false local claims) 3.6%
Age 2.1%
Buyers (n = 36)
My current suppliers do not carry local / Do not know
potential suppliers 63.9%
Price is too high / too variable 47.2%
Inconsistent / inadequate supply 41.7%
We’ve just never done this before 25.0%
They might not be delivered as scheduled 19.4%
We do not have adequate storage space 16.7%
We lack labor to prepare 5.6%
Sub-standard quality 5.6%
Lack of our interest 2.8%
We lack facilities to prepare 0.0%
The producers’ top concerns were their quantities of production being too small for institutional
buyers or too large for local buyers (50.5% and 9.9%, respectively), lack of year-round
production (34.4%), transportation means or time (24.5%), insufficient time to produce or to find local
buyers (24.0%), and low prices in the local outlets (21.4%). These concerns mirror those identified in
another study [32], in which the lack of year-round availability, lack of a dependable market, and

Sustainability 2010, 2
246
inability to produce sufficient quantity were the top barriers for producers, with the notable exception
of transportation and time constraint.
7. Producers’ Conundrum
Supplying to a local food system typically implies more frequent marketing in smaller volume than
conventional marketing outlets. Previous literature suggests that the logistics of getting food
from farms to schools is a key constraint for developing and maintaining these marketing
arrangements [25,35,37], and one out of four producers in our sample indicated transportation as a
major barrier. Thus, the management of logistics critically determines whether it is feasible for a
time-constrained producer, as revealed above, to participate in the local food system. Anecdotal
evidence suggests that producers are willing to drive to their market expending their time and physical
travel costs. But, there is always risk of not being able to generate sufficient revenue due to factors
beyond producers’ control.
To analyze the producers’ conundrum, we asked the respondents to indicate the smallest amount of
gross sales revenue that they would consider worthwhile marketing their products (Table 10). The
majority of growers (71.2%) were willing to make a delivery spending one hour one-way for $100
to $1,000 gross sales, and 19.2% were willing for sales worth $10 to 100. If products were picked up at
the farm, the minimum value decreased in general, with 87.0% willing to deal with $100 or less in
gross sales.
Table 10. The Smallest Sales Producers Consider Worthwhile to Market.
If producers traveled one
hour one-way to deliver
If products were picked
up at farm
Gross sales (n = 125) (n = 132)
$1–10 2.4%
42.7%
$10–100 19.2%
44.3%
$100–1,000 71.2%
9.2%
$1,000–5000 4.0%
0.8%
$5,000–10,000 1.6%
1.5%
>$10,000 1.6%
2.3%
Another way to quantify the trade-offs producers make is through a series of designed choice task
questions. The producers were asked to consider a situation where they had a vehicle-load of a product
that must be sold within the next 10 days, and offers for this product varied by the unit price, volume,
the delivery arrangement, and the type of buyer. To simplify, we asked them to assume that they
considered $10 per unit as a fair value for the product, but the offer price could vary between $8
and $12. The sales volume could be a full-, half-, or quarter-load of their vehicle’s capacity. The
producers were asked to adjust the units of their products so that $10 would be relatively realistic, with
examples of a bag of potatoes or a quarter of a lug of peaches. Thus, the number of units per load was
not specified. The delivery options were either the producer drove 1 or 2 hours one way to the delivery
point, or that the buyer would pick up from the producer’s premise. The buyer could be a locally-based

Sustainability 2010, 2
247
business with at most a few store locations or a chain operation of a national- or regional-franchise.
There were 18 choice tasks designed using an orthogonal factorial design, which were divided into two
blocks; each respondent was presented with one of the blocks with 9 choice tasks. Figure 1 is an
example choice task.
Figure 1. Example Choice Tasks.
The responses to these choice tasks were analyzed using conditional logit model [38], which
estimates utility functions of attributes relative to a base set of attributes. The base attributes in the
current analysis were specified as a full vehicle load sold to a non-local buyer. The producers’ implicit
valuations for the departures from the base attributes were computed from the parameter estimates as
the negative of ratios between the coefficients on the attributes and price. The values for the delivery
options were calculated as differences from the pickup option.
The estimation results, presented in Table 11, show that the average producer in the sample
preferred supplying to local buyers and was willing to take a $2.43 discount per unit of a product
valued at $10, or roughly a 25% discount relative to selling to a non-local customer. Relative to having
a full-load of their vehicle for sale, the producers wanted to charge close to a 50% premium for their
quarter-vehicle load and about a 25% premium for their half-vehicle load. Clearly, the producer
decisions were defined in terms of total revenue that could be generated from a delivery route. They
were willing to sacrifice per unit price if they could sell a larger quantity.
Table 11. Conditional Logit Estimates of Producer Preferences for Marketing Options.a
Variable Parameter estimate Standard error Producers’ value
rice 0.3075 0.0332
Local 0.7472 0.0910 –$2.43
Quarter-load –1.4087 0.1436 $4.58
Half-load –0.7455 0.1107 $2.42
Pickup –0.9888 0.2725
Drive 1 hour –2.3572 0.3037 $4.45
Drive 2 hours –3.3926 0.3493 $7.82 a 1,354 observations, log-likelihood function = –1,296, McFadden’s likelihood ratio index = 0.129.
Regarding travel time, relative to pick-up on premise, the producers on average demanded $4.45 per
unit to drive for one hour and $7.82 per unit to drive for two hours one way to sell their products. This
is consistent with an average score of 4.15 that producers indicated (with a scale of 5 equaling strongly
agree and 1 equaling strongly disagree) to the statement “Fuel prices affect my decision about how far
to transport my product to market.” Assuming that one can travel 50 miles in an hour, their response
implies per-unit delivery cost of 4.5 cents per mile for a 100-mile round trip or 3.9 cents per mile for

Sustainability 2010, 2
248
a 200-mile round trip. This might be sufficient to cover fuel costs if their minimum load consisted
of 4 units (e.g., if gasoline cost $3 per gallon and the gas mileage for the vehicle was 22 miles per
gallon, the fuel costs of a 100-mile round trip would be 13.6 cents per mile). The load would need to
be sufficiently larger if producers intended to recover their time expense.
8. Discussion and Conclusions
Despite the consensus on the definition of their local market and active participation by both
producers and institutional buyers, the survey responses revealed a gap between levels of producers’
enthusiasm to supply locally and buyers’ interest to source locally. Overall, this gap has been
highlighted in other related research, although there are clear differences among types of institutional
buyers in terms of their interest in buying locally. Researchers in Iowa noted that college and
university institutional food buyers who purchase local food state their reasons for doing so as the
importance of supporting local farmers and the local economy [39]. However, it appears that
supporting the local farmers and local economy does not factor as strongly for other institutional
buyers, which was revealed in our research as well. Making a clearer connection between local food
sourcing and supporting the local economy is one suggestion for increasing institutional purchasing
and might help to overcome some of the barriers.
In addition, in alignment with many other studies, there is a need for research and policy
interventions to assist in streamlining some of the logistical challenges that currently impede
institutional purchasing and selling. One suggestion is to work to incorporate local foods into
traditional distribution channels [25], while others suggest the need for state-level policy interventions.
The proposed policy interventions include requiring state institutions, such as schools, to purchase a
set percentage of available local foods, and mounting state level promotional campaigns on the
use of local foods by various institutions [2]. A search of the Healthy Community Design and
Access to Healthy Food Legislation Database [40] under the topic area of “agriculture/local food”
yielded 655 pieces of legislation to support local food that were considered by states since 2004 or an
average of 109 per year. In 2009, 36 states (Kansas not being among them) had some sort of initiative,
and 27 of these proposed bills passed and were on their way to becoming law. These ranged from bills
mandating that state agencies track and report local food purchases, to requiring a certain 20% of food
purchased by state agencies be sourced locally by 2020, to assistance with coordinating local purchases
by schools, hotels, and restaurants and other businesses.
While producers are shown to be more enthusiastic and willing to participate in institutional food
sales, there is obviously a need for more research exploring both the potential benefits for producers
and particular constraints they face. While farm-to-institution programs have received relatively less
attention than other types of marketing arrangements in the literature on local and sustainable food
systems, producers’ needs have been much less explored than have buyers’ needs in this research [31].
The findings from the last section further support producers’ clear preferences to participate in a local
food network. The system, particularly in its emergence, mostly expects the producers to bear the cost
of logistics. Not surprisingly, they have reservation prices for the services they provide. Our estimates
of these reservation prices provide a useful first step, but clearly much more research is needed. The

Sustainability 2010, 2
249
question remains whether the producers’ reservation prices are indeed sufficient to maintain and
promote the economic viability of their operations.
In order to overcome these barriers, contributions to sustainable food systems need to be presented
as business opportunities for new and existing producers, distributors, and institutional users. All
current and potential players in the system should be involved in developing solutions to the
conundrum. Production and consumption are part of a common system [41], and sustainable solutions
will not be developed for one sector in isolation from another, or without considering the ultimate
impact on the environment, both physical and social. Many research questions remain to seek the
ultimate structure of sustainable food systems. One such quest would identify the scope of a local food
network that optimizes the degree of sustainability in terms of fuel use and farm economies.
Acknowledgements
The grant funding from the Center for Engagement at Kansas State University is gratefully
acknowledged.
References and Notes
1. Robles, C. Sustainable Food Systems—Why Are Sustainable Food Systems Important? 2008;
Available online: http://www.faqs.org/nutrition/Smi-Z/Sustainable-Food-Systems.html (accessed
on 1 June 2009).
2. Starr, A.; Card, A.; Benepe, C.; Auld, G.; Lamm, D.; Smith, K.; Wilken, K. Sustaining local
agriculture: barriers and opportunities to direct marketing between farms and restaurants in
Colorado. Agric. Human Values 2003, 20, 301-321.
3. Gold, M.V. Sustainable Agriculture: Definitions and Terms; Special Reference Briefs Series NO.
SRB 99-02; National Agricultural Library, Agricultural Research Service, U.S. Department of
Agriculture: Beltsville, MD, USA, 1999; Available online: http://www.nal.usda.gov/afsic/
AFSIC_pubs/srb9902e.htm (accessed on 31 May 2009).
4. Kloppenburg, J., Jr.; Hendrickson, J.; Stevenson, G.W. Coming in to the foodshed. Agric. Human
Values 1996, 13, 33-42.
5. Hinrichs, C.C. The practice and politics of food system localization. J. Rural Stud. 2003, 19,
33-45.
6. Winter, M. Embeddedness, the new food economy and defensive localism. J. Rural Stud. 2003, 19,
23-32.
7. Schneider, M.L.; Francis, C.A. Marketing locally produced foods: consumer and farmer opinions
in Washington County, Nebraska. Renew. Agr. Food Syst. 2005, 20, 252-260.
8. FoodRoutes. There Are Many Good Reasons to Buy Locally Grown Food; 2009; Available online:
http://www.foodroutes.org/whycare1.jsp (accessed on 2 June 2009).
9. Darby, K.; Batte, M.T.; Ernest, S.; Roe, B. Decomposing local: a conjoint analysis of locally
produced foods. Amer. J. Agr. Econ. 2008, 90, 476-486.
10. Pirog, R. Ecolabel Value Assessment Phase II: Consumer Perceptions of Local Foods; Leopold
Center for Sustainable Agriculture, Iowa State University: Ames, IA, USA, 2004; Available

Sustainability 2010, 2
250
online: http://www.leopold.iastate.edu/pubs/staff/files/050504_ecolabels2.pdf (accessed on 31
May 2008).
11. Brown, C. Consumers’ preferences for locally produced food: a study in southeast Missouri. Am.
J. Alternative Agr. 2003, 18, 213-224.
12. Campbell, R.G.; Nelson, B.L.; Ebel, R.C.; Dozier, W.A.; Adrian, J.L.; Hockema, B.R. Fruit
quality characteristics that affect consumer preferences for satsuma mandarins. HortScience 2004,
39, 1664-1669.
13. Harris, B.; Burress, D.; Mercer, S.; Oslund, P.; Rose, C. Kaw Valley Focus Groups on Local and
Organic Produce; IPPBR Report No. 254B; University of Kansas: Lawrence, KS, USA, 2000;
Available online: http://www.ipsr.ku.edu/resrep/pdf/m254B.pdf (accessed on 1 June 2008).
14. Guptill, A.; Wilkins, J.L. Buying into the food system: trends in food retailing in the US and
implications for local foods. Agric. Human Values 2002, 19, 39-51.
15. Zepeda, L.; Leviten-Reid, C. Consumers’ views on local food. J. Food Distrib. Res. 2004, 35, 1-6.
16. Selfa, T.; Qazi, J. Place, taste or face-to-face? Understanding producer-consumer networks in
“local” food systems in Washington State. Agric. Human Values 2005, 22, 451-464.
17. Whole Foods Market. Locally Grown—The Whole Foods Market Promise; Available online:
http://www.wholefoodsmarket.com/products/locallygrown/index.html (accessed on 31 May 2008).
18. The Hartman Group. Consumer understanding of buying local. HartBeat Newsletter, 27 February
2008; Available online: http://www.hartman-group.com/hartbeat/2008-02-27 (accessed on 1 June
2008).
19. LocalHarvest Home Page. Available online: http://www.localharvest.org/ (accessed on 25
October 2009).
20. Center for Great Plains Studies; Available online: http://www.unl.edu/plains/index.shtml
(accessed on 31 May 2008).
21. Champion, B.L. The Political Economy of “Local Foods” in Eastern Kansas: Opportunities and
Justice in Emerging Agro-Food Networks and Markets; Ph.D. Thesis, Balliol College, Oxford
University, Oxford, UK, 2007.
22. Endicott, D. Our Story; Available online: http://www.goodnatured.net/our_story/story.html
(accessed on 1 June 2008).
23. Qazi, J.; Selfa, T. The politics of building alternative agro-food networks in the belly of
agro-industry. Food Cult. Soc. 2005, 8, 45-72.
24. Food CPI, Prices and Expenditures: Food Expenditure Tables; Economic Research Service, US
Department of Agriculture: Washington DC, USA, 2008; Available online: http://www.
ers.usda.gov/Briefing/CPIFoodAndExpenditures/data/ (accessed on 2 June 2009).
25. Izumi, B.; Wright, D.W.; Hamm, M. Farm to School Programs: exploring the role of
regionally-based food distributors in alternative agrifood networks. Agric. Human Values 2009,
doi:10.1007/s10460-009-9221-x.
26. Morgan, K.; Sonnino, R. The School Food Revolution: Public Food and the Challenges of
Sustainable Development; Earthscan Publications: London, UK, 2008.
27. Allen, P.; Guthman, J. From “old school” to “farm-to-school”: neoliberalization from the ground
up. Agric. Human Values 2006, 23, 401-415.

Sustainability 2010, 2
251
28. Kloppenburg, J.; Hassanein, N. From old school to reform school? Agric. Human Values 2006,
23, 417-421
29. Kalb, M. National farm to school network takes root. Community Food Secur. News 2008, 1, 12.
30. Bagdonis, J.M.; Hinrichs, C.; Schafft, K. The emergence and framing of farm-to school initiatives:
civic engagement, health and local agriculture. Agric. Human Values 2009, 26, 107-119.
31. Vogt, R.; Kaiser, L. Still time to act: a review of institutional marketing of regionally-grown food.
Agric. Human Values 2008, 25, 241-255.
32. Gregoire, M.B.; Arendt, S.W.; Strohbehm, C.H. Iowa producers’ perceived benefits and obstacles
in marketing to local restaurants and institutional foodservice operations. J. Ext. 2005, 43, 1;
Available online: http://www.joe.org/joe/2005february/rb1.php (accessed on 23 October 2009).
33. Conner, D.S.; Montri, A.D.; Montri, D.N.; Hamm, M.W. Consumer demand for local produce at
extended season farmers’ markets: guiding farmer marketing strategies. Renew. Agr. Food Syst.
2009, doi:10.1017/S1742170509990044.
34. 2007 Census of Agriculture; National Agricultural Statistical Service, US Department of
Agriculture: Washington DC, USA, 2009; Available online: http://www.agcensus.usda.gov/
Publications/2007/Full_Report/usv1.pdf (accessed on 24 October 2009).
35. Gregoire, M.B.; Strohbehm, C. Benefits and obstacles in purchasing food from local growers and
producers. J. Child Nutr. Manag. 2002, 26, 1-7.
36. Hoppe, R.A.; Korb, P.; O’Donoghue, E.J.; Banker, D.E. Structure and Finances of U.S. Farms:
Family Farm Report, 2007 Edition; Economic Information Bulletin No. 24; Economic Research
Service, United States Department of Agriculture: Washington, DC, USA, 2007; Available online:
http://www.ers.usda.gov/ Publications/EIB24/ (accessed on 30 October 2009).
37. Berkenkamp, J. Making the Farm/School Connection: Opportunities and Barriers to Greater Use
of Locally-Grown Produce in Public Schools; Department of Applied Economics, University of
Minnesota: Minneapolis, MN, USA 2006; Available online: http://www.cifap.umn.edu/
publications/Berkenkamp%20Feasibility%20final%20paper.pdf (accessed on 23 October 2009).
38. McFadden, D. Conditional logit analysis of qualitative choice behavior. In Frontiers in
Econometrics; Zarembka, P., Ed.; Academic Press: New York, NY, USA, 1973; pp. 105-142.
39. Strohbehm, C.H.; Gregoire, M.B. Local Foods: From Farm to College and University
Foodservice; 2005; Available online: https://www.extension.iastate.edu/NR/rdonlyres/
B0D64A49-9FA9-410E-849A-31865EFECE91/65253/manuscript2004003final_version.pdf
(accessed on 24 October 2009).
40. Healthy Community Design and Access to Healthy Food Legislation Database; National
Conference of State Legislatures: Washington, DC, USA, 2009; Available online: http://www.
ncsl.org/?tabid=13227 (accessed on 9 December 2009).
41. Lebel, L.; Lorek, S. Enabling sustainable production-consumption systems. Annu. Rev. Environ.
Resour. 2008, 3, 241-275.
© 2010 by the authors; licensee Molecular Diversity Preservation International, Basel, Switzerland.
This article is an open-access article distributed under the terms and conditions of the Creative
Commons Attribution license (http://creativecommons.org/licenses/by/3.0/).