Barium uptake into the shells of the common mussel (Mytilus edulis ...
40
HAL Id: hal-00452801 https://hal.archives-ouvertes.fr/hal-00452801 Submitted on 3 Feb 2010 HAL is a multi-disciplinary open access archive for the deposit and dissemination of sci- entific research documents, whether they are pub- lished or not. The documents may come from teaching and research institutions in France or abroad, or from public or private research centers. L’archive ouverte pluridisciplinaire HAL, est destinée au dépôt et à la diffusion de documents scientifiques de niveau recherche, publiés ou non, émanant des établissements d’enseignement et de recherche français ou étrangers, des laboratoires publics ou privés. Barium uptake into the shells of the common mussel (Mytilus edulis) and the potential for estuarine paleo-chemistry reconstruction David Paul Gillikin, F. Dehairs, Anne Lorrain, Dirk Steenmans, Willy Baeyens, Luc André To cite this version: David Paul Gillikin, F. Dehairs, Anne Lorrain, Dirk Steenmans, Willy Baeyens, et al.. Barium uptake into the shells of the common mussel (Mytilus edulis) and the potential for estuarine paleo- chemistry reconstruction. Geochimica et Cosmochimica Acta, Elsevier, 2006, 70 (2), pp.395-407. <hal-00452801>
-
Upload
nguyentruc -
Category
Documents
-
view
224 -
download
1
Transcript of Barium uptake into the shells of the common mussel (Mytilus edulis ...
HAL Id: hal-00452801https://hal.archives-ouvertes.fr/hal-00452801
Submitted on 3 Feb 2010
HAL is a multi-disciplinary open accessarchive for the deposit and dissemination of sci-entific research documents, whether they are pub-lished or not. The documents may come fromteaching and research institutions in France orabroad, or from public or private research centers.
L’archive ouverte pluridisciplinaire HAL, estdestinée au dépôt et à la diffusion de documentsscientifiques de niveau recherche, publiés ou non,émanant des établissements d’enseignement et derecherche français ou étrangers, des laboratoirespublics ou privés.
Barium uptake into the shells of the common mussel(Mytilus edulis) and the potential for estuarine
paleo-chemistry reconstructionDavid Paul Gillikin, F. Dehairs, Anne Lorrain, Dirk Steenmans, Willy
Baeyens, Luc André
To cite this version:David Paul Gillikin, F. Dehairs, Anne Lorrain, Dirk Steenmans, Willy Baeyens, et al.. Bariumuptake into the shells of the common mussel (Mytilus edulis) and the potential for estuarine paleo-chemistry reconstruction. Geochimica et Cosmochimica Acta, Elsevier, 2006, 70 (2), pp.395-407.<hal-00452801>
Barium uptake into the shells of the common mussel (Mytilus edulis) and the potential for estuarine paleo-chemistry reconstruction David P. Gillikin1,*, Frank Dehairs1, Anne Lorrain2, 3, Dirk Steenmans1, Willy Baeyens1, and Luc André2 5 1Department of Analytical and Environmental Chemistry, Vrije Universiteit Brussel, 10
Pleinlaan 2, B-1050 Brussels, Belgium. Tel.: +32-2-629-1265; fax: +32-2-629-3274;
E-mail addresses: [email protected], [email protected];
* Corresponding author.
2Section of Mineralogy and Petrography, Royal Museum for Central Africa, 15
Leuvensesteenweg 13, B-3080 Tervuren, Belgium.
3Current address: UR Thetis, IRD-CRH (Centre de Recherche Halieutique
Méditerranéenne et Tropicale), Avenue Jean Monnet - BP 171, 34203 Sète Cedex,
France. 20
25 30 35 Submitted to Geochimica et Cosmochimica Acta on 03 February 2005 Revised and re-submitted on 12 July 2005 Revised and re-submitted on 14 September 2005
Barium in Mytilus shells Gillikin et al.
2
40 Abstract
In this study we test if calcite shells of the common mussel, Mytilus edulis, contain
barium in proportion to the water in which they grew. Similar to all bivalves analyzed
to date, the [Ba/Ca]shell profiles are characterized by a relatively flat background
[Ba/Ca]shell, interrupted by sharp [Ba/Ca]shell peaks. Previous studies have focused on 45
these [Ba/Ca]shell peaks, but not on the background [Ba/Ca]shell. We show that in both
laboratory and field experiments, there is a direct relationship between the
background [Ba/Ca]shell and [Ba/Ca]water in M. edulis shells. The laboratory and field
data provided background Ba/Ca partition coefficients (DBa) of 0.10 ± 0.02 and 0.071
± 0.001, respectively. This range is slightly higher than the DBa previously determined 50
for inorganic calcite, and slightly lower than foraminiferal calcite. These data suggest
that M. edulis shells can be used as an indicator of [Ba/Ca]water, and therefore, fossil or
archaeological M. edulis shells could be used to extend knowledge of estuarine
dissolved Ba throughputs back in time. Moreover, considering the inverse relationship
between [Ba/Ca]water and salinity, background [Ba/Ca]shell data could be used as an 55
estuary specific indicator of salinity. The cause of the [Ba/Ca]shell peaks are more
confusing, both the laboratory and field experiments indicate that they cannot be used
as a direct proxy of [Ba/Ca]water or phytoplankton production, but may possibly be
caused by barite ingestion.
60
Keywords: Ba/Ca, biogenic carbonate, mollusk, estuary, isotope, diet, hemolymph,
trace element, salinity
Barium in Mytilus shells Gillikin et al.
3
1. INTRODUCTION
In recent years there has been an increasing amount of papers presenting high 65
resolution elemental profiles in bivalve shells. Unlike corals and foraminifera, much
of the bivalve data presented suggests that many of these elemental profiles (e.g., Sr,
Mn, Pb, U), which often largely differ from expected concentrations based on
inorganic and other biogenic carbonates, cannot be used as proxies of environmental
conditions (e.g., Stecher et al., 1996; Purton et al., 1999; Vander Putten et al, 2000; 70
Takesue and van Geen, 2004; Freitas et al., 2005; Gillikin et al., 2005a; Gillikin,
2005). There have been some promising reports of bivalve shell Mg/Ca ratios as a
proxy of sea surface temperature (SST) (Klein et al., 1996), but other reports illustrate
that this is not always the case, and is apparently strongly species specific (Vander
Putten et al, 2000; Takesue and van Geen, 2004; Freitas et al., 2005; Gillikin, 2005; 75
Lorrain et al., in press). Bivalve shell Ba/Ca ratios on the other hand have been shown
to be highly reproducible between specimens and have been hypothesized to be a
proxy of both particulate Ba (Stecher et al., 1996; Vander Putten et al, 2000; Lazareth
et al., 2003) and dissolved Ba (Torres et al., 2001), and therefore could be particularly
promising. 80
The oceanic barium cycle has received much attention over the past several decades
(e.g., Chan et al., 1977; Dehairs et al., 1980; 1992; Paytan and Kastner, 1996;
McManus et al., 2002; Jacquet et al., 2005). This is due in part to the use of Ba as a
paleoproductivity and paleoalkalinity proxy (Dymond et al., 1992; Lea, 1993; 85
McManus et al., 1999). Barium enters the oceans from river or ground water inputs,
which pass through estuaries and the coastal zone (Carroll et al., 1993; Guay and
Falkner, 1997; 1998; Shaw et al., 1998). Obtaining insight into the magnitude and
temporal variability of these Ba inputs is important for understanding the oceanic Ba
cycle and residence time, as shown by many studies (Edmond et al., 1978; Moore and 90
Edmond, 1984; Coffey et al., 1997; Guay and Falkner, 1997; 1998); however,
historical records of riverine inputs are lacking. Having a proxy of Ba inputs from
estuaries or the coastal zone that can be extended back in time would be highly
valuable.
95
Barium in Mytilus shells Gillikin et al.
4
Barium / calcium ratios have been proposed as a proxy of dissolved seawater Ba/Ca in
aragonitic corals (Tudhope et al., 1996; McCulloch et al., 2003; Sinclair and
McCulloch, 2004), calcitic foraminifera (Lea and Boyle, 1989; 1991) and vesicomyid
clam shells (Torres et al., 2001), providing information on salinity, nutrient and
alkalinity distributions in past oceans. 100
To date, all published records of high resolution Ba profiles in bivalve shells (both
aragonite and calcite) have similar characteristics with a more or less stable
background Ba concentration, interspaced with sharp episodic Ba peaks (Stecher et
al., 1996; Toland et al., 2000; Vander Putten et al., 2000; Torres et al., 2001; Lazareth 105
et al., 2003; Gillikin, 2005). Stecher et al. (1996) first proposed that these peaks were
the result of the filter feeding bivalves ingesting Ba-rich particles associated with
diatom blooms, as either phytoplankton, or barite. It is well known that primary
productivity and barite formation are closely associated (e.g., Dehairs et al., 1980;
1987). Once inside the digestive tract, Ba may be metabolized and moved via the 110
hemolymph to the extrapallial fluid (EPF), where shell precipitation occurs (Wilbur
and Saleuddin, 1983). Vander Putten et al. (2000) found a remarkable coincidence of
the Ba peaks in several mussel shells collected at the same site, providing further
evidence that an environmental parameter controls their occurrence. However, this
hypothesis remains untested. Furthermore, there are no studies reporting the Ba/Ca 115
partition coefficient (DBa = (Ba/Ca)carbonate / (Ba/Ca)water) for bivalves and the only
study suggesting that bivalves record dissolved Ba may possibly have included the
effects of these shell Ba peaks (see Torres et al., 2001). Rosenthal and Katz (1989)
found a good correlation between dissolved Ba/Ca and shell Ba/Ca in two species of
freshwater aragonitic gastropods, but analyzed large shell sections and may have also 120
included shell Ba/Ca peaks.
The aim of this study was to assess if calcite shells of the common mussel, Mytilus
edulis, contain barium in proportion to the water in which they grew. To validate this
proxy, we measured Ba concentrations in the shells, soft tissues and hemolymph of 125
mussels exposed to different levels of dissolved Ba in the laboratory as well as
mussels fed diets with varying Ba concentrations. To calibrate the proxy on natural
populations, a field study along the Westerschelde Estuary (The Netherlands) was
conducted, where mussels were grown along a salinity gradient while elemental
Barium in Mytilus shells Gillikin et al.
5
concentrations and physico-chemical water parameters were regularly monitored. 130
This experimental setup allowed us to compare data from both culture and natural
situations.
2. MATERIALS AND METHODS
2.1 Laboratory experiments 135
2.1.1 Dissolved Ba experiment
Mytilus edulis were collected from the Oosterschelde estuary near Wemeldinge, The
Netherlands (salinity ~ 35; temperature ~ 8 ºC) on 1 March 2004 (Fig. 1). Epibionts 140
were gently removed and the mussels were acclimated to laboratory conditions at 9.2
± 0.3 ºC (mean ± standard deviation) for 7 days, then another 14 days at 14.7 ± 0.2 ºC
(i.e., 21 days acclimation; temperature monitored hourly with a TidBit data logger,
Onset Computer Corp.). During acclimation, mussels were fed three times per week
with 12 mg of dried yeast per animal per week (Artemic Systems, LANSY PZ). After 145
the acclimation period, 40 mussels (2.8 ± 0.3 cm length) were selected for the
‘dissolved Ba’ experiment and were stained with calcein (200 mg l-1; C30H26N2O13;
Sigmal Chemical) for 20 hours to mark the beginning of the experiment in the shell
(see Rowley and Mackinnon, 1995). Afterwards, 10 mussels were placed in each of
four aquaria containing 10 l of filtered (10 µm) North Sea water spiked with 150
approximately 0, 110, 220 and 440 nmol l-1 of Ba (as BaCl2) (Table 1). Water was
continuously circulated through acid washed plastic filters (except during feeding
periods, see further) and was aerated. Mussels were fed the same quantities of yeast as
during the acclimation period. Feeding took place for three hours, three times per
week. Mussels were fed in their separate aquaria during which the filtration pumps 155
were turned off. This experiment ran for 36 days, during which the water in all tanks
was changed weekly (similar to Lorens and Bender, 1980) and was maintained at 16.4
± 0.6 ºC with a pH of 7.9 ± 0.1 and salinity of 36.4 ± 0.9 (on occasion salinity was
adjusted with deionized water (>18MΩ cm-1) to compensate for evaporation; pH and
salinity were measured with a WTW multiline P4 multimeter). Water samples were 160
taken two times per week for [Ba/Ca]water using syringe filters (Macherey-Nagel;
Chromafil A45/25; cellulose mixed esters; 0.45 µm pore size), once just before and
Barium in Mytilus shells Gillikin et al.
6
after a water change, and were acidified with trace metal grade HCl to ~ pH 3.
Procedural blanks were also taken by filtering deionized water (>18MΩ cm-1).
165
2.1.2 Feeding experiment
To assess the effect of Ba being ingested as food, a feeding experiment was
conducted. In a fifth aquarium, two plastic mesh baskets, each with 10 mussels were 170
held under the same conditions, except that there was 20 l of water to compensate for
the higher density of animals and they were fed differently. These mussels were fed in
separate aquaria with different foods. One batch was fed a slurry of living
phytoplankton (Chlamidomonas reinhardii) grown in a ‘normal’ Tris-Acetate-
Phosphate (TAP) medium (hereafter referred to as phyto +0) with the phytoplankton 175
containing 5.87 ± 0.51 nmol g-1 dry weight (DW) Ba (n = 3), whereas the other batch
were fed the same phytoplankton species, which were grown in a Ba rich TAP
medium (spiked with 730 nmol l-1 Ba; hereafter referred to as phyto +100; see
Steenmans (2004) for more details regarding phytoplankton culturing) with [Ba] =
14.56 ± 0.95 nmol g-1 DW (n = 3). Both batches were fed for 1 hour per day, five days 180
per week, with a total of 18 mg phytoplankton (DW) per animal per week. This
provided three levels of Ba in food given to mussels maintained in normal seawater
Ba concentrations (i.e., yeast (with [Ba] = 3.35 ± 0.32 nmol g-1 DW (n = 3)), phyto +0
and phyto +100). After feeding, mussels were returned to their aquarium. This
experiment was run for 29 days; water maintenance and sampling was similar to the 185
dissolved Ba experiment. Mussels were sampled (7 per treatment) approximately 24
hours after the last feeding period. Mytilus edulis hemolymph has been determined to
have a slow turnover time based on the residence time (> 3 days) of a fluorescent dye
(Gillikin, 2005). Therefore, this sampling design should have captured any Ba
entering the hemolymph from the food. 190
2.1.3 Hemolymph, soft tissue and shell sampling
After the experiments were complete, mussels were removed from their aquaria one at
a time and were sampled for hemolymph, soft tissues and shells. Hemolymph was 195
sampled by blotting the shell dry, and then gently prying open the valves with a
Barium in Mytilus shells Gillikin et al.
7
scalpel, draining the mantle cavity and then sampling the hemolymph from the
adductor muscle with a sterile 5 ml syringe and needle. Procedural blanks were
prepared by drawing deionized water into a new syringe. Whole tissues were
dissected from the valves using a scalpel. Samples (hemolymph and tissues) and 200
blanks were transferred to micro-centrifuge tubes and were immediately frozen to -20
ºC until analysis. Shells were rinsed with deionized water (>18MΩ cm-1) and were air
dried.
A condition index was used to compare mussel health at the end of the experiments 205
([shell length / shell width] / tissue dry weight) to mussels health at the end of the
acclimation period (beginning of experiments), which indicated that all animals were
healthy (ANOVA, LSD test, p > 0.05 for all).
2.2 Field experiment 210
Mytilus edulis (~ 3 cm) were collected from the Oosterschelde (The Netherlands; Fig.
1). The Oosterschelde estuary was dammed in the late eighties and now has more or
less marine salinities (S > 30; Gerringa et al., 1998). Mussels were transported back to
the laboratory where epibionts were removed. They were then stained with calcein as 215
in the previously described experiments. Within the next week (on 24 Oct. 2001), 50
mussels were placed into four stainless steel cages and these were deployed along an
estuarine salinity gradient in the Westerschelde estuary (Fig. 1; see Baeyens et al.,
1998 for a general description of the Westerschelde). Cages were attached at the same
tidal level as the highest density of ‘local’ mussels at Ossenisse (OS; the most 220
upstream occurrence of wild Mytilus populations), Griete (GR), Hooftplaat (HF), and
Knokke (KN; Fig. 1). Water temperature was monitored at each site hourly using a
TidBit data logger. Near-shore water was sampled monthly at high tide for one year
(Nov. 2001- Nov. 2002) and every two weeks between March and May for salinity,
dissolved Ba/Ca, and chlorophyll a (Chl a). Salinity was measured in situ with a 225
WTW multiline P4 multimeter. [Ba/Ca]water was sampled by filtering 250 to 500 ml of
seawater through 0.4 µm polycarbonate filters (Osmonics poretics). The filtrate was
acidified with trace metal grade HNO3 to ~ pH 3. Blanks were prepared by filtering
deionized water (>18MΩ cm-1) through the same system and blank filter.
Phytoplankton pigments were sampled by filtering 200 to 500 ml of seawater through 230
Barium in Mytilus shells Gillikin et al.
8
Whatman GF-F filters (nominal porosity = 0.7 µm). Filters were wrapped in
aluminum foil and placed in liquid nitrogen; three replicates were taken at each
sampling. Upon return to the laboratory, samples were transferred to a –85 ºC freezer
until analysis.
Mussels were collected on four different dates (29 Sept. 02, 9 Dec. 02, 20 Feb. 03 and 235
21 Apr. 03). Mussels transplanted to OS did not survive (undoubtedly due to the
salinity shock) and therefore local mussels from this site were used. Similarly, the
wave action at KN repeatedly destroyed cages and all mussels were lost; so again at
this site, mussels from the local population were used.
240
2.3 Sample preparation and analysis
All water samples for dissolved Ba and Ca analysis were diluted with deionized water
(>18MΩ cm-1) to assure a salt concentration less than 0.2 %. Ba was measured on a
VG PlasmaQuad II+ inductively coupled plasma mass spectrometer (ICP-MS) using 245
In as an internal standard. Calcium was measured with an IRIS Thermo Jarrell Ash
Corp. ICP- optical emission spectrometer (ICP-OES) using Yt and Au as internal
standards. Certified reference materials (CRM) were run to check for precision and
accuracy. The reproducibility of the SLRS-3 water standard was < 4 % (%RSD) for
both Ba and Ca and mean values were within 5 % of the recommended values for 250
both elements (n = 8). Phytoplankton pigments were analyzed at NIOO-CEME,
Yerseke, NL, using reverse-phase HPLC (see Gieskes et al., 1988) with a
reproducibility of 2.7 % (or 0.3 µg/l; 1σ) for Chl a, based on an in-house standard (n =
7).
255
Hemolymph samples were defrosted and 150 µl of sample was pipetted into a clean
Teflon beaker. The sample was digested by adding 150 µl HNO3 and 150 µl H2O2
(trace metal grade) and allowing the reaction to take place in the sealed beaker at 60
°C for more than 12 hours. In and Re were used as internal standards to control
instrument fluctuations. Samples were analyzed for Ba and Ca on a Finnigan 260
Element2 High Resolution-Inductively Coupled Plasma-Mass Spectrometer (HR-ICP-
MS). Samples were diluted 20 times with deionized water (>18MΩ cm-1) to assure a
salt concentration less than 0.2 %. Reproducibility of seawater and hemolymph
Barium in Mytilus shells Gillikin et al.
9
samples was < 5 % for both Ba and Ca ([Ba/Ca]hemolymph = 3.8 ± 0.2 µmol/mol, n = 9,
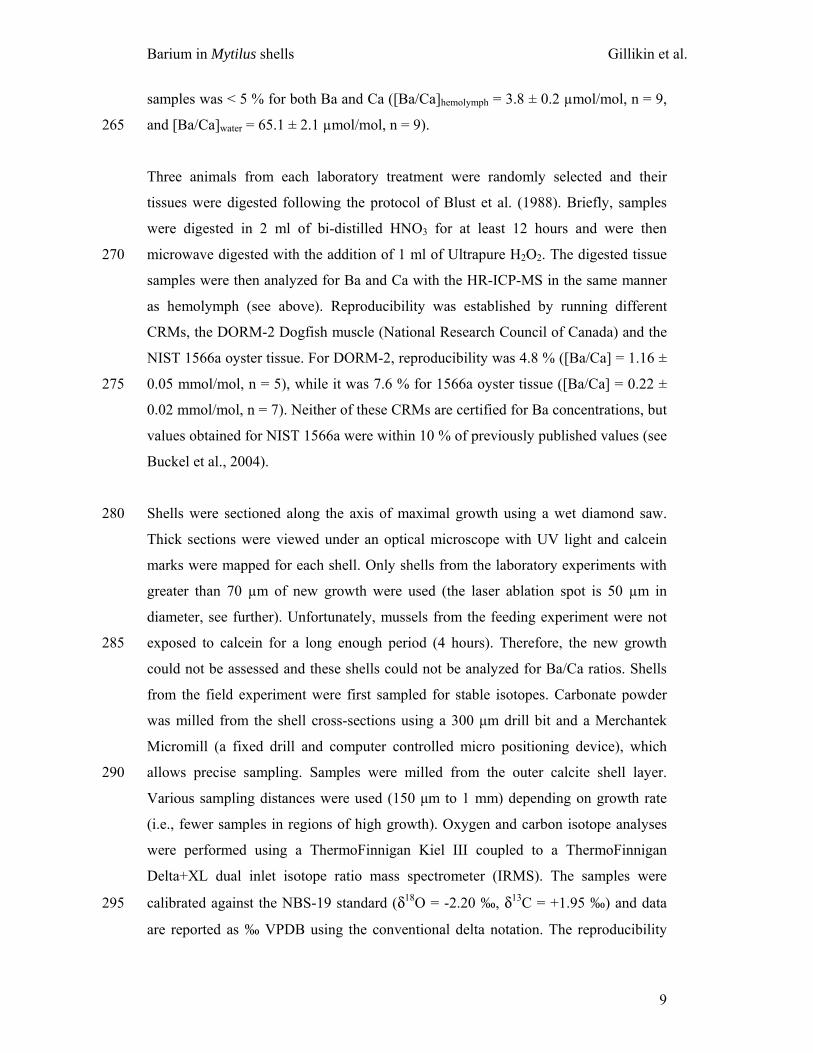
and [Ba/Ca]water = 65.1 ± 2.1 µmol/mol, n = 9). 265
Three animals from each laboratory treatment were randomly selected and their
tissues were digested following the protocol of Blust et al. (1988). Briefly, samples
were digested in 2 ml of bi-distilled HNO3 for at least 12 hours and were then
microwave digested with the addition of 1 ml of Ultrapure H2O2. The digested tissue 270
samples were then analyzed for Ba and Ca with the HR-ICP-MS in the same manner
as hemolymph (see above). Reproducibility was established by running different
CRMs, the DORM-2 Dogfish muscle (National Research Council of Canada) and the
NIST 1566a oyster tissue. For DORM-2, reproducibility was 4.8 % ([Ba/Ca] = 1.16 ±
0.05 mmol/mol, n = 5), while it was 7.6 % for 1566a oyster tissue ([Ba/Ca] = 0.22 ± 275
0.02 mmol/mol, n = 7). Neither of these CRMs are certified for Ba concentrations, but
values obtained for NIST 1566a were within 10 % of previously published values (see
Buckel et al., 2004).
Shells were sectioned along the axis of maximal growth using a wet diamond saw. 280
Thick sections were viewed under an optical microscope with UV light and calcein
marks were mapped for each shell. Only shells from the laboratory experiments with
greater than 70 µm of new growth were used (the laser ablation spot is 50 µm in
diameter, see further). Unfortunately, mussels from the feeding experiment were not
exposed to calcein for a long enough period (4 hours). Therefore, the new growth 285
could not be assessed and these shells could not be analyzed for Ba/Ca ratios. Shells
from the field experiment were first sampled for stable isotopes. Carbonate powder
was milled from the shell cross-sections using a 300 µm drill bit and a Merchantek
Micromill (a fixed drill and computer controlled micro positioning device), which
allows precise sampling. Samples were milled from the outer calcite shell layer. 290
Various sampling distances were used (150 µm to 1 mm) depending on growth rate
(i.e., fewer samples in regions of high growth). Oxygen and carbon isotope analyses
were performed using a ThermoFinnigan Kiel III coupled to a ThermoFinnigan
Delta+XL dual inlet isotope ratio mass spectrometer (IRMS). The samples were
calibrated against the NBS-19 standard (δ18O = -2.20 ‰, δ13C = +1.95 ‰) and data 295
are reported as ‰ VPDB using the conventional delta notation. The reproducibility
Barium in Mytilus shells Gillikin et al.
10
(1σ) of the routinely analyzed carbonate standard is better than 0.1 ‰ for both δ18O
and δ13C (more details can be found in Gillikin et al., 2005b). High resolution Ba/Ca
profiles from field grown shells were obtained using either solution nebulization HR-
ICP-MS (SN-HR-ICP-MS) on micromilled powders (powders were milled directly 300
beneath the isotope sample to assure proper alignment of the data and to remove
surface contamination) or by laser ablation ICP-MS (LA-ICP-MS; see below). All
shells from the dissolved Ba experiment with adequate growth were analyzed for
Ba/Ca using the LA-ICP-MS.
305
Carbonate powders for Ba/Ca analyses (~ 150 µg) were dissolved in a 1 ml 5 %
HNO3 solution containing 1 ppb of In and Re, which were used as internal standards.
Reproducibility of Ba/Ca ratios over the sampling period was 6.6 % (1σ; or 0.06
µmol/mol) based on replicate measurements of a M. edulis in-house reference
material ([Ba/Ca] = 0.96 µmol/mol; n = 8). Accuracy was assessed using the USGS 310
MACS1 carbonate standard ([Ba/Ca] = 84.76 µmol/mol) and was found to be within 1
% of the recommended value (n = 6; values from S. Wilson, USGS, unpublished data,
2004).
Data from LA-ICP-MS were calibrated using both the NIST 610 (values from Pearce 315
et al. (1997)) and the USGS MACS1 (values from S. Wilson, USGS, unpublished
data, 2004). The laser was shot (~50 µm spots) directly in the holes of the isotope
sampling allowing direct alignment of Ba/Ca and isotope profiles for the field
experiment (cf. Toland et al., 2000). All shells from the laboratory experiment were
analyzed in front of the calcein mark (one analysis per shell, if growth was less than 320
50 µm, the shell was not sampled). Calibration (including gas blank subtraction, 43Ca
normalization, and drift correction) was performed offline following Toland et al.
(2000). Ba/Ca reproducibility over the sampling period was 0.11 µmol/mol (1σ; or
12.8 %) at the 1 µg/g level (MACS2, mean = 0.9 µmol/mol, n = 17) and 5.9 µmol/mol
(1σ; or 7.3 %) at the 80 µg/g level (MACS1, mean = 80.5 µmol/mol, n = 47), which 325
covers the full range of Ba/Ca values encountered in this study (see results). Accuracy
was assessed using MACS2; as there is no recommended value available for MACS2,
we used our own SN-HR-ICP-MS data (MACS2 = 0.90 ± 0.07 µmol/mol (n = 5),
which indicate a robust LA-ICP-MS calibration. Details of operating conditions can
Barium in Mytilus shells Gillikin et al.
11
be found in Lazareth et al. (2003). Briefly, the system consists of a Fisons-VG 330
frequency quadrupled Nd-YAG laser (266 nm) coupled to a Fisons-VG PlasmaQuad
II+ mass spectrometer.
The background or baseline [Ba/Ca]shell was selected by first omitting obvious peaks
(e.g., ~15 – 22 mm from the umbo in shell KN200203), then omitting all data that was
greater than 50 % of the (peak-less) mean. This was repeated until the change in mean 335
[Ba/Ca]shell was less than 5 %. This provided an objective criterion for selecting
background [Ba/Ca]shell data.
3. RESULTS
340
3.1 Laboratory experiments
3.1.1 Hemolymph
In the dissolved Ba experiment, Mytilus edulis [Ba/Ca]hemolymph was only slightly 345
different from the [Ba/Ca]water, with the linear least squares regression
[Ba/Ca]hemolymph = 0.86 (± 0.04) * [Ba/Ca]water + 2.26 (± 1.49) (1)
(in µmol/mol; R2 = 0.98, p < 0.0001, n = 36, in four treatments) (Fig 2, Table EA1). 350
The errors of the regression coefficients reported above (and hereafter) represent the
95 % confidence intervals (95 % CI), and are based on among individual variation
and not among treatment variation. Despite the Ba difference in foods offered (3.35,
5.87 and 14.56 nmol g-1 DW Ba), hemolymph was similar between the three
treatments of the feeding experiment (Fig. 2, inset; Table EA1). 355
3.1.2 Tissues
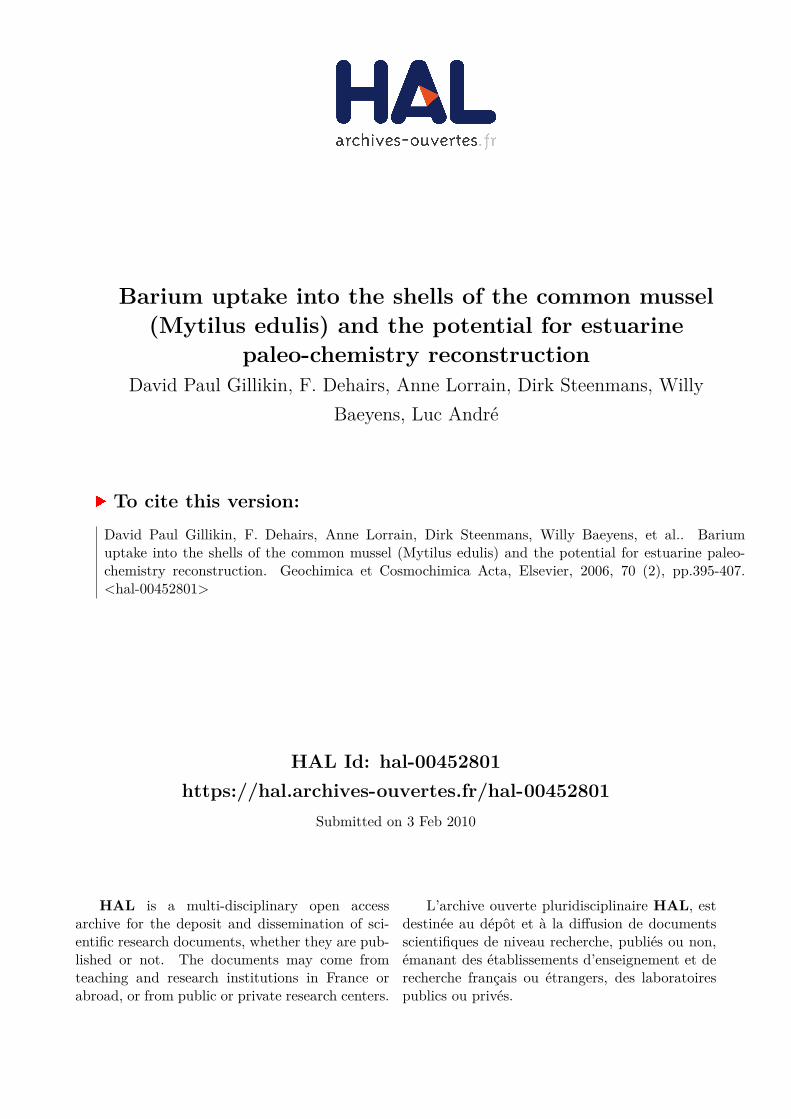
In the dissolved Ba experiment, tissue Ba/Ca was slightly enriched as compared to
[Ba/Ca]water in the ambient treatment but was reduced by almost half in the highest 360
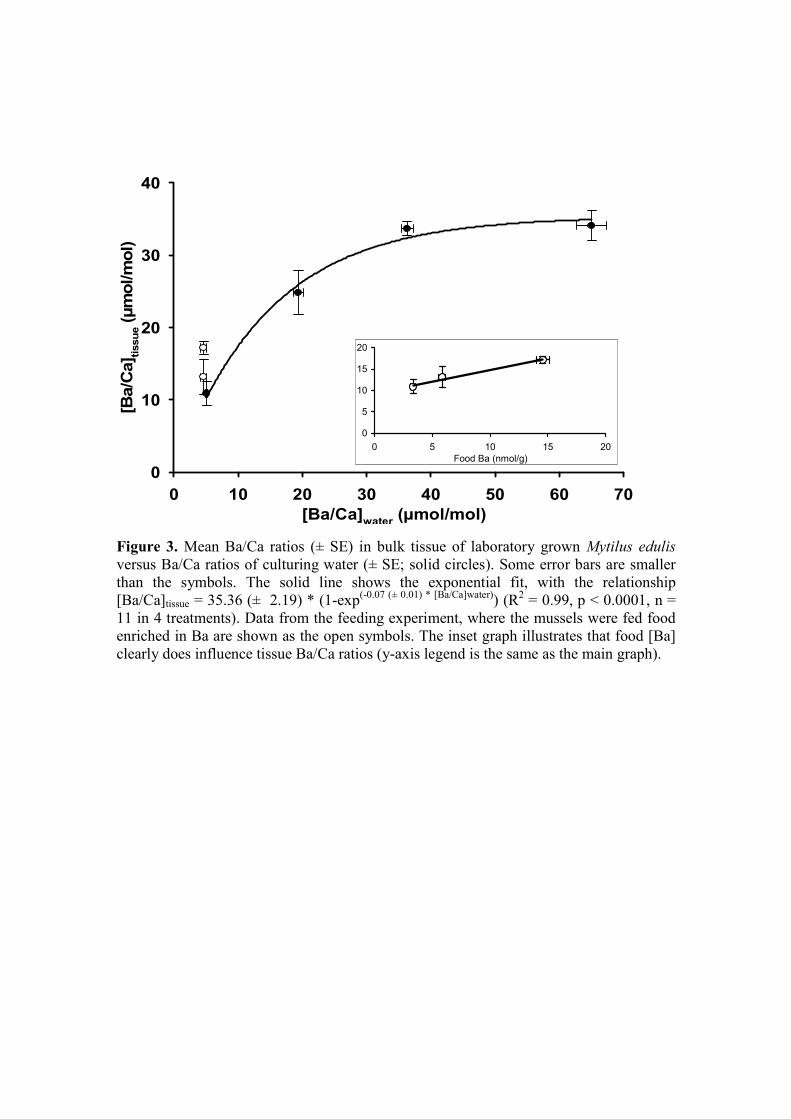
[Ba/Ca]water treatment (Fig. 3). This resulted in an exponential fit between water and
tissue
Barium in Mytilus shells Gillikin et al.
12
[Ba/Ca]tissue = 35.36 (± 2.19) * (1-exp(-0.07 (± 0.01) *[Ba/Ca]water)) (2)
365
(in µmol/mol; R2 = 0.99, p < 0.0001, n = 11, in four treatments) (Fig. 3, Table EA1).
Although we do not have enough data for statistics, it is clear that there is a trend of
increasing tissue Ba/Ca with increasing food Ba (Fig. 3, inset; Table EA1) in the
feeding experiment.
370
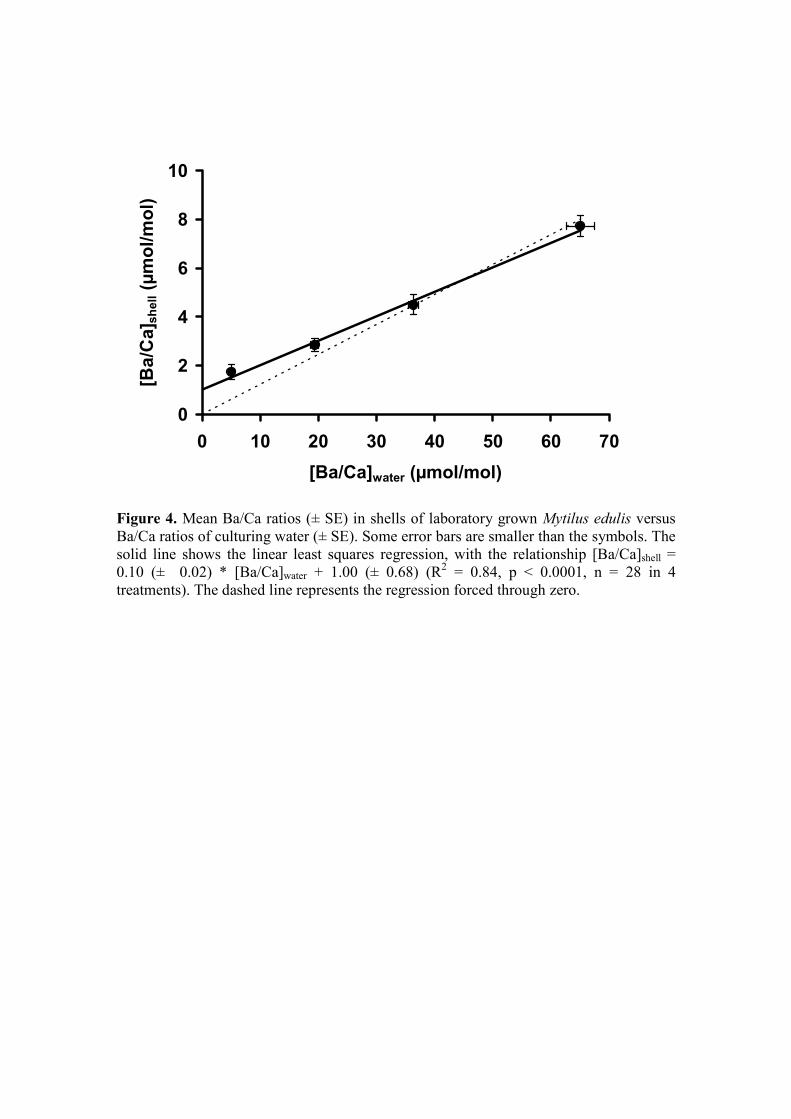
3.1.3 Shells
Between six to nine shells were analyzed for each Ba treatment (see Table EA1). In
the dissolved Ba experiment, [Ba/Ca]shell was directly proportional to [Ba/Ca]water with
the linear relationship 375
[Ba/Ca]shell = 0.10 (± 0.02) * [Ba/Ca]water + 1.00 (± 0.68) (3)
(in µmol/mol; R2 = 0.84, p < 0.0001, n = 28, in four treatments) (Fig 4, Table EA1).
To calculate the partition coefficient (DBa), many studies force the regression through 380
zero (see Lea and Spero, 1992; Zacherl et al., 2003); yet, considering that our
intercept is well above zero, we chose not to force through the origin, resulting in a
DBa of 0.10 ± 0.02 (95 % CI). However, it should be noted here that forcing through
the origin does not significantly change the DBa (0.12 ± 0.01; 95 % CI) (t-test, p =
0.38). 385
Although shells were collected in early March, prior to the onset of the spring
phytoplankton bloom (see further) and formation of the shell Ba/Ca peak, we
analyzed a few shells just behind the calcein mark to assess if the shells were
collected during the formation of a ‘Ba/Ca peak’, but these shell regions did not 390
exhibit elevated [Ba/Ca]shell indicative of the Ba/Ca peak.
3.2 Field experiment
3.2.1 Environmental parameters 395
Barium in Mytilus shells Gillikin et al.
13
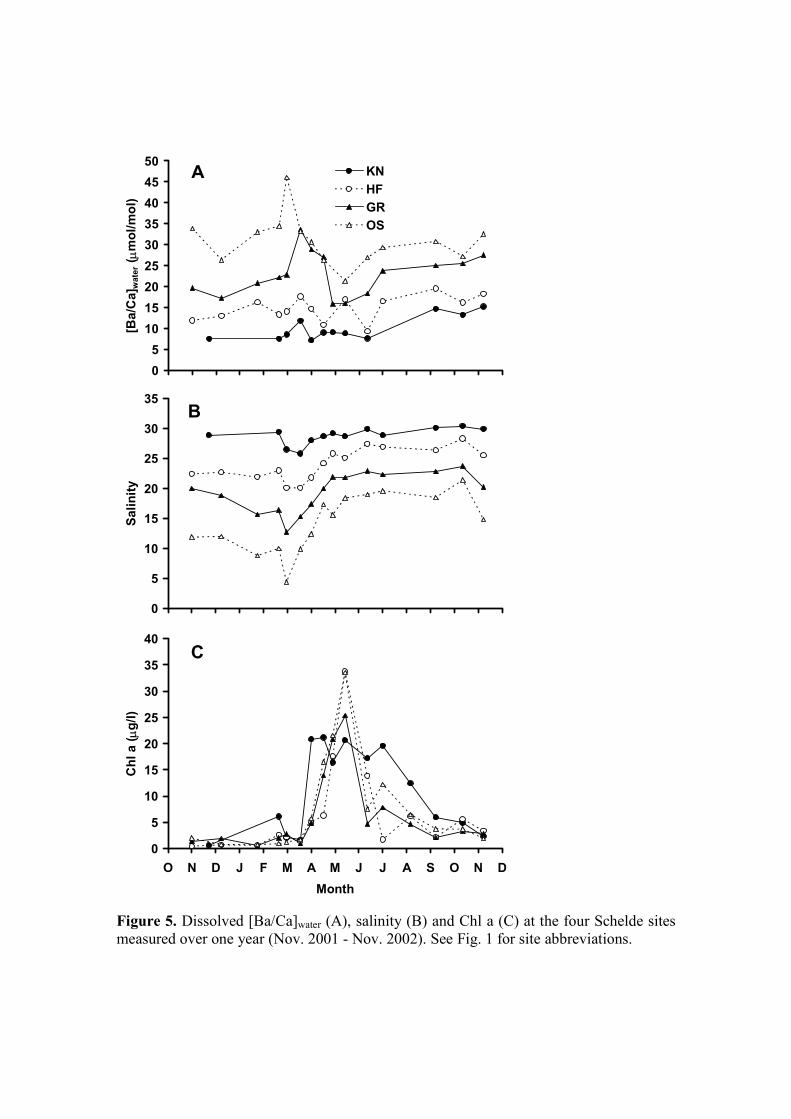
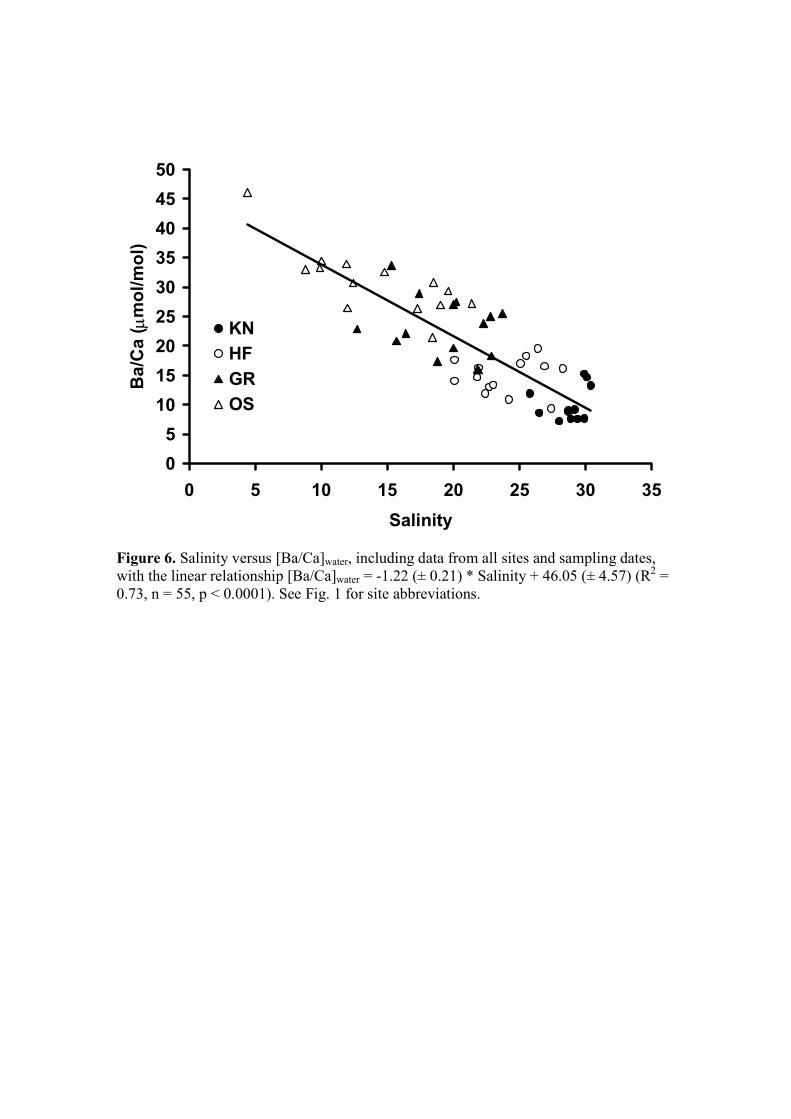
All four sites had significantly different salinity and [Ba/Ca]water values (Fig. 5A, B;
ANOVA, p < 0.0001; post hoc LSD test, all p < 0.01; Table EA2) and there was a
highly significant negative relationship between [Ba/Ca]water and salinity (Fig. 6; in
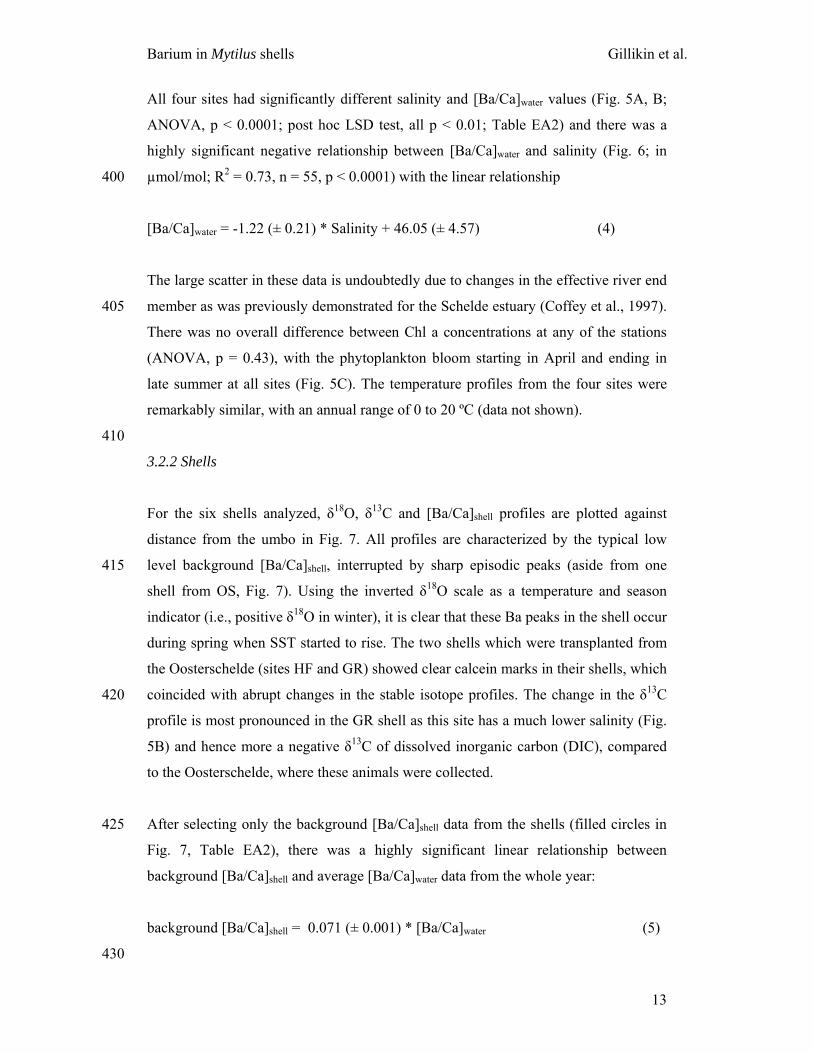
µmol/mol; R2 = 0.73, n = 55, p < 0.0001) with the linear relationship 400
[Ba/Ca]water = -1.22 (± 0.21) * Salinity + 46.05 (± 4.57) (4)
The large scatter in these data is undoubtedly due to changes in the effective river end
member as was previously demonstrated for the Schelde estuary (Coffey et al., 1997). 405
There was no overall difference between Chl a concentrations at any of the stations
(ANOVA, p = 0.43), with the phytoplankton bloom starting in April and ending in
late summer at all sites (Fig. 5C). The temperature profiles from the four sites were
remarkably similar, with an annual range of 0 to 20 ºC (data not shown).
410
3.2.2 Shells
For the six shells analyzed, δ18O, δ13C and [Ba/Ca]shell profiles are plotted against
distance from the umbo in Fig. 7. All profiles are characterized by the typical low
level background [Ba/Ca]shell, interrupted by sharp episodic peaks (aside from one 415
shell from OS, Fig. 7). Using the inverted δ18O scale as a temperature and season
indicator (i.e., positive δ18O in winter), it is clear that these Ba peaks in the shell occur
during spring when SST started to rise. The two shells which were transplanted from
the Oosterschelde (sites HF and GR) showed clear calcein marks in their shells, which
coincided with abrupt changes in the stable isotope profiles. The change in the δ13C 420
profile is most pronounced in the GR shell as this site has a much lower salinity (Fig.
5B) and hence more a negative δ13C of dissolved inorganic carbon (DIC), compared
to the Oosterschelde, where these animals were collected.
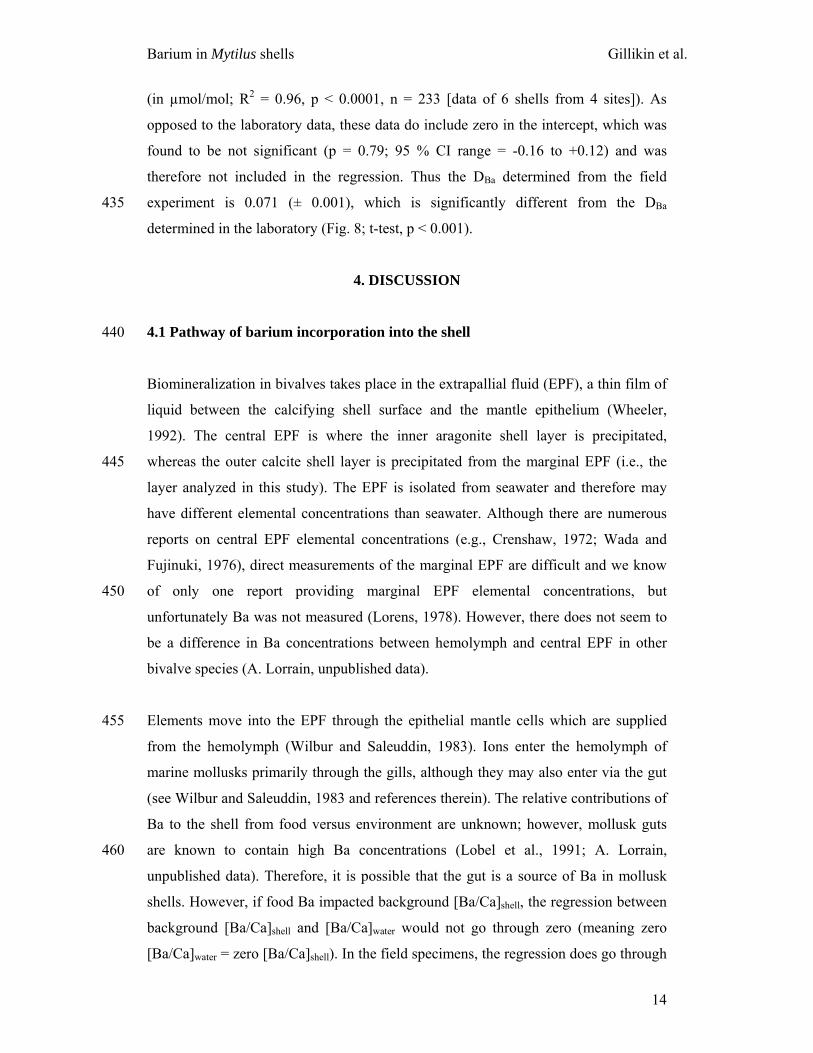
After selecting only the background [Ba/Ca]shell data from the shells (filled circles in 425
Fig. 7, Table EA2), there was a highly significant linear relationship between
background [Ba/Ca]shell and average [Ba/Ca]water data from the whole year:
background [Ba/Ca]shell = 0.071 (± 0.001) * [Ba/Ca]water (5)
430
Barium in Mytilus shells Gillikin et al.
14
(in µmol/mol; R2 = 0.96, p < 0.0001, n = 233 [data of 6 shells from 4 sites]). As
opposed to the laboratory data, these data do include zero in the intercept, which was
found to be not significant (p = 0.79; 95 % CI range = -0.16 to +0.12) and was
therefore not included in the regression. Thus the DBa determined from the field
experiment is 0.071 (± 0.001), which is significantly different from the DBa 435
determined in the laboratory (Fig. 8; t-test, p < 0.001).
4. DISCUSSION
4.1 Pathway of barium incorporation into the shell 440
Biomineralization in bivalves takes place in the extrapallial fluid (EPF), a thin film of
liquid between the calcifying shell surface and the mantle epithelium (Wheeler,
1992). The central EPF is where the inner aragonite shell layer is precipitated,
whereas the outer calcite shell layer is precipitated from the marginal EPF (i.e., the 445
layer analyzed in this study). The EPF is isolated from seawater and therefore may
have different elemental concentrations than seawater. Although there are numerous
reports on central EPF elemental concentrations (e.g., Crenshaw, 1972; Wada and
Fujinuki, 1976), direct measurements of the marginal EPF are difficult and we know
of only one report providing marginal EPF elemental concentrations, but 450
unfortunately Ba was not measured (Lorens, 1978). However, there does not seem to
be a difference in Ba concentrations between hemolymph and central EPF in other
bivalve species (A. Lorrain, unpublished data).
Elements move into the EPF through the epithelial mantle cells which are supplied 455
from the hemolymph (Wilbur and Saleuddin, 1983). Ions enter the hemolymph of
marine mollusks primarily through the gills, although they may also enter via the gut
(see Wilbur and Saleuddin, 1983 and references therein). The relative contributions of
Ba to the shell from food versus environment are unknown; however, mollusk guts
are known to contain high Ba concentrations (Lobel et al., 1991; A. Lorrain, 460
unpublished data). Therefore, it is possible that the gut is a source of Ba in mollusk
shells. However, if food Ba impacted background [Ba/Ca]shell, the regression between
background [Ba/Ca]shell and [Ba/Ca]water would not go through zero (meaning zero
[Ba/Ca]water = zero [Ba/Ca]shell). In the field specimens, the regression does go through
Barium in Mytilus shells Gillikin et al.
15
zero (Fig. 8). This, together with the good correlation with [Ba/Ca]water, makes it very 465
unlikely that food is a major source of Ba to the shell during those times when
background [Ba/Ca]shell is observed. Nevertheless ingested particulate Ba may be
involved in the formation of the [Ba/Ca]shell peaks (see section 4.3).
4.2 Mytilus edulis calcite DBa 470
Both the laboratory and field experiments verify that there is a direct relationship
between background [Ba/Ca]shell and [Ba/Ca]water in M. edulis calcite. A possible
reason for the difference in slopes between the laboratory and field experiment
[Ba/Ca]shell vs. [Ba/Ca]water (Fig. 8) may be that we did not replicate treatments in the 475
laboratory, but only individuals within a treatment, while we had an overall low
number of samples form the field experiment. An alternative explanation could be
that the stress of handling and the suddenly increased Ba concentration in the
laboratory experiments caused a saturation of the ionoregulatory ability of the animal.
Lorens and Bender (1980) found that elemental ratios in shells increased in laboratory 480
held M. edulis for a short while, then decreased (they termed this section of the shell
“transition zone calcite” (or TZC)). They proposed that this was caused by the stress
of capture and the adjustment to a new environment. Although we acclimated these
animals to laboratory conditions for three weeks, the change to the experimental
conditions may have caused stress and we may have included TZC in our analyses. 485
This could explain the higher DBa in the laboratory cultured mussels. Furthermore, the
fact that the regression does not go through the origin supports this. As in the field
population, it can be expected that when there is zero Ba in the water, there should be
zero Ba in the shell. Interestingly, as the hemolymph can be expected to represent the
crystallization fluid better than seawater, when a regression between hemolymph and 490
shell is performed (laboratory experiment), the regression does go through the origin
(intercept not significant, p = 0.07). The DBa calculated using hemolymph, 0.134 (±
0.006) (R2 = 0.95, n = 25, p < 0.0001), is also more similar to that for planktonic
foraminifera (see further).
495
Alternatively, the field DBa may also not be accurate, we averaged the [Ba/Ca]water
from the whole year, while it is clear that the background [Ba/Ca]shell is formed from
approximately mid-summer to the end of the growing season. Selecting only the
Barium in Mytilus shells Gillikin et al.
16
[Ba/Ca]water from July to November changes the regression slightly, but significantly
to background [Ba/Ca]shell = 0.091 (± 0.006) * [Ba/Ca]water – 0.52 (± 0.17) (R2 = 0.76, 500
p < 0.0001), and when only selecting September to November it changes to
background [Ba/Ca]shell = 0.081 (± 0.006) * [Ba/Ca]water – 0.26 (± 0.15) (R2 = 0.76, p
< 0.0001). Therefore, considering both the laboratory and field data, we propose that
the DBa for M. edulis lies within the range of 0.07 to 0.12. Furthermore, the algorithm
used to select the background [Ba/Ca]shell data used here may be excluding some 505
[Ba/Ca]water data stored in the shell. It is possible that all [Ba/Ca]shell data between
large [Ba/Ca]shell peaks are recording [Ba/Ca]water. If this was the case, seasonal
[Ba/Ca]water could be reconstructed; however, this could only be determined from
more detailed experiments. Nevertheless, these data do illustrate that average
[Ba/Ca]water can be estimated from M. edulis shells using the proposed algorithm to 510
select the background [Ba/Ca]shell data.
It should be noted that incorporation of elements in calcite with ionic radii larger than
calcium (such as Ba) are expected to be strongly affected by external factors, such as
temperature or salinity (Pingitore and Eastman, 1984; Morse and Bender, 1990). We 515
are unable to determine if salinity has an effect or not. The strong relationship in the
field between [Ba/Ca]water and salinity makes it difficult to deconvolve the effects,
whereas in the laboratory salinity was similar in all treatments. Therefore, this could
be another reason for the difference in intercepts between the two experiments.
Considering the seasonal 20 ºC temperature range at these sites (from ~0 to 20 ºC), 520
and the stable background [Ba/Ca] ratios observed in these shells, it does not seem
likely that there is a major temperature effect on background DBa in M. edulis. This is
most probably true for all bivalves as well, as the stable Ba background in all
published data is evident and temperature almost always has a seasonal cyclicity.
Similarly, Lea and Spero (1994) did not find an influence of temperature on DBa in 525
foraminifera, and no temperature effect has been reported for inorganic calcite.
However, definitive experiments should be carried out to confirm that temperature
does not affect bivalve background [Ba/Ca] ratios.
Abiogenic experiments on the DBa in calcite have provided a range of values, which is 530
probably due to unconstrained precipitation rates in many of the experiments
(Tesoriero and Pankow, 1996). For the range of M. edulis shell precipitation rates
Barium in Mytilus shells Gillikin et al.
17
estimated by Lorens (1981), DBa is expected to range between 0.03 and 0.05
according to the abiogenic calcite experiments of Tesoriero and Pankow (1996).
Pingitore and Eastman (1984) provided an inorganic DBa of 0.06 ± 0.01, which is very 535
similar to the low end of the range we estimate for M. edulis DBa (i.e., 0.07).
Planktonic foraminifera, on the other hand can have higher DBa than M. edulis,
ranging from 0.09 to 0.19 (Lea and Boyle, 1991; Lea and Spero, 1992; 1994),
whereas benthic foraminifera have an even higher DBa in both laboratory (0.2 – 0.5;
Havach et al., 2001) and field based studies (0.37; Lea and Boyle, 1989). It can 540
generally be considered that when the partition coefficient of a particular element
(DMe) is far from inorganically determined DMe, then other factors most likely
influence DMe, such as the physiology of the organism or other biological factors. For
example, Sr/Ca in corals has been shown to be a good SST proxy and the DSr is close
to one (Weber, 1973), which is similar to abiogenic aragonite (Kinsman and Holland, 545
1969), whereas in aragonitic bivalve shells the DSr is around 0.25 and there is no link
with SST (Gillikin et al., 2005a). The fact that foraminiferal Ba/Ca has successfully
been used as a proxy of dissolved Ba/Ca, and that the foraminiferal DBa is farther from
expected values than M. edulis, further implies that Ba/Ca in M. edulis has great
potential as a robust proxy of dissolved seawater Ba/Ca, as there should be an even 550
smaller biological effect in M. edulis calcite.
To test this proxy further, we use the shell GR210403 data for the period preceding
transplantation. These data should be representative of Oosterschelde conditions with
salinity above 30 (see section 2.2). The background [Ba/Ca]shell before transplantation 555
is 0.98 ± 0.05 (n = 13), which corresponds to a [Ba/Ca]water of 13.8 ± 0.7 when using
a DBa of 0.07 and 8.2 ± 0.4 when using a DBa of 0.12. A range of [Ba/Ca]water of 8 to
14 is reasonable for a salinity of about 30 (Fig. 6) and provides additional evidence
that even at low [Ba/Ca]water, this is a good proxy.
560
4.3 High resolution barium profiles
Our results confirm the general Ba profiles recorded in other bivalves (e.g., Stecher et
al., 1996; Toland et al., 2000; Vander Putten et al., 2000; Torres et al., 2001; Lorrain,
2002; Lazareth et al., 2003; Gillikin, 2005), with a stable background signal 565
interrupted by sharp episodic peaks, generally occurring in the spring (using δ18O as a
Barium in Mytilus shells Gillikin et al.
18
relative temperature scale). The unstable background Ba in OS shells probably
reflects the highly variable salinity at this site. Another striking feature of the profiles
is that the peak amplitude seems to be correlated to the mussels’ age, with younger
shell sections having larger peaks. For example, shell KN200203 has a large Ba/Ca 570
peak ~ 20 µmol/mol at 15 – 22 mm of growth, while in the same shell at 38 – 40 mm
the peak only reaches ~ 5 µmol/mol (Fig. 7). This is reproduced in the other shells as
well, with a large peak around 24 mm in shell GR210403 and small peaks around 35
– 40 mm in shells KN9 290902 and HF091202 (Fig. 7). This trend was also found by
Vander Putten et al. (2000), who collected their M. edulis shells from the same 575
estuary in 1997, suggesting that peak amplitude is not environmentally controlled.
However, this could be an averaging effect, with the sample size integrating more
growth time as shell growth slows with age (see Goodwin et al., 2001). Considering
the width of the peaks, this does not seem probable and is more likely a physiological
effect of ageing (see further). 580
There are several hypotheses which could explain the [Ba/Ca]shell peaks. The
hypothesis of Stecher et al. (1996), that either Ba-rich phytoplankton or barite formed
in decaying phytoplankton flocs are ingested by the filter feeding bivalve and
eventually the Ba is sequestered in the shell, is plausible. However, our data do not 585
support a direct incorporation of Ba from phytoplankton ingestion into the shell.
Although we could not measure Ba in the shell in the feeding experiment, it can be
assumed that ingested Ba would have to pass through the hemolymph to get to the
EPF and be taken up in the shell (see section 4.1). We fed mussels food with different
Ba concentrations, which was taken up in the bulk tissues (Fig. 3 inset), but 590
hemolymph Ba concentrations did not increase (Fig. 2 inset). However, it is possible
that Ba concentrations in the food offered in this study were not high enough to have
an effect (maximum ~ 15 nmol/g). Although many marine phytoplankton species
contain barium concentrations similar to that of the food used in this study, certain
species can have barium concentrations as high as 420 nmol/g (dry weight; Dehairs et 595
al., 1980) (see Fisher et al. (1991) for review). Therefore, as previously suggested by
Stecher et al. (1996), the [Ba/Ca]shell peaks can still be related to phytoplanktonic
events in some way; for example, barite ingestion (see further) or uptake of specific
phytoplankton species containing high levels of barium. However, the lack of a
[Ba/Ca]shell peak in the shell OS 091202 (Fig. 7) and the large Chl a peak at this site 600
Barium in Mytilus shells Gillikin et al.
19
(Fig. 5C) suggest that phytoplankton blooms are not the direct cause. Nevertheless,
this does not exclude barite ingestion as a cause. Indeed, invertebrates are known to
directly ingest barite crystals (Brannon and Rao, 1979). It is possible that barite
formation only occurs downstream from the OS site (see Stecher and Kogut, 1999),
explaining the lack of a [Ba/Ca]shell peak at this site. This would also explain the large 605
sharp [Ba/Ca]shell peak in the KN shells (Fig. 7), despite the lower broad Chl a peak at
this site (Fig. 5C). However, particulate Ba data from the Schelde, which show a peak
in the spring only at mid-salinities (Zwolsman and van Eck, 1999), do not agree with
this scenario; but a more detailed sampling campaign is needed to be conclusive.
Clearly, more work is needed to understand the relationship between these [Ba/Ca]shell 610
peaks and phytoplankton. Therefore, further experiments for longer time periods
using a larger range of [Ba] in food and possibly even barite would be useful.
An increase in [Ba/Ca]water is highly unlikely to be the cause of [Ba/Ca]shell peaks, as
the 20 – 25 µmol/mol [Ba/Ca]shell peaks would require [Ba/Ca]water to be around 300 615
µmol/mol, which is clearly not the case (Fig 5A). An alternative hypothesis may be
that Ba is remobilized from tissue stores during spawning, which also occurs in the
spring. Indeed, M. edulis tissue dry weight also exhibits sharp episodic peaks
throughout the life of the animal (Kautsky, 1982). The lack of a [Ba/Ca]shell peak in
the OS shell could possibly be due to this mussel not spawning. Osmotic stress may 620
have required a large part of this animals’ energy budget, leaving no energy for
spawning (cf. Qiu et al., 2002; Gillikin et al., 2004). It is also interesting to note that
the δ13C profiles coincide with changes in [Ba/Ca]shell. This is most evident in shells
KN9 290902 and HF092102, where the δ13C values are more negative when the
[Ba/Ca]shell deviates from background concentrations and are more positive when the 625
[Ba/Ca]shell is at background levels (Fig. 7). Bivalve shell δ13C values are known to be
influenced by the incorporation of metabolically derived light carbon (i.e., 12C)
(McConnaughey et al., 1997). Furthermore, it has been shown that increased
metabolism in larger bivalves, relative to growth rate, leads to a larger availability of
metabolic C for CaCO3 precipitation and therefore results in a more negative δ13C in 630
the shell (Lorrain et al., 2004). Using this rationale, higher metabolic rates from either
spawning or seasonally increased growth, caused by an increase in food supply,
would also result in a more negative shell δ13C. This could explain the pattern we see
in these shells, and also agrees with a metabolic control on [Ba/Ca]shell peak amplitude
Barium in Mytilus shells Gillikin et al.
20
as described above. However, data from the scallop, Pecten maximus, do not 635
corroborate this hypothesis, with their [Ba/Ca]shell peaks not being correlated with
spawning (Lorrain, 2002). Alternatively, the higher [Ba/Ca]shell could be a kinetic
growth rate effect, which has been noted in inorganic calcite (Tesoriero and Pankow,
1996). Higher growth rates would also increase metabolic rates and thus lower shell
δ13C. Finally, it can be argued that the [Ba/Ca]shell peaks can be caused by higher 640
organic matter content in the shell. Bivalve shells can contain up to 5 % organic
matter (see Marin and Luquet, 2004, and references therein) and Ba is known to be
associated with organic matter (Lea and Boyle, 1993). However, neither Hart et al.
(1997) nor Sinclair (2005) found a relationship between organic matter and Ba
concentrations in other biogenic carbonates (i.e., corals), and Rosenthal and Katz 645
(1989) suggest that Ba is bound to the crystal in mollusks. Thus it is unlikely that the
Ba peaks are associated with shell regions containing higher organic content.
Remarkably, a similar phenomenon also occurs in corals, with sharp episodic Ba
peaks occurring at the same time each year, which are not related to river discharge 650
(Sinclair, 2005). However, unlike bivalves, Sinclair (2005) found that the timing of
the peaks differed between coral colonies, even when they grew within 20 km of each
other. The main conclusion of Sinclair (2005) regarding the cause of these peaks in
corals was that there is currently no satisfactory hypothesis to explain them. This is
also the case for bivalves. However, the similarities between coral and bivalve Ba/Ca 655
peaks may suggest a common cause for these peaks. This in itself would be amazing
considering the large difference in biology, ecology, and biomineralization
mechanisms between these two phyla of invertebrates.
4.4 Implications for estuarine paleo-seawater chemistry 660
Our data suggest that M. edulis shells have potential as a proxy of dissolved
[Ba/Ca]water. However, it should be clear that only high resolution profiles covering an
adequate amount of growth may be used to assure the correct background [Ba/Ca]shell
is selected. This selection can also be aided using the δ18O and δ13C profiles. Selecting 665
the mid-summer growth region (or the most negative δ18O) along with the most
positive δ13C should result in a good selection of background [Ba/Ca]shell. Obviously
whole shell analyses are not suitable to determine [Ba/Ca]water, because peaks would
Barium in Mytilus shells Gillikin et al.
21
be integrated. Once the correct background [Ba/Ca]shell is obtained, the [Ba/Ca]water
may be approximated using a DBa of about 0.1. These data can be useful for giving a 670
relative indication of salinity (different estuaries can be expected to have different
salinity - [Ba/Ca]water relationships (Coffey et al., 1997)), which could assist with δ18O
interpretations (see Gillikin et al., 2005b for more explanation). Furthermore, if
[Ba/Ca]water was extended back through geologic time for the world’s large estuaries,
the overall change in the oceanic Ba budget could be better constrained. However, we 675
stress that this proxy needs to be further refined before it should be used as a proxy of
environmental conditions.
5. SUMMARY
680
In both the field and laboratory we have verified that background Ba/Ca ratios in
Mytilus edulis shells are directly related to the Ba/Ca ratios of the water in which they
grew. Our data suggest that the DBa of M. edulis calcite is within the range of 0.07 to
0.12, which is very close to the expected DBa range determined from inorganic calcite
studies (0.03 to 0.07; Pingitore and Eastman, 1984; Tesoriero and Pankow, 1996) and 685
is lower than foraminiferal calcite (see previous references). Although our laboratory
data on the effect of Ba in food was inconclusive, they, along with data from the field,
suggest that the nearly ubiquitous Ba/Ca peaks found in bivalve shells are not related
to phytoplankton blooms in a simple manner, but might be related to barite ingestion.
Finally, the Ba/Ca (background) proxy in bivalve shells can be used as a relative 690
indicator of salinity, and if better constrained, can extend our knowledge of estuarine
Ba cycling back through time by using fossil or archaeological shells.
Acknowledgements - We thank P. Dubois and H. Ranner (Université Libre de
Bruxelles) for the use of their cold room and assistance with the laboratory 695
experiment. V. Mubiana (U. Antwerp) kindly assisted with mussel collection, gave
advice on mussel husbandry and helped setting up the field experiment and acid
digesting the tissue samples. We also thank A. Van de Maele and M. Korntheuer for
technical support with the IRMS and L. Monin and J. Navez for laboratory (ICP)
assistance. We are grateful for the HPLC expertise offered by J. Sinke and J. 700
Nieuwenhuize (NIOO-CEME, Yerseke, NL). H.A. Stecher, D.W. Lea (associate
editor), two anonymous reviewers, A. Verheyden and S. Bouillon gave helpful
Barium in Mytilus shells Gillikin et al.
22
comments on an earlier version of this manuscript; M. Elskens assisted with statistics
and together with N. Brion collected the North Sea water. Funding was provided by
both the Belgian Federal Science Policy Office, Brussels, Belgium (CALMARS, 705
contract: EV/03/04B) and the ESF Paleosalt project funded by the FWO-Flanders
(contract: G.0642.05). Funding for the HR-ICP-MS equipment was partly provided
via the Belgian Lotto and FWO-Flanders (contract: G.0117.02N).
References 710 Baeyens W., van Eck B., Lambert C., Wollast R., and Goeyens L. (1998) General description
of the Scheldt estuary. Hydrobiologia 366, 1-14.
Blust R, Vanderlinden A., Verheyen E., and Decleir W. (1988) Evaluation of microwave-
heating digestion and graphite-furnace atomic-absorption spectrometry with continuum 715 source background correction for the determination of iron, copper and cadmium in brine
shrimp. J. Anal. Atom. Spectrom. 3, 387-393.
Brannon A. C., and Rao K. R. (1979) Barium, strontium and calcium levels in the
exoskeleton, hepatopancreas and abdominal muscle of the grass shrimp, Palaemonetes
pugio - relation to molting and exposure to barite. Comparative Biochemistry and 720 Physiology A-Physiology 63, 261-274.
Buckel J. A., Sharack B. L., and Zdanowicz V. S. (2004) Effect of diet on otolith composition
in Pomatomus saltatrix, an estuarine piscivore. J. Fish Biol. 64, 1469-1484.
Carroll J., Falkner K. K., Brown E. T., and Moore W. S. (1993) The role of the Ganges-
Brahmaputra mixing zone in supplying barium and Ra-226 to the Bay of Bengal. Geochim. 725 Cosmochim. Acta 57, 2981-2990.
Chan L. H., Drummond D., Edmond J. M., and Grant B. (1977) On the barium data from the
Atlantic GEOSECS expedition. Deep-Sea Res. 24, 613-649.
Coffey M., Dehairs F., Collette O., Luther G., Church T., and Jickells T. (1997) The
behaviour of dissolved barium in estuaries. Est. Coast. Shelf Sci. 45, 113-121. 730 Crenshaw, M. A. (1972) Inorganic composition of molluscan extrapallial fluid, Biol. Bull.,
143, 506-512.
Dehairs F., Baeyens W., and Goeyens L. (1992) Accumulation of suspended barite at
mesopelagic depths and export production in the Southern Ocean. Science 258, 1332–
1335. 735 Dehairs F., Chesselet R., and Jedwab J. (1980) Discrete suspended particles of barite and the
barium cycle in the open ocean. Earth Planet. Sci. Lett. 49, 528-550.
Barium in Mytilus shells Gillikin et al.
23
Dehairs F., Lambert C. E., Chesselet R., and Risler N. (1987) The biological production of
marine suspended barite and the barium cycle in the Western Mediterranean Sea.
Biogeochemistry 4, 119–139. 740 Dymond J., Suess E., and Lyle M. (1992) Barium in deep-sea sediment: A geochemical proxy
for paleoproductivity. Paleoceanography 7, 163–181.
Edmond J. M., Boyle E. D., Drummond D., Grant B., Mislick T. (1978) Desorption of barium
in the plume of the Zaire (Congo) River. Netherlands J. Sea Res. 12, 324-328.
Fisher N. S., Guillard R. R. L., and Bankston D. C. (1991) The accumulation of barium by 745 marine-phytoplankton grown in culture. Journal of Marine Research 49: 339-354.
Freitas P., Clarke L. J., Kennedy H., Richardson C., and Abrantes F. (2005) Mg/Ca, Sr/Ca,
and stable-isotope (δ18O and δ13C) ratio profiles from the fan mussel Pinna nobilis:
Seasonal records and temperature relationships. Geochem. Geophy. Geosys. 6, Q04D14,
doi:10.1029/2004GC000872. 750 Gerringa L. J. A., Hummel H., and Moerdijk-Poortvliet T. C. W. (1998) Relations between
free copper and salinity, dissolved and particulate organic carbon in the Oosterschelde and
Westerschelde, Netherlands. J. Sea Res. 40, 193-203.
Gieskes W. W. C., Kraay G. W., Nontji A., Setiapennana D., and Sutomo (1988) Monsoonal
alternation of a mixed and layered structure in the phytoplankton of the euphotic zone of 755 the Banda Sea (Indonesia), a mathematical analysis of algal pigment fingerprints. Neth. J.
Sea Res. 22, 123-137.
Gillikin D. P., De Ridder F., Ulens H., Elskens M., Keppens E., Baeyens W., and Dehairs F.
(2005b) Assessing the reproducibility and reliability of estuarine bivalve shells (Saxidomus
giganteus) for sea surface temperature reconstruction: implications for paleoclimate 760 studies. Palaeogeogr. Palaeoclimatol. Palaeoecol. doi:10.1016/j.palaeo.2005.03.047
Gillikin D. P., Lorrain A., Navez J., Taylor J. W., André L., Keppens E., Baeyens W., and
Dehairs F. (2005a) Strong biological controls on Sr/Ca ratios in aragonitic marine bivalve
shells. Geochem. Geophy. Geosys. 6, Q05009, doi:10.1029/2004GC000874.
Gillikin D.P., 2005. Geochemistry of Marine Bivalve Shells: the potential for 765 paleoenvironmental reconstruction. Ph.D. thesis. Vrije Universiteit Brussel, Belgium.
Gillikin D.P., De Wachter B., and Tack J. F. (2004) Physiological responses of two
ecologically important Kenyan mangrove crabs exposed to altered salinity regimes. J. Exp.
Mar. Biol. Ecol. 301, 93-109.
Goodwin D. H., Flessa K. W., Schöne B. R., Dettman D. L. (2001) Cross-calibration of daily 770 growth increments, stable isotope variation, and temperature in the Gulf of California
bivalve mollusk Chione cortezi: implications for paleoenvironmental analysis. Palaios 16,
387-398.
Barium in Mytilus shells Gillikin et al.
24
Guay C. K., and Falkner K. K. (1997) Barium as a tracer of Arctic halocline and river waters.
Deep-Sea Res. II 44, 1543-1569. 775 Guay C. K., and Falkner K. K. (1998) A survey of dissolved barium in the estuaries of major
Arctic rivers and adjacent seas. Cont. Shelf Res. 18, 859-882.
Hart S. R., Cohen A. L., and Ramsay P. (1997) Microscale analysis of Sr/Ca and Ba/Ca in
Porites, Proceedings of the 8th International Coral Reef Symposium 2, 1707 - 1712.
Havach S. M., Chandler T., Wilson-Finelli A., and Shaw T. J. (2001) Experimental 780 determination of trace element partition coefficients in cultured benthic foraminifera.
Geochim. Cosmochim. Acta 65, 1277–1283.
Jacquet S. H. M., Dehairs F., Cardinal D., Navez J., and Delille B. (2005) Barium distribution
across the Southern Ocean frontal system in the Crozet–Kerguelen Basin. Mar. Chem. 95,
149-162. 785 Kautsky N. (1982) Growth and size structure in a Baltic Mytilus edulis population. Mar. Biol.
68, 117-133.
Kinsman D. J. J., and Holland H. D. (1969) The co-precipitation of cations with CaCO3 - IV.
the co-precipitation of Sr2+ with aragonite between 16 degrees and 96 degrees C. Geochim.
Cosmochim. Acta 33, 1-17. 790 Klein R. T., Lohmann K. C., and Thayer C. W. (1996) Bivalve skeletons record sea-surface
temperature and δ18O via Mg/Ca and 18O/16O ratios. Geology 24, 415-418.
Lazareth C. E., Vander Putten E., André L., and Dehairs F. (2003) High-resolution trace
element profiles in shells of the mangrove bivalve Isognomon ephippium: a record of
environmental spatio-temporal variations? Est. Coast. Shelf Sci. 57, 1103-1114. 795 Lea D. W, and Spero H. J. (1992) Experimental determination of barium uptake in shells of
the planktonic foraminifera Orbulina universa at 22°C. Geochim. Cosmochim. Acta 56,
2673–2680.
Lea D. W, and Spero H. J. (1994) Assessing the reliability of paleochemical tracers: Barium
uptake in the shells of planktonic foraminifera. Paleoceanography 9, 445-452. 800 Lea D. W. (1993) Constraints on the alkalinity and circulation of glacial circumpolar deep-
water from benthic foraminiferal barium. Global Biogeochem. Cy. 7, 695-710.
Lea D. W., and Boyle E. (1989) Barium content of benthic foraminifera controlled by bottom-
water composition. Nature 338, 751-753.
Lea D. W., and Boyle E. (1991) Barium in planktonic foraminifera. Geochim. Cosmochim. 805 Acta 55, 3321-3331.
Lea D. W., and Boyle E. (1993) Determination of carbonate-bound barium in foraminifera
and corals by isotope dilution plasma-mass spectrometry. Chem. Geol. 103, 73 - 84.
Lobel P. B., Longerich H. P., Jackson S. E., and Belkhode S. P. (1991) A major factor
contributing to the high degree of unexplained variability of some elements concentrations 810
Barium in Mytilus shells Gillikin et al.
25
in biological tissue - 27 elements in 5 organs of the mussel Mytilus as a model. Arch.
Environ. Con. Tox. 21, 118-125.
Lorens R. B. (1978) A study of biological and physiological controls on the trace metal
content of calcite and aragonite. Ph.D. thesis, University of Rhode Island.
Lorens R. B. (1981) Sr, Cd, Mn and Co distribution coefficients in calcite as a function of 815 calcite precipitation rate. Geochim. Cosmochim. Acta 45, 553-561.
Lorens R. B., and Bender M. L. (1980) The impact of solution chemistry on Mytilus edulis
calcite and aragonite. Geochim. Cosmochim. Acta 44, 1265-1278.
Lorrain A. (2002) Utilisation de la coquille Saint-Jacques comme traceur environnemental:
approches biologique et biogéochimique. PhD thesis, Université de Bretagne occidentale, 820 Brest, France.
Lorrain A., Paulet Y.-M., Chauvaud L., Dunbar R., Mucciarone D., and Fontugne M. (2004)
δ13C variations in scallop shells: Increasing metabolic carbon contribution with body size?
Geochim. Cosmochim. Acta 68, 3509-3519.
Lorrain A., Gillikin D.P., Paulet Y.-M., Chauvaud L., Le Mercier A., Navez J., and André L. 825 (in press) Strong kinetic effects on Sr/Ca ratios in the calcitic bivalve Pecten maximus.
Geology, 1 December 2005 issue
Marin F., and Luquet G. (2004) Molluscan shell proteins. C. R. Palevol 3, 469–492.
McConnaughey T. A., Burdett J., Whelan J. F., and Paull C. K. (1997) Carbon isotopes in
biological carbonates: Respiration and photosynthesis. Geochim. Cosmochim. Acta 61, 830 611–622.
McCulloch M., Fallon S., Wyndham T., Hendy E., Lough J., and Barnes D. (2003) Coral
record of increased sediment flux to the inner Great Barrier Reef since European
settlement. Nature 421, 727-730.
McManus J., Berelson W. M., Hammond D. E., and Klinkhammer G. P. (1999) Barium 835 cycling in the North Pacific: Implications for the utility of Ba as a paleoproductivity and
paleoalkalinity proxy. Paleoceanography 14, 53-61.
McManus J., Dymond J., Dunbar R. B., and Collier R. W. (2002) Particulate barium fluxes in
the Ross Sea. Mar. Geol. 184, 1-15.
Moore W. S., and Edmond J. M. (1984) Radium and barium in the Amazon River system. J. 840 Geophys. Res. Oceans 89 (NC2), 2061-2065.
Morse J. W., and Bender M. L. (1990) Partition-coefficients in calcite - examination of
factors influencing the validity of experimental results and their application to natural
systems. Chem. Geol. 82, 265-277.
Paytan A., and Kastner M. (1996) Benthic Ba fluxes in the central Equatorial Pacific, 845 implications for the oceanic Ba cycle. Earth Planet. Sci. Lett.142, 439-450.
Barium in Mytilus shells Gillikin et al.
26
Pearce N. J. G., Perkins W. T., Westgate J. A., Gorton M. P., Jackson S. E., Neal C. R., and
Chenery S. P. (1997) A compilation of new and published major and trace element data for
NIST SRM 610 and NIST SRM 612 glass reference materials. Geostand. Newsl. 21, 115-
144. 850 Pingitore N. E., and Eastman M. P. (1984) The experimental partitioning of Ba2+ into calcite.
Chem. Geol. 45, 113-120.
Purton L. M. A., Shields G. A., Brasier M. D., and Grime G. W. (1999) Metabolism controls
Sr/Ca ratios in fossil aragonitic mollusks. Geology 27, 1083-1086.
Qiu J. W., Tremblay R., and Bourget E. (2002) Ontogenetic changes in hyposaline tolerance 855 in the mussels Mytilus edulis and M. trossulus: implications for distribution. Mar. Ecol.
Prog. Ser. 228, 143-152.
Rosenthal Y., and Katz A. (1989) The applicability of trace elements in freshwater shells for
paleogeochemical studies. Chem. Geol. 78, 65-76.
Rowley R. J., and Mackinnon D. I. (1995) Use of the flourescent marker calcein in 860 biomineralisation studies of brachiopods and other marine organisms. Bulletin de l'Institut
Oceanographique, Monaco 14, 111-120.
Shaw T. J., Moore W. S., Kloepfer J., and Sochaski M. A. (1998) The flux of barium to the
coastal waters of the southeastern USA: The importance of submarine groundwater
discharge. Geochim. Cosmochim. Acta 62, 3047-3054. 865 Sinclair D. J. (2005) Non river-flood barium signals in the skeletons of corals from coastal
Queensland , Australia. Earth Planet. Sci. Lett. 237, 354-369.
Sinclair D. J., and McCulloch M. T. (2004) Corals record low mobile barium concentrations
in the Burdekin River during the 1974 flood: evidence for limited Ba supply to rivers?
Palaeogeogr. Palaeoclimat. Palaeoecol. 214, 155-174. 870 Stecher H. A., and Kogut M. B. (1999) Rapid barium removal in the Delaware estuary.
Geochim. Cosmochim. Acta 63, 1003-1012.
Stecher H. A., Krantz D. E., Lord C. J., Luther G. W., and Bock K. W. (1996) Profiles of
strontium and barium in Mercenaria mercenaria and Spisula solidissima shells. Geochim.
Cosmochim. Acta 60, 3445-3456. 875 Steenmans D. (2004) Do marine bivalve shells record paleo-productivity? M.Sc. thesis. Vrije
Universiteit Brussel, Belgium.
Takesue R. K., and van Geen A. (2004) Mg/Ca, Sr/Ca, and stable isotopes in modern and
Holocene Protothaca staminea shells from a northern California coastal upwelling region.
Geochim. Cosmochim. Acta 68, 3845-3861. 880 Tesoriero A. J., and Pankow J. F. (1996) Solid solution partitioning of Sr2+, Ba2+, and Cd2+ to
calcite. Geochim. Cosmochim. Acta 60, 1053-1063.
Barium in Mytilus shells Gillikin et al.
27
Toland H., Perkins B., Pearce N., Keenan F., and Leng M. J. (2000) A study of
sclerochronology by laser ablation ICP-MS, J. Ana. Atom. Spectro. 15, 1143-1148.
Torres M. E., Barry J. P., Hubbard D. A, and Suess E. (2001) Reconstructing the history of 885 fluid flow at cold seep sites from Ba/Ca ratios in vesicomyid clam shells. Limnol.
Oceanogr. 46, 1701-1708.
Tudhope A. W., Lea D. W., Shimmield G. B., Chilcott C. P., and Head S. (1996) Monsoon
climate and Arabian Sea coastal upwelling recorded in massive corals from southern
Oman. Palaios 11: 347-361. 890 Vander Putten E., Dehairs F., Keppens E., and Baeyens W. (2000) High resolution
distribution of trace elements in the calcite shell layer of modern Mytilus edulis:
Environmental and biological controls. Geochim. Cosmochim. Acta 64, 997-1011.
Wada K., and Fujinuki T. (1976) Biomineralization in bivalve molluscs with emphasis on the
chemical composition of the extrapallial fluid, In The Mechanisms of Mineralization in the 895 Invertebratesand Plants (eds.N. Watabe and K. M. Wilbur) University of South Carolina
Press, Columbia, pp. 175–190.
Weber J. N. (1973) Incorporation of strontium into reef coral skeletal carbonate. Geochim.
Cosmochim. Acta 37, 2173-2190.
Wheeler A. P. (1992) Mechanisms of molluscan shell formation. In Calcification in 900 Biological Systems (ed. E. Bonucci). CRC press. pp. 179-216.
Wilbur K. M., and Saleuddin A. S. M. (1983) Shell formation. In The Mollusca (eds. A. S. M.
Saleuddin and K. M. Wilbur). Academic Press, Inc. pp. 235-287.
Zacherl D. C., Paradis G., and Lea D. W. (2003) Barium and strontium uptake into larval
protoconchs and statoliths of the marine neogastropod Kelletia kelledi. Geochim. 905 Cosmochim. Acta 67, 4091-4099.
Zwolsman J. J. G., and van Eck G. T. M. (1999) Geochemistry of major elements and trace
metals in suspended matter of the Scheldt estuary, southwest Netherlands. Mar. Chem. 66,
91-111.
910
Barium in Mytilus shells Gillikin et al.
28
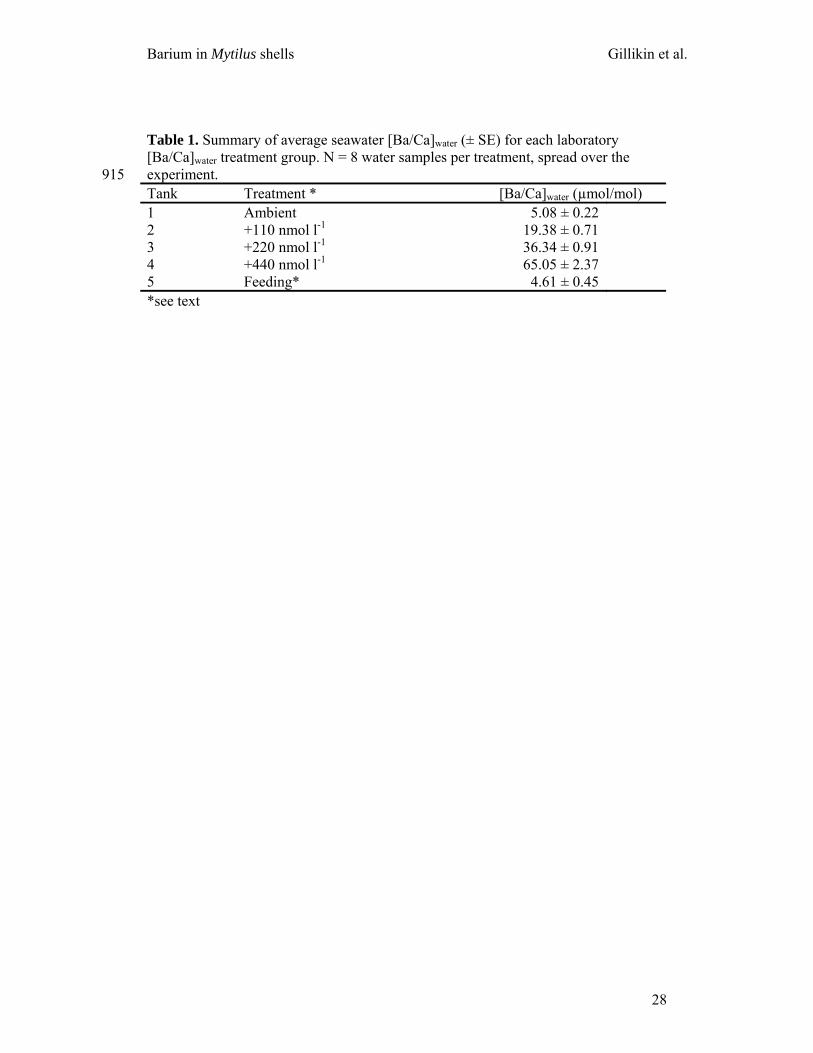
Table 1. Summary of average seawater [Ba/Ca]water (± SE) for each laboratory [Ba/Ca]water treatment group. N = 8 water samples per treatment, spread over the experiment. 915 Tank Treatment * [Ba/Ca]water (µmol/mol) 1 Ambient 5.08 ± 0.22 2 +110 nmol l-1 19.38 ± 0.71 3 +220 nmol l-1 36.34 ± 0.91 4 +440 nmol l-1 65.05 ± 2.37 5 Feeding* 4.61 ± 0.45 *see text
Barium in Mytilus shells Gillikin et al.
29
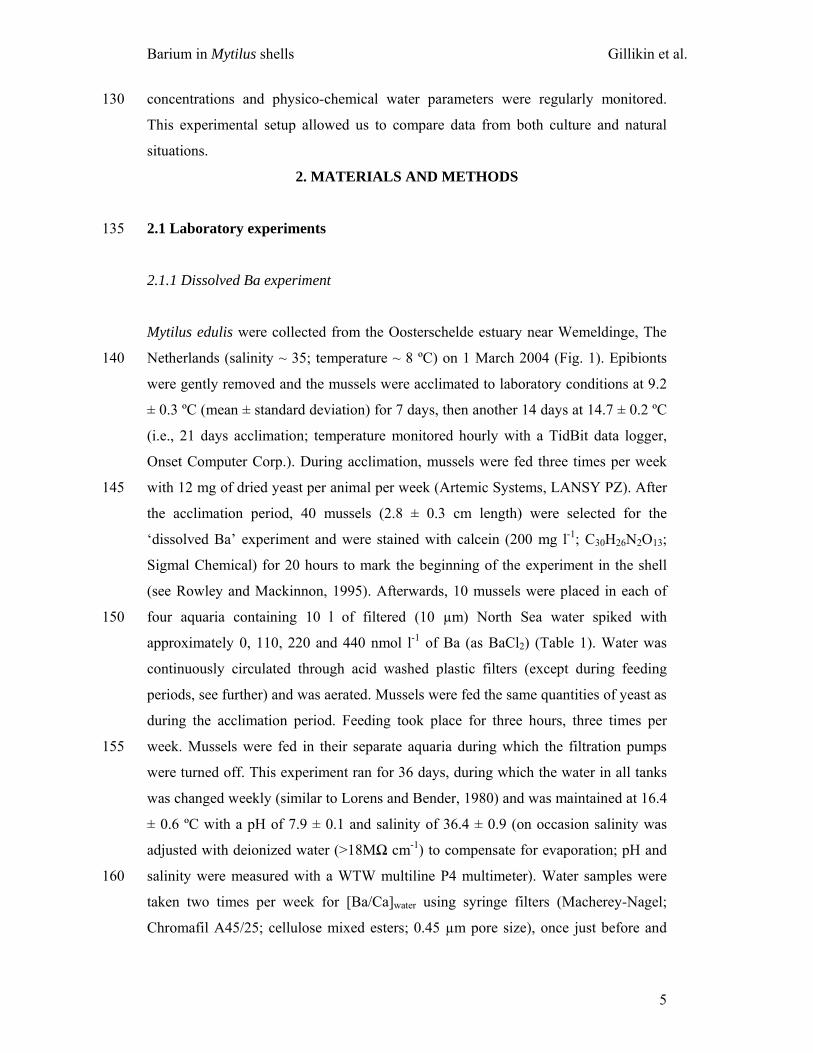
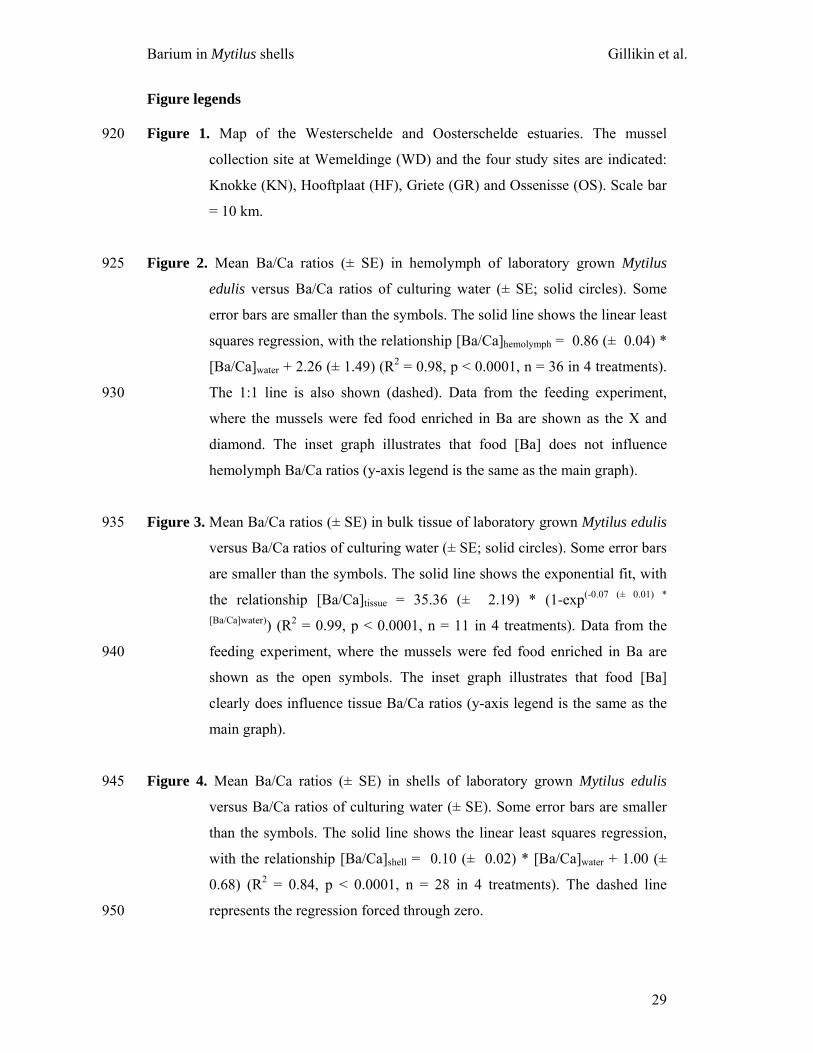
Figure legends Figure 1. Map of the Westerschelde and Oosterschelde estuaries. The mussel 920
collection site at Wemeldinge (WD) and the four study sites are indicated:
Knokke (KN), Hooftplaat (HF), Griete (GR) and Ossenisse (OS). Scale bar
= 10 km.
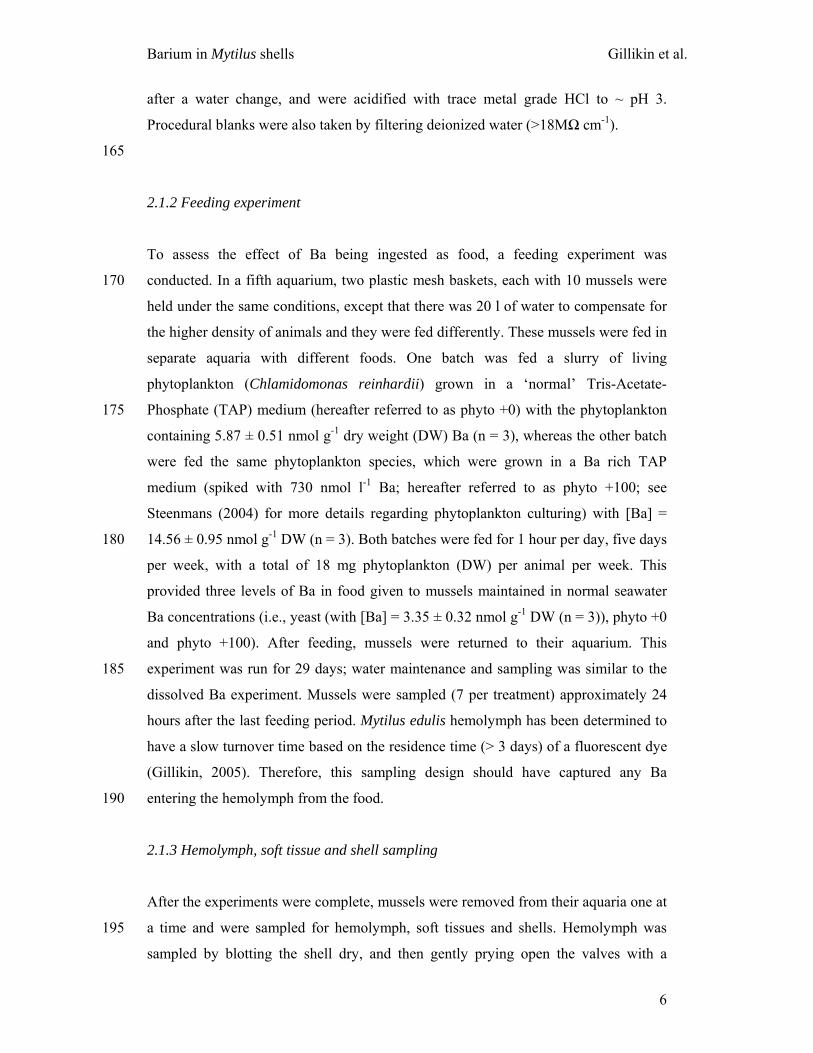
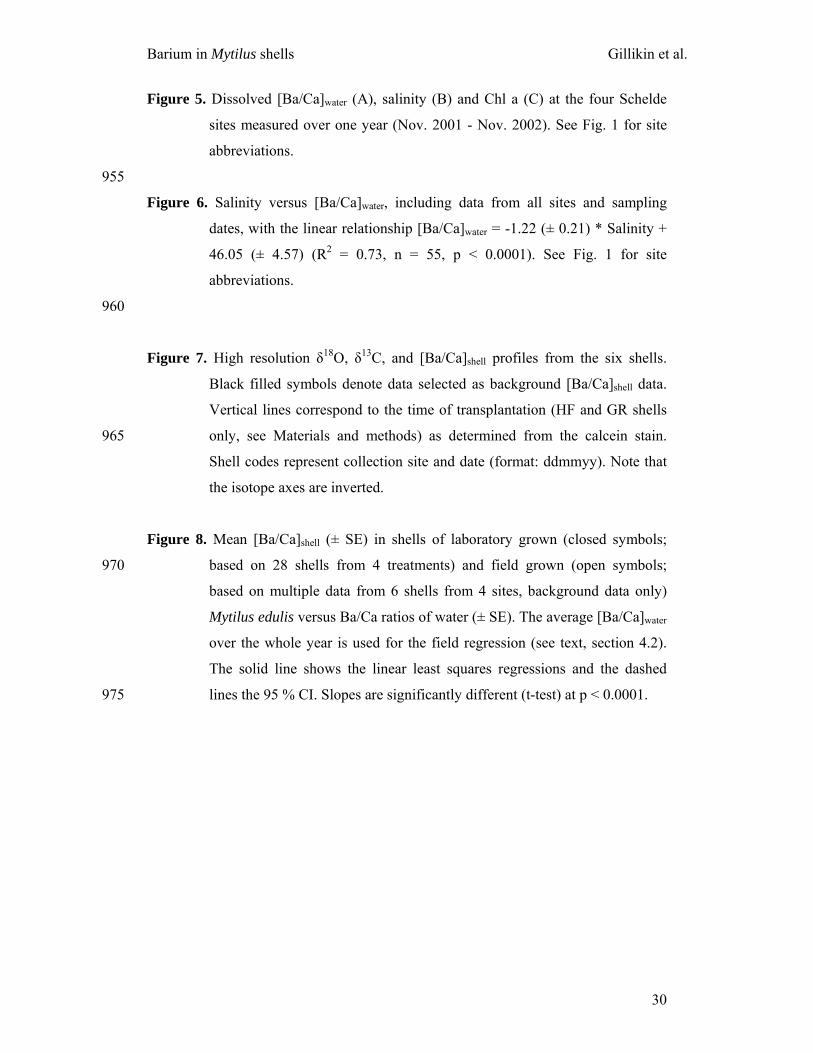
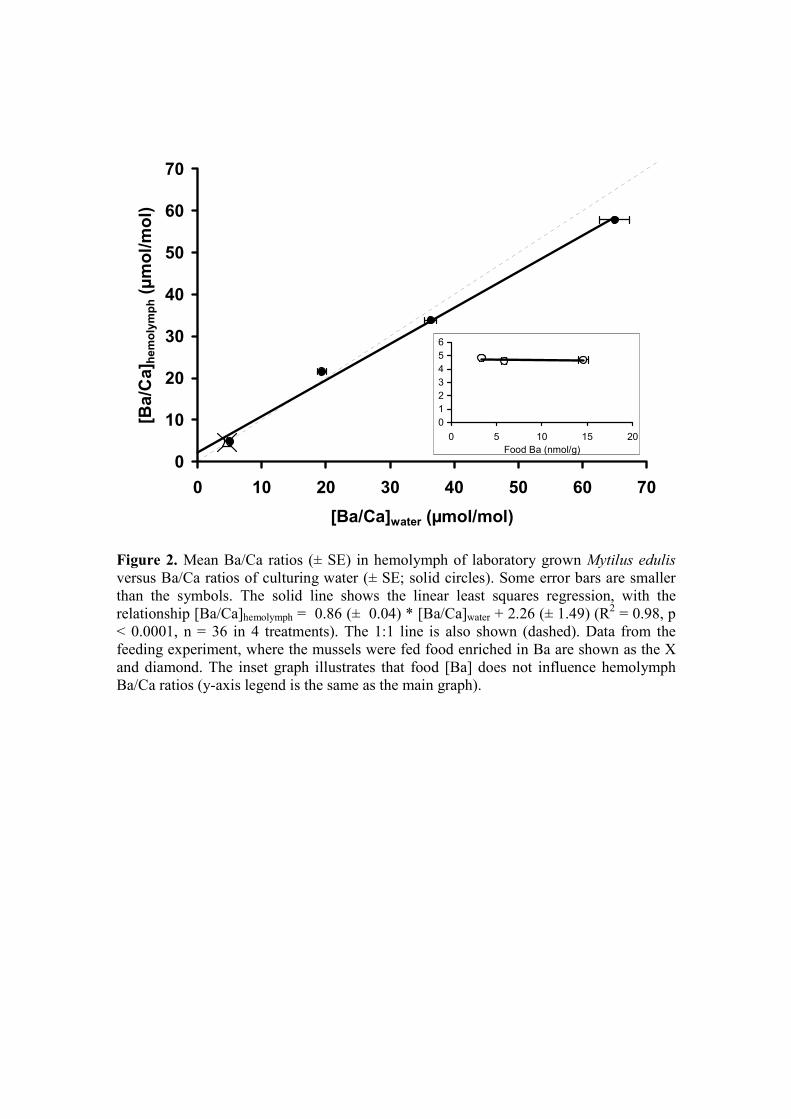
Figure 2. Mean Ba/Ca ratios (± SE) in hemolymph of laboratory grown Mytilus 925
edulis versus Ba/Ca ratios of culturing water (± SE; solid circles). Some
error bars are smaller than the symbols. The solid line shows the linear least
squares regression, with the relationship [Ba/Ca]hemolymph = 0.86 (± 0.04) *
[Ba/Ca]water + 2.26 (± 1.49) (R2 = 0.98, p < 0.0001, n = 36 in 4 treatments).
The 1:1 line is also shown (dashed). Data from the feeding experiment, 930
where the mussels were fed food enriched in Ba are shown as the X and
diamond. The inset graph illustrates that food [Ba] does not influence
hemolymph Ba/Ca ratios (y-axis legend is the same as the main graph).
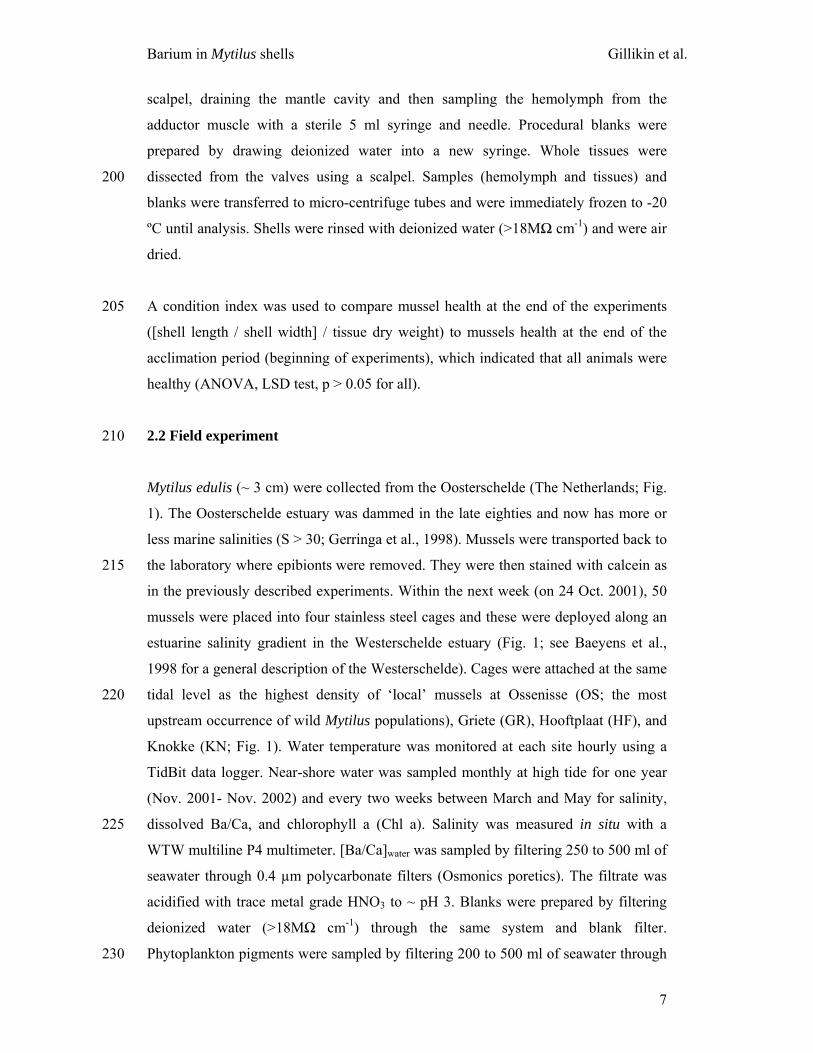
Figure 3. Mean Ba/Ca ratios (± SE) in bulk tissue of laboratory grown Mytilus edulis 935
versus Ba/Ca ratios of culturing water (± SE; solid circles). Some error bars
are smaller than the symbols. The solid line shows the exponential fit, with
the relationship [Ba/Ca]tissue = 35.36 (± 2.19) * (1-exp(-0.07 (± 0.01) *
[Ba/Ca]water)) (R2 = 0.99, p < 0.0001, n = 11 in 4 treatments). Data from the
feeding experiment, where the mussels were fed food enriched in Ba are 940
shown as the open symbols. The inset graph illustrates that food [Ba]
clearly does influence tissue Ba/Ca ratios (y-axis legend is the same as the
main graph).
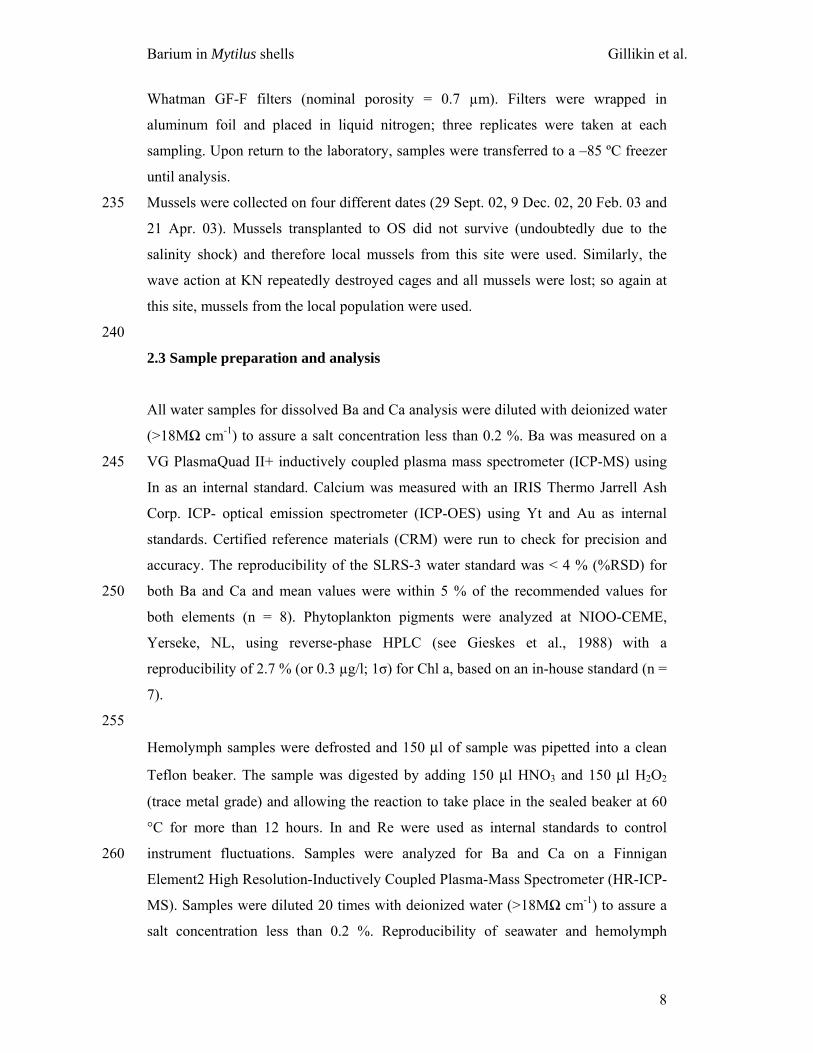
Figure 4. Mean Ba/Ca ratios (± SE) in shells of laboratory grown Mytilus edulis 945
versus Ba/Ca ratios of culturing water (± SE). Some error bars are smaller
than the symbols. The solid line shows the linear least squares regression,
with the relationship [Ba/Ca]shell = 0.10 (± 0.02) * [Ba/Ca]water + 1.00 (±
0.68) (R2 = 0.84, p < 0.0001, n = 28 in 4 treatments). The dashed line
represents the regression forced through zero. 950
Barium in Mytilus shells Gillikin et al.
30
Figure 5. Dissolved [Ba/Ca]water (A), salinity (B) and Chl a (C) at the four Schelde
sites measured over one year (Nov. 2001 - Nov. 2002). See Fig. 1 for site
abbreviations.
955
Figure 6. Salinity versus [Ba/Ca]water, including data from all sites and sampling
dates, with the linear relationship [Ba/Ca]water = -1.22 (± 0.21) * Salinity +
46.05 (± 4.57) (R2 = 0.73, n = 55, p < 0.0001). See Fig. 1 for site
abbreviations.
960
Figure 7. High resolution δ18O, δ13C, and [Ba/Ca]shell profiles from the six shells.
Black filled symbols denote data selected as background [Ba/Ca]shell data.
Vertical lines correspond to the time of transplantation (HF and GR shells
only, see Materials and methods) as determined from the calcein stain. 965
Shell codes represent collection site and date (format: ddmmyy). Note that
the isotope axes are inverted.
Figure 8. Mean [Ba/Ca]shell (± SE) in shells of laboratory grown (closed symbols;
based on 28 shells from 4 treatments) and field grown (open symbols; 970
based on multiple data from 6 shells from 4 sites, background data only)
Mytilus edulis versus Ba/Ca ratios of water (± SE). The average [Ba/Ca]water
over the whole year is used for the field regression (see text, section 4.2).
The solid line shows the linear least squares regressions and the dashed
lines the 95 % CI. Slopes are significantly different (t-test) at p < 0.0001. 975
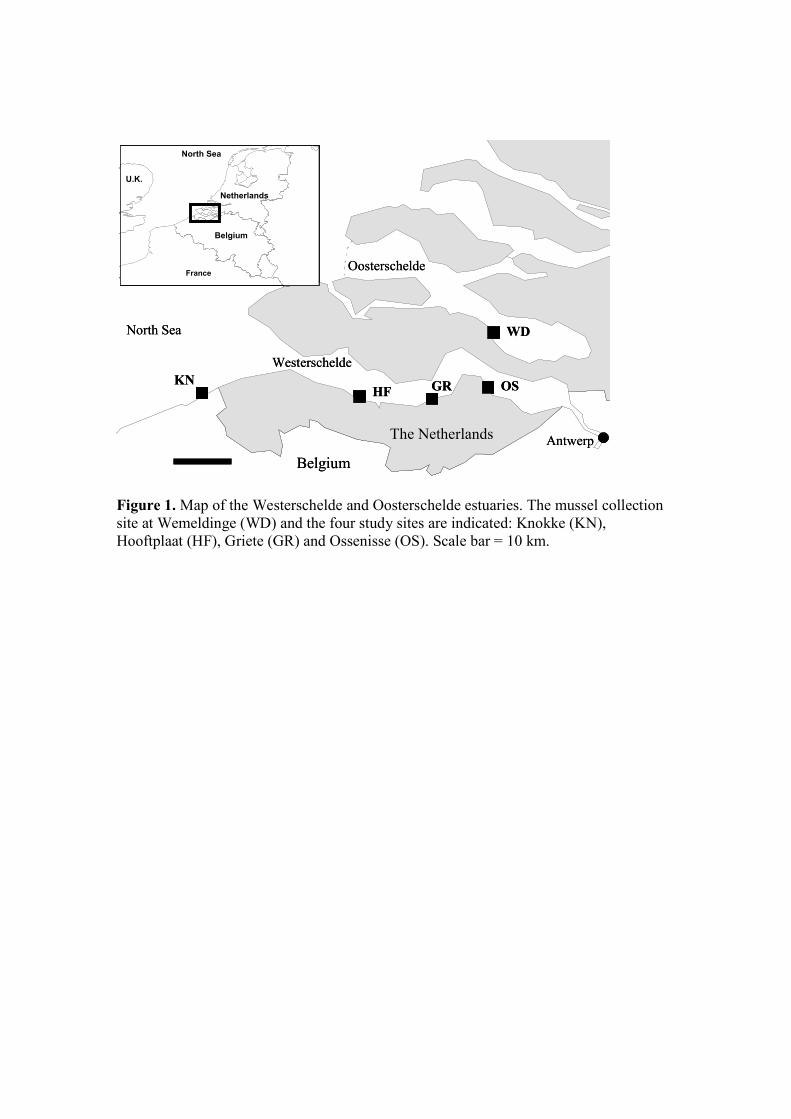
Figure 1. Map of the Westerschelde and Oosterschelde estuaries. The mussel collection site at Wemeldinge (WD) and the four study sites are indicated: Knokke (KN), Hooftplaat (HF), Griete (GR) and Ossenisse (OS). Scale bar = 10 km.
Antwerp
Oosterschelde North Sea
Westerschelde
France
Netherlands
Belgium
North Sea
U.K.
WD
Belgium
OSGRHFKN
The Netherlands
North Sea
Antwerp
Oosterschelde North Sea
Westerschelde
France
Netherlands
Belgium
North Sea
U.K.
WD
Belgium
OSGRHFKN
The Netherlands
North Sea
0
10
20
30
40
50
60
70
0 10 20 30 40 50 60 70[Ba/Ca]water (µmol/mol)
[Ba/
Ca]
hem
olym
ph (µ
mol
/mol
)
0123456
0 5 10 15 20Food Ba (nmol/g)
Figure 2. Mean Ba/Ca ratios (± SE) in hemolymph of laboratory grown Mytilus edulis versus Ba/Ca ratios of culturing water (± SE; solid circles). Some error bars are smaller than the symbols. The solid line shows the linear least squares regression, with the relationship [Ba/Ca]hemolymph = 0.86 (± 0.04) * [Ba/Ca]water + 2.26 (± 1.49) (R2 = 0.98, p < 0.0001, n = 36 in 4 treatments). The 1:1 line is also shown (dashed). Data from the feeding experiment, where the mussels were fed food enriched in Ba are shown as the X and diamond. The inset graph illustrates that food [Ba] does not influence hemolymph Ba/Ca ratios (y-axis legend is the same as the main graph).
[Ba/Ca]water (µmol/mol)0 10 20 30 40 50 60 70
[Ba/
Ca]
tissu
e (µm
ol/m
ol)
0
10
20
30
40
0
5
10
15
20
0 5 10 15 20Food Ba (nmol/g)
Figure 3. Mean Ba/Ca ratios (± SE) in bulk tissue of laboratory grown Mytilus edulis versus Ba/Ca ratios of culturing water (± SE; solid circles). Some error bars are smaller than the symbols. The solid line shows the exponential fit, with the relationship [Ba/Ca]tissue = 35.36 (± 2.19) * (1-exp(-0.07 (± 0.01) * [Ba/Ca]water)) (R2 = 0.99, p < 0.0001, n = 11 in 4 treatments). Data from the feeding experiment, where the mussels were fed food enriched in Ba are shown as the open symbols. The inset graph illustrates that food [Ba] clearly does influence tissue Ba/Ca ratios (y-axis legend is the same as the main graph).
0
2
4
6
8
10
0 10 20 30 40 50 60 70[Ba/Ca]water (µmol/mol)
[Ba/
Ca]
shel
l (µm
ol/m
ol)
Figure 4. Mean Ba/Ca ratios (± SE) in shells of laboratory grown Mytilus edulis versus Ba/Ca ratios of culturing water (± SE). Some error bars are smaller than the symbols. The solid line shows the linear least squares regression, with the relationship [Ba/Ca]shell = 0.10 (± 0.02) * [Ba/Ca]water + 1.00 (± 0.68) (R2 = 0.84, p < 0.0001, n = 28 in 4 treatments). The dashed line represents the regression forced through zero.
05
101520253035404550
O N D J F M A M J J A S O N D
[Ba/
Ca]
wat
er ( µ
mol
/mol
)
KNHFGROS
0
5
10
15
20
25
30
35
O N D J F M A M J J A S O N DMonth
Salin
ity
B
0
5
10
15
20
25
30
35
40
O N D J F M A M J J A S O N DMonth
Chl
a ( µ
g/l)
C
A
Figure 5. Dissolved [Ba/Ca]water (A), salinity (B) and Chl a (C) at the four Schelde sites measured over one year (Nov. 2001 - Nov. 2002). See Fig. 1 for site abbreviations.
05
101520253035404550
0 5 10 15 20 25 30 35Salinity
Ba/
Ca
( µm
ol/m
ol)
KNHFGROS
Figure 6. Salinity versus [Ba/Ca]water, including data from all sites and sampling dates, with the linear relationship [Ba/Ca]water = -1.22 (± 0.21) * Salinity + 46.05 (± 4.57) (R2 = 0.73, n = 55, p < 0.0001). See Fig. 1 for site abbreviations.
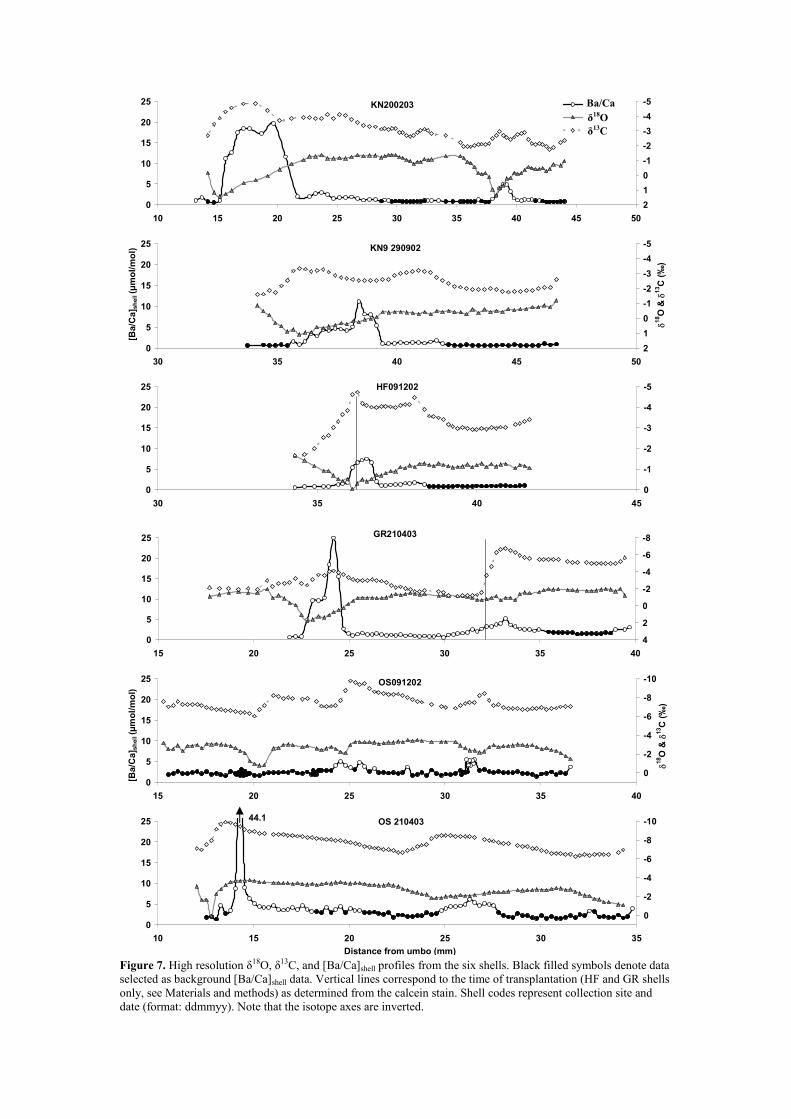
Figure 7. High resolution δ18O, δ13C, and [Ba/Ca]shell profiles from the six shells. Black filled symbols denote data selected as background [Ba/Ca]shell data. Vertical lines correspond to the time of transplantation (HF and GR shells only, see Materials and methods) as determined from the calcein stain. Shell codes represent collection site and date (format: ddmmyy). Note that the isotope axes are inverted.
KN9 290902
0
5
10
15
20
25
30 35 40 45 50
-5-4-3-2-1012
[Ba/
Ca]
shel
l (µm
ol/m
ol)
δ18O
& δ
13C
(‰)
HF091202
0
5
10
15
20
25
30 35 40 45
-5
-4
-3
-2
-1
0
KN200203
0
5
10
15
20
25
10 15 20 25 30 35 40 45 50
-5-4-3-2-1012
Ba/Cad18Od13C
GR210403
0
5
10
15
20
25
15 20 25 30 35 40
-8
-6
-4
-2
0
2
4
OS091202
0
5
10
15
20
25
15 20 25 30 35 40
-10
-8
-6
-4
-2
0
δ18O
& δ
13C
(‰)
[Ba/
Ca]
shel
l (µm
ol/m
ol)
OS 210403
0
5
10
15
20
25
10 15 20 25 30 35
-10
-8
-6
-4
-2
0
44.1
Distance from umbo (mm)
δ13C δ18O Ba/Ca
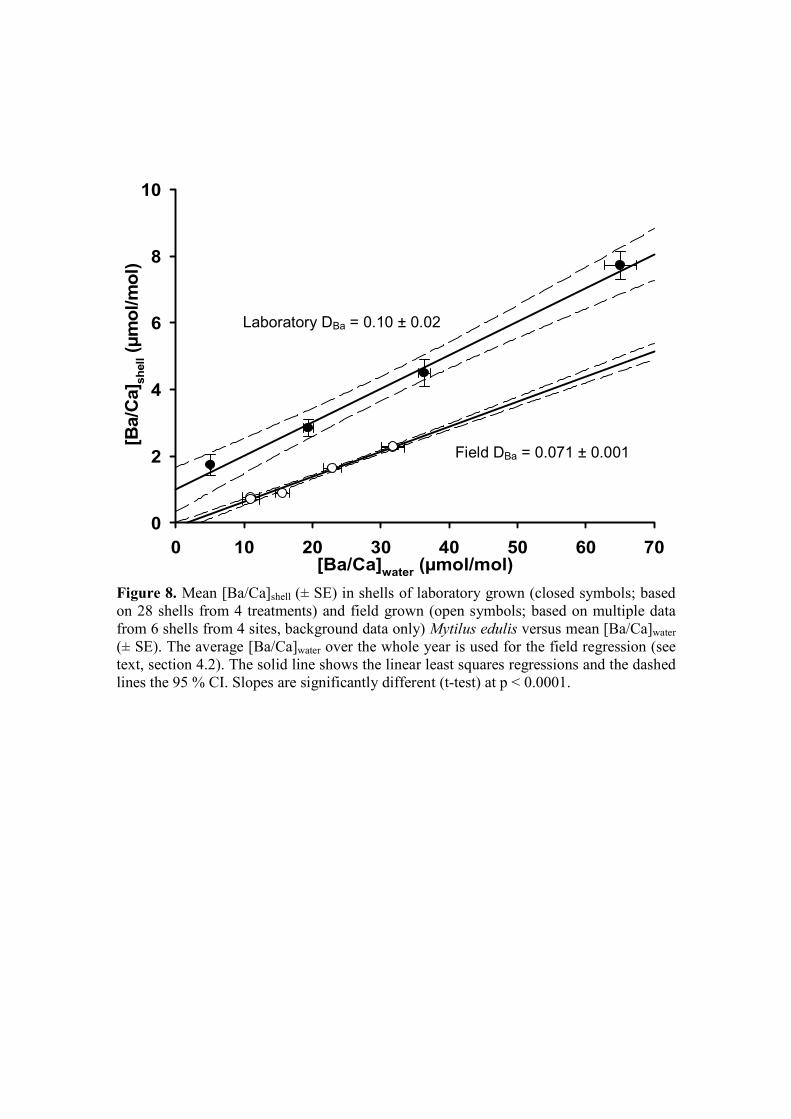
[Ba/Ca]water (µmol/mol)0 10 20 30 40 50 60 70
[Ba/
Ca]
shel
l (µm
ol/m
ol)
0
2
4
6
8
10
Figure 8. Mean [Ba/Ca]shell (± SE) in shells of laboratory grown (closed symbols; based on 28 shells from 4 treatments) and field grown (open symbols; based on multiple data from 6 shells from 4 sites, background data only) Mytilus edulis versus mean [Ba/Ca]water (± SE). The average [Ba/Ca]water over the whole year is used for the field regression (see text, section 4.2). The solid line shows the linear least squares regressions and the dashed lines the 95 % CI. Slopes are significantly different (t-test) at p < 0.0001.
Laboratory DBa = 0.10 ± 0.02
Field DBa = 0.071 ± 0.001

Electronic Annex Captions EA1: Summary of Ba/Ca data EA2: Summary of field data