Bariatric Surgery in the Waikato: The 360 o View J Wu*, D Schroeder,** B Gibbison,* J McClymont*...
33
Bariatric Surgery in the Waikato: The 360 o View J Wu*, D Schroeder,** B Gibbison,* J McClymont* Waikato Adult Weight Management Programme* Surgical Obesity Service**
-
Upload
johnathan-mckinney -
Category
Documents
-
view
220 -
download
2
Transcript of Bariatric Surgery in the Waikato: The 360 o View J Wu*, D Schroeder,** B Gibbison,* J McClymont*...

Bariatric Surgery in the Waikato:The 360o View
J Wu*, D Schroeder,**B Gibbison,* J McClymont*Waikato Adult Weight Management Programme*Surgical Obesity Service**


Roux-en Y Gastric Bypass Surgery
Restrictive: – 15ml gastric
pouch
Malabsorptive– Bypass to ~50 cm
distal to DJ flexure

Quantity & Demographics
45 patients (2005-2009) 31% men: 69% women Age: 25-64 y/o (48+/-10) BMI: 44 +/-6. Ethnicity:
NZ Europ. 60.0%
NZ Maori 31.1%
Pacific Is. 6.7%
Unspecified 2.2%

Obesity Related Disorders
Diabetes: 90%– Diet: 4%– Orals: 30%– Insulin: 66%
IGT: 7% OSA: 40% HTN: 93%

Patient Tracking post Surgery
Weight Loss Health Benefits Quality of Life (SF36) (2007 onwards) Complications
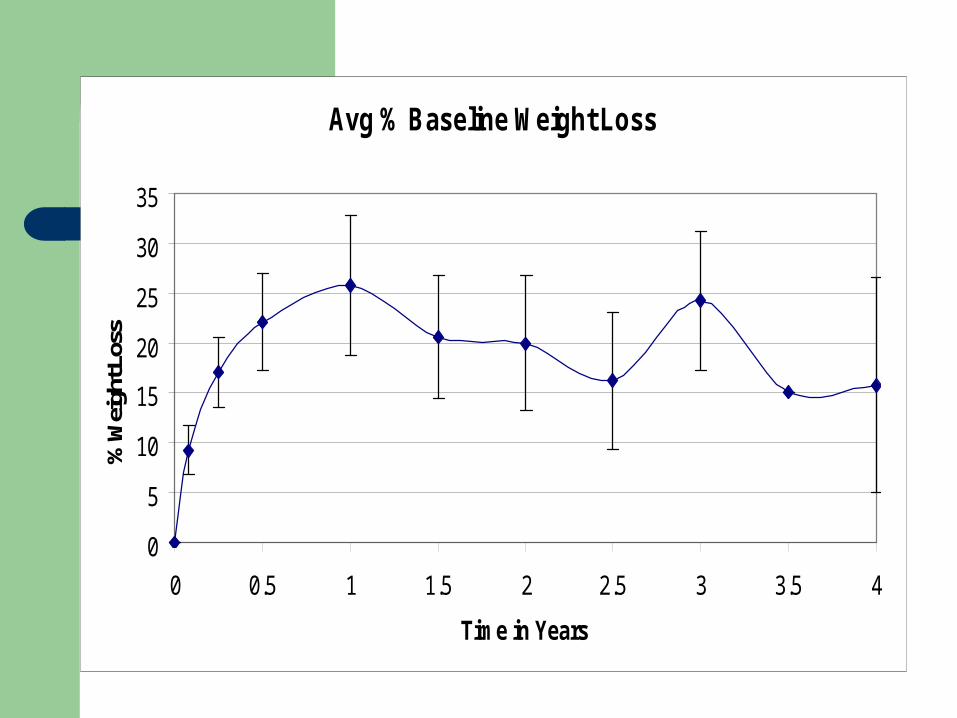
Avg % Baseline Weight Loss
0
5
10
15
20
25
30
35
0 0.5 1 1.5 2 2.5 3 3.5 4
Time in Years
% W
eigh
t Los
s
Weight Loss
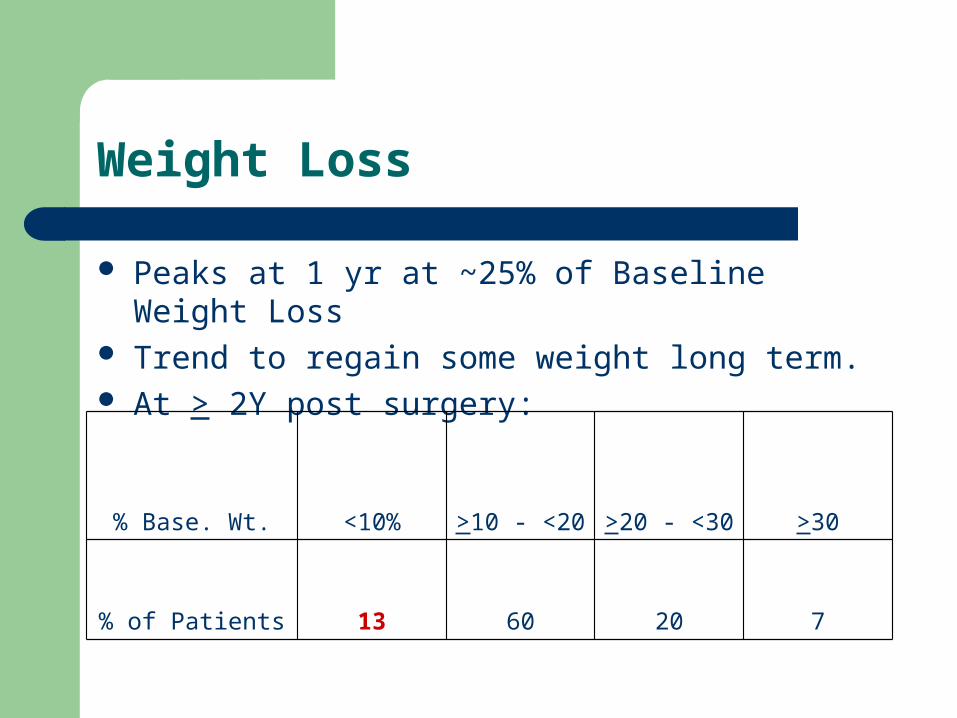
Peaks at 1 yr at ~25% of Baseline Weight Loss Trend to regain some weight long term. At > 2Y post surgery:
% Base. Wt. <10% >10 - <20 >20 - <30 >30
% of Patients 13 60 20 7
Good Losers vs Poor Loosers:What’s the difference?
Formally compared weight loss between:– Ethnic groups– +/- previous AWMP participation– Male vs. Female– Age groups– Baseline Quality of Life Measurements (SF36)

What’s the difference?
Formally compared weight loss between:– Ethnic groups - none– +/- previous AWMP participation– Male vs. Female– Age groups– Baseline Quality of Life Measurements (SF36)

What’s the difference?
Formally compared weight loss between:– Ethnic groups - none– +/- previous AWMP participation - none– Male vs. Female– Age groups– Baseline Quality of Life Measurements (SF36)

What’s the difference?
Formally compared weight loss between:– Ethnic groups - none– +/- previous AWMP participation - none– Male vs. Female - none– Age groups– Baseline Quality of Life Measurements (SF36)

What’s the difference?
Formally compared weight loss between:– Ethnic groups - none– +/- previous AWMP participation - none– Male vs. Female - none– Age groups - Yes– Baseline Quality of Life Measurements (SF36)
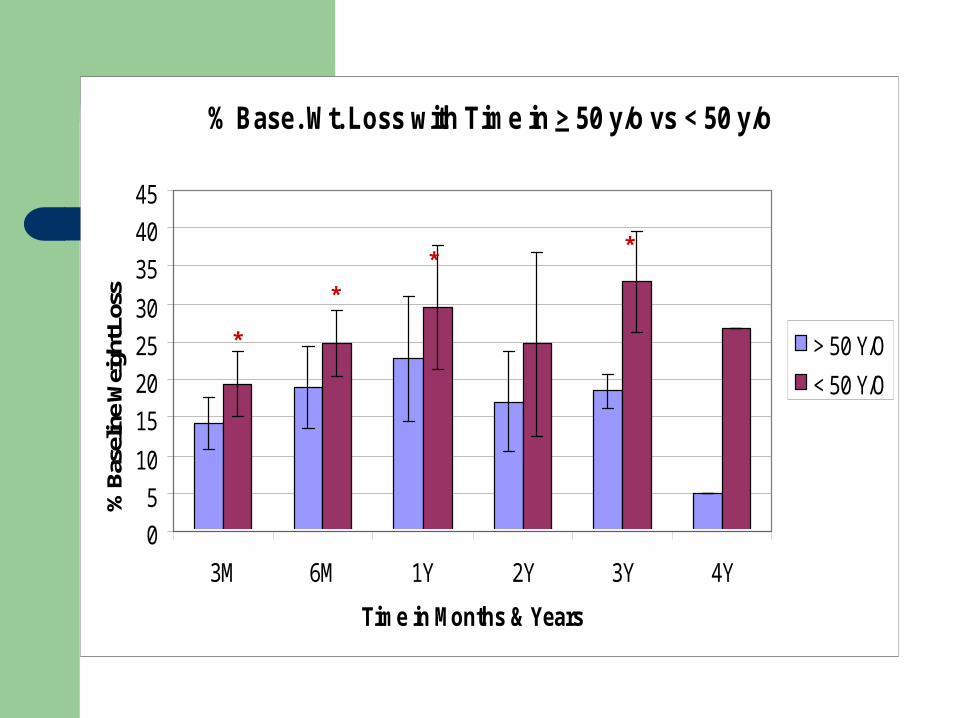
% Base. Wt. Loss with Time in > 50 y/o vs < 50 y/o
0
5
10
15
20
25
30
35
40
45
3M 6M 1Y 2Y 3Y 4Y
Time in Months & Years
% B
asel
ine
Wei
ght L
oss
> 50 Y/O
< 50 Y/O
*
*
* *
What’s the difference?
Formally compared weight loss between:– Ethnic groups - none– +/- previous AWMP participation - none– Male vs. Female - none– Age groups - Yes– Baseline Quality of Life Measurements (SF36) -
Yes

Physical Function & Bodily Pain Scores:Negative Correlation with Future Wt Loss?
0
20
40
60
80
100
120
140
160
180
200
0 5 10 15 20 25 30
% Baseline Wt Loss
r = - 0.68 (rsq=0.47) Increased physical
limitations & bodily pain may predict better future weight loss.

Role Limitation due to Emotional & General Mental Health Sum of Scores:Positive Correlation with Future Wt Loss?
r = 0.52 (rsq = 0.27)
Suggests that poor mental health may carry a risk of poor future weight loss.
50
70
90
110
130
150
170
190
0 5 10 15 20 25 30
% Baseline Weight Loss

Additional Observations
Patient who tend to lose weight well in the first year, tend to do better long term.
Patients selected early in the programme tended to achieve less overall weight loss than those selected later in the programme.– Formally compare weight loss at 1 Y for patients
who received surgery from 2005-7 with those who received surgery in 2008.

% Base. Wt. Loss @ 1 Y: 2005-7 vs 2008 Surgeries
0
10
20
30
40
50
60
<10% 10-20% 20-30% >30%
% Baseline Weight Loss Categories
% o
f Pat
ient
s
2005-7
2008
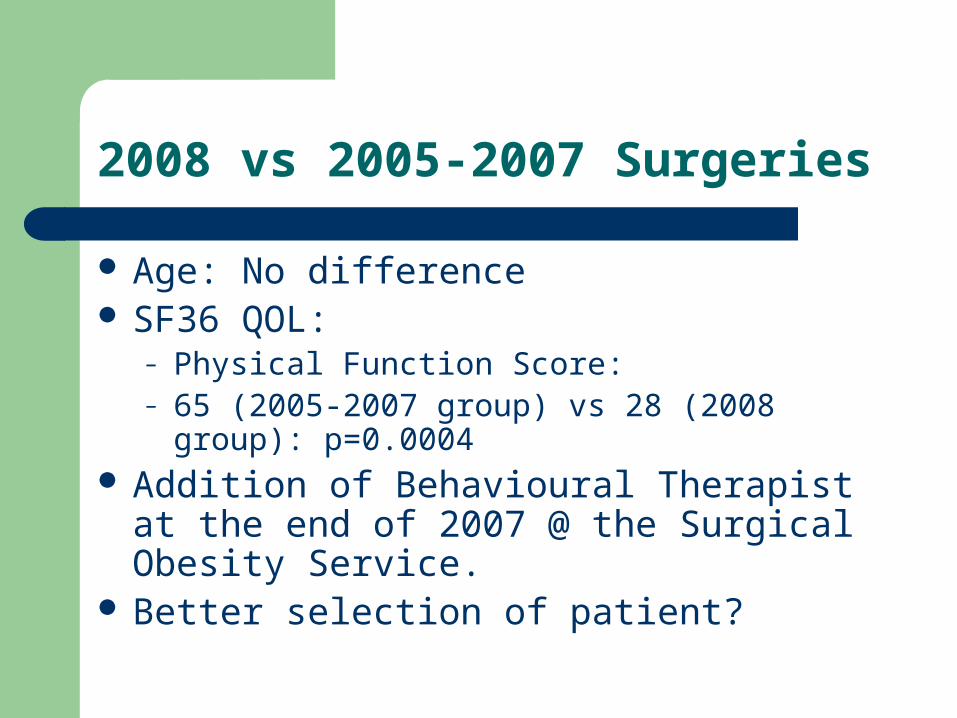
2008 vs 2005-2007 Surgeries
Age: No difference SF36 QOL:
– Physical Function Score:– 65 (2005-2007 group) vs 28 (2008 group):
p=0.0004 Addition of Behavioural Therapist at the end
of 2007 @ the Surgical Obesity Service. Better selection of patient?

Health Improvements: Diabetes
Cure rate (as assessed by HBA1c)– Diet alone: 100%– Oral Rx: 73% (88%: able to D/C meds)– Insulin: 0%
60%: able to D/C insulin and onto orals or diet 40%: decrease insulin usage by 62%
Improvement in HBA1c of those not cured:– 8.9+/-2.3% to 7.4+/-1.5% (p=0.02)

Health Improvements:
OSA:– 41% were able to discontinue CPAP machine.
Hypertension– 26% D/C meds– 139/79 to 126/71: p=0.0003
Urine Microalbumin:Cr– 46% had normalisation of ratio
CRP– 9.8 to 2.8 mg/L: p=0.015

Health Improvements: Lipids
Total C LDL-C HDL-C Tg
Baseline 4.43 2.56 1.16 2.09
> 1Y Post-Surgery 4.34 2.47 1.26 1.33
p value 0.68 0.6 0.05 0.0003

SF36 QOL Improvements
0
10
20
30
40
50
60
70
80
90
100
PF RL BP SF GMH RLE VEF GHP HCLY
Sc
ore Baseline
1Y
2Y
* **
**
** *
*
*
*
*
*
*

Surgical Complications
No mortalities Post-operative infections: 6% Abdominal surgery: 4% (adhesions) OGD for symptoms of obstruction:16%
– 29% of OGD were normal-no cause found
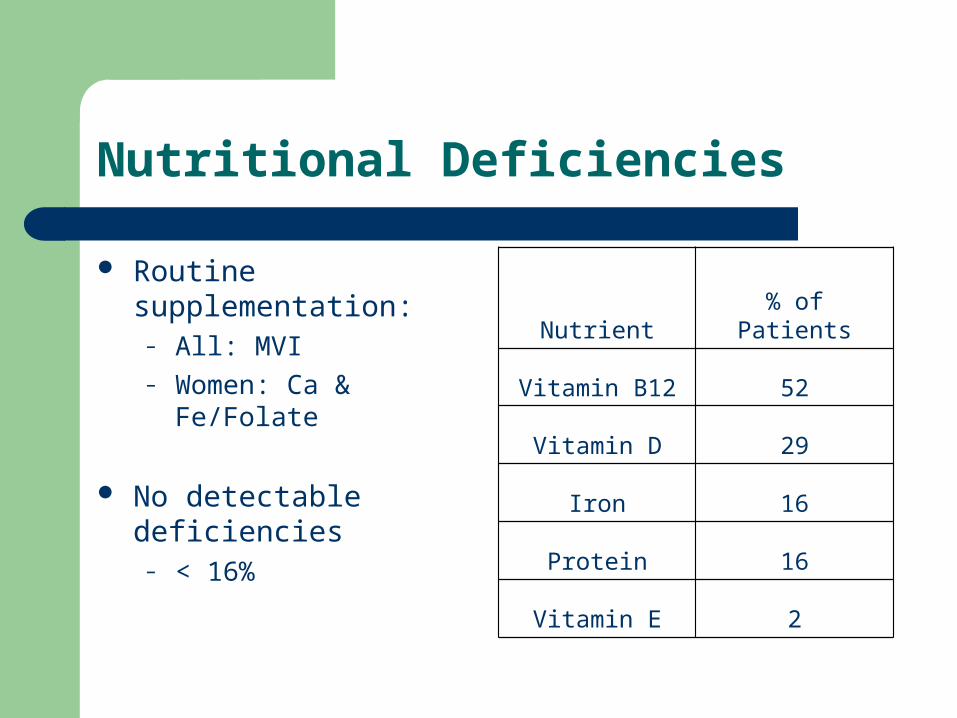
Nutritional Deficiencies
Routine supplementation:– All: MVI – Women: Ca & Fe/Folate
No detectable deficiencies
– < 16%
Nutrient % of Patients
Vitamin B12 52
Vitamin D 29
Iron 16
Protein 16
Vitamin E 2
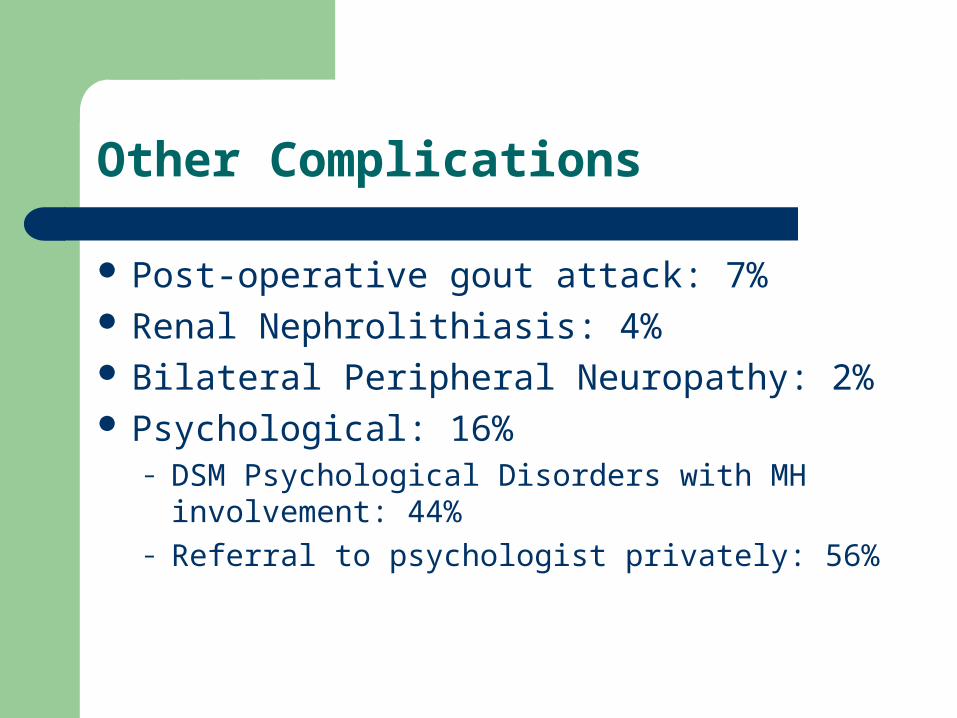
Other Complications
Post-operative gout attack: 7% Renal Nephrolithiasis: 4% Bilateral Peripheral Neuropathy: 2% Psychological: 16%
– DSM Psychological Disorders with MH involvement: 44%
– Referral to psychologist privately: 56%
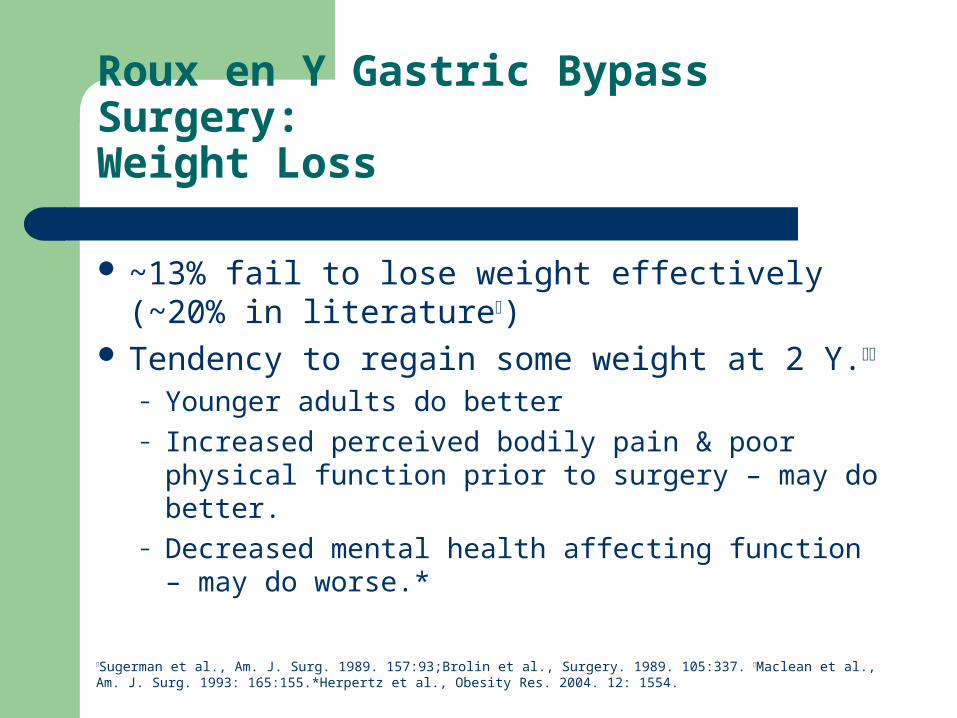
Roux en Y Gastric Bypass Surgery:Weight Loss
~13% fail to lose weight effectively (~20% in literature)
Tendency to regain some weight at 2 Y.
– Younger adults do better– Increased perceived bodily pain & poor physical
function prior to surgery – may do better.– Decreased mental health affecting function – may
do worse.*
Sugerman et al., Am. J. Surg. 1989. 157:93;Brolin et al., Surgery. 1989. 105:337. Maclean et al., Am. J. Surg. 1993: 165:155.*Herpertz et al., Obesity Res. 2004. 12: 1554.
Roux en Y Gastric Bypass Surgery:Health Benefits
Diabetes OSA Hypertension Lipids Markers of CV risk Quality of Life
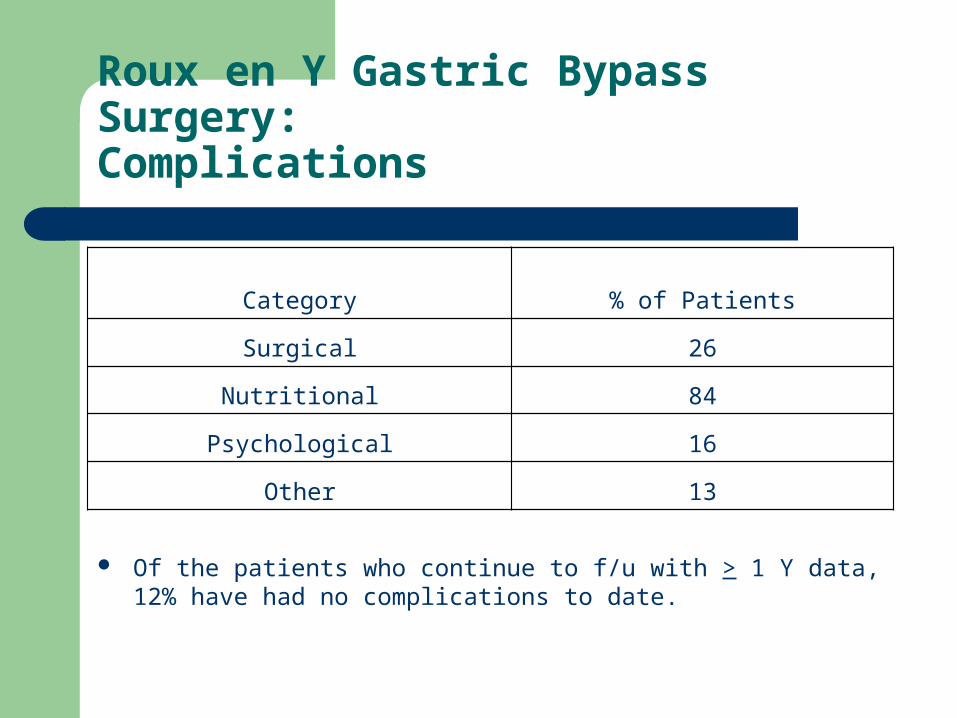
Roux en Y Gastric Bypass Surgery:Complications
Of the patients who continue to f/u with > 1 Y data, 12% have had no complications to date.
Category % of Patients
Surgical 26
Nutritional 84
Psychological 16
Other 13

Roux en Y Gastric Bypass Surgery:Conclusions
Care with patient selection Care with patient preparation for best results
& expectations Continued monitoring for complications
– Surgical– Nutritional– Psychological

Acknowledgements
Waikato Diabetes Service
– Peter Dunn– Susie Ryan
Adult Weight Management Programme
– Sharon Moore
Surgical Obesity Service
– Carol Stidolph– Andrea Schroeder– Ann Monahan– Donna Southwick– Zola McDonald