Barge hinterland transport of orange juice in Europe · Barge hinterland transport of orange juice...
84
Erasmus University Rotterdam MSc in Maritime Economics and Logistics 2008/2009 Barge hinterland transport of orange juice in Europe by Antonio Sergio Ellero
Transcript of Barge hinterland transport of orange juice in Europe · Barge hinterland transport of orange juice...
Erasmus University Rotterdam
MSc in Maritime Economics and Logistics
2008/2009
Barge hinterland transport of orange juice in
Europe
by
Antonio Sergio Ellero
ii
The task of writing a thesis is a pleasant and a challenging one. The challenge lies
in having it structured and in my particular case in getting knowledge of the orange
juice industry and having the network of industry experts to be interviewed
developed. In having it structured and improved I shall thank Professor Rommer
Dekker my thesis supervisor who was able to give me good insights when needed
and never lost his good temper. During the very first thoughts about this thesis I am
very glad to have talked to Mr. Ernesto Monteiro, managing director of Continental
Juice who kindly agreed with the idea of supporting it and Mr. Eduardo Silva,
operations manager, who helped in creating the basic thesis subject and gave me
useful information about the orange juice processing, thank you. I would like to
thank Mrs. Karin de Schepper, general secretary of INE, who I had the pleasure to
meet after his lecture at MEL, she presented me the contacts of industry experts
who, without them, would be impossible to develop my industry experts‟ network. I
wish to thank Mr. Robert-Jan Zimmerman, CEO of Mercurius Shipping Group who
introduced me to his company and Mr. Jan Riemens who helped with precious
information and insights about the barging business and for his friendship. Likewise I
wish to thank Mr. Henk G. Blaauw, manager inland shipping of Marin, for sharing his
expertise in inland shipping and greenhouse gases emissions. A special thank to
Mr. Cok Vinke, manager director of Contargo for his endless efforts in supplying me
with barge transport cost information as accurate as possible. I also have to express
my gratitude to Mr. Donald Baan, business manager logistics and Mrs. Sofie Tolk,
business manager breakbulk of Port of Rotterdam for their enthusiasm about the
thesis subject and helpful market information. I would like to thank the MEL staff for
their support along the course. Finally I would not have been able to complete this
task without the support and comprehension of my loved wife and two boys for the
countless busy weekends. Thank you all.
Acknowledgments

iii
Abstract
The purpose of this thesis is to verify the feasibility of using tank container barge
services for the European hinterland transport of orange juice, to reduce transport
costs and to promote the opportunity to divert tanker truck traffic from the congested
Port of Rotterdam area to waterborne travel as an alternative transport modal.
The world orange juice trade market, industry structure, value and transport chain
are discussed in order to help the understanding of this world industry, its products
and quality specification which will determine the transport quality requirements and
care of the product.
The study investigated existing container barge services in established fairways
along the river Rhine and the Mittellandkanal to supply customers in Germany,
along the river Rhine to supply customers in France and along the Dutch province of
Zeeland waterways‟ to supply customers in Belgium through information obtained
from barge operators. The existing logistic infrastructure for inland waterway
transport taking into consideration the studied corridors were also analyzed in order
to determine their appropriateness to handle this new tank container service.
The findings of the investigation conducted indicate that the tank container barge
service is economically feasible; therefore, for some destinations, barging tank
containers would allow avoiding the road tanker truck transport along the congested
area of the Port of Rotterdam.
Operation and capital costs were analyzed. The operating cost would vary according
to the final destination and may result on transport cost reduction around 50% if
compared to road transport mode. Capital cost, around € 11,000,000 is the
bottleneck of the inland transport mode operation analyzed in the case study and it
is represented by the acquisition of reefer tank containers to be deployed for the
barge services to orange juice processing companies located in the Fruitport. The
actual capital and operating costs would be determinate through a further detailed
operations plan for the new service. A detailed operating plan should be developed
to implement a start-up tank container service between the Port of Rotterdam‟s
Fruitport and the orange juice packer located in Sarre Union, France.
The tank container barge service would replace 18,500 tanker trucks per year from
the congested area of the Port of Rotterdam with a decrease in 1.0 ton of CO2
emission per ton-mile per year only taking into consideration the orange juice
transshipments done by the major companies located in Rotterdam‟s Fruitport.
Abstract
iv
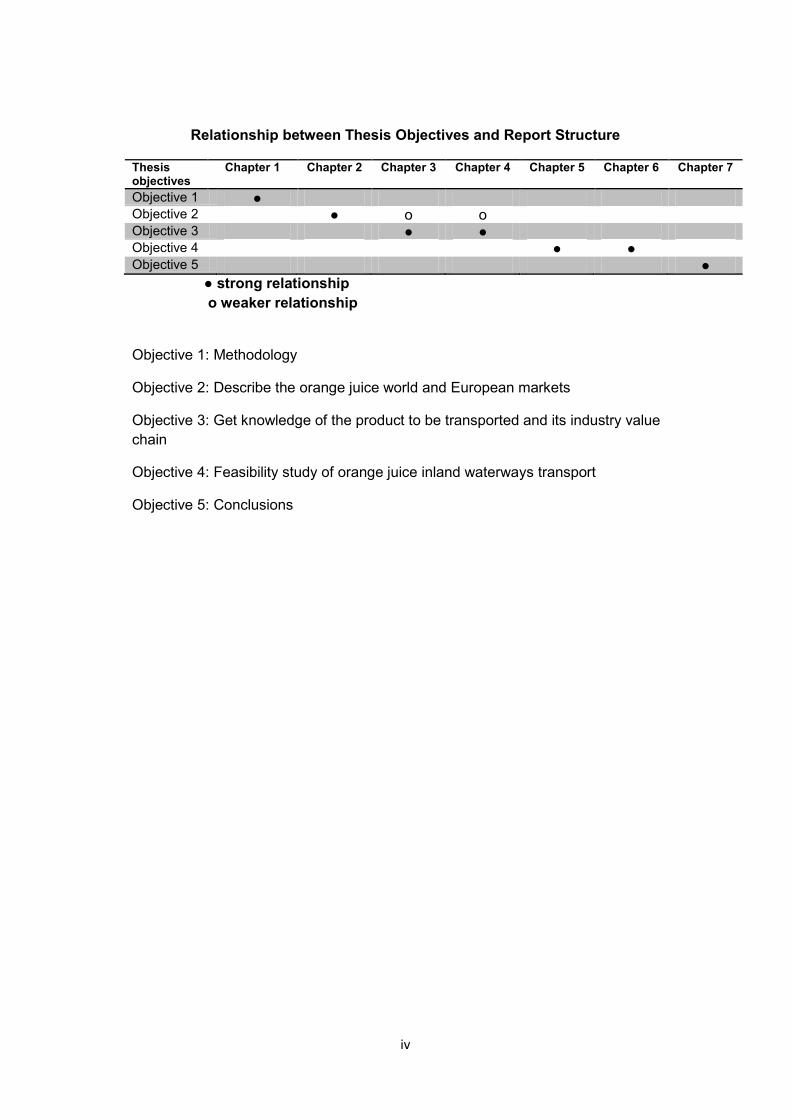
Relationship between Thesis Objectives and Report Structure
Thesis objectives
Chapter 1 Chapter 2 Chapter 3 Chapter 4 Chapter 5 Chapter 6 Chapter 7
Objective 1 ● Objective 2 ● o o Objective 3 ● ● Objective 4 ● ● Objective 5 ●
● strong relationship
o weaker relationship
Objective 1: Methodology
Objective 2: Describe the orange juice world and European markets
Objective 3: Get knowledge of the product to be transported and its industry value
chain
Objective 4: Feasibility study of orange juice inland waterways transport
Objective 5: Conclusions
v
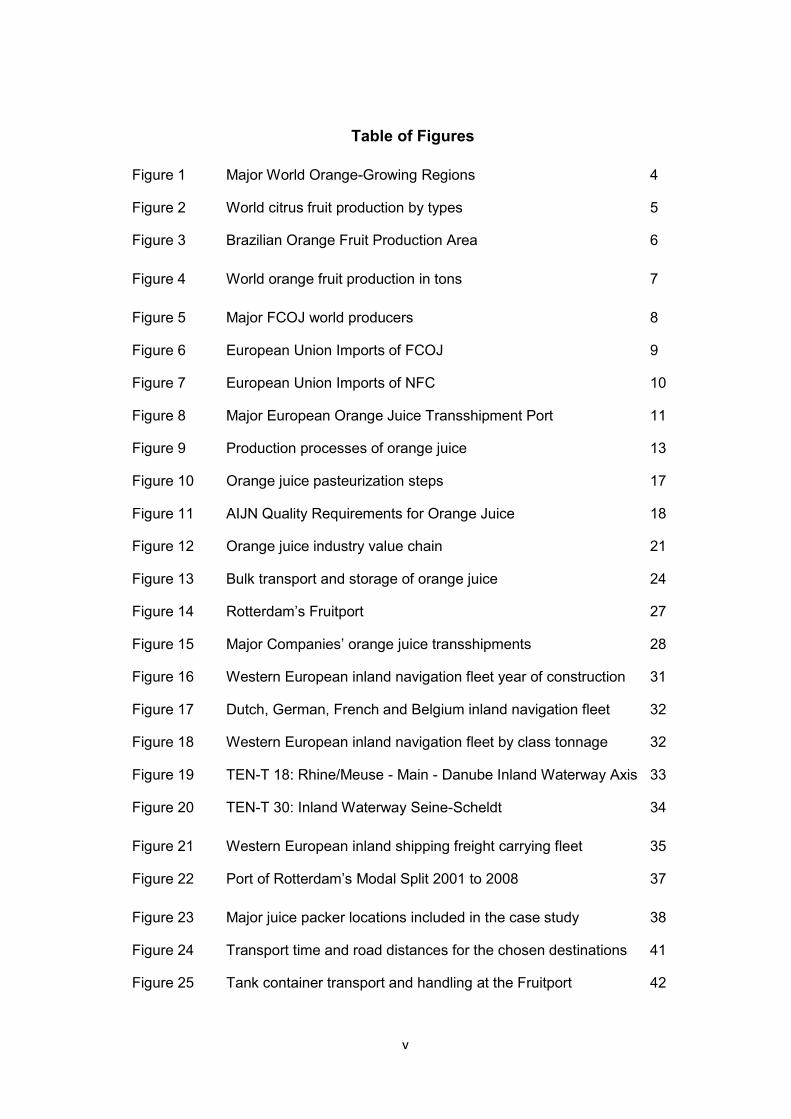
Table of Figures
Figure 1 Major World Orange-Growing Regions 4
Figure 2 World citrus fruit production by types 5
Figure 3 Brazilian Orange Fruit Production Area 6
Figure 4 World orange fruit production in tons 7
Figure 5 Major FCOJ world producers 8
Figure 6 European Union Imports of FCOJ 9
Figure 7 European Union Imports of NFC 10
Figure 8 Major European Orange Juice Transshipment Port 11
Figure 9 Production processes of orange juice 13
Figure 10 Orange juice pasteurization steps 17
Figure 11 AIJN Quality Requirements for Orange Juice 18
Figure 12 Orange juice industry value chain 21
Figure 13 Bulk transport and storage of orange juice 24
Figure 14 Rotterdam‟s Fruitport 27
Figure 15 Major Companies‟ orange juice transshipments 28
Figure 16 Western European inland navigation fleet year of construction 31
Figure 17 Dutch, German, French and Belgium inland navigation fleet 32
Figure 18 Western European inland navigation fleet by class tonnage 32
Figure 19 TEN-T 18: Rhine/Meuse - Main - Danube Inland Waterway Axis 33
Figure 20 TEN-T 30: Inland Waterway Seine-Scheldt 34
Figure 21 Western European inland shipping freight carrying fleet 35
Figure 22 Port of Rotterdam‟s Modal Split 2001 to 2008 37
Figure 23 Major juice packer locations included in the case study 38
Figure 24 Transport time and road distances for the chosen destinations 41
Figure 25 Tank container transport and handling at the Fruitport 42
vi
Figure 26 First scenario transport costs per container tank 42
Figure 27 Second scenario transport costs per container tank 43
Figure 28 Third scenario transport costs per container tank 43
Figure 29: Rinteln and Calvorde calling the port of Hamburg 44
Figure 30 Weekly average number of tank containers 47
Figure 31 NPV – tank container investment 50
Figure 32 IRR – tank container investment 50
Figure 33 Ton-miles carried per liter of fuel by transport modal 51
Figure 34 Total CO2 emissions per transport mode 52
Figure 35 Port of Rotterdam‟s Modal Split in 2007 and Target for 2035 53
Figure 36 Section‟s summary table 54
vii
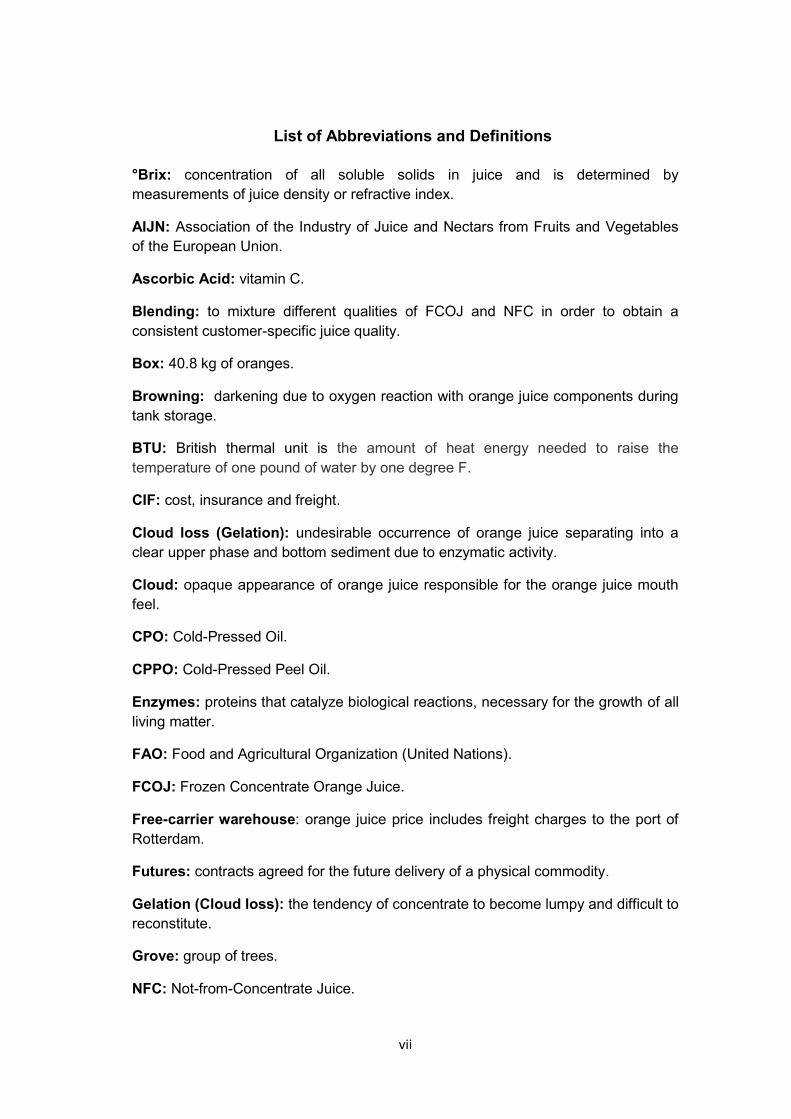
List of Abbreviations and Definitions
°Brix: concentration of all soluble solids in juice and is determined by
measurements of juice density or refractive index.
AIJN: Association of the Industry of Juice and Nectars from Fruits and Vegetables
of the European Union.
Ascorbic Acid: vitamin C.
Blending: to mixture different qualities of FCOJ and NFC in order to obtain a
consistent customer-specific juice quality.
Box: 40.8 kg of oranges.
Browning: darkening due to oxygen reaction with orange juice components during
tank storage.
BTU: British thermal unit is the amount of heat energy needed to raise the
temperature of one pound of water by one degree F.
CIF: cost, insurance and freight.
Cloud loss (Gelation): undesirable occurrence of orange juice separating into a
clear upper phase and bottom sediment due to enzymatic activity.
Cloud: opaque appearance of orange juice responsible for the orange juice mouth
feel.
CPO: Cold-Pressed Oil.
CPPO: Cold-Pressed Peel Oil.
Enzymes: proteins that catalyze biological reactions, necessary for the growth of all
living matter.
FAO: Food and Agricultural Organization (United Nations).
FCOJ: Frozen Concentrate Orange Juice.
Free-carrier warehouse: orange juice price includes freight charges to the port of
Rotterdam.
Futures: contracts agreed for the future delivery of a physical commodity.
Gelation (Cloud loss): the tendency of concentrate to become lumpy and difficult to
reconstitute.
Grove: group of trees.
NFC: Not-from-Concentrate Juice.

viii
NYCE: New York Cotton Exchange.
Pasteurization: orange juice heat-treatment to destroy microorganisms and
inactivate enzymes.
Pectin: type of polysaccharide which is a natural colloidal stabilizer that gives the
orange juice its body or viscosity.
Physical prices: price at which the actual commodity is selling for.
PoR: Port of Rotterdam.
Pulp: the solid parts of the orange juice.
RDT: ready-to-drink (juice made from concentrate).
Refractive index: a measure of how much light is refracted when passing from one
medium to another, it depends on the solution concentration and can be translated
into concentration of soluble solids of a solution such orange juice.
Relative density 20/20: density of sucrose solution at 20°C relative to the density of
water at 20°C also referred as specific gravity 20/20.
Ripeness: state of fruit maturity, readiness to be processed into orange juice.
Single strength: term assigned to juice as its natural strength, either directly from
the extraction process or in a reconstituted form.
Single-strength equivalent (SSE): concentrate and other products stated as their
corresponding amount of single-strength juice.
Soluble solids: solid materials dissolved in the orange juice (e.g. sugars and
acids).
Supply chain: movement of materials as they flow from their source to the end
customer.
Ton-mile: product of the distance that freight is hauled, measured in miles, and the
weight of the cargo being hauled, measured in tons.
Value chain: connected series of organizations, resources, and knowledge streams
involved in the creation and delivery of value to end customers.
Vertical integration: process in which several steps in the production and/or
distribution of a product or service are controlled by a single company or entity, in
order to increase that company's or entity's power in the marketplace.
WESOS: Water-Extracted Soluble Orange Solids.
WPCI: World Ports Climate Initiative.

ix
Table of Contents
Acknowledgments .................................................................................................... ii
Abstract .................................................................................................................... iii
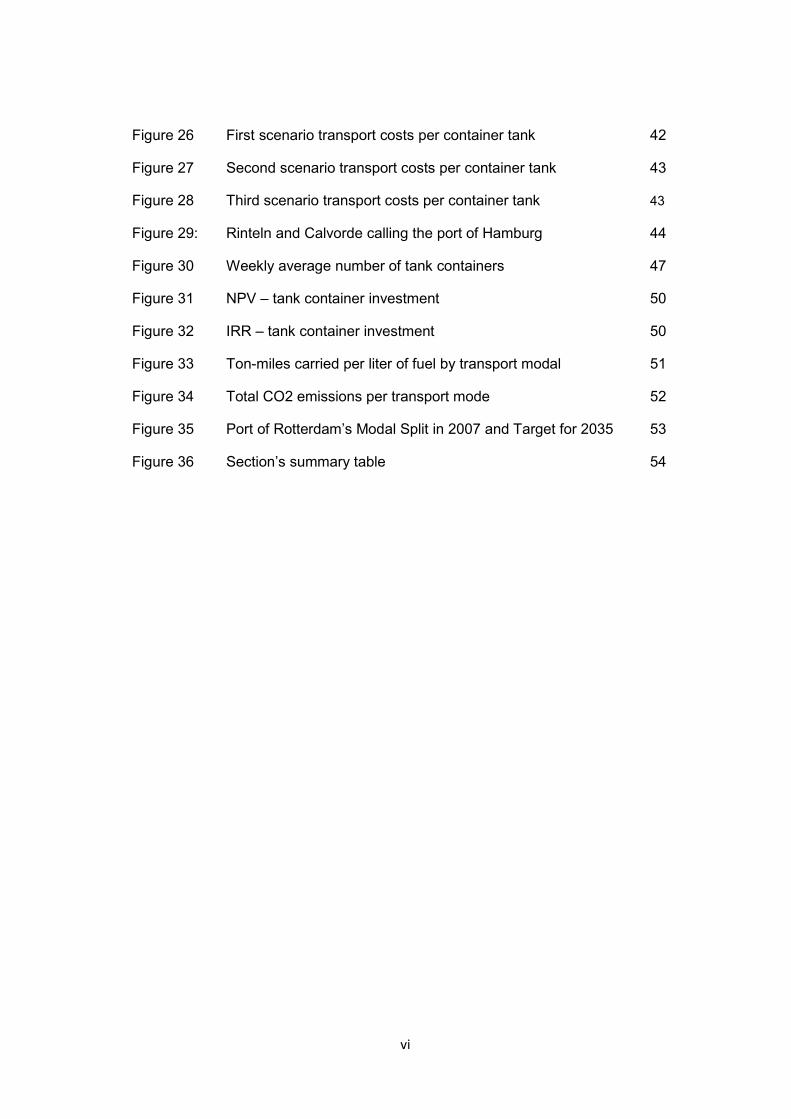
Table of Figures ....................................................................................................... v
List of Abbreviations and Definitions ........................................................................ vii
Table of Contents .................................................................................................... ix
1. Introduction ....................................................................................................... 1
1.1. Research methodology .............................................................................. 1
1.2. Thesis structure.......................................................................................... 2
1.3. Relevance of the topic ................................................................................ 3
1.4. Difficulties and suggested next steps ......................................................... 3
2. The orange juice world markets ........................................................................ 4
2.1. Orange fruit origins ..................................................................................... 4
2.2. Industry history ........................................................................................... 4
2.3. World orange fruit production ..................................................................... 5
2.4. Orange juice types ..................................................................................... 7
2.4.1. NFC (not-from-concentrate) ................................................................ 7
2.4.2. FCOJ (frozen concentrated orange juice) ............................................ 8
2.5. Orange juice world and European markets ................................................. 8
2.6. The orange juice world market pricing ...................................................... 11
3. Orange juice processing .................................................................................. 12
3.1. Fruit reception .......................................................................................... 13
3.2. Juice extraction ........................................................................................ 14
3.3. Clarification .............................................................................................. 14
3.4. FCOJ production ...................................................................................... 15
3.5. NFC production ........................................................................................ 15
3.6. By-products .............................................................................................. 16
3.7. Pasteurization .......................................................................................... 17
3.8. Orange juice quality ................................................................................. 18
x
3.9. Vitamin C ................................................................................................. 19
3.10. Orange juice processing and the supply chain ......................................... 19
4. Industry value and transport chain ................................................................... 21
4.1. Industry value chain ................................................................................. 21
4.1.1. Orange growers ................................................................................ 22
4.1.2. Fruit processors ................................................................................ 22
4.1.3. Blending houses ............................................................................... 22
4.1.4. Juice packers .................................................................................... 23
4.1.5. Soft drink producers .......................................................................... 23
4.2. Industry transport chain ............................................................................ 23
4.2.1. FCOJ storage and transport .............................................................. 25
4.2.2. NFC storage and transport ................................................................ 25
4.3. Storage and transport - effects of oxygen on quality ................................. 26
4.4. Comparison with the chemical industry transport chain ............................ 26
5. Logistic infrastructure for orange juice hinterland transport.............................. 27
5.1. Rotterdam‟s Fruitport and its orange juice processing players .................. 27
5.2. Shipping FCOJ from Brazil to Europe ....................................................... 29
5.3. Shipping NFC from Brazil to Europe ......................................................... 29
5.4. Transport of bulk FCOJ and NFC versus transport of packaged products 30
5.5. Inland terminals ........................................................................................ 30
5.6. Western European inland navigation fleet ................................................ 31
5.7. Inland waterways ..................................................................................... 33
5.7.1. TEN-T 18: Rhine/Meuse - Main - Danube Inland Waterway Axis ...... 33
5.7.2. TEN-T 30: Inland Waterway Seine-Scheldt ....................................... 34
6. Barge hinterland transport of orange juice in Europe: case study .................... 36
6.1. Intermodal transport ................................................................................. 36
6.1.1. Containerization ................................................................................ 36
6.2. The tank container ................................................................................... 37
6.3. Feasibility of orange juice hinterland transport by barges ......................... 38
6.4. Transport costs ........................................................................................ 40
xi
6.4.1. First scenario .................................................................................... 42
6.4.2. Second scenario ............................................................................... 43
6.4.3. Third scenario ................................................................................... 43
6.5. Floating stocks ......................................................................................... 45
6.6. Investments .............................................................................................. 46
6.6.1. Tank Container ................................................................................. 47
6.6.2. Tank Container Leasing .................................................................... 48
6.6.3. Crane Barge ...................................................................................... 48
6.6.4. Mobile Quay Crane ........................................................................... 48
6.7. Investment appraisal ................................................................................ 49
6.8. Environmental issues ............................................................................... 51
7. Conclusions .................................................................................................... 55
Bibliography ........................................................................................................... 58
Appendices ............................................................................................................ 62
Appendix 1: Orange grove: City of Avare - state of Sao Paulo, Brazil ................. 62
Appendix 2: Average vitamin C content of some fruits ........................................ 62
Appendix 3: Nutrient composition of orange juice ............................................... 63
Appendix 4: Quantity of concentrate needed to make 1 liter of juice ................... 63
Appendix 5: Tri-modal container barge inland terminal – Dortmund, Germany ... 64
Appendix 6: Inland Vessels Classes (CEMT- Conférence Européenne des
Ministres de Transport) ....................................................................................... 64
Appendix 7: IMO type T11 frame tank container specifications ........................... 65
Appendix 8: Pictures of a frame tank container ................................................... 66
Appendix 9: Inland waterway route Port of Rotterdam – Rinteln, Germany ......... 67
Appendix 10: Inland waterway route Port of Rotterdam – Hennef, Germany ....... 68
Appendix 11: Inland waterway route Port of Rotterdam – Calvorde, Germany .... 69
Appendix 12: Inland waterway route Port of Rotterdam – Monchengladback,
Germany ............................................................................................................. 70
Appendix 13: Inland waterway route Port of Rotterdam – Sarre Union, France ... 71
Appendix 14: Inland waterway route Port of Rotterdam – Gent, Belgium ............ 72
Appendix 15: Crane barge .................................................................................. 73

1
1. Introduction
Nowadays companies have been challenged, among others, by two major
problems: the financial crises and the global warming caused by the emission of
gases with greenhouse effects. The so called credit crises created a severe
economic downturn and the global warming is turning on society‟s red lights against
fossil fuels emissions. Concerned and affected by these two problems, companies
are working hard to minimize and even solve them and it is in this context that the
orange juice industry is doing its efforts to minimize the effects of the economic
downturn on its financial results focusing on restructuring its operations and on costs
reduction and working on creative solutions to reduce carbon emissions from its own
or related operations.
Observing the supply chain of the orange juice industry it is easy to notice that 100%
of the hinterland product transport has been done by tanker trucks and due to the
problems stated above the idea of using barges for the hinterland transport of
orange juice came up so that the present thesis was proposed. The aim of this
thesis is to verify the feasibility to use container barge services for the European
hinterland transport of orange juice and consequently reduce costs by using
intermodal transport and promote the opportunity to divert tanker truck traffic from
the congested Port of Rotterdam area to inland waterborne transport as an
alternative modal.
1.1. Research methodology
The methodologies utilized to carry on this thesis are:
Literature review and on site observations: the first part of the thesis is a
compilation of comprehensive literature and on site observations of the orange
juice international market, orange juice processing, industry structure and
transport chain. Current literatures on the subject consist on technical
publications, journals, Port of Rotterdam statistics, newsletters and international
organizations statistics and bulletins. This review aims at obtaining an
understanding of the orange juice world market, industry structure and products
quality. Factors that have a direct influence on the orange juice transport
requirements.
Interviews with experts in the field of orange juice production, inland navigation,
ports and terminals logistics, vessels and tank containers manufacturers and
service barge companies. The interviews aim at acquiring a better
understanding of the orange juice quality and transport issues, vessel and tank
container manufacturers and inland shipping industry players‟ insights in terms
of transport logistics and determining factors to consider when undertaking food
quality product transport by barges.
1. Introduction
2
Case study method used for the European hinterland transport of orange juice
by barges. The objective of presenting this case study is to see in practical terms
the feasibility of using inland waterway modal to transport orange juice. Major
juice packer companies in Germany, France and Belgium were chosen and their
type of orange juices and weekly volumes transported from the fruit port of the
Port of Rotterdam to their respective hinterland addresses were taken into
consideration for the feasibility study. Finally, conclusions are drawn and a
recommendation of a pilot project for a detailed economic feasibility study is
made in order to make the barge transport economically viable on the basis of
the research and analysis made throughout the thesis.
1.2. Thesis structure
To carry on the feasibility study, information related to the orange juice world trade,
orange juice types and required quality, industry players, storage and transport
requirements is necessary in order to construct a thorough knowledge of the product
to be transported. Information related to the European barge fleet and inland
waterways are also necessary to make the orange juice hinterland transport by
waterways feasible.
Therefore, the thesis is formed by seven chapters:
Chapter 1 contains the research topic and the methodology used to carry on the
study. Chapter 2 is based on literature review and it provides a brief description of
the industry history, an overview of the orange juice world and European market and
its major producers, exporters and importers. Chapter 3 based on literature review
and on site observation introduces the orange juice production process in order to
understand the product types and quality requirements which will compose the
aseptic transport requirements of food quality product. Chapter 4 based on literature
review and on site observation presents the industry value chain where it is possible
to understand the importance of each industry player on the orange juice
manufacturing and their correlated transport quality requirements as well as the
transport and storage requirements for each stage of orange juice processing.
Chapter 5 introduces the Fruitport and the orange juice processing companies
located there and a description of how the bulk product shipped from Brazil is
transported to the Port of Rotterdam. Also, it reviews the logistic infrastructure for
orange juice transport through a brief description of inland terminals and of the
European inland vessels fleet and the bottle-necks and expected investments of the
European inland waterways related to the case. In Chapter 6, the tank container is
detailed and the concepts of inter-modality and containerization are introduced.
These concepts will be applied in the logistics of orange juice transport since the
tank container will substitute the tanker truck mono-modal transport. The case study
is then presented, the feasibility to use container barge services for the European
hinterland transport of orange juice as well as environmental issues are discussed.
Finally, Chapter 7 concludes the thesis by stating the main findings and a
recommendation for further studies is suggested.
3
1.3. Relevance of the topic
The shipment of orange juice by barges using tank containers from the fruit terminal
brings the possibility to use intermodal transport for this product creating greater
possibilities of transport modal maneuvers towards transport rationalization and cost
reduction. Moreover, the Port of Rotterdam will benefit from a better usage of its
inland waterways improving its hinterland connectivity which might attract more
cargo flows to its territories. The reduction of the tanker truck traffic in the congested
area of Port of Rotterdam will contribute to less green-house gases emission, better
air quality, less accidents and less environment degradation. Will decrease travel
time and increase people‟s mobility increasing overall the productivity of the region.
Furthermore, barges are more fuel efficient and produce less noise when compared
with tanker trucks.
1.4. Difficulties and suggested next steps
This research involved orange juice producer‟s site visit and interviews with industry
experts giving the author the opportunity to understand the orange juice production
process, storage and transport which complement the body of knowledge to perform
the feasibility study of orange juice by barges using tank containers. The research
shows that this transport modal is feasible but in order to be cost competitive in
some routes further research should be done. This research should be extended to
analyze and solve the lack of resources of the fruit terminal container handling and
the cargo bundling to attract regular barge services from the fruit terminal in the Port
of Rotterdam and the various European inland terminals and the needed capital
investments as well.
4
2. The orange juice world markets
The orange juice world market is presented in this chapter. It starts with a brief
history of the orange juice industry, as well as the definition of the two types of
industrialized orange juice which will be used along the whole thesis. Some aspects
of the production of the orange fruit which will intervene in the orange juice
production are also discussed.
2.1. Orange fruit origins
The orange is the world‟s most popular fruit. Like all citrus plants, the orange tree
originated in the tropical regions of Southeast Asia and spread gradually to other
parts of the world. Oranges are mentioned in an old Chinese manuscript dating back
to 2,200 BC. The development of the Arab trade routes, the spread of Islam and the
expansion of the Roman Empire led to the fruit being cultivated in other regions. The
orange spread to India, the east coast of Africa, and from there to the eastern
Mediterranean region. The plant was brought to the Americas by Columbus and his
followers in 1,500. Nowadays oranges are cultivated in tropical and subtropical
region around the world.
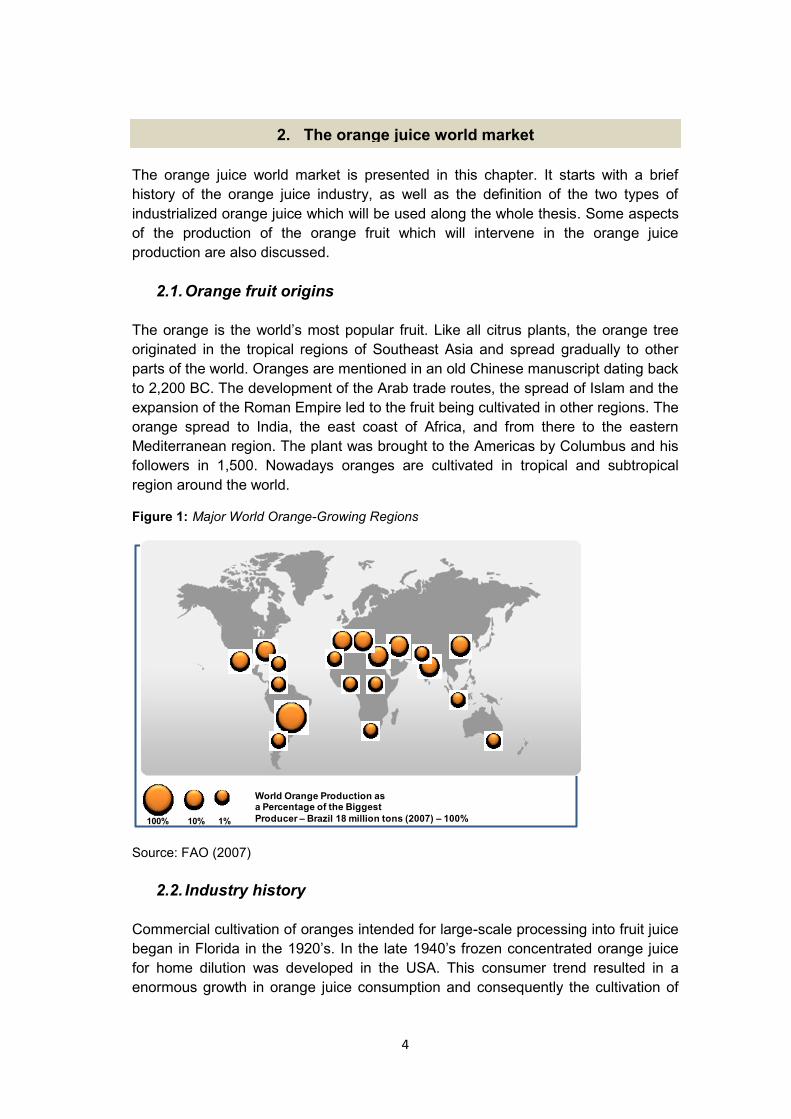
Figure 1: Major World Orange-Growing Regions
Source: FAO (2007)
2.2. Industry history
Commercial cultivation of oranges intended for large-scale processing into fruit juice
began in Florida in the 1920‟s. In the late 1940‟s frozen concentrated orange juice
for home dilution was developed in the USA. This consumer trend resulted in a
enormous growth in orange juice consumption and consequently the cultivation of
100% 10% 1%
World Orange Production asa Percentage of the Biggest
Producer – Brazil 18 million tons (2007) – 100%
2. The orange juice world market
5
orange and the Florida‟s orange juice processing capacity grew in a quick pass.
Severe frosts in Florida during the 1960‟s, the 70‟s and the 80‟s drastically reduced
fruit yields and killed many trees. This fact encouraged producers in Brazil to expand
orange tree plantations and large processing plants were built for orange
concentrate to attend the Brazilian and American markets. In 1983 Brazil surpassed
the USA as the world‟s number one orange producer.
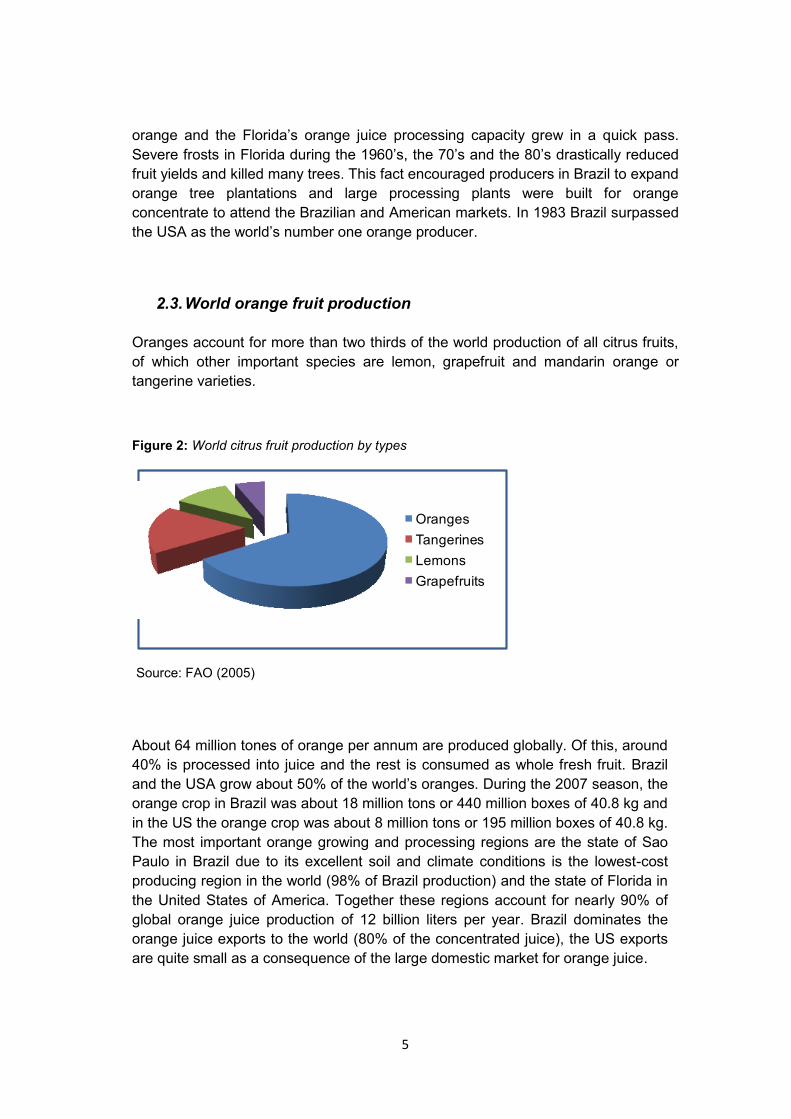
2.3. World orange fruit production
Oranges account for more than two thirds of the world production of all citrus fruits,
of which other important species are lemon, grapefruit and mandarin orange or
tangerine varieties.
Figure 2: World citrus fruit production by types
Source: FAO (2005)
About 64 million tones of orange per annum are produced globally. Of this, around
40% is processed into juice and the rest is consumed as whole fresh fruit. Brazil
and the USA grow about 50% of the world‟s oranges. During the 2007 season, the
orange crop in Brazil was about 18 million tons or 440 million boxes of 40.8 kg and
in the US the orange crop was about 8 million tons or 195 million boxes of 40.8 kg.
The most important orange growing and processing regions are the state of Sao
Paulo in Brazil due to its excellent soil and climate conditions is the lowest-cost
producing region in the world (98% of Brazil production) and the state of Florida in
the United States of America. Together these regions account for nearly 90% of
global orange juice production of 12 billion liters per year. Brazil dominates the
orange juice exports to the world (80% of the concentrated juice), the US exports
are quite small as a consequence of the large domestic market for orange juice.
Oranges
Tangerines
Lemons
Grapefruits
6
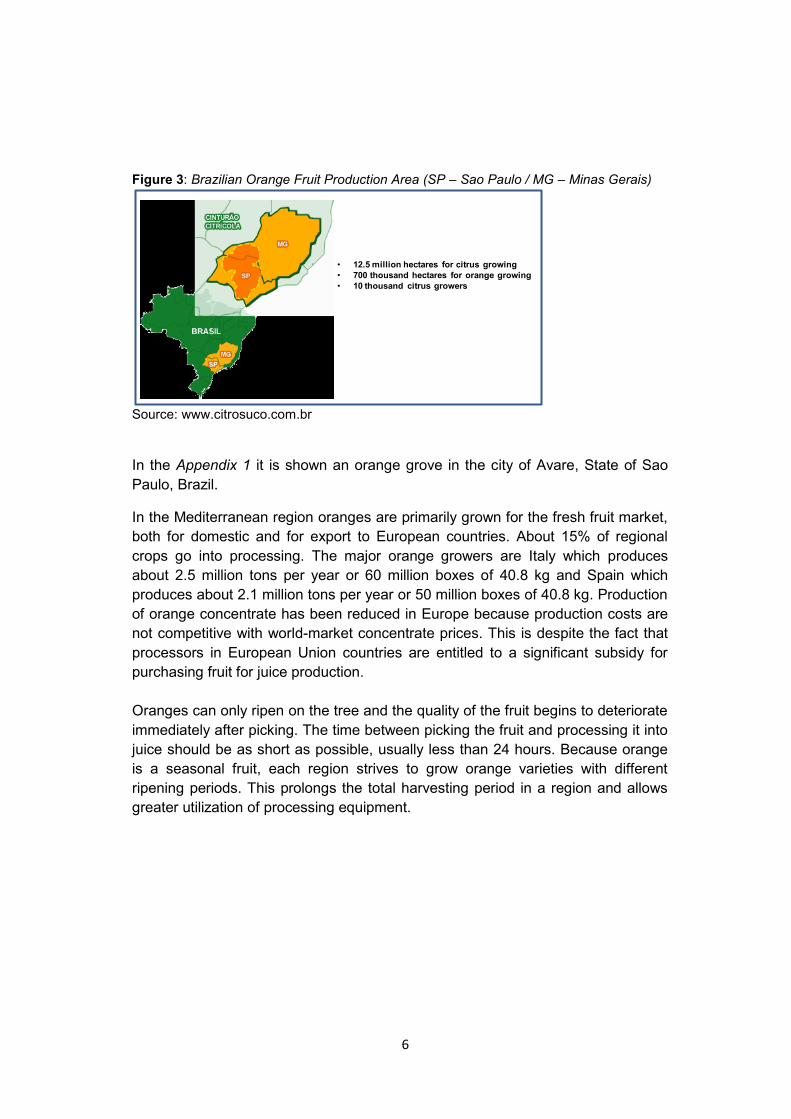
Figure 3: Brazilian Orange Fruit Production Area (SP – Sao Paulo / MG – Minas Gerais)
Source: www.citrosuco.com.br
In the Appendix 1 it is shown an orange grove in the city of Avare, State of Sao
Paulo, Brazil.
In the Mediterranean region oranges are primarily grown for the fresh fruit market,
both for domestic and for export to European countries. About 15% of regional
crops go into processing. The major orange growers are Italy which produces
about 2.5 million tons per year or 60 million boxes of 40.8 kg and Spain which
produces about 2.1 million tons per year or 50 million boxes of 40.8 kg. Production
of orange concentrate has been reduced in Europe because production costs are
not competitive with world-market concentrate prices. This is despite the fact that
processors in European Union countries are entitled to a significant subsidy for
purchasing fruit for juice production.
Oranges can only ripen on the tree and the quality of the fruit begins to deteriorate
immediately after picking. The time between picking the fruit and processing it into
juice should be as short as possible, usually less than 24 hours. Because orange
is a seasonal fruit, each region strives to grow orange varieties with different
ripening periods. This prolongs the total harvesting period in a region and allows
greater utilization of processing equipment.
• 12.5 million hectares for citrus growing
• 700 thousand hectares for orange growing
• 10 thousand citrus growers

7
Figure 4: World orange fruit production in tons
Source: United States Department of Agriculture – Foreign Agricultural Service (February
2009)
2.4. Orange juice types
Before going on with the orange juice world and European markets it is important to
describe the orange juice types since the terms NFC and FCOJ will occur many
times along this thesis.
The orange juice is produced on a seasonal basis therefore it must be stored
between seasons to ensure a year-round supply to consumer markets. Most juice is
produced as frozen concentrated orange juice, FCOJ, because it can be stored for
long periods of time and shipped at lower cost as it contains less water. Not-from-
concentrate juice, NFC, which is at single-strength (juice as its natural strength,
either directly from the extraction process or in a reconstituted form), requires much
larger volumes during storage and shipping.
2.4.1. NFC (not-from-concentrate)
NFC is orange juice as it is extracted directly from the fruit, its average concentration
is 12°Brix. Due to its low concentration the NFC is normally consumed by markets
located near the processing plants, nonetheless, its world trade is increasing. For
the same amount of ready-to-drink (RTD) juice, produced from concentrated juice by
adding water, in order to store it before joining the water, if compared to the NFC
juice, it will be needed 5 to 6 times less storage volume. Thus shipping costs over
long distances are significantly higher for single-strength products like the NFC
juice. Regulations and the production process allow for very limited adjustments to
product characteristics other than blending NFC from different varieties. Therefore
careful selection of the fruit is necessary for the NFC production. Most NFC products
also consist of a blend of juices extracted at different times of the season. Blending
of NFC may take place within the producing country or in the importing market. The
16.730
8.2706.000 5.935
3.900 3.1001.470 1.450
480
(1,000 Metric Tons)
2008/2009

8
difference in quality and yield between different orange varieties is reflected in the
range of market prices.
2.4.2. FCOJ (frozen concentrated orange juice)
FCOJ is orange juice concentrated to 66 °Brix. It is allowed during the FCOJ
processing, blending concentrated juice from different orange fruit varieties in order
to have throughout the year the same quality expected by the consumers. As
concentrated juice quality is created during the evaporation process and essence
recovery (Section 3.4), producers can adjust quality requirements and different
product specifications during this phase of the production process. Therefore, for the
concentrated juice when compared to NFC production, variations in the orange fruit
quality are less important. For this reason, in all plants where NFC is produced,
concentrate juice is also produced to use the orange fruits not suitable for the NFC
processing. Some orange fruit growers which produce orange to be eaten fresh also
have juice processing facilities to, in the same way, for those oranges which do not
have the quality, go to the market went to be processed into concentrated orange
juice.
2.5. Orange juice world and European markets
Brazil is the largest orange juice producer. In the harvest of 2008/2009, it produced
1,240,000 metric tons of FCOJ which corresponds to 50% of the world production,
followed by the USA with a FCOJ production of 754,000 tons, 34% of the world‟s
production. Together, both countries account for 84% of the world‟s FCOJ
production. Below, in the Figure 5, it is given the world production of FCOJ classified
per major world producers.
Figure 5: Major FCOJ world producers
Source: United States Department of Agriculture – Foreign Agricultural Service (February
2009)
1,240,000
754,000
136,324 60,000 18,000 14,000 12,700 8,800
(Metric Ton)2008/2009
FCOJ
9
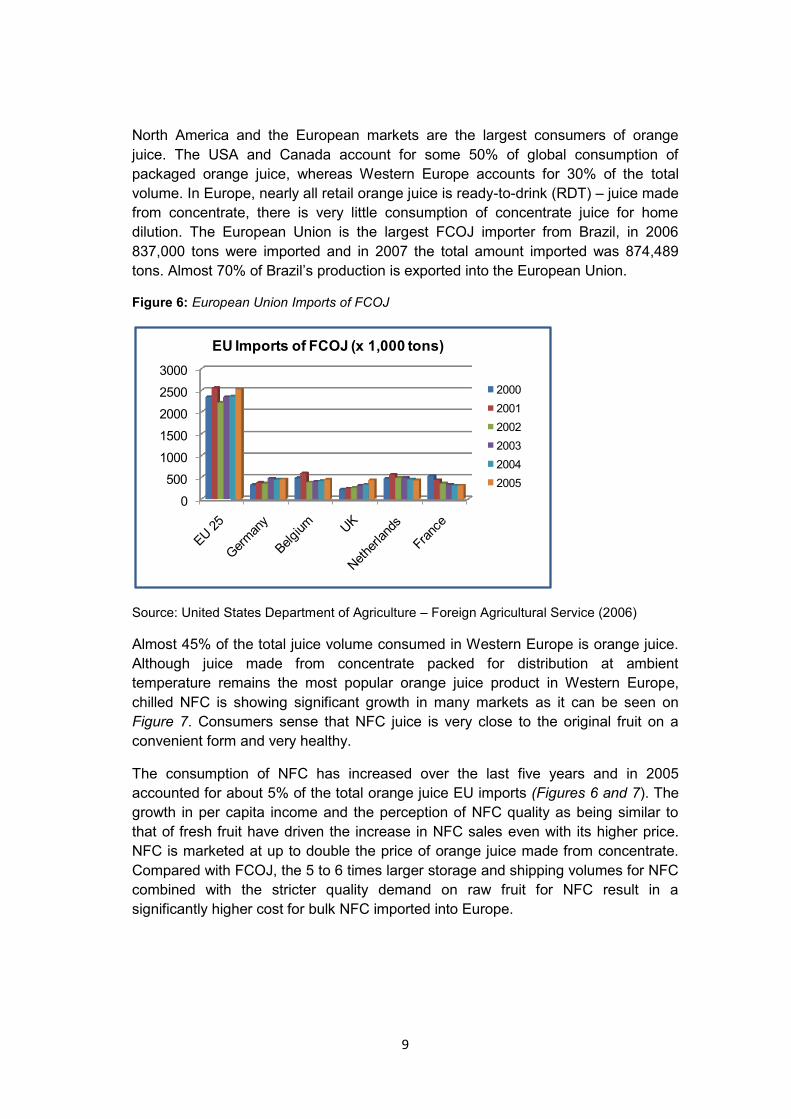
North America and the European markets are the largest consumers of orange
juice. The USA and Canada account for some 50% of global consumption of
packaged orange juice, whereas Western Europe accounts for 30% of the total
volume. In Europe, nearly all retail orange juice is ready-to-drink (RDT) – juice made
from concentrate, there is very little consumption of concentrate juice for home
dilution. The European Union is the largest FCOJ importer from Brazil, in 2006
837,000 tons were imported and in 2007 the total amount imported was 874,489
tons. Almost 70% of Brazil‟s production is exported into the European Union.
Figure 6: European Union Imports of FCOJ
Source: United States Department of Agriculture – Foreign Agricultural Service (2006)
Almost 45% of the total juice volume consumed in Western Europe is orange juice.
Although juice made from concentrate packed for distribution at ambient
temperature remains the most popular orange juice product in Western Europe,
chilled NFC is showing significant growth in many markets as it can be seen on
Figure 7. Consumers sense that NFC juice is very close to the original fruit on a
convenient form and very healthy.
The consumption of NFC has increased over the last five years and in 2005
accounted for about 5% of the total orange juice EU imports (Figures 6 and 7). The
growth in per capita income and the perception of NFC quality as being similar to
that of fresh fruit have driven the increase in NFC sales even with its higher price.
NFC is marketed at up to double the price of orange juice made from concentrate.
Compared with FCOJ, the 5 to 6 times larger storage and shipping volumes for NFC
combined with the stricter quality demand on raw fruit for NFC result in a
significantly higher cost for bulk NFC imported into Europe.
0
500
1000
1500
2000
2500
3000
2000
2001
2002
2003
2004
2005
EU Imports of FCOJ (x 1,000 tons)

10
Figure 7: European Union Imports of NFC
Source: United States Department of Agriculture – Foreign Agricultural Service (2006)
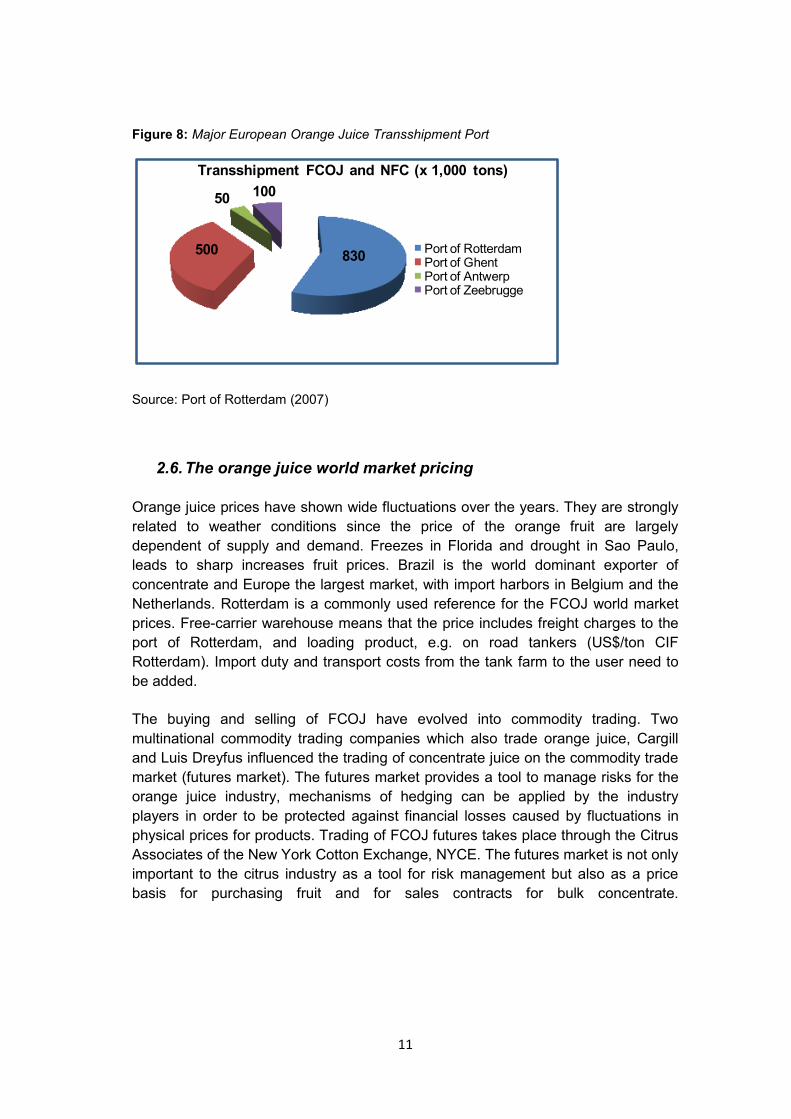
The companies active in the orange juice market in the Western Europe are mainly
concentrated in the Ports of Rotterdam, Ghent, Antwerp and Zeebrugge. The
companies located in the Port of Rotterdam are the Brazilian Cutrale (Continental
Juice and its European Juice Terminal – EJT), the Dutch Kloosterboer, the
Japanese HIWA (Nicherei Group) and the German Wild Juice (Wild Flavors Group)
together these companies generated the turnover about 830,000 tons of FCOJ and
NFC in 2007. The Port of Ghent is represented by the Citrus Coolstore Terminal
owned by the Brazilian company Citrosuco Paulista (Fisher Group) responsible for
the turnover of 500,000 tons of FCOJ in 2007. In the Port of Antwerp the Brazilian
company Citrovita (Votorantim Group) imported 50,000 tons of FCOJ and NFC into
Western Europe in 2007. The Port of Zeebrugge hosts Sea-Invest, which operates
the Belgian New Fruit Company, Belfruco and Flanders Cold Storage. Sea-Invest
handled 100,000 tons of Tropicana NFC juice imported from Florida, USA.
0100200300400500600700800900
10002000
2001
2002
2003
2004
2005
EU Imports of NFC (x 1,000 tons)
11
Figure 8: Major European Orange Juice Transshipment Port
Source: Port of Rotterdam (2007)
2.6. The orange juice world market pricing
Orange juice prices have shown wide fluctuations over the years. They are strongly
related to weather conditions since the price of the orange fruit are largely
dependent of supply and demand. Freezes in Florida and drought in Sao Paulo,
leads to sharp increases fruit prices. Brazil is the world dominant exporter of
concentrate and Europe the largest market, with import harbors in Belgium and the
Netherlands. Rotterdam is a commonly used reference for the FCOJ world market
prices. Free-carrier warehouse means that the price includes freight charges to the
port of Rotterdam, and loading product, e.g. on road tankers (US$/ton CIF
Rotterdam). Import duty and transport costs from the tank farm to the user need to
be added.
The buying and selling of FCOJ have evolved into commodity trading. Two
multinational commodity trading companies which also trade orange juice, Cargill
and Luis Dreyfus influenced the trading of concentrate juice on the commodity trade
market (futures market). The futures market provides a tool to manage risks for the
orange juice industry, mechanisms of hedging can be applied by the industry
players in order to be protected against financial losses caused by fluctuations in
physical prices for products. Trading of FCOJ futures takes place through the Citrus
Associates of the New York Cotton Exchange, NYCE. The futures market is not only
important to the citrus industry as a tool for risk management but also as a price
basis for purchasing fruit and for sales contracts for bulk concentrate.
Transshipment FCOJ and NFC (x 1,000 tons)
Port of RotterdamPort of GhentPort of Antwerp Port of Zeebrugge
830500
10050
12
3. Orange juice processing
In this chapter the orange juice production processes are briefly described due to
the fact that the thorough understand of the product, its types and quality
requirements will compose the minimum knowledge necessary to promote the safe
and correct aseptic transport of a food quality product by inland navigation deploying
tank containers.
The orange juice contains sugars, acids, vitamins, minerals, pectin and colored
components along with many other components. Orange colored substances called
carotenoid in the fruit peel give its characteristic color. Juices from early and late
fruit varieties differ in quality as regards color, sugar content, etc. The maximum
juice yield from an orange is 40 to 60% by weight depending on the fruit variety and
local climate.
In the state of Sao Paulo, Brazil, the harvest and processing season is from mid
June to mid October, whereas in the state of Florida, USA, the harvest and
processing season is from mid October until mid June which allows processing
companies located in both countries, which is the case of the major Brazilian
producers, to bridge the seasons and produce orange juice the whole year.
Orange processing plants are located near the fruit groves due to the fact that the
fruit should be processed as soon as possible after harvesting because it
deteriorates quickly at the high temperatures found in the citrus-growing areas
(Figure 1). Orange juice, on the other hand, are produced in a form that allows it to
be stored for extended periods (about one year) and shipped over long distances. In
the orange juice industry, the basic count of reporting crop and plant intake is the
fruit box which is defined as containing 40.8 kg of fruit. Just as an example, the
world‟s largest orange juice plant is located in the city of Matao, state of Sao Paulo,
Brazil owned by Citrosuco which has a processing capacity of 60 million boxes (2.4
million tons) per season.
Following it is described the processing steps of orange juice production:
3. Orange juice processing

13
Figure 9: Production processes of orange juice
Source: The Orange Book page 66
All production processing stages are done in Brazil, until the bulk transport to the
Fruitport, from there, juice packers, blending houses and soft drink producers in the
European Union make the final product according to their customer‟s specifications.
3.1. Fruit reception
After harvesting, fruit picked in the groves are loaded onto trucks of 20 tons which is
unloaded onto a specially designed tipping ramp which allows the fruits roll off the
truck going directly onto a conveyor belt to the prewash station where dust, dirt and
pesticide residues are removed. The fruits then move onto de-stemming and pre-
grading in order to remove stems and leaves and to have rotten and visibly
damaged fruits removed which will be sent to the feed mill to animal feed
processing. A sample of fruit is taken for analysis from each truck. The main
parameters analyzed are juice yield, °Brix, acidity and color, this gives the processor
Picking of fruit
Transport
Fruit reception
Peel oil
Pulp
Pulp washed
Juice extraction
Clarification
NFC FCOJ
Bulk transport
Juice Packers Packaging Distribution
Main products By-products
Direct citrus pulp
Essences
oil emulsion
peel, rag, seed
pulpy juice
pulp
essence
Pasteurization Evaporation
Fruitport

14
an indication of fruit ripeness and each batch of fruit goes to a bin storage (for less
than 24 h) and is tagged and identified. Then it will be possible to select suitable fruit
from various sources for blending during the extraction process to achieve the
desired final product quality.
3.2. Juice extraction
Juice extraction involves squeezing juice out of the fruit by means of mechanical
pressure. After the washing process, the raw fruit is selected by its size since the
extractor yield is greater the more uniform the fruit size is. The extractor determines
the quality and the juice yield therefore it is the most important process in orange
juice production. Its operational pressure must be regulated in order to produce as
much as possible juice without the presence of peel, oil and other components of
the fruit from entering the juice. Over squeezed juice leads to bitterness in taste and
during its storage other defects will occur. Extractors operate at a fixed number of
oranges processed per minute therefore the plant‟s throughput is very sensitive and
dependent of fruit size and quality. The standard operating speed of a five-headed
extractor is 100 rpm or 500 oranges per minute, as the fruit not always flow to each
cup of the extractor 90% utilization is a high figure. A typical capacity for a medium-
sized fruit is 5 tons/h of fruit per extractor, which is about 2,500 l/h of juice. Three
streams result from the extraction process: oil emulsion; peel, rag and seeds and,
pulpy juice briefly described in the Section 3.6.
3.3. Clarification
The juice produced by the extractors is called pulpy juice and it is full of pulp and
other substances which accounts for 20 or 25% in weight that must be removed
before processing the juice into FCOJ or NFC. Therefore it goes to a process called
clarification before going on in the production process. It is not possible to use this
juice in the evaporation process to produce FCOJ and it is not possible to transform
this juice into NFC. The clarification process involves equipment called finisher
which is a cylindrical sieving screen. Applying mechanical or centrifugal forces
(depends on the equipment used) the pulp is separated from the juice. The juice
flows through the screen holes and the pulp remains concentrated inside the screen.
FCOJ for use in the production of orange nectars and drinks requires the lowest
pulp content which ranges is from 1 to 3% in weight of pulp.
Now, if it is necessary, the juice is ready for blending with juice from other batches in
order to balance its flavor, color, acidity and °Brix levels before going on in the
production process. If this clarified juice is for NFC production, it is ready and in
order to avoid microbiological activity it is necessary to cool it to 4°C before storage
in buffer or blending tanks.
15
3.4. FCOJ production
The FCOJ production involves its concentration, in other words, it involves the
reduction of water content of the clarified juice. This is often done in order to reduce
transport costs since from one liter of FCOJ it is possible to make five liters of RDT
orange juice. The clarified juice then goes to the evaporators. During the
evaporation process the clarified juice is pre-heated and held at 95 to 98°C under
vacuum. This is so in order to avoid microbiological and enzymatic activities. The
evaporation stages bring the clarified juice to a concentration up to 66°Brix. The
total evaporation process lasts around 7 minutes. The evaporators are designed for
enormous juice volumes and their capacities can exceed 100,000 kg/h of water
evaporated.
Volatile flavor components go out of the clarified juice during the evaporation
process together with water and in order to be recovered the evaporators have an
essence recovery system. The volatile flavor components are separated from the
water by distillation under vacuum and then cooled to condensate. By cooling them
they are they are separated into oil and aqueous phases which will be separated
through decantation or centrifugation processes. Aroma and essence oil are sold to
concentrate blending houses, juice packers and flavor manufacturing companies.
According to the client specifications the FCOJ concentrated up to The 66°Brix will
be blended with concentrates of other produced batches and then cooled to long
bulk storage (about one year) at -10°C. The average density for FCOJ is 1.30t/m³.
3.5. NFC production
The clarified juice is ready to be transformed into NFC which is also known to be a
single-strength product. After the clarification process the juice is found mixed with a
great amount of oxygen which reduced the juice quality in terms of loss of vitamin C,
browning and changes in flavor, therefore the clarified juice must be submitted to a
de-aeration process carried under vacuum chambers, then it is cooled to avoid
microbiological growth or enzymatic reactions during its storage period. Before
storage for long periods of time, the single-strength juice must undergo a process
called pasteurization, better described in the Section 3.7. The NFC must go to the
pasteurization process before storage to have its enzymes deactivated and to avoid
microbiological activation the juice must be microbiologically stable. Due to its low
osmotic pressure, low sugar content which is up to 12°Brix and higher water
content, the NFC is more prone to microbiological growth. In the same way, its
chilled and not frozen storage requires a better hygienic storage if compared to
FCOJ frozen storage.
The NFC can be bulk stored in the long run (about one year) under either frozen or
aseptic conditions. NFC production involves large product volumes; for the same

16
amount of final juice, NFC volumes are 5 to 6 times larger than FCOJ, therefore
NFC transport costs are also higher if compared to FCOJ. Energy and warehouse
costs of freezing and storing frozen NFC are high. Moreover freezing NFC leads to
handling problems because it freezes solid, whereas frozen orange concentrate is
very viscous but it is still possible to be pumped. Frozen storage of NFC at -18°C is
more appropriate to low NFC volumes, stored in mild steel drums of 200 l lined with
a polyethylene plastic bag. Large volumes producers store NFC aseptically in very
large stainless-steel tanks up to 4 million liters capacity for the aseptic storage of
juice at -1°C. The average density for NFC juice is 1.045t/m³ and has on average a
concentration of 12°Brix.
3.6. By-products
The scope of this study is based on the main products of orange juice processing,
FCOJ and NFC. Therefore, it will be given just few information related to the by-
products of the orange juice production:
Peel oil: the extraction process produces an emulsion of oil and water and to
remove this oil is removed by means of oil concentration this concentrated oil
is called peel oil. It is normally packed in 200 l drums and is stored at -10°C
and is traded as Cold-Pressed Oil (CPO) or Cold-Pressed Peel Oil (CPPO)
and is used as a raw material in the flavor manufacturing industry, and by the
concentrated blending houses and drink-base manufacturers.
Direct citrus pulp: after the juice extraction about 50% of the fruit remains
in the form of peel, rag, seeds and pulp not used for commercial purposes
In the large processing plants this waste is sent to a feed mill to be
processed. The feed mill broke down this material to small pieces by
hammer mills, by pressing and drying processes the moisture is removed
and it pelletized to be sold as livestock feed.
Pulp: the solid particles in the orange juice form are called pulp. Pulp is also
the commercial name of the orange juice processing by-product which
consists of broken pieces of cell sacs and segment wall which are added
back o the final juice. The dry pulp is packed in 20kg corrugated cardboard
boxes lined with polyethylene bag or in 200 l drums and then frozen for
storage.
Pulp washed concentrates: it is the waste pulp produced by all juice
processes steps which are washed and recovered. It is then concentrated
and may be added back to concentrated orange juice. It can also be packed
in 200 l drums and frozen to be sold as base for juice drinks. Pulp wash is
also referred as water-extracted soluble orange solids (WESOS).
17
Essences and essence oils: the essence recovery is an integral part of the
evaporation process and was described in the section of concentrate
production.
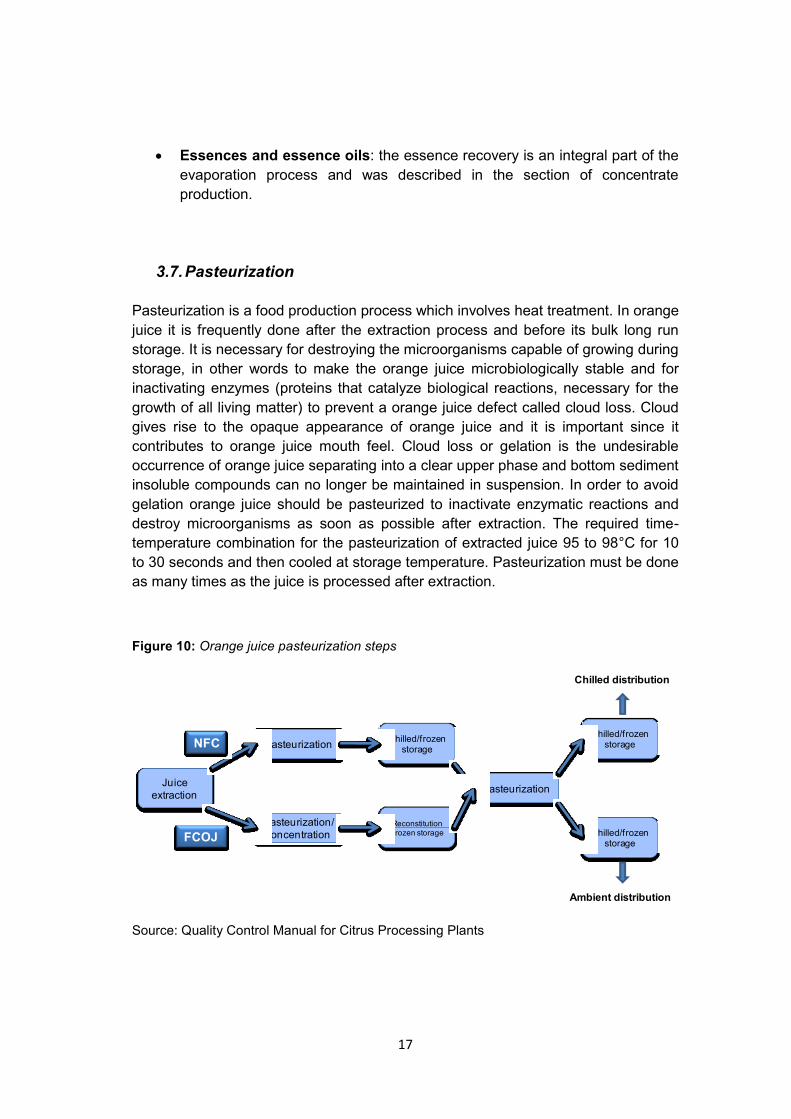
3.7. Pasteurization
Pasteurization is a food production process which involves heat treatment. In orange
juice it is frequently done after the extraction process and before its bulk long run
storage. It is necessary for destroying the microorganisms capable of growing during
storage, in other words to make the orange juice microbiologically stable and for
inactivating enzymes (proteins that catalyze biological reactions, necessary for the
growth of all living matter) to prevent a orange juice defect called cloud loss. Cloud
gives rise to the opaque appearance of orange juice and it is important since it
contributes to orange juice mouth feel. Cloud loss or gelation is the undesirable
occurrence of orange juice separating into a clear upper phase and bottom sediment
insoluble compounds can no longer be maintained in suspension. In order to avoid
gelation orange juice should be pasteurized to inactivate enzymatic reactions and
destroy microorganisms as soon as possible after extraction. The required time-
temperature combination for the pasteurization of extracted juice 95 to 98°C for 10
to 30 seconds and then cooled at storage temperature. Pasteurization must be done
as many times as the juice is processed after extraction.
Figure 10: Orange juice pasteurization steps
Source: Quality Control Manual for Citrus Processing Plants
Juice
extraction
Pasteurization
Pasteurization/
concentrationReconstitutionFrozen storage
Chilled/frozen storage
Pasteurization
Chilled/frozen storage
Chilled/frozen storageNFC
FCOJ
Chilled distribution
Ambient distribution
18
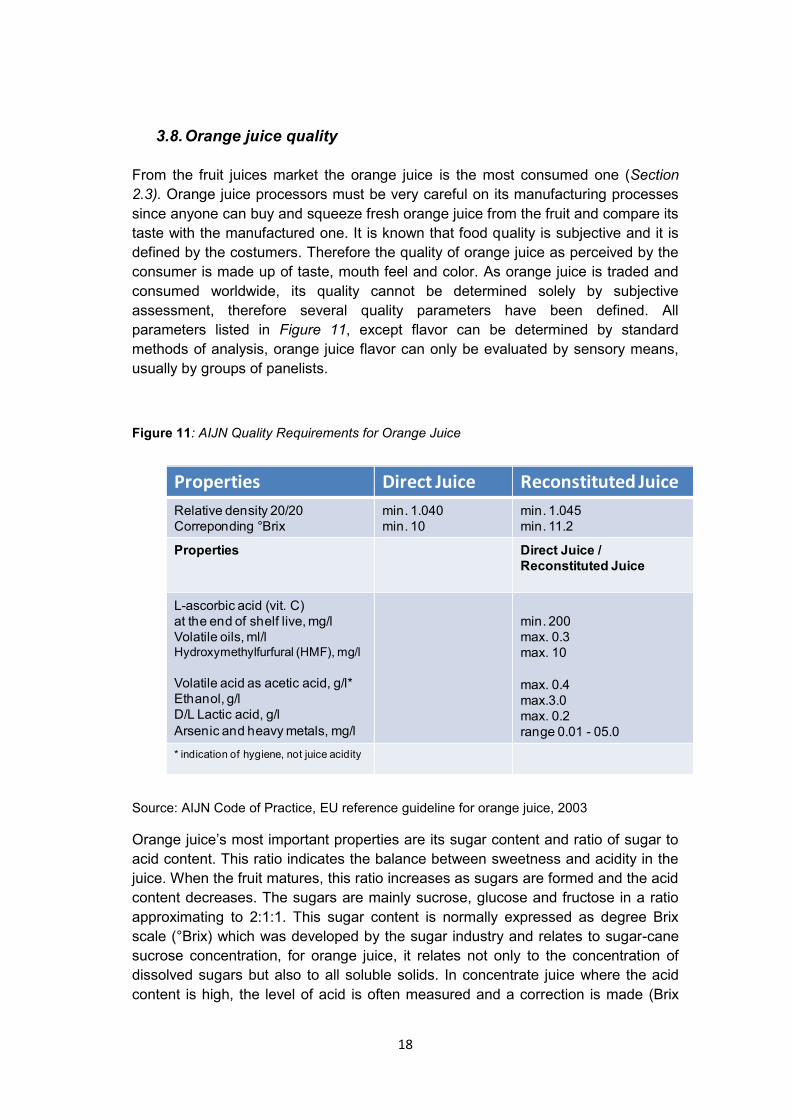
3.8. Orange juice quality
From the fruit juices market the orange juice is the most consumed one (Section
2.3). Orange juice processors must be very careful on its manufacturing processes
since anyone can buy and squeeze fresh orange juice from the fruit and compare its
taste with the manufactured one. It is known that food quality is subjective and it is
defined by the costumers. Therefore the quality of orange juice as perceived by the
consumer is made up of taste, mouth feel and color. As orange juice is traded and
consumed worldwide, its quality cannot be determined solely by subjective
assessment, therefore several quality parameters have been defined. All
parameters listed in Figure 11, except flavor can be determined by standard
methods of analysis, orange juice flavor can only be evaluated by sensory means,
usually by groups of panelists.
Figure 11: AIJN Quality Requirements for Orange Juice
Source: AIJN Code of Practice, EU reference guideline for orange juice, 2003
Orange juice‟s most important properties are its sugar content and ratio of sugar to
acid content. This ratio indicates the balance between sweetness and acidity in the
juice. When the fruit matures, this ratio increases as sugars are formed and the acid
content decreases. The sugars are mainly sucrose, glucose and fructose in a ratio
approximating to 2:1:1. This sugar content is normally expressed as degree Brix
scale (°Brix) which was developed by the sugar industry and relates to sugar-cane
sucrose concentration, for orange juice, it relates not only to the concentration of
dissolved sugars but also to all soluble solids. In concentrate juice where the acid
content is high, the level of acid is often measured and a correction is made (Brix
Properties Direct Juice Reconstituted Juice
Relative density 20/20
Correponding Brix
min. 1.040
min. 10
min. 1.045
min. 11.2
Properties Direct Juice /
Reconstituted Juice
L-ascorbic acid (vit. C)
at the end of shelf live, mg/l
Volatile oils, ml/lHydroxymethylfurfural (HMF), mg/l
Volatile acid as acetic acid, g/l*
Ethanol, g/l
D/L Lactic acid, g/l
Arsenic and heavy metals, mg/l
min. 200
max. 0.3
max. 10
max. 0.4
max.3.0
max. 0.2
range 0.01 - 05.0
* indication of hygiene, not juice acidity
19
corrected), this not so for single strength juice where the Brix scale is used without
correction.
The fruit juice industry in the European Union countries is guided by compulsory
directives found at the European Union Council Directive 2001/112/EC, by national
fruit juice regulations that are in force in the respective EU country and it is also
guided by recommendations which are given by the Association of the Industry of
Juices and Nectars (AIJN) from Fruit and vegetables of the European Union which
was revised in 2003.
The quality of fruit and the juice extraction process determines the quality of the
orange juice no other further production process can do it. Only in cases of allowed
posterior blending (FCOJ) the orange juice quality can be improved. Water is
another element very important in the orange juice quality made from concentrated
juice since it is added around 85% of water in the FCOJ for the production of a RTD
juice. Orange juice exposition to oxygen can decrease its quality through browning,
loss of vitamin C and changes in flavor. Therefore care must be taken to store and
transport orange juice. Juice packers will always check the above quality
requirements before accepting the delivery of a cargo.
3.9. Vitamin C
Ascorbic acid (vitamin C) is the most important nutrient of orange juice. Typical
values for vitamin C in freshly extracted juice range from 450 to 600 mg/l. Provided
that the production procedures are correct, only a small loss of vitamin C will occur.
More significant loses will occur during the packaging process and storage. Typical
values for orange juice when consumed range from 200 to 400 mg/l. Vitamin C is
essential for the synthesis of collagen, the most abundant protein in mammals, it is
the major fibrous element of skin, bone, blood vessels and teeth. It is suggested that
it has anticancer effects by its reaction with and inactivation of free radicals, it has
never shown that vitamin C has a preventive effect on the common cold. In the
Appendix 2 it is given the average vitamin C content of some fruits compared with
the vitamin C content of the orange juice and in Appendix 3 it is shown the nutrient
composition of orange juice.
3.10. Orange juice processing and the supply chain
Orange juice is a commodity and has as supply chain characteristic to be efficient
rather than responsive. The focus is on the cost reduction along the supply chain.
The orange juice processing industry needs to focus on supply chain efficiency as
the market uncertainties are low and consequently the responsiveness in the supply
chain is less required. As we have seen in this chapter the harvesting is always
somehow known before the orange juice processing and the market is a mature
one. This chapter and the following one describes what the industry does in order to
achieve efficiency in the supply chain as concentration of orange juice and overseas
transport of bulk orange juice by big refrigerated vessels aiming low transport costs
20
by volume unit. The goals of the orange juice supply chain, being characterized as
efficient is to supply the demand at the lowest cost. To achieve this objective, the
orange juice processing companies carry low profit margins since FCOJ is a
commodity and their customers are price driven with high inelastic demand
characteristic. As it was seen in this chapter the orange juice processors must have
high manufacturing volumes to benefit from economies of scale to reduce
manufacturing costs. It is necessary to maintain inventory costs low and to reduce
lead times without increasing costs. The supply strategy must be based on low costs
and high quality. Orange juice quality requirements are presented in this chapter on
Sections 3.8 and 3.9.
The aim of a supply chain is to add value to the customers and at the same time
reduce the costs along the supply chain raised to satisfy the customer needs.
Profitability of a supply chain is the difference between products value and what is
spent along all operations within the supply chain. Thus, to be successful a supply
chain must be profitable not only on its individual stages but along the whole chain
(Chopra and Meindl).
The orange juice industry is not vertically integrated (Section 4.1) and it deals with
food products, therefore, a thorough knowledge of the product is necessary along
the whole supply chain in order to avoid unwanted costs due to product damage
from inadequate handling or processing. In order to be competitive, the orange juice
processors must fit their supply strategies with their corporate competitive strategies
and this can be achieved by understanding the customer needs and fixing the
supply chain strategies to the customer needs covered by the umbrella of the
corporate competitive strategies. Also, as the orange juice industry is not vertically
integrated companies along the supply chain must work on a coordinated way
avoiding optimization of individual performance but working to promote optimization
along the entire supply chain to achieve the expected high supply chain profitability.
Transport cost is an important component in the price of the bulk orange juice
(Section 4.2), Chapter 6 describes how orange juice transport by inland vessels
deploying tank containers can increase supply chain efficiency by reducing transport
costs not increasing inventory costs and reducing inbound transport costs for the
orange juice packers therefore reducing their order costs.

21
4. Industry value and transport chain
In order to know the industry players and understand their importance on the orange
juice manufacturing and transport chain and their correlated quality issues as well as
the transport and storage requirements for each stage of orange juice processing,
this chapter brings information related to the orange juice industry structure.
4.1. Industry value chain
The orange industry is formed by the orange fruit growers, by the bulk processors
which sell their product in bulk form, by the marketing processors which produce
and sell their own juice brands, by the blending houses which provide concentrate
juice and supply it on a consistent base according to customer specifications, by the
juice packers which treat bulk product as required and then pack it into customer
packages and finally by the soft drink producers which use orange juice concentrate
and prepared bases from blending houses as raw material.
Vertical integration in the orange industry is not common. Rare are the companies
that participate in all phases of the orange juice value chain: from the fruit groves to
the juice packers. It has been observed that as the industry matures, the needs of
specialization in each phase of the value chain are growing, each link in the
production chain is becoming more and more independent as the demands of the
market for specialized services grows and long term contracts have been agreed
among the value chain players as well as the use of the future markets both
practices aiming the reduction of international price fluctuation risks.
Figure 12: Orange juice industry value chain
Source: The author
Oranges
Fruit
processors
Soft drink
producers
Final
consumer
Juice
packers
Blending
houses
4. Industry value and transport chain

22
4.1.1. Orange growers
The first link of the orange juice value chain are the orange juice growers, they own,
manage and harvest the grove. Normally they are small enterprises which sell the
orange fruit to a handler or sell it to the large processing companies through a
cooperative. The relationship between the orange growers and the large processing
companies are through long term supply contracts. Some large processors in Brazil
still get part of their fruit (around 20%) from their own groves and the remaining fruit
is obtained from independent growers.
Growers are paid not on quantity of boxes or weight of delivered fruit but on the
amount soluble solids obtained from the fruit. A sample of fruit is taken for analysis
from each truck and the quantity of fruit‟s soluble solids is calculated from the
volume of juice extracted from the fruit multiplied by the °Brix of the juice. This gives
the processor an indication of fruit ripeness.
4.1.2. Fruit processors
Orange juice processors buy the fruit and process it to produce FCOJ and NFC.
They are divided in two groups: marketing processors and bulk processors.
Marketing processors sell packaged juice under their own brand name, which
requires retail and consumer marketing skills. The largest marketing processors are
Tropicana and Citrus World which are based in Florida, USA. They are the NFC
leading producers. They process fruit into juice and fill it into retail packages at their
own facilities. They also purchase additional juice in bulk from other bulk
processors. The control, of product availability is regarded more important than
ownership of manufacturing assets. As an example, Coca-Cola focuses on
marketing and distributing Minute-Maid brands, while the production facilities are
owned by the Brazilian bulk processors.
Bulk processors mainly sell their products in bulk form, which requires skills in the
efficient distribution and marketing of a commodity. The majority of orange juice
worldwide is produced by bulk processors. Bulk delivery is most important to the
large Brazilian processors; they do not have their own consumer brands in order to
avoid competing with their bulk juice customers. Bulk processors make money from
the difference in bulk concentrate prices and fruit prices (the bulk processing
margin). In order to more efficiently operate in the world market, Brazilian
processors own about half of Florida‟s juice production. Operating in both markets
offers benefits such as higher trading efficiency and balancing concentrate quality
through juice blending.
4.1.3. Blending houses
The orange juice customers demand a juice with consistent quality. As it was
described in Section 2.4.2 due to variations in the fruit quality along the season
which by consequence create variations in operation conditions it is impossible to
maintain the same juice quality along the year, it will be experienced variations in
flavor profile, °Brix, acidity, pulp levels etc, therefore, consistent quality between

23
batches of FCOJ are not maintained. This need of quality consistence created the
blending houses. In order to provide juice packers with a concentrate and even NFC
juice that consistently meets defined quality specifications, these companies blend
juice of different origin and add flavor fractions, often according to customer
specification. The large Brazilian processors who have their own terminal facilities
also offer blending house operations. The preparation of soft drinks bases is another
important business activity for the blending houses. Purchasing juice from a
blending house is more expensive than buying it from the spot market but the buyer
can be assured that the product quality meets his demands.
4.1.4. Juice packers
This industry segment is responsible for buying orange and other type of juices in
bulk, put them according to the customers‟ specifications and then pack the juices in
consumer packages. They may also control the distribution of the packaged juice.
There are two main categories of juice packers: those who market their own brands
and those who co-packing for private label brands. Fluctuations in world market
prices not always are reflected in the retail prices, thus, for a successful operation,
juice packers need to have special skills in areas such as:
Sourcing: raw material costs constitute a major share of the total costs, right juice
quality and favorable contracts are vital to overall profitability.
Processing and packaging: focus is maintaining product quality and keeping running
costs and product losses down.
Distribution: as distribution plays also an important role in juice packers‟ profitability,
an efficient distribution system must be in place.
Marketing: important to those who market its own brand.
4.1.5. Soft drink producers
Companies in this link of the value chain are manufacturers of retail packaged
carbonated beverages and fruit-flavored still drinks. They may use orange
concentrate as raw material, but often purchase a prepared base from a blending
house. For drinks of fruit content, the flavor of FCOJ is not strong enough and has to
be enhanced with additional flavors. Other ingredients are emulsifiers,
preservatives, sugar, acids, water and carbonation when required. Blending houses
play an important role for soft drink producers since they are a source of experience
and product knowledge which can help in the development of new soft drinks in
response to new consumer trends and demands.
4.2. Industry transport chain
Shipping of orange juice products is dominated by bulk shipments, mainly frozen
concentrate. Shipping costs depend on the modes and current rates of shipment.
24
The sales price for the bulk product usually includes the cost of the bulk package,
and often the transport cost to the import harbor. Orange juice consumption in
Europe with regard to imported Brazilian juice requires shipping large quantities of
juice products over long distances. Transport cots constitute a significant part of the
bulk product price, typically 15 to 20%. Thus, efficient control of the transport chain
is very important (Section 3.10). Long distance overseas shipping of juice products
in retail packages is not common for reasons of cost and logistics.
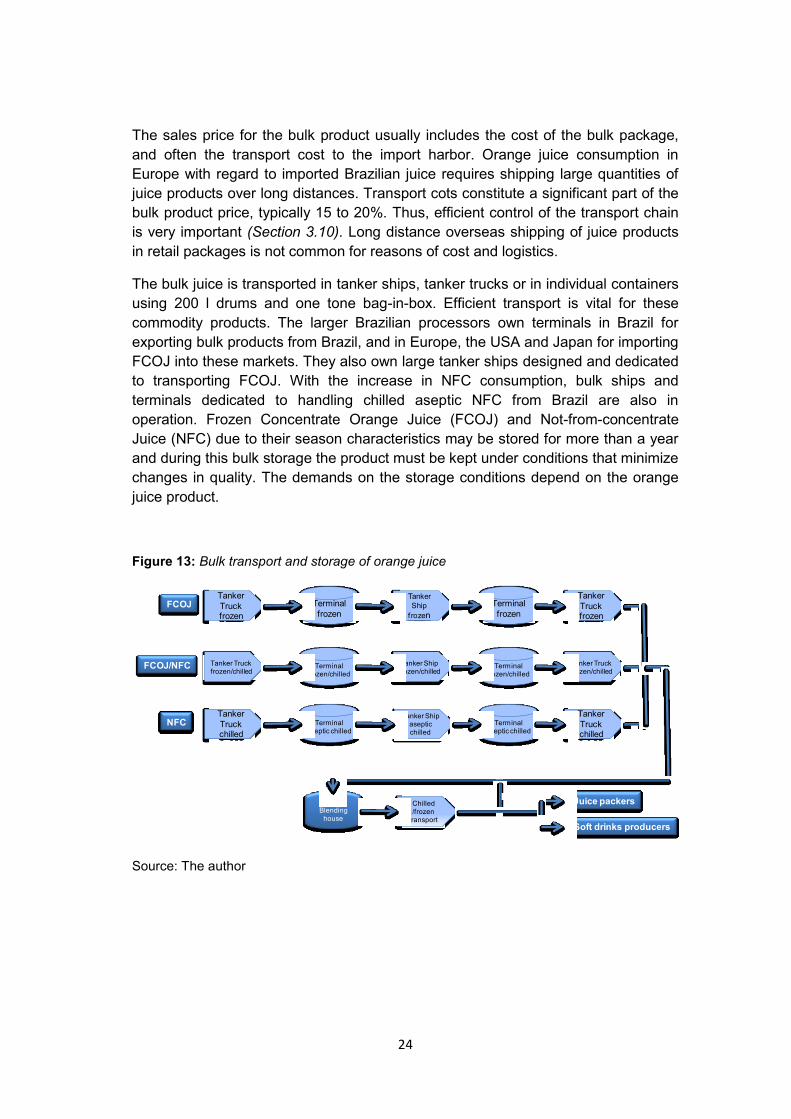
The bulk juice is transported in tanker ships, tanker trucks or in individual containers
using 200 l drums and one tone bag-in-box. Efficient transport is vital for these
commodity products. The larger Brazilian processors own terminals in Brazil for
exporting bulk products from Brazil, and in Europe, the USA and Japan for importing
FCOJ into these markets. They also own large tanker ships designed and dedicated
to transporting FCOJ. With the increase in NFC consumption, bulk ships and
terminals dedicated to handling chilled aseptic NFC from Brazil are also in
operation. Frozen Concentrate Orange Juice (FCOJ) and Not-from-concentrate
Juice (NFC) due to their season characteristics may be stored for more than a year
and during this bulk storage the product must be kept under conditions that minimize
changes in quality. The demands on the storage conditions depend on the orange
juice product.
Figure 13: Bulk transport and storage of orange juice
Source: The author
Tanker
Truck frozen
Tanker Truck frozen/chilled
Tanker
Truck chilled
Terminal
frozen
Terminal aseptic chilled
Terminal frozen/chilled
Tanker Ship aseptic chilled
Tanker Ship frozen/chilled
Tanker
Ship
f rozen
Terminal
frozen
Terminal frozen/chilled
Terminal aseptic chilled
Tanker
Truck frozen
Tanker Truck frozen/chilled
Tanker
Truck chilled
NFC
FCOJ
FCOJ/NFC
Blending house
Chilled /frozen
transport
Juice packers
Soft drinks producers
25
4.2.1. FCOJ storage and transport
FCOJ shipping is normally done in ships, tanker trucks and drums. For shipping in
tanker trucks the product is typically kept at - 8 to -10°C. For drums the FCOJ is
normally packed in 200 l steel drums with double polyethylene liners and stored
frozen at -18 to -25°C. It is also packed in aseptic bags using drums or wooden bins
for outer support as under these conditions they do not require frozen storage
conditions they allow more flexibility in the transport chain. FCOJ is bulk stored
frozen at temperatures from - 6 to - 25°C to avoid degradation of product quality, the
longer the storage time the lower the storage. The transport of FCOJ in bulk tanker
ships is made easier by special port terminals and the major Brazilian processors
have built their own terminal facilities in Brazil, Europe USA and Japan. Tanker ship
capacities are in the range of 6,000 to 15,000 tons of product. Some of the major
Brazilian processors run their own ships for transporting the bulk orange juice to
their foreign terminals. The handling of FCOJ in bulk tanker ships requires heavy
investment in infrastructure such as the ships themselves and special terminals but
when this infrastructure is in place it turns to be an effective way of transporting
large orange juice volumes.
4.2.2. NFC storage and transport
NFC is bulk stored frozen in 200 l drums at -18°C or lower, or chilled in large aseptic
tanks or aseptic bag-in-box containers at -1 to 1°C. Both forms of storage give a
shelf life of one year. This long shelf life is necessary since juice from fruit harvested
at different times of the season is blended to obtain consistent quality year round.
Low temperature storage is important. A temperature of 0°C is low enough to avoid
deterioration of the juice while keeping the juice as a liquid; single-strength juice
starts to freeze at around - 2°C. An advantage of aseptic NFC storage over frozen
NFC is that the juice does not have to be thawed before final packaging. This avoids
the use of crushing equipment and high energy input for quick thawing. At ambient
temperature thawing takes several days and therefore product quality may
deteriorate during this period due to microbial growth and flavor degradation.
Freezing NFC leads to handling problems because it freezes solid, whereas frozen
orange concentrate is very viscous but it is still possible to pump it. Frozen storage
of NFC at -18°C is more appropriate to low NFC volumes, stored in mild steel drums
of 200 l lined with a polyethylene plastic bag. Large volumes producers store NFC
aseptically in very large stainless-steel tanks up to 4 million liters capacity for the
aseptic storage of juice at -1°C, just above the freezing temperature of the juice.
While in Florida carbon steel tanks with the internal surfaces coated with an epoxy
lining, Brazilian producers use mainly stainless-steel tanks for NFC storage. The
tanks are sterilized fluid (iodoform) and are installed within a large refrigerated
building. The juice must be agitated periodically to avoid separation of sinking pulp
and to maintain °Brix uniformity. Pressurized nitrogen above the juice surface is
often maintained to minimize the risk of quality and vitamin C loss through oxidation.
26
4.3. Storage and transport - effects of oxygen on quality
Oxygen plays a major role in the loss of quality in orange juice during storage due to
color changes (browning), flavor and vitamin C degradation. It is a very reactive
element which can induce several changes in the chemical composition of orange
juice and the most dominant of which is the loss of vitamin C and consequent loss of
nutritional value of the product. The vitamin C degradation can occur through both
aerobic (depending on oxygen) and anaerobic (not depending on oxygen) which one
predominates depends on the temperature and availability of oxygen. During
processing the aerobic degradation of vitamin C predominates, whereas during
orange juice storage both systems help with vitamin C degradation. In the aerobic
degradation, 1 mg of oxygen corresponds theoretically to a loss of 11 mg of vitamin
C. Also, the desirable taste of freshly squeezed orange juice is easily affected by
bulk storage. When the right processing conditions are followed by the fruit
processor, the loss of vitamin C from orange fruit to frozen orange juice concentrate
is in general negligible. Therefore, the bulk storage of orange juice in the FCOJ or
NFC forms must be done not only under the recommended temperature but also as
stated before in positive pressurized warehouses and in stainless steel tanks with
inert gas (normally nitrogen).
4.4. Comparison with the chemical industry transport chain
The chemical industry has various similarities in regard to the orange juice transport
chain. The products are processed in large batches and are transported as liquid
bulk from the processing plants to the final customers. This is normally done using
tanker barges, tanker trucks and trains. This particular industry have been using
tank containers (Section 6.2) since long time ago, practice which permits the
application of intermodal transport (Section 6.1), goods can be transported in
different modalities without the necessity of handle the cargo at each modal change.
This is only possible using the tank container. The chemical industry mastered the
concept of containerization (Section 6.6.1) applying the usage of standardized
containers in order to unitize cargo and transfer it from one transport modal to other
transport modal by means of standardized handling equipment, and provides cheap
door to door products delivery handling it only at the point of origin and destination.
The possibility to choose the transport mode more convenient for each cargo to be
transported creates a competitive advantage on a very competitive market where
this industry is allocated. Therefore, the same concepts should be applied for the
orange juice industry, respecting all of its particularities and technicalities seen in
this chapter.
27
5. Logistic infrastructure for orange juice hinterland transport
This chapter introduces the Fruitport and the orange juice processing companies
located there and a description of how the bulk product shipped from Brazil is
transported to the Port of Rotterdam. Also, it reviews the logistic infrastructure for
orange juice transport through a brief description of inland terminals and of the
European inland vessels fleet and the bottle-necks and expected investments of the
European inland waterways related to the case study.
It is known that the strength of a transportation system is based on its diversity with
each modal carrying its own advantage: trucks with its ability to door-to-door
services, water carriers with the ability to carry goods safely at low costs and trains
able to carry all sorts of goods at long distances. In the Port of Rotterdam it is
possible to find all this modalities for the hinterland transport of goods. This thesis,
due to the characteristics of the product and available water transport infrastructure
in Europe benefiting from its river systems, will explore the feasibility of European
inland water transport of orange juice by barges.
5.1. Rotterdam’s Fruitport and its orange juice processing players
Source: Port of Rotterdam
The companies located in the Port of Rotterdam active in the juice market are
historically grouped in the Vierhavensgebied and the Merwehaven and due to this
geographic clustering this port area is called the Fruitport. Due to their proximities to
the city center, these areas are to be transformed in residential areas. By 2020 the
Merwehaven and by 2030 the Vierhavens are to be re-developed into residential
areas. The Merwehaven has been active in the transshipment and storage of fruit
and vegetables since 1971 and currently has a capacity of 43,000 m² of cold storage
Rotterdam’s FruitportFigure 14: Rotterdam’s Fruitport:
5. Logistic infrastructure for orange juice hinterland transport
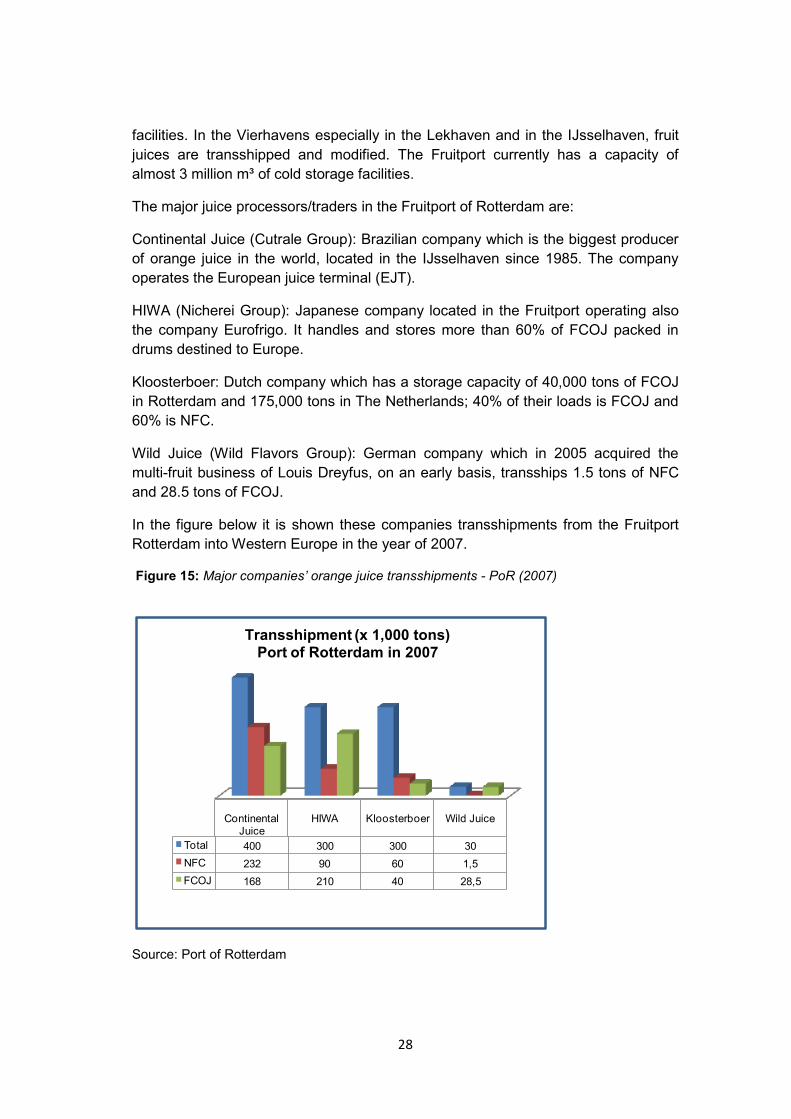
28
facilities. In the Vierhavens especially in the Lekhaven and in the IJsselhaven, fruit
juices are transshipped and modified. The Fruitport currently has a capacity of
almost 3 million m³ of cold storage facilities.
The major juice processors/traders in the Fruitport of Rotterdam are:
Continental Juice (Cutrale Group): Brazilian company which is the biggest producer
of orange juice in the world, located in the IJsselhaven since 1985. The company
operates the European juice terminal (EJT).
HIWA (Nicherei Group): Japanese company located in the Fruitport operating also
the company Eurofrigo. It handles and stores more than 60% of FCOJ packed in
drums destined to Europe.
Kloosterboer: Dutch company which has a storage capacity of 40,000 tons of FCOJ
in Rotterdam and 175,000 tons in The Netherlands; 40% of their loads is FCOJ and
60% is NFC.
Wild Juice (Wild Flavors Group): German company which in 2005 acquired the
multi-fruit business of Louis Dreyfus, on an early basis, transships 1.5 tons of NFC
and 28.5 tons of FCOJ.
In the figure below it is shown these companies transshipments from the Fruitport
Rotterdam into Western Europe in the year of 2007.
Figure 15: Major companies’ orange juice transshipments - PoR (2007)
Source: Port of Rotterdam
Continental Juice
HIWA Kloosterboer Wild Juice
Total 400 300 300 30
NFC 232 90 60 1,5
FCOJ 168 210 40 28,5
Transshipment (x 1,000 tons)Port of Rotterdam in 2007

29
5.2. Shipping FCOJ from Brazil to Europe
About 80% of the Brazilian orange juice production is controlled by four companies:
The Brazilians Cutrale, Citrosuco, Citrovita and the French Group Louis Dreyfus-
Coinbra. Worldwide they control the prices and the rules of the FCOJ market, and
the whole value chain as well: production, processing, export, transport and storage.
The majority of the orange juice processors are located in the state of Sao Paulo
with distance from the export harbor in the Port of Santos within the range of 400
and 800 km. A dedicated fleet of 25 tons tanker trucks carry the FCOJ from the
production sites to the terminals in the port of Santos where it is stored in dockside
tanks at -10°C under nitrogen atmosphere. At a tightly controlled schedule bulk
tanker ships after arriving in Santos receive the FCOJ pumped on board within 24 to
36 hours depending on the size of the ship. The bulk tanker ships are filled
completely to allow no headspace. The orange concentrate is loaded and
transported at -10 °C. The journey from the Port of Santos in the state of Sao Paulo,
Brazil to the Port of Rotterdam in The Netherlands, Europe takes 13 days. During
the whole voyage the storage conditions of the product is continuously monitored.
After arriving in the Rotterdam terminal with dedicated dockside facilities to receive
FCOJ, large pumps (8 inch piping) on board the ship pump out the FCOJ directly
into storage tanks on land. This operation takes also 24 to 36 hours, depending on
the size of the ship. Operation of a terminal requires unlimited choice of product
specifications, thus it needs to be controlled by modern automation system which
allows the operators to get a rapid overview of pumping operations at all times. After
have been unloaded, the bulk tanker ship returns to Santos ballasted and may also
take freight containers on deck. The ship‟s empty tanks are not cleaned but are kept
under nitrogen. Apart from the road transport the FCOJ is kept all the time under
nitrogen protective atmosphere.
5.3. Shipping NFC from Brazil to Europe
Unlike in Florida where NFC is mainly stored and utilized on a processor‟s site, NFC
produced in Brazil is primarily intended for export. The aseptic tank farms are
therefore installed at the dockside export terminal instead at the juice factory.
Clarified juice is then pre-pasteurized and cooled down to 0°C at the processing site
and transported by insulated road tanker of 25 tons to the dockside storage facilities
at the export harbor located in Port of Santos, situated within the range of 400 and
800 km from the processing plants. Full pasteurization of juice takes place at the
terminal before it is transferred to the large aseptic storage tanks of nearly 4 million
liters volume for long-term bulk storage to bridge the season or to be aseptic
transferred to sea vessels fitted with bulk aseptic tanks. The aseptic tanks are
located in insulated refrigerated storage areas where the temperature is maintained
at 0°C. Juice is then transported to Europe under chilled aseptic conditions,
normally at 0°C, on board of specially designed ships which can take up to 35,000
30
tons of NFC each. They are more than 200m long and 30m wide. Each ship
contains four insulated refrigerated holds with several freestanding cylindrical tanks
in each hold. Sloping bottoms ensure that the tanks can be completed drained. Each
ship is equipped with own sterilization system for the bulk tanks and the piping
system is sterilized before juice transfer. Aseptic seals are maintained on tank
valves throughout the journey. Individual bulk tanks are maintained under
continuous nitrogen pressure, even during loading/unlading when nitrogen is
exchanged with dockside tanks. On arrival at Rotterdam, samples from onboard
tanks are checked to confirm that the juice is microbiologically acceptable. The
piping system is sterilized before aseptic juice transfer from onboard tanks to
dockside storage using similar facilities to that at the export terminal in Brazil. A
nitrogen system ensures that the entire system of tanks and piping is under nitrogen
pressure during the NFC transfer. Voyage time and load/unload operations time are
similar of the FCOJ case. For the ballasted return trip to Brazil the empty tanks are
filled with nitrogen. In order to reduce the costs of the returning trip, they can also
take on deck dry or refrigerated freight containers. Juice in the dockside tanks is
sampled regularly to verify that their contents are microbiologically acceptable. The
juice from the tank storage is dispatched chilled by road tanker, hygienic but not
aseptic, to the customer.
5.4. Transport of bulk FCOJ and NFC versus transport of packaged
products
As for concentrate shipping volumes are 5 to 6 times smaller in order to obtain
constituted juice it is simple to conclude that bulk shipping in this case is more
economic (Appendix 4 calculates the quantity of concentrate needed to make 1 liter
of juice). However, for the NFC the volumes are the same whether it is shipped in
bulk or in retail packages. In the USA for instance, NFC produced in Florida is retail
packed and shipped within the USA.
In the case of Brazil where almost all production is dedicated for export, bulk
shipping is more cost efficient; bulk package can maintain a long shelf life whereas
after the retail packaging in non-aseptic packages the shelf live is relatively short
and this is a problem when almost a month of shelf live is eliminated by the transport
chain. Another import point to be considered is the fact that it is not possible to
respond quickly to market demands due to the long time required to get retail
packages to the consumer.
5.5. Inland terminals
Inland terminals are inland ports located in inland waterway such as a river, lake or
canal. They are linked with a sea port and between themselves and have as a
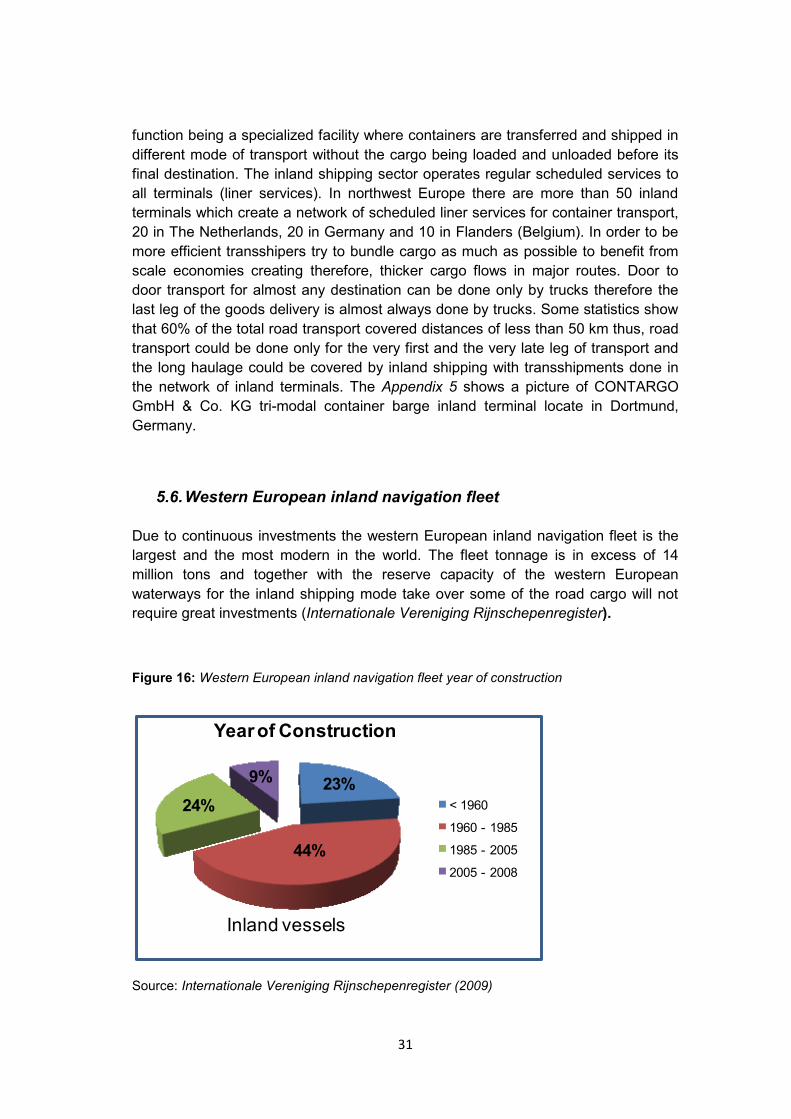
31
function being a specialized facility where containers are transferred and shipped in
different mode of transport without the cargo being loaded and unloaded before its
final destination. The inland shipping sector operates regular scheduled services to
all terminals (liner services). In northwest Europe there are more than 50 inland
terminals which create a network of scheduled liner services for container transport,
20 in The Netherlands, 20 in Germany and 10 in Flanders (Belgium). In order to be
more efficient transshipers try to bundle cargo as much as possible to benefit from
scale economies creating therefore, thicker cargo flows in major routes. Door to
door transport for almost any destination can be done only by trucks therefore the
last leg of the goods delivery is almost always done by trucks. Some statistics show
that 60% of the total road transport covered distances of less than 50 km thus, road
transport could be done only for the very first and the very late leg of transport and
the long haulage could be covered by inland shipping with transshipments done in
the network of inland terminals. The Appendix 5 shows a picture of CONTARGO
GmbH & Co. KG tri-modal container barge inland terminal locate in Dortmund,
Germany.
5.6. Western European inland navigation fleet
Due to continuous investments the western European inland navigation fleet is the
largest and the most modern in the world. The fleet tonnage is in excess of 14
million tons and together with the reserve capacity of the western European
waterways for the inland shipping mode take over some of the road cargo will not
require great investments (Internationale Vereniging Rijnschepenregister).
Figure 16: Western European inland navigation fleet year of construction
Source: Internationale Vereniging Rijnschepenregister (2009)
Year of Construction
< 1960
1960 - 1985
1985 - 2005
2005 - 2008
24%
44%
9% 23%
Inland vessels
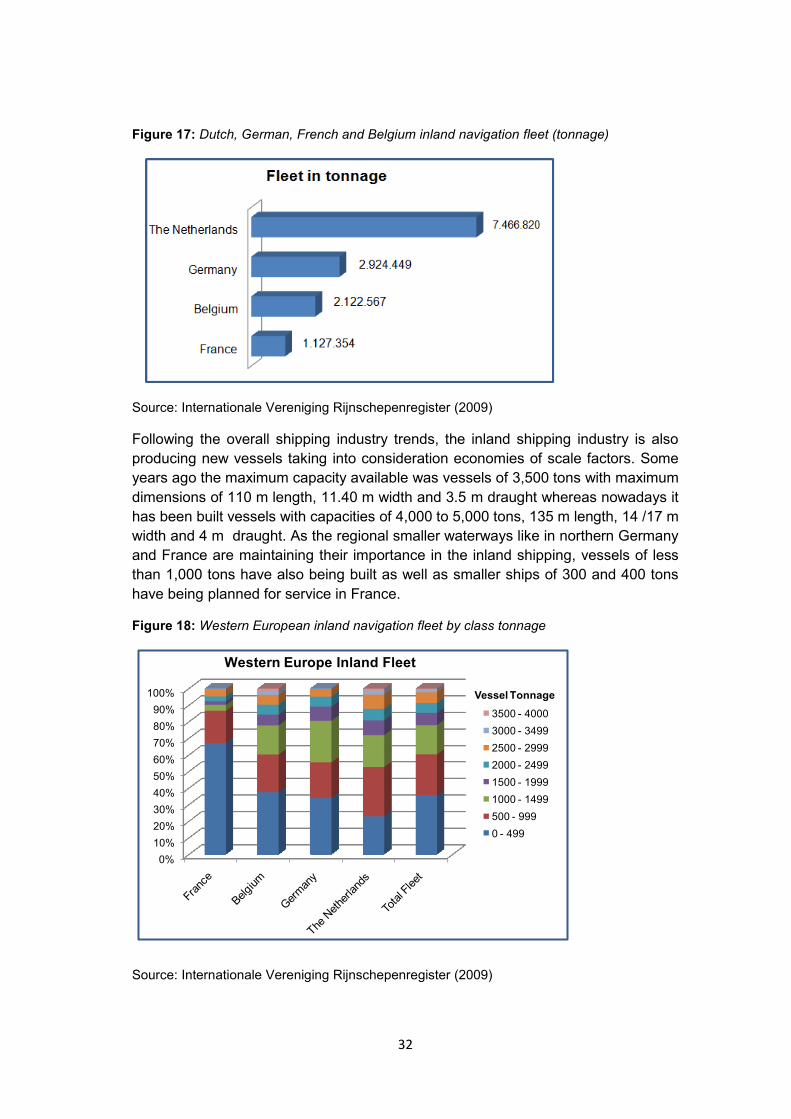
32
Figure 17: Dutch, German, French and Belgium inland navigation fleet (tonnage)
Source: Internationale Vereniging Rijnschepenregister (2009)
Following the overall shipping industry trends, the inland shipping industry is also
producing new vessels taking into consideration economies of scale factors. Some
years ago the maximum capacity available was vessels of 3,500 tons with maximum
dimensions of 110 m length, 11.40 m width and 3.5 m draught whereas nowadays it
has been built vessels with capacities of 4,000 to 5,000 tons, 135 m length, 14 /17 m
width and 4 m draught. As the regional smaller waterways like in northern Germany
and France are maintaining their importance in the inland shipping, vessels of less
than 1,000 tons have also being built as well as smaller ships of 300 and 400 tons
have being planned for service in France.
Figure 18: Western European inland navigation fleet by class tonnage
Source: Internationale Vereniging Rijnschepenregister (2009)
0%
10%
20%
30%
40%
50%
60%
70%
80%
90%
100%
3500 - 4000
3000 - 3499
2500 - 2999
2000 - 2499
1500 - 1999
1000 - 1499
500 - 999
0 - 499
Vessel Tonnage
Western Europe Inland Fleet
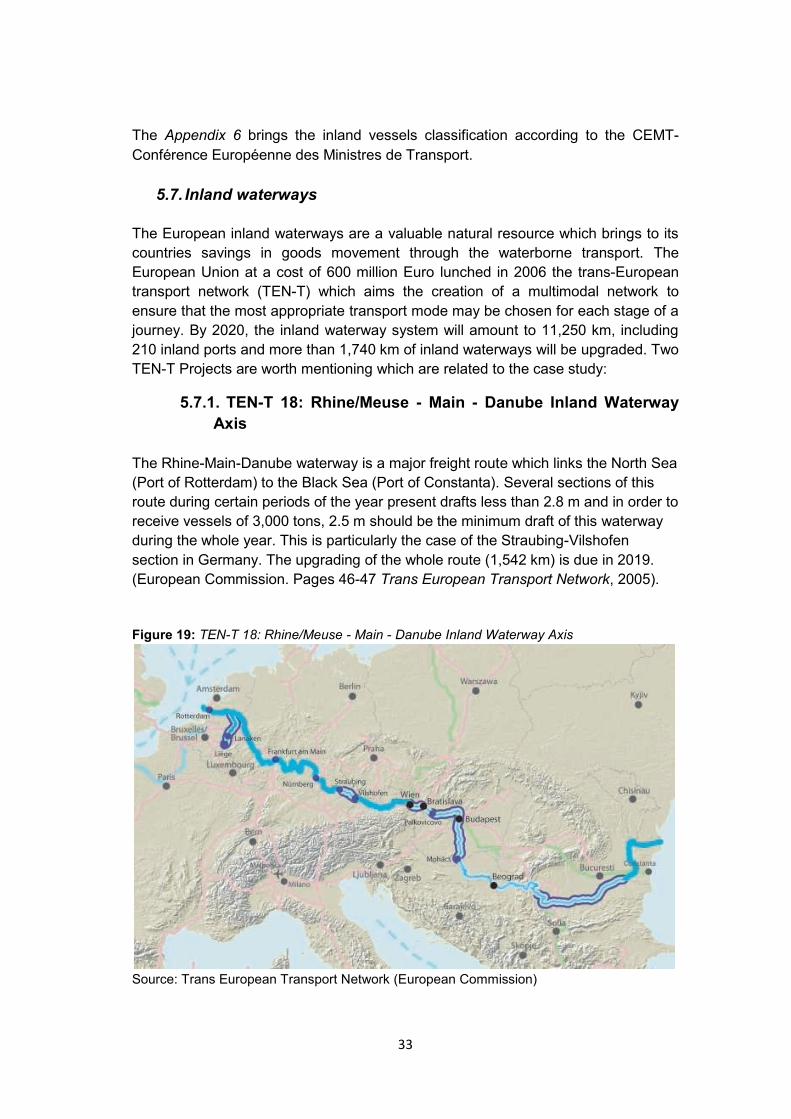
33
The Appendix 6 brings the inland vessels classification according to the CEMT-
Conférence Européenne des Ministres de Transport.
5.7. Inland waterways
The European inland waterways are a valuable natural resource which brings to its
countries savings in goods movement through the waterborne transport. The
European Union at a cost of 600 million Euro lunched in 2006 the trans-European
transport network (TEN-T) which aims the creation of a multimodal network to
ensure that the most appropriate transport mode may be chosen for each stage of a
journey. By 2020, the inland waterway system will amount to 11,250 km, including
210 inland ports and more than 1,740 km of inland waterways will be upgraded. Two
TEN-T Projects are worth mentioning which are related to the case study:
5.7.1. TEN-T 18: Rhine/Meuse - Main - Danube Inland Waterway
Axis
The Rhine-Main-Danube waterway is a major freight route which links the North Sea
(Port of Rotterdam) to the Black Sea (Port of Constanta). Several sections of this
route during certain periods of the year present drafts less than 2.8 m and in order to
receive vessels of 3,000 tons, 2.5 m should be the minimum draft of this waterway
during the whole year. This is particularly the case of the Straubing-Vilshofen
section in Germany. The upgrading of the whole route (1,542 km) is due in 2019.
(European Commission. Pages 46-47 Trans European Transport Network, 2005).
Figure 19: TEN-T 18: Rhine/Meuse - Main - Danube Inland Waterway Axis
Source: Trans European Transport Network (European Commission)
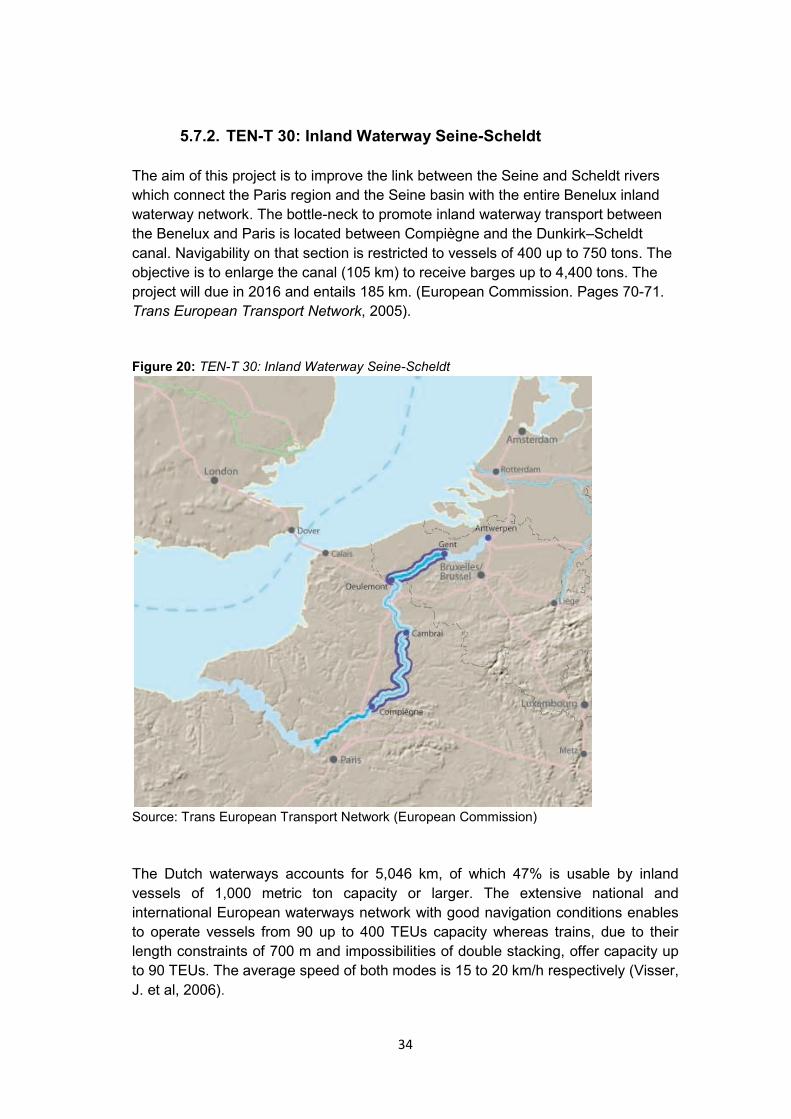
34
5.7.2. TEN-T 30: Inland Waterway Seine-Scheldt
The aim of this project is to improve the link between the Seine and Scheldt rivers
which connect the Paris region and the Seine basin with the entire Benelux inland
waterway network. The bottle-neck to promote inland waterway transport between
the Benelux and Paris is located between Compiègne and the Dunkirk–Scheldt
canal. Navigability on that section is restricted to vessels of 400 up to 750 tons. The
objective is to enlarge the canal (105 km) to receive barges up to 4,400 tons. The
project will due in 2016 and entails 185 km. (European Commission. Pages 70-71.
Trans European Transport Network, 2005).
Figure 20: TEN-T 30: Inland Waterway Seine-Scheldt
Source: Trans European Transport Network (European Commission)
The Dutch waterways accounts for 5,046 km, of which 47% is usable by inland
vessels of 1,000 metric ton capacity or larger. The extensive national and
international European waterways network with good navigation conditions enables
to operate vessels from 90 up to 400 TEUs capacity whereas trains, due to their
length constraints of 700 m and impossibilities of double stacking, offer capacity up
to 90 TEUs. The average speed of both modes is 15 to 20 km/h respectively (Visser,
J. et al, 2006).

35
More than half of the transport of all goods and 40% of container transport within the
Netherlands is carried out using inland shipping vessels and the figure below
confirms this Dutch preference by this mode of transport since 46% of the Western
Europe inland shipping freight carrying fleet is under the Dutch flag. Even though,
almost all European hinterland transport of orange juice from the Fruitport is done
solely by tanker trucks.
Figure 21: Western European inland shipping freight carrying fleet (%)
Source: Internationale Vereniging Rijnschepenregister (2009)
Netherlands
Germany
Belgium
France
Others
Freight carrying fleet %
25
46
1315
1
36
6. Barge hinterland transport of orange juice in Europe: case study
This chapter introduces the tank container and the concepts of inter-modality and
containerization. These concepts will be applied in the logistics of orange juice
transport since the tank container will substitute the tanker truck mono-modal
transport. The case study is then presented, the feasibility to use container barge
services for the European hinterland transport of orange juice as well as investment
and environmental issues are discussed.
6.1. Intermodal transport
According to the Europe Forum on Intermodal Transport, intermodal transport is
defined as a service involving transference between different modes of transport
through the use of different modes of transport while transporting a cargo in the
same load unit without handling the cargo when the modes are changed. Intramodal
transport is defined as the transport using different elements of a modal subsystem
requiring cooperation among them. In order to be competitive in the international
market a country needs to have an efficient and diversified transport mode. This
diversified transport mode creates interdependency among them and makes the
transportation designers think on a coordinated way when deciding for transport
modes to be used in specific cases. It is this concept that will be used in this case
study.
Inland shipping involves pre and post transport operations in order for goods reach
their final destination. Intermodality, the combination of different modes of transport,
relays on transshipment to other modes as trains and trucks and this operation can
be easily done by using standardized containers sizes.
6.1.1. Containerization
Containerization is to use standardized containers in order to unitize cargo for
supply, storage and transport. Rather than being loaded and unloaded, cargo can
be transferred from one transport mode to another by means of standardized
handling equipment without being re-handled. The goods will be loaded or unloaded
only at the port of origin or destination, on a door to door base.
Using tank containers it will be promoted the containerization of the orange juice
transport and thus, the concepts of intermodal and intramodal transport can be
applied since it will be possible to use different hinterland transport modals as
barges, trains and trucks on a coordinated way. In Europe, intermodal hinterland
transport (trains and barges) is gaining importance since using it will promote the
modal shift from congested road transport by trucks to trains and barges. This is the
particular case of the ports of Rotterdam and Antwerp where inland waterways and
railways promote a cost effective hinterland connection. In the figure below it is
possible to see that the modal split among road, rail and barge remained constant
6. Barge hinterland transport of orange juice in Europe: case study
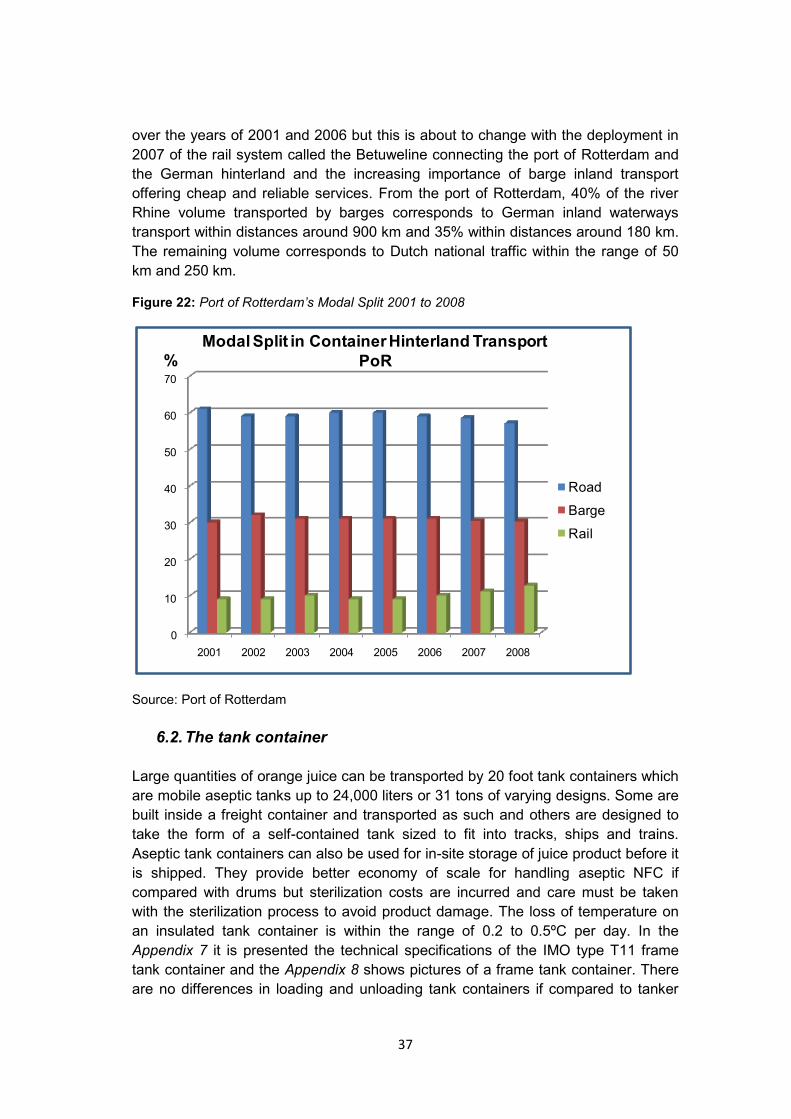
37
over the years of 2001 and 2006 but this is about to change with the deployment in
2007 of the rail system called the Betuweline connecting the port of Rotterdam and
the German hinterland and the increasing importance of barge inland transport
offering cheap and reliable services. From the port of Rotterdam, 40% of the river
Rhine volume transported by barges corresponds to German inland waterways
transport within distances around 900 km and 35% within distances around 180 km.
The remaining volume corresponds to Dutch national traffic within the range of 50
km and 250 km.
Figure 22: Port of Rotterdam’s Modal Split 2001 to 2008
Source: Port of Rotterdam
6.2. The tank container
Large quantities of orange juice can be transported by 20 foot tank containers which
are mobile aseptic tanks up to 24,000 liters or 31 tons of varying designs. Some are
built inside a freight container and transported as such and others are designed to
take the form of a self-contained tank sized to fit into tracks, ships and trains.
Aseptic tank containers can also be used for in-site storage of juice product before it
is shipped. They provide better economy of scale for handling aseptic NFC if
compared with drums but sterilization costs are incurred and care must be taken
with the sterilization process to avoid product damage. The loss of temperature on
an insulated tank container is within the range of 0.2 to 0.5ºC per day. In the
Appendix 7 it is presented the technical specifications of the IMO type T11 frame
tank container and the Appendix 8 shows pictures of a frame tank container. There
are no differences in loading and unloading tank containers if compared to tanker
0
10
20
30
40
50
60
70
2001 2002 2003 2004 2005 2006 2007 2008
Road
Barge
Rail
Modal Split in Container Hinterland Transport
PoR%
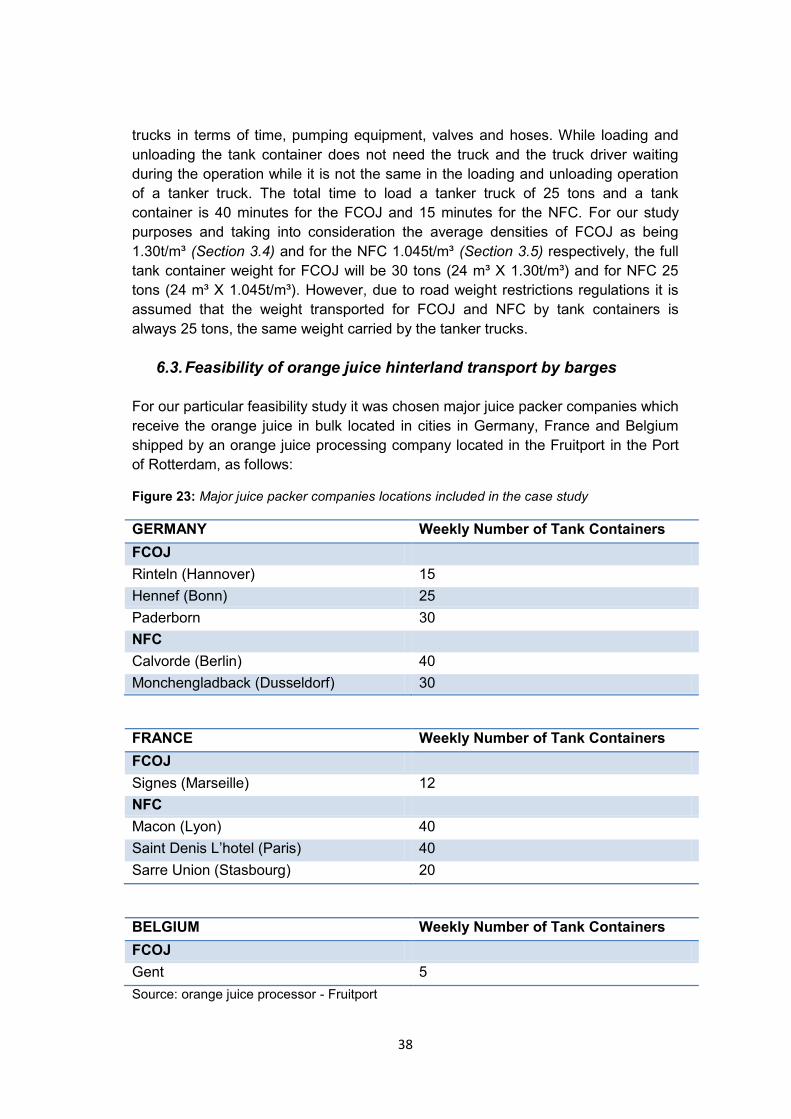
38
trucks in terms of time, pumping equipment, valves and hoses. While loading and
unloading the tank container does not need the truck and the truck driver waiting
during the operation while it is not the same in the loading and unloading operation
of a tanker truck. The total time to load a tanker truck of 25 tons and a tank
container is 40 minutes for the FCOJ and 15 minutes for the NFC. For our study
purposes and taking into consideration the average densities of FCOJ as being
1.30t/m³ (Section 3.4) and for the NFC 1.045t/m³ (Section 3.5) respectively, the full
tank container weight for FCOJ will be 30 tons (24 m³ X 1.30t/m³) and for NFC 25
tons (24 m³ X 1.045t/m³). However, due to road weight restrictions regulations it is
assumed that the weight transported for FCOJ and NFC by tank containers is
always 25 tons, the same weight carried by the tanker trucks.
6.3. Feasibility of orange juice hinterland transport by barges
For our particular feasibility study it was chosen major juice packer companies which
receive the orange juice in bulk located in cities in Germany, France and Belgium
shipped by an orange juice processing company located in the Fruitport in the Port
of Rotterdam, as follows:
Figure 23: Major juice packer companies locations included in the case study
GERMANY Weekly Number of Tank Containers
FCOJ
Rinteln (Hannover) 15
Hennef (Bonn) 25
Paderborn 30
NFC
Calvorde (Berlin) 40
Monchengladback (Dusseldorf) 30
FRANCE Weekly Number of Tank Containers
FCOJ
Signes (Marseille) 12
NFC
Macon (Lyon) 40
Saint Denis L‟hotel (Paris) 40
Sarre Union (Stasbourg) 20
BELGIUM Weekly Number of Tank Containers
FCOJ
Gent 5
Source: orange juice processor - Fruitport
39
Due to the lack of inland waterway services for Paderborn, the nearest big city is
Dortmund 140 km away, barge transport for this German juice packer company was
deemed not feasible. In the same way, the lack of good waterways in the north of
France due to the bottle-neck located between Compiègne and the Dunkirk–Scheldt
canal, discussed in Section 5.7, which restricts navigability to vessels of 400 up to
750 tons making the barge transport costs too high per tank container unit, barge
transport to the city of Saint Denis de L„hotel nearby Paris was also deemed not
feasible, tanker truck mode is more suitable. Still in France, the juice packer
company located in the city of Macon, nearby Lion is better reached by train but as
NFC will be transported refrigeration is needed thus tanker trucks with reefer must
be used as trains do not have reefer systems. The juice packer company located in
Signes, also in France, nearby Marseille is better reached by train or short-sea
shipping, as FCOJ will be transported, train without reefer system could be a
transport mode possibility but as this modal is not that reliable and the distance is
big, around 1,200 km, short-sea shipping transport mode is the best possibility. Thus
orange juice transport by barge was also deemed not feasible for these two French
juice packers located in the cities of Macon and Signes.
Concerning barge transport to the German juice packer companies located in the
cities of Rinteln, Hennef, Calvorde and Monchengladback, the juice packer company
located in Sarre Union, France and the juice packer company located in Gent,
Belgium, the inland waterway transport mode by barges using container tanks was
deemed feasible. Taking into consideration the route to the city of Rinteln, due to a
lock restriction, only class IV of inland vessels can be used whereas for the
remaining destination routes, up to class VI of inland vessels can be used.
The inland waterway routes front the Fruitport in the Port of Rotterdam to the cities
where the above mentioned juice packer companies are located are described
below:
Juice packer companies located in Germany in the cities of:
Rinteln: river Rheine and Mittellandkanal (Appendix 9)
Hennef: river Rheine (Appendix 10)
Calvorde: river Rheine and Mittellandkanal (Appendix 11)
Monchengladback: river Rheine (Appendix 12)
Juice packer company located in France in the city of:
Sarre Union: river Rheine (Appendix 13)
Juice packer company located in Belgium in the city of:
Gent: Dutch Province of Zeeland inland waterway routes (Appendix 14)
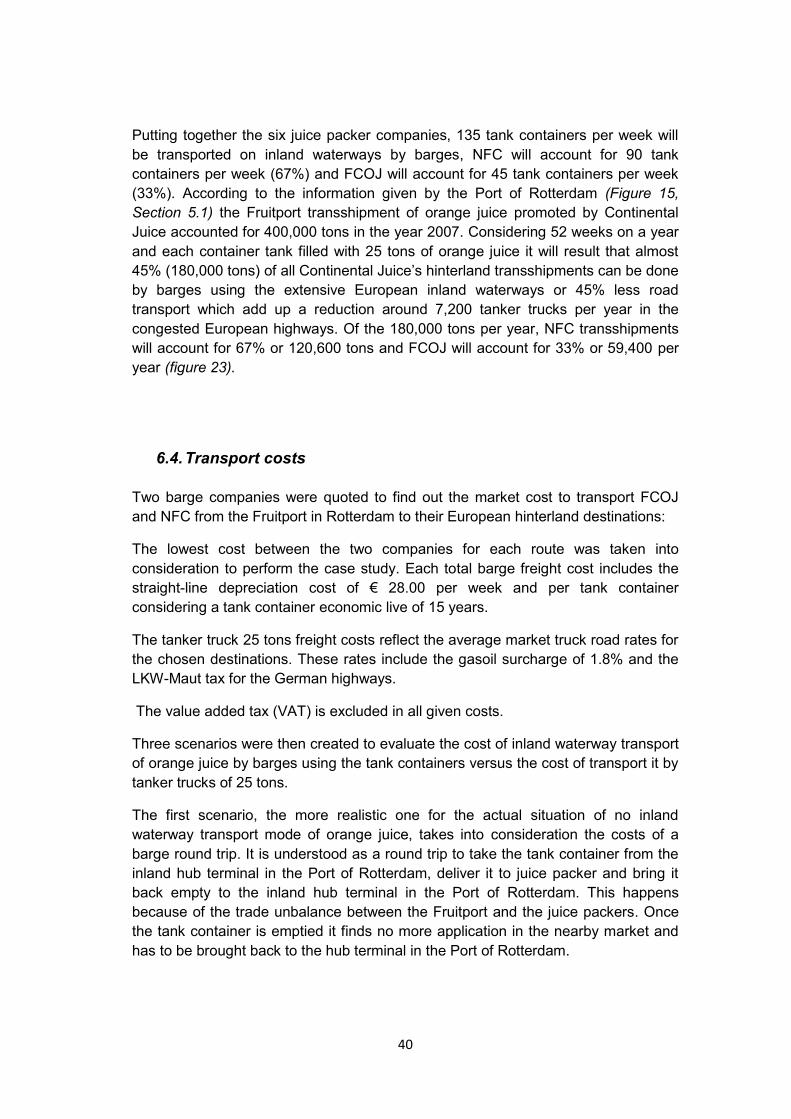
40
Putting together the six juice packer companies, 135 tank containers per week will
be transported on inland waterways by barges, NFC will account for 90 tank
containers per week (67%) and FCOJ will account for 45 tank containers per week
(33%). According to the information given by the Port of Rotterdam (Figure 15,
Section 5.1) the Fruitport transshipment of orange juice promoted by Continental
Juice accounted for 400,000 tons in the year 2007. Considering 52 weeks on a year
and each container tank filled with 25 tons of orange juice it will result that almost
45% (180,000 tons) of all Continental Juice‟s hinterland transshipments can be done
by barges using the extensive European inland waterways or 45% less road
transport which add up a reduction around 7,200 tanker trucks per year in the
congested European highways. Of the 180,000 tons per year, NFC transshipments
will account for 67% or 120,600 tons and FCOJ will account for 33% or 59,400 per
year (figure 23).
6.4. Transport costs
Two barge companies were quoted to find out the market cost to transport FCOJ
and NFC from the Fruitport in Rotterdam to their European hinterland destinations:
The lowest cost between the two companies for each route was taken into
consideration to perform the case study. Each total barge freight cost includes the
straight-line depreciation cost of € 28.00 per week and per tank container
considering a tank container economic live of 15 years.
The tanker truck 25 tons freight costs reflect the average market truck road rates for
the chosen destinations. These rates include the gasoil surcharge of 1.8% and the
LKW-Maut tax for the German highways.
The value added tax (VAT) is excluded in all given costs.
Three scenarios were then created to evaluate the cost of inland waterway transport
of orange juice by barges using the tank containers versus the cost of transport it by
tanker trucks of 25 tons.
The first scenario, the more realistic one for the actual situation of no inland
waterway transport mode of orange juice, takes into consideration the costs of a
barge round trip. It is understood as a round trip to take the tank container from the
inland hub terminal in the Port of Rotterdam, deliver it to juice packer and bring it
back empty to the inland hub terminal in the Port of Rotterdam. This happens
because of the trade unbalance between the Fruitport and the juice packers. Once
the tank container is emptied it finds no more application in the nearby market and
has to be brought back to the hub terminal in the Port of Rotterdam.

41
The second scenario simulates a future situation where the market of orange juice
transport by tank containers via inland waterways is consolidated, the barge service
is charged only for the single trip and as in the case of road transport the empty tank
container is used for further transport from its last destination, the trade imbalance is
eliminated.
The third scenario, is the expected future situation, where the transport market of
orange juice in tank containers by barges from the Fruitport is already consolidated
and the volume handled is large enough to justify a container terminal in the
Fruitport sheared by all companies located there or stimulates the barge companies
to create a regular service to inland waterway transport mode of orange juice from
the Fruitport to the European hinterland deploying crane barges (Appendix 15).
The table below shows for comparison the barge transport times (given by the barge
companies), the truck transport times (average speed of 70 km/h) and the road
distances for the chosen destinations:
Figure 24: Transport times and road distances for the chosen destinations
Destination Transport Time
barges (days)
Transport Time
trucks (hours)
Road Distance
(km)
Rinteln 4 5:10 358
Calvorde 5 7:40 534
Hennef 2 4;20 305
Monchengladback 2 3:00 211
Sarre Union 5 7:10 501
Gent 1 2:20 162
Source: The author
The barge transport times include slack times at the inland terminals. It is worth
noting that for some destinations the total time given by barge operating companies
varies a little from the ones given by the software PC Navigo (Appendices 9 to 14).
As all hinterland transport of orange juice is done by tanker trucks, the Fruitport
does not have container handling facilities. Therefore, the first two scenarios
described above carry on the € 195.00 per tank container of additional cost due to
the transport from the Fruitport by crane barge or container truck to the barge inland
hub terminal (€110.00 per tank container) and handling at the barge hub terminal
(€85.00 per 2 moves), as described in the figure below:
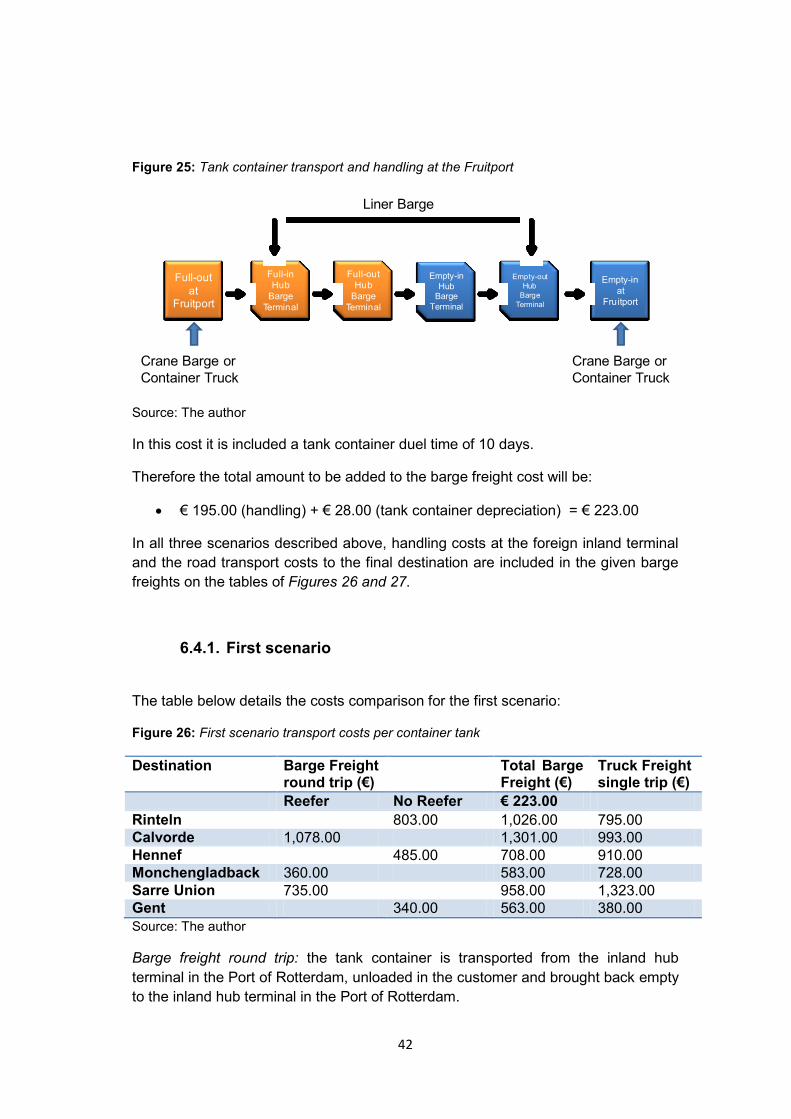
42
Figure 25: Tank container transport and handling at the Fruitport
Source: The author
In this cost it is included a tank container duel time of 10 days.
Therefore the total amount to be added to the barge freight cost will be:
€ 195.00 (handling) + € 28.00 (tank container depreciation) = € 223.00
In all three scenarios described above, handling costs at the foreign inland terminal
and the road transport costs to the final destination are included in the given barge
freights on the tables of Figures 26 and 27.
6.4.1. First scenario
The table below details the costs comparison for the first scenario:
Figure 26: First scenario transport costs per container tank
Destination Barge Freight round trip (€)
Total Barge Freight (€)
Truck Freight single trip (€)
Reefer No Reefer € 223.00
Rinteln 803.00 1,026.00 795.00
Calvorde 1,078.00 1,301.00 993.00
Hennef 485.00 708.00 910.00
Monchengladback 360.00 583.00 728.00
Sarre Union 735.00 958.00 1,323.00
Gent 340.00 563.00 380.00
Source: The author
Barge freight round trip: the tank container is transported from the inland hub
terminal in the Port of Rotterdam, unloaded in the customer and brought back empty
to the inland hub terminal in the Port of Rotterdam.
Full-out
at Fruitport
Empty-in
at
Fruitport
Full-in
Hub
Barge
Terminal
Full-out
Hub
Barge
Terminal
Empty-in
Hub Barge
Terminal
Empty-out
Hub
Barge
Terminal
Liner Barge
Crane Barge or
Container Truck
Crane Barge or
Container Truck

43
Total barge freight cost: tank container handling costs and transport cost from the
fruit terminal to the hub inland terminal in the Port of Rotterdam.
6.4.2. Second scenario
The table below details the costs comparison for the second scenario:
Figure 27: Second scenario transport costs per container tank
Destination Barge Freight single trip (€)
Total Barge Freight (€)
Truck Freight single trip (€)
Reefer No Reefer € 223.00
Rinteln 490.00 713.00 795.00
Calvorde 705.00 928.00 993.00
Hennef 320.00 543.00 910.00
Monchengladback 260.00 483.00 728.00
Sarre Union 573.00 796.00 1,323.00
Gent 270.00 493.00 380.00
Source: The author
In the second scenario it is considered just the barges single trip, the tank container
trade imbalance is eliminated and it finds other applications in the market nearby.
Total barge freight cost: tank container handling costs and transport cost from the
fruit terminal to the hub inland terminal in the Port of Rotterdam.
6.4.3. Third scenario
The table below details the costs comparison for the third scenario:
Figure 28: Third scenario transport costs per container tank
Destination Barge Freight single trip (€)
Truck Freight single trip (€)
Cost Savings %
Reefer No Reefer
Rinteln 518.00 795.00 35
Calvorde 733.00 993.00 26
Hennef 348.00 910.00 62
Monchengladback 288.00 728.00 60
Sarre Union 601.00 1,323.00 55
Gent 298.00 380.00 22
Source: The author
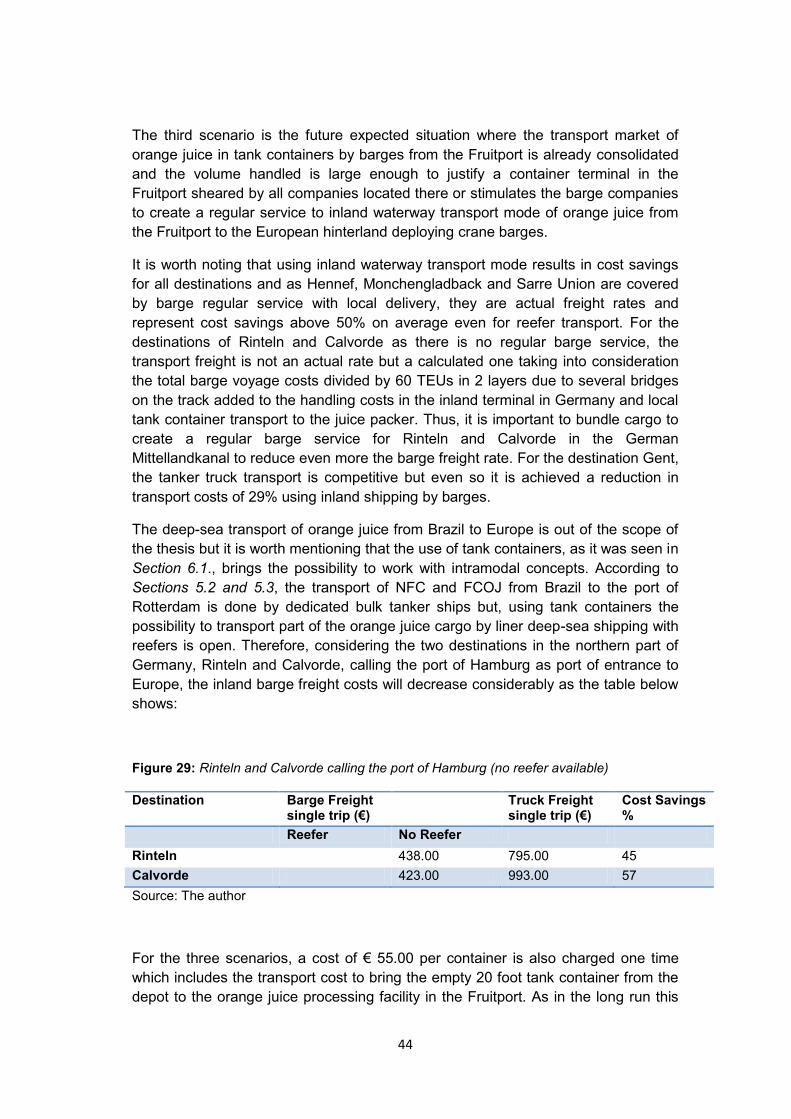
44
The third scenario is the future expected situation where the transport market of
orange juice in tank containers by barges from the Fruitport is already consolidated
and the volume handled is large enough to justify a container terminal in the
Fruitport sheared by all companies located there or stimulates the barge companies
to create a regular service to inland waterway transport mode of orange juice from
the Fruitport to the European hinterland deploying crane barges.
It is worth noting that using inland waterway transport mode results in cost savings
for all destinations and as Hennef, Monchengladback and Sarre Union are covered
by barge regular service with local delivery, they are actual freight rates and
represent cost savings above 50% on average even for reefer transport. For the
destinations of Rinteln and Calvorde as there is no regular barge service, the
transport freight is not an actual rate but a calculated one taking into consideration
the total barge voyage costs divided by 60 TEUs in 2 layers due to several bridges
on the track added to the handling costs in the inland terminal in Germany and local
tank container transport to the juice packer. Thus, it is important to bundle cargo to
create a regular barge service for Rinteln and Calvorde in the German
Mittellandkanal to reduce even more the barge freight rate. For the destination Gent,
the tanker truck transport is competitive but even so it is achieved a reduction in
transport costs of 29% using inland shipping by barges.
The deep-sea transport of orange juice from Brazil to Europe is out of the scope of
the thesis but it is worth mentioning that the use of tank containers, as it was seen in
Section 6.1., brings the possibility to work with intramodal concepts. According to
Sections 5.2 and 5.3, the transport of NFC and FCOJ from Brazil to the port of
Rotterdam is done by dedicated bulk tanker ships but, using tank containers the
possibility to transport part of the orange juice cargo by liner deep-sea shipping with
reefers is open. Therefore, considering the two destinations in the northern part of
Germany, Rinteln and Calvorde, calling the port of Hamburg as port of entrance to
Europe, the inland barge freight costs will decrease considerably as the table below
shows:
Figure 29: Rinteln and Calvorde calling the port of Hamburg (no reefer available)
Destination Barge Freight single trip (€)
Truck Freight single trip (€)
Cost Savings %
Reefer No Reefer
Rinteln 438.00 795.00 45
Calvorde 423.00 993.00 57
Source: The author
For the three scenarios, a cost of € 55.00 per container is also charged one time
which includes the transport cost to bring the empty 20 foot tank container from the
depot to the orange juice processing facility in the Fruitport. As in the long run this
45
onetime cost will not influence our conclusions it is not considered in the calculation.
The cost of aseptic cleaning the tank container is not considered as well since the
cost of cleaning the tank of a tanker truck is similar to that of a tank container, thus it
will not affect the case study conclusions.
6.5. Floating stocks
By definition, floating stocks is the use of intermodal transport in order to deliver
goods to the supply chain before customers demand (Dekker et al, 2006). The
orange juice total transport time deploying barges is higher if compared to the total
transport time of tanker trucks for the same destination (Figure 24). This higher
transport time can be transformed in advantage for the inland waterway transport
mode if the concept of floating stocks is used in practice. On each harvest season,
after the signature of the supplying contracts, orange juice processing companies
store in batches the orange juice to be delivered to their clients in huge aseptic
tanks located in their terminals in the Fruitport (Section 4.2). Applying the floating
stocks concept, the orange juice processing companies can deliver by barges the
contracted weekly product volumes to the nearest customers‟ inland terminals.
Doing so inventory‟s occupancy cost, space costs of having orange juice stored in
big stainless steel tanks will be reduced, more space to tank storage will be
available to supply new customers without the need to invest in new storage
capacity. On the other hand, the juice packers will also benefit since the product will
be located in the nearby inland terminals for immediately deliver upon demand
avoiding the long hours of tanker truck transport from the terminals in the Fruitport.
More storage from the Fruitport to inland terminals will promote a reduction in the
order reaction times. Also, possibilities of pooling orange juice distribution arise if
near the inland terminal exists a cluster of juice packers. The implementation of
floating stocks will act on decreasing static inventories in favor of transit inventories
(pipeline inventories) decreasing storage costs since it benefits from the free of
charge storage conditions in the inland terminals (three days – no reefer) it will be
seen increasing holding costs but they are lower than the storage costs.
Tank container NFC holding cost:
Retail price: € 2.98 / l
VAT 6% = € 0.18
Assumption: total profit margin = 50%
Production cost: (€ 2.98 - € 0.18) X 0.5 = € 1.40 / l
NFC volume:
25,000 kg / 1.045 (t/m³) = 23,923 l
23,923 l X € 1.40 = € 33,492.00
Assumption: holding cost = 20% per year
Holding cost:
€ 33,492 X 0.05% = € 16.75 / tank container / day
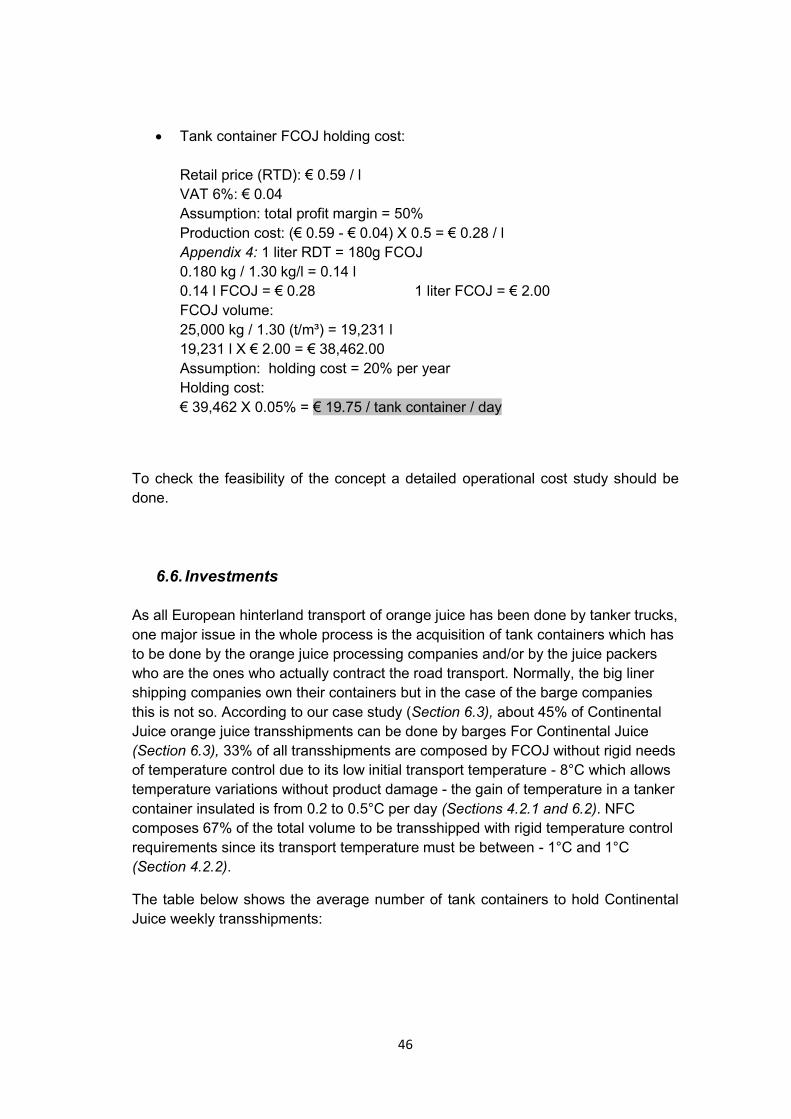
46
Tank container FCOJ holding cost:
Retail price (RTD): € 0.59 / l
VAT 6%: € 0.04
Assumption: total profit margin = 50%
Production cost: (€ 0.59 - € 0.04) X 0.5 = € 0.28 / l
Appendix 4: 1 liter RDT = 180g FCOJ
0.180 kg / 1.30 kg/l = 0.14 l
0.14 l FCOJ = € 0.28 1 liter FCOJ = € 2.00
FCOJ volume:
25,000 kg / 1.30 (t/m³) = 19,231 l
19,231 l X € 2.00 = € 38,462.00
Assumption: holding cost = 20% per year
Holding cost:
€ 39,462 X 0.05% = € 19.75 / tank container / day
To check the feasibility of the concept a detailed operational cost study should be
done.
6.6. Investments
As all European hinterland transport of orange juice has been done by tanker trucks,
one major issue in the whole process is the acquisition of tank containers which has
to be done by the orange juice processing companies and/or by the juice packers
who are the ones who actually contract the road transport. Normally, the big liner
shipping companies own their containers but in the case of the barge companies
this is not so. According to our case study (Section 6.3), about 45% of Continental
Juice orange juice transshipments can be done by barges For Continental Juice
(Section 6.3), 33% of all transshipments are composed by FCOJ without rigid needs
of temperature control due to its low initial transport temperature - 8°C which allows
temperature variations without product damage - the gain of temperature in a tanker
container insulated is from 0.2 to 0.5°C per day (Sections 4.2.1 and 6.2). NFC
composes 67% of the total volume to be transshipped with rigid temperature control
requirements since its transport temperature must be between - 1°C and 1°C
(Section 4.2.2).
The table below shows the average number of tank containers to hold Continental
Juice weekly transshipments:
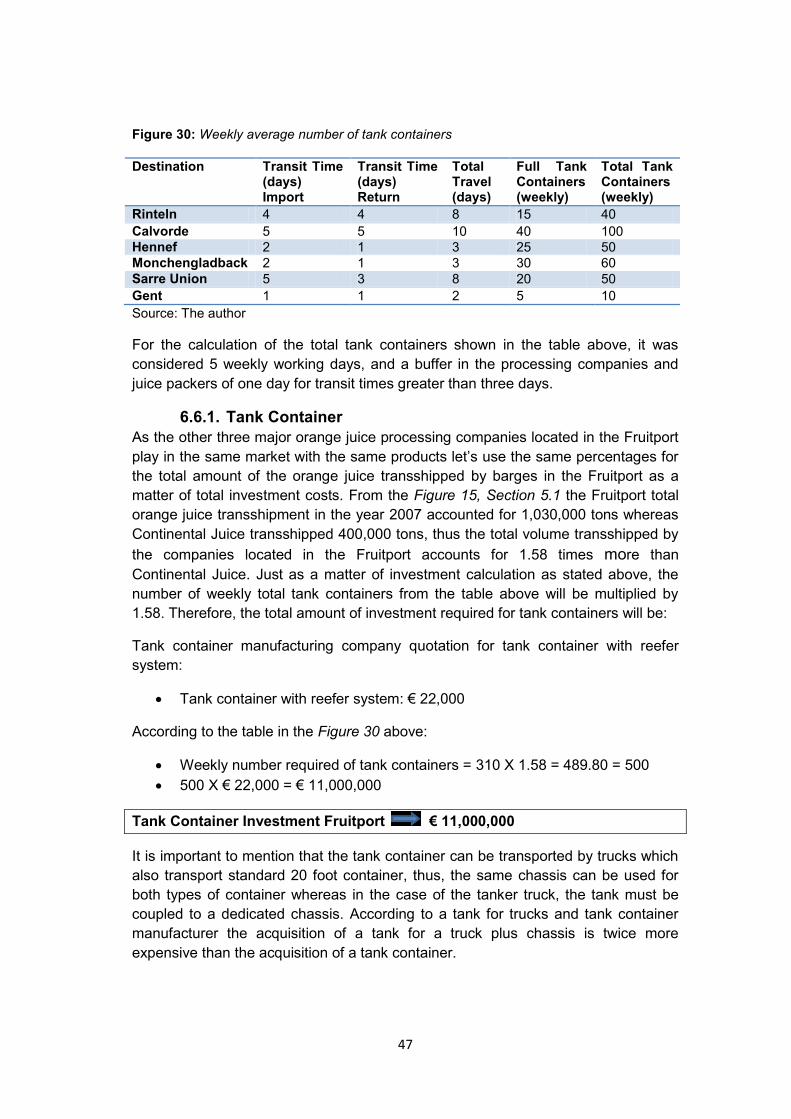
47
Figure 30: Weekly average number of tank containers
Destination Transit Time (days) Import
Transit Time (days) Return
Total Travel (days)
Full Tank Containers (weekly)
Total Tank Containers (weekly)
Rinteln 4 4 8 15 40
Calvorde 5 5 10 40 100
Hennef 2 1 3 25 50
Monchengladback 2 1 3 30 60
Sarre Union 5 3 8 20 50
Gent 1 1 2 5 10
Source: The author
For the calculation of the total tank containers shown in the table above, it was
considered 5 weekly working days, and a buffer in the processing companies and
juice packers of one day for transit times greater than three days.
6.6.1. Tank Container
As the other three major orange juice processing companies located in the Fruitport
play in the same market with the same products let‟s use the same percentages for
the total amount of the orange juice transshipped by barges in the Fruitport as a
matter of total investment costs. From the Figure 15, Section 5.1 the Fruitport total
orange juice transshipment in the year 2007 accounted for 1,030,000 tons whereas
Continental Juice transshipped 400,000 tons, thus the total volume transshipped by
the companies located in the Fruitport accounts for 1.58 times more than
Continental Juice. Just as a matter of investment calculation as stated above, the
number of weekly total tank containers from the table above will be multiplied by
1.58. Therefore, the total amount of investment required for tank containers will be:
Tank container manufacturing company quotation for tank container with reefer
system:
Tank container with reefer system: € 22,000
According to the table in the Figure 30 above:
Weekly number required of tank containers = 310 X 1.58 = 489.80 = 500
500 X € 22,000 = € 11,000,000
Tank Container Investment Fruitport € 11,000,000
It is important to mention that the tank container can be transported by trucks which
also transport standard 20 foot container, thus, the same chassis can be used for
both types of container whereas in the case of the tanker truck, the tank must be
coupled to a dedicated chassis. According to a tank for trucks and tank container
manufacturer the acquisition of a tank for a truck plus chassis is twice more
expensive than the acquisition of a tank container.
48
6.6.2. Tank Container Leasing
Leasing, an option to be considered for the short term and initial phase of the
project, will bring the following costs according to quotation done by a tank container
manufacturing company:
Leasing short term (up to 3 years) – daily rental € 11.00
Leasing long term (3 years plus) – daily rental € 9.00
Considering short term leasing and according the numbers given in the text above:
500 tank containers X € 11.00 X 360 days X 3 years = € 5,940,000
The following onetime cost also incurs:
Accreditation Body Surveys - € 50.00 per tank container
500 X € 50.00 X 2 (initial and final surveys) = € 50,000
Payment for damages (end of contract leasing) - € 1,000 per container
500 X € 1,000 = € 500,000
Total short term leasing cost = € 5,940,000 + € 50,000 + € 500,000 = € 6,490,000
Short Term Leasing Cost (3 years) € 6,500,000 / year
6.6.3. Crane Barge
In the third scenario where the transport market of orange juice in tank containers by
barges from the Fruitport is already consolidated and the volume handled is large
enough to justify and to stimulate the barge companies to create a regular service to
transport orange juice from the Fruitport to the European hinterland, investment in
crane barges (Appendix 15) will be necessary if the decision is not to construct a
container terminal to be shared by all companies located in the Fruitport. Estimated
investment:
Crane Barge: € 4,000,000
6.6.4. Mobile Quay Crane
According to information from a terminal operator company, one mobile quay crane
for the Fruitport to be shared by all companies located there would be enough at
investment a cost of:
Mobile Quay Crane: 40 tons € 2,000,000
Handling equipments are not considered in this case study since container terminal
design is out of the scope of this thesis.

49
6.7. Investment appraisal
In this section the net present value (NPV) and the internal rate of return (IRR) are
calculated to the related investments in the orange juice inland transport
destinations deemed feasible in this case study and their proposed three scenarios
discussed in the Section 6.4. In this appraisal it is considered the investment that
needs to be done in the acquisition of tank containers for each destination.
Investments in crane barges and/or in mobile quay cranes are not considered due to
the fact that further studies must be done concerning issues like the relocation of the
Fruitport and possibilities of cargo bundling among juice processor and fruit traders.
Parameters for the NPV and IRR calculation:
Discount rate: 5% (industry market average)
Period: 5 years
Cash flow: difference between the tanker truck freight cost and the barge
freight cost per year along the period of 5 years
Container tank investment: € 22,000 per container
The Figures 31 and 32 show the NPV and IRR related to investments in tank
container for each feasible destination and scenario:
Investments in tank containers to the destinations Hennef, Monchengladback and
Sarre Union presented positive NPV in the three scenarios while Gent presented
negative NPV in all of them even in the third scenario where the barge freight cost is
lower than the tanker truck freight cost showing that investment in tank containers
with only 22% reduction in freight costs is not economically feasible. The calculation
of NPV and IRR is important because from the investment appraisal became clear
that the most cost effective destination is Sarre Union in France. Therefore, a pilot
project to deliver orange juice by barges to the juice packer located on this
destination is suggested.
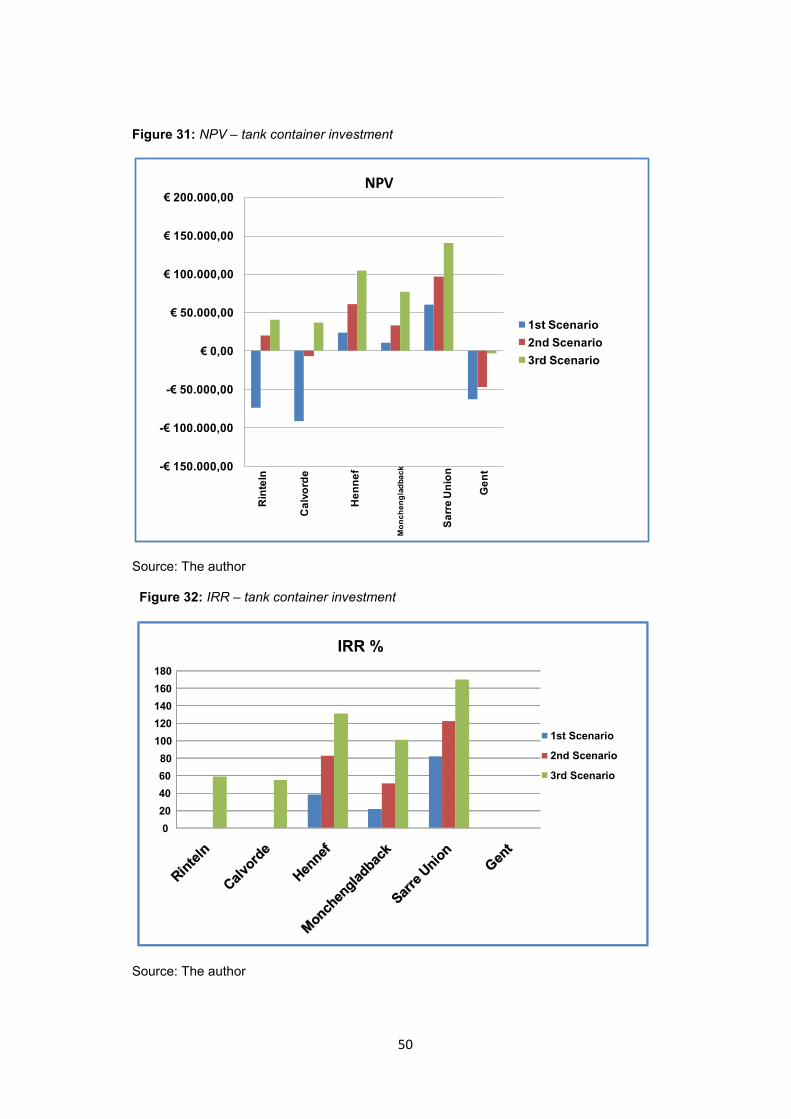
50
Figure 31: NPV – tank container investment
Source: The author
Figure 32: IRR – tank container investment
Source: The author
-€ 150.000,00
-€ 100.000,00
-€ 50.000,00
€ 0,00
€ 50.000,00
€ 100.000,00
€ 150.000,00
€ 200.000,00NPV
1st Scenario
2nd Scenario
3rd Scenario
Rin
teln
Ca
lvo
rde
He
nn
ef
Mo
nc
he
ng
lad
ba
ck
Sa
rre
Un
ion
Ge
nt
0 20 40 60 80
100 120 140 160 180
IRR %
1st Scenario
2nd Scenario
3rd Scenario

51
6.8. Environmental issues
Due to its scale, waterborne transport consumes relatively little propelling energy by
ton-kilometer which results in lower exhaust emissions, when compared to trucks
and trains. Furthermore, inland shipping is safer if compared to truck transport and
according to the Dutch Agency of Inland Shipping (BVB) the number of ships must
more than double in order to create some sort of water congestion. Roads and
railways are expensive to be built and maintain whereas most of the waterways
were created by nature and requires less investments and lower maintenance costs.
Inland shipping therefore creates less external costs for the society, environmental
pollution; noise and congestion are minimal with this transport mode.
According to the U.S Department of Transportation Report on Environmental
Advantages of Inland Barge Transportation (August 1994), inland shipping
transportation is the most fuel efficient mode of transport for moving cargo and the
least energy intensive method of freight transportation when moving equivalent
amounts of cargo. On average, water carriers consume 500 BTUs of energy per ton-
mile whereas trains consume 750 BTUs and trucks 2,400 BTUs. In terms of
capacity, a 1,500 ton barge carries as much as sixty 25 ton trucks. A standard barge
is 90 m long and the sixty trucks one after the other would be about 900 m long.
Figure 33: Ton-miles carried per liter of fuel by transport modal
Source: U.S Department of Transportation Report on Environmental Advantages of Inland
Barge Transportation
The barge transport will also bring environmental benefits for the Port of Rotterdam
area, following the objectives of the Rotterdam Climate Initiative since using barges
will decrease in 45% the number of tanker trucks transporting orange juice. These
benefits can be enumerated as less fossil fuel burning per unit of cargo and
consequently less exhaust emissions of green-house gases, less road accidents
Truck
Train
Barge
15
55
135
Ton-miles / liter of fuel
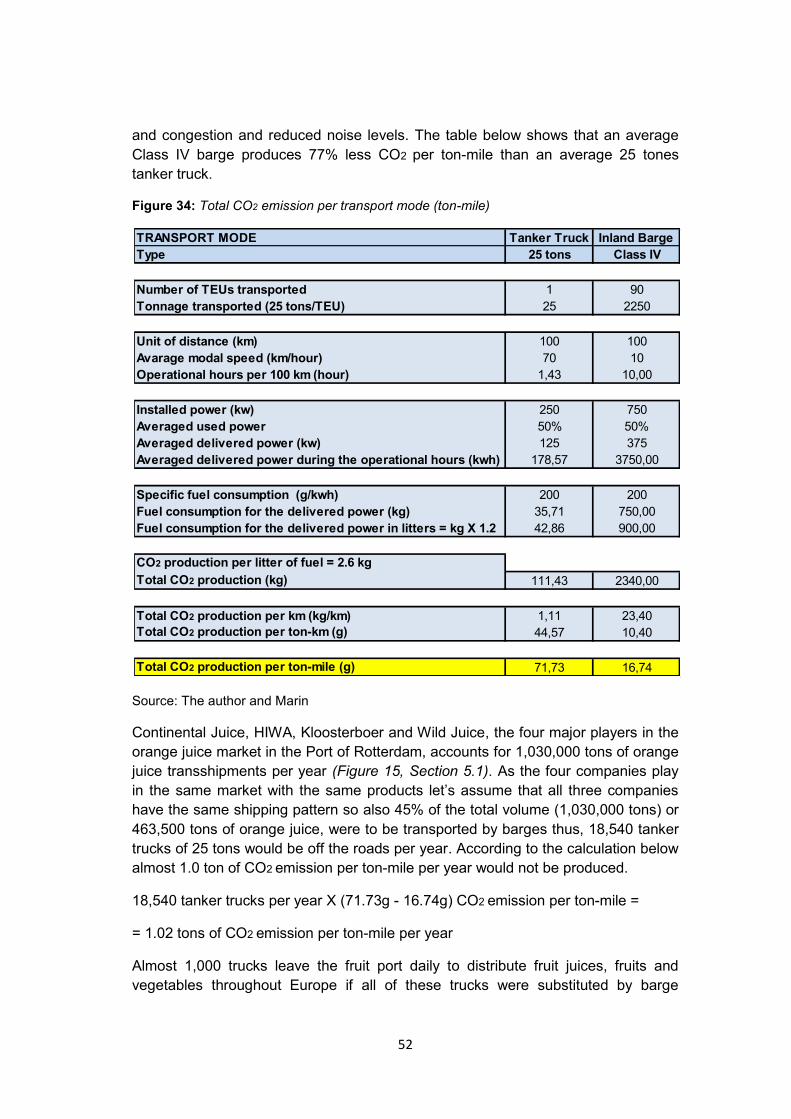
52
and congestion and reduced noise levels. The table below shows that an average
Class IV barge produces 77% less CO2 per ton-mile than an average 25 tones
tanker truck.
Figure 34: Total CO2 emission per transport mode (ton-mile)
Source: The author and Marin
Continental Juice, HIWA, Kloosterboer and Wild Juice, the four major players in the
orange juice market in the Port of Rotterdam, accounts for 1,030,000 tons of orange
juice transshipments per year (Figure 15, Section 5.1). As the four companies play
in the same market with the same products let‟s assume that all three companies
have the same shipping pattern so also 45% of the total volume (1,030,000 tons) or
463,500 tons of orange juice, were to be transported by barges thus, 18,540 tanker
trucks of 25 tons would be off the roads per year. According to the calculation below
almost 1.0 ton of CO2 emission per ton-mile per year would not be produced.
18,540 tanker trucks per year X (71.73g - 16.74g) CO2 emission per ton-mile =
= 1.02 tons of CO2 emission per ton-mile per year
Almost 1,000 trucks leave the fruit port daily to distribute fruit juices, fruits and
vegetables throughout Europe if all of these trucks were substituted by barge
TRANSPORT MODE Tanker Truck Inland Barge
Type 25 tons Class IV
Number of TEUs transported 1 90
Tonnage transported (25 tons/TEU) 25 2250
Unit of distance (km) 100 100
Avarage modal speed (km/hour) 70 10
Operational hours per 100 km (hour) 1,43 10,00
Installed power (kw) 250 750
Averaged used power 50% 50%
Averaged delivered power (kw) 125 375
Averaged delivered power during the operational hours (kwh) 178,57 3750,00
Specific fuel consumption (g/kwh) 200 200
Fuel consumption for the delivered power (kg) 35,71 750,00
Fuel consumption for the delivered power in litters = kg X 1.2 42,86 900,00
CO2 production per litter of fuel = 2.6 kg
Total CO2 production (kg) 111,43 2340,00
Total CO2 production per km (kg/km) 1,11 23,40
Total CO2 production per ton-km (g) 44,57 10,40
Total CO2 production per ton-mile (g) 71,73 16,74
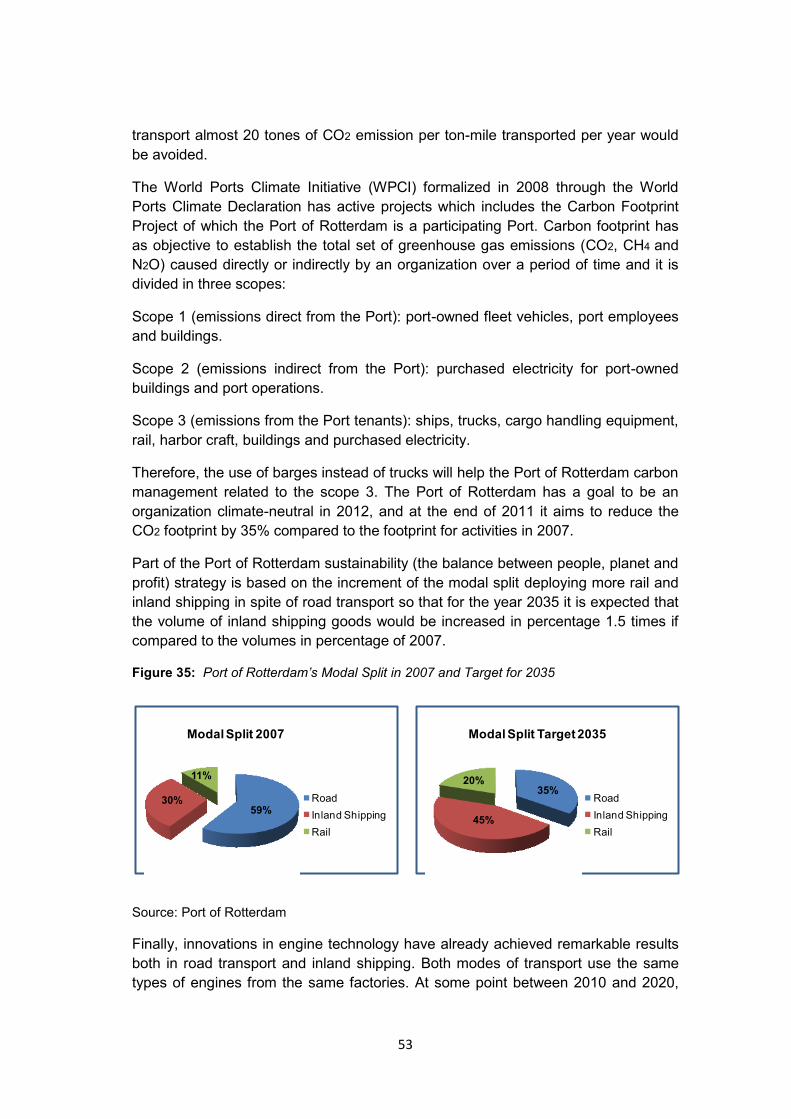
53
transport almost 20 tones of CO2 emission per ton-mile transported per year would
be avoided.
The World Ports Climate Initiative (WPCI) formalized in 2008 through the World
Ports Climate Declaration has active projects which includes the Carbon Footprint
Project of which the Port of Rotterdam is a participating Port. Carbon footprint has
as objective to establish the total set of greenhouse gas emissions (CO2, CH4 and
N2O) caused directly or indirectly by an organization over a period of time and it is
divided in three scopes:
Scope 1 (emissions direct from the Port): port-owned fleet vehicles, port employees
and buildings.
Scope 2 (emissions indirect from the Port): purchased electricity for port-owned
buildings and port operations.
Scope 3 (emissions from the Port tenants): ships, trucks, cargo handling equipment,
rail, harbor craft, buildings and purchased electricity.
Therefore, the use of barges instead of trucks will help the Port of Rotterdam carbon
management related to the scope 3. The Port of Rotterdam has a goal to be an
organization climate-neutral in 2012, and at the end of 2011 it aims to reduce the
CO2 footprint by 35% compared to the footprint for activities in 2007.
Part of the Port of Rotterdam sustainability (the balance between people, planet and
profit) strategy is based on the increment of the modal split deploying more rail and
inland shipping in spite of road transport so that for the year 2035 it is expected that
the volume of inland shipping goods would be increased in percentage 1.5 times if
compared to the volumes in percentage of 2007.
Figure 35: Port of Rotterdam’s Modal Split in 2007 and Target for 2035
Source: Port of Rotterdam
Finally, innovations in engine technology have already achieved remarkable results
both in road transport and inland shipping. Both modes of transport use the same
types of engines from the same factories. At some point between 2010 and 2020,
Modal Split 2007
Road
Inland Shipping
Rail
30%59%
11%
Modal Split Target 2035
Road
Inland Shipping
Rail45%
35%20%
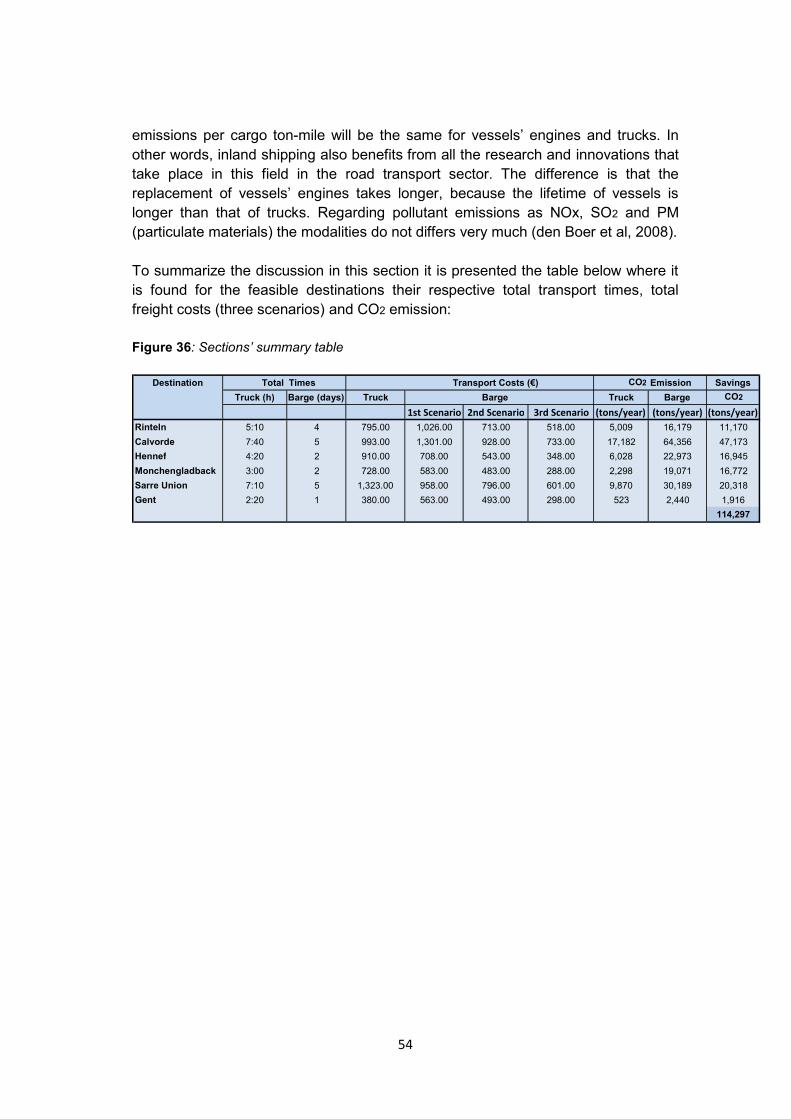
54
emissions per cargo ton-mile will be the same for vessels‟ engines and trucks. In
other words, inland shipping also benefits from all the research and innovations that
take place in this field in the road transport sector. The difference is that the
replacement of vessels‟ engines takes longer, because the lifetime of vessels is
longer than that of trucks. Regarding pollutant emissions as NOx, SO2 and PM
(particulate materials) the modalities do not differs very much (den Boer et al, 2008).
To summarize the discussion in this section it is presented the table below where it
is found for the feasible destinations their respective total transport times, total
freight costs (three scenarios) and CO2 emission:
Figure 36: Sections’ summary table
Destination Total Times Transport Costs (€) CO 2 Emission Savings Truck (h) Barge (days) Truck Barge Truck Barge CO 2
1st Scenario 2nd Scenario 3rd Scenario (tons/year) (tons/year) (tons/year) Rinteln 5:10 4 795.00 1,026.00 713.00 518.00 5,009 16,179 11,170 Calvorde 7:40 5 993.00 1,301.00 928.00 733.00 17,182 64,356 47,173 Hennef 4:20 2 910.00 708.00 543.00 348.00 6,028 22,973 16,945 Monchengladback 3:00 2 728.00 583.00 483.00 288.00 2,298 19,071 16,772 Sarre Union 7:10 5 1,323.00 958.00 796.00 601.00 9,870 30,189 20,318 Gent 2:20 1 380.00 563.00 493.00 298.00 523 2,440 1,916
114,297

55
7. Conclusions
Rotterdam is the main entry Port in Europe for orange juice, particularly shipped
from Brazil, the major export country. Primarily, the orange juice is shipped in bulk,
refrigerated and under protective atmosphere, by dedicated special tanker seagoing
vessels from the port of Santos, Brazil to the Port of Rotterdam‟s Fruitport, The
Netherlands, where the major orange juice processors terminals are located. The
European hinterland transport is done by tanker trucks and under this context the
Rotterdam‟s Port Authority and industry participants all agree that the sole use of
road transport will be unfeasible in the near future, the extensive Rotterdam‟s
intermodal network must be better explored by this industry segment and the use of
reefer tank containers will create greater possibilities of intermodal exploitation.
The extensive national and international European waterways network with good
navigation conditions enables to operate inland vessels from 90 up to 400 TEUs
capacity and it was not observed any lack of capacity regarding the western
European fleet of inland vessels. Due to continuous investments the western
European inland navigation fleet is considered the largest and the most modern in
the world. The fleet tonnage is in excess of 14 million tons and together with the
reserve capacity of the western European waterways for the inland shipping there is
no fleet or inland waterways constraints, there is capacity available for a fleet
enlargement and increase of goods flow. The western European inland shipping
sector operates regular scheduled services to all inland terminals able to handle
reefer containers which create a network of scheduled liner services for reefer tank
container transport.
European hinterland transport of NFC and FCOJ by inland waterways using barges
is feasible. There is no quality restriction on using reefer tank container, no fleet and
waterways capacity constraints and the inland container terminals have no
restrictions to handle reefer tank containers. Inland waterway transport mode shows
to be cost competitive mostly in routes to Germany and France along the river
Rheine and in routes to Belgium along the waterways of the Dutch province of
Zeeland. Some barge companies have regular and local delivery services along the
river Rheine which turns the inland waterway transport mode very cost competitive if
compared to the long haulage road mode. Using tank container makes it possible to
use barges for the long leg of the transport and container trucks for the short leg or
delivery to the juice packers as are the cases of companies located in
Monchengladback, distant 30 km from the inland port of Dusseldorf, Hennef, distant
20 km from the inland port of Bonn, in Germany and the juice packer located in
Sarre Union, France, distant 90 km from the inland port of Kehl (Strasbourg area).
Orange juice transport by barges to juice packers located in these destinations will
perceive a reduction on their orders reaction time through the use of floating stocks.
The northern part of France near Paris presents severe inland navigation problems,
inland vessels are restricted from 400 up to 750 tons which turns barge transport
more expensive than tanker truck transport to juice packer companies located in this
area. The European Union TEN-T 30 - Inland Waterway Seine-Scheldt - project
7. Conclusions
56
aims to improve the link between the rivers Seine and Scheldt which connects the
Paris region and the Seine basin with the entire Benelux inland waterways network,
the objective is to enlarge the canal to receive barges up to 4,400 tons, the project
will due in 2016.
Demand for NFC and FCOJ is correlated with respective welfare levels, for the
incoming years it is expected a stable growth in Western Europe and higher growth
in Eastern Europe. The economic expansion in East Europe as new member states
join the European Union, will shift the centre of economic growth in the coming
years towards the east and south with the expected economic growth of east and
south Germany, and of the new EU countries as Poland, Estonia, Latvia, Czech
Republic and Slovakia. This entails in the expansion of the Port of Rotterdam
hinterland capabilities and a better utilization of the European Union waterways. As
far as the south-eastern Europe is concerned, the European Union TEN-T 18 –
Rhine/Meuse – Main – Danube Inland Waterway – project aims to upgrade the
whole route of this major freight route which links the North Sea (Port of Rotterdam
– The Netherlands) to the Black Sea (Port of Constanta - Romania) maintaining the
minimum draft during the whole year at a minimum of 2.5 m to receive inland
vessels of 3,000 tons. This project is due in 2019.
It is important to mention the “Fresh Corridor”, project chaired by Mr. Jo van Nunen,
Professor in Logistics and Information Systems at the Erasmus University,
Rotterdam, supported by Dutch fruit trading companies, which aims to develop an
effective network of terminal and intermodal connections for the European transport
of fresh products in reefer containers from Rotterdam. In terms of intermodal
transport it primarily looks inland shipping, trains and short-sea shipping will be
addressed in a later phase. Barges with reefer connections are aimed to transport
reefer containers within the port and beyond. Deep-sea reefer containers at the
Maasvlakte terminals are shuttled from there to consolidation points for fruits and
vegetables further down the port, alleviating the congested A15 highway (Fast
Forward, Summer 2009, issue 45). By using tank containers, it will be promoted the
containerization of orange juice transport; it then could be transferred from one
transport mode to another without being re-handled and the benefits of intermodal
transport can be accrued. It will be possible to create a cost effective European
hinterland transport of orange juice using on a coordinated way different transport
modals to different final destinations.
In order to minimize the handling costs of the tank containers of the orange juice
processors located in the Fruitport, their products should be bundled with those of
the participants in the Fresh Corridor project. As far as it will be possible to bundle
as more cargo as possible, liner barges will come to the Fruitport and so increase
even further the reliability and frequency of the barge services which will reduce
costs and the amount of tank containers needed. As soon as the tank container is
on the barge, the juice packers will gain cargo visibility, their cargo can be traced,
therefore they can control the transport process again which means that the amount
of quality information decision makers have at their disposal will increase.
57
Tank containers handling at the Fruitport can be solved deploying a mobile quay
crane at a cost estimated of € 2,000,000 (land side handling equipment not
considered) or through the Rotterdam‟s Port Authorities planned relocation of the
Fruitport from the north bank of the port to the Waalhaven/Eenhaven area on the
south bank which has a strong concentration of container-related activities.
This research shows that the bottlenecks of the European hinterland transport of
orange juice by inland waterways using barges is the lack of regular barge services
in the Mittellandkanal in northern Germany, the Paris region due to its restrict
navigability conditions and the unavoidable capital expenditure regarding the
acquisition of tank containers which for the case in point for the total volume
transshipped by the orange juice processing companies located in the Fruitport
accounts for € 11,000,000 with the option of a three years leasing contract of €
6,500,000.
The hinterland transport by barges also brings environmental benefits. Almost 1,000
trucks leave the fruit port daily to distribute fruit juices, fruits and vegetables
throughout Europe if all of these trucks were substituted by barge transport almost
20 tones of CO2 emission per ton-mile transported per year would be avoided and
road congestion would be diminished. The European Union offers through its Marco
Polo project financial incentives for initiatives related to the reduction of road
congestion and these financial incentives could be applied to solve part of
bottleneck. Also, the Kyoto Protocol allows carbon credits for the reduction of
greenhouse gases emission which would bring financial benefits to be used to solve
part of the bottleneck costs.
This thesis shows that the hinterland transport of orange juice by barges is just the
start of a completely new market for inland shipping. The use of inland shipping can
only be done if transport costs, including storage and transshipment, are at the very
least on a par with those incurred using road transport. Transshipers will not make
the switch to inland shipping if this means of transport is more expensive than road
transport. As recommendation, a pilot project involving the transshipment of NFC
from the Rotterdam‟s Fruitport to the juice packer in Sarre Union, France,
destination which presented the best return on investment (NPV and IRR), should
be performed in order to find out hidden issues and hidden costs not revealed in this
case study, in order to have a feeling of the juice packers‟ acceptance of this new
transport mode and as next step produce a detailed economic feasibility study about
the subject.
58
References:
Blaaw, H. G. (2009). Interview by author. Marin, Wageningen, The Netherlands.
Booij, L. and de Vries C.J., 2005. The Power of Inland Navigation. Rotterdam. Dutch
Inland Shipping Information Agency.
Bottema, U. (2009). Interview by author. Europe Container Terminals, Rotterdam,
The Netherlands.
Brazilian Homes, 2009.
http://www.brazilmax.com/news.cfm/tborigem/fe_business/id/7. Accessed on July
2nd, 2009.
Bureau Voorlichting Binnevaart, 2009.
http://www.bureauvoorlichtingbinnenvaart.nl/content/view/24/35/lang,en/. Accessed
on July 8th, 2009.
Chopra, S. and Meindl, P., 2007. Supply Chain Management: Strategy, Planning &
Operations (Third Edition). Chapters 1 to 4, 10 and 13. Pearson Education, Upper
Saddle River, NJ, USA.
Citrossuco. http://www.citrosuco.com.br. Accessed on July 2nd, 2009.
Connecticut Department of Transportation, 2001. Container Barge Feeder Service
Study. Bridgeport, USA.
Contargo B.V., 2009.
http://www.contargo.net/index.php?option=com_content&task=view&id=32&Itemid=
188. Accessed on August 12th, 2009.
Cronos, 2009.
http://www.cronos.com/CustomerRoom/ProductInformation.aspx?ContainerType=T
K. Accessed on August 1st, 2009.
De Schepper, K. (2009). Interview by author. Inland Navigation Europe, Brussels,
Belgium.
Dekker, R. et al, 2006. Floating Stocks in FMCG Supply Chains. School of
Economics, Erasmus University Rotterdam, Rotterdam, The Netherlands.
Den Boer, L.C., et al, 2008. STREAM Studie naar Transport Emissies van Alle
Modaliteiten. Delft, CE, september 2008.
European Commission Transport, 2009.
http://ec.europa.eu/transport/infrastructure/networks_eu/networks_eu_en.htm.
Accessed on August 5th.
Bibliography
59
European Commission. Pages 46-47 and pages 70-71. Trans European Transport
Network, 2005.
Fast Forward, issue 41, spring 2008. Pages 12-13. Delta Barge Feeders Terminal
on Its Way.
Fast Forward, issue 45, summer 2009. Pages 18-19. Seeding for an Intermodal
Fresh Corridor.
Florida department of Citrus, 2008.
http://www.floridajuice.com/history_of_citrus.php. Accessed on June 27th, 2009.
Food and Agricultural Organization, United Nations, 2009. Citrus Fruit Statistics,
2007. New York, USA.
Food and Agricultural Organization, United Nations, 2009.
http://www.fao.org/es/ess/top/commodity.html?lang=en&item=490&year=2005.
Accessed on July 6th, 2009.
Goodrich, R.M. and Brown M.G., 2000. European Markets for NFC: Supply and
Demand Issues. University of Florida, Citrus Research and Education Center,
Florida, USA.
Gouka, C. ,2009. Port of Rotterdam. A Case Study of Port Marketing Strategy. MEL
Class, March 6th, 2009. Rotterdam, The Netherlands.
Green Port, 2009, issue 5, May/June 2009. Pages 24-27. Ports Climate Initiative:
Charting the way ahead.
Heap, R., et al, 1998. Food Transportation. London. Blackie Academic &
Professional.
Inland Navigation Europe, 2009.
http://www.inlandnavigation.org/en/factsandfigures.html. Accessed on June 24th,
2009.
Inland Rivers Port and Terminals, 2009.
http://www.irpt.net/irpt.nsf/LinksView/EnvironmentalAdvantages?Opendocument.
Accessed on August 3rd, 2009.
International Association the Rhine Ships Register (IVR), 2009.
http://www.ivr.nl/statistics. Accessed on August 5th, 2009.
ISSU Publications, 2009.
http://issuu.com/docent62/docs/k6_soorten_schepen_lesboek. Accessed on August
3rd, 2009.
Luijendijk H. (2009) Interview by author. Port of Rotterdam, Rotterdam, The
Netherlands.
60
M & S Shipping LTD., 2009.
http://www.msship.co.za/TankSpecs.htm. Accessed on June 29th, 2009.
Marin B.V., 2009. http://www.marin.nl/web/show. Accessed on July 4th, 2009.
Mercurius Shipping B.V., 2009. http://www.marin.nl/web/show. Accessed on July 1st,
2009.
Port of Rotterdam, 2004. Port Vision 2020.
Port of Rotterdam, 2009. Annual Report 2008.
Porto de Santos, 2009. http://www.portodesantos.com.br/authority/estatistica.html.
Accessed on July 2nd, 2009.
Redd, J. B., et al.,1996. Quality Control Manual for Citrus Processing Plants, Vol. III.
USA, Florida. Agroscience, Inc.
Riemens J. (2009). Interview by author. MCT Lucassen, Amsterdam, The
Netherlands.
Silva, E. A. (2008). Interview by author. Continental Juice, Rotterdam, The
Netherlands.
Smith J. S.and Hui,Y, H., 2004. Food Processing: Principles and Applications,
Chapter 21. Blackwell Publishing.
Stuijts, J. (2009). Interview by author. Holvrieka Nirota B.V., Sneek, The
Netherlands.
Tetra Pack Processing Systems AB, 2004. The Orange Book. Sweden, Lund. Ruter
Media Group.
Transport Guide Rotterdam, 2009.
http://www.transportguiderotterdam.com/companies/barge/. Accessed on August 4th,
2009.
U.S. Department of Agriculture, Foreign Agricultural Services, February 2009. World
Markets and Trade. Washington, DC, USA.
U.S. Department of Transportation, 1994. Environmental Advantages of Inland
Barge Transportation. St. Louis, USA.
U.S. Department of Transportation, Maritime Administration, August 1994.
Environmental Advantages of Inland Barges Transportation. Washington, DC, USA.
United Nations Conference on Trade and Development (UNCTAD), 2009. Citrus
Fruit. http://www.unctad.org/infocomm/anglais/orange/chain.htm. Accessed on June
23rd, 2009.

61
Viadonau, 2009.
http://www.donauschifffahrt.info/en/facts_figures/the_danube_as_a_major_route_of
_transport/basic_data/. Accessed on July, 28th.
Vinke, C. (2009). Interview by author. Contargo B.V., Zwijndrecht, The Netherlands.
Visser, J., et al, 2006. A new hinterland transport concept for the port of Rotterdam:
organizational and/or technological challenges? Delft University of Technology. The
Netherlands.
Zimmerman R. J., 2009. Interview by author. Mercurius Shipping Group,
Zwijndrecht, The Netherlands.
Zuidwijk, R., 2009. Intermodal Transport. MEL Class, March 3rd, 2009. Rotterdam,
The Netherlands.

62
Appendices
Appendix 1: Orange grove: City of Avare - state of Sao Paulo, Brazil
Source: http://www.upload.wikimedia.org
Appendix 2: Average vitamin C content of some fruits
Source: The Orange Book page 26
Fruit Average vitamin C
(mg/1000g fruit)
Peach 80
Apple 80
Blackberry 210
Kumquat 380
Grapefruit 390
Orange 530
Papaya 620
Kiwi fruit 630
Strawberry 660
Guava 1840
Blackcurrant 2100
Appendices

63
Appendix 3: Nutrient composition of orange juice
Source: Food Transportation page 2
Appendix 4: Quantity of concentrate needed to make 1 liter of juice
Source: The Orange Book page 117
Water Protein Fat Carbohydrate Other
89.2% 0.5% 0.1% 8.8% 1.4%
Basis
Final juice: 11.2 Brix
Concentrate: 65 Brix, corrected *Juice of 11.2 Brix has a specific gravity of 1.045 kg/lTherefore: 1 l of juice at 20 C weights 1,045 g
Calculations:
1 l final juice = 1,045 X 11.2/100 = 117 g of soluble solids
1 kg concentrate = 1,000 X 65/100 = 650 g of soluble solids
Result:
To prepare 1 l of juice:
Concentrate: 117/650 X 1000 = 180 gWater: 1,045 - 180 = 865 g * = value approximate because juice is not a pure sugar solution

64
Appendix 5: Tri-modal container barge inland terminal – Dortmund, Germany
Source: CONTARGO GmbH & Co. KG
Appendix 6: Inland Vessels Classes (CEMT- Conférence Européenne des
Ministres de Transport)
Class Tonnage Length (m) Width (m) Draft (m)
I 300 38.5 5.05 2.2
II 650 55.0 6.6 2.5
III 1000 80.0 8.2 2.5
IV 1500 85.0 9.5 2.5
V 2500 110.0 11.4 2.8
VI 6000 140.0 15.0 3.9
Source: ISSUU Digital Publishers (http://issuu.com)
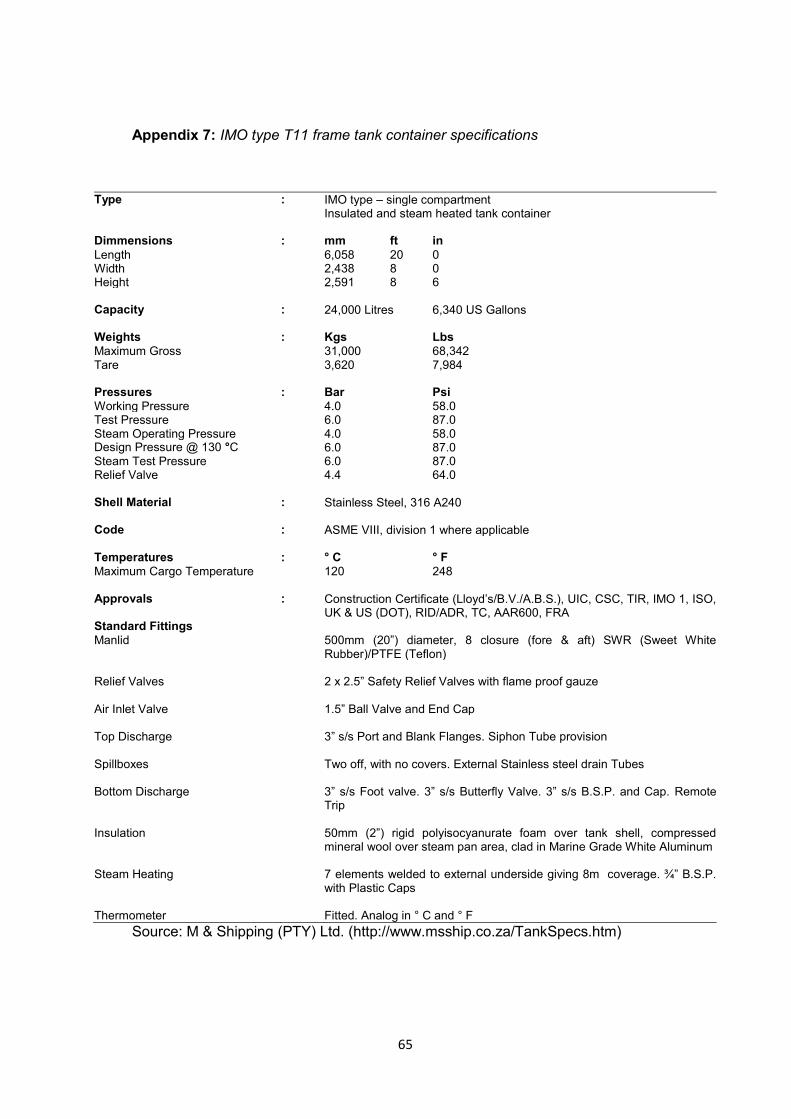
65
Appendix 7: IMO type T11 frame tank container specifications
Type : IMO type – single compartment Insulated and steam heated tank container Dimmensions : mm ft in
Length 6,058 20 0 Width 2,438 8 0 Height 2,591 8 6 Capacity : 24,000 Litres 6,340 US Gallons Weights : Kgs Lbs
Maximum Gross 31,000 68,342 Tare 3,620 7,984 Pressures : Bar Psi
Working Pressure 4.0 58.0 Test Pressure 6.0 87.0 Steam Operating Pressure 4.0 58.0 Design Pressure @ 130 °C 6.0 87.0 Steam Test Pressure 6.0 87.0 Relief Valve 4.4 64.0 Shell Material : Stainless Steel, 316 A240 Code : ASME VIII, division 1 where applicable Temperatures : ° C ° F
Maximum Cargo Temperature 120 248 Approvals : Construction Certificate (Lloyd‟s/B.V./A.B.S.), UIC, CSC, TIR, IMO 1, ISO,
UK & US (DOT), RID/ADR, TC, AAR600, FRA Standard Fittings Manlid
500mm (20”) diameter, 8 closure (fore & aft) SWR (Sweet White Rubber)/PTFE (Teflon)
Relief Valves
2 x 2.5” Safety Relief Valves with flame proof gauze
Air Inlet Valve
1.5” Ball Valve and End Cap
Top Discharge
3” s/s Port and Blank Flanges. Siphon Tube provision
Spillboxes
Two off, with no covers. External Stainless steel drain Tubes
Bottom Discharge
3” s/s Foot valve. 3” s/s Butterfly Valve. 3” s/s B.S.P. and Cap. Remote Trip
Insulation
50mm (2”) rigid polyisocyanurate foam over tank shell, compressed mineral wool over steam pan area, clad in Marine Grade White Aluminum
Steam Heating
7 elements welded to external underside giving 8m coverage. ¾” B.S.P. with Plastic Caps
Thermometer
Fitted. Analog in ° C and ° F
Source: M & Shipping (PTY) Ltd. (http://www.msship.co.za/TankSpecs.htm)

66
Appendix 8: Pictures of a frame tank container
Frame Tank Container
Frame tank container being road transported as a standard 20 foot container
Source: Holvrieka Nirota B.V. – Sneek, The Netherlands
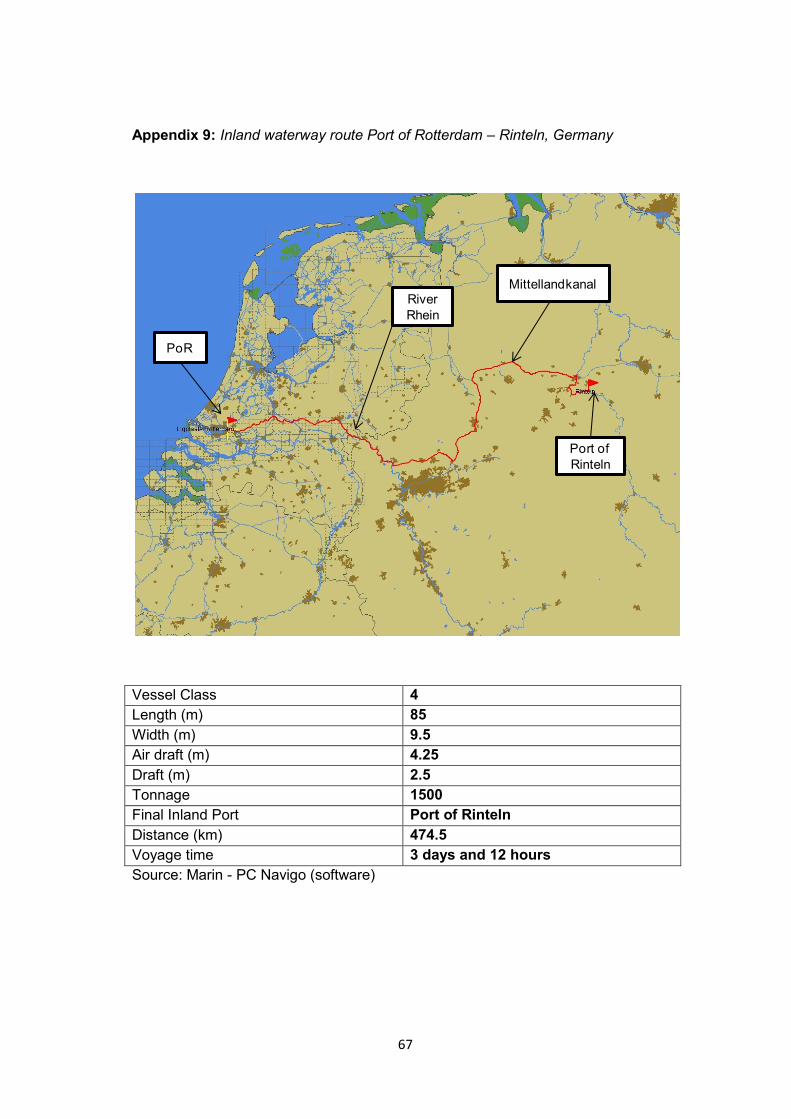
67
Appendix 9: Inland waterway route Port of Rotterdam – Rinteln, Germany
Vessel Class 4
Length (m) 85
Width (m) 9.5
Air draft (m) 4.25
Draft (m) 2.5
Tonnage 1500
Final Inland Port Port of Rinteln
Distance (km) 474.5
Voyage time 3 days and 12 hours
Source: Marin - PC Navigo (software)
River
Rhein
Mittellandkanal
PoR
Port of
Rinteln
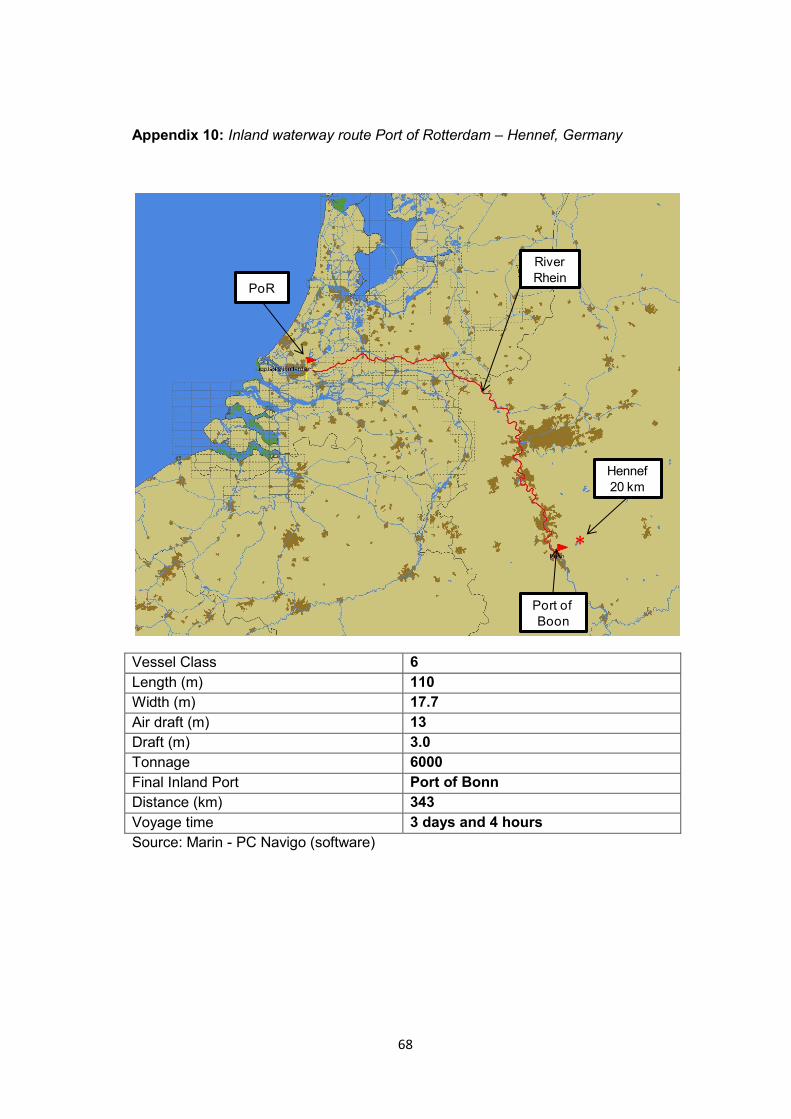
68
Appendix 10: Inland waterway route Port of Rotterdam – Hennef, Germany
Vessel Class 6
Length (m) 110
Width (m) 17.7
Air draft (m) 13
Draft (m) 3.0
Tonnage 6000
Final Inland Port Port of Bonn
Distance (km) 343
Voyage time 3 days and 4 hours
Source: Marin - PC Navigo (software)
PoR
River
Rhein
Port of
Boon
Hennef
20 km
*
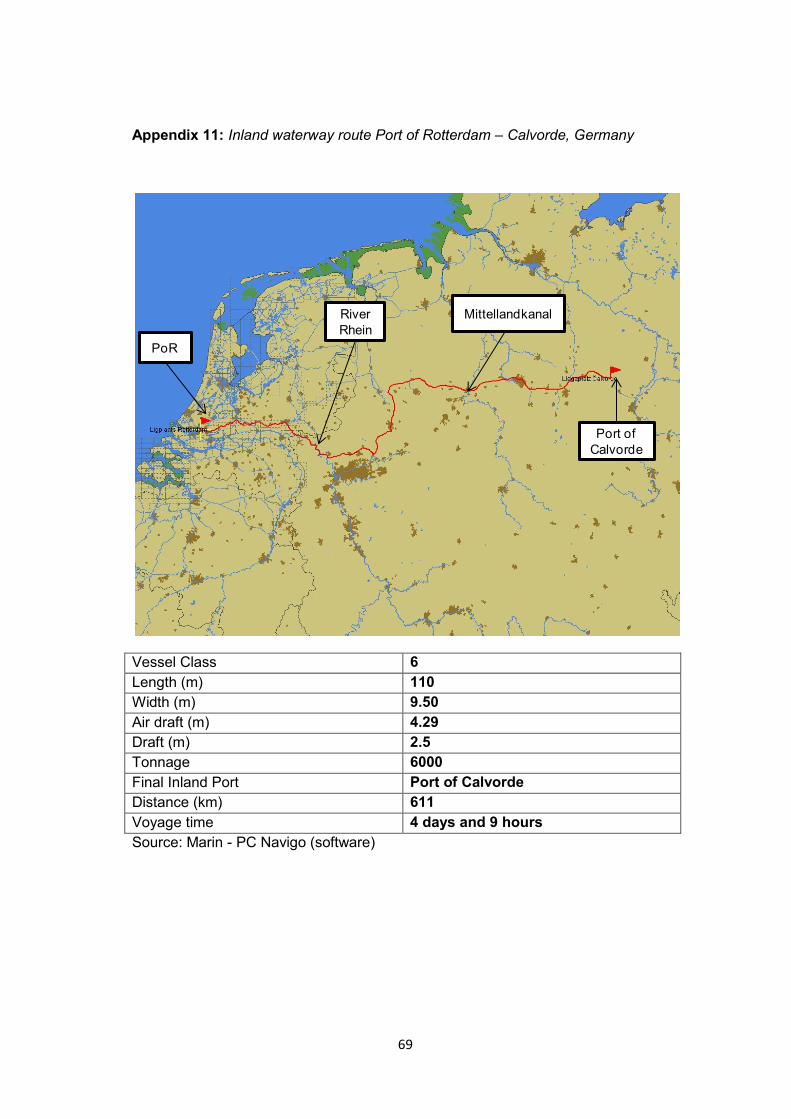
69
Appendix 11: Inland waterway route Port of Rotterdam – Calvorde, Germany
Vessel Class 6
Length (m) 110
Width (m) 9.50
Air draft (m) 4.29
Draft (m) 2.5
Tonnage 6000
Final Inland Port Port of Calvorde
Distance (km) 611
Voyage time 4 days and 9 hours
Source: Marin - PC Navigo (software)
PoR
River
Rhein
Mittellandkanal
Port of
Calvorde
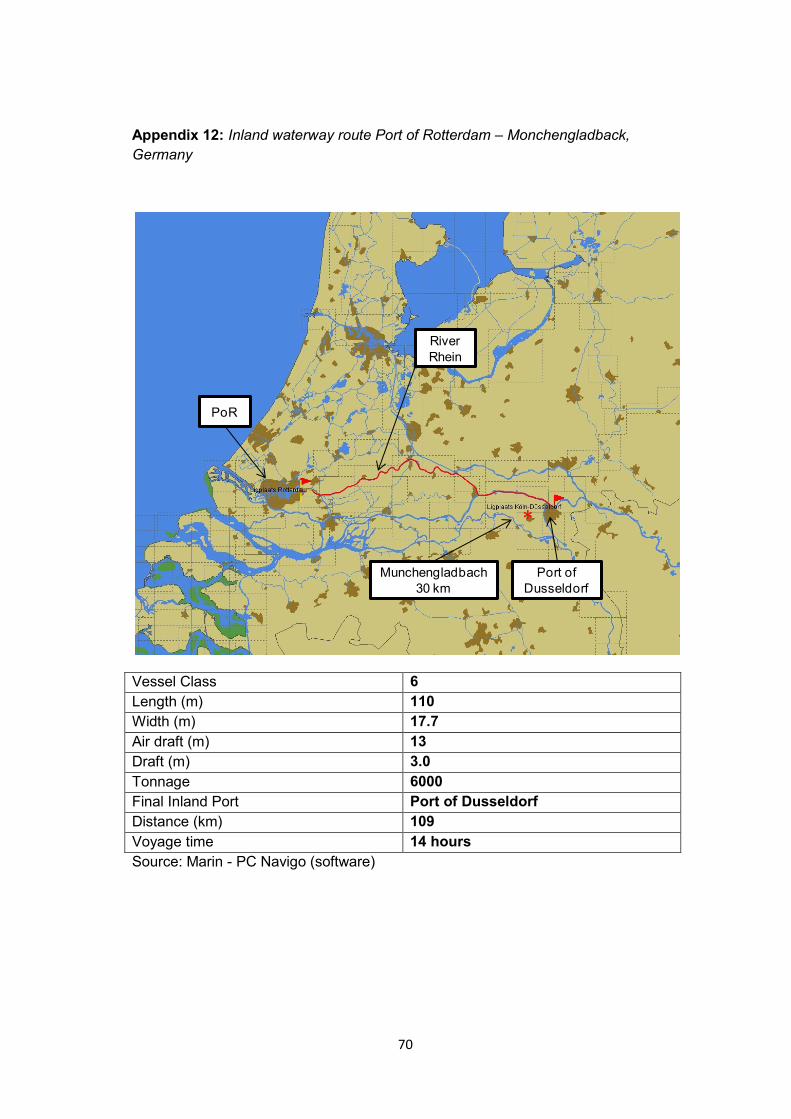
70
Appendix 12: Inland waterway route Port of Rotterdam – Monchengladback,
Germany
Vessel Class 6
Length (m) 110
Width (m) 17.7
Air draft (m) 13
Draft (m) 3.0
Tonnage 6000
Final Inland Port Port of Dusseldorf
Distance (km) 109
Voyage time 14 hours
Source: Marin - PC Navigo (software)
PoR
River
Rhein
Port of
Dusseldorf
Munchengladbach
30 km
*
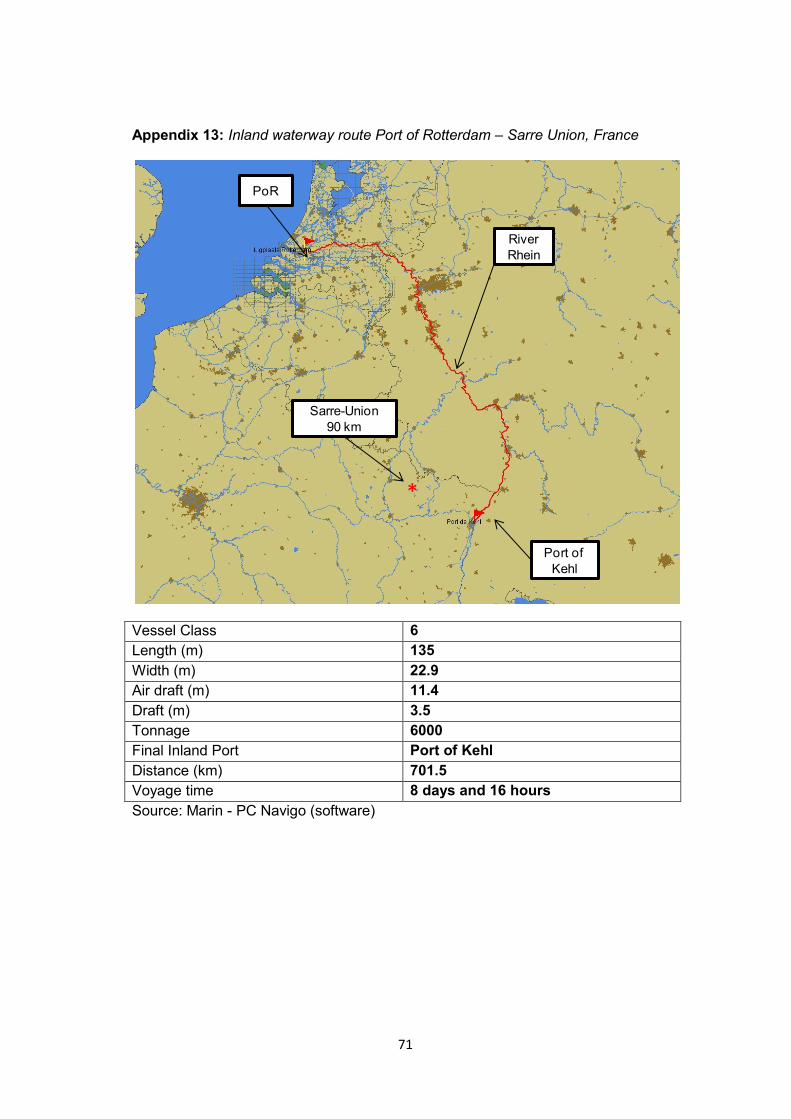
71
Appendix 13: Inland waterway route Port of Rotterdam – Sarre Union, France
Vessel Class 6
Length (m) 135
Width (m) 22.9
Air draft (m) 11.4
Draft (m) 3.5
Tonnage 6000
Final Inland Port Port of Kehl
Distance (km) 701.5
Voyage time 8 days and 16 hours
Source: Marin - PC Navigo (software)
PoR
River
Rhein
Port of
Kehl
*
Sarre-Union
90 km
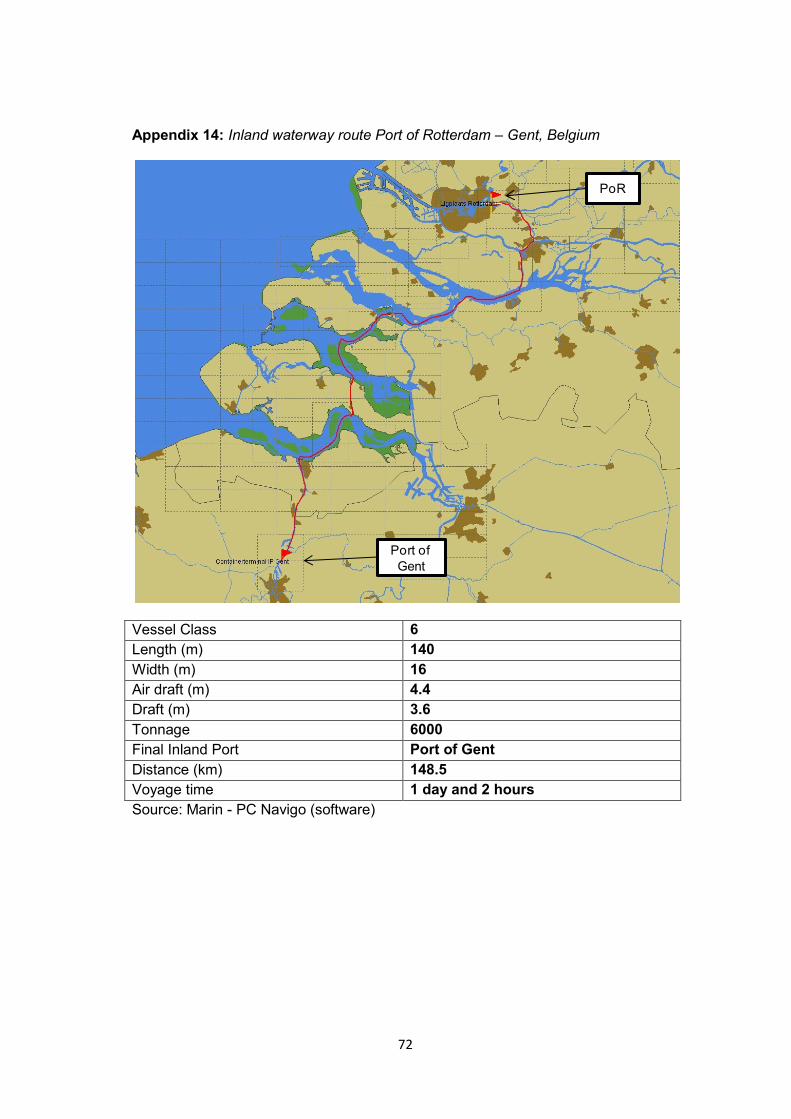
72
Appendix 14: Inland waterway route Port of Rotterdam – Gent, Belgium
Vessel Class 6
Length (m) 140
Width (m) 16
Air draft (m) 4.4
Draft (m) 3.6
Tonnage 6000
Final Inland Port Port of Gent
Distance (km) 148.5
Voyage time 1 day and 2 hours
Source: Marin - PC Navigo (software)
PoR
Port of
Gent
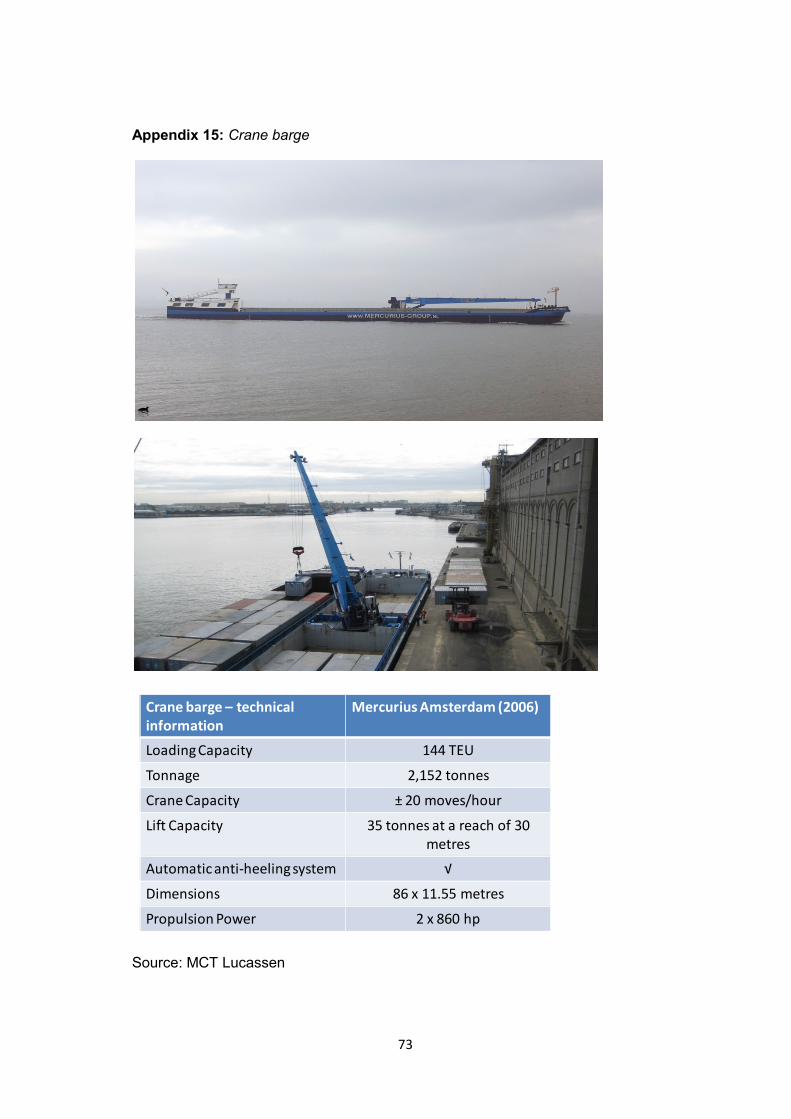
73
Appendix 15: Crane barge
Source: MCT Lucassen
Crane barge – technical information
Mercurius Amsterdam (2006)
Loading Capacity 144 TEU
Tonnage 2,152 tonnes
Crane Capacity ± 20 moves/hour
Lift Capacity 35 tonnes at a reach of 30 metres
Automatic anti-heeling system √
Dimensions 86 x 11.55 metres
Propulsion Power 2 x 860 hp