Bargaining on Annual Pay Rises
31
Bargaining on annual pay rises Last updated: September 2021 Contact: [email protected] 1 Bargaining on Annual Pay Rises
Transcript of Bargaining on Annual Pay Rises

Bargaining on annual pay rises Last updated: September 2021 Contact: [email protected] 1
Bargaining
on Annual
Pay Rises
Bargaining on annual pay rises Last updated: September 2021 Contact: [email protected] 2
BARGAINING ON ANNUAL PAY RISES
How can this guide assist me?
This document seeks to provide negotiators with the following material to assist in bargaining
over annual pay increases:
• An outline of the latest developments in key economic factors that shape pay claims,
particularly:
➢ Changes in the cost of living facing workers, which pay claims need to keep pace
with if the buying power of wages is not to fall;
➢ Pay settlement and average earnings growth figures, which can act as a
benchmark for pay claims;
➢ The context for pay claims in terms of the labour market, the National Minimum
Wage, the Living Wage and other dimensions of the economy.
• Directions to model pay claims, which are likely to be of most value to branches
representing staff working in private companies and community / voluntary
organisations, who are not covered by the major national bargaining bodies in local
government, the NHS and education;
• Advice on supplementing a claim through a staff survey and a model questionnaire
that can be amended to suit local circumstances;
• Word versions of the model pay claim and model survey can be downloaded from the
UNISON bargaining guides page at https://www.unison.org.uk/bargaining-guides/

Bargaining on annual pay rises Last updated: September 2021 Contact: [email protected] 3
Contents of the guide
Latest headline figures ....................................................................................................... 4
Inflation as benchmark for pay claims .............................................................................. 5
Historical inflation rates ..................................................................................................... 5
Impact on real wages ........................................................................................................ 6
Main factors affecting inflation ........................................................................................... 7
Forecast inflation rates ...................................................................................................... 8
Reason for comparing wages to RPI ................................................................................. 9
Pay settlements and average earnings as benchmark for pay claims .......................... 11
Pay settlements ............................................................................................................... 11
Average earnings ............................................................................................................ 12
Wider context to consider referencing in pay claims ..................................................... 15
Labour market ................................................................................................................. 15
Pandemic impact ............................................................................................................. 16
National Minimum Wage ................................................................................................. 16
Living Wage..................................................................................................................... 17
Appendix 1 - Model pay claim .......................................................................................... 18
Appendix 2 – Merits of percentage and flat-rate pay claims .......................................... 25
Appendix 3 - Strengthening claims through a staff survey ........................................... 26
Bargaining on annual pay rises Last updated: September 2021 Contact: [email protected] 4
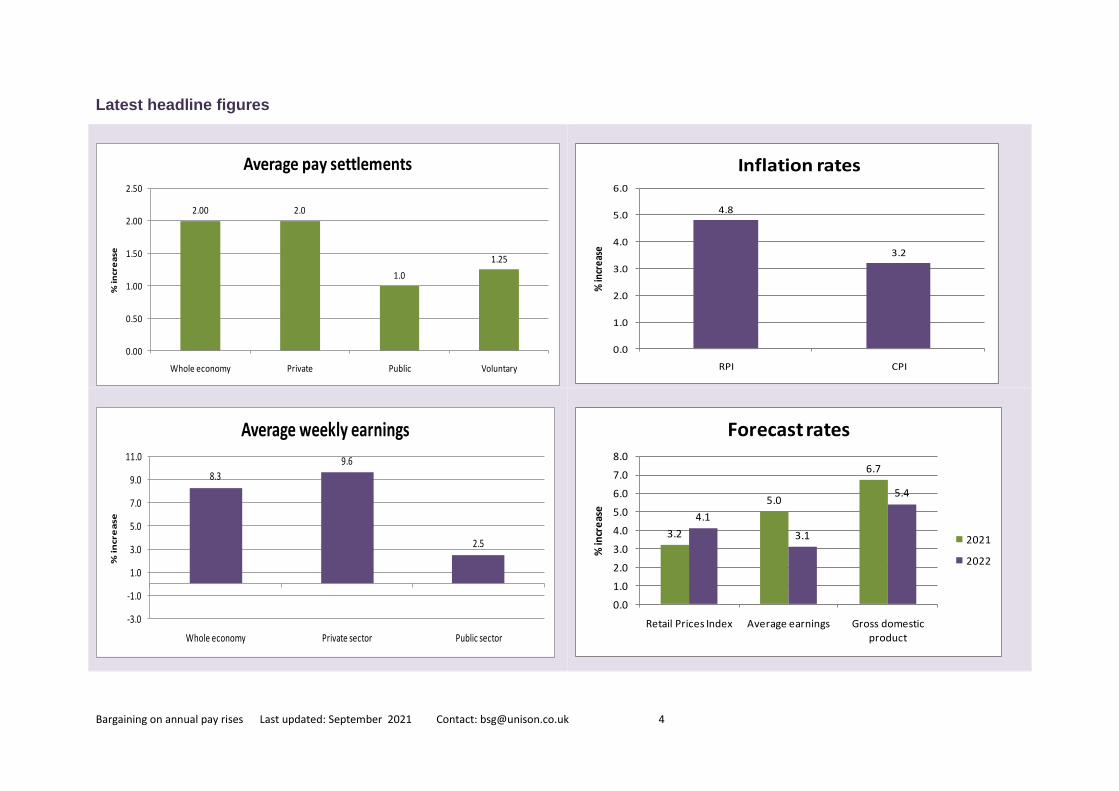
Latest headline figures
2.00 2.0
1.0
1.25
0.00
0.50
1.00
1.50
2.00
2.50
Whole economy Private Public Voluntary
% in
cre
ase
Average pay settlements
4.8
3.2
0.0
1.0
2.0
3.0
4.0
5.0
6.0
RPI CPI
% in
crea
se
Inflation rates
8.3
9.6
2.5
-3.0
-1.0
1.0
3.0
5.0
7.0
9.0
11.0
Whole economy Private sector Public sector
% in
cre
ase
Average weekly earnings
3.2
5.0
6.7
4.1
3.1
5.4
0.0
1.0
2.0
3.0
4.0
5.0
6.0
7.0
8.0
Retail Prices Index Average earnings Gross domestic product
% in
cre
ase
Forecast rates
2021
2022

Bargaining on annual pay rises Last updated: September 2021 Contact: [email protected] 5
Inflation as benchmark for pay claims
Historical inflation rates
The most widely reported measure of inflation in the UK is the Consumer Prices Index (CPI).
However, the most accurate indicator of changes in the cost of living facing workers is the
Retail Prices Index (RPI) [for the reasons why RPI is most relevant, see note below].
Inflation rose markedly over 2016 and 2017, pushing the RPI rate to over 4%. During 2018
and into 2019 the rate fell back and the effect of the Covid-19 pandemic on the economy
heralded a further decline. However, rates have exploded over this year, putting the August
2021 RPI rate at 4.8% and the CPI rate at 3.2% - inflation rates not seen in a decade.
Source: Office for National Statistics, UK Consumer Price Inflation: August 2021, published September 2021
Throughout the period shown by the graph above, the average CPI rate has been just under
1% lower than the average RPI rate.
Between the start of 2010 and the end of 2020, the cost of living, as measured by the Retail
Prices Index, rose by a total of 35.6%.
0.0
1.0
2.0
3.0
4.0
5.0
6.0
Jan
-16
Ap
r-1
6
Jul-
16
Oct
-16
Jan
-17
Ap
r-1
7
Jul-
17
Oct
-17
Jan
-18
Ap
r-1
8
Jul-
18
Oct
-18
Jan
-19
Ap
r-1
9
Jul-
19
Oct
-19
Jan
-20
Ap
r-2
0
Jul-
20
Oct
-20
Jan
-21
Ap
r-2
1
Jul-
21
% c
han
ge o
ver
12
mo
nth
s
Year / Month
Inflation rates
CPI RPI

Bargaining on annual pay rises Last updated: September 2021 Contact: [email protected] 6
Impact on real wages
The annual changes for full years since 2010 have been as below. The annual pay rises at
an organisation can be set against these annual inflation rates to show the impact on the
value of wages and examples of actual salaries can be used to show the impact in cash
terms (if you need assistance in carrying out these calculations, contact Bargaining Support
on [email protected] ).
The RPI rate is the one that UNISON believes most accurately reflects the change in prices
faced by workers. However, the CPI figures are also shown below as they may be useful in
showing the scale of decline in wage value even if that figure is used.
Year % Annual Growth in RPI % Annual Growth in CPI
2010 4.6 3.3
2011 5.2 4.5
2012 3.2 2.8
2013 3.0 2.6
2014 2.4 1.5
2015 1.0 0.0
2016 1.8 0.7
2017 3.6 2.7
2018 3.3 2.5
2019 2.6 1.8
2020 1.5 0.9
Across the economy, the most recent data from the Annual Survey of Hours and Earnings
suggests that the real value of average UK pay packets has fallen by 11% since 2009, with
employees losing over £3,000 a year from the value of their pay packet. The average worker
would have accumulated £37,370 more had their wage kept pace with inflation.
The average public sector worker has seen an even steeper 14% decline in the value of their
wages. For the public sector worker who has not benefited from any incremental progression
in their pay, the cut has been 18%, leaving their 2020 wage over £6,800 down on the value
of their earnings in 2009 and the accumulated loss from their wage failing to keep pace with
inflation each year standing at over £53,307.

Bargaining on annual pay rises Last updated: September 2021 Contact: [email protected] 7
Main factors affecting inflation
The changes in the price of components of the Retail Prices Index over the year to August
2021 are shown in the table below.
Item Average % increase to August 2021
Consumer durables 8.1
Travel and leisure 6.7
Personal expenditure 5.9
Food and catering 4.4
Housing and household expenditure 4.1
Alcohol and tobacco 2.2
All goods 5.4
All services 3.8
All items 4.8
Source: Office for National Statistics, Consumer Price Inflation Reference Tables, August 2021
Within these figures, some costs are rising significantly faster, such as petrol and oil at
17.9%, as well as electricity bills at 5.8%.
The price of housing also remains one of the biggest issues facing employees and their
families. Across the UK, house prices rose by 8% in the year to July 20211, with Scotland
experiencing the biggest increase at 14.6%, followed by Wales at 11.6%, Northern Ireland at
9% and England at 7% (for a breakdown of increases by English region, click here).
Private rental prices have also seen a significant increase, taking the average monthly rent
for new tenancies in the UK up 6.9% to £1,0532 in August 2021 (for a country / regional
breakdown of rents click here ).
Though not specifically assessed by CPI or RPI figures, childcare costs represent a key area
of expenditure for many staff (UNISON surveys have consistently found that around a third
of staff have child caring responsibilities). Therefore, it is also worth noting that the annual
Family & Childcare Trust survey3 for 2021 found that the cost of a nursery place for a child
under two rose by 4% since the previous year, with the annual cost of 25 hours care per
week hitting £7,000 in Britain.
1 Office for National Statistics, UK House Price Index: July 2021, published September 2021 2 HomeLet Rental Index, August 2021 3 Family & Childcare Trust, Childcare Survey 2021

Bargaining on annual pay rises Last updated: September 2021 Contact: [email protected] 8
Current inflation rates can mask longer term changes in the cost of living that have taken
place since 2009 The examples below show major increases in core costs that have
surpassed average price increases over the period.
Expenditure item House prices Bus & coach fares Electricity Rail fares
Price rise 2009 - 20 49% 72% 55% 51%
Forecast inflation rates
The Treasury average of independent forecasts states that RPI inflation will average 3.2%
over 2021. It will then escalate to 4.1% in 2022 and continue to run at or above 3% for the
following three years, in line with the pattern shown in the graph below. These annual rates
show the rate at which pay rises would be needed for wages just to maintain their current
value.
Source: HM Treasury Forecasts for the UK Economy, August 2021
3.2
4.1
3.5
3.23.0
2.2
2.8
2.2 2.1 2.0
0.0
0.5
1.0
1.5
2.0
2.5
3.0
3.5
4.0
4.5
2021 2022 2023 2024 2025
% in
cre
ase
Forecast annual increase in cost of living
RPI
CPI
Bargaining on annual pay rises Last updated: September 2021 Contact: [email protected] 9
Reason for comparing wages to RPI
The key arguments
UNISON believes that the Retail Prices Index (RPI) remains the most accurate measure of
inflation faced by employees.
The most widely quoted figure for inflation in the media is the Consumer Prices Index (CPI),
However, UNISON believes that CPI consistently understates the real level of inflation for
the following reasons:
• CPI fails to adequately measure one of the main costs facing most households in the
UK – housing. Almost two-thirds of housing in the UK is owner occupied, yet CPI
almost entirely excludes the housing costs of people with a mortgage;
• CPI is less targeted on the experiences of the working population than RPI, since
CPI covers non-working groups excluded by RPI – most notably pensioner
households where 75% of income is derived from state pensions and benefits, the
top 4% of households by income and tourists;
• CPI is calculated using a flawed statistical technique that consistently under-
estimates the actual cost of living rises faced by employees. The statistical
arguments are set out exhaustively in the report “Consumer Prices in the UK” by
former Treasury economic adviser Dr Mark Courtney, which is summarised here and
covered in full here
While we do not claim that RPI is perfect, we believe that it is a much better indicator than
CPI. Estimates arising from Courtney’s analysis suggest that, of the 0.9 percentage point
average difference between RPI and CPI inflation over recent years, 0.2 percentage points
represented an over-estimation by the RPI, while 0.7 percentage points was down to under-
estimation by the CPI.
Widespread opposition to CPI
RPI was the virtually unchallenged measure of UK inflation for almost six decades following
the Second World War. However, RPI has been under sustained attack by the UK Statistics
Authority (UKSA) for almost a decade, since changes in the collection of clothing price data
created a substantial difference in RPI and CPI for this very small element of the overall
inflation calculation
Drawing on the work of economists whose theory offered some support to the UKSA’s
arguments against RPI, the authority derocognised RPI in its official status as a “national
statistic” in 2013. Subsequently, the UKSA developed CPIH as its “most comprehensive
measure of inflation” in 2017 (CPIH attempts to introduce housing costs into the CPI
measure, though it uses the controversial rental equivalence method, which treats owner
occupiers as if they were renting their property).
However, those steps faced overwhelming opposition whenever the UKSA put their
proposals out to public consultation. UNISON and the TUC have joined with sympathetic
economists in defending RPI. In addition, the Royal Statistical Society has consistently
stated that CPI was never intended as a measure of changes in costs facing households.
Rather, it was “designed in the 1990s for macroeconomic purposes” and its purpose is to act
“as the principal inflation indicator for the Bank of England in its interest-setting rate role.”
Bargaining on annual pay rises Last updated: September 2021 Contact: [email protected] 10
The society sums up its position as follows:
“Why should the typical household accept an inflation index that: -
• fails to take account of, or does not track directly, one of their main expenditure
items: mortgage payments and other costs of house purchase and renovation;
• gives more weight to the expenditure patterns of wealthier households than of other
households;
• fails to take account of interest on loans for a wide variety of purposes, ranging from
student loans to loans for car purchase;
• includes the expenditure of foreign tourists in the UK but not their own expenditure
outside the UK;
• fails to include council tax.”
In 2019, the UKSA then faced a withering rebuke from the House of Lords Economic Affairs
Committee over its handling of RPI, most notably with regard to its failure to fulfil its duty to
properly maintain the methodology for calculating RPI. As a result, the committee demanded
that, “given RPI remains in widespread use, the authority should stop treating RPI as a
legacy measure and resume a programme of periodic methodological improvements.”
And the committee directed a further blow at the credibility of CPIH, stating that it was “not
convinced by use of rental equivalence in CPIH to impute owner occupier housing costs.”
The continued use of RPI
Though CPI is the figure quoted almost uniformly across the media when reporting inflation,
RPI remains a common reference point for pay negotiations.
And beyond pay bargaining, RPI remains the government’s measure for uprating fuel benefit
charges on company cars, air passenger duty, alcohol duty, gaming duty, regulated rail
fares, student loan interest rates, tobacco duty and vehicle excise duty,
Across the private sector, it is extensively used wherever charges are made on a rolling
contract basis. For instance, RPI uprating can be found among:
• Mobile phone tariffs charged by many major providers - iD mobile, O2, Virgin
• Annual reviews of property rental – historically, RPI has been the standard
benchmark;
• Annual uprating of private sector pension payments;
• Contracts for ongoing services eg RPI is commonplace as the agreed uprating
charge under Private Finance Intiative projects.
Some organisations, such as Barnardo’s and British Telecom, have pursued high profile
court cases to reduce uprating of pension payments to CPI, but have found their arguments
rejected. BT pursued its claim on the basis that RPI had become an “inappropriate measure”
but the courts refused to accept that RPI was inappropriate for the purpose of the scheme.
Bargaining on annual pay rises Last updated: September 2021 Contact: [email protected] 11
Pay settlements and average earnings as benchmark for pay claims
Pay settlements
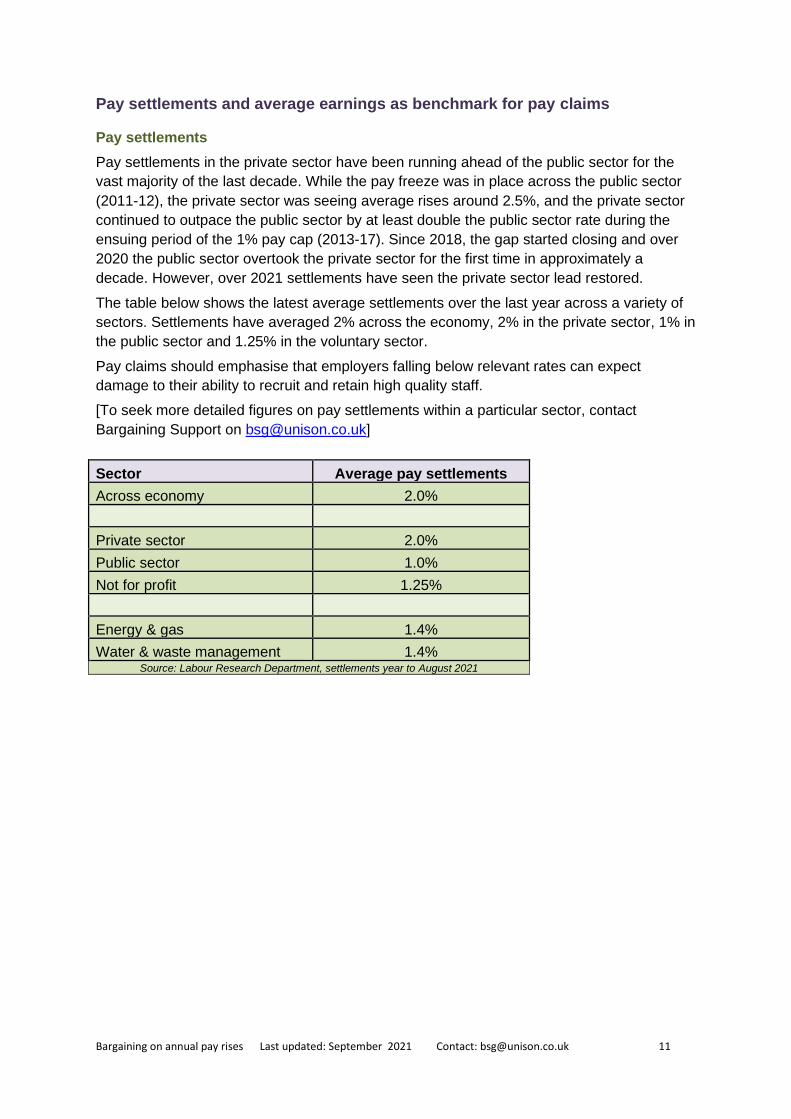
Pay settlements in the private sector have been running ahead of the public sector for the
vast majority of the last decade. While the pay freeze was in place across the public sector
(2011-12), the private sector was seeing average rises around 2.5%, and the private sector
continued to outpace the public sector by at least double the public sector rate during the
ensuing period of the 1% pay cap (2013-17). Since 2018, the gap started closing and over
2020 the public sector overtook the private sector for the first time in approximately a
decade. However, over 2021 settlements have seen the private sector lead restored.
The table below shows the latest average settlements over the last year across a variety of
sectors. Settlements have averaged 2% across the economy, 2% in the private sector, 1% in
the public sector and 1.25% in the voluntary sector.
Pay claims should emphasise that employers falling below relevant rates can expect
damage to their ability to recruit and retain high quality staff.
[To seek more detailed figures on pay settlements within a particular sector, contact
Bargaining Support on [email protected]]
Sector Average pay settlements
Across economy 2.0%
Private sector 2.0%
Public sector 1.0%
Not for profit 1.25%
Energy & gas 1.4%
Water & waste management 1.4% Source: Labour Research Department, settlements year to August 2021
Bargaining on annual pay rises Last updated: September 2021 Contact: [email protected] 12
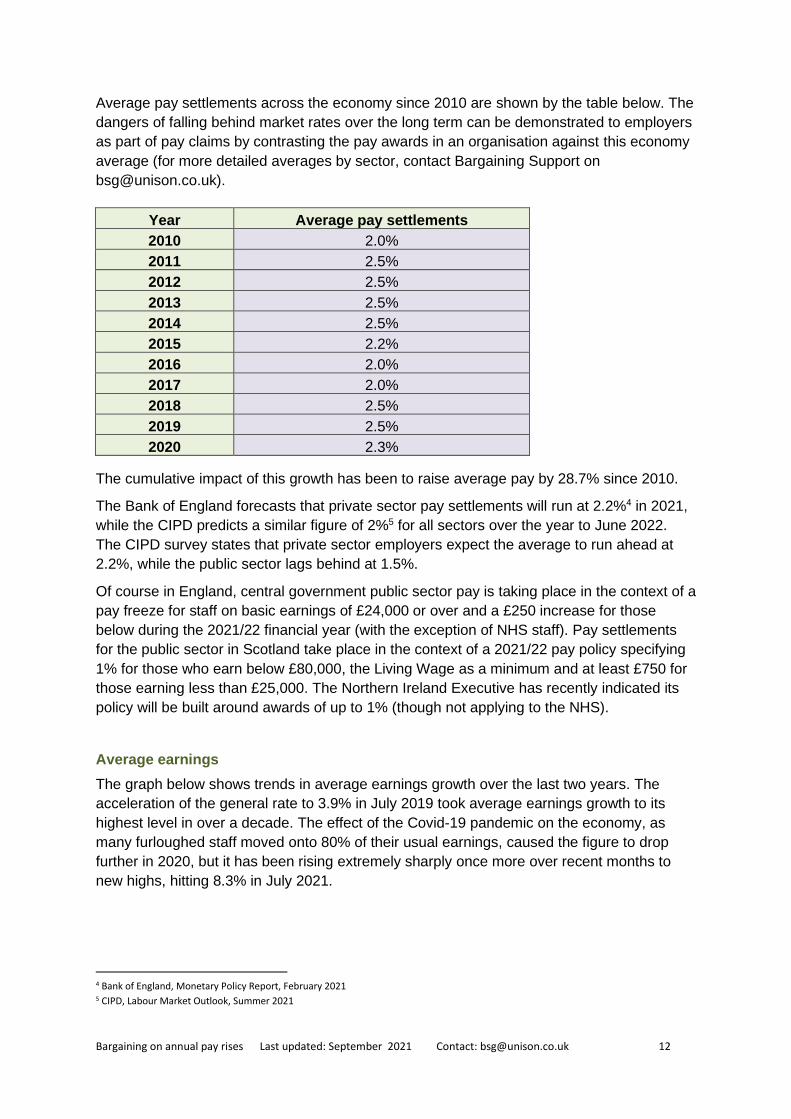
Average pay settlements across the economy since 2010 are shown by the table below. The
dangers of falling behind market rates over the long term can be demonstrated to employers
as part of pay claims by contrasting the pay awards in an organisation against this economy
average (for more detailed averages by sector, contact Bargaining Support on
Year Average pay settlements
2010 2.0%
2011 2.5%
2012 2.5%
2013 2.5%
2014 2.5%
2015 2.2%
2016 2.0%
2017 2.0%
2018 2.5%
2019 2.5%
2020 2.3%
The cumulative impact of this growth has been to raise average pay by 28.7% since 2010.
The Bank of England forecasts that private sector pay settlements will run at 2.2%4 in 2021,
while the CIPD predicts a similar figure of 2%5 for all sectors over the year to June 2022.
The CIPD survey states that private sector employers expect the average to run ahead at
2.2%, while the public sector lags behind at 1.5%.
Of course in England, central government public sector pay is taking place in the context of a
pay freeze for staff on basic earnings of £24,000 or over and a £250 increase for those
below during the 2021/22 financial year (with the exception of NHS staff). Pay settlements
for the public sector in Scotland take place in the context of a 2021/22 pay policy specifying
1% for those who earn below £80,000, the Living Wage as a minimum and at least £750 for
those earning less than £25,000. The Northern Ireland Executive has recently indicated its
policy will be built around awards of up to 1% (though not applying to the NHS).
Average earnings
The graph below shows trends in average earnings growth over the last two years. The
acceleration of the general rate to 3.9% in July 2019 took average earnings growth to its
highest level in over a decade. The effect of the Covid-19 pandemic on the economy, as
many furloughed staff moved onto 80% of their usual earnings, caused the figure to drop
further in 2020, but it has been rising extremely sharply once more over recent months to
new highs, hitting 8.3% in July 2021.
4 Bank of England, Monetary Policy Report, February 2021 5 CIPD, Labour Market Outlook, Summer 2021
Bargaining on annual pay rises Last updated: September 2021 Contact: [email protected] 13
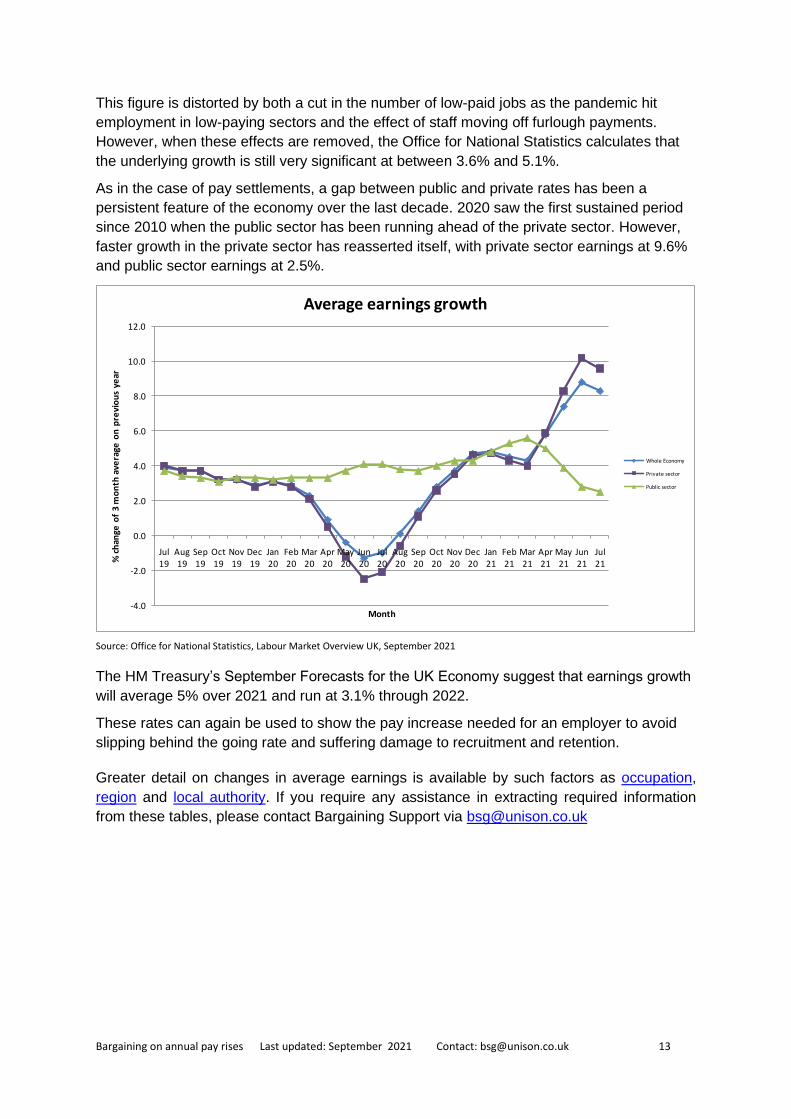
This figure is distorted by both a cut in the number of low-paid jobs as the pandemic hit
employment in low-paying sectors and the effect of staff moving off furlough payments.
However, when these effects are removed, the Office for National Statistics calculates that
the underlying growth is still very significant at between 3.6% and 5.1%.
As in the case of pay settlements, a gap between public and private rates has been a
persistent feature of the economy over the last decade. 2020 saw the first sustained period
since 2010 when the public sector has been running ahead of the private sector. However,
faster growth in the private sector has reasserted itself, with private sector earnings at 9.6%
and public sector earnings at 2.5%.
Source: Office for National Statistics, Labour Market Overview UK, September 2021
The HM Treasury’s September Forecasts for the UK Economy suggest that earnings growth
will average 5% over 2021 and run at 3.1% through 2022.
These rates can again be used to show the pay increase needed for an employer to avoid
slipping behind the going rate and suffering damage to recruitment and retention.
Greater detail on changes in average earnings is available by such factors as occupation,
region and local authority. If you require any assistance in extracting required information
from these tables, please contact Bargaining Support via [email protected]
-4.0
-2.0
0.0
2.0
4.0
6.0
8.0
10.0
12.0
Jul 19
Aug 19
Sep 19
Oct 19
Nov 19
Dec 19
Jan 20
Feb 20
Mar 20
Apr 20
May 20
Jun 20
Jul 20
Aug 20
Sep 20
Oct 20
Nov 20
Dec 20
Jan 21
Feb 21
Mar 21
Apr 21
May 21
Jun 21
Jul 21%
ch
ange
of
3 m
on
th a
vera
ge o
n p
revi
ou
s ye
ar
Month
Average earnings growth
Whole Economy
Private sector
Public sector

Bargaining on annual pay rises Last updated: September 2021 Contact: [email protected] 14
Note on comparisons between public and private sector
The campaign by the government and much of the media to paint public sector workers as
overpaid relative to private sector workers has reasserted itself over the last year and was
prominent in arguments put forward to support the introduction of another public sector pay
freeze in 2021. Average earnings figures have often been used as the basis for making this
false assertion.
The claim is usually based on a crude comparison of average pay that doesn’t take account
of the different type of jobs in the public and private sector. The last study by the Office for
National Statistics that ensured the comparison was conducted on a like-for-like basis, taking
into account region, occupation, gender, job tenure and organisational size found that the
average public sector worker was paid 3% less than a private sector worker in 20196 and
had been earning less in terms of gross pay (including overtime and bonus pay) every year
since 2014.
Public sector workers only earn more than comparable private sector workers when
pensions are added to the comparison, because of the private sector’s widespread
abandonment of defined benefit schemes.
Before public sector average earnings growth dropped well below the private sector rate in
2013, average earnings growth rates were also often used as a basis to argue that the public
sector continues to see improvements in pay that are not matched by the private sector and
particularly as a basis for attacking pay progression.
The flaw in these arguments is that the use of average earnings growth for comparisons
does not simply reflect changes due to pay settlements and pay progression.
Changes in the average are affected by a multitude of factors that affect the composition of
the public and private workforce. Any changes that swell the lower paid end of the workforce
and/or reduce the proportion of higher paid employees, such as differences between the
sectors in recruiting staff on part time or zero hours contracts, or redundancies that hit the
most recent recruits hardest, will act as a downward pressure on the average.
The government’s drive toward greater outsourcing in itself tends to lower private sector
average earnings growth and raise public sector growth because of the marked tendency for
outsourcing to focus on lower paid sections of the workforce.
Therefore, average earnings growth does not offer any kind of sound basis for judging actual
changes in the pay packet of a worker in the public or private sector. Pay settlement data
forms a much sounder basis for comparison as it eradicates the differences in workforce
composition that affects average earnings growth comparisons.
6 ONS, Public and Private Sector Earnings 2019, September 2020
Bargaining on annual pay rises Last updated: September 2021 Contact: [email protected] 15
Wider context to consider referencing in pay claims
Labour market
The general pattern across the economy during the pandemic has of course been one of
escalating unemployment and falling vacancies, but these trends have shown signs of
abating this year, so raising recruitment and retention pressures on employers.
The unemployment rate had been in decline from a peak of 8.5% in 2011 to 3.8% (the
lowest level for 44 years) by September 2019, but the impact of the pandemic saw that
figure rise to 4.6% in the three months to July 2021.
Forecasts now put the average unemployment rate at 5% over 2021 and 2022, before the
rate gradually moves back toward the 4% level in subsequent years7.
However, the Office for National Statistics indicates that the vacancy rate across the
economy had bounced back to 3.4% by August 2021, taking the level higher than before
pandemic measures hit the economy and putting the total number of vacancies at over a
million for the first time since records began.
The number of unemployed people per vacancy fell from 5.8 in 2011 to 1.6 by September
2019, before the pandemic lifted the figure back up to 3.5 by mid 2020. However, recovery
has seen the numbers competing for a job drop back to 1.6 again by July 2021.
Sector analysis shows that human health and social work retains one of the highest vacancy
rates across the economy at 4.1%, while the other sectors most closely aligned with
UNISON membership show rates of 2.1% for public administration, 2.2% for education, 4.2%
for electricity and gas and 3.2% for water supply.8
The acute issues that have been facing the “health and social work” category are also
reflected in pre-pandemic publications showing that the adult social care sector has a
vacancy rate of 7% and a turnover rate of 30%,9 while the NHS displays one of the highest
vacancy rates in the country at 8.5%.
Data gathered on turnover and / or vacancy rates within an employer can be contrasted
within these wider rates to illustrate a particular recruitment and retention problem. For more
detailed figures on sector turnover rates, contact Bargaining Support on [email protected].
7 HM Treasury, Forecasts for the UK Economy, August 2021 8 Office for National Statistics, Labour Market Overview, September 2021 9 Skills for Care, The State of the Adult Social Care Workforce in England, September 2020
Bargaining on annual pay rises Last updated: September 2021 Contact: [email protected] 16
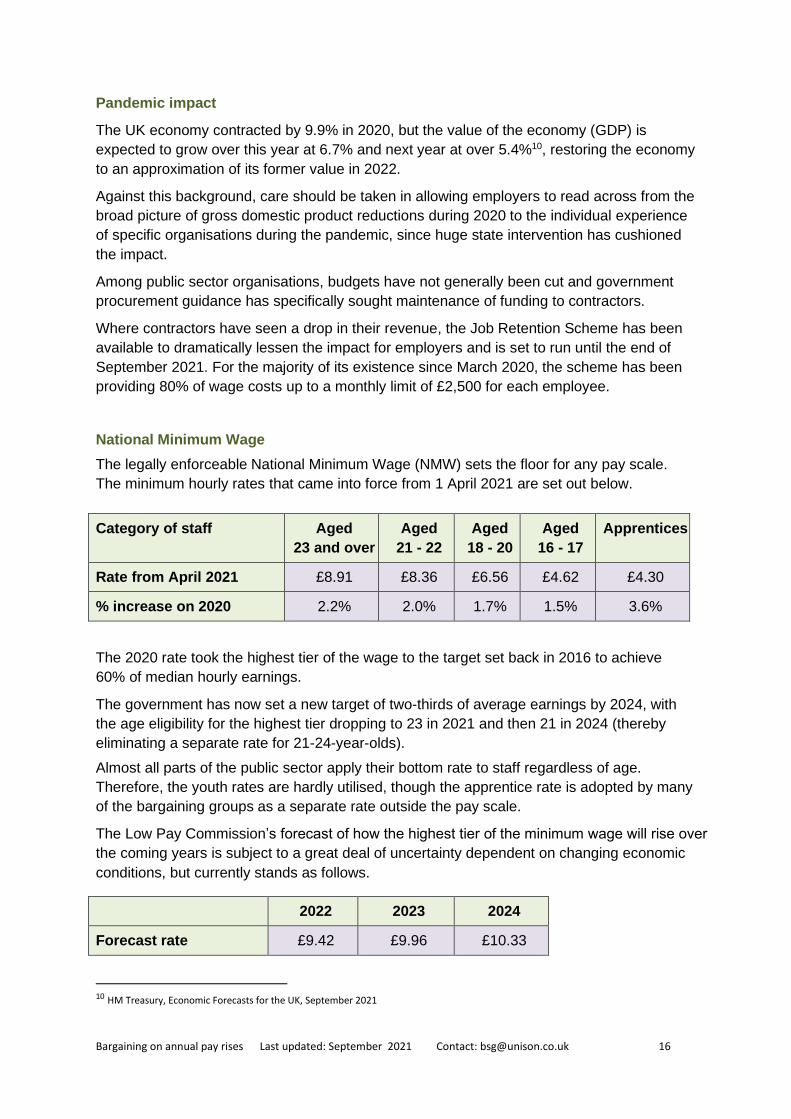
Pandemic impact
The UK economy contracted by 9.9% in 2020, but the value of the economy (GDP) is
expected to grow over this year at 6.7% and next year at over 5.4%10, restoring the economy
to an approximation of its former value in 2022.
Against this background, care should be taken in allowing employers to read across from the
broad picture of gross domestic product reductions during 2020 to the individual experience
of specific organisations during the pandemic, since huge state intervention has cushioned
the impact.
Among public sector organisations, budgets have not generally been cut and government
procurement guidance has specifically sought maintenance of funding to contractors.
Where contractors have seen a drop in their revenue, the Job Retention Scheme has been
available to dramatically lessen the impact for employers and is set to run until the end of
September 2021. For the majority of its existence since March 2020, the scheme has been
providing 80% of wage costs up to a monthly limit of £2,500 for each employee.
National Minimum Wage
The legally enforceable National Minimum Wage (NMW) sets the floor for any pay scale.
The minimum hourly rates that came into force from 1 April 2021 are set out below.
Category of staff Aged
23 and over
Aged
21 - 22
Aged
18 - 20
Aged
16 - 17
Apprentices
Rate from April 2021 £8.91 £8.36 £6.56 £4.62 £4.30
% increase on 2020 2.2% 2.0% 1.7% 1.5% 3.6%
The 2020 rate took the highest tier of the wage to the target set back in 2016 to achieve
60% of median hourly earnings.
The government has now set a new target of two-thirds of average earnings by 2024, with
the age eligibility for the highest tier dropping to 23 in 2021 and then 21 in 2024 (thereby
eliminating a separate rate for 21-24-year-olds).
Almost all parts of the public sector apply their bottom rate to staff regardless of age.
Therefore, the youth rates are hardly utilised, though the apprentice rate is adopted by many
of the bargaining groups as a separate rate outside the pay scale.
The Low Pay Commission’s forecast of how the highest tier of the minimum wage will rise over
the coming years is subject to a great deal of uncertainty dependent on changing economic
conditions, but currently stands as follows.
2022 2023 2024
Forecast rate £9.42 £9.96 £10.33
10 HM Treasury, Economic Forecasts for the UK, September 2021

Bargaining on annual pay rises Last updated: September 2021 Contact: [email protected] 17
UNISON’s National Minimum Wage guide carries a thorough treatment of the issue and
includes factors to consider within a pay claim, such as cascading increases up the pay scale
and eliminating youth or apprentice rates if the organisation applies them.
Living Wage
UNISON policy is to press for the Living Wage as the minimum rate of pay and where that
rate has been achieved to press for a minimum of £10 an hour.
The Living Wage has become a standard benchmark for the minimum needed for low-paid
staff to have a “basic but acceptable” standard of living.
The rates, announced annually by the Living Wage Foundation, are currently £9.50 an hour
outside London and £10.85 an hour in London.
Studies supported by Barclays Bank have shown that Living Wage employers report an
increase in productivity, a reduction in staff turnover / absenteeism rates and improvements
in their public reputation.
Consequently, there are now almost 7.000 employers accredited as Living Wage employers
by the Living Wage Foundation, including some of the largest private companies in the UK,
such as Barclays, HSBC, IKEA and Lidl.
Across the public sector, the Living Wage has made major inroads. Now long-established as
the baseline in Scotland across all public sector organisations, 2019 pay deals took
minimum rates to at least the then prevailing Living Wage in the NHS, local government,
police and probation service, while framework agreements for support staff also set the
Living Wage as the target in more than 12,000 schools across the UK.
Scotland has also made strides in enforcing the wage among contractors, announcing in
April 2020 that it was uprating government funding to enable all adult social care workers to
receive the Living Wage, including payment at the rate for sleepovers.
Pay claims that include a Living Wage element can draw on the greater detail set out in
UNISON’s Living Wage guide on supporting arguments and the bargaining factors to
consider.

Bargaining on annual pay rises Last updated: September 2021 Contact: [email protected] 18
Appendix 1 - Model pay claim
Most UNISON members are covered by national public sector bargaining structures through
which a central pay claim is made on behalf of all staff covered by that bargaining
machinery.
However, pay claims are also necessary where public authorities are able to opt out of
nationally agreed arrangements, where outsourcing has led to delivery of services by private
and community / voluntary and in the utility sectors where private companies predominate.
To assist in developing a pay claim in these circumstances, a general model is set out
below.
Separate model pay claims for local government NJC compliant organisations, non NJC
compliant local authorities and non NJC academies are available on the links below
• NJC Compliant Organisations
• Non NJC Local Authorities
• Non NJC Academies
In the case of NHS contractors, a thorough set of materials, including a model pay claim and
model letters, are available on this link:
• unison.org.uk/oneteamus2
Bargaining on annual pay rises Last updated: September 2021 Contact: [email protected] 19
PAY CLAIM FOR [INSERT YEAR]
SUBMITTED BY UNISON TO [NAME OF ORGANISATION]
1. INTRODUCTION
This pay claim is submitted by UNISON on behalf of staff working for [organisation].
The claim is set at a level that we believe recognises the following key points:
• Substantial increases in the cost of living over recent years have significantly
reduced the value of staff wages;
• Appropriate reward is needed to sustain the morale and productivity of staff in
their crucial role of delivering high quality services;
• Appropriate reward is needed for the increased workload and stress placed
on staff against a background of unprecedented changes in working
practices;
• Average pay settlements across the economy have been running ahead of
those received by [organisation] staff over recent years, increasing the
likelihood of recruitment and retention problems in the long term;
• Nobody should be paid less than the nationally recognised Living Wage rate,
which has become a benchmark for the minimum level of decent pay across
the UK and is now paid by large sections of the public services and many
major private companies.
2. SUMMARY OF CLAIM
We are seeking:
• A [__%] increase on all salary points and allowances [If you are seeking an
increase in line with a related public sector bargaining group, contact
the Bargaining Support Group at [email protected] for the latest
figures]
• An additional increase in rates for staff at the bottom of the pay scale to bring
their pay up to the level of the Living Wage.
• [Any other additions to payments or improvement to conditions –
UNISON guides on typical additional components, such as unsocial
hours payments, reductions in hours, additional leave or workload
controls can be found on the bargaining guides web page. This page
also carries guidance on locational pay supplements and sets out
arguments for their defence if employers attack supplements because
of increased post-pandemic homeworking arrangements]
Bargaining on annual pay rises Last updated: September 2021 Contact: [email protected] 20
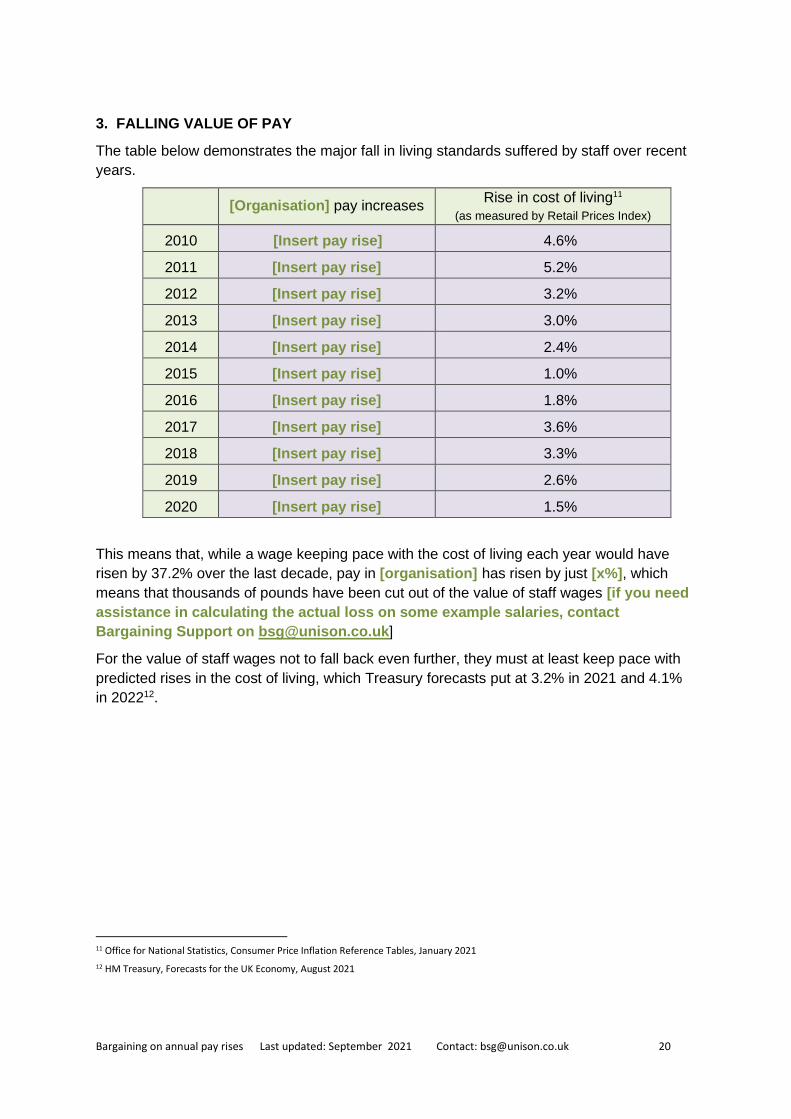
3. FALLING VALUE OF PAY
The table below demonstrates the major fall in living standards suffered by staff over recent
years.
[Organisation] pay increases
Rise in cost of living11
(as measured by Retail Prices Index)
2010 [Insert pay rise] 4.6%
2011 [Insert pay rise] 5.2%
2012 [Insert pay rise] 3.2%
2013 [Insert pay rise] 3.0%
2014 [Insert pay rise] 2.4%
2015 [Insert pay rise] 1.0%
2016 [Insert pay rise] 1.8%
2017 [Insert pay rise] 3.6%
2018 [Insert pay rise] 3.3%
2019 [Insert pay rise] 2.6%
2020 [Insert pay rise] 1.5%
This means that, while a wage keeping pace with the cost of living each year would have
risen by 37.2% over the last decade, pay in [organisation] has risen by just [x%], which
means that thousands of pounds have been cut out of the value of staff wages [if you need
assistance in calculating the actual loss on some example salaries, contact
Bargaining Support on [email protected]]
For the value of staff wages not to fall back even further, they must at least keep pace with
predicted rises in the cost of living, which Treasury forecasts put at 3.2% in 2021 and 4.1%
in 202212.
11 Office for National Statistics, Consumer Price Inflation Reference Tables, January 2021
12 HM Treasury, Forecasts for the UK Economy, August 2021

Bargaining on annual pay rises Last updated: September 2021 Contact: [email protected] 21
4. FALLING BEHIND AVERAGE PAY RATES
The ability of [organisation] to attract and retain staff in the long term will be damaged if the
pay of its staff falls behind the going rate in the labour market.
The table below shows that pay settlements over the last year across the economy have
been running at 2%, which stands in contrast to the most recent [organisation] settlement
of [x%].
[Contact Bargaining Support at [email protected] for further data if you want to
make a comparison with a more specific sector or organisations within a sector]
The table below shows that pay settlements have not only been running behind economy
averages this year, [organisation]’s pay rates have been growing steadily more
uncompetitive over a sustained period.
Year Average pay settlements [Organisation] pay increases
2010 2.0% [Insert pay rise]
2011 2.5% [Insert pay rise]
2012 2.5% [Insert pay rise]
2013 2.5% [Insert pay rise]
2014 2.5% [Insert pay rise]
2015 2.2% [Insert pay rise]
2016 2.0% [Insert pay rise]
2017 2.0% [Insert pay rise]
2018 2.5% [Insert pay rise]
2019 2.5% [Insert pay rise]
2020 2.3% [Insert pay rise]
[For more detailed averages by sector, contact Bargaining Support at
The Bank of England expects pay settlements to average 2.2% in the private sector over
202113, putting [organisation] at a disadvantage in the recruitment and retention of staff if it
fails to match general rates.
13 Bank of England, Monetary Policy Report, February 2021
Sector Average pay settlements
Whole economy 2%
Private sector 2%
Public sector 1%
Not for profit 1.25% Source: Labour Research Department, settlements year to August 2021
Bargaining on annual pay rises Last updated: September 2021 Contact: [email protected] 22
5. LIVING WAGE BECOMING STANDARD MINIMUM PAY BENCHMARK
The Living Wage has become a standard benchmark for the minimum needed for low-paid
staff to have a “basic but acceptable” standard of living.
[Organisation] is now competing in a labour market where the Living Wage of £9.50 an
hour outside London and £10.85 an hour in London has become an increasingly common
minimum point in the pay scale.
Studies supported by Barclays Bank have shown that Living Wage employers report an
increase in productivity, a reduction in staff turnover / absenteeism rates and improvements
in their public reputation.
Consequently, there are now almost 7,000 employers accredited as Living Wage employers
by the Living Wage Foundation, including some of the largest private companies in the UK,
such as Barclays, HSBC, IKEA and Lidl.
Across the public sector, minimum rates at or above the Living Wage have been established
over recent years for all staff covered by NJC Local Government, NHS Agenda for Change
in Britain, all Scotland’s public sector organisations, Further Education colleges in Wales and
all UK universities (for staff on a 35-hour week). Support staff in more than 12,000 schools
across the UK are also set to be paid the Living Wage as a result of national agreements.
[A listing of accredited Living Wage employers is published here and may be useful
for developing a list of organisations that can put pressure on the employer by
showing local or sectoral employers that are already paying the wage]
[For more detailed guidance if you wish to expand on arguments for the Living Wage,
see the UNISON guide here – this includes further material on the damaging impact
for employers of low pay, dispelling confusion with the government’s “national living
wage” and cascading benefits up the pay scale].

Bargaining on annual pay rises Last updated: September 2021 Contact: [email protected] 23
6. RECRUITMENT AND RETENTION PRESSURES BUILDING
[Following the economic downturn triggered by the pandemic, recruitment and
retention pressures are now beginning to reassert themselves on employers.
Therefore, if you can obtain figures for the organisation showing an increase in the
vacancy rate (the number of vacant posts divided by the total number of posts in the
organisation) or figures that are markedly worse than the 3,4% vacancy rate across
the economy, set them out here.
Median turnover rates are estimated at 14.4% across the economy14, so if you have
figures on turnover rates (calculated by taking the total number of leavers in a
specified period - usually 12 months - and expressing the number as a percentage of
the number of people employed during that period) that indicate the organisation is
suffering higher than average turnover, insert them here. [For information on turnover
rates in specific sectors, contact Bargaining Support at [email protected]]
7. MORALE UNDER THREAT
Working against a background of tight budgets and the unprecedented demands of the
Covid-19 pandemic, staff have been facing greater workload pressures. The resulting
increased stress puts the morale of the workforce at risk and poses a long-term threat to
[organisation’s] ability to provide a consistent quality of service.
[Set out any evidence you can gather on the following factors
• Increasing demands on the service;
• Reductions in staffing;
• Staff feeling greater stress;
• Staff suffering falling morale;
• The impact of these pressures showing themselves in rising sickness absence,
higher staff turnover or declining service standards
It is in this area that a short survey of staff may provide the most valuable material to
support the evidence. An amendable basic pay survey is set out in appendix 5 below]
14 XpertHR, Labour turnover rates 2020
Bargaining on annual pay rises Last updated: September 2021 Contact: [email protected] 24
8. AFFORDABILITY
The affordability of this claim is clear from the latest [organisation] accounts, which show a
surplus of [£_] for 2020/21, which is equivalent to a surplus of [£_] for each employee.
Against this figure, the accounts suggest that a [x%] pay rise will cost [£_].
We also note the affordability of an [x%] pay rise for the chief executive, taking [his/her]
total remuneration to [£_]
[For the accounts of a private or community / voluntary organisation or assistance in
interpreting accounts, contact Bargaining Support at [email protected]]
9. CONCLUSION
There can be no doubt that all [organisation] staff have seen the value of their earnings fall
considerably over recent years and evidence suggests that they are also falling behind pay
settlements for comparable jobs.
Combined with these developments, the last year has seen intensified pressures placed on
staff against the unprecedented background of the Covid-19 pandemic.
Staff have had to adapt to new ways of working during the pandemic, placing significantly
increased stresses on all staff. Many staff have also faced the pressure of juggling their
workload with extra demands in their private life, particularly where they have been caring for
children or elderly relatives.
Nonetheless, the dedication of staff over the pandemic has enabled [organisation] to
maintain and adapt its services throughout this unprecedented period.
Therefore, this pay claim represents a very reasonable estimate of the reward staff deserve
for their dedication, skill and hard work and the minimum improvement in pay needed to
maintain workforce morale for delivering consistently high-quality services.

Bargaining on annual pay rises Last updated: September 2021 Contact: [email protected] 25
Appendix 2 – Merits of percentage and flat-rate pay claims
Pay settlements can take the form of a percentage increase or a flat-rate increase. In making
a judgement about whether to pursue a pay claim on a percentage or flat rate basis,
branches should consider the following factors.
A percentage increase to salary can be viewed as fairer in the sense that all workers receive
the same proportionate uplift in their pay packet. However, the cash value of that increase
will be greater for higher paid staff than low paid staff.
For instance, a 1% pay rise for a worker on £20,000 a year translates into £200. A 1%
increase for a worker on £40,000 translates into £400.
In contrast, agreeing a flat rate increase ensures that all staff receive the same cash uplift in
wages, but that will mean a greater percentage for lower-paid workers than higher paid
workers.
For instance, a £400 flat rate rise for a worker on £20,000 translates into a 2% increase. A
£400 increase for a worker on £40,000 translates into a 1% increase.
In short, flat rate pay rises are more advantageous to lower paid workers than higher paid
workers.
However, the other major consideration in evaluating these options is their effect on the pay
scale as a whole and the differences in pay between jobs. This is particularly important if the
pay structure has been established on the basis of a proper job evaluation procedure that
seeks to recognise the different demands of job roles in the corresponding salary. Flat rate
increases maintain the same cash value between jobs of differing demands and
responsibilities, but reduce the percentage difference between them.
For instance, if a worker is on a salary of £20,000 and a supervisor on a salary of £30,000, a
worker stepping up to a supervisor role would receive a 50% increase in their wage. If
successive flat rate increases changed the pay structure so that a worker is on a salary of
£30,000 and a supervisor on a salary of £40,000, stepping up would mean a 33% increase
in their wage.
Settlements can often be based on a compromise between the percentage and flat rate. For
instance, a flat rate is applied to a number of lower pay bands below a set pay threshold
(e.g. all staff that earn less than £25,000), while a percentage applies to any staff above the
threshold. The flat rate will normally be set at a level that delivers a higher percentage
increase for lower paid staff than that for staff above the threshold. However, the percentage
increase also ensures that pay rises at the top of the scale do not dwindle to a negligible
percentage of salary.

Bargaining on annual pay rises Last updated: September 2021 Contact: [email protected] 26
Appendix 3 - Strengthening claims through a staff survey
The model agreement above provides a framework for a claim that draws on broad national
or sectoral information to make a case. However, to tailor the claim effectively to a particular
employer, the most valuable information can often be drawn from members themselves.
Therefore, consider conducting a short survey to identify the key pay related concerns of
members and generate data, quotes or examples that are likely to influence the employer.
However, surveys can entail some notable pitfalls that can be addressed by observing the
following points:
• Start planning the survey in good time to develop the questions, allow a two or three
week period for responses and sufficient time for result analysis before incorporating
within the claim and lodging the claim at the appropriate point in the annual pay
negotiation cycle.
• Try to keep the survey short so that it is not overly demanding on staff time and they
are more likely to complete it. As a rough guide, it should take between five and 10
minutes to complete, which means between 10 and 30 questions.
• Requiring answers that are specific reduces the time necessary for analysis. For
example, if asking “How would you describe morale?”, requiring responses of High,
Moderate or Low will enable you to quickly establish from the results that, for
instance, 64% of staff see morale as low. If the answer is left open, responses will
have to be analysed one by one to place them in categories and provide usable
percentages for a claim.
• However, there can be a place for open-ended questions as they can generate
quotes and examples of value to a claim. For instance, supplementing a survey with
a question such as “In what way has your experience of work changed over the last
year?” may give you a telling quote that makes a point more effectively than a page
of percentages.
• Profile questions can be considered at the end of surveys to enable the results to be
broken down according to certain categories. You may want to assess the differing
experiences of pay for different parts of the workforce, by breaking down responses
by factors such as department, occupation, part-time/full-time status, income band,
disability, gender, age or ethnicity.
• Ensure that the survey carries a preamble that emphasises to members that the
survey is completely anonymous, makes plain the purpose for which the gathered
data will be used and tells them approximately how long the survey will take to
complete.
• Always make sure that the data you submit to the employer protects your members’
identities.
• The best method for protecting confidentiality and for reducing the time necessary to
analyse results is to conduct an online survey. The recommended online survey
service is set out below. However, if the survey is sent out to email addresses, care
has to be taken that this is compliant with the General Data Protection Regulations.
Distribution should take place through UNISON’s WARMS system (Web Access
Bargaining on annual pay rises Last updated: September 2021 Contact: [email protected] 27
RMS), to ensure that the emails used for members are those that that they have
provided for such purposes to the union.
• Consider alternative ways to gain the benefits of an online survey without the
restrictions of email distribution. For instance, you could place the survey link on
social media if you are confident that it would be accessed by sufficient staff without
notifying emails. Alternatively, you could seek to develop a joint pay survey with the
employer (if that did not mean too many compromises on questions asked), which
the employer could then distribute to staff.
• If you decide on manually distributing a hard copy survey, ensure that the survey can
be returned as confidentially as possible. Like the examples above which do not rely
on union email distribution lists, the advantage to this method is that it can go wider
than UNISON membership if agreed with any other unions representing staff. In this
way, it may both gather a wider section of staff views that carries more weight with
the employer and assist in recruiting members by highlighting the role of the union in
advancing staff terms and conditions.
Online survey providers
SurveyMonkey is one of the most widely used online survey services but UNISON now
recommends SurveyGizmo as it has EU servers and therefore complies with EU data
protection law, whereas SurveyMonkey servers are US based.
SurveyGizmo offer various different packages, but UNISON recommends the standard
version of SurveyGizmo, as it fulfils the required data protection and anonymity features.
Branches must set up their own online surveys and cannot use regional SurveyGizmo
accounts. We realise that at around £700 for the year SurveyGizmo may seem expensive,
but branches can use it for unlimited surveys including branch mapping surveys,
consultations and member questionnaires throughout the year.
It is possible to sign up for SurveyGizmo here: https://www.surveygizmo.eu
[Please make sure that you use the .eu address and not the .com address so that it is EU
based]
SurveyGizmo’s instructions on sending out survey invitations to email addresses are here:
https://help.surveygizmo.com/help/share-survey-via-email
Its instructions on how to make voting anonymous are here:
https://help.surveygizmo.com/help/anonymous-surveys
For every SurveyGizmo account that contains UNISON member data, a branch elected
official should notify their Regional Head.

Bargaining on annual pay rises Last updated: September 2021 Contact: [email protected] 28
UNISON SURVEY
UNISON [branch name] is currently assembling a pay claim to put to [employer’s name] for
the annual pay rise from [insert date]. In order to ensure this claim is firmly based on your
experiences and views, we would greatly appreciate it if you could spare the time to complete
this survey.
The survey covers just 10 questions and would normally take less than five minutes to
complete. All responses to this questionnaire are anonymous and will be treated as
confidential. It will not be possible to identify any individual from information used for the claim.
PAY
1. Compared to 12 months ago, how do you feel your pay has changed relative to the cost of living? I am better off
I am worse off
Neither better nor worse off
2. Are you dependent on any of the following additional payments to sustain your standard of living? Unsocial hours
On-call / stand-by
Overtime
Second job
Other - please specify here
Bargaining on annual pay rises Last updated: September 2021 Contact: [email protected] 29
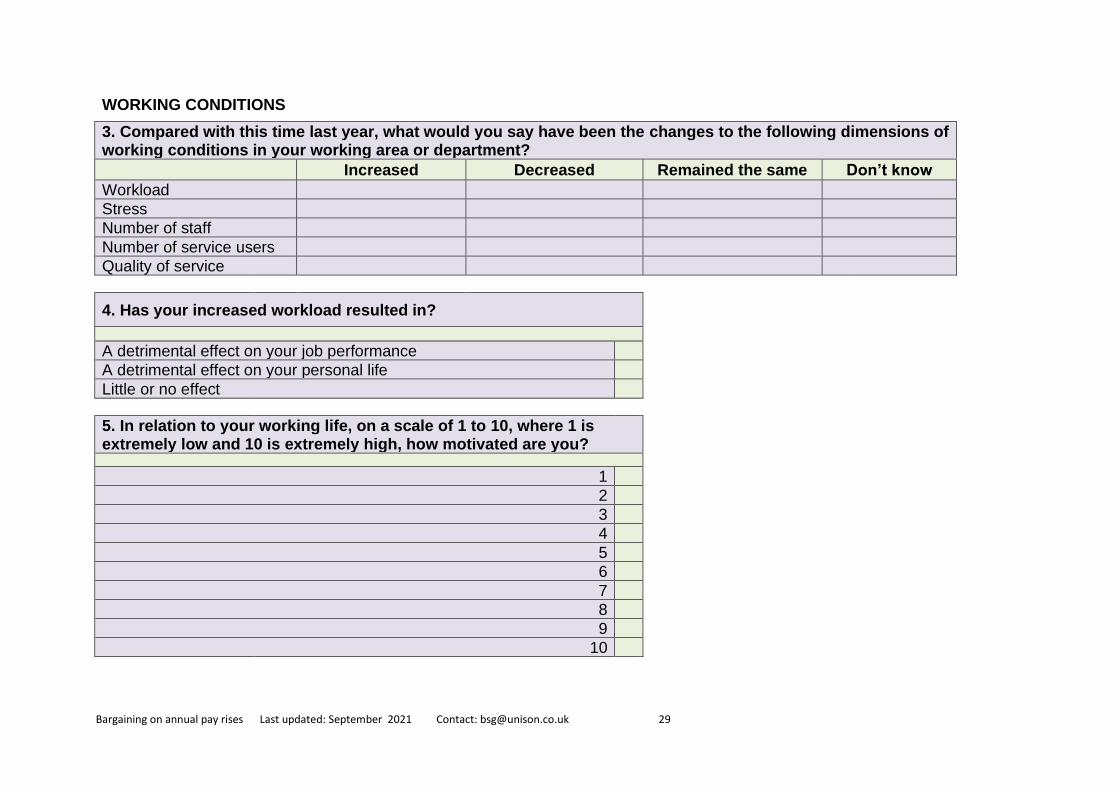
WORKING CONDITIONS
3. Compared with this time last year, what would you say have been the changes to the following dimensions of working conditions in your working area or department? Increased Decreased Remained the same Don’t know Workload
Stress
Number of staff
Number of service users
Quality of service
4. Has your increased workload resulted in?
A detrimental effect on your job performance
A detrimental effect on your personal life
Little or no effect
5. In relation to your working life, on a scale of 1 to 10, where 1 is extremely low and 10 is extremely high, how motivated are you?
1
2
3
4
5
6
7
8
9
10
Bargaining on annual pay rises Last updated: September 2021 Contact: [email protected] 30
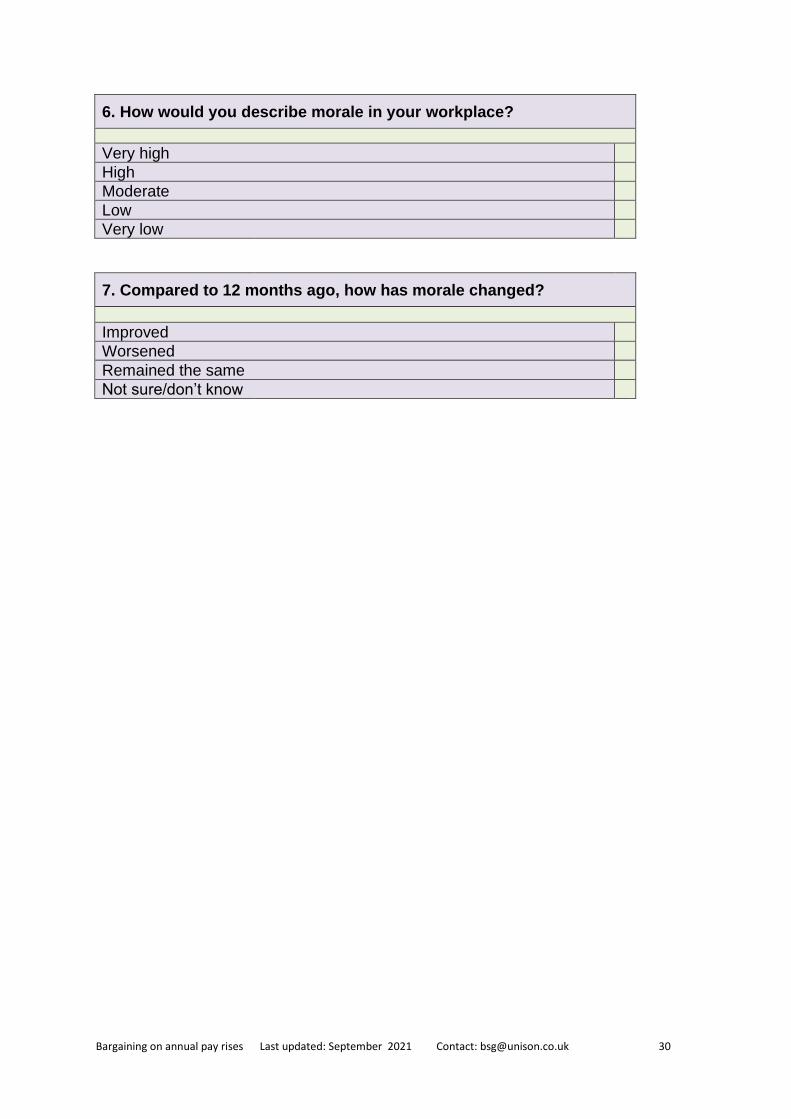
6. How would you describe morale in your workplace?
Very high
High
Moderate
Low
Very low
7. Compared to 12 months ago, how has morale changed?
Improved
Worsened
Remained the same
Not sure/don’t know
Bargaining on annual pay rises Last updated: September 2021 Contact: [email protected] 31
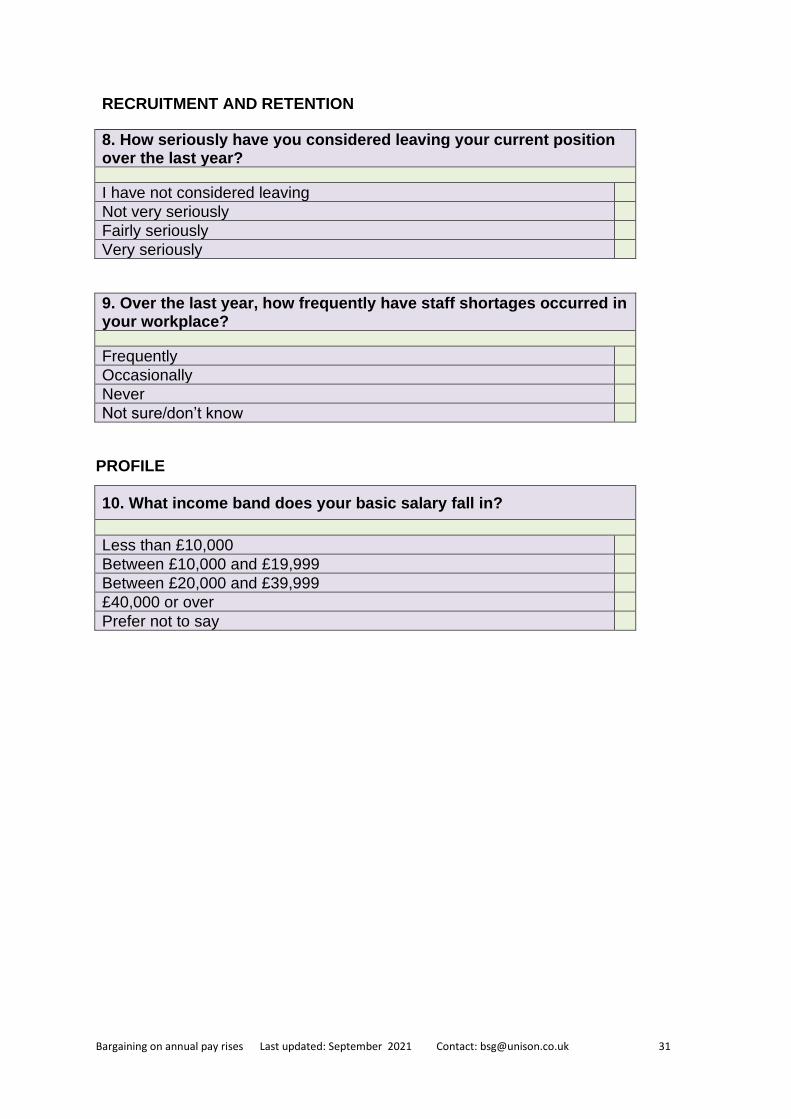
RECRUITMENT AND RETENTION
8. How seriously have you considered leaving your current position over the last year?
I have not considered leaving
Not very seriously
Fairly seriously
Very seriously
9. Over the last year, how frequently have staff shortages occurred in your workplace?
Frequently
Occasionally
Never
Not sure/don’t know
PROFILE
10. What income band does your basic salary fall in?
Less than £10,000
Between £10,000 and £19,999
Between £20,000 and £39,999
£40,000 or over
Prefer not to say