Barclays PLC Pillar 3 · 2020-06-06 · Summary Barclays PLC 2 KM1 - Key Metrics As at As at As at...
14
Barclays PLC Pillar 3 31 March 2020
Transcript of Barclays PLC Pillar 3 · 2020-06-06 · Summary Barclays PLC 2 KM1 - Key Metrics As at As at As at...

Barclays PLC
Pillar 3
31 March 2020

Table of Contents
Barclays PLC 1
Pillar 3 Page
Summary
- KM1 - Key Metrics 2
- IFRS 9 Introduction 3
- IFRS 9-FL: Comparison of with and without the IFRS9 transitional arrangements 4
Risk Weighted Assets
- Risk weighted assets (RWAs) by risk type and business 5
- Movement analysis of RWAs 5
- CR8 - RWA flow statement of credit risk exposures under the advanced IRB approach 6
- CCR7 - RWA flow statement of counterparty credit risk exposures under the IMM 7
- MR2-B - RWA flow statement of market risk exposures under the IMA 7
- OV1 - Overview of risk weighted assets and capital requirements 8
Leverage
- Leverage Introduction 9
- Summary reconciliation of accounting assets and leverage ratio exposures 9
- Leverage ratio common disclosure 10
Minimum requirement for own funds and eligible liabilities(MREL)
- MREL Introduction 11
- KM2 - Key metrics – TLAC requirements (at resolution group level) 11
Liquidity
- Liquidity coverage ratio (period end) 12
- LIQ1 – Liquidity coverage ratio (average) 12
Notes
- Forward-looking statement 13

Summary
Barclays PLC 2
KM1 - Key Metrics As at As at As at As at As at
31.03.20 31.12.19 30.09.19 30.06.19 31.03.19
£m £m £m £m £m Available capital (amounts)
1 Common Equity Tier 1 (CET1)1 42,518 40,813 41,875 42,888 41,437
1a Fully loaded Expected Credit Loss (ECL) accounting model2 41,303 39,687 40,742 41,704 40,268
2 Tier 13 54,012 52,241 53,366 55,592 54,724
2a Fully loaded ECL accounting model Tier 14 52,044 50,428 51,472 53,697 51,257
3 Total capital3 66,394 63,641 66,095 68,330 66,549
3a Fully loaded ECL accounting model total capital4 63,145 60,294 62,434 64,681 63,485
Risk-weighted assets (amounts)
4 Total risk-weighted assets (RWA)1 325,631 295,131 313,261 319,107 319,671
4a Fully loaded ECL accounting model total risk-weighted assets (RWA)2 325,536 295,016 313,147 318,993 319,556
Risk-based capital ratios as a percentage of RWA
5 Common Equity Tier 1 ratio (%) 13.1% 13.8% 13.4% 13.4% 13.0%
5a Fully loaded ECL accounting model Common Equity Tier 1 (%) 12.7% 13.5% 13.0% 13.1% 12.6%
6 Tier 1 ratio (%) 16.6% 17.7% 17.0% 17.4% 17.1%
6a Fully loaded ECL accounting model Tier 1 ratio (%) 16.0% 17.1% 16.4% 16.8% 16.0%
7 Total capital ratio (%) 20.4% 21.6% 21.1% 21.4% 20.8%
7a Fully loaded ECL accounting model total capital ratio (%) 19.4% 20.4% 19.9% 20.3% 19.9%
Additional CET1 buffer requirements as a percentage of RWA
8 Capital conservation buffer requirement (%) 2.5% 2.5% 2.5% 2.5% 2.5%
9 Countercyclical buffer requirement (%) 0.0% 0.6% 0.5% 0.5% 0.5%
10 Bank G-SIB and/or D-SIB additional requirements (%) 1.5% 1.5% 1.5% 1.5% 1.5%
11 Total of bank CET1 specific buffer requirements (%) (row 8 + 9 + 10) 4.0% 4.6% 4.5% 4.5% 4.5%
12 CET1 available after meeting the bank’s minimum capital
requirements (%) 8.6% 9.3% 8.9% 8.9% 8.5%
CRR leverage ratio5, 6
13 Total CRR leverage ratio exposure measure 1,326,549 1,126,259 1,235,079 1,213,800 1,205,303
14 Fully loaded CRR leverage ratio (%) 3.9% 4.5% 4.2% 4.4% 4.3%
Average UK leverage ratio (Transitional)7,8,9
13a Total average UK leverage ratio exposure measure 1,176,198 1,142,819 1,171,152 1,134,589 1,105,518
14a Transitional average UK leverage ratio (%) 4.5% 4.5% 4.6% 4.7% 4.6%
UK leverage ratio (Transitional)6,7,8
13b Total UK leverage ratio exposure measure 1,178,708 1,007,721 1,099,815 1,079,416 1,064,959
14b Transitional UK leverage ratio (%) 4.5% 5.1% 4.8% 5.1% 4.9%
Liquidity Coverage Ratio
15 Total HQLA 232,296 206,448 225,556 232,098 225,850
16 Total net cash outflows 149,946 128,901 148,895 148,669 141,515
17 LCR ratio (%) 155% 160% 151% 156% 160%
Notes:
1 CET1 capital and RWAs are calculated applying the IFRS9 transitional arrangements of the CRR as amended by CRR II applicable as at the reporting date.
2 Fully loaded CET1 capital and RWAs are calculated without applying the transitional arrangements of the CRR as amended by CRR II applicable as at the
reporting date.
3 Transitional Tier 1 and Total capital include AT1 and T2 capital that is calculated applying the grandfathering of CRR and CRR II non-compliant capital
instruments.
4 Fully loaded Tier 1 and Total capital include AT1 and T2 capital that is calculated without applying the grandfathering of CRR and CRR II non-compliant
capital instruments.
5 Fully loaded CRR leverage ratio is calculated without applying the transitional arrangements of the CRR as amended by CRR II applicable as at the
reporting date.
6 The difference between CRR leverage ratio and UK leverage ratio is primarily driven by the exclusion of qualifying central bank claims from the UK
leverage exposure.
7 Transitional UK leverage ratios are calculated applying the IFRS 9 transitional arrangements and in line with the PRA Handbook.
8 Fully loaded average UK leverage ratio was 4.4%, with £1,175bn of leverage exposure. Fully loaded UK leverage ratio was 4.4%, with £1,177bn of
leverage exposure. Fully loaded UK leverage ratios are calculated without applying the transitional arrangements of the PRA Handbook.
9 Average UK leverage ratio uses capital based on the last day of each month in the quarter and an exposure measure for each day in the quarter.
The CET1 ratio decreased to 13.1% (December 2019: 13.8%)
CET1 capital increased by £1.7bn to £42.5bn driven by £0.9bn of profits, net of credit impairment charges not subject to IFRS 9
transitional capital relief, an increase in the currency translation reserve of £1.0bn (mainly driven by the appreciation of period end USD
against GBP), and £1.0bn following the cancellation of the full year 2019 dividend. These increases were partially offset by a decrease
of £0.8bn in the fair value through other comprehensive income reserve driven by a decrease in the Absa Group Limited share price and
appreciation of period end GBP against ZAR
RWAs increased by £30.5bn to £325.6bn primarily driven by an increase in client activity within CIB (including drawdowns on
facilities) and higher market volatility as well as the appreciation of period end USD against GBP

Capital
Barclays PLC 3
IFRS 9 - Transitional capital arrangements
On 1 January 2018, IFRS 9 transitional capital arrangements were implemented by Regulation (EU) 2017/2395. Barclays
elected to apply the transitional arrangements at both consolidated and individual entity levels and will disclose both
transitional and fully loaded CET1 ratios until the end of the transitional period. The transitional benefit is phased out over a
5 year period with 95% applicable for 2018; 85% for 2019; 70% for 2020; 50% for 2021; 25% for 2022 and with no
transitional benefit from 2023.
The transitional arrangements, implemented under a modified static approach, allow for transitional relief on the “day 1”
impact on adoption of IFRS 9 (static element) and for the increase between “day 1” and the reporting date (modified
element), subject to eligibility. For the static element, stage 1, stage 2 and stage 3 provisions are eligible for transition,
whereas for the modified element, stage 3 provisions are excluded.
Separate calculations are performed for standardised and advanced IRB portfolios, reflecting the different ways these
frameworks take account of provisions. Under the standardised approach, increases in provisions for both the static and
modified elements are eligible for transition. Under the advanced approach, for both the static and modified elements,
provisions are only eligible for transitional relief to the extent that they exceed regulatory expected loss.
Any increases in impairment allowances as a result of IFRS 9, net of tax, decreases shareholders’ equity through retained
earnings. This is somewhat mitigated by the transitional relief applied on eligible impairment.
For regulatory Internal Ratings Based (IRB) exposures, the calculation of capital takes account of the expected loss via a
comparison with the impairment allowances. Where regulatory expected losses exceed impairment allowances, the
shortfall is deducted from CET1 capital. Where the impairment allowance is higher than expected loss, the excess is added
back to tier 2 capital and capped at an amount of 0.6% of IRB RWAs.
The DTAs created from the increase of impairment are also accounted for in the CET1 ratio. When DTAs arising from
temporary differences are above the 10% CET1 capital threshold, any excess above the threshold is deducted and those
below the threshold are risk weighted at 250% up to the point they reach threshold.
Standardised RWAs decrease due to the increase in impairment being offset against the Standardised Credit Risk exposures.

Capital
Barclays PLC 4
IFRS9-FL: Comparison of institutions’ own funds and capital and leverage ratios with and
without the application of transitional arrangements for IFRS 9 or analogous ECLs
As at
31.03.20
As at
31.12.19
As at
30.09.19
As at
30.06.19
As at
31.03.19
£m £m £m £m £m
Available capital (amounts)
1 Common Equity Tier 1 (CET1) capital1 42,518 40,813 41,875 42,888 41,437
2 Common Equity Tier 1 (CET1) capital as if IFRS 9 or analogous
ECLs transitional arrangements had not been applied 41,303
39,687
40,742
41,704
40,268
3 Tier 1 capital2 54,012 52,241 53,366 55,592 54,724
4 Tier 1 capital as if IFRS 9 or analogous ECLs transitional
arrangements had not been applied 52,797
51,115
52,233
54,408
53,555
5 Total capital2 66,394 63,641 66,095 68,330 66,549
6 Total capital as if IFRS 9 or analogous ECLs transitional
arrangements had not been applied 65,644
62,628
65,084
67,333
65,548
Risk-weighted assets (amounts) £m £m £m £m £m
7 Total risk-weighted assets1 325,631 295,131 313,261 319,107 319,671
8 Total risk-weighted assets as if IFRS 9 or analogous ECLs
transitional arrangements had not been applied
325,536
295,016
313,147
318,993
319,556
Capital ratios
9 Common Equity Tier 1 (as a percentage of risk exposure
amount) 13.1%
13.8%
13.4%
13.4%
13.0%
10 Common Equity Tier 1 (as a percentage of risk exposure
amount) as if IFRS 9 or analogous ECLs transitional
arrangements had not been applied
12.7%
13.5%
13.0%
13.1%
12.6%
11 Tier 1 (as a percentage of risk exposure amount) 16.6% 17.7% 17.0% 17.4% 17.1%
12 Tier 1 (as a percentage of risk exposure amount) as if IFRS 9
or analogous ECLs transitional arrangements had not been
applied
16.2%
17.3%
16.7%
17.1%
16.8%
13 Total capital (as a percentage of risk exposure amount) 20.4% 21.6% 21.1% 21.4% 20.8%
14 Total capital (as a percentage of risk exposure amount) as if
IFRS 9 or analogous ECLs transitional arrangements had not
been applied
20.2%
21.2%
20.8%
21.1%
20.5%
Leverage ratio £m £m £m £m £m
15 Leverage ratio total exposure measure 1,326,549 1,126,259 1,235,079 1,213,800 1,205,303
16 Leverage ratio3 3.9% 4.5% 4.2% 4.4% 4.3%
17 Leverage ratio as if IFRS 9 or analogous ECLs transitional
arrangements had not been applied 3.9% 4.5% 4.2% 4.4% 4.3%
Notes:
1 Transitional CET1 capital and RWAs are calculated applying the IFRS9 transitional arrangements of the CRR as amended by CRR II applicable as at the
reporting date.
2 Transitional T1 and Total capital are calculated applying the transitional arrangements of the CRR as amended by CRR II applicable as at the reporting
date. This includes the grandfathering of CRR and CRR II non-compliant capital instruments and IFRS 9 transitional arrangements.
3 Leverage ratio is calculated applying the fully loaded treatment of the CRR as amended by CRR II applicable as at the reporting date.

Risk weighted assets
Barclays PLC 5
Risk weighted assets (RWAs) by risk type and business
Credit risk Counterparty credit risk Market risk
Operational
risk
Total
RWAs
Std IRB Std IRB
Settlement
risk CVA Std IMA
As at 31.03.20 £m £m £m £m £m £m £m £m £m £m
Barclays UK 5,835 59,451 311 - - 28 202 - 11,851 77,678
Corporate and Investment Bank 30,620 71,993 15,611 19,756 1,022 3,309 14,036 24,010 21,390 201,747
Consumer, Cards and Payments 25,205 3,085 132 31 - 21 - 151 7,536 36,161
Barclays International 55,825 75,078 15,743 19,787 1,022 3,330 14,036 24,161 28,926 237,908
Head Office 3,706 6,212 - - - - - - 127 10,045
Barclays Group 65,366 140,741 16,054 19,787 1,022 3,358 14,238 24,161 40,904 325,631
As at 31.12.19
Barclays UK 5,189 57,455 235 - - 23 178 - 11,821 74,901
Corporate and Investment Bank 25,749 62,177 12,051 16,875 276 2,470 12,854 17,626 21,475 171,553
Consumer, Cards and Payments 27,209 2,706 92 37 - 11 - 103 7,532 37,690
Barclays International 52,958 64,883 12,143 16,912 276 12,481 12,854 17,728 29,007 209,243
Head Office 5,104 5,754 - - - - - - 129 10,987
Barclays Group 63,251 128,092 12,378 16,912 276 2,504 13,032 17,729 40,957 295,131
Movement analysis of risk weighted assets
Credit Risk
Counterparty
Credit Risk Market Risk Operational Risk Total
£m £m £m £m £m
As at 31.12.19 191,343 32,070 30,761 40,957 295,131
Book size 7,205 8,300 9,977 (53) 25,429
Acquisitions and disposals (33) - - - (33)
Book quality 1,511 (404) - - 1,107
Model updates 887 - - - 887
Methodology and policy 1,166 255 (2,339) - (918)
Foreign exchange movement1 4,028 - - - 4,028
As at 31.03.20 206,107 40,221 38,399 40,904 325,631
Note:
1 Foreign exchange movements do not include foreign exchange for counterparty credit risk or market risk.
RWAs increased £30.5bn to £325.6bn: Book size increased RWAs £25.4bn primarily due to an increase in client activity compared to year-end 2019, including drawdowns
on facilities and higher market volatility
Book quality increased RWAs £1.1bn primarily due to changes in model calibration
Foreign exchange movements increased RWAs £4.0bn due to the appreciation of period end USD against GBP

Risk weighted assets
Barclays PLC 6
CR8 - RWA flow statement of credit exposures under the AIRB approach RWA amount Capital requirements
£m £m
1 As at 31.12.19 128,095 10,248
2 Asset size 7,479 598
3 Asset quality 1,297 104
4 Model updates 888 71
5 Methodology and policy 736 59
6 Acquisitions and disposals (33) (3)
7 Foreign exchange movements 2,279 182
8 Other - -
9 As at 31.03.20 140,741 11,259
Advanced credit risk RWAs increased £12.7bn to £140.8bn driven by: Asset size increased RWAs £7.5bn primarily driven by increased lending activity
Asset quality increased RWAs £1.3bn primarily due to changes in model calibration
Foreign exchange movements increased RWAs £2.3bn primarily due to the appreciation of period end USD against GBP

Risk weighted assets
Barclays PLC 7
CCR7 - RWA flow statement of counterparty credit risk exposures under the IMM
The total shows the contribution of IMM exposures to CCR RWAs (under both standardised and AIRB) and will not directly
reconcile to CCR AIRB RWAs.
RWA amount Capital requirements
£m £m
1 As at 31.12.19 21,872 1,750
2 Asset size 5,344 428
3 Credit quality of counterparties (328) (26)
4 Model updates (IMM only) - -
5 Methodology and policy (IMM only) (38) (3)
6 Acquisitions and disposals - -
7 Foreign exchange movements - -
8 Other - -
9 As at 31.03.20 26,850 2,148
Internal Model Method (IMM) RWAs increased by £5.0bn primarily due to increase in trading activity within modelled derivatives and SFTs.
MR2-B - RWA flow statement of market risk exposures under the IMA
VaR SVaR IRC CRM Other Total RWA
Total Capital
requirements
£m £m £m £m £m £m £m
1 As at 31.12.19 4,120 8,237 3,704 - 1,668 17,729 1,418
2 Movement in risk levels 1,491 5,126 (416) - 3,154 9,355 748
3 Model updates/changes - - - - - - -
4 Methodology and policy (114) (1,474) (369) - (966) (2,923) (233)
5 Acquisitions and disposals - - - - - - -
6 Other - - - - - - -
7 As at 31.03.20 5,497 11,889 2,919 - 3,856 24,161 1,933
Internal Model Approach RWAs increased by £6.5bn primarily due to increase in trading activities and higher market volatility.

Risk weighted assets
Barclays PLC 8
OV1 - Overview of risk weighted assets by risk type and capital requirements
RWA
Minimum capital
requirements
As at
31.03.20
As at
31.12.19
As at
31.03.20
As at
31.12.19
£m £m £m £m
1 Credit risk (excluding CCR) 187,673 174,321 15,014 13,946
2 Of which standardised approach 64,137 60,482 5,131 4,839
3 Of which the foundation IRB (FIRB) approach - - - -
4 Of which the advanced IRB (AIRB) approach 123,536 113,839 9,883 9,107
5
Of which Equity IRB under the Simple risk-weight or the internal models
approach - - - -
6 CCR 38,954 31,630 3,116 2,530
7 Of which mark to market 2,947 1,697 236 136
8 Of which original exposure - - - -
9 Of which standardised approach - - - -
9a Of which financial collateral comprehensive method 5,216 4,723 417 378
10 Of which internal model method 26,605 21,708 2,128 1,736
11 Of which risk exposure amount for contributions to the default fund of a CCP 828 998 66 80
12 Of which CVA 3,358 2,504 269 200
13 Settlement risk 1,022 276 82 22
14 Securitisation exposures in banking book (after cap) 9,445 6,899 756 552
14a Of which capital deduction approach (CAPD) 128 147 10 12
14b Of which look through approach (KIRB) - 76 - 6
15 Of which IRB approach - 2,737 - 219
16 Of which IRB supervisory formula approach (SFA) - - - -
17 Of which internal assessment approach (IAA) - 106 - 8
18 Of which standardised approach - - - -
14c Of which Sec-ERBA 972 161 78 13
14d Of which Sec-IAA 1,711 931 137 74
14e Of which Sec-SA 974 669 78 54
14f Of which Sec-IRBA 5,660 2,072 453 166
19 Market risk 38,399 30,761 3,072 2,461
20 Of which the standardised approach 14,238 13,032 1,139 1,043
21 Of which IMA 24,161 17,729 1,933 1,418
22 Large exposures - - - -
23 Operational risk 40,904 40,957 3,272 3,277
24 Of which basic indicator approach - - - -
25 Of which standardised approach 40,904 40,957 3,272 3,277
26 Of which advanced measurement approach - - - -
27 Amounts below the thresholds for deduction (subject to 250% risk weight) 9,234 10,287 739 823
28 Floor Adjustments - - - -
29 Total 325,631 295,131 26,050 23,611

Leverage
Barclays PLC 9
Leverage ratio and exposure
The following leverage tables show the components of the leverage ratio using the CRR definition for the leverage exposure and the tier 1
capital on a fully loaded basis as at 31 March 2020.1
Summary reconciliation of accounting assets and leverage ratio exposures
This table is a summary of the total leverage exposure and comprises of total IFRS assets used for statutory purposes, regulatory
consolidation and other leverage adjustments.
As at
31.03.20
As at
31.12.19
£m £m
1 Total assets as per published financial statements 1,444,296 1,140,229
2 Adjustment for entities which are consolidated for accounting purposes but are outside the
scope of regulatory consolidation
(4,841) (1,170)
4 Adjustments for derivative financial instruments (233,846) (123,318)
5 Adjustments for securities financing transactions (SFTs) 34,271 18,339
6 Adjustment for off-balance sheet items (i.e. conversion to credit equivalent amounts of off-
balance sheet exposures)
102,499 105,289
EU-6a (Adjustment for intragroup exposures excluded from the leverage ratio exposure measure in
accordance with Article 429 (7) of Regulation (EU) No 575/2013)
- -
7 Other adjustments (15,830) (13,110)
8 Total leverage ratio exposure 1,326,549 1,126,259
Note:
1 Capital and leverage measures are calculated applying CRR as amended by CRR II applicable as at the reporting date.
Leverage
Barclays PLC 10
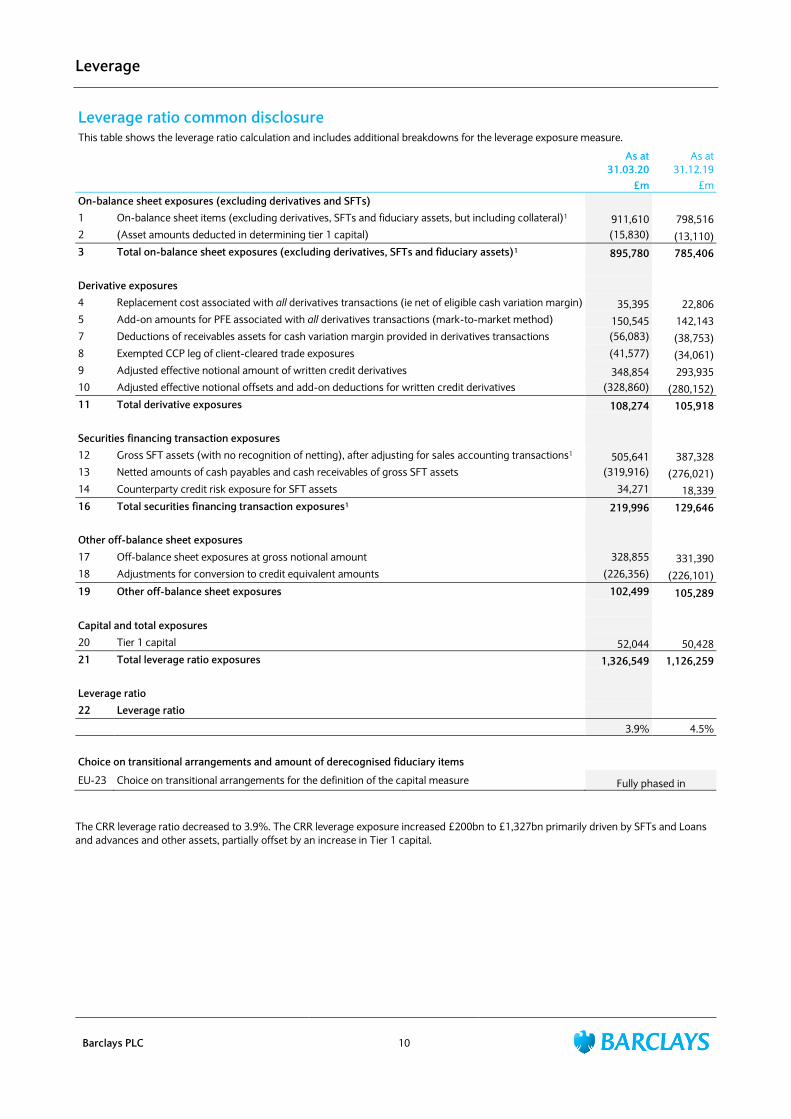
Leverage ratio common disclosure This table shows the leverage ratio calculation and includes additional breakdowns for the leverage exposure measure.
As at
31.03.20
As at
31.12.19
£m £m
On-balance sheet exposures (excluding derivatives and SFTs)
1 On-balance sheet items (excluding derivatives, SFTs and fiduciary assets, but including collateral)1 911,610 798,516
2 (Asset amounts deducted in determining tier 1 capital) (15,830) (13,110)
3 Total on-balance sheet exposures (excluding derivatives, SFTs and fiduciary assets)1 895,780 785,406
Derivative exposures
4 Replacement cost associated with all derivatives transactions (ie net of eligible cash variation margin) 35,395 22,806
5 Add-on amounts for PFE associated with all derivatives transactions (mark-to-market method) 150,545 142,143
7 Deductions of receivables assets for cash variation margin provided in derivatives transactions (56,083) (38,753)
8 Exempted CCP leg of client-cleared trade exposures (41,577) (34,061)
9 Adjusted effective notional amount of written credit derivatives 348,854 293,935
10 Adjusted effective notional offsets and add-on deductions for written credit derivatives (328,860) (280,152)
11 Total derivative exposures 108,274 105,918
Securities financing transaction exposures
12 Gross SFT assets (with no recognition of netting), after adjusting for sales accounting transactions1 505,641 387,328
13 Netted amounts of cash payables and cash receivables of gross SFT assets (319,916) (276,021)
14 Counterparty credit risk exposure for SFT assets 34,271 18,339
16 Total securities financing transaction exposures1 219,996 129,646
Other off-balance sheet exposures
17 Off-balance sheet exposures at gross notional amount 328,855 331,390
18 Adjustments for conversion to credit equivalent amounts (226,356) (226,101)
19 Other off-balance sheet exposures 102,499 105,289
Capital and total exposures
20 Tier 1 capital 52,044 50,428
21 Total leverage ratio exposures 1,326,549 1,126,259
Leverage ratio
22 Leverage ratio
3.9% 4.5%
Choice on transitional arrangements and amount of derecognised fiduciary items
EU-23 Choice on transitional arrangements for the definition of the capital measure Fully phased in
The CRR leverage ratio decreased to 3.9%. The CRR leverage exposure increased £200bn to £1,327bn primarily driven by SFTs and Loans
and advances and other assets, partially offset by an increase in Tier 1 capital.
Minimum requirements for own funds and eligible liabilities
Barclays PLC 11
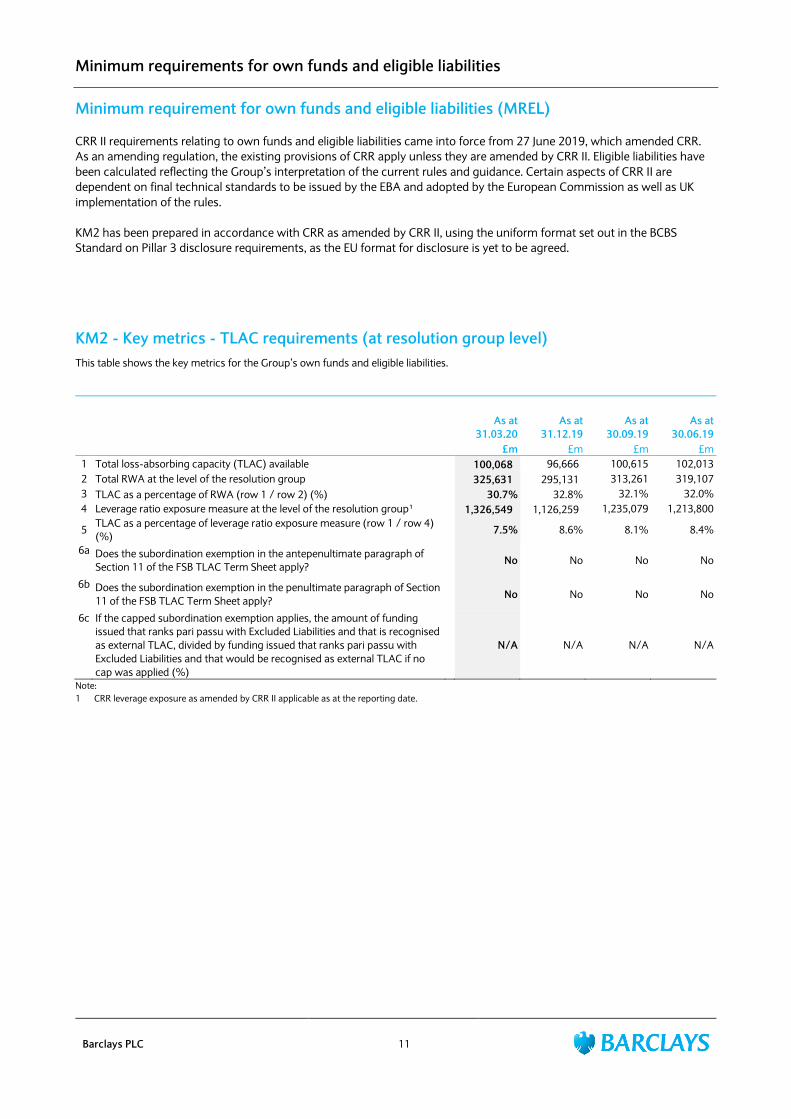
Minimum requirement for own funds and eligible liabilities (MREL)
CRR II requirements relating to own funds and eligible liabilities came into force from 27 June 2019, which amended CRR.
As an amending regulation, the existing provisions of CRR apply unless they are amended by CRR II. Eligible liabilities have
been calculated reflecting the Group’s interpretation of the current rules and guidance. Certain aspects of CRR II are
dependent on final technical standards to be issued by the EBA and adopted by the European Commission as well as UK
implementation of the rules.
KM2 has been prepared in accordance with CRR as amended by CRR II, using the uniform format set out in the BCBS
Standard on Pillar 3 disclosure requirements, as the EU format for disclosure is yet to be agreed.
KM2 - Key metrics - TLAC requirements (at resolution group level)
This table shows the key metrics for the Group’s own funds and eligible liabilities.
As at
31.03.20
As at
31.12.19
As at
30.09.19
As at
30.06.19 £m £m £m £m
1 Total loss-absorbing capacity (TLAC) available 100,068 96,666 100,615 102,013
2 Total RWA at the level of the resolution group 325,631 295,131 313,261 319,107
3 TLAC as a percentage of RWA (row 1 / row 2) (%) 30.7% 32.8% 32.1% 32.0%
4 Leverage ratio exposure measure at the level of the resolution group¹ 1,326,549 1,126,259 1,235,079 1,213,800
5 TLAC as a percentage of leverage ratio exposure measure (row 1 / row 4)
(%) 7.5% 8.6% 8.1% 8.4%
6a Does the subordination exemption in the antepenultimate paragraph of
Section 11 of the FSB TLAC Term Sheet apply? No No No No
6b Does the subordination exemption in the penultimate paragraph of Section
11 of the FSB TLAC Term Sheet apply? No No No No
6c If the capped subordination exemption applies, the amount of funding
issued that ranks pari passu with Excluded Liabilities and that is recognised
as external TLAC, divided by funding issued that ranks pari passu with
Excluded Liabilities and that would be recognised as external TLAC if no
cap was applied (%)
N/A N/A N/A N/A
Note:
1 CRR leverage exposure as amended by CRR II applicable as at the reporting date.

Liquidity
Barclays PLC 12
LIQ1 - Liquidity Coverage Ratio This table shows the level and components of the Liquidity Coverage Ratio. This disclosure has been prepared in accordance with the
requirements set out in the ‘Guidelines on LCR disclosure to complement the disclosure of liquidity risk management under Article 435 of
Regulation (EU) No 575/2013’ as specified in Annexure II which complements Article 435(1)(f) of Regulation (EU) No 575/2013.
Liquidity coverage ratio (period end) Total period end value
31.03.20 31.12.19 30.09.19 30.06.19 31.03.19
£m £m £m £m £m
Liquidity buffer 232,296 206,448 225,556 232,098 225,850
Total net cash outflows 149,946 128,901 148,895 148,669 141,515
Liquidity coverage ratio (%) (period end) 155% 160% 151% 156% 160%
LIQ1 - Liquidity coverage ratio (average) Total unweighted value (average) Total weighted value (average)
31.03.20 31.12.19 30.09.19 30.06.19 31.03.19 31.03.20 31.12.19 30.09.19 30.06.19 31.03.19
Number of data points used in calculation of
averages¹ 12 12 12 12 12 12 12 12 12 12
High-quality liquid assets £m £m £m £m £m £m £m £m £m £m
1 Total high-quality liquid assets (HQLA) 230,568 232,008 233,702 228,910 223,998
Cash outflows
2 Retail deposits and deposits from small
business customers, of which: 204,385 201,969 199,916 198,142 196,505 18,224 17,961 17,676 17,420 17,178
3 Stable deposits 112,156 111,319 111,028 110,858 110,736 5,608 5,566 5,551 5,543 5,537
4 Less stable deposits 92,221 90,642 88,880 87,275 85,760 12,608 12,387 12,117 11,869 11,633
5 Unsecured wholesale funding, of which: 174,578 170,453 169,354 165,612 161,449 89,155 88,247 89,112 87,232 84,565
6 Operational deposits (all counterparties) and
deposits in networks of cooperative banks 38,908 34,908 32,653 31,518 30,675 9,555 8,582 8,030 7,747 7,535
7 Non-operational deposits (all counterparties) 130,740 130,513 131,751 129,483 126,545 74,670 74,633 76,132 74,874 72,801
8 Unsecured debt 4,930 5,032 4,950 4,611 4,229 4,930 5,032 4,950 4,611 4,229
9 Secured wholesale funding 59,679 59,782 58,953 56,419 55,036
10 Additional requirements, of which: 178,204 177,769 178,845 175,345 175,335 51,530 50,402 51,292 50,422 52,089
11 Outflows related to derivative exposures and
other collateral requirements 19,931 18,740 19,131 18,917 19,977 17,760 16,734 17,239 17,205 18,503
12 Outflows related to loss of funding on debt
products 9,113 8,576 8,421 7,498 7,440 9,113 8,576 8,421 7,498 7,440
13 Credit and liquidity facilities 149,160 150,453 151,293 148,930 147,918 24,657 25,092 25,632 25,719 26,146
14 Other contractual funding obligations 2,382 2,410 5,047 13,666 16,668 1,637 1,654 1,590 1,426 1,241
15 Other contingent funding obligations 162,494 159,506 156,966 152,837 149,866 6,136 5,371 4,486 4,017 3,657
16 Total cash outflows 226,361 223,417 223,109 216,936 213,766
Cash inflows
17 Secured lending (e.g. reverse repos) 443,300 418,571 406,338 389,512 376,448 58,964 58,649 57,633 56,042 54,564
18 Inflows from fully performing exposures 13,346 12,750 12,714 12,641 12,642 8,518 8,129 8,220 8,305 8,412
19 Other cash inflows² 13,648 12,057 12,182 12,042 11,556 8,840 6,926 6,965 6,956 6,763
EU-
19a
(Difference between total weighted inflows and
total weighted outflows arising from
transactions in third countries where there are
transfer restrictions or which are denominated
in non-convertible currencies)
EU-
19b
(Excess inflows from a related specialised credit
institution)
20 Total cash inflows 470,294 443,378 431,234 414,195 400,646 76,322 73,704 72,818 71,303 69,739
Fully exempt inflows - - - - - - - - -
Inflows subject to 90% cap - - - - - - - - -
Inflows subject to 75% cap 381,164 359,897 351,480 336,018 318,874 76,322 73,704 72,818 71,303 69,739
21 Liquidity buffer 230,568 232,008 233,702 228,910 223,998
22 Total net cash outflows 150,039 149,713 150,291 145,633 144,027
23 Liquidity coverage ratio (%) (average) 154% 155% 155% 157% 156%
Notes:
1 Trailing average of 12 month-end observations to the reporting date
2 Difference between total weighted inflows and total weighted outflows arising from transactions in third countries where there are transfer restrictions or
which are denominated in non-convertible currencies
As at 31 March 2020, the Barclays Group LCR was 155% (December 2019: 160%), equivalent to a surplus of £82bn (December 2019: £78bn)
to 100% regulatory requirement. The change in the liquidity pool, LCR and surplus is driven by deposit growth net of client and business
funding requirements, and reflects actions to maintain a prudent funding and liquidity position in the current environment. The 12 month-
end average LCR to 31 March 2020 is 154% (December 2019: 155%).

Notes
Barclays PLC 13
The terms Barclays or Barclays Group refer to Barclays PLC together with its subsidiaries. The abbreviations ‘£m’ represent millions of Pounds Sterling.
There are a number of key judgement areas, for example impairment calculations, which are based on models and which are subject to ongoing
adjustment and modifications. Reported numbers reflect best estimates and judgements at the date these interim results were approved.
Relevant terms that are used in this document but are not defined under applicable regulatory guidance or International Financial Reporting Standards
(IFRS) are explained in the results glossary that can be accessed at home.barclays/investor-relations/reports-and-events/annual-reports.
Forward-looking statements
This document contains certain forward-looking statements within the meaning of Section 21E of the US Securities Exchange Act of 1934, as amended,
and Section 27A of the US Securities Act of 1933, as amended, with respect to the Group. Barclays cautions readers that no forward-looking statement
is a guarantee of future performance and that actual results or other financial condition or performance measures could differ materially from those
contained in the forward-looking statements. These forward-looking statements can be identified by the fact that they do not relate only to historical
or current facts. Forward-looking statements sometimes use words such as ‘may’, ‘will’, ‘seek’, ‘continue’, ‘aim’, ‘anticipate’, ‘target’, ‘projected’,
‘expect’, ‘estimate’, ‘intend’, ‘plan’, ‘goal’, ‘believe’, ‘achieve’ or other words of similar meaning. Forward-looking statements can be made in writing
but also may be made verbally by members of the management of the Group (including, without limitation, during management presentations to
financial analysts) in connection with this document. Examples of forward-looking statements include, among others, statements or guidance
regarding or relating to the Group’s future financial position, income growth, assets, impairment charges, provisions, business strategy, capital,
leverage and other regulatory ratios, payment of dividends (including dividend payout ratios and expected payment strategies), projected levels of
growth in the banking and financial markets, projected costs or savings, any commitments and targets, estimates of capital expenditures, plans and
objectives for future operations, projected employee numbers, IFRS impacts and other statements that are not historical fact. By their nature, forward-
looking statements involve risk and uncertainty because they relate to future events and circumstances. The forward-looking statements speak only
as at the date on which they are made and such statements may be affected by changes in legislation, the development of standards and
interpretations under IFRS, including evolving practices with regard to the interpretation and application of accounting and regulatory standards, the
outcome of current and future legal proceedings and regulatory investigations, future levels of conduct provisions, the policies and actions of
governmental and regulatory authorities, geopolitical risks and the impact of competition. In addition, factors including (but not limited to) the
following may have an effect: capital, leverage and other regulatory rules applicable to past, current and future periods; UK, US, Eurozone and global
macroeconomic and business conditions; the effects of any volatility in credit markets; market related risks such as changes in interest rates and
foreign exchange rates; effects of changes in valuation of credit market exposures; changes in valuation of issued securities; volatility in capital markets;
changes in credit ratings of any entity within the Group or any securities issued by such entities; direct and indirect impacts of the coronavirus (COVID-
19) pandemic; instability as a result of the exit by the UK from the European Union and the disruption that may subsequently result in the UK and
globally; and the success of future acquisitions, disposals and other strategic transactions. A number of these influences and factors are beyond the
Group’s control. As a result, the Group’s actual financial position, future results, dividend payments, capital, leverage or other regulatory ratios or other
financial and non-financial metrics or performance measures may differ materially from the statements or guidance set forth in the Group’s forward-
looking statements. Additional risks and factors which may impact the Group’s future financial condition and performance are identified in our filings
with the SEC (including, without limitation, our Annual Report on Form 20-F for the fiscal year ended 31 December 2019 and our Q1 2020 Results
Announcement for the three months ended 31 March 2020 filed on Form 6-K), which are available on the SEC’s website at www.sec.gov.
Subject to our obligations under the applicable laws and regulations of any relevant jurisdiction, (including, without limitation, the UK and the US), in
relation to disclosure and ongoing information, we undertake no obligation to update publicly or revise any forward-looking statements, whether as
a result of new information, future events or otherwise.


![M at p l o t l i b - math.uni-leipzig.dehellmund/Vorlesung/matplotlib17.pdf · M at p l o t l i b In [1]: import numpy as np import matplotlib.pyplot as plt Damit die von Matplotlib](https://static.fdocuments.in/doc/165x107/5d57f99788c993774c8b5012/m-at-p-l-o-t-l-i-b-mathuni-hellmundvorlesungmatplotlib17pdf-m-at-p-l.jpg)