Barcelona data sheet 2010
28
CREATE INVEST WORK LEARN RESEARCH NETWORK GROW GLOBAL SMILE / DO IT IN BARCELONA Economic Promotion Area BARCELONA DATA SHEET 2010 www.bcn.cat/barcelonabusiness
-
Upload
barcelona-business -
Category
Education
-
view
3.105 -
download
4
Transcript of Barcelona data sheet 2010

CREATE INVEST WORK LEARN RESEARCHNETWORK GROW GLOBAL SMILE / DO IT IN BARCELONA
Economic PromotionArea BARCELONA
DATASHEET 2010
www.bcn.cat/barcelonabusiness

Panoramic view of 22@Barcelona
Barcelona is one of the ten largest urbanareas in Europe
It is the capital of Catalonia and centre of a Euroregion thatis one of the driving hubs of Southern Europe and theMediterranean area, approximately 15 million inhabitants.
With more than 1,600,000 inhabitants, the city is the centreof a metropolitan area with nearly 5,000,000 inhabitants,making up 11% of the Spanish population.
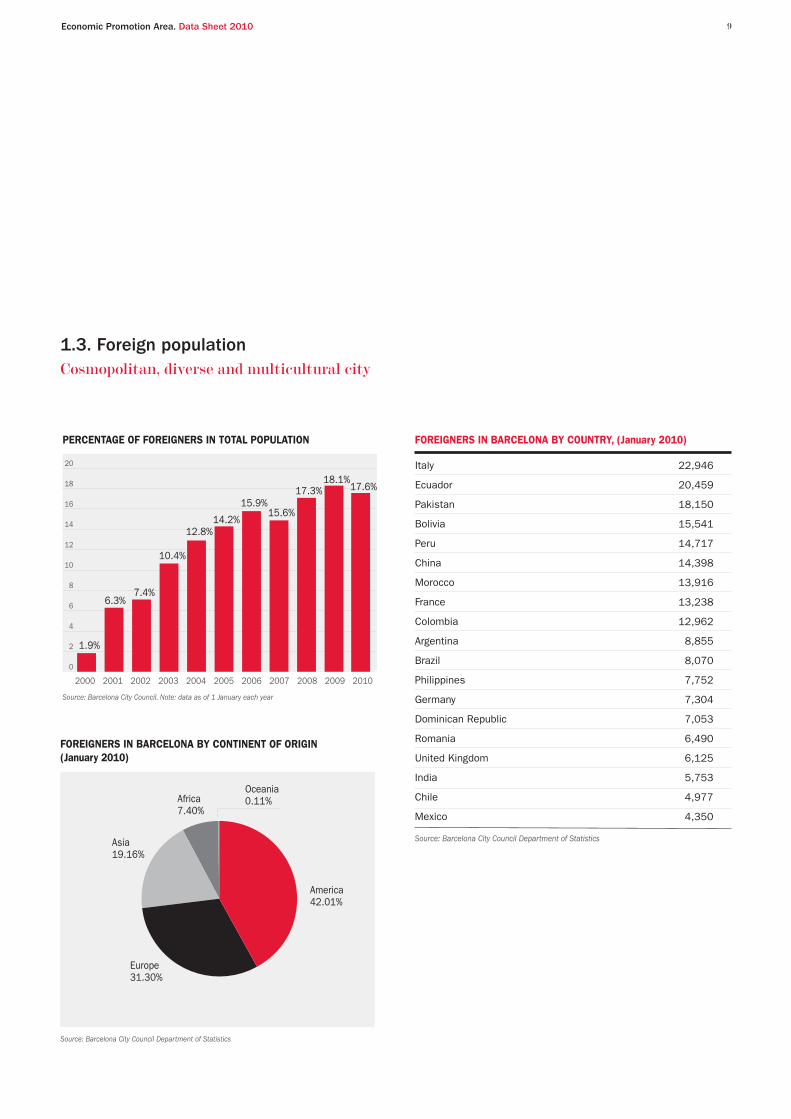
The cosmopolitan, diverse and multicultural spirit ofBarcelona is clearly demonstrated by the fact that nearly18% of the city’s residents are foreigners.
Barcelona is a dynamic economic motorwith a diversified structure that isinternationally renowned
In a global economic climate characterized by the currentrecession, Barcelona has held a solid internationalposition and very strong brand recognition. In 2010,Barcelona was ranked the fifth best city for doing businessby the European Cities Monitor (Cushman & Wakefield).Additionally, the publication Scorecard on Prosperity 2010(Toronto Board of Trade) ranked Barcelona third in globalprosperity, above metropolitan areas like San Francisco,Paris, Madrid, Seattle and Hong Kong.
Barcelona’s gross domestic product (GDP) totalled57,237 million euros in 2006, with a per capita GDP of35.8 thousand euros. In the distribution of value added bysector, the significance of business services and realestate agencies is noteworthy, making up nearly one fourthof the total (24.3%), followed by collective services(20.7%), industry (12.7%), retail and repairs (11.5%) andtransport (9.6%). Additionally, Barcelona has the mostdiverse productive structure in all of Spain.
Barcelona has an important industrial sector, employing9.5% of salaried workers, which is particularly strong in theautomotive –one of the main European producers–,pharmaceuticals and chemicals, food products, electricmaterials and equipment, and waste treatment clusters.
In 2009, Catalonia had a GDP of 206,966 million euros,making up 20% of the Spanish total, and a per capita GDP26% higher than that of the European Union.
Barcelona is a centre of dynamic andflexible entrepreneurial activity
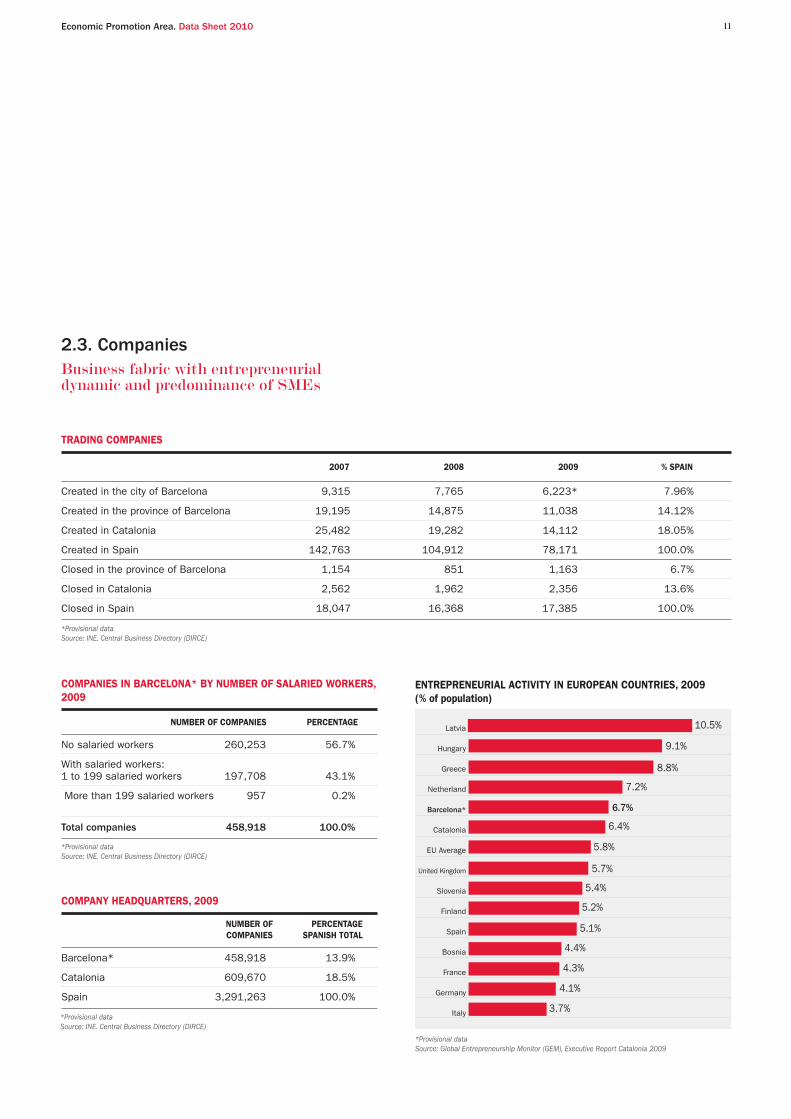
Barcelona is the headquarters of 458,918 companies,14% of the Spanish total. They are mainly SMEs (98%),characterized by their greater flexibility and ability to adaptto complex environments.
The rate of entrepreneurial activity (6.7%) is higher than thatof countries with a long business tradition, like Finland andGermany, and the European (5.8%) and Spanish (5.1%)averages. A total of 6,233 companies were created inBarcelona in 2009 and the city has the highest rate ofbusinesses created per 1,000 inhabitants of all large urbanareas in Spain.
The rate of business regeneration, measured by comparingthe number of business people who have closed theircompany to that of new entrepreneurs, is more favourable inthe province of Barcelona (26%) than in Catalonia (39%), theEuropean Union (49%) and Spain (62%). The averageentrepreneur in the province of Barcelona is male, under 35,with a university degree and a job, according to the GlobalEntrepreneurship Monitor for Catalonia in 2009.
In the city of Barcelona, it takes 48 hours to set up a newcompany.
Additionally, Catalonia received the 2010 EntrepreneurialRegion Award from the European Union’s Committee of theRegions.
Barcelona’s labour market has a criticalmass and qualified human capital
More than one million jobs are located in the city and nearly2.5 million in the surrounding metropolitan area. Activity andemployment rates in Barcelona (79% and 65.6%,respectively) are above the Catalan, Spanish and Europeanaverages.
40% of all people employed in the city are universitygraduates and 80% have completed secondary education.Catalonia is ranked fifth in the European Union in number ofpeople employed in science and technology and has12 universities, with nearly 227,000 students.
Barcelona offers high quality university education, as shownby the International Campus of Excellence recognitionreceived by both the University of Barcelona’s (UB)Barcelona Knowledge Campus and the Autonomous
·
·
·
·
·
·
·
Executive Summary
·
·
·
·
·
·
·
·

University of Barcelona (UAB), as well as the fact that 59masters’ degrees of global excellence are offered in themetropolitan area. The UB and the UAB are the onlySpanish universities ranked among the top 200 on the2010 QS World University Rankings.
Furthermore, two of Barcelona’s business schools –IESE andESADE– are ranked among the top 10 in Europe and the top20 in the world according to the Financial Times 2010 MBAranking. Likewise, IESE has been first on the EconomistIntelligence Unit’s global MBA ranking since 2009.
Barcelona is leading Spain in the movetowards a knowledge economy
29% of companies and 48% of employees in the city work inknowledge-intensive sectors.
The province of Barcelona generates 15% of all patentapplications and 22.4% of all utility models in Spain.
23% of all innovative companies in Spain are concentratedin Catalonia, accounting for 19% of the total nationalexpenditure in innovative activities.
The drive for research in Catalonia over the past yearsbrought R&D expenditure to 1.6% of the GDP in 2008 andincreased the number of workers devoted to research anddevelopment, now totalling more than 46,500.
The Barcelona area has more than 210 technology parksand technology and research centres as of 2010, as well as9 science and technology facilities that are benchmarks atan international level.
The strategic commitment to moving towards a knowledgeand creativity based economy has brought about significantbreakthroughs. Particularly noteworthy among these is thatBarcelona is now ranked 15th in the world and 6th inEurope for scientific production.
According to the Times Higher Education Ranking, the UBand the University of Pompeu Fabra (UPF) are among the top200 universities in the world; the UB is ranked 44th in lifesciences and 49th in clinical and health sciences.
Barcelona has a rich ecosystem of highly competitivebusiness schools, foundations and educational institutions,making it one of the most popular international destinationsfor business management studies. Together with Paris andLondon, Barcelona is the European city with the highestproportion of international MBA students (78%) and isranked 8th in the world in number of full-time MBA students.
The creative sectors, like cultural industries, architecture,design and advertising, generate 13% of all jobs in theBarcelona area.
Barcelona has a competitive supply ofbusiness real estate
The Barcelona metropolitan area is developing 7 millionm2 of floor space for economic activities with high valueadded. This space will be able to generate more than200,000 new jobs, concentrated in the three areas ofeconomic activity that make up the Barcelona EconomicTriangle, which works as a catalyst for other projects intheir surroundings and bring together the best businessand investment opportunities in the knowledge economy:22@Barcelona (Besòs) is the technology district locatedin the centre of Barcelona, which is devoted to advancedservices and knowledge-intensive activities linked toinformation and communication technology, media,medical technology, energy and design. Parc de l’Alba (Vallès) is one of the main hubs for sectorslinked to science and technology with benchmarkfacilities like Creapolis, the Alba Synchrotron and theUAB Research Park. Delta BCN/BZ Innovation Zone (Llobregat), located in oneof the main industrial and logistics areas in Spain,focuses mainly on emerging sectors like aerospace,mobility, health, media, food and other advancedindustries.
Barcelona has an economy that is openand connected to the world
Catalonia is home to the headquarters of nearly 3,400foreign companies and received a gross total of 1,804.3million euros in direct foreign investment (DFI)1 and 153 DFIprojects in 2009. In the same year, Catalan companiesinvested 2,169.3 million euros abroad.
Barcelona generates one fifth of the total Spanish exports(much higher than its part of the GDP) and has maintaineda volume of foreign sales equivalent to 32,262 millioneuros in 2009, a year marked by the serious internationalrecession.
·
·
·
·
·
·
·
·
·
·
·
·
·
·
·
(1) Total gross investment, including foreign shareholding entities (ETVES).
Furthermore, Barcelona leads Spain in medium-to-hightechnology exports, with 25% of all Spanish exports in thiscategory. In 2009, more than 14% of all exports fromBarcelona had a high technological content and 46% weremedium-to-high, more than Spain.
In 2009, Barcelona airport was ranked ninth in terms ofpassenger volume, with a total of 27.3 million travellers,59% of which were international passengers, and 24different intercontinental routes, to which 4 more wereadded in 2010. Additionally, Barcelona airport has beenchosen the best airport in Europe with more than 25 millionpassengers per year by ACE EUROPE 2010. Thisorganization has highlighted the airport’s achievements inquality services, range of products, safety andenvironmental awareness.
The Port of Barcelona was ranked the 12th most importantEuropean container port in 2009. Port activity is currently at41.8 million tons transported, despite the effects of theinternational recession.
The high-speed train (AVE) between Barcelona and Madridrecorded 2.7 million passengers in its second year ofservice.
Barcelona is an international benchmarkin tourism and the organization of tradefairs and congresses
Barcelona maintains an excellent position among leadingurban-tourism destinations in Europe, ranked fifth in numberof visitors and was one of the cities least affected by therecession in 2009.
The city received 6.5 million visitors in 2009, with12.8 million over-night stays in the wide range of qualityhotels available. 69% of all visitors were foreigners.
Moreover, it remains the leading destination for cruisesamong Mediterranean ports, with more than 2 millionpassengers.
Barcelona is ranked 2nd in the world for organizing tradefairs and congresses according to the InternationalCongress Association (ICCA), with 280,000 m2 of indoorexhibition space and nearly 3 million visitors in 2009.Furthermore, Barcelona was ranked the second best city inthe world in organizing congresses, after London, byConference and Incentive Travel.
The city is committed to a quality,diverse and proximity-based retail model
With 16,650 companies and 151,724 jobs, retail sales isone of the most important activities in Barcelona’seconomic structure.
The municipal markets, with more than 200,000 m2 of floorspace and an economic impact of 1,000 million euros, areone of the benchmarks in Barcelona’s retail model due totheir economic and social impact on the city’sneighbourhoods.
Barcelona is the leading European cityin quality of life
Barcelona was ranked first in 2010, for the 13th year in arow, on the European Cities Monitor list of the bestEuropean cities for workers quality of life (Cushman &Wakefield).
In terms of sustainability, the city is committed to energysavings and efficiency, with considerable municipal effortgoing to develop renewable energy and self-generation ofelectricity.
The compact urban model favours sustainable mobility, with8 out of 10 trips within the city being done by publictransport, bicycle or on foot. Other noteworthy areas includethe reduction in household water use in the city (from133 litres per inhabitant per day 10 years ago to 110 litresper inhabitant per day in 2009) and the technical plan totake advantage of alternative hydraulic resources.
The “UPC Energy Campus, Energy for excellence” project,which aims to help move the energy sector towards a moresustainable and innovative model, has received recognitionas an International Campus of Excellence for the PolytechnicUniversity of Catalonia.
There is a wide range of quality cultural and educationalopportunities. In 2009, there were 35 public libraries in thecity and the museums are free on Sunday afternoons,allowing all residents of Barcelona access and proximity toculture.
·
·
·
·
·
·
·
·
·
·
·
·
·
·
·

Media-TIC building

Index01.One of Europe’s main metropolitan areas ................0802.Economic motor with a diversified structure ..........1003.Qualified human capital ..............................................1204. City of knowledge and creativity ................................1405.Competitive business real estate ...............................1606.An economy open to the world....................................1807.Benchmark in tourism and city of trade fairs and congresses ..............................................................21
08.Retail sales ....................................................................2309.Quality of life .................................................................2310. International positioning of Barcelona ....................26
November 2010

8
01. One of Europe’s mainmetropolitan areas
1.1. Population, surface area andclimate Barcelona, one of the ten largest metropolitanareas in Europe by population
1.2. Demographics of Barcelona
POPULATIONJANUARY 2009
(inhabitants)
PERCENTAGE OFTOTAL SPANISHPOPULATION (%)
SURFACE AREA(km2)
DENSITY(inhab/km2)
Barcelona 1,621,537 3.5% 101 16,055
Metropolitan Region 4,992,193 10.7% 3,242 1,540
Catalonia 7,475,420 16.0% 32,107 233
Spain 46,745,807 100.0% 505,990 92
POPULATION AND AREA DATA
Source: Barcelona City Council, INE
Average yearly temperature 18.1ºC
Highest temperature 36.8ºC
Lowest temperature 0.7ºC
Yearly hours of sun 2,526.3
CLIMATE INDICATORS BARCELONA
Source: Barcelona City Council, 2010 Statistical Year Book
RANKING CITY POPULATION*
1 London 12,730,234
2 Paris 10,145,314
3 Cologne 10,130,822
4 Amsterdam-Rotterdam 6,487,918
5 Liverpool-Manchester 6,444,953
6 Milan 6,244,760
7 Madrid 5,541,480
8 Barcelona 4,613,839
9 Naples 4,586,245
10 Berlin 3,909,764
RANKING POPULATION IN EUROPEAN METROPOLITAN AREAS
* Data from 2005Source: Papers 50, European Metropolitan Agglomerations Barcelona Institute of Regional and Metropolitan Studies
Age groups (2009)
0-14 years 11.8%
15-64 years 67.8%
65 and over 20.3%
Life expectancy (2008)
Men 79 years
Women 85.2 years
Birth rate (2009) 8.7 ‰
Mortality rate (2009) 9.4 ‰
Fertility rate (2008) 38.7 ‰Births per 1000 womenbetween 15 and 49 years
DEMOGRAPHIC INDICATORS BARCELONA
Source: Barcelona City Council Department of Statistics
Economic Promotion Area. Data Sheet 2010 9
Italy 22,946
Ecuador 20,459
Pakistan 18,150
Bolivia 15,541
Peru 14,717
China 14,398
Morocco 13,916
France 13,238
Colombia 12,962
Argentina 8,855
Brazil 8,070
Philippines 7,752
Germany 7,304
Dominican Republic 7,053
Romania 6,490
United Kingdom 6,125
India 5,753
Chile 4,977
Mexico 4,350
FOREIGNERS IN BARCELONA BY COUNTRY, (January 2010)
Source: Barcelona City Council Department of Statistics
1.3. Foreign populationCosmopolitan, diverse and multicultural city
PERCENTAGE OF FOREIGNERS IN TOTAL POPULATION
FOREIGNERS IN BARCELONA BY CONTINENT OF ORIGIN(January 2010)
2000 2001 2002 2003 2004 2005 2006 2007 2008 2009 2010
20
18
16
14
12
10
8
6
4
2
0
Source: Barcelona City Council. Note: data as of 1 January each year
Source: Barcelona City Council Department of Statistics
1.9%
6.3%7.4%
10.4%
12.8%14.2%
15.9%15.6%
17.3%18.1%
17.6%
Asia19.16%
Europe31.30%
America42.01%
Africa7.40%
Oceania0.11%

10
2.1. Economic activity and growthCatalonia generates one fifth of the SpanishGDP
Barcelona 57,237 35.8 131.0
MetropolitanRegion 137,474.20
BARCELONA AND BARCELONA METROPOLITAN REGION. GROSS DOMESTIC PRODUCT AT MARKET PRICES (GDP)(1). 2006
(1) GDP 2006. Base 2000. Valued at market priceSource: Catalan Institute of Statistics
Catalonia 126.40
Spain 103.10
Euro Zone 108.00
European Union 100.00
PER CAPITA GDPpurchasing power parity*. 2009 Index (UE 27=100)
*Harmonized GDPSource: Eurostat and INE
GROSS DOMESTIC PRODUCT AT MARKET PRICES(Current prices) million €
Source: Idescat, INE
SPAIN CATALONIA (%) CAT/SPAIN
2007 1,052,730 208,680 19.8
2008 1,088,502 214,714 19.7
2009 1,051,151 206,966 19.7
ANNUAL RATES OF VARIATION IN GDP AT CONSTANT PRICES (in %)
Source: Eurostat, INE, Idescat
2007 2008 2009
Catalonia 3.2 0.2 -4.0
Spain 3.6 0.9 -3.6
European Union 2.9 0.7 -4.2
02. Economic motor with adiversified structure
million eurosGDP per inhabitantthousands of euros Catalonia Index=100
Agriculture, cattle, forestry and fishing 0.01
Energy, chemicals and rubber 3.60
Food, drinks and tobacco 1.11
Textiles, wood, paper and publishing 3.03
Machinery, electronics and transport 4.01
Metalwork, metal products and othermanufacturing industries 0.94
Construction 6.64
Retail and repairs 11.57
Hotels 7.50
Transport, storage and communication 9.57
Financial advisory 7.02
Business services and real estate activity 24.35
Other services 20.71
Total Sectors 100.00
BARCELONA. GROSS VALUE ADDED (GVA)(1). 2006.FOR 13 BRANCHES OF ACTIVITY % of total
(1) GVA 2006. Base 2000. Value of basic pricesSource: Catalan Institute of Statistics
2.2. Productive specializationDiversified structure with a predominanceof services and significant industrial-basedclusters
BARCELONA BMR CATALONIA SPAIN
Agriculture 0.0% 0.1% 0.3% 0.4%
Industry 9.5% 16.9% 18.3% 15.5%
Construction 4.8% 6.5% 7.5% 8.4%
Services 85.7% 76.6% 73.9% 75.0%
Total 100.0% 100.0% 100.0% 100.0%
PRODUCTION STRUCTURE.PERCENTAGE OF SALARIED EMPLOYEES BY ECONOMIC SECTOR,2009
Source: Prepared by the Barcelona City Council Department of Statistics with data from the CatalanDepartment of Labour and the INSS
No salaried workers 260,253 56.7%
With salaried workers:1 to 199 salaried workers 197,708 43.1%
More than 199 salaried workers 957 0.2%
Total companies 458,918 100.0%
COMPANIES IN BARCELONA* BY NUMBER OF SALARIED WORKERS,2009
*Provisional dataSource: INE. Central Business Directory (DIRCE)
NUMBER OF COMPANIES PERCENTAGE
Barcelona* 458,918 13.9%
Catalonia 609,670 18.5%
Spain 3,291,263 100.0%
COMPANY HEADQUARTERS, 2009
*Provisional dataSource: INE. Central Business Directory (DIRCE)
NUMBER OF COMPANIES
PERCENTAGESPANISH TOTAL
Economic Promotion Area. Data Sheet 2010 11
2.3. CompaniesBusiness fabric with entrepreneurialdynamic and predominance of SMEs
2007 2008 2009 % SPAIN
Created in the city of Barcelona 9,315 7,765 6,223* 7.96%
Created in the province of Barcelona 19,195 14,875 11,038 14.12%
Created in Catalonia 25,482 19,282 14,112 18.05%
Created in Spain 142,763 104,912 78,171 100.0%
Closed in the province of Barcelona 1,154 851 1,163 6.7%
Closed in Catalonia 2,562 1,962 2,356 13.6%
Closed in Spain 18,047 16,368 17,385 100.0%
TRADING COMPANIES
*Provisional dataSource: INE. Central Business Directory (DIRCE)
*Provisional dataSource: Global Entrepreneurship Monitor (GEM), Executive Report Catalonia 2009
Latvia
Hungary
Greece
Netherland
Barcelona*
Catalonia
EU Average
United Kingdom
Slovenia
Finland
Spain
Bosnia
France
Germany
Italy
10.5%
9.1%
8.8%
7.2%
6.7%
6.4%
5.8%
5.7%
5.4%
5.2%
5.1%
4.4%
4.3%
4.1%
3.7%
ENTREPRENEURIAL ACTIVITY IN EUROPEAN COUNTRIES, 2009 (% of population)

Barcelona 1,009,834 5.7
Barcelona province 2,325,310 13.2
Catalonia 3,109,445 17.7
Spain 17,587,252 100.00
Barcelona 79.2 65.6 17.2
Catalonia 77.9 64.0 17.9
Spain 74.5 59.4 20.2
European Union 71.1 64.3 9.6
12
3.1. Rates of activity, employment andunemployment Activity and employment rates above theEuropean average
40% of all jobs are done by universitygraduates
RATES OF ACTIVITY, EMPLOYMENT AND UNEMPLOYMENT2nd QUARTER OF 2010 (In %)
Source: Labour Force Survey and Eurostat
ACTIVITY RATE EMPLOYMENTRATE
UNEMPLOYMENTRATE
3.2. Jobs in Barcelona More than 1 million jobs in the city andnearly 2.5 million in the surroundingmetropolitan area
WORKERS AFFILIATED TO SOCIAL SECURITY. 2nd QUARTER 2010
Source: Catalan Department of Labour
TOTAL % SPANISH TOTAL
121.8 Zurich 126
118.2 Copenhagen 88
117.3 Geneva 113.1
100 New York 100
82.2 Munich 72.3
79.2 Miami 81.9
78.8 Frankfurt 71.7
73.3 London 78
73.1 Amsterdam 65.6
68 Vienna 67.9
65.4 Paris 66.8
64.5 Lyon 67.3
51.9 Barcelona 58.2
43.8 Athens 44.9
47.5 Rome 44.8
3.3. SalariesCompetitive salaries at an internationallevel
SALARY LEVEL IN WORLD CITIES, 2010
Source: UBS. Prices and Earnings around The Globe 2010
GROSS SALARY(NEW YORK=100)
NET SALARY(NEW YORK=100)
JOBS BY WORKERS' LEVEL OF FORMAL EDUCATION2006 (in %)
Source: IERMB, Idescat. Survey on living conditions and habits of the population of Catalonia, 2006
BARCELONA BMA
No formal education 1.6 1.9
Primary education 19.6 27.7
Secondary education 39.2 40.6
University education 39.6 29.8
Catalan universities 12
University students (2008-2009 school year) 226,787
Foreign students in PhD courses (2008) 34%
Number of Masters of excellence 66
Foreign students in Masters of excellence (2009) 65%
Foreign schools 25
TRAINING AND UNIVERSITIES
Source: Barcelona City Council
3.4. Training and attractiveness ofuniversities
03. Qualified human capital

Economic Promotion Area. Data Sheet 2010 13
1 1 London Business School London
2 5 Insead Fontainebleau
3 6 IE Business School Madrid
4 11 IESE Business School Barcelona
5 15 IMD Lausanne
6 16 University of Oxford: Saïd Oxford
7 18 HEC Paris Paris
8 19 Esade Business School Barcelona
9 21 University of Cambridge: Judge Cambridge
10 24 Lancaster University Management School Lancaster
10 25 Rotterdam School of Management, Erasmus University Rotterdam
12 26 Cranfield School of Management Cranfield
13 32 Imperial College Business School London
14 38 SDA Bocconi Milan
15 40 Manchester Business School Manchester
16 41 City University: Cass London
17 42 Warwick Business School Coventry
18 51 University of Strathclyde Business School Glasgow
19 73 Aston Business School Birmingham
19 74 Durham Business School Durham
21 75 Birmingham Business School Birmingham
22 87 University of Bath School of Management Bath
23 87 Vlerick Leuven Gent Management School Gant
24 89 University of Edinburgh Business School Edinburgh
25 89 Bradford School of Management/TiasNimbas Business School Bradford
26 97 EM Lyon Lyon
27 98 University College Dublin: Smurfit Dublin
TOP EUROPEAN BUSINESS SCHOOLS IN 2010
Source: Financial Times
EUROPEAN RANKING 2010 WORLD RANKING 2010 BUSINESS SCHOOL CITY
3.4. Training and attractiveness of universitiesBusiness schools, universities and masters of global excellencewith international projection
14
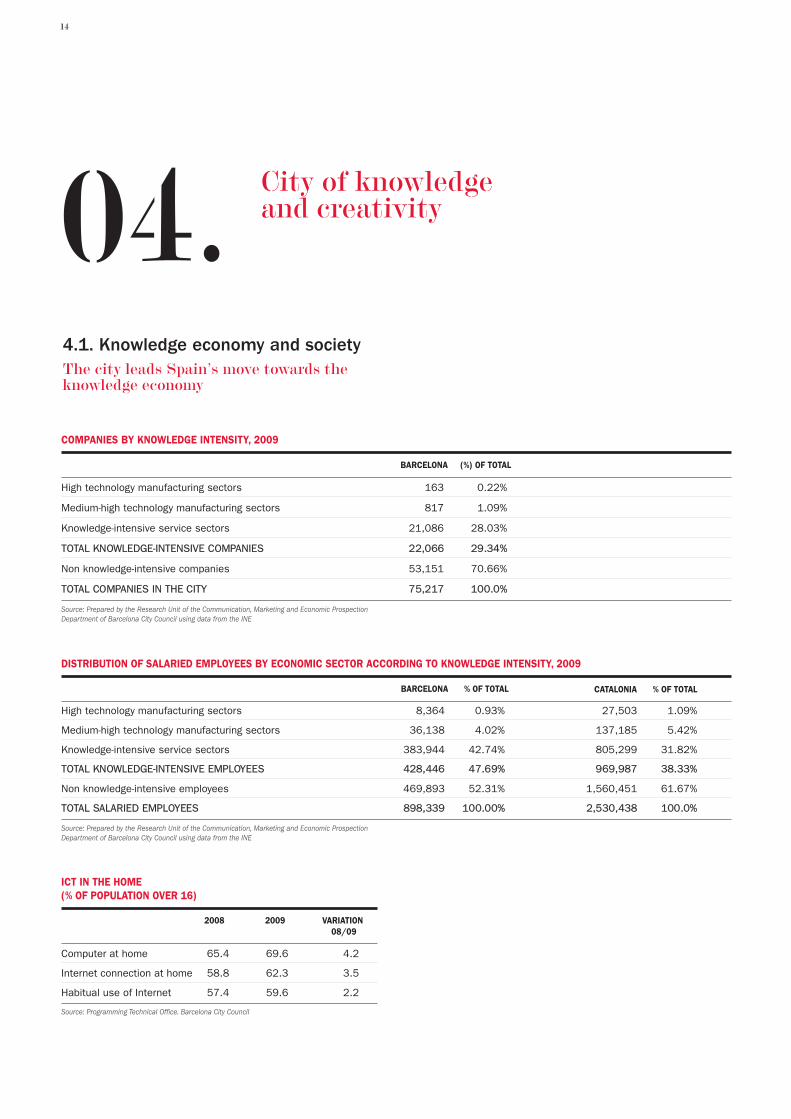
4.1. Knowledge economy and society The city leads Spain’s move towards theknowledge economy
High technology manufacturing sectors 163 0.22%
Medium-high technology manufacturing sectors 817 1.09%
Knowledge-intensive service sectors 21,086 28.03%
TOTAL KNOWLEDGE-INTENSIVE COMPANIES 22,066 29.34%
Non knowledge-intensive companies 53,151 70.66%
TOTAL COMPANIES IN THE CITY 75,217 100.0%
COMPANIES BY KNOWLEDGE INTENSITY, 2009
Source: Prepared by the Research Unit of the Communication, Marketing and Economic ProspectionDepartment of Barcelona City Council using data from the INE
BARCELONA (%) OF TOTAL
High technology manufacturing sectors 8,364 0.93% 27,503 1.09%
Medium-high technology manufacturing sectors 36,138 4.02% 137,185 5.42%
Knowledge-intensive service sectors 383,944 42.74% 805,299 31.82%
TOTAL KNOWLEDGE-INTENSIVE EMPLOYEES 428,446 47.69% 969,987 38.33%
Non knowledge-intensive employees 469,893 52.31% 1,560,451 61.67%
TOTAL SALARIED EMPLOYEES 898,339 100.00% 2,530,438 100.0%
DISTRIBUTION OF SALARIED EMPLOYEES BY ECONOMIC SECTOR ACCORDING TO KNOWLEDGE INTENSITY, 2009
Source: Prepared by the Research Unit of the Communication, Marketing and Economic ProspectionDepartment of Barcelona City Council using data from the INE
BARCELONA % OF TOTAL CATALONIA % OF TOTAL
ICT IN THE HOME(% OF POPULATION OVER 16)
Source: Programming Technical Office. Barcelona City Council
2008 2009 VARIATION08/09
Computer at home 65.4 69.6 4.2
Internet connection at home 58.8 62.3 3.5
Habitual use of Internet 57.4 59.6 2.2
04. City of knowledgeand creativity
Economic Promotion Area. Data Sheet 2010 15
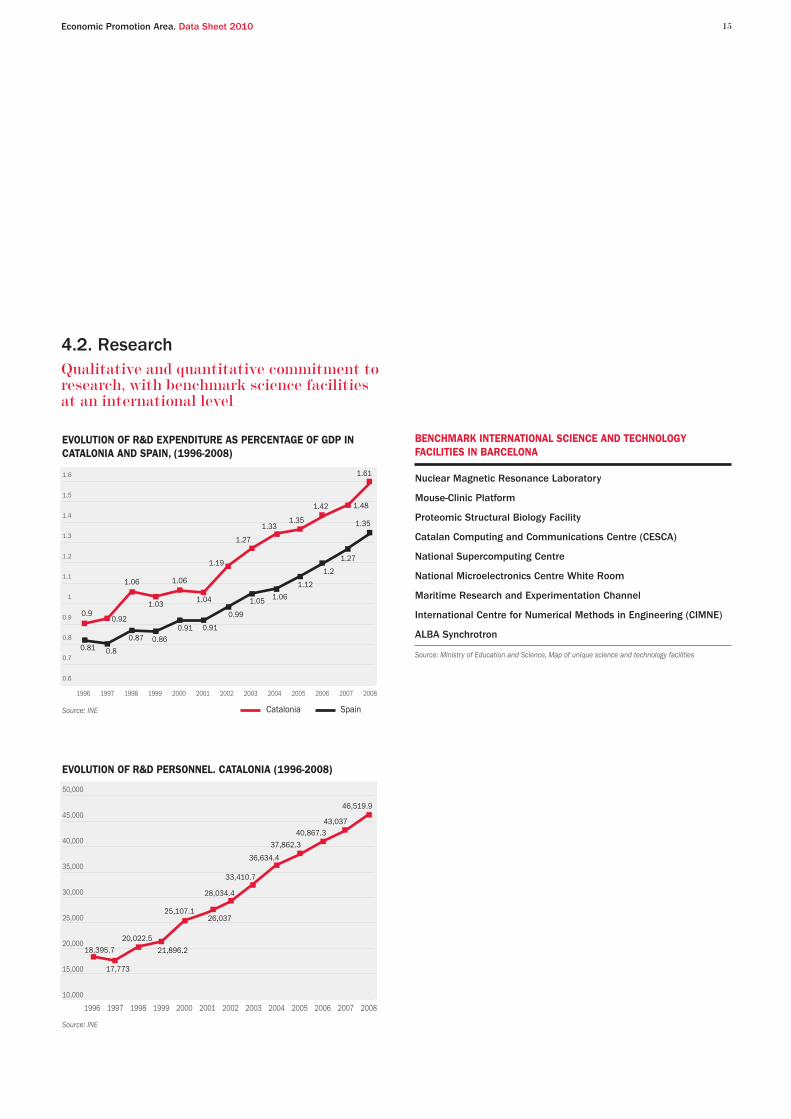
4.2. ResearchQualitative and quantitative commitment to research, with benchmark science facilities at an international level
EVOLUTION OF R&D EXPENDITURE AS PERCENTAGE OF GDP IN CATALONIA AND SPAIN, (1996-2008)
1996 1997 1998 1999 2000 2001 2002 2003 2004 2005 2006 2007 2008
1.6
1.5
1.4
1.3
1.2
1.1
1
0.9
0.8
0.7
0.6
Source: INE
EVOLUTION OF R&D PERSONNEL. CATALONIA (1996-2008)
1996 1997 1998 1999 2000 2001 2002 2003 2004 2005 2006 2007 2008
50,000
45,000
40,000
35,000
30,000
25,000
20,000
15,000
10,000
Source: INE
0.90.92
1.06
1.03
1.06
1.04
1.19
1.27
1.331.35
1.42
1.27
1.2
1.12
1.061.05
0.99
0.910.910.860.87
0.80.81
Catalonia Spain
43,03740,867.3
37,862.3
36,634.4
33,410.7
28,034.4
26,03725,107.1
21,896.2
20,022.5
17,773
18,395.7
Nuclear Magnetic Resonance Laboratory
Mouse-Clinic Platform
Proteomic Structural Biology Facility
Catalan Computing and Communications Centre (CESCA)
National Supercomputing Centre
National Microelectronics Centre White Room
Maritime Research and Experimentation Channel
International Centre for Numerical Methods in Engineering (CIMNE)
ALBA Synchrotron
BENCHMARK INTERNATIONAL SCIENCE AND TECHNOLOGYFACILITIES IN BARCELONA
Source: Ministry of Education and Science, Map of unique science and technology facilities
1.48
1.61
1.35
46,519.9
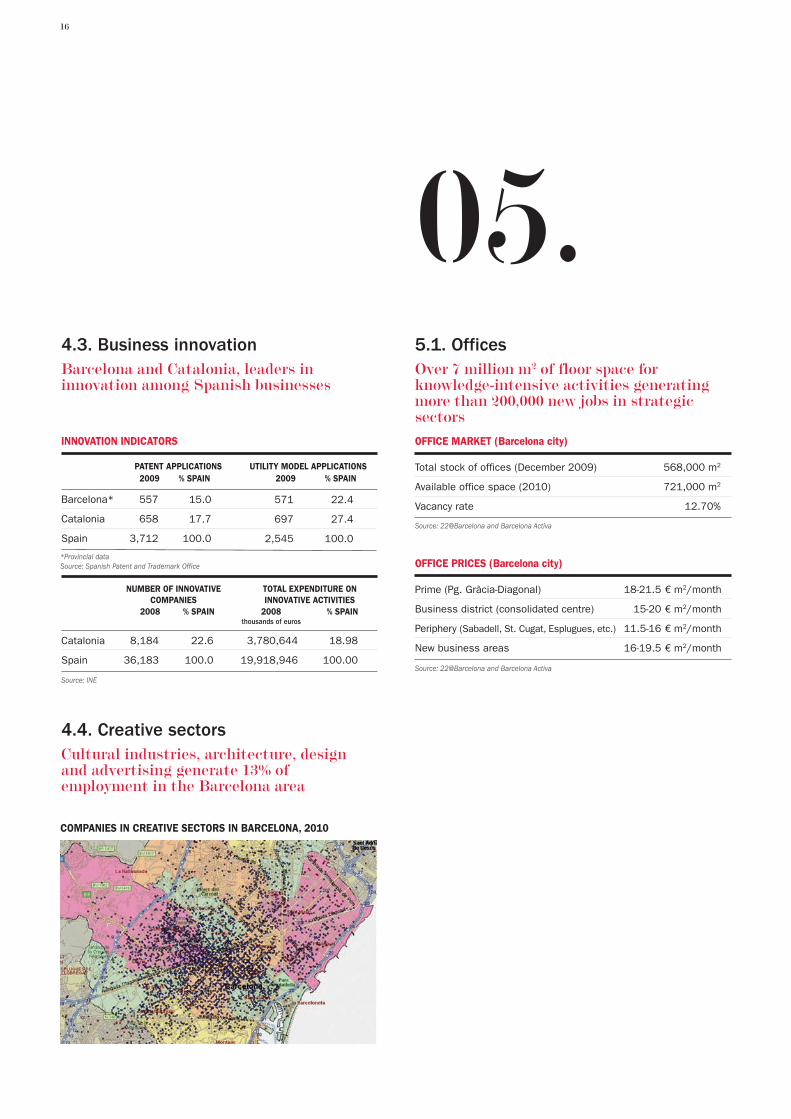
4.4. Creative sectorsCultural industries, architecture, designand advertising generate 13% ofemployment in the Barcelona area
Catalonia 8,184 22.6 3,780,644 18.98
Spain 36,183 100.0 19,918,946 100.00
INDICADORS D’INNOVACIÓ
Source: INE
NUMBER OF INNOVATIVECOMPANIES
TOTAL EXPENDITURE ONINNOVATIVE ACTIVITIES
2008 % SPAIN 2008 % SPAIN
16
4.3. Business innovationBarcelona and Catalonia, leaders ininnovation among Spanish businesses
5.1. OfficesOver 7 million m2 of floor space for knowledge-intensive activities generatingmore than 200,000 new jobs in strategic sectors
Barcelona* 557 15.0 571 22.4
Catalonia 658 17.7 697 27.4
Spain 3,712 100.0 2,545 100.0
INNOVATION INDICATORS
PATENT APPLICATIONS UTILITY MODEL APPLICATIONS2009 % SPAIN 2009 % SPAIN
Total stock of offices (December 2009) 568,000 m2
Available office space (2010) 721,000 m2
Vacancy rate 12.70%
OFFICE MARKET (Barcelona city)
Source: 22@Barcelona and Barcelona Activa
Prime (Pg. Gràcia-Diagonal) 18-21.5 € m2/month
Business district (consolidated centre) 15-20 € m2/month
Periphery (Sabadell, St. Cugat, Esplugues, etc.) 11.5-16 € m2/month
New business areas 16-19.5 € m2/month
OFFICE PRICES (Barcelona city)
Source: 22@Barcelona and Barcelona Activa
05.
*Provincial dataSource: Spanish Patent and Trademark Office
COMPANIES IN CREATIVE SECTORS IN BARCELONA, 2010
thousands of euros

Economic Promotion Area. Data Sheet 2010 17
Barcelona Economic TriangleThe Barcelona Metropolitan Areahas three main areas that drive economicactivity, forming a large economic triangle:
Delta BCNBZ Barcelona Innovation Zone (Llobregat)
22@Barcelona(Besòs)
Parc de l’Alba(Vallès)
Aerospace, mobility, biotech, food sciences,optics & photonics
Media, ICT, medicaltechnology, energy,design
Biotech, energy,nanotechnology,new materials,pharma & health
Aerospace and MobilityPark
Viladecans Business Park
Mediterranean Technology Park
BZ Barcelona Innovation Zone
22@Barcelona
Diagonal- Besòs Campus
Sagrera station area
Parc Alba
Esade Creápolis
Parc Taulí Health Park
Vallès Technology Park
UAB Research Park
Can Sant Joan BusinessPark
245,000 m2
98,000 m2
93,300 m2
1,000,000 m2
3,200,000 m2
60,000 m2
436,022 m2
1,320,000 m2
39,800 m2
93,700 m2
190,600 m2
120,000 m2
172,330 m2
Technology Centre for the Aeronautical and Aerospace Industry (CTAE)
Wind Tunnel
International Centre for NumericalModels in Engineering (CIMNE)
Institute of Photonic Sciences(ICFO)
Barcelona Biomedical ResearchPark (PRBB)
Barcelona Media Innovation Centre
Barcelona Digital
Catalan Institute for Energy Research (IREC)
ITER Project "Fusion for Energy"
Barcelona Design Hub
Blood and Tissue Bank
Alba Synchrotron
National Microelectronics CentreWhite Room (CSIC-CNM)
Institute for Research on ArtificialIntelligence (CSIC-IIIA)
INDICADORS D’INNOVACIÓ
DRIVING AREA SECTORS PROJECTS TOTAL FLOOR SPACE FOR ECONOMIC ACTIVITY
MAIN FACILITIES AND RESEARCH CENTRES
Competitive business real estate
18
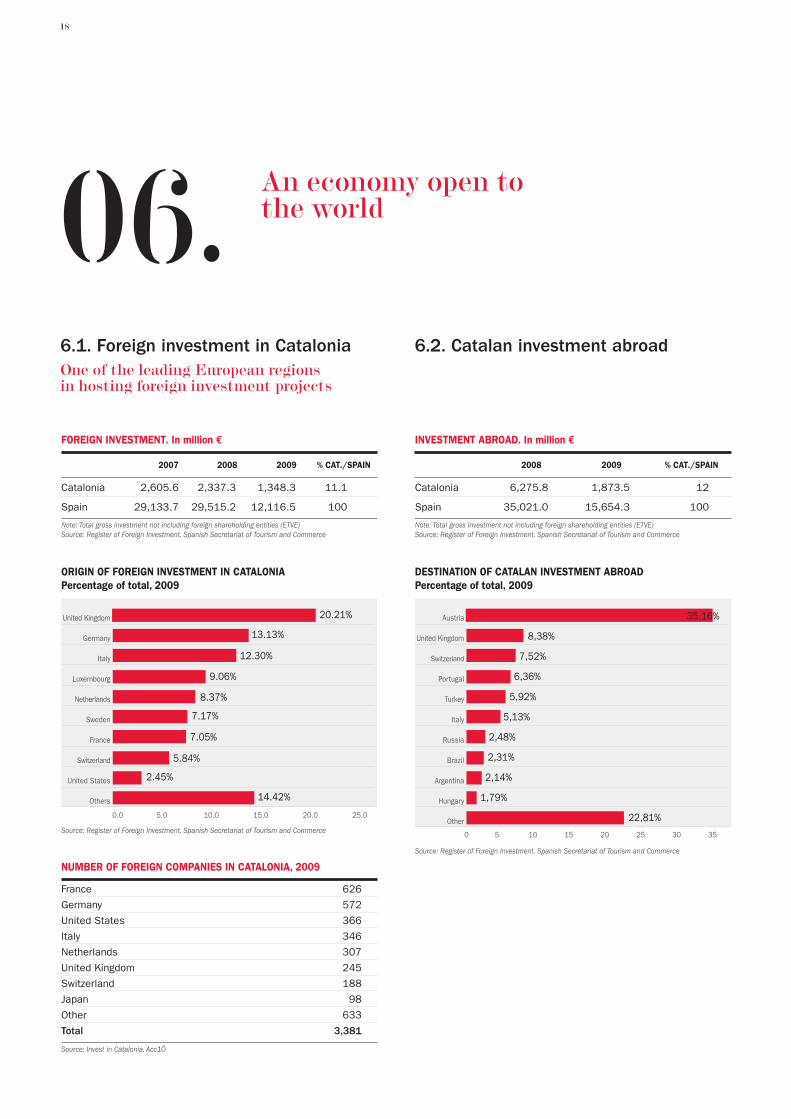
Catalonia 2,605.6 2,337.3 1,348.3 11.1
Spain 29,133.7 29,515.2 12,116.5 100
6.1. Foreign investment in Catalonia One of the leading European regionsin hosting foreign investment projects
FOREIGN INVESTMENT. In million €
Note: Total gross investment not including foreign shareholding entities (ETVE)Source: Register of Foreign Investment. Spanish Secretariat of Tourism and Commerce
2007 2008 2009 % CAT./SPAIN
ORIGIN OF FOREIGN INVESTMENT IN CATALONIAPercentage of total, 2009
0.0 5.0 10.0 15.0 20.0 25.0
United Kingdom
Germany
Italy
Luxembourg
Netherlands
Sweden
France
Switzerland
United States
Others
Source: Register of Foreign Investment. Spanish Secretariat of Tourism and Commerce
20.21%
France 626
Germany 572
United States 366
Italy 346
Netherlands 307
United Kingdom 245
Switzerland 188
Japan 98
Other 633
Total 3,381
NUMBER OF FOREIGN COMPANIES IN CATALONIA, 2009
Source: Invest in Catalonia. Acc1Ó
13.13%
12.30%
9.06%
8.37%
7.17%
7.05%
5.84%
2.45%
14.42%
Catalonia 6,275.8 1,873.5 12
Spain 35,021.0 15,654.3 100
6.2. Catalan investment abroad Catalunya genera la cinquena part de lainversió espanyola a l’exterior
INVESTMENT ABROAD. In million €
Note: Total gross investment not including foreign shareholding entities (ETVE)Source: Register of Foreign Investment. Spanish Secretariat of Tourism and Commerce
2008 2009 % CAT./SPAIN
DESTINATION OF CATALAN INVESTMENT ABROADPercentage of total, 2009
0 5 10 15 20 25 30 35
Austria
United Kingdom
Switzerland
Portugal
Turkey
Italy
Russia
Brazil
Argentina
Hungary
Other
Source: Register of Foreign Investment. Spanish Secretariat of Tourism and Commerce
35,16%
8,38%
7,52%
6,36%
5,92%
5,13%
2,48%
2,31%
2,14%
1,79%
22,81%
06. An economy open tothe world

Economic Promotion Area. Data Sheet 2010 19
Barcelona 39,442.37 39,814.11 32,261.80 20.4%
Catalonia 49,678.31 50,314.31 41,157.47 26.0%
Spain 185,023.22 188,184.39 158,254.28 100.0%
6.3. ExportsThe Barcelona area is the leading exporter in Spain, accountingfor more than one fifth of all sales abroad
EXPORTS. In million €
*Provisional dataSource: Ministry of Industry, Tourism and Trade
2007 2008 2009* % SPAIN 2009
EVOLUTION OF EXPORTS FROM THE PROVINCE OF BARCELONA(1995-2009)
1995 1996 1997 1998 1999 2000 2001 2002 2003 2004 2005 2006 2007 2008 2009
45,000
40,000
35,000
30,000
25,000
20,000
15,000
10,000
Source: Ministry of Industry, Tourism and Trade
MAIN DESTINATION COUNTRIES FOR EXPORTS FROM BARCELONA(PROVINCE). Percentages of total, 2009
France
Germany
Italy
Portugal
United Kingdom
Switzerland
United States
Netherlands
Belgium
Mexico
Morocco
Turkey
Source: Ministry of Industry, Tourism and Trade
18.93%
9.68%
9.03%
8.82%
4.85%
4,03%
3.03%
2.69%
2.47%
1.95%
1.83%
1.82%
DISTRIBUTION OF EXPORTS FROM SPAIN BY TECHNOLOGY CONTENT, 2009
DISTRIBUTION OF EXPORTS FROM BARCELONA BY TECHNOLOGYCONTENT, 2009
14.23%
High Medium-high Medium-low Low Not classified
16.17%
21.97%
45.77%
1.86%
9.98%
High Medium-high Medium-low Low Not classified
21.77%
26.03%
39.40%
2.82%
Technology Content Technology Content
Source: Ministry of Industry, Tourism and Trade

20
Goods (tons) 50.55 41.79
Containers (TEU) 2.57 1.8
Passengers 3.24 3.2
INFRASTRUCTURES
Surface space (ha.) 828.9
Docks and berths (km.) 20.3
6.4. Port of BarcelonaOne of the top twelve European containerports
PORT OF BARCELONA INDICATORS
Source: Barcelona Port Authority
2008 2009TRAFFIC (in millions)
Total passengers 32,898,249 30,272,084 27,311,765
Goods (in tons) 104,239 96,770 89,812
6.5. AirportOne of the top ten European airports innumber of passengers.Intercontinental flights to 44 destinations,with 157 frequencies per week in 2009BARCELONA AIRPORT
Source: Barcelona Economia
2007 2008 2009
North America 12 49 627,560
Africa 18 66 587,501
Middle East 6 23 243,697
South America 2 6 163,818
Asia 6 13 (2 cargo) 81,984
Total direct intercontinental passengers 44 157 1,704,560
BARCELONA AIRPORT. INTERNATIONAL FLIGHTSBY GEOGRAPHIC AREA, 2009
Source: Bcn Air Route Development Committee
DESTINATION AIRPORTS
NUMBER OF WEEKLY FLIGHTS
NUMBER OF TOTALDIRECT
PASSENGERS
AVE Barcelona-Madrid 2,673,900 2 hours 40 minutes
HIGH-SPEED TRAIN BARCELONA - MADRID
Source: Renfe
PASSENGERS 2009 DURATION OF JOURNEY
Londres Heathrow (LHR) 66.0
Paris Roissy (CDG) 57.9
Frankfurt (FRA) 50.9
Madrid (MAD) 48.2
Amsterdam (AMS) 43.6
Rome-Fiumicino (FCO) 33.7
Munich (MUC) 32.7
London Gatwick (LGW) 32.4
Barcelona (BCN) 27.3
Paris Orly (ORY) 25.1
MAIN EUROPEAN AIRPORTS BY PASSENGER VOLUME
Source: Airport Council International (2009)
CITY (AIRPORT) MILLION PASSENGERS 2009
RANKING 2009 CITY PORT TEU*
1 Rotterdam 9,743,290
2 Antwerp 7,309,639
3 Hamburg 7,010,000
4 Bremen 4,535,842
5 Valencia 3,653,890
6 Algeciras 3,042,759
7 Gioia Tauro 2,857,438
8 Felixstowe 2,800,000
9 Zeebrugee 2,328,198
10 Malta Freeport 2,260,000
11 Le Havre 2,240,714
12 Barcelona 1,800,213
RANKING OF EUROPEAN CONTAINER PORTS, 2009
*TEU= Standard measure of maritime transport equivalent to a 20-foot container Source: Cargo Systems (008), Top 100 Containerports
Economic Promotion Area. Data Sheet 2010 21
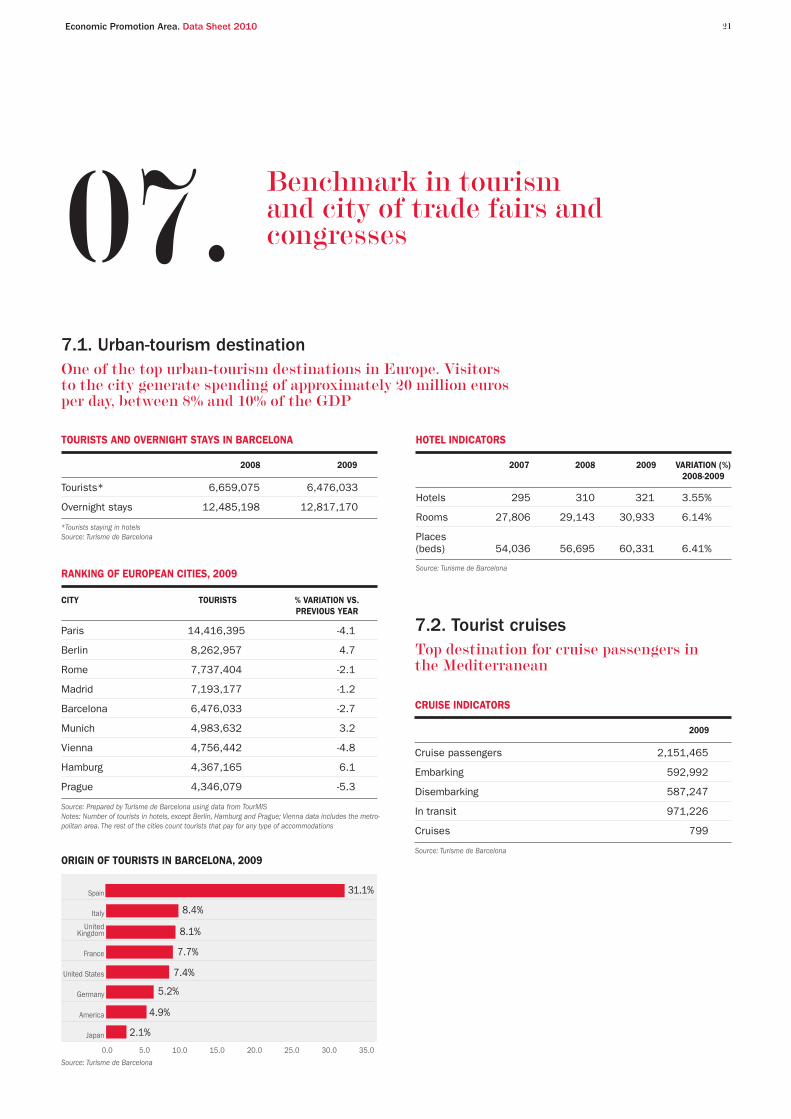
7.1. Urban-tourism destinationOne of the top urban-tourism destinations in Europe. Visitorsto the city generate spending of approximately 20 million eurosper day, between 8% and 10% of the GDP
Tourists* 6,659,075 6,476,033
Overnight stays 12,485,198 12,817,170
TOURISTS AND OVERNIGHT STAYS IN BARCELONA
*Tourists staying in hotelsSource: Turisme de Barcelona
2008 2009
ORIGIN OF TOURISTS IN BARCELONA, 2009
0.0 5.0 10.0 15.0 20.0 25.0 30.0 35.0
Spain
Italy
United Kingdom
France
United States
Germany
America
Japan
Source: Turisme de Barcelona
31.1%
8.4%
8.1%
7.7%
7.4%
5.2%
4.9%
2.1%
Hotels 295 310 321 3.55%
Rooms 27,806 29,143 30,933 6.14%
Places (beds) 54,036 56,695 60,331 6.41%
HOTEL INDICATORS
Source: Turisme de Barcelona
2007 2008 2009 VARIATION (%)2008-2009
7.2. Tourist cruisesTop destination for cruise passengers inthe Mediterranean
Cruise passengers 2,151,465
Embarking 592,992
Disembarking 587,247
In transit 971,226
Cruises 799
CRUISE INDICATORS
Source: Turisme de Barcelona
2009
07. Benchmark in tourismand city of trade fairs andcongresses
CITY TOURISTS % VARIATION VS. PREVIOUS YEAR
Paris 14,416,395 -4.1
Berlin 8,262,957 4.7
Rome 7,737,404 -2.1
Madrid 7,193,177 -1.2
Barcelona 6,476,033 -2.7
Munich 4,983,632 3.2
Vienna 4,756,442 -4.8
Hamburg 4,367,165 6.1
Prague 4,346,079 -5.3
RANKING OF EUROPEAN CITIES, 2009
Source: Prepared by Turisme de Barcelona using data from TourMISNotes: Number of tourists in hotels, except Berlin, Hamburg and Prague; Vienna data includes the metro-politan area. The rest of the cities count tourists that pay for any type of accommodations

TOTAL INDOOR SPACE (m2) → 280,000
22
7.3. City of trade fairs and congressesBarcelona, second city in the world fororganizing international meetings
Total meetings 1,775 2,482 1,857 -25.18
Congresses 340 383 294 -23.24
Conferences, Symposia, Courses N/A 286 215 -24.83
Conventions and incentives 1,435 1,813 1,348 -25.65
Total delegates 629,704 695,902 576,157 -17.21
CONGRESS ACTIVITY INDICATORS
Source: Turisme de Barcelona and Barcelona City Council
2007 2008 2009 VARIATION 08/09 (%)
MOBILE WORLD CONGRESS Cebit - HannoverEIBTMPISCINA Piscine - Lyon Intervad - DüsseldorfCONSTRUMAT Batimat - Paris Bau - MünchenALIMENTARIA Anuga - Köln Sial - ParisHOSTELCO Host - Milano Equiphotel - Paris SALÓN NAUTICO Nautico - Genova Boot - Düsseldorf EXPOQUIMIA Achema - Frankfurt Interchirmie - ParisHISPACK Interpack - DüsseldorfSALÓ DE LA LOGISTICA Transport et logistic - Paris Emballage - ParisBARCELONA MEETING POINT Mipm - Cannes Expo Real-MünchenAUTOMÒBIL Automobil - Frankfurt Mondial de l'Automobile - ParisCARAVANING Caravaning - DüsseldorfSONIMAGFOTO Photokina - Köln
TOP FAIRS IN EUROPE
Source: Fira de Barcelona
FIRA DE BARCELONA OTHER VENUES
RANKING 2009 CITY NUMBER OF MEETINGS
1 Vienna 160
2 Barcelona 135
3 Paris 131
4 Berlin 129
5 Singapore 119
RANKING 2009 CITY NUMBER OF MEETINGS
6 Copenhagen 103
7 Stockholm 102
8 Amsterdam 98
9 Lisbon 98
10 Beijing 96
WORLD RANKING OF CITIES BY NUMBER OF INTERNATIONAL MEETINGS, 2009
Source: International Congress & Convention Association

Economic Promotion Area. Data Sheet 2010 23
7.3. Ciutat de fires i congressosA model of quality, diverse and proximity-based retail, which generates economicactivity and social cohesion in the city’sneighbourhoods
7.3. Ciutat de fires i congressosTop city in Europe for quality of life
Number of companies 16,650
Jobs 151,724
MUNICIPAL MARKETS
Food 39
Special 4
Number of establishments 2,929
Total floor space 206,769 m2
Turnover* €7,511.67
RETAIL SALES IN BARCELONA , 2009
*Average sales per month and establishmentSource: INSS and Barcelona City Council
RETAIL SHOPS RANKING 2010 CITY
1 Barcelona
2 Munich
3 Stockholm
4 Paris
5 Zurich
6 Madrid
7 Copenhagen
8 Edinburgh
9 Geneva
10 London
BEST EUROPEAN CITIES IN QUALITY OF LIFE FOR WORKERS , 2010
Source: Cushman & Wakefield, European Cities Monitor 2010
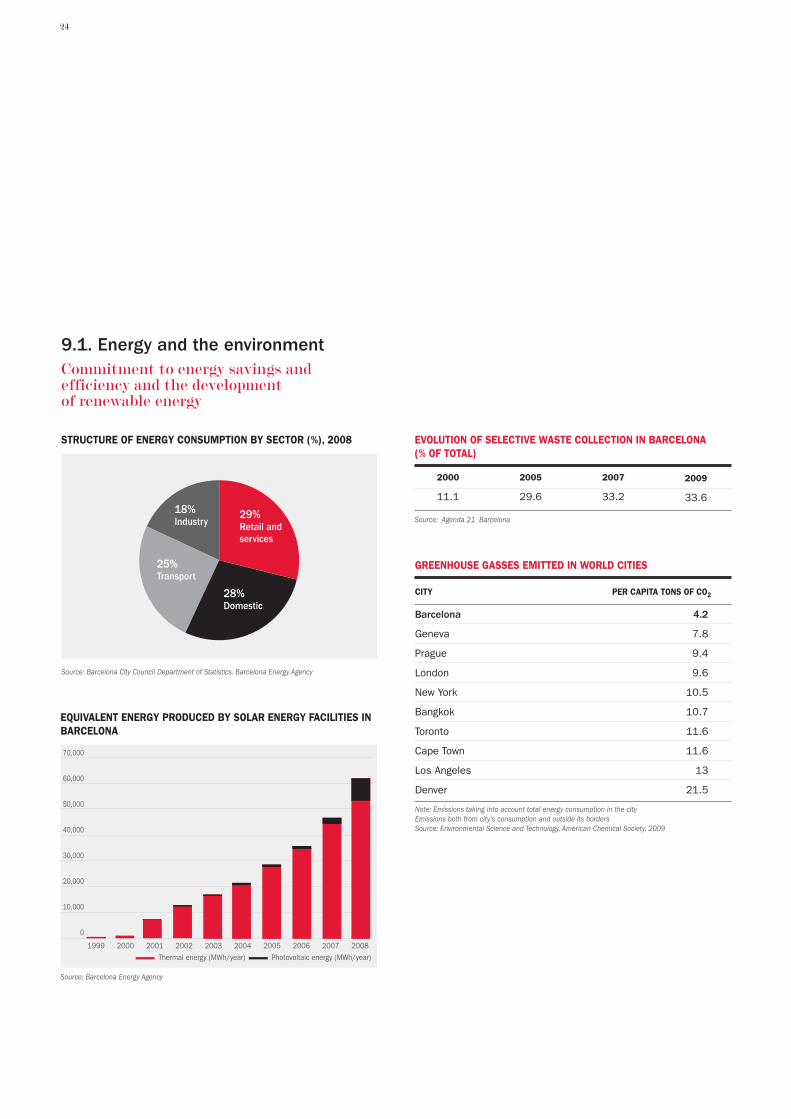
9.1. Energy and the environmentCommitment to energy savings andefficiency and the developmentof renewable energy
Urban parks (green zonesfor public use) 5,593,000 m2
Urban green (green spaces incorporatedinto the urban fabric) 10,757,181 m2
Per capita urban green space 6.7 m2/inhabitant
GREEN ZONE INDICATORS IN BARCELONA, 2008
Source: Barcelona City Council. 2009 Statistics Yearbook
2008
BEACHES (NUMBER / KM2) → 7 / 3,910
08. Retailsales 09. Quality of life
24
7.3. Ciutat de fires i congressosLa primera ciutat d’Europa en qualitat devida
STRUCTURE OF ENERGY CONSUMPTION BY SECTOR (%), 2008
25%Transport
18%Industry
28%Domestic
Source: Barcelona City Council Department of Statistics. Barcelona Energy Agency
29%Retail andservices
2000
11.1
2005
29.6
2007
33.2
2009
33.6
EVOLUTION OF SELECTIVE WASTE COLLECTION IN BARCELONA(% OF TOTAL)
Source: Agenda 21 Barcelona
EQUIVALENT ENERGY PRODUCED BY SOLAR ENERGY FACILITIES INBARCELONA
1999 2000 2001 2002 2003 2004 2005 2006 2007 2008
70,000
60,000
50,000
40,000
30,000
20,000
10,000
0
Source: Barcelona Energy Agency
Thermal energy (MWh/year)
9.1. Energy and the environmentCommitment to energy savings andefficiency and the development of renewable energy
Photovoltaic energy (MWh/year)
Barcelona 4.2
Geneva 7.8
Prague 9.4
London 9.6
New York 10.5
Bangkok 10.7
Toronto 11.6
Cape Town 11.6
Los Angeles 13
Denver 21.5
GREENHOUSE GASSES EMITTED IN WORLD CITIES
Note: Emissions taking into account total energy consumption in the cityEmissions both from city's consumption and outside its bordersSource: Environmental Science and Technology. American Chemical Society, 2009
CITY PER CAPITA TONS OF CO2
Economic Promotion Area. Data Sheet 2010 25
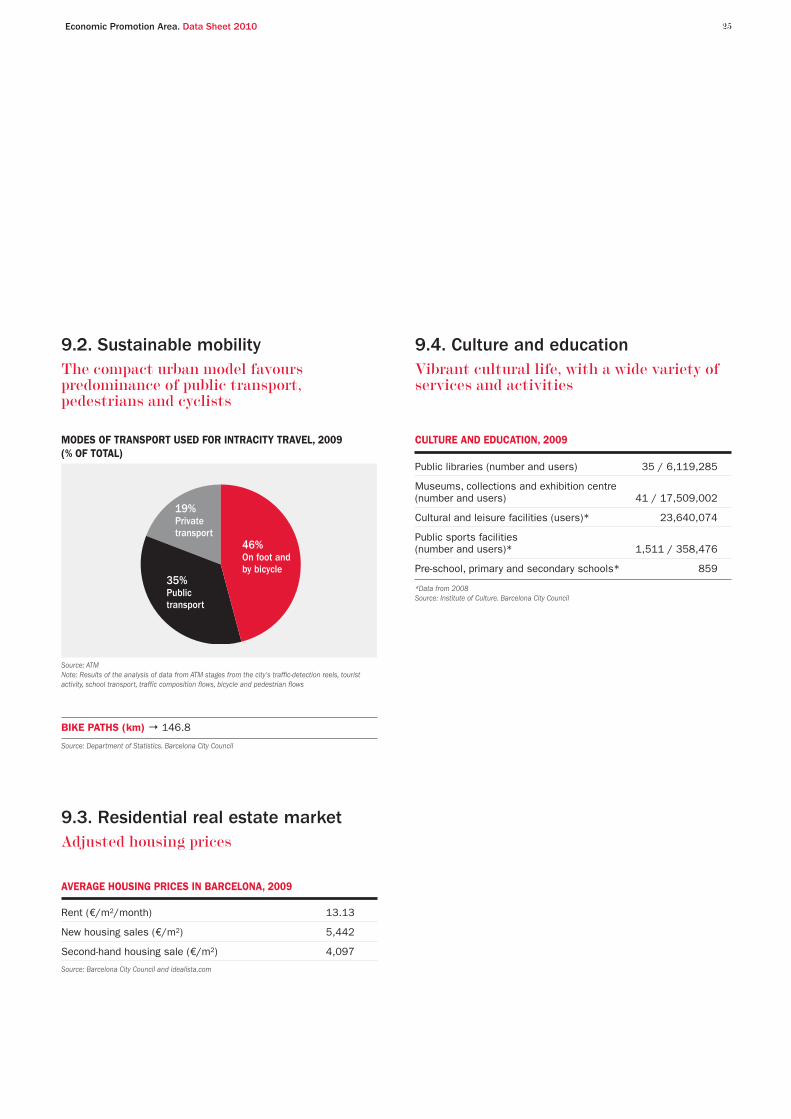
9.2. Sustainable mobilityThe compact urban model favours predominance of public transport, pedestrians and cyclists
9.4. Culture and educationVibrant cultural life, with a wide variety ofservices and activities
MODES OF TRANSPORT USED FOR INTRACITY TRAVEL, 2009 (% OF TOTAL)
19%Privatetransport
46%On foot andby bicycle
Source: ATMNote: Results of the analysis of data from ATM stages from the city's traffic-detection reels, tourist activity, school transport, traffic composition flows, bicycle and pedestrian flows
35%Publictransport
BIKE PATHS (km) → 146.8
Source: Department of Statistics. Barcelona City Council
9.3. Residential real estate marketAdjusted housing prices
Rent (€/m2/month) 13.13
New housing sales (€/m2) 5,442
Second-hand housing sale (€/m2) 4,097
AVERAGE HOUSING PRICES IN BARCELONA, 2009
Source: Barcelona City Council and idealista.com
Public libraries (number and users) 35 / 6,119,285
Museums, collections and exhibition centre(number and users) 41 / 17,509,002
Cultural and leisure facilities (users)* 23,640,074
Public sports facilities(number and users)* 1,511 / 358,476
Pre-school, primary and secondary schools* 859
CULTURE AND EDUCATION, 2009
*Data from 2008Source: Institute of Culture. Barcelona City Council

26
“European Cities Monitor" (2010)5th best European city for business 2nd city in Europe of greatest progress1st city in Europe for worker’s quality of life4th best known city in Europe6th best city in internal transport 6th best city in availability of office space 6th best city in value for money in office space 9th cost of staff
"Scorecard on Prosperity" (2010)3rd city in global prosperity1st city in labour attractiveness
“European cities and regions of the future” (2010-2011)5th European City for foreign direct investment potential 1st Southern Europe city4th best city in human resources4th best infrastructure in Europe
“World Country & City Rankings” (2009) 2nd city in the world for organising international meetings
“International Meeting Statistics” (2009)5th city in the world for organising international congresses
“Best Conference Destination” (2010)Silver –Barcelona (2nd)
“Prices and Earnings” (August 2010)Purchasing power30th global city
"World-wide cost of living survey" (2009)Out of the group of 30 world more expensive cities
“World’s happiest cities” (2009)3rd world city
“World’s best cities to eat well” (2009)5th world city(GFK Custom Research North America)
10. International positioningof Barcelona
Economic Promotion Area. Data Sheet 2010 27

Economic PromotionArea
The City Council of BarcelonaC. Llacuna 162, 1st floor08018 Barcelona · Spainwww.bcn.cat/barcelonabusiness
www.bcn.cat/barcelonabusiness