Barbara Hammer, Marc Strickert and Thomas Villmann- Prototype based recognition of splice sites
31
Prototype based recognition of splice sites Barbara Hammer , Marc Strickert , and Thomas Villmann University of Osnabr¨ uck, Department of Mathematics/Computer Science, Albrechtstraße 28, 49069 Osnabr¨ uck, Germany , hammer,marc @informatik.uni-osnabrueck.de University of Leipzig, Clinic for Psychotherapy and Psychosomatic Medicine, Karl-Tauchnitz-Straße 25, 04107 Leipzig, Germany, [email protected] Summary. Splice site recognition is an important subproblem of de novo gene finding, splice junctions constituting the boundary between coding and non-coding regions in eukaryotic DNA. The availability of large amounts of sequenced DNA makes the development of fast and reliable tools for automatic identification of important functional regions of DNA necessary. We present a prototype based pattern recognition tool trained for automatic donor and acceptor recognition. The developed classification model is very sparse and allows fast iden- tificat ion of splic e sites. The metho d is compared with a recen t model based on supp ort vec- tor machines on two publicly available data sets, a well known benchmark from the UCI- repository for human DNA [6] and a large dataset containing DNA of C.elegans. Our method shows competitive results and the achieved model is much sparser. 3 1 Introduction Rapid advances in biotechnology have made massive amounts of biological data available so that automated analyzing tools constitute a prerequisite to cope with huge and complex biological sequence data. Machine learning tools are used for widespread applications ranging from the identification of characteristic functional sites in genomic DNA [39], the prediction of protein secondary structure and higher structures [53], to the classification of the functionality of chemical compounds [5]. Here we will deal with a subpro blem in de novo gene finding in DNA sequence s of a given species, the problem of splice site recognition. For higher eukaryotic mech- anisms gene finding requires the identification of the start and stop codons and the recognition of all introns, i.e. non-coding regions which are spliced out before tran- scription, that means all donor and acceptor sites of the sequence. The biological splicing process is only partially understood [64]. Fig. 1 depicts a schematic view of the splicing process for eukaryotes: if genes become activated, transcription describes the process of synthesizing a copy of the coding strand of the double -stran ded DNA start ing at the promoter site, thereb y substitut ing Thymine (T) The program is available at http://www.informatik.uni-osnabrueck.de/lnm/upload/
Transcript of Barbara Hammer, Marc Strickert and Thomas Villmann- Prototype based recognition of splice sites
8/3/2019 Barbara Hammer, Marc Strickert and Thomas Villmann- Prototype based recognition of splice sites
http://slidepdf.com/reader/full/barbara-hammer-marc-strickert-and-thomas-villmann-prototype-based-recognition 1/31
Prototype based recognition of splice sites
Barbara Hammer
, Marc Strickert
, and Thomas Villmann¡
¢
University of Osnabruck, Department of Mathematics/Computer Science,
Albrechtstraße 28, 49069 Osnabruck, Germany,£
hammer,marc ¤ @informatik.uni-osnabrueck.de¥
University of Leipzig, Clinic for Psychotherapy and Psychosomatic Medicine,
Karl-Tauchnitz-Straße 25, 04107 Leipzig, Germany,
Summary. Splice site recognition is an important subproblem of de novo gene finding, splice
junctions constituting the boundary between coding and non-coding regions in eukaryoticDNA. The availability of large amounts of sequenced DNA makes the development of fast and
reliable tools for automatic identification of important functional regions of DNA necessary.
We present a prototype based pattern recognition tool trained for automatic donor and
acceptor recognition. The developed classification model is very sparse and allows fast iden-
tification of splice sites. The method is compared with a recent model based on support vec-
tor machines on two publicly available data sets, a well known benchmark from the UCI-
repository for human DNA [6] and a large dataset containing DNA of C.elegans. Our method
shows competitive results and the achieved model is much sparser. 3
1 Introduction
Rapid advances in biotechnology have made massive amounts of biological dataavailable so that automated analyzing tools constitute a prerequisite to cope with
huge and complex biological sequence data. Machine learning tools are used for
widespread applications ranging from the identification of characteristic functional
sites in genomic DNA [39], the prediction of protein secondary structure and higher
structures [53], to the classification of the functionality of chemical compounds [5].
Here we will deal with a subproblem in de novo gene finding in DNA sequences of
a given species, the problem of splice site recognition. For higher eukaryotic mech-
anisms gene finding requires the identification of the start and stop codons and the
recognition of all introns, i.e. non-coding regions which are spliced out before tran-
scription, that means all donor and acceptor sites of the sequence.
The biological splicing process is only partially understood [64]. Fig. 1 depicts
a schematic view of the splicing process for eukaryotes: if genes become activated,transcription describes the process of synthesizing a copy of the coding strand of the
double-stranded DNA starting at the promoter site, thereby substituting Thymine (T)¦
The program is available at http://www.informatik.uni-osnabrueck.de/lnm/upload/

8/3/2019 Barbara Hammer, Marc Strickert and Thomas Villmann- Prototype based recognition of splice sites
http://slidepdf.com/reader/full/barbara-hammer-marc-strickert-and-thomas-villmann-prototype-based-recognition 2/31
2 B. Hammer, M. Strickert, and T. Villmann
mRNA
DNA
pre−mRNA
transcription
splicing
translation
protein
exon intron exon exonintron
GT AG GT AG
... ...
... ...
... ...
AG GU AGGU
... ...
Fig. 1. Schematic view of the major steps in protein synthesis: from the point of view of
computational biology, transcription consists in copying the relevant information of the DNA;
splicing in eukaryotes deletes the non-coding substrings of the pre-mRNA, and translation
substitutes triples of bases by new symbols for the amino acids. The resulting sequence de-
scribes the primary structure of the synthesized protein.
by the base Uracil (U). Since the information contained in the two strings is identi-cal, DNA is often represented only by a single strand and U and T are used as syn-
onyms in computational biology. Splicing accounts for a deletion of the non-coding
regions of the pre-mRNA. The resulting mRNA is then translated into a sequence
of amino acids which folds into the native state of the protein. Thereby, three letters
encode one amino acid. Start and stop codons denote the boundaries of translation.
For canonical splice sites, the 5’ boundary or donor site of introns in mRNA usually
contains the dinucleotides GT and the 3’ boundary or acceptor site contains the din-
ucleotide AG. Non-canonical splice-sites not centered around AG and GT account
for less than §¨
and they are not tackled within most automated splice site recog-
nition programs. Splice sites have strong specific consensus strings. In addition, a
pyrimidine-rich region precedes AG, and a short consensus can be observed at the
branch site 18-40 bp upstream of the 3’ site in higher eukaryotes. Naturally, reading
frames can only be found in coding regions [40]. It is not yet clear whether infor-
mation beyond the pure DNA sequence such as secondary structure is also relevant
for splicing [48]. In addition, splicing need not be deterministic and it might depend
on external conditions. Alternative splicing is so far seldom tackled within machine
learning approaches although it occurs at a much higher rate than previously ex-
pected e.g. for human DNA [17]. Alternative splicing might account for diseases,
and steps towards adequate representation of alternative splicing and computational
modeling are currently investigated [8, 29, 34].
Here we will consider the problem of splice site recognition based on a local win-
dow around a potential splice site. We will restrict ourselves to canonical splice sites
for which large databases are avaliable for extensive evaluation of splice site recog-
nition methods. On the one hand side, the development of reliable signal sensors
for sequences based on given training data constitutes a typical problem in bioinfor-matics and prominent methods and typical design criteria for machine learning tools
for sequences can be explained within this context. On the other hand, good splice
8/3/2019 Barbara Hammer, Marc Strickert and Thomas Villmann- Prototype based recognition of splice sites
http://slidepdf.com/reader/full/barbara-hammer-marc-strickert-and-thomas-villmann-prototype-based-recognition 3/31
Prototype based recognition of splice sites 3
sensors would do a nearly perfect job for ab initio gene finding. Note that a consid-
erable amount of genes annotated in newly sequenced genomes is purely the result
of computational predictions, hence the development of accurate prediction mod-
els is essential [55]. Usually, signal sensors are integrated into more general content
sensors and complete gene prediction systems. However, a reduction of the numberof potential splice sites and accurate splice site sensors would lead to significantly
reduced computation time and more accurate overall gene prediction.
Various machine learning tools have been proposed to detect splice sites auto-
matically based on mRNA sequences, either as stand-alone system or as subsystem
within a gene-finder. Recent systems try to incorporate evolutionary patterns and
combine gene location with phylogenetic or alignment information from close or
weak homologues [45, 47]. However, these methods require that annotated DNA of
the same or a similar family exists. Due to common patterns of splice sites, machine
learning tools, which work solely on a local window around potential splice sites,
constitute promising approaches, if representative data for the respective organism
are available. Popular methods include feedforward neural networks [11, 42, 51, 66],
statistical models [14, 31, 55, 61], logical formulas, decision trees, or combinations[12, 49, 50, 54], or, recently, support vector machines (SVM) [63]. All state-of-the-
art methods achieve an accuracy above ¨
. However, it is difficult to compare the
models directly: results have been presented for different scenarios in the literature
and training and test data are not exactly documented as discussed in [55]. It is often
not documented how negative examples, i.e. local windows which do not contain
splice sites, are obtained for training. They might be chosen close to true splice sites
or further away. The classification accuracy highly depends on the training and test
examples and a great variety in the complexity of the task for different organisms or
even within one organism can be observed. Moreover, alternative evaluation criteria
such as the model sensitivity and specificity are often documented for different levels
which cannot directly be compared. Since it is not clear which data has been used for
training, the posterior evaluation of publicly available methods, as done e.g. in [55],
also gives only a partial picture.
The methods vary in complexity and accuracy. The computational expensive ones
are usually more accurate, as demonstrated e.g. in the work presented in [63] where
SVMs based on various kernels are proposed. Among these kernels the ones which
are based on statistical models are computationally quite demanding. However, the
possibility of fast classification is a prerequisite if DNA sequences are to be clas-
sified in an online e.g. Web-based environment. An additional problem consists in
the fact that data are potentially high-dimensional in this task because it is not clear
which size of a local window contains all relevant information for reliable splice
site prediction. Too large windows, for example, might cause overfitting of the mod-
els. As a consequence, methods which guarantee good generalization independent
of the input dimensionality such as SVM are particularly promising [63]. Alterna-
tively, various models have been proposed which use small window sizes or only fewdata components, e.g. Boolean formulas or decision trees which use only a subset of
all input dimensions [12, 50]. In addition several explicit feature selection methods
have been proposed in the context of splice site recognition or other problems of
8/3/2019 Barbara Hammer, Marc Strickert and Thomas Villmann- Prototype based recognition of splice sites
http://slidepdf.com/reader/full/barbara-hammer-marc-strickert-and-thomas-villmann-prototype-based-recognition 4/31
4 B. Hammer, M. Strickert, and T. Villmann
bioinformatics [19, 20, 35, 41, 70]. As mentioned before, data in bioinformatics are
often very high-dimensional such as sequential data, expression data derived from
microarrays, or profiles, and only few training examples might be available at the
same time. Dimensionality reduction is necessary to guarantee valid generalization.
Besides, it might considerably speed up the classification and lead to sparse modelswhich also allow some insight into their behavior.
Here we are interested in a splice site recognition tool which is both, accurate and
sparse. For this purpose, we adapt a prototype based and similarity based learning
mechanism to this special problem of splice site recognition. The algorithm yields
very sparse and intuitive models by finding a small number of representative points
in the space of the training examples that characterize the data. The training process
can be interpreted in a mathematical precise manner as stochastic gradient descent.
It shows a stable behavior also for noisy data sets. The learning objective includes an
explicit term for margin optimization and good generalization ability is achieved. To
avoid a critical dependence on the initialization of the algorithm, we include neigh-
borhood cooperation of the prototypes during learning. In addition, the algorithm
can be combined with any adaptive similarity measure. In particular, relevance termsweight the input dimensions, i.e. the influence of a base nucleus on the splicing, ac-
cording to the contained information and therefore also high-dimensional data can
be dealt with. We evaluate our learning algorithm on two data sets used in the above
mentioned recent approach [63]. Both data sets are publicly available: on the one
hand side, a well known (though old and possibly low quality) benchmark data set
from the UCI repository [6] for human data (referred to as IPsplice) is included for
which many different methods have been evaluated in comparison [6]. On the other
hand a large dataset involving mRNA of C.elegans is used. For this dataset, extensive
tests of various SVMs are available but no other methods have been applied so far.
Since SVM showed the best performance for IPsplice as reported in [63] and consti-
tutes one of the most successful pattern recognition tools available today, we believe
that the accuracy achieved for SVM represents the state of the art and, hence, a new
approach can be evaluated based on these results using the same datasets.
2 Splice site recognition methods
We start with an overview of prominent splice site recognition sensors. On the one
hand side, this constitutes a representative collection of machine learning tools for
classification. On the other hand it demonstrates that the problem of accurate splice
sensors is not yet solved.
The basic task of splice site recognition is often tackled as a sensor problem, i.e.
splice site recognition is solely performed based on the local area around potential
splice sites. The overall likelihood of splice sites which also takes the length of ex-
ons and introns and further signals of the sequence into account is then computedin a second step using statistical methods and dynamic programming. For the basic
problem, splice site recognition can be formulated as a classification problem: win-
dows of fixed size around potential splice sites are chosen and constitute the input
8/3/2019 Barbara Hammer, Marc Strickert and Thomas Villmann- Prototype based recognition of splice sites
http://slidepdf.com/reader/full/barbara-hammer-marc-strickert-and-thomas-villmann-prototype-based-recognition 5/31
Prototype based recognition of splice sites 5
vectors. These input vectors of fixed size, whereby the nucleotides T, C, G, A can be
encoded in a unary fashion in a four-dimensional vector space, are mapped to one of
the classes donor, acceptor, or neither.
Different approaches have been proposed to solve this classification task for a
given organism. The earliest and most simple approaches are based on consensusstrings around splice sites such as PROSITE expressions [3]. This method is fast
and it generalizes well to new data, however, it is not very accurate for modeling
a given training set. Slightly more complex methods take the probabilities of the
single nucleotides in a given training set into account. In the weight matrix model
(WMM) matches of the entries with nucleotides are scored with different weightings
around a potential splice site and the window size is usually chosen in the range
of the consensus string. The overall score then gives the probability of splice sites
[60]. This method can be interpreted as a naive Bayesian classifier [15]. Assume that
!
is the # th feature (i.e. nucleotide at position # ) of the example
, and $ is a
potential class, i.e. the indication whether a splice site or not is present for
. Given
, Bayesian decision yields the class
$%
argmax'
(
! 1 3 3 3 1 8 ! A
$
!(
$
!
(
! 1 3 3 3 1 8
! !
3
Naive Bayes assumes independence of the features, i.e.
(
! 1 3 3 3 1 8 ! !
%
(
! ! H 3 3 3 H ( 8 ! ! 3
These values are estimated on a given representative training set, maximizing the log
likelihood for the given data. This method is fast but still not very accurate, because
the assumption of independence between nucleotides cannot be maintained for DNA
sequences.
Weight array matrix models generalize to first order dependencies of consecutive
nucleotides by assuming a probability distribution of the form
(
! 1 3 3 3 1 8
! !
%
(
! ! (
¡
! A
! ! 3 3 3 ( 8
! A 8
S
! !
i.e. a first order Markov model is chosen [71]. The same model has been proposed
in the articles [31, 61] within an explicit statistical context. The probabilities can
efficiently be computed by means of dynamic programming, i.e. Viterbi decoding,
and training can be done using standard methods such as the Baum-Welsh algorithm.
This procedure is still only polynomial in time with respect to the size of the win-
dow, which is very efficient. Note that the Markov models can be embedded into
more complex hidden Markov models for complete gene finding as proposed in the
contributions [31, 61]. However, these models are often restricted to only first order
dependencies of adjacent nucleotides.
A variety of statistical models which also take more complex dependencies intoaccount and which are shortly mentioned below has been proposed [2, 14, 36, 61].
It is necessary to balance the complexity of the model (i.e. the window sizes and the
dependencies which are taken into account) with the number of available training
8/3/2019 Barbara Hammer, Marc Strickert and Thomas Villmann- Prototype based recognition of splice sites
http://slidepdf.com/reader/full/barbara-hammer-marc-strickert-and-thomas-villmann-prototype-based-recognition 6/31
6 B. Hammer, M. Strickert, and T. Villmann
patterns so that the parameters can be reliably estimated. As a consequence of the
comparably small data sets which were available in the past, many models take only
low order dependencies into account. Expansion to higher order correlations are of-
ten accompanied by careful, possibly automated mechanisms to select only relevant
information.In HSPL a linear discriminant recognition function is based on triplet frequencies
in various functional parts of the DNA and octanucleotides in potential protein cod-
ing and intron regions [61]. The method [36] proposes to also integrate a more global
feature, the compositional contrast with respect to the elements U and GU
C to the
local windows. The approach [2] integrates pair-wise correlations of the nucleotides
using a second order approximation of the probability in an appropriate expansion
according to higher correlations. Since more correlations are integrated, the results
can be more accurate than first order Markov models, whereby the complexity of
classification is also polynomial with respect to the window size. Another extension
of Markov models are Bayesian decision trees as introduced in [14]. These models
can account for more general dependencies of the form
V
! 1 3 3 3 1 8 ! !
%
V
! ! H
V
¡
! A
! ! H
V
Y ! A
! ! H 3 3 3
where each feature might influence the probability of more than one other feature,
i.e. every probability V
! A ` ! !
might occur with the restriction that all de-
pendencies can be formulated within a directed tree structure. E.g. cycles are not
allowed. The tree structure is determined automatically in the approach [14] based
on pairwise mutual information of all variables. The (in an arbitrary way oriented)
spanning tree which maximizes the overall mutual information between adjacent
features within this tree is then chosen and the probabilities are determined by the
relative frequencies of the features. Hence, appropriate global information can be
detected automatically within this approach. However, the choice of the direction of
the tree puts a causality assumption to processing and only limited correlations are
integrated.As an alternative, one can iteratively construct a decision tree which successively
divides the splice site recognition problem into subclasses of simpler form based on
particularly distinguishing features [12]. The feature which determines the respec-
tive next division is chosen using so-called maximum dependence decomposition
(MDD). This computes for each pair of nucleotide positions their b
¡
statistics and
chooses the position with maximum overall value. The leafs are built with simple
WMM models for the remaining data. Some particularly relevant global dependen-
cies are combined with simple WMM models. A further modification of this model
has been proposed in [55]. Here MDD is combined with first order Markov mod-
els, i.e. WAMs, at the leafs. This yields very good results in comparison to several
alternative methods as reported in [55]. Note that a second optimization step is inte-
grated into the first direct prediction of potential splice sites which takes all scores ina local window into account. This global second step has been proposed in [10] and
can in principle be integrated into all splice site prediction models. However, most
statistical models induce severe restrictions such as limited correlation since other-
8/3/2019 Barbara Hammer, Marc Strickert and Thomas Villmann- Prototype based recognition of splice sites
http://slidepdf.com/reader/full/barbara-hammer-marc-strickert-and-thomas-villmann-prototype-based-recognition 7/31
Prototype based recognition of splice sites 7
wise models would become too complex and reliable parameter estimation would no
longer be possible.
Alternatives to statistical models are offered by classical decision trees or induc-
tion of logical formulas e.g. in disjunctive normal form [50, 54]. Appropriate feature
selection mechanisms form the core of each algorithm to avoid too complex formu-las. The resulting models are usually sparse and provide explicit insight into the way
of classification.
A further even more successful class of algorithms is based on more complex pat-
tern recognition tools which can, in principle, model every possibly nonlinear depen-
dency among variables within an appropriate window. Feedforward neural networks
(FNNs) [52] constitute a very prominent approach for splice site recognition that is
proposed by various authors [11, 42, 51, 66]. A complex nonlinear function is com-
puted to approximate the decision boundaries. The functions are composed of affine
functions and a fixed nonlinearity. In principle, all possible dependencies can be cap-
tured by this approach. Training takes place with some gradient descent mechanism
on the training error. The resulting classifier is still fast, but usually no longer com-
prehensive for humans. In addition, the generalization ability of this approach scaleswith the number of free parameters of the model. Since the number of parameters
is commonly lower bounded by the input dimension, high-dimensional data might
cause problems. The approaches [11, 51] therefore include further information which
allows a more direct computation of the classification borders: additional informa-
tion about binding energies and explicit encoding of adjacent dinucleotides of the
DNA sequence. Nevertheless, several state of the art gene finder such as NNSplice
[51], NetGene2 [30], and GENIO [42] are based on neural splice site sensors.
Recently, support vector machines (SVM) have also been proposed for splice site
detection [13]. Since worst case generalization bounds which are independent of the
dimensionality of the input data can be derived for SVMs, they seem particularly
suited for splice site recognition with potentially large window and small training
sets. Informally spoken, a SVM combines a fixed nonlinear embedding of data in
a possibly high-dimensional feature space with a trainable linear classifier. Training
yields structural risk minimization because it chooses a separating point with largest
possible margin of the data to the separation hyperplane. The nonlinear embedding
is computed only implicitly using a kernel function. Appropriate design of a suitable
kernel constitutes a key issue for accurate classification. The final SVM classifier
can be computed as linear combination of the kernel evaluated at the respective data
point and a subset of the training set which determines the output, the so-called sup-
port vectors. SVM training is polynomial with respect to the number of patterns.
However, for large data sets the computational effort might still be quite high. In
addition, the classification time depends on the number of support vectors which is
usually given by a fraction of the training set. Hence, classification might take much
longer than for alternatives such as feedforward networks or statistical models. Fur-
thermore, the classification can often not be interpreted by humans since SVM isa black-box classifier. Another contribution [48] combines a SVM with a standard
kernel with additional information related to secondary structure and binding ener-
gies leading to good results. The approach [19] introduces an input reduction scheme

8/3/2019 Barbara Hammer, Marc Strickert and Thomas Villmann- Prototype based recognition of splice sites
http://slidepdf.com/reader/full/barbara-hammer-marc-strickert-and-thomas-villmann-prototype-based-recognition 8/31
8 B. Hammer, M. Strickert, and T. Villmann
wrapped around SVM classification which might considerably reduce the classifica-
tion time, provides further insight into the model, and might increase the accuracy.
In that approach, the features which affect the prediction least are iteratively deleted.
Alternative relevance determination schemes such as statistical considerations might
also be appropriate [41]. Recently, several specific SVM kernels which are partic-ularly suitable for the processing of spatio- or temporal data have been proposed,
e.g. [28, 33]. The splice site recognition model proposed in [63] uses several kernels
which are specifically designed for the actual problem. Kernels can be derived from
statistical models such as the Fisher kernel [33] and the TOP-kernel [62]. The ba-
sic statistical model from which the kernels are derived is a hidden Markov model.
The SVM approach increases the discriminative power of the original HMM model
at least if enough training data are avaliable [63]. However, the complexity is quite
demanding with respect to training and classification time. A third kernel applied in
[63] for splice site recognition takes local correlations of time series into account
and gives good results already for small training sets. Overall, SVM gives excellent
results due to its inherent structural risk minimization. Still, the design of appropriate
kernels is crucial, and the such designed models are usually computationally quitedemanding.
All splice site recognition models can be integrated as signal sensors into com-
plex gene finding systems and the accuracy of prediction can be increased integrating
local classification results. In complex gene finding tools, often further considera-
tions and information are integrated such as homologies to already annotated DNA
from appropriate databases.
The question now occurs which method can be used for the splice site detec-
tion of a newly sequenced organism. It is complicated to directly compare the basic
sensor models due to various reasons: the models have been trained for different or-
ganisms and usually the used data sets are not publicly available and mostly also not
exactly documented. For example, we do not know how negative training examples
(i.e. non-splice sites) have been chosen. Typical representatives for non-splice sites
might vary depending on whether they are chosen in a neighborhood of splice sites
or not, for example. In addition, available training data changes frequently due to
newly sequenced genomes. As a consequence, reported results seldom refer to simi-
lar or even the same training sets and cannot be compared directly. An exception is a
data set used in the StatLog project; competitive results for many different machine
learning tools are available for this (though old and possibly outdated) data set [50].
The contribution [55] provides another comparison of several different state-of-the-
art splice site predictors. This is done by testing publicly available prediction servers
on the web with the same data set. It can, of courses, not be guaranteed that the used
test data has not been used for training for these programs and the results might be
overly optimistic. In addition, classification accuracy is measured using sensitivity
and specificity with respect to donors or acceptors. Since the achieved values are
different for the different programs, the results can only be compared to the newlyproposed method of [55] for which a ROC curve, which relates the value §
cspeci-
ficity to the sensitivity value, is available.
8/3/2019 Barbara Hammer, Marc Strickert and Thomas Villmann- Prototype based recognition of splice sites
http://slidepdf.com/reader/full/barbara-hammer-marc-strickert-and-thomas-villmann-prototype-based-recognition 9/31
Prototype based recognition of splice sites 9
Several characteristics of splice site recognition sensors (including the accuracy,
of course) are interesting for the evaluation of the model efficiencies:
d Accuracy of classification: the methods should achieve a high classification ac-
curacy. However, the accuracy might critically depend on the chosen evaluationdata as discussed above. In addition, the models might differ with respect to the
specificity of classification, i.e. the number of correctly predicted splice sites
compared to the number of all sites which are predicted as splice sites, and the
sensitivity, i.e. the number of correctly predicted splice sites compared to the
number of all splice sites in the training set. The accuracy of modern systems is
reported as more than ¨
. More complex methods are usually more accurate
and more specific to the problem. Statistical assumptions might priorly restrict
the models such that perfect prediction is not possible in comparison to (in the-
ory) approximation complete FNNs or SVMs [21, 32].d
Training effort: of course, models with low training effort are preferred to com-
plex ones. However, training time is often less critical because it has to be
done only once in an offline fashion. Since ever larger amounts of training data
are available, methods which allow to further refine already trained models if new data becomes available are of particular interest. For several models such
as WAMs, WMMs, and SVMs, polynomial training time can be guaranteed,
whereas FNNs have worst-case exponential training time although they often
perform reasonably well in practice.d Classification effort: in particular for online systems, the classification effort
should be as small as possible. Sparse models are much more efficient than more
complex systems. However, most statistical models and also FNNs achieve a
classification in very short time. SVMs might take much longer because their
classification effort depends also on the number of support vectors, which usu-
ally scales with the training set size.d
Generalization ability and necessary training set size: data might be high--
dimensional and possibly just few training data are available (or have been avail-able in the past) so that good generalization ability of the models to unseen exam-
ples is required. Hence, statistical models are often restricted to only low order
correlations although higher order correlations occur in practice. Methods for
complexity reduction, such a input pruning or margin optimization in SVMs,
seem particularly appropriate for these tasks.d Sparseness of the models: sparse models often need considerably smaller classi-
fication time and possibly allow to gain insight into the classification behavior.
Biological insight into relevant features and important correlations of nucleotides
with respect to the classification task are, of course, interesting features of mod-
els. Here, simple statistical models are more intuitive compared to possibly com-
plicated SVM or FNN classifiers.d
Integration of the models into a gene prediction system: usually splice sensors
constitute a subtool of gene prediction tools. Therefore, it should be possible to
integrate the models into larger ones. It might be necessary to vary specificity
and sensitivity of the systems to account for the specific properties of the whole
8/3/2019 Barbara Hammer, Marc Strickert and Thomas Villmann- Prototype based recognition of splice sites
http://slidepdf.com/reader/full/barbara-hammer-marc-strickert-and-thomas-villmann-prototype-based-recognition 10/31
10 B. Hammer, M. Strickert, and T. Villmann
prediction machinery. This can usually easily be achieved for statistical mod-
els, neural networks, and support vector machines since one can simply adapt
the classification threshold in an appropriate way. Adaptation of specificity and
sensitivity might, however, not be possible for computational logic approaches.
We will in the following propose a new approach, a prototype based classification.
This approach achieves results which are competitive to a recent SVM approach but
adding some advantages: like SVM, the prototype based classification can be inter-
preted as margin optimizer, hence very good generalization ability is achieved. The
approach constitutes in principle a universal approximator. An explicit adaptation of
the underlying metric to sequential data is possible. The approach is accompanied
by a very robust and fast training method (although polynomial worst case training
time cannot be guaranteed). However, unlike SVM, the model provides very sparse
classifiers, the classification provides further insight into relevant factors, and more-
over classification time is very low. Sensitivity and specificity of the model can be
adapted as appropriate for complete gene finders.
3 Prototype based clustering
Assume that a clustering of data into e classes is to be learned and a finite train-
ing set f
1g ! i q
8s
f§
13 3 3 1
eu
A
#% §
13 3 3 1 y
u of training data is given. For
splice site recognition we find or classes corresponding to donors, acceptors, and
decoys. Denote by % f
A
#% §
13 3 3 1 y
u all input signals of the training set.q
8
denotes the potentially high-dimensional data space. DNA sequences are com-
monly encoded as concatenation of unary nucleotides. The classes are enumerated
by f§
13 3 3 1
eu
. We denote the components of a vector
q
8
by subscripts, i.e.,
%
13 3 3 1 8 !
. Learning vector quantization (LVQ) as introduced by Kohonen
combines the accuracy of supervised training methods with the elegance and sim-
plicity of self-organizing systems [37]. LVQ represents every class $ by a set
$
!
of weight vectors (prototypes) inq
8
. Weight vectors are denoted by
and their
respective class label is referred to by $
. A new signal
q
8
is classified by the
winner-takes-all-rule by an LVQ network, i.e.
$
!
%$
such that
1
!
is minimum.
1
!
%
c
¡
%
c
!
¡
denotes the squared Euclidean distance of
the data point
to the prototype
. The respective closest prototype
is called
winner or best matching unit. The subset
l
%f
A
1
!
is minimum u
is called receptive field of neuron
.The training algorithm of LVQ aims at minimizing the classification error on
the given training set. I.e., the difference of the points belonging to the $ th class,
f
Ag
%$ u
, and the receptive fields of the corresponding prototypes,

8/3/2019 Barbara Hammer, Marc Strickert and Thomas Villmann- Prototype based recognition of splice sites
http://slidepdf.com/reader/full/barbara-hammer-marc-strickert-and-thomas-villmann-prototype-based-recognition 11/31
Prototype based recognition of splice sites 11
o
'
l
, is minimized by the adaptation process. Training iteratively presents
randomly chosen data from the training set and adapts the respective closest proto-
type by Hebbian learning. Hebbian learning refers to the intuitive scheme to empha-
size already correct classifications and to de-emphasize bad ones. If a vector
is
presented, the update rule for the winner has the form
%
H
c
!
if $ % $
!
c
H
c
!
otherwise
1
§
!
is an appropriate learning rate. As explained in [56] this update can be
interpreted as a stochastic gradient descent on the cost function
Cost |} ~ %
|} ~
1
!3
denotes the squared Euclidean distance of
to the closest prototype
la-
beled with $
%
g
and
denotes the squared Euclidean distance to the closest
prototype
labeled with a label $
different fromg
. For standard LVQ, the
function is
|} ~
1
!
%
if
c
otherwise
Obviously, this cost function is highly discontinuous and instabilities arise for over-
lapping data distributions. Various alternatives have been proposed to achieve a more
stable behavior of training also in case of overlapping classes or noisy data. LVQ2.1
as proposed by Kohonen optimizes a different cost function which is obtained by
setting in the above sum
|} ~
¡
1
!
%
c
!
whereby
yields
the identity within a window in which adaptation of LVQ2.1 takes place, and
vanishes outside. Still this choice might produce an instable dynamic, i.e. prototypes
might diverge due to the fact that repelling forces from the term
might be larger
than attracting forces from the term
. To prevent this behavior as far as possible,
the window within which adaptation takes place must be chosen carefully.Note that LVQ2.1 explicitly optimizes the term
c
. It has been shown re-
cently that LVQ can therefore be interpreted as structural risk minimization scheme:
according to [18], the related term
c
c
c
!
constitutes the so-called hypothesis margin of the classifier. The hypothesis mar-
gin denotes the distance that the classifier can be changed (in an appropriate norm)
without changing the classification. As proved in [18], the generalization ability of a
LVQ-classifier can be estimated based on the hypothesis margin independently of the
dimensionality of the given input data. Hence LVQ can be interpreted as a large mar-
gin optimizer similar to SVMs thus aiming at optimizing the generalization ability
during training, which is a valuable feature.An alternative to LVQ2.1 which also explicitly optimizes the hypothesis margin
has been proposed in [56], so-called generalized LVQ (GLVQ). The respective cost
function can be obtained by setting
8/3/2019 Barbara Hammer, Marc Strickert and Thomas Villmann- Prototype based recognition of splice sites
http://slidepdf.com/reader/full/barbara-hammer-marc-strickert-and-thomas-villmann-prototype-based-recognition 12/31
12 B. Hammer, M. Strickert, and T. Villmann
|} ~
1
!
% sgd
c
U
whereby sgd
!
%
§U
c
! !
S
denotes the logistic function. As discussed in
[57], the additional scaling factors avoid numerical instabilities and divergent behav-ior also for overlapping data distributions. Note that the term
c
!
U
!
evaluates the classification of LVQ with a number between c§ (correct classi-
fication with large margin) and § (entirely wrong classification). The default classifi-
cation threshold is given by . The additional scaling caused by the logistic function
further emphasizes the relevant range of values around . Hence, the data points
for which the closest correct and the closest wrong prototype have almost the same
distance also contribute to the learning. Update rules for GLVQ can be obtained by
taking the derivatives with respect to the prototypes:
%
H
sgd
H
H
H
c
!
and
%c
S
H
sgd
H
S
H
H
c
!
denotes the update of the closest correct and closest wrong prototype, given an ex-
ample
, whereby
and
S
1
§
!
are the learning rates, the logistic function is
evaluated at position
!
%
c
!
U
!
, and
%
H
U
!
¡
and
S
%
H
U
!
¡
denote the derivatives of
|} ~
1
!
with respect to
and
.
Alternative modifications of LVQ with cost function optimization have been pro-posed, such as the recent statistic interpretation developed in [59]. However, the pro-
posed cost functions do often no longer optimize the hypothesis margin leading to a
worse generalization ability compared to GLVQ.
Since GLVQ is an iterative update scheme, it might suffer from the problem of
local optima: it constitutes a stochastic gradient descent on a possibly highly mul-
timodal cost function and the result might severely depend on the initialization of
prototypes. This problem already occurs for simple LVQ and LVQ2.1, Kohonen pro-
poses one possible solution: one can include neighborhood cooperation of the proto-
types to ensure a faithful representation of all modes of the given data [38]. Kohonen
proposes to combine LVQ with the so-called self-organizing map, a very intuitive
and well established unsupervised learning scheme which allows to find a topolog-
ical representation of given data points by a lattice of neurons [37]. The fact thatGLVQ can be interpreted as a stochastic gradient descent offers a particularly effi-
cient alternative way of neighborhood integration. We can combine the cost function
of GLVQ with the unsupervised Neural Gas algorithm (NG), the latter offering a
8/3/2019 Barbara Hammer, Marc Strickert and Thomas Villmann- Prototype based recognition of splice sites
http://slidepdf.com/reader/full/barbara-hammer-marc-strickert-and-thomas-villmann-prototype-based-recognition 13/31
Prototype based recognition of splice sites 13
particularly robust and efficient unsupervised learning scheme to spread prototypes
faithfully among a given data set [43, 44]. Unlike the self-organizing map, NG does
not rely on a fixed priorly chosen neighborhood structure but chooses automatically
a data-optimum lattice and computational artefacts and topological mismatches do
not occur for NG [68]. Given prototypes from a set and data points
(bothwithout class labels), NG optimizes the cost function
Cost
%
§
e
1 !
1
1
!
1
!
where
1
1
!
%
c
1
!
denotes the degree of neighborhood cooperativity,
1
!
yields the rank of
which is the number of prototypes
for which
1
!ª
1
!
is valid, and
e
1 !
is a normalization constant depending on the neighborhood range
and
cardinality
of . The learning rule is given by
%
H
1
1
!
c
!
where
«
is the learning rate.
Supervised Neural Gas
As already proposed in [25], NG can directly be combined with GRLVQ, integrating
neighborhood cooperation for prototypes of the same class, thus avoiding local op-
tima and accelerating convergence. The cost function of this supervised neural gas
(SNG) algorithm is
-®
%
°
1
1
g
!! H
®
1
!
e
1 g
!!
whereby
®
1
!
%
|} ~
1
!
% sgd
c
U
and
denotes the squared Euclidean distance of
to
.
g
!
denotes the car-
dinality of the set of prototypes labeled byg
, i.e.A
g
!A
.
denotes the closest
prototype not in
g
!
. Due to the NG-dynamics, all prototypes of a specific class
are adapted towards the given data point, preventing neurons from being idle or re-
pelled from their class. The simultaneous GLVQ dynamics makes sure that those
class borders are found which yield a good classification. In addition, the cost func-tion includes terms related to the hypothesis margin, just like GLVQ and original
LVQ. Note that vanishing neighborhood cooperativity
yields the original cost
function of GLVQ.
8/3/2019 Barbara Hammer, Marc Strickert and Thomas Villmann- Prototype based recognition of splice sites
http://slidepdf.com/reader/full/barbara-hammer-marc-strickert-and-thomas-villmann-prototype-based-recognition 14/31
14 B. Hammer, M. Strickert, and T. Villmann
The update formulas for the prototypes are obtained by taking the derivative. For
each
, all prototypes
g
!
are adapted by
%
H
sgd
A
H
H
1
1
g
!!
e
1 g
!!
H
H
c
!
and the closest wrong prototype is adapted by
%c
S
°
sgd
A
H
S
H
1
1
g
!!
e
1 g
!!
H
H
c
!3
and
S
1
§
!
are learning rates and the derivative of the logistic function is
evaluated at position
!
%
c
U
3
The terms
are again obtained as derivative of
®
as
%
H
U
!
¡
and
S
%
H
U
!
¡
3
The precise derivation of these formulas also for continuous data distributions can be
found in [24]. Note that the original updates of GLVQ are recovered if
. For
positive neighborhood cooperation, all correct prototypes are adapted according to a
given data point such that also neurons outside their class become active. Eventually,
neurons become spread among the data points of their respective class. Since all pro-
totypes have a repelling function on the closest incorrect prototype, it is advisable to
choose
S
one magnitude smaller than
. As demonstrated in [25] also highly mul-timodal classification tasks can be solved with this modification of GLVQ. Note that
GLVQ allows insight into the classification behavior by looking at the prototypes.
Often, a comparably small number of prototypes already yields good classification
accuracy.
4 Relevance learning and general similarity measures
SNG does no longer critically depend on initialization and shows stable behavior also
for overlapping classes. However, it depends crucially on the underlying Euclidean
metric. It is based on the assumption that data form compact clusters in Euclidean
space. This assumption is not met if heterogeneous data are dealt with for whichthe input dimensions have different relevance for the classification. The situation is
particularly critical if high-dimensional data are considered, where a large number
of possibly less relevant and noisy dimensions disturbs the whole classification. As
8/3/2019 Barbara Hammer, Marc Strickert and Thomas Villmann- Prototype based recognition of splice sites
http://slidepdf.com/reader/full/barbara-hammer-marc-strickert-and-thomas-villmann-prototype-based-recognition 15/31
Prototype based recognition of splice sites 15
discussed beforehand, biological data are often high-dimensional and heterogeneous.
Feature selection mechanisms have been proposed in various different scenarios [19,
20, 35, 41, 70]. In the case of splice site recognition, we would like to use large
windows to make sure that all relevant information is contained. It can be expected
that nucleotides close to potential splice sites within regions of consensus stringsare more relevant for classification than other entries. In addition, local correlations
might play an important role as indicated by various models based on correlations of
adjacent dinucleotides such as WAMs.
SNG possesses a cost function and it is straightforward to substitute the Eu-
clidean metric by an alternative, possibly adaptive one. A particularly efficient and
powerful model has been introduced in [26]: the Euclidean metric is substituted by
a weighted Euclidean metric which incorporates relevance factors for the input di-
mensions. I.e.,
1 g !
%
c
g
¡
is substituted by
²
1 g !
%
³
c
g
!
¡
whereby³
´
and
³
%§ . Appropriate scaling terms
³
allow to choose smallrelevance factors for less relevant or noisy dimensions such that high-dimensional
or heterogeneous data can be accounted for with an appropriate choice of ³
. Since
appropriate relevances are not a priori known, we adapt also the relevance terms with
a stochastic gradient descent on the cost function. The cost function of supervised
relevance neural gas (SRNG), i.e. SNG with weighted metric, is
-® ¶
%
°
1
1
g
!
! H
®
²
1
²
!
e
1 g ! ! (1)
whereby
²
º
%
²
1
!
,
S
denotes the closest prototype which does not belong
to
g !
measured according to the similarity measure
²
, and the rank of proto-
types is computed using similarity measure
²
, too. The updates with respect to theprototypes can be obtained as beforehand. Given
, all prototypes
g
!
are
adapted by
%c
H
sgd
A
H
H
1
1
g
!!
e
1 g
!!
H¼
²
¼
(2)
and the closest wrong prototype is adapted by
%
S
H
°
sgd
A
H
S
H
1
1
g
!!
e
1 g
!!
H
¼
²
¼
(3)
whereby the logistic function is evaluated at position
!
%
²
c
²
²
U
²
3
The terms
are again obtained as derivative of
®
as
8/3/2019 Barbara Hammer, Marc Strickert and Thomas Villmann- Prototype based recognition of splice sites
http://slidepdf.com/reader/full/barbara-hammer-marc-strickert-and-thomas-villmann-prototype-based-recognition 16/31
16 B. Hammer, M. Strickert, and T. Villmann
%
H
²
²
U
²
!
¡ and
S
%
H
²
²
U
²
!
¡
3
For the squared Euclidean metric, we obtain
¼
²
¼
%c
H½ H
c
!
whereby½
denotes the matrix with diagonal elements³
. The updates of the rele-
vance factors are given by
³
%
²
H
°
sgd
A
H
1
1
g
!!
e
1 g
!! (4)
H
H
¼
²
¼
³
c
S
H
¼
²
¼
³
3
(5)
Here
²
1
§
!
constitutes the learning rate for³
. It should be chosen some mag-
nitudes smaller than the learning rates for the prototypes such that adaptation of the
prototypes takes place in a quasi stationary environment and convergence and gener-
alization is optimized for each choice of relevance terms. For the squared Euclidean
metric, it holds¼
²
¼
³¾
%
¾
c
¾
!
¡
3
After each adaptation step, the relevance terms must be normalized to ensure the
constraint³
´
and
³
%§
. The precise derivation of these formulas also for
continuous data distributions can again be found in [24].
Note that input features with different relevances are now automatically taken
into account. In addition the resulting relevance profile of training allows to gain
insight into the problem since the resulting relevance profile indicates which input
features contribute most to the classification. The squared Euclidean metric consti-tutes one very efficient possible distance measure to compare prototypes and data
points. Note, however, that it is in principle possible to use an arbitrary differentiable
similarity measure
²
1
!
including possibly adaptive terms³
. The similarity
measure should be some positive function which measures in an adequate way the
closeness of prototypes and data points. It is well known that alternatives to the Eu-
clidean metric might be better suited for non Gaussian data e.g. because of larger
robustness with respect to noise or other properties [16]. In our experiments, we use
two further similarity measures which show more robust behavior and increase the
classification accuracy.
The weighted quartic metric
²
À
1 g !
º
%
³
¡
c
g
!
À
(6)
leads to faster convergence and better classification accuracy in some cases. Note
that this measure punishes large deviations of the data point from the prototype more
8/3/2019 Barbara Hammer, Marc Strickert and Thomas Villmann- Prototype based recognition of splice sites
http://slidepdf.com/reader/full/barbara-hammer-marc-strickert-and-thomas-villmann-prototype-based-recognition 17/31
Prototype based recognition of splice sites 17
than smaller ones in comparison to the weighted Euclidean distance. It seems partic-
ularly suited if the entries are not Gaussian but more sharply clustered. The quartic
similarity then better matches the test whether a large number of entries can be found
within the sharp clusters provided by the prototype coefficients.
In analogy to the so-called locality improved kernel (LIK) which has been pro-posed for splice site recognition to take local correlations of spatial data into account
[62, 63], we use the following similarity measure: assume data points have the form
%
13 3 3 1 8 !
and local correlations of neighbored entries
,
might be rel-
evant for the similarity;
might, for example, represent a local window of lengthÁ
around a potential splice site.
Â
then computes
²
Â
1 g !
º
%
8
Ã
³
Ä
1 g !
(7)
whereby
Ä
1 g !
%ÅÇ
¾
`Ã S
¾È
`
ÈÉ Ê Ë Ì
`
c
g
`!
¡ÍÎ
Ï
measures the correlation of the distances of the entries within a local window around
position # of the two data points. Ð
«
is typically chosen as a small natural number,
È
`
is a factor which is decreasing towards the borders of the local window such as
È
`
%§
Ò H A Ó A
U§
!
withÒ
«
,
ÈÉ
Ê Ë Ì
%
¾
`Ã S
¾
È
`
, and Õ denotes the radius of
the local windows. At the borders of the range of indices of
andg
, adaptation of
the window size is necessary.³
´
are adaptive values with
³
%§
. In the
case of DNA-sequences, entries consist of nucleotides which are embedded in a low-
dimensional vector space, i.e.
%
×
13 3 3 1 × Ø ! q
Ø
for some small Ù (e.g.
Ù% Û for unary encoding of nucleotides), and neighboring vectors
should be
compared. In this case we can generalize
Ä
1 g !
%ÅÇ
¾
`Ã S
¾È
`
ÈÉ Ê Ë Ì
Ø
Ý
Ã
`× Ø
c
g
`× Ø !
¡ÍÎ
Ï
if
andg
contain entries which are vectors inq
Ø
. Research reported in [51, 61, 63]
indicates that classification results for splice site recognition can be improved if local
correlations of nucleotides are taken into account. This is quite reasonable since local
correlations can easily detect, on the one hand side, reading frames and, on the other
hand, local consensus strings. LIK seems particularly suited for the task of splice site
recognition.
Note that we can easily substitute the weighted Euclidean metric by the quartic
similarity measure or the locality improved measure by substituting the metric in the
cost function 1 by the terms as defined in equation 6 or equation 7. The learning rulesare obtained from equations 2, 3, and 4 using the equalities
¼
²
À
1 g !
¼
% Û
H
³
¡
H
c
g !
Y
1¼
²
À
1 g !
¼
g % c Û
H
³
¡
H
c
g !
Y
1
8/3/2019 Barbara Hammer, Marc Strickert and Thomas Villmann- Prototype based recognition of splice sites
http://slidepdf.com/reader/full/barbara-hammer-marc-strickert-and-thomas-villmann-prototype-based-recognition 18/31
18 B. Hammer, M. Strickert, and T. Villmann
and¼
²
À
1 g !
¼
³
%
H
³
H
c
g
!
À
for the quartic similarity measure and
¼
²
Â
1 g !
¼
%
¾
à S
¾
H
³
H
Ð
H
Ä
1 g ! ! ß
à
ß
H
È
S
ÈÉ Ê Ë Ì
H
c
g
!1
¼
²
Â
1 g !
¼
g
%c
¾
à S
¾
H
³
H
Ð
H Ä
1 g ! !
ß
à
ß
H
È
S
ÈÉ
Ê Ë Ì
H
c
g ! 1
and¼
²
Â
1 g !
¼
³
%
Ä
1 g ! 3
5 A note on the generalization ability
The generalization ability of a classifier refers to the expected error for data which
have not been used for training in comparison to the training error. There exist var-
ious ways to formalize and prove the generalization ability of classifiers such as the
popular VC-theory [67]. Since data are often high-dimensional in problems of bioin-
formatics requiring many parameters to be tuned during training, methods which
directly optimize the generalization ability of the classifier seem particularly suited
for these tasks. One of the most prominent methods which directly aims at structural
risk minimization is the SVM. LVQ constitutes an alternative for which dimension
independent generalization bounds have recently been derived [18]. Here, we discuss
which aspects can be transferred to SRNG. We mention two possible argumentation
lines, one for fixed similarity measure and one which also captures adaptive rele-vance terms.
As already mentioned, generalization bounds for prototype based classifiers in
terms of the so-called hypothesis margin have been derived in [18]. The hypothesis
margin is given by the distance of the closest correct prototype compared to the
distance of the closest incorrect prototype. GLVQ as well as LVQ2.1 directly aim at
margin optimization and excellent generalization can thus be expected also for high-
dimensional data. We have substituted the Euclidean metric by different similarity
measures and the above argument does no longer apply. However, the bounds transfer
to a general similarity if the situation can be interpreted as a kernelized version of
the original algorithm. Kernelization constitutes a popular trick of which the SVM
constitutes the most prominent application. In our case, a kernel refers to a functioná
º
q
8
from the data space
q
8
to some Hilbert space
such that the similaritymeasure of our algorithm can be written as
1 g !
%
á !
c
á g !
8/3/2019 Barbara Hammer, Marc Strickert and Thomas Villmann- Prototype based recognition of splice sites
http://slidepdf.com/reader/full/barbara-hammer-marc-strickert-and-thomas-villmann-prototype-based-recognition 19/31
Prototype based recognition of splice sites 19
whereby refers to the respective similarity which we use in the actual version of
SRNG, and
H
refers to the metric of the Hilbert space . It has been shown
in [58] that suchá
can be found if constitutes a real-valued symmetric func-
tion with
1 !
% such that c
is conditionally positive definite, i.e. for all
Ù
ä
, $
13 3 3 1
$
Ø q
with
$
% and
13 3 3 1
Ø
q
8
the inequality
× `
$
$
`H
c§
!H
1
`
!´
holds. As an example, functions of the form è c é
Ï
for an arbitrary metric
H
and Ð
1
ë
fulfill these properties. The similarity mea-
sures which we use, the quartic measure and LIK, have been derived in analogy
to well-known kernels of SVM, but they do unfortunately not fulfill this condition.
Nevertheless, we could observe excellent generalization ability in our experiments.
Another more fundamental problem which prohibits the direct application of
these generalization bounds for SRNG consists in the fact that we change the sim-
ilarity measure during training: the relevance factors are adapted according to the
given training data. If arbitrary changes of the kernel were allowed, no generaliza-
tion bounds would hold [27]. If adaptation is restricted for example to convex com-
binations of fixed kernels, bounds have been established [9]. Arguments along this
line could also be applied to SRNG. However, another more direct argumentationis presented in [23] which derives a large margin generalization bound for the basic
weighted squared similarity measure also for adaptive relevance terms. We sketch
this result in the remaining part of this section.
Assume that a SRNG network with the weighted squared Euclidian similarity
measure and adaptive relevance terms is trained ony
data points
1g
!
, . . . ,
ì 1 g ì ! q
8s
fc §
1
§u
for a two-class problem with inputs
and outputsg
.
The two classes are referred to by c§
and § , for simplicity. We assume that the data
points are chosen randomly according to a fixed unknown probability distribution(
onq
8s
fc §
1
§u
. Given some example
, denote by
the closest prototype
labeled with§
and by
the closest prototype labeled withc
§
. A point
with
desired outputg
is classified correctly iff
gH
c
U
!´
The quantity î
-
ì
º
%
ì
Ã
ï ð
g
H
c
U
!ò y
thus measures the percentage of misclassifications on the given training set whereby
ï
º
q
f
1
§u
denotes the standard Heaviside function withï
ó !
% ô õ
óª
. The term generalization refers to the fact that the number of misclassifications on
the training set
î
-
ì (which is usually small since it is optimized during training) is
representative for the number of misclassifications for new data points
which have
not been used for training. In mathematical terms, generalization refers to the fact
that
î
-
ì approximates the expected value of g
H
c
U
!
if
1 g !
is chosen
randomly according(
. We are interested in guarantees for this property. Note, how-ever, that the empirical error
î
-
ì as defined above does not take a large margin into
account. The margin is thereby given by the valueA
c
U
A
, i.e. the difference
between the distances to the closest correct and incorrect prototypes. This is related
8/3/2019 Barbara Hammer, Marc Strickert and Thomas Villmann- Prototype based recognition of splice sites
http://slidepdf.com/reader/full/barbara-hammer-marc-strickert-and-thomas-villmann-prototype-based-recognition 20/31
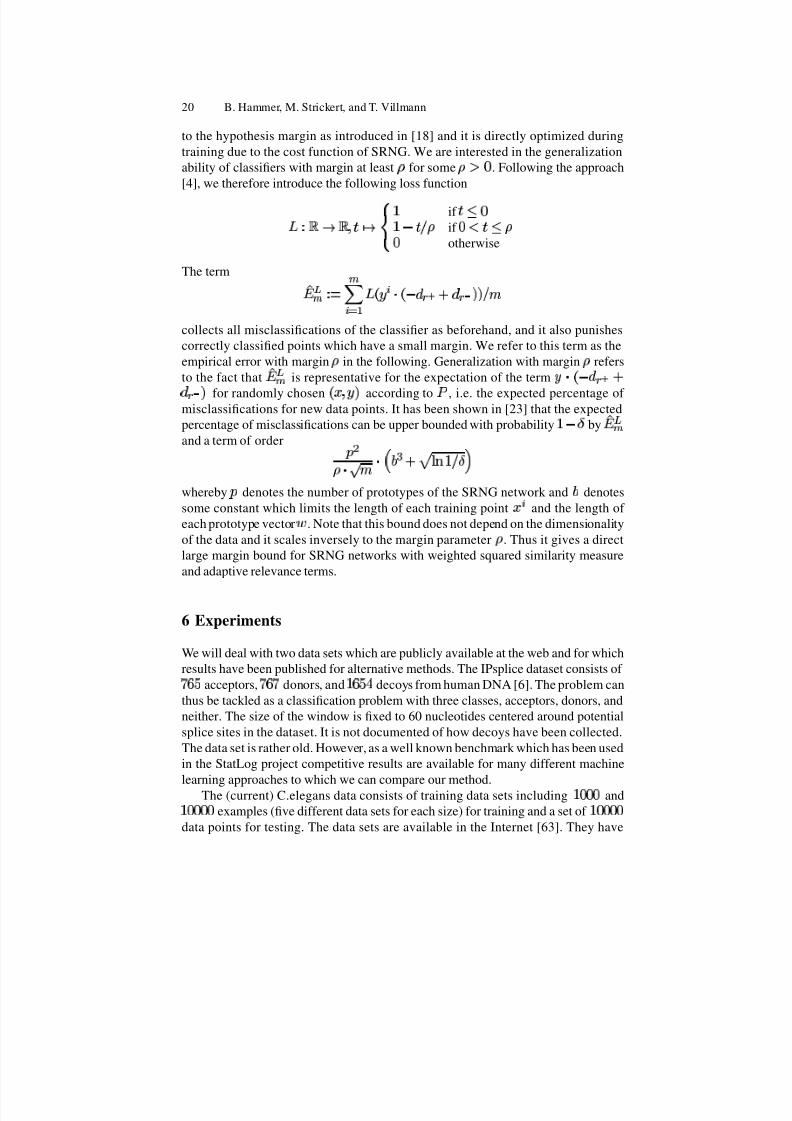
20 B. Hammer, M. Strickert, and T. Villmann
to the hypothesis margin as introduced in [18] and it is directly optimized during
training due to the cost function of SRNG. We are interested in the generalization
ability of classifiers with margin at least ÷ for some ÷
«
. Following the approach
[4], we therefore introduce the following loss function
ø
º
q q 1 ó ú
û ü
§ if ó
§c
ó
÷ if
ªó
÷
otherwise
The term î
-
Â
ì
º
%
ì
Ã
ø g
H
c
U
!! y
collects all misclassifications of the classifier as beforehand, and it also punishes
correctly classified points which have a small margin. We refer to this term as the
empirical error with margin ÷ in the following. Generalization with margin ÷ refers
to the fact that
î
-
Â
ì is representative for the expectation of the termg
H
c
U
!
for randomly chosen
1 g !
according to(
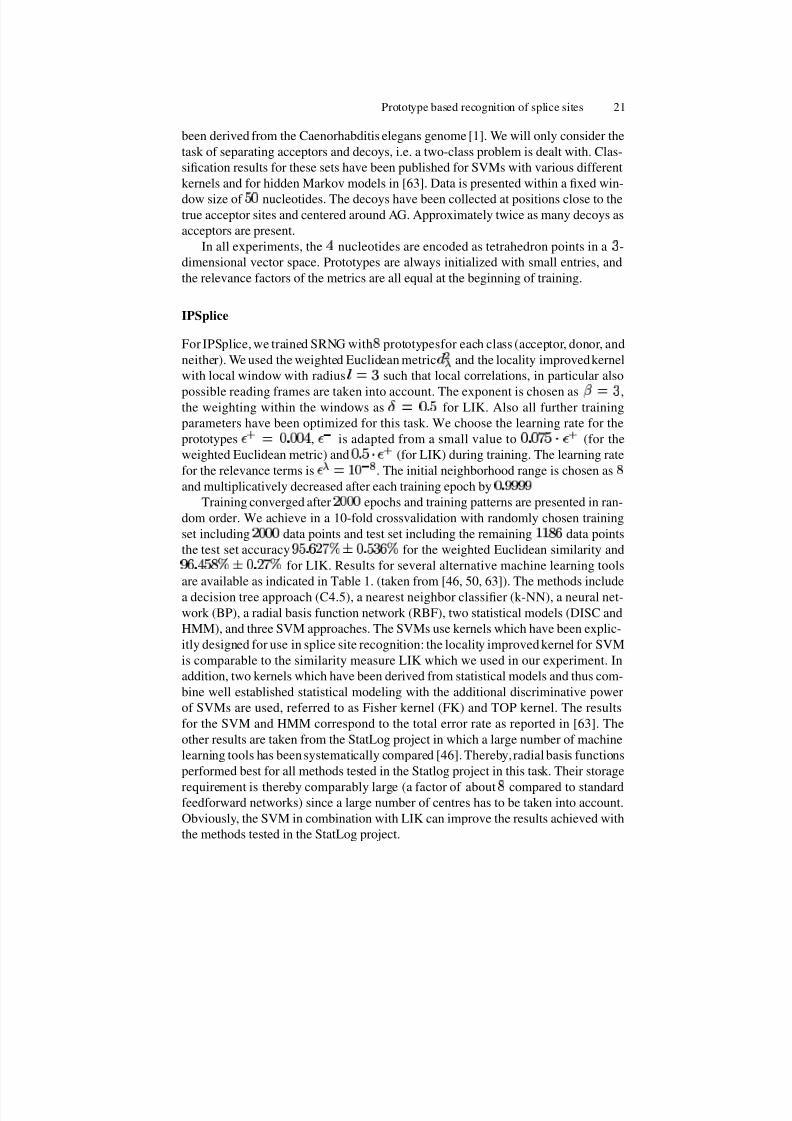
, i.e. the expected percentage of misclassifications for new data points. It has been shown in [23] that the expected
percentage of misclassifications can be upper bounded with probability §c
Ò
by
î
-
Â
ì
and a term of orderV
¡
÷
Hþ y
Hÿ
È
Y
U ¢ £ §
Ò ¥
whereby V denotes the number of prototypes of the SRNG network and
È
denotes
some constant which limits the length of each training point
and the length of
each prototype vector . Note that this bound does not depend on the dimensionality
of the data and it scales inversely to the margin parameter ÷ . Thus it gives a direct
large margin bound for SRNG networks with weighted squared similarity measure
and adaptive relevance terms.
6 Experiments
We will deal with two data sets which are publicly available at the web and for which
results have been published for alternative methods. The IPsplice dataset consists of § ¨
acceptors,§ ¨ §
donors, and §
¨
Û decoys from human DNA [6]. The problem can
thus be tackled as a classification problem with three classes, acceptors, donors, and
neither. The size of the window is fixed to 60 nucleotides centered around potential
splice sites in the dataset. It is not documented of how decoys have been collected.
The data set is rather old. However, as a well known benchmark which has been used
in the StatLog project competitive results are available for many different machine
learning approaches to which we can compare our method.The (current) C.elegans data consists of training data sets including §
and
§ examples (five different data sets for each size) for training and a set of §
data points for testing. The data sets are available in the Internet [63]. They have
8/3/2019 Barbara Hammer, Marc Strickert and Thomas Villmann- Prototype based recognition of splice sites
http://slidepdf.com/reader/full/barbara-hammer-marc-strickert-and-thomas-villmann-prototype-based-recognition 21/31
Prototype based recognition of splice sites 21
been derived from the Caenorhabditis elegans genome [1]. We will only consider the
task of separating acceptors and decoys, i.e. a two-class problem is dealt with. Clas-
sification results for these sets have been published for SVMs with various different
kernels and for hidden Markov models in [63]. Data is presented within a fixed win-
dow size of
nucleotides. The decoys have been collected at positions close to thetrue acceptor sites and centered around AG. Approximately twice as many decoys as
acceptors are present.
In all experiments, the Û nucleotides are encoded as tetrahedron points in a -
dimensional vector space. Prototypes are always initialized with small entries, and
the relevance factors of the metrics are all equal at the beginning of training.
IPSplice
For IPSplice, we trained SRNG with
prototypesfor each class (acceptor, donor, and
neither). We used the weighted Euclidean metric
¡
²
and the locality improved kernel
with local window with radius Õ%
such that local correlations, in particular also
possible reading frames are taken into account. The exponent is chosen asÐ
%
,the weighting within the windows as
Ò
%
3
for LIK. Also all further training
parameters have been optimized for this task. We choose the learning rate for the
prototypes
%
3
Û ,
S
is adapted from a small value to
3
§ H
(for the
weighted Euclidean metric) and
3 H
(for LIK) during training. The learning rate
for the relevance terms is
²
%§
S
. The initial neighborhood range is chosen as
and multiplicatively decreased after each training epoch by
3
Training converged after
epochs and training patterns are presented in ran-
dom order. We achieve in a 10-fold crossvalidation with randomly chosen training
set including
data points and test set including the remaining §§
¨
data points
the test set accuracy
3 ¨
§
¨
3
¨
¨ for the weighted Euclidean similarity and
¨ 3
Û
¨
3
§
¨ for LIK. Results for several alternative machine learning tools
are available as indicated in Table 1. (taken from [46, 50, 63]). The methods include
a decision tree approach (C4.5), a nearest neighbor classifier (k-NN), a neural net-
work (BP), a radial basis function network (RBF), two statistical models (DISC and
HMM), and three SVM approaches. The SVMs use kernels which have been explic-
itly designed for use in splice site recognition: the locality improved kernel for SVM
is comparable to the similarity measure LIK which we used in our experiment. In
addition, two kernels which have been derived from statistical models and thus com-
bine well established statistical modeling with the additional discriminative power
of SVMs are used, referred to as Fisher kernel (FK) and TOP kernel. The results
for the SVM and HMM correspond to the total error rate as reported in [63]. The
other results are taken from the StatLog project in which a large number of machine
learning tools has been systematically compared [46]. Thereby, radial basis functions
performed best for all methods tested in the Statlog project in this task. Their storage
requirement is thereby comparably large (a factor of about compared to standardfeedforward networks) since a large number of centres has to be taken into account.
Obviously, the SVM in combination with LIK can improve the results achieved with
the methods tested in the StatLog project.

8/3/2019 Barbara Hammer, Marc Strickert and Thomas Villmann- Prototype based recognition of splice sites
http://slidepdf.com/reader/full/barbara-hammer-marc-strickert-and-thomas-villmann-prototype-based-recognition 22/31
22 B. Hammer, M. Strickert, and T. Villmann
our" #
$
ourLIK SVMLIK SVMTOP SVMFK HMM DISC k-NN C4.5 BP RBF
95.6 96.5 96.3 94.6 94.7 94 94.1 86.4 92.4 91.2 95.9
Table 1. Accuracy (in % ) of various methods achieved on the IPsplice dataset, the classifi-
cation accuracy on the test set is reported for the models. The results for SVM and HMMcorrespond to the total error rates of binary classifiers [63].
Our result for the weighted Euclidean similarity measure is already compara-
ble to the best results which have been achieved in [63, 46]. Our results for LIK
are even slightly better, whereby the SVM provides state of the art results, since
it constitute very powerful methods also for high-dimensional data sets with good
generalization ability and the possibility to also include higher order correlations of
nucleotides. The combination of statistical models and SVMs combines the advan-
tages of both, however, shows slightly worse results possibly due to overfitting since
the data set is comparably small. Our models show the same good or even better
results and demonstrate excellent generalization ability. Note that standard feedfor-
ward networks (BP) perform quite badly although they are as powerful as SVMs.
This is due to the comparably high-dimensional inputs which cause strong overfit-
ting of the network. The combination of powerful models with explicit mechanisms
to cope with high-dimensional input data are particularly useful.
Note that our models only use
prototypes per class, i.e. they can be described
with Û
vectors. Our models are sparse and the classification is very fast. Classifi-
cation complexity using HMMs depends on the number of interior states, which is
chosen as about §
in the approach [63]. Hence the classification time of HMMs
is competitive to our model. SVMs can be expressed in terms of the support vec-
tors which constitute a fraction of the data set. For the IPSplice data set, an order of
roughly §
support vectors can be expected. The SVM’s classification time takes an
order of magnitude longer than for our models. In addition, our model provides in-
sight into the classification behavior due to the resulting relevance profiles. Figure 2depicts the relevance terms
³
within a local window which are achieved when train-
ing with the weighted Euclidean metric, and Figure 3 depicts the relevance terms
which weight the local windows if the LIK similarity is used. The mean of the rel-
evance terms for the Û nucleotides at one position is depicted. Clearly, the region
around a potential splice site (the possible consensus string) is of particular impor-
tance. The characteristic dinucleotide GT or AG, respectively is relevant, since we
deal with the three class problem to differentiate donors and acceptors from decoys.
Note that the relevance profile of both, the weighted Euclidean similarity and LIK
weight the left site a bit more than the right one which might indicate the relevance
of the pyrimidine rich region. In addition, the profile for LIK looks smoother and it
also increases the relevance of the borders. This effect is due to the specific choice of
the similarity: information is contained in more than one window since nucleotidesare taken into account in different adjacent windows. The relevance terms can be
distributed more smoothly among adjacent windows. The nucleotides at the borders
are contained in less windows than nucleotides at the centers. As a consequence, the

8/3/2019 Barbara Hammer, Marc Strickert and Thomas Villmann- Prototype based recognition of splice sites
http://slidepdf.com/reader/full/barbara-hammer-marc-strickert-and-thomas-villmann-prototype-based-recognition 23/31
Prototype based recognition of splice sites 23
0.005
0.0055
0.006
0.0065
0.007
0.0075
0.008
0.0085
0.009
-30 -20 -10 0 10 20 30
EUC^2 relevances
sequence position, 0 is the potential splice site
r e l e v a n c e v
a l u e
Fig. 2. Relevance profile for the weighted Euclidean similarity measure for the IPSplice data
set. Each position shows the average over the the successive relevance factors for the four
nucleotides at one position of the window.
relevance of local windows at the borders is to be emphasized such that nucleotides
at the borders have at least the same relevance as nucleotides at the center. Note that
the increase of relevance at the borders is strictly linear and it can be observed for
the leftmost three windows or rightmost three windows, respectively, which directly
corresponds to the smaller number of occurrences of the border corresponding to the3D-nucleotides-embedding coordinates for LIK.
Another measure which is particularly interesting if splice sensors are to be in-
tegrated into gene finding systems is the specificity and sensitivity of the model.
Specificity refers to the percentage of non-splice sites which have been predicted
correctly compared to the number of decoys in the training set. Sensitivity refers
to the percentage of correctly predicted splice sites compared to all potential splice
sites in the data set. High specificity means that the gene finding system can assume
that most decoys are correctly identified and the false-negative rate is small. High
sensitivity means that almost all potential splice sites are reported, however, possi-
bly many non splice sites are also reported such that intensive backtracking might
be necessary. Obviously, these two measures constitute contradictory demands and a
good balance between both is to be found depending on the properties of the whole
gene finding system. For many splice site sensors, it is very easy to explicitly control
the balance of specificity and sensitivity. One can vary the classification boundary
and report specificity and sensitivity for several choices of the boundary. In the case

8/3/2019 Barbara Hammer, Marc Strickert and Thomas Villmann- Prototype based recognition of splice sites
http://slidepdf.com/reader/full/barbara-hammer-marc-strickert-and-thomas-villmann-prototype-based-recognition 24/31
24 B. Hammer, M. Strickert, and T. Villmann
0.0095
0.01
0.0105
0.011
0.0115
0.012
-30 -20 -10 0 10 20 30
LIK relevances
sequence position, 0 is the potential splice site
r e l e v a n c e v
a l u e
Fig. 3. Relevance profile for the locality improved similarity measure for the IPSplice data set.
of SRNG, we restrict to the two-class problem of separating splice sites (acceptor or
donor) from non-splice sites. Given a data point, we can then interprete the term
²
c
²
²
U
²
as a measure for the likelihood of being a splice site, whereby
²
denotes the simi-
larity to the closest prototype which class is a splice site, and
²
denotes the simi-
larity to the closest prototype with class decoy. Note that this term lies in the interval&
c§
1
§ë. Standard SRNG maps all data points with activation at most to the class
of splice sites. Alternative values of specificity and sensitivity can be achieved by
varying the classification boundary within the interval&
c§
1
§ë. A complete receiver
operating characteristic (ROC) curve which depicts the false negative rate ( §c
speci-
ficity) versus the true positive rate (sensitivity) is given in Fig. 4. It is possible to
achieve specificity and sensitivity
3
§
for the test set with LIK and specificity and
sensitivity
3
¨
for the test set and the weighted Euclidean similarity. Note that only
a subset of the whole range is depicted in Fig. 4 to make the differences between the
single graphs visible. A global picture including the diagonal can be found in Fig. 5.
C.elegans
For this data set the way in which decoys have been chosen is precisely documented.
They are collected close to true sites. It can be expected that precise prediction of

8/3/2019 Barbara Hammer, Marc Strickert and Thomas Villmann- Prototype based recognition of splice sites
http://slidepdf.com/reader/full/barbara-hammer-marc-strickert-and-thomas-villmann-prototype-based-recognition 25/31
Prototype based recognition of splice sites 25
0.75
0.8
0.85
0.9
0.95
1
0 0.05 0.1 0.15 0.2 0.25
s e n s i t i v i t y
1 - specificity
LIK train
LIK test
LIK all
EUC^2 train
EUC^2 test
EUC^2 all
Fig. 4. ROC curve for the IPSplice data set for the two similarity measures (EUC ' 2 (
weighted Euclidiqan measure, LIK(
locality improved similarity) and training and test set
and both. Note that the graph is quite close to axes such that high specificity and sensitivity
can be achieved simultaneously.
splice sites is particularly relevant (and possibly also particular difficult) for regions
around potential splice sites since fast regions of intergenic DNA can be filtered out
before splice sensors are applied. We trained for the same
data sets as the models
in [63] such that we can directly compare our results with recent results for SVMs
and HMMs. We used the weighted quartic metric with only two prototypes per classand parameters as follows: the learning rate for prototypes is chosen as
%
3
and
S
is increased from a small value to
3
H
. The learning rate for the rel-
evance terms is
H
§
S
. Initial neighborhood range is § which is multiplicatively
decreased by
3
in each epoch. We trained¨
epochs for the data set with §
points and¨
epochs for the data set with §
points. The achieved classification
accuracy for the test set is
3
¨
3
§
§ ¨
¨ for the result of the first training set and
3 ¨
¨
3
¨
for the second one. In addition to these results we used a proce-
dure which similarly to LIK takes local correlations into account: data are encoded
explicitly as adjacent dinucleotide pairs which are at most one nucleotide apart. I.e.
given a point
, for each position # of the window around a potential splice site the
pairs
S
¡
1 !
,
S
1 !
,
1
!
, and
1
¡
!
are considered. Each pair has
§
¨
potential choices, which are encoded in a unary way for each pair. We thus obtaininput vectors of dimensionality §
where local correlations within a neighborhood
of radius of each nucleotide are explicitly encoded. For this more complex encod-
ing (which we also refer to as LIK since it is very similar in spirit to LIK but allows

8/3/2019 Barbara Hammer, Marc Strickert and Thomas Villmann- Prototype based recognition of splice sites
http://slidepdf.com/reader/full/barbara-hammer-marc-strickert-and-thomas-villmann-prototype-based-recognition 26/31
26 B. Hammer, M. Strickert, and T. Villmann
0
0.2
0.4
0.6
0.8
1
0 0.2 0.4 0.6 0.8 1
s e n s i t i v i t y
1 - specificity
ip-data LIK
ip-data EUC^2
c.elegans LIK
c.elegans EUC^4
Fig. 5. ROC curve for the IPSplice and c.elegans data sets (test sets) for the respectve different
similarity measures in comparison to the diagonal.
more flexibility due to separate weighting of all entries), we use the quartic weighted
metric and SRNG. Here we choose
prototypes per class and the following param-
eters: learning rate
%
3
§
for correct prototypes and
S
%
3
§
H
for the
closest incorrect prototype.
H
§
S
for the relevance terms, and initial neighbor-
hood range Û which is not decreased during training. Training has been done for¨
epochs for the smaller sets and §
epochs for the larger sets. The achieved accuracy
on the test sets is
3
¨
3
§
§ ¨
¨ for the sets with §
training examples and
3 ¨
¨
3
¨
for the sets with §
training examples. Results for SVM and
HMM can be found in Table 2.
As indicated in Table 2, our results are competitive to the results achieved with
the SVM and the locality improved kernel. Results for statistical models and com-
binations with SVM, however, show a better performance in particular for the large
data set. The variance of these methods is a bit higher. This can be explained by the
fact that for large enough data sets the statistical models can capture more relevant
information from the training data such that problem adapted kernels arise. We could,
of course, use these statistical similarity measure also for our approach and would
likely achieve improved results as well. However, the training time for statistical
models is usually quite demanding. Training one SRNG model in our experiments
took only about one hour on a Pentium III (700 MHz) computer for§
data pointswhereas training a statistical model and SVM might take a day or more. Even more
interesting is the complexity of classification. Our models are rather sparse since they
are given by only §
prototypes and classification of the whole test set of size §

8/3/2019 Barbara Hammer, Marc Strickert and Thomas Villmann- Prototype based recognition of splice sites
http://slidepdf.com/reader/full/barbara-hammer-marc-strickert-and-thomas-villmann-prototype-based-recognition 27/31
Prototype based recognition of splice sites 27
0.65
0.7
0.75
0.8
0.85
0.9
0.95
1
0 0.05 0.1 0.15 0.2 0.25 0.3
s e n s i t i v i t y
1 - specificity
EUC^4 (1000)
EUC^4 (10000)
LIK (1000)
LIK (10000)
Fig. 6. ROC curve for the c.elegans data set (test sets) for the respective different similarity
measures (EUC'
2(
weighted quartic similarity, LIK(
dinucleotide encoding and weighted
quartic similarity).
takes only a few seconds. For SVM, the classification time is one or two orders of
magnitudes slower because of the number of support vectors which scales with the
training set size. Hence our model is much more appropriate for tasks such as fast
online prediction. This property would also transfer if we combined SRNG with al-
ternative similarities derived from statistical models. If these measures were used in
combination with prototype based classifiers instead of SVM much sparser modelscould be achieved.
We also include a complete ROC curve for our models. Note that Fig. 6 does only
contain a subarea of the whole graph as depicted in Fig. 5 such that the differences of
the models are better visible. We can obtain simultaneous specificity and sensitivity
of about
3
if dinucleotide encoding is used.
method ourquartic ourLIK HMM SVMLIK SVMTOP SVMFK
1000 94.62
0.003 95.22
0.15 97.22
0.1 94.82
0.1 95.42
0.4 96.52
0.2
10000 94.82
0.003 95.72
0.09 97.42
0.2 96.12
0.2 97.72
0.1 97.52
0.3
Table 2. Accuracy (in%
) of various methods achieved on the C.elegans dataset, only the test
set accuracy is reported.

8/3/2019 Barbara Hammer, Marc Strickert and Thomas Villmann- Prototype based recognition of splice sites
http://slidepdf.com/reader/full/barbara-hammer-marc-strickert-and-thomas-villmann-prototype-based-recognition 28/31
28 B. Hammer, M. Strickert, and T. Villmann
7 Discussion
We have proposed a prototype based splice size recognition model which achieves
state of the art results with very sparse models. The algorithm has a sound math-
ematical foundation and explicit dimension independent generalization bounds canbe derived. Training is robust and due to the incorporation of neighborhood cooper-
ation also insensitive with respect to initialization. Note that further training is easily
possible due to the iterative training scheme if new data becomes available. The algo-
rithm has been evaluated on two publicly available data sets. Complete ROC curves
demonstrate that simultaneous high specificity and sensitivity can be achieved. Since
SRNG can be combined with any differentiable similarity measure and it includes
adaptive terms of the similarity, the method constitutes a convenient tool for general
classification tasks where possibly high-dimensional and heteroneneous data is dealt
with. The classifier also provides insight into the classification because of the result-
ing relevance profiles and explicit (usually only few) prototypes as representatives
of the classes. This fact can be used to further extract explicit (though possibly less
accurate) logical descriptions of the classifier as demonstrated in [22].
References
1. Genome sequence of the Nematode Caenorhabditis elegans. Science 282:2012–2018,
1998. See also http://genome.wustl.edu/gsc/C elegans for the specific chromosome and
GFF files used here.
2. M. Arita, K. Tsuda, and K. Asai. Modeling splicing sites with pairwise correlations.
Bioinformatics 18(Supplement 2):S27-S34, 2002.
3. A. Bairoch. Prosite: a dictionary of sites and patterns in proteins. Nucleid acid reserach
20:2013–2018, 1992.
4. P.L. Bartlett and S. Mendelson. Rademacher and Gaussian complexities: risk bounds and
structural results. Journal of Machine Learning and Research 3:463-482, 2002.
5. A. M. Bianucci, A. Micheli, A. Sperduti, and A. Starita. Application of Cascade Corre-lation Networks for Structures to Chemistry. Applied Intelligence Journal, 12(1/2): 117–
146, 2000.
6. C.L. Blake and C. J. Merz, UCI Repository of machine learning databases , Irvine, CA:
University of California, Department of Information and Computer Science.
7. T. Bojer, B. Hammer, and C. Koers. Monitoring technical systems with prototype
based clustering. In: M. Verleysen (ed.), European Symposium on Artificial Neural Net-
works’2003, D-side publications, pages 433–439, 2003.
8. S. Boue, M. Vingron, E. Kritventseva, and I. Koch. Theoretical analysis of alternative
splice forms using computational methods. Bioinformatics 18(Supplement 2):S65–S73,
2002.
9. O. Bousquet and D.J.L. Herrmann. On the complexity of learning the kernel matrix. In:
NIPS 2002.
10. V. Brendel and J. Kleffe. Prediction of locally optimal splice sites in plant pre-mRNA
with applications to gene identification in Arabidopsis thaliana genomic DNA. Nucleid
Acid Research 26:4748–4757, 1998.
11. S. Brunak, J. Engelbrecht, and S. Knudsen. Prediction of human mRNA donor and ac-
ceptor sites from the DNA sequence. Journal of Molecular Biology, 220:49–65, 1991.

8/3/2019 Barbara Hammer, Marc Strickert and Thomas Villmann- Prototype based recognition of splice sites
http://slidepdf.com/reader/full/barbara-hammer-marc-strickert-and-thomas-villmann-prototype-based-recognition 29/31
Prototype based recognition of splice sites 29
12. C. Burge, and S. Karlin. Prediction of complete gene structures in human genomic DNA.
Journal of Molecular Biology, 268:78–94, 1997.
13. C. Burges. A tutorial on support vector machines for pattern recognition. Knowledge
Discovery and Data Mining, 2(2), 1998.
14. D. Cai, A. Delcher, B. Kao, and S. Kasif. Modeling splice sites with Bayes networks. Bioinformatics, 16(2):152–158, 2000.
15. J.-M. Claverie. Some useful statistical properties of position-weight matrices. Computers
and Chemsitry 18(3):287–294, 1994.
16. V. Cherkassky and Y. Ma, Selecting the loss function for robust linear regression. Sub-
mitted to: Neural Computation.
17. Consortium. Initial sequencing and analysis of the human genome. Nature 409:860–924,
2001.
18. K. Crammer, R. Gilad-Bachrach, A. Navot, and A. Tishby. Margin analysis of the LVQ
algorithm. In: NIPS 2002.
19. S. Degroeve, B. de Baets, Y. Van de Peer, and P. Rouze. Feature subset selection for splice
site prediction. Bioinformatics Supplement 2: S75–S83, 2002.
20. C.H.Q. Ding. Unsupervised feature selection via two-way ordering in gene expression
analysis. Bioinformatics 19(10):1259–1266, 2003.
21. B. Hammer and K. Gersmann. A note on the universal approximation capability of sup-
port vector machines. Neural Processing Letters 17: 43-53, 2003.
22. B. Hammer, A. Rechtien, M. Strickert, and T. Villmann. Rule extraction from self-
organizing maps. In: J.R. Dorronsoro (ed.), Artificial Neural Networks - ICANN 2002,
pages 370–375, Springer, 2002.
23. B. Hammer, M. Strickert, and T. Villmann. On the generalization ability of GRLVQ-
networks. Submitted.
24. B. Hammer, M. Strickert, and T. Villmann. Supervised neural gas with general similarity.
Accepted at Neural Processing Letters.
25. B. Hammer, M. Strickert, and T. Villmann. Learning vector quantization for multimodal
data. In: J.R. Dorronsoro (Ed.), Artificial Neural Networks – ICANN 2002, Springer, pages
370–375, 2002.
26. B. Hammer and T. Villmann. Generalized relevance learning vector quantization. Neural
Networks 15:1059–1068, 2002.27. D. Harn, D.D. Lee, S. Mika, and B. Scholkopf. A kernel view of the dimensionality
reduction of manifolds. Submited to NIPS 2003.
28. D. Haussler. Convolutional kernels for dicrete structures. Technical Report UCSC-CRL-
99-10, Computer Science Department, University of California at Santa Cruz, 1999.
29. S. Hebner, M. Alekseyev, S.-H. Sze, H. Tang, and P.A. Pevzner. Splicing graphs and EST
assemply problem. Bioinformatics 18(Supplement 1):S181–@188, 2002.
30. S. M. Hebsgaard, P. G. Korning, N. Tolstrup, J. Engelbrecht, P. Rouze, and S. Brunak.
Splice site prediction in Arabidopsis thaliana DNA by combining local and global se-
quences information. Nucleid Acid Research 24:3439–3452, 1996.
31. J. Henderson, S. Salzberg, and K. Fasman. Finding genes in human DNA with a hidden
Markov model. Journal of Computational Biology, 4:127–141, 1997.
32. K. Hornik, M. Stinchcombe, and H. White. Multilayer feedforward networks are universal
approximators. Neural Networks, pages 359–366, 1989.
33. T. Jaakkola, M. Diekhans, and D. Haussler. A discriminative framework for detectingremote protein homologies. Journal of Computational Biology, 7:95–114, 2000.
34. W.J. Kent and A.M. Zahler. The intronerator: exploring introns and alternative splicing in
Caenorhabditis elegans. Nucleid Acid Research 28(1):91–93, 2000.

8/3/2019 Barbara Hammer, Marc Strickert and Thomas Villmann- Prototype based recognition of splice sites
http://slidepdf.com/reader/full/barbara-hammer-marc-strickert-and-thomas-villmann-prototype-based-recognition 30/31
30 B. Hammer, M. Strickert, and T. Villmann
35. S. Kim, E.R. Dougherty, J. Barrera, Y. Cheng, M.L. Bittner, and J.M. Trent. Strong feature
sets from small samples. Journal of Computational Biology 9(1):127–146, 2002.
36. J. Kleffe, K. Herrmann, W. Vahrson, B. Wittig, and V. Brendel. Logitlinear models
for the prediction of splice sites in plant pre-mRNA sequences. Nucleid Acid Research
24(23):4709–4718, 1996.37. T. Kohonen. Learning vector quantization. In M. Arbib, editor, The Handbook of Brain
Theory and Neural Networks, pages 537–540. MIT Press, 1995.
38. T. Kohonen. Self-Organizing Maps. Springer, 1997.
39. A. Krogh. Gene finding: putting the parts together. In: M.J. Bishop (Ed.), Guide to human
genome computing, pp.261-274, 2nd edition, Academic Press, 1998.
40. B. Lewin. Genes VII . Oxford University Press, New York, 2000.
41. Y. Li, C. Campbell, and M. Tipping. Bayesian automatic relevance determination algo-
rithms for classifying gene expression data. Bioinformatics 18(10):1332–1339, 2002.
42. N. Mache and P. Levi. GENIO – a non-redundant eukariotic gene database of annotated
sites and sequences. RECOMB’98 Poster , New York, 1998.
43. T. Martinetz, S. Berkovich, and K. Schulten. ‘Neural-gas’ network for vector quantization
and its application to time-series prediction. IEEE Transactions on Neural Networks
4(4):558-569, 1993.
44. T. Martinetz and K. Schulten. Topology representing networks. Neural Networks,
7(3):507–522, 1993.
45. I. M. Meyer and R. Durbin. Comparative ab initio prediction of gene structures using pair
HMMs. Bioinformatics 18(10):1309–1318, 2002.
46. D. Michie, D.J. Spiegelhalter, C.C. Taylor (eds). Machine Learning, Neural and Statistical
Classification. Ellis Horwood 1994. http://www.amsta.leeds.ac.uk/charles/statlog/
47. J. S. Pedersen and J. Hein. Gene finding with a hidden Markov model of genome structure
and evolution. Bioinformatics 19(2):219–227, 2003.
48. D. J. Patterson, K. Yasuhara, and W. L. Ruzzo. Pre-mRNA secondary structure prediction
aids splice site prediction. In: Altman et al. (eds.), Pacific Symposium on Biocomputing,
pages 223–234, World Scientific, 2002.
49. M. Pertea, X. Lin, and S. L. Salzberg. GeneSplicer: a new computational method for
splice site prediction. Nucleid Acids Research, 29(5):1185–1190, 2001.
50. S. Rampone. Recognition of splice junctions on DNA sequences by BRAIN learningalgorithm. Bioinformatics, 14(8):676–684, 1998.
51. M. G. Reese, F. H. Eeckman, D. Kulp, and D. Haussler. Improved splice site detection in
Genie. Journal of Computational Biology, 4(3):311–324, 1997.
52. B. Ripley. Pattern Recognition and Neural Networks. Cambridge University Press, 1996.
53. B. Rost and S. O’Donoghue. Sisyphus and protein structure prediction. Bioinformatics,
13:345–356, 1997.
54. S. L. Salzberg, A. L. Delcher, K. Fasman, and J. Henderson. A decision tree system for
finding genes in DNA. Journal of Computational Biology, 5:667–680, 1998.
55. S. L. Salzberg, A. L. Delcher, S. Kasif, and O. White. Microbial gene identification using
interpolated Markov models. Nucleid Acids Research, 26:544–548, 1998.
56. A. S. Sato and K. Yamada. Generalized learning vector quantization. In G. Tesauro,
D. Touretzky, and T. Leen, editors, Advances in Neural Information Processing Systems,
volume 7, pages 423–429. MIT Press, 1995.
57. A.S. Sato and K. Yamada. An analysis of convergence in generalized LVQ. In L. Niklas-son, M. Boden, and T. Ziemke (eds.) ICANN’98, pages 172-176, Springer, 1998.
58. B. Scholkopf. The kernel trick for distances. Technical Report MSR-TR-2000-51. Mi-
crosoft Research, Redmond, WA, 2000.

8/3/2019 Barbara Hammer, Marc Strickert and Thomas Villmann- Prototype based recognition of splice sites
http://slidepdf.com/reader/full/barbara-hammer-marc-strickert-and-thomas-villmann-prototype-based-recognition 31/31
Prototype based recognition of splice sites 31
59. S. Seo and K. Obermayer. Soft learning vector quantization. Neural Computation 15:
1589-1604, 2003.
60. R. Staden. Finding protein coding regions in genomic sequences. Methods in Enzymology
183:163–180, 1990.
61. V. V. Solovyev, A. A. Salamov, and C. B. Lawrence. Predicting internal exons by oligonu-cleotide composition and discriminant analysis of spliceable open reading frames. Nu-
cleid Acids Research, 22:5156–5163, 1994.
62. S. Sonnenburg, New methods for splice site recognition. Diploma Thesis, Humboldt-
Universitat Berlin, Institut fur Informatik, 2002.
63. S. Sonnenburg, G.Ratsch, A. Jagota, and K.-R. Muller. New methods for splice site
recognition. In: J. R. Dorronsoro (ed.), ICANN’2002, pages 329–336, Springer, 2002.
Data sets at: http://mlg.anu.edu.au/ 3 raetsch/splice/
64. J. P. Staley and C. Guthrie. Mechanical devices of the spliceosome: motor, clocks, springs,
and things. Cell, 92:315–326, 1998.
65. M. Strickert, T. Bojer, and B. Hammer. Generalized relevance LVQ for time series.
In: G.Dorffner, H.Bischof, K.Hornik (eds.), Artificial Neural Networks - ICANN’2001,
Springer, pages 677–683, 2001.
66. G. G. Towell and J. W. Shavlik. Knowledge-Based Artificial Neural Networks. Artificial
Intelligence, 70(1-2):119–165, 1994.
67. V. Vapnik and A. Chervonenkis. On the uniform convergence of relative frequencies of
events to their probabilities. Theory of Probability and its Applications 16(2):264-280,
1971.
68. T. Villmann. Topology preservation in self-organizing maps. In E. Oja and S. Kaski, Ko-
honen Maps, pages 279–292, Elsevier, 1999.
69. T. Villmann, E. Merenyi, and B. Hammer. Neural maps in remote sensing image analysis.
Neural Networks, 16(3-4):389–403, 2003.
70. J. Weston, F. Perez-Cruz, O. Bousquet, O. Chappelle, A. Elisseeff, B. Scholkopf. Fea-
ture selection and transduction for prediction of molecular bioactivity for drug design.
Bioinformatics 19(6):764–771, 2003.
71. M. Zhang and T. Marr. A weighted array method for splicing and signal analysis. CABIOS
9:499–509, 1993.