Fiscal responsibility and fiscal fantasy Nuffield Alumni Seminar 20.09.14 [email protected].
Barban, N., Jansen, R., De Vlaming, R., Vaez, A., Mandemakers, J. J., Tropf,F. C., ... Mills, M. C. (2016). Genome-wide analysis identifies 12 lociinfluencing human reproductive behavior. Nature Genetics, 48(12), 1462-1472. DOI: 10.1038/ng.3698
Peer reviewed version
Link to published version (if available):10.1038/ng.3698
Link to publication record in Explore Bristol ResearchPDF-document
This is the author accepted manuscript (AAM). The final published version (version of record) is available onlinevia Nature at http://www.nature.com/ng/journal/v48/n12/full/ng.3698.html. Please refer to any applicable terms ofuse of the publisher.
University of Bristol - Explore Bristol ResearchGeneral rights
This document is made available in accordance with publisher policies. Please cite only the publishedversion using the reference above. Full terms of use are available:http://www.bristol.ac.uk/pure/about/ebr-terms
1
Genome-wide analysis identifies 12 loci influencing human reproductive behavior
Correspondence to: Melinda C. Mills ([email protected]), Nicola Barban
([email protected]), Harold Snieder ([email protected]) or Marcel den Hoed
Authors: Nicola Barban1,*, Rick Jansen2,#, Ronald de Vlaming3,4,5,#, Ahmad Vaez6,#, Jornt J. Mandemakers7,#, Felix C. Tropf1,#, Xia Shen8,9,10,#, James F. Wilson10,9,#, Daniel I. Chasman11,#, Ilja M. Nolte6,#, Vinicius Tragante,#12, Sander W. van der Laan13,#, John R. B. Perry14,#, Augustine Kong32,15 ,#, BIOS Consortium, Tarunveer Ahluwalia16,17,18, Eva Albrecht19, Laura Yerges-Armstrong20, Gil Atzmon21,22, Kirsi Auro23,24 , Kristin Ayers25, Andrew Bakshi26, Danny Ben-Avraham27, Klaus Berger28, Aviv Bergman29, Lars Bertram30, Lawrence F. Bielak31, Gyda Bjornsdottir32, Marc Jan Bonder33, Linda Broer34, Minh Bui35, Caterina Barbieri36, Alana Cavadino37,38, Jorge E Chavarro39,40,41, Constance Turman41, Maria Pina Concas42, Heather J. Cordell25, Gail Davies43,44, Peter Eibich45, Nicholas Eriksson46, Tõnu Esko47,48, Joel Eriksson49, Fahimeh Falahi6, Janine F. Felix50,4,51, Mark Alan Fontana52, Lude Franke33, Ilaria Gandin53, Audrey J. Gaskins39, Christian Gieger54,55, Erica P. Gunderson56, Xiuqing Guo57, Caroline Hayward9, Chunyan He58, Edith Hofer59,60, Hongyan Huang41, Peter K. Joshi10, Stavroula Kanoni61, Robert Karlsson8, Stefan Kiechl62, Annette Kifley63, Alexander Kluttig64, Peter Kraft 41,65, Vasiliki Lagou66,67,68,Cecile Lecoeur,99 Jari Lahti69,70,71, Ruifang Li-Gao72, Penelope A. Lind73, Tian Liu74, Enes Makalic35, Crysovalanto Mamasoula25, Lindsay Matteson75, Hamdi Mbarek76,77, Patrick F. McArdle20, George McMahon78, S. Fleur W. Meddens79, 5, Evelin Mihailov47, Mike Miller80, Stacey A. Missmer81,41, Claire Monnereau50,4,51 , Peter J. van der Most6, Ronny Myhre125, Mike A. Nalls82, Teresa Nutile83, Kalafati Ioanna Panagiota84, Eleonora Porcu85,86, Inga Prokopenko87,88,89, Kumar B. Rajan90, Janet Rich-Edwards91,41, Cornelius A. Rietveld3,4,5, Antonietta Robino92, Lynda M. Rose11, Rico Rueedi93,94, Kathy Ryan20, Yasaman Saba159, Daniel Schmidt35, Jennifer A. Smith31, Lisette Stolk34, Elizabeth Streeten20, Anke Tonjes95, Gudmar Thorleifsson32, Sheila Ulivi92, Juho Wedenoja96, Juergen Wellmann28, Peter Willeit62,97,98, Jie Yao57, Loic Yengo99,100, Jing Hua Zhao101, Wei Zhao31, Daria V. Zhernakova33, Najaf Amin4, Howard Andrews102, Beverley Balkau,99 Nir Barzilai21, Sven Bergmann93,32, Ginevra Biino103, Hans Bisgaard18, Klaus Bønnelykke18, Dorret I. Boomsma76,77, Julie E. Buring11, Harry Campbell10, Stefania Cappellani92, Marina Ciullo83, Simon R. Cox43,44, Francesco Cucca85,86, Toniolo Daniela36, George Davey-Smith104, Ian J. Deary43,44, George Dedoussis84, Panos Deloukas61,105, Cornelia M. van Duijn4, Eco JC. de Geus76,77, Johan G. Eriksson106,107,108,71,109, Denis A. Evans90, Jessica D. Faul110, Sala Cinzia Felicita36, Philippe Froguel,99 Paolo Gasparini111,112, Giorgia Girotto53,112, Hans-Jörgen Grabe113 , Karin Halina Greiser114, Patrick J.F. Groenen115,5, Hugoline G. de Haan72, Johannes Haerting64, Tamara B. Harris116, Andrew C. Heath117, Kauko Heikkilä24, Albert Hofman4,5,118, Georg Homuth119, Elizabeth G Holliday120,121, John Hopper35, Elina Hypponen37,122,123 , Bo Jacobsson124,125, Vincent W. V. Jaddoe50,4,51 , Magnus Johannesson126, Astanand Jugessur125, Mika Kähönen127, Eero Kajantie128,129,130, Sharon L.R. Kardia31, Bernard Keavney25,131, Ivana Kolcic132, Päivikki Koponen,133 Peter Kovacs134, Florian Kronenberg135, Zoltan Kutalik136,94 , Martina La Bianca92, Genevieve Lachance137, William Iacono80, Sandra Lai85,Terho Lehtimäki138, David C Liewald43, Lifelines Cohort Study139, Cecilia Lindgren89,88,140,141, Yongmei Liu142, Robert Luben143, Michael Lucht107, Riitta Luoto144, Per Magnus125, Patrik K.E. Magnusson8, Nicholas G. Martin73, Matt McGue145,80, Ruth McQuillan10, Sarah E. Medland73, Christa Meisinger55,146 , Dan Mellström49, Andres Metspalu47,147, Traglia Michela36, Lili Milani47, Paul Mitchell63 , Grant W. Montgomery117,148 Dennis Mook-Kanamori72,149,150, Renée de Mutsert72, Ellen A Nohr151, Claes Ohlsson49, Jørn Olsen152, Ken K. Ong101, Lavinia Paternoster104, Alison Pattie44, Brenda WJH Penninx153, Markus Perola23,24,47 , Patricia
2
A. Peyser31, Mario Pirastu42, Ozren Polasek132, Chris Power37, Jaakko Kaprio24,96154, Leslie J. Raffel155, Katri Räikkönen69, Olli Raitakari156, Paul M. Ridker11, Susan M. Ring104, Kathryn Roll57, Igor Rudan10, Daniela Ruggiero83, Dan Rujescu157, Veikko Salomaa23, David Schlessinger158, Helena Schmidt159 , Reinhold Schmidt59, Nicole Schupf160, Johannes Smit153, Rossella Sorice83, Tim D. Spector137, John M. Starr43,161, Doris Stöckl55, Konstantin Strauch19,162, Michael Stumvoll163,134, Morris A. Swertz33, Unnur Thorsteinsdottir32,164, A. Roy Thurik3,165, 5, Nicholas J. Timpson104, Anke Tönjes163, Joyce Y. Tung46, André G. Uitterlinden3,34,5 , Simona Vaccargiu42, Jorma Viikari166, Veronique Vitart9, Henry Völzke167, Peter Vollenweider168, Dragana Vuckovic53,112, Johannes Waage18, Gert G. Wagner45, Jie Jin Wang63, Nicholas J. Wareham101, David R. Weir110, Gonneke Willemsen76,77, Johann Willeit62, Alan F. Wright9, Krina T. Zondervan169, Kari Stefansson32,164, Robert F. Krueger170, James J. Lee170, Daniel J. Benjamin171,172, David Cesarini173,174, Philipp D. Koellinger79,3,5, Marcel den Hoed175,* , Harold Snieder6,*, Melinda C. Mills1,*
1 University of Oxford, Department of Sociology and Nuffield College, United Kingdom 2 Department of Psychiatry, VU University Medical Center, Amsterdam, The Netherlands 3 Department of Applied Economics, Erasmus School of Economics, Rotterdam, The Netherlands 4 Department of Epidemiology, Erasmus MC, University Medical Center Rotterdam, Rotterdam, the Netherlands 5 Erasmus University Rotterdam Institute for Behavior and Biology, Rotterdam, The Netherlands 6 Department of Epidemiology, University of Groningen, University Medical Center Groningen, The Netherlands 7 Sociology of Consumption and Households, Wageningen University Research, Wageningen, the Netherlands 8 Department of Medical Epidemiology and Biostatistics, Karolinska Institutet, Stockholm, Sweden 9 MRC Human Genetics Unit, MRC Institute of Genetics and Molecular Medicine, University of Edinburgh, Edinburgh, United Kingdom 10 Centre for Global Health Research, Usher Institute of Population Health Sciences and Informatics, University of Edinburgh, Teviot Place, Edinburgh, United Kingdom 11 Brigham and Women's Hospital, Boston MA and Harvard Medical School, Boston MA 12 Department of Cardiology, Division of Heart and Lungs, University Medical Center Utrecht, Utrecht, The Netherlands 13Laboratory of Experimental Cardiology, Division of Heart and Lungs, University Medical Center Utrecht, Utrecht, The Netherlands14MRC Epidemiology Unit, Institute of Metabolic Science, University of Cambridge, Cambridge, UK.15 School of Engineering and Natural Sciences, University of Iceland, Reykjavik 101, Iceland. 16 Novo Nordisk Foundation Centre for Basic Metabolic Research, Section of Metabolic Genetics, Faculty of Health and Medical Sciences, University of Copenhagen, Copenhagen, Denmark 17 Steno Diabetes Center, Denmark 18 COPSAC, Copenhagen Prospective Studies on Asthma in Childhood, Herlev and Gentofte Hospital, University of Copenhagen, Copenhagen, Denmark 19 Institute of Genetic Epidemiology, Helmholtz Zentrum München—German Research Center for Environmental Health, Neuherberg, Germany 20 University of Maryland School of Medicine, Division of Endocrinology, Diabetes and Nutrition 21 Department of Medicine and Genetic, Institute for Aging Research and the Diabetes Research Center, Albert Einstein College of Medicine, Bronx, NY, USA 22 Department of Natural Science, University of Haifa, Haifa, Israel 23 Department of Health, National Institute for Health and Welfare, Helsinki, Finland 24 University of Helsinki, Institute for Molecular Medicine (FIMM), Helsinki, Finland 25 Institute of Genetic Medicine, Newcastle University 26Queensland Brain Institute, The University of Queensland, Brisbane, Australia
3
27 Department of Genetic, Institute for Aging Research and the Diabetes Research Center, Albert Einstein College of Medicine, Bronx, NY, USA 28 Institute of Epidemiology and Social Medicine, University of Münster, Germany 29 Departments of Systems and Computational Biology, Pathology and Neuroscience, Albert Einstein College of Medicine, Bronx, NY, USA 30 Lübeck Interdisciplinary Platform for Genome Analytics, Institutes of Neurogenetics & Integrative and Experimental Genomics, University of Lübeck, Germany 31 Department of Epidemiology, University of Michigan, Ann Arbor, MI, USA 32 deCODE Genetics/Amgen Inc., Reykjavik, Iceland 33 Department of Genetics, Genomics Coordination Center, University of Groningen, University Medical Center Groningen, The Netherlands 34 Department of Internal Medicine, Erasmus Medical Center, The Netherlands 35 Centre for Epidemiology and Biostatistics, Melbourne School of Population and Global Health, The University of Melbourne 36 Division of Genetics and Cell Biology, San Raffaele Research Institute, Milano, Italy 37 Population, Policy and Practice, UCL Institute of Child Health, London, UK 38 Centre for Environmental and Preventive Medicine, Wolfson Institute of Preventative Medicine, Queen Mary University of London; London, UK 39 Department of Nutrition, Harvard T.H. Chan School of Public Health 40 Department of Medicine, Brigham and Women's Hospital and Harvard Medical School 41 Department of Epidemiology, Harvard T.H. Chan School of Public Health 42 Institute of Genetic and Biomedic Research, National Research Council, Cagliari, Italy 43 Centre for Cognitive Ageing and Cognitive Epidemiology, University of Edinburgh, Edinburgh, UK 44 Department of Psychology, University of Edinburgh, Edinburgh, UK 45 German Socio- Economic Panel Study (SOEP) & Health Economics Research Centre, University of Oxford46 23andMe, Inc. 47 Estonian Genome Center, University of Tartu, Tartu, Estonia 48 Broad Institute of the Massachusetts Institute of Technology and Harvard University, Cambridge, USA 49 Centre for Bone and Arthritis Research, Institute of Medicine, Sahlgrenska Academy, University of Gothenburg, Gothenburg, Sweden 50 The Generation R Study Group, Erasmus MC, University Medical Center Rotterdam, Rotterdam, the Netherlands 51 Department of Pediatrics, Erasmus MC, University Medical Center Rotterdam, Rotterdam, the Netherlands 52 Center for Economic and Social Research, University of Southern California, Los Angeles, California, USA53 Department of Medical, Surgical and Health Sciences, University of Trieste, 34100 Trieste, Italy 54 Research Unit of Molecular Epidemiology, Helmholtz Zentrum München—German Research Center for Environmental Health, Neuherberg, Germany 55 Institute of Epidemiology II, Helmholtz Zentrum München—German Research Center for Environmental Health, Neuherberg, Germany 56 Cardiovascular and Metabolic Conditions Section, Division of Research, Kaiser Permanente Northern California, Oakland, USA 57 Institute for Translational Genomics and Population Sciences, Los Angeles Biomedical Research Institute at Harbor-UCLA Medical Center, Torrance, CA 58 Department of Epidemiology, Indiana University Richard M. Fairbanks School of Public Health 59 Clinical Division of Neurogeriatrics, Department of Neurology, Medical University of Graz, Austria 60 Institute of Medical Informatics, Statistics and Documentation, Medical University of Graz, Austria 61 William Harvey Research Institute, Barts and The London School of Medicine and Dentistry, Queen Mary University of London, UK 62 Department of Neurology, Medical University of Innsbruck, Innsbruck, Austria 63 Centre for Vision Research, Department of Ophthalmology and The Westmead Institute for Medical Research, NSW Australia 64 Institute of Medical Epidemiology, Biostatistics and Informatics, Martin-Luther-University Halle-Wittenberg, Halle (Saale), Germany 65 Department of Biostatistics, Harvard T.H. Chan School of Public Health 66 Department of Neurosciences, KU Leuven, Leuven 3000, Belgium 67 Department of Microbiology and Immunology, KU Leuven, Leuven 3000, Belgium 68 Translational Immunology Laboratory, VIB, Leuven 3000, Belgium
4
69 Institute of Behavioural Sciences, University of Helsinki, Helsinki, Finland 70 Helsinki Collegium for Advanced Studies, University of Helsinki, Helsinki, Finland 71 Folkhälsan Research Centre, Helsinki, Finland 72 Department of Clinical Epidemiology, Leiden University Medical Center, Leiden, the Netherlands 73 Psychiatric Genetics, QIMR Berghofer Medical Research Institute, 300 Herston Rd, Herston Brisbane 4006, Australia 74 Center for Lifespan Psychology, Max Planck Institute for Human Development, Germany & Dept of Vertebrate Genomics, Max Planck Institute for Molecular Genetics, Germany75 Minnesota Center for Twin and Family Research, Department of Psychology, University of Minnesota, Minneapolis, USA 76 Department of Biological Psychology, VU University Amsterdam, Amsterdam, The Netherlands 77 EMGO+ Institute for Health and Care Research, Amsterdam, The Netherlands 78 School of Social and Community Medicine University of Bristol, Bristol, UK 79 Complex Trait Genetics, VU University, Amsterdam, The Netherlands 80 Department of Psychology, University of Minnesota, Minneapolis, USA 81 Department of Obstetrics, Gynecology and Reproductive Biology, Brigham and Women's Hospital and Harvard Medical School 82 Laboratory of Neurogenetics, National Institute on Aging, NIH, Bethesda, Maryland 83 Institute of Genetics and Biophysics "A. Buzzati-Traverso", CNR, Naples - Italy 84 Department of Nutrition and Dietetics, School of Health Science and Education, Harokopio University, Athens, Greece 85 Istituto di Ricerca Genetica e Biomedica, Consiglio Nazionale delle Ricerche,c/o Cittadella Universitaria di Monserrato, Monserrato, Cagliari, Italy 86 Dipartimento di Scienze Biomediche, Università di Sassari, Sassari, Italy 87 Department of Genomics of Common Disease, School of Public Health, Imperial College London, London, UK 88 Wellcome Trust Centre for Human Genetics, Nuffield Department of Medicine, University of Oxford, Oxford, UK 89 Oxford Centre for Diabetes, Endocrinology, and Metabolism, Radcliffe Department of Medicine, University of Oxford, Oxford, UK 90 Rush University Medical Center, Chicago, USA 91 Connors Center for Women's Health and Gender Biology. Brigham and Women's Hospital and Harvard Medical School 92 Institute for Maternal and Child Health-IRCCS “Burlo Garofolo” – Trieste, Italy 93 Department of Medical Genetics, University of Lausanne, Lausanne, Switzerland 94 Swiss Institute of Bioinformatics, Lausanne, Switzerland 95Department of Medicine, University of Leipzig, Leipzig, Germany96 Department of Public Health, University of Helsinki, Helsinki, Finland 97 King’s British Heart Foundation Centre, King’s College London, UK 98 Department of Public Health and Primary Care, University of Cambridge, UK 99 University of Lille, CNRS, Institut Pasteur of Lille, UMR 8199 - EGID, F-59000 Lille, France 100 Centre for Neurogenetics and Statistical Genomics, University of Queensland, Australia 101 MRC Epidemiology Unit, Institute of Metabolic Science, University of Cambridge, Cambridge, UK102 The Data Coordinating Center, New York State Psychiatric Institute 103 Institute of Molecular Genetics, National Research Council of Italy, Pavia 104 MRC Integrative Epidemiology Unit, University of Bristol, Bristol, UK 105 Princess Al-Jawhara Al-Brahim Centre of Excellence in Research of Hereditary Disorders (PACER-HD), King Abdulaziz University, Jeddah, Saudi Arabia 106 National Institute for Health and Welfare, Department of Chronic Disease Prevention, Helsinki, Finland 107 Department of General Practice and Primary Health Care, University of Helsinki, Finland 108 Unit of General Practice, Helsinki University Central Hospital, Finland 109 Vasa Central Hospital, Vasa, Finland 110 Survey Research Center, Institute for Social Research, University of Michigan, Ann Arbor, MI 111 Medical Genetics, IRCCS-Burlo Garofolo and University of Trieste, Trieste, Italy 112 Department of Experimental Genetics, Sidra, Doha, Qatar 113 Department of Psychiatry, University Medicine Greifswald, Greifswald, Germany 114 German Cancer Research Center, Division of Cancer Epidemiology, Heidelberg, Germany
5
115 Econometric Institute, Erasmus School of Economics, Erasmus University Rotterdam, Rotterdam, The Netherlands 116 Laboratory of Epidemiology and Population Sciences, National Institute on Aging, Bethesda, Maryland 117 Genetic Epidemiology, QIMR Berghofer Medical Research Institute, Brisbane, Australia 118 Department of Epidemiology, Harvard T.H. Chan School of Public Health, Boston, MA, USA119 Interfaculty Institute for Genetics and Functional Genomics, University Medicine Greifswald, Germany 120 School of Medicine and Public Health, University of Newcastle, Newcastle, Australia 121 Hunter Medical Research Institute, Newcastle, Australia 122 Centre for Population Health Research, Sansom Institute of Health Research and School of Health Sciences, University of South Australia, Adelaide,Australia 123 South Australian Health and Medical Research Institute, Adelaide, Australia 124 Department of Obstetrics and Gynecology, Institute of Public Health, Sahlgrenska Academy, Sahgrenska University Hospital, Gothenburg, Sweden 125 Department of Genetics and Bioinformatics, Area of Health Data and Digitalisation, Institute of Public Health, Oslo, Norway126 Department of Economics, Stockholm School of Economics,Box Stockholm, Sweden 127 Department of Clinical Physiology, University of Tampere and Tampere University Hospital, Tampere, Finland. 128 National Institute for Health and Welfare, Diabetes Prevention Unit, Helsinki, Finland 129 Children's Hospital, Helsinki University Central Hospital and University of Helsinki,Helsinki, Finland 130 Department of Obstetrics and Gynecology, MRC Oulu, Oulu University Hospital and University of Oulu, Oulu, Finland 131 Institute of Cardiovascular Sciences, University of Manchester 132 Department of Public Health, Faculty of Medicine, University of Split, Croatia 133 National Institute for Health and Welfare, Health Monitoring Unit, Helsinki, Finland 134 IFB Adiposity Diseases, University of Leipzig, Leipzig, Germany 135 Division of Genetic Epidemiology, Medical university of Innsbruck, Innsbruck, Austria 136 Institute of Social and Preventive Medicine, Lausanne University Hospital (CHUV), Lausanne, Switzerland 137 Department of Twin Research and Genetic Epidemiology, King's College London, London, United Kingdom 138 Department of Clinical Chemistry, Fimlab Laboratories, and School of Medicine, University of Tampere, Tampere, Finland 139 LifeLines Cohort Study, Groningen, The Netherlands 140 The National Institute for Health Research Oxford Biomedical Research Centre (F.K.) 141The Li Ka Shing Centre for Health Information and Discovery, the Big Data Institute (C.M.L.), University of Oxford, Oxford, United Kingdom142 Division of Public Health Sciences, Wake Forest School of Medicine, Winston-Salem, North Carolina 143 Strangeways Research Laboratory, University of Cambridge, Worts Causeway, Cambridge, UK 144 UKK Institute for Health Promotion, Finland 145 The Danish Aging Research Center, and The Danish twin Registry, Institute of Public Health, University of Southern Denmark, Odense, Denmark 146 MONICA/KORA Myocardial Infarction Registry, Central Hospital of Augsburg, Augsburg, Germany 147 Institute of Molecular and Cell Biology, University of Tartu, Tartu, Estonia 148 Molecular Bioscience, University of Queensland, Brisbane, Australia.149 Department of Public Health and Primary Care, Leiden University Medical Center, Leiden, the Netherlands 150 Department of BESC, Epidemiology Section, King Faisal Specialist Hospital and Research Centre, Riyadh, Saudi Arabia 151 Research Unit for Gynaecology and Obstetrics, Deparrtment of Clinical Research, University of Southern Denmark 152 Department of Clinical Epidemiology, Aarhus University, Aarhus, Denmark 153 Department of Psychiatry & EMGO Institute for Health and Care Research VU University Medical Center, Amsterdam, The Netherlands 154 National Institute for Health and Welfare, Dept of Health, Helsinki, Finland�
155 Medical Genetics Institute; Cedars-Sinai Medical Center, Los Angeles, CA 156 Research Centre of Applied and Preventive Cardiovascular Medicine, University of Turku and the Department of Clinical Physiology and Nuclear Medicine, Turku University Hospital, Turku, Finland, 157 Department of Psychiatry, Martin-Luther-University Halle-Wittenberg, Halle (Saale), Germany 158 Laboratory of Genetics, National Institute on Aging, Baltimore, Maryland, USA
6
159 Institute of Molecular Biology and Biochemistry, Centre for Molecular Medicine, Medical University of Graz, Austria 160 Departments of Epidemiology and Psychiatry, Columbia University Medical Center NY, USA 161 Alzheimer Scotland Dementia Research Centre, University of Edinburgh, Edinburgh, UK 162 Institute of Medical Informatics, Biometry and Epidemiology, Ludwig Maximilians Universität, Munich, Germany 163 Medical Department, University of Leipzig, Leipzig, Germany 164 Faculty of Medicine, University of Iceland, Reykjavik, Iceland 165 Montpellier Business School, Montpellier, France 166 Department of Medicine, University of Turku, and Division of Medicine, Turku University Hospital, Turku, Finland 167 Institute for Community Medicine, University Medicine Greifswald, Germany 168 Department of Internal Medicine, Internal Medicine, Lausanne University Hospital (CHUV), Lausanne, Switzerland 169Genetic and Genomic Epidemiology Unit, Wellcome Trust Centre for Human Genetics, University of Oxford, Oxford, UK. 170 Department of Psicology, University of Minnesota, USA 171 Center for Economic and Social Research, University of Southern California, Los Angeles, CA, USA 172 National Bureau of Economic Research, Cambridge, MA, USA 173 Department of Economics, New York University, New York, USA 174 Research Institute for Industrial Economics, Stockholm, Sweden 175Department of Medical Sciences, Molecular Epidemiology and Science for Life Laboratory, Uppsala University, Uppsala, Sweden. * These authors contributed equally to this work # Shared second authors
Abstract
The genetic architecture of human reproductive behavior – age at first birth (AFB) and number of
children ever born (NEB) – has a strong relationship with fitness, human development, infertility and
risk of neuropsychiatric disorders. However, very few genetic loci have been identified and the
underlying mechanisms of AFB and NEB are poorly understood. We report the largest genome-wide
association study to date of both sexes including 251,151 individuals for AFB and 343,072 for NEB.
We identified 12 independent loci that are significantly associated with AFB and/or NEB in a SNP-
based genome-wide association study, and four additional loci in a gene-based effort. These loci
harbor genes that are likely to play a role – either directly or by affecting non-local gene expression –
in human reproduction and infertility, thereby increasing our understanding of these complex traits.
Introduction
Human reproductive behavior – age at first birth (AFB) and number of children ever born (NEB) –
has been associated with human development,1,2 infertility3,4 and neuropsychiatric disorders5.
Reproductive tempo (AFB) and quantum (NEB) are cross-cutting topics in the medical, biological,
evolutionary and social sciences and central in national and international policies.6 Advanced societies
experienced a rapid postponement of AFB, with the mean AFB of women now being 28-29 years in
many countries.7 This increase in AFB has been linked to lower fertility rates, unprecedented
childlessness (~20%) and infertility, which affects 10 to 15 % of couples.8 An estimated 48.5 million
7
couples worldwide are infertile, with a large part of subfertility, particularly in men, remaining
unexplained.9 Although infertility has been related to advanced AFB, ovulation defects,
spermatogenic failure, and single- or polygenic defects, their causal effects remain unsubstantiated.10
Until now, genetic and clinical research has focussed on proximal infertility phenotypes.3,4,10,11 AFB
and NEB represent accurate measures of complex reproductive outcomes, are frequently recorded and
consistently measured, and are key parameters for demographic population forecasting.12 There is
evidence of a genetic component underlying reproduction, with heritability estimates of up to 50% for
AFB and NEB (Supplementary Figure 1).6 A recent study attributed 15% of the variance of AFB and
10% of NEB to common genetic variants.13 There are also sex-specific differences in human
reproduction, related to the timing of fertility, fecundability and sex-genotype interactions
(Supplementary Note). Researchers have given less attention to traits such as NEB due to an
erroneous and frequently repeated misinterpretation of Fisher’s14 Fundamental Theorem of Natural
Selection that the additive genetic variance in fitness should be close to zero. The misreading had a
naively intuitive appeal: genes that reduce fitness should have been less frequently passed on. Fisher,
however, actually argues that fitness is moderately heritable in human populations (for a discussion
see the Supplementary Note). Since no established genes are currently available for clinical testing of
infertility,10 isolating genetic loci and their causative effects has the potential to provide new insights
into the etiology of reproductive diseases and novel diagnostic and clinical technologies for infertility
treatment.
RESULTS
We report the largest meta-analysis of genome-wide association studies (GWAS) to date of 251,151
individuals for AFB and 343,072 for NEB from a total of 62 cohorts of European ancestry. We
identify 12 independent loci (10 of which are novel and 2 previously identified in a study on age at
first sexual intercourse11) that are significantly associated with AFB and/or NEB in men, women
and/or both sexes combined (Table 1). Follow-up analyses identified a number of genetic variants and
genes that likely drive GWAS associations. We also quantified the genetic overlap with biologically
adjacent reproductive, developmental, neuropsychiatric and behavioral phenotypes. A detailed
description of all materials and methods is available in the Supplementary Note.
Meta-analysis of GWAS
Associations of AFB (mean ± SD 26.8±4.78 years) and/or NEB (mean ± SD 2.3±1.43 children) with
NCBI build 37 HapMap Phase 2 imputed SNPs were examined in 62 cohorts using multiple linear
regression under an additive model, in men and women separately (Supplementary Note).
Associations were adjusted for principal components – to reduce confounding by population
stratification15 – as well as for the birth year of the respondent and its square and cubic to control for
8
non-linear birth cohort effects (Supplementary Note and Supplementary Tables 1-,2 ). NEB was
assessed only for those who had completed their reproductive period (age ≥ 45 women; age ≥ 55
men), while AFB was only assessed for those who were parous. Quality control (QC) was conducted
in two independent centers using QCGWAS16 and EasyQC17 (Supplementary Note). Results were
subsequently meta-analyzed for the 2.4M SNPs that passed QC filters (Supplementary Note) and
reported for men and women combined and separately.
We applied a single genomic control at the cohort level and meta-analyzed results using a sample-size
weighted fixed effect method in METAL (Supplementary Note). The PLINK clumping function
isolated ‘lead SNPs’ – i.e. those with the lowest P-value for association that are independently
associated – using an r2 threshold of 0.1 and distance threshold of 500 kb. For AFB, we identified ten
genome-wide significantly associated loci (i.e., P<5x10⁻⁸ for combined and P<1.67x10⁻⁸ for sex-
specific results adjusted for multiple testing) of which nine were significantly associated in both sexes
combined and one in women only (N=154,839) (Figure 1a, Table 1). Three loci were significantly
associated with NEB: two in both sexes combined and one in men only (N=103,736) (Figure 1b,
Table 1, Supplementary Note). One locus on Chr 1 reached significance for association with both
AFB and NEB with an r2 of 0.57 between the two lead SNPs, suggesting a shared genetic basis for the
two traits (Table 2). A statistical test of sex-specific effects confirms that differences are mainly due
to variation in sample size and not variation in effect sizes (Supplementary Note).
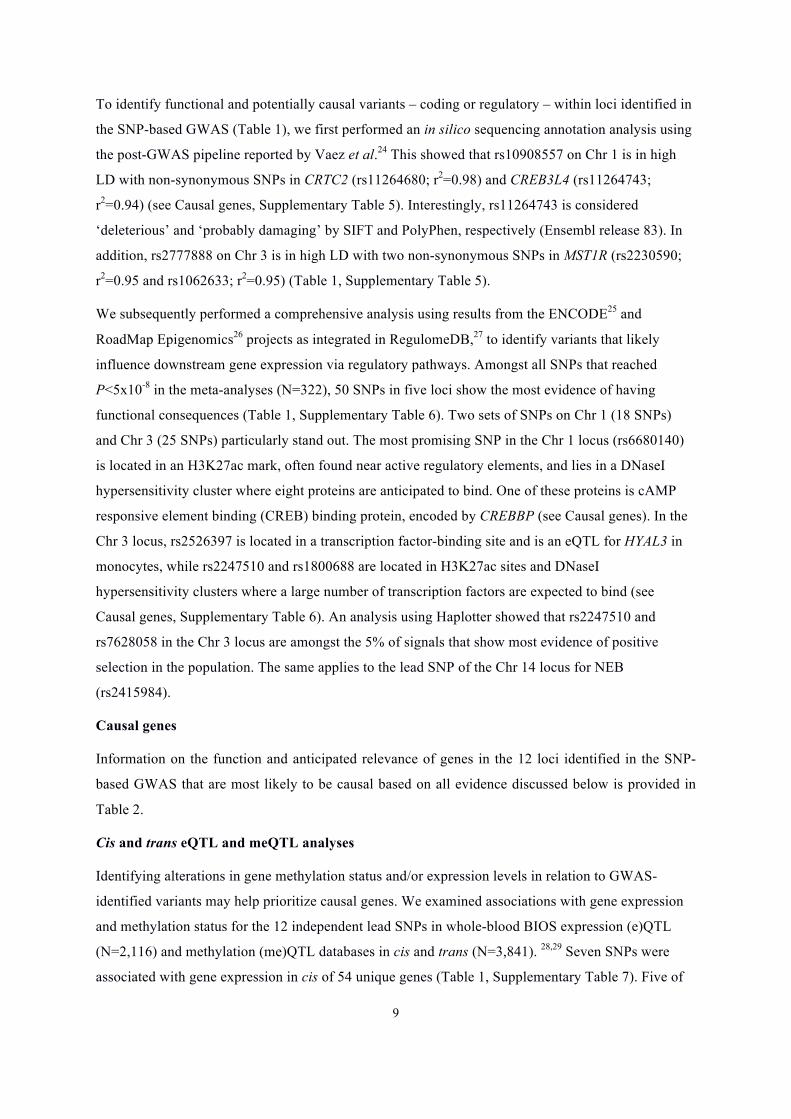
As for other complex traits18, the Q-Q plots of the meta-analyses exhibit strong inflation of low P-
values (Figure 2), suggesting that although cohorts controlled for the top principal components and
cohort-level genomic control was applied (Supplementary Note), residual population stratification
may remain. However, the LD Score intercept method19 as well as a series of individual and within-
family regression analyses using polygenic scores as predictors20,21 (Supplementary Note) indicated
that the observed inflation is almost entirely attributable to a true polygenic signal, rather than
population stratification.
Gene-based GWAS
To increase the power to find statistically significant associations and causal genes, we additionally
performed a gene-based GWAS using VEGAS.22,23 The results confirmed top hits from the single-
SNP analyses. For AFB, seven loci from the SNP-based GWAS were also represented in the gene-
based analysis (Supplementary Table 3), and three additional loci emerged, represented by SLF2 (Chr
10), ENO4 (Chr 10) and TRAF3-AMN (Chr 14). For NEB, one locus from the SNP-based GWAS was
represented in the gene-based analysis – i.e. GATAD2B (Chr 1) – and one novel locus on Chr 17 was
identified (Supplementary Table 4).
Causal variants
9
To identify functional and potentially causal variants – coding or regulatory – within loci identified in
the SNP-based GWAS (Table 1), we first performed an in silico sequencing annotation analysis using
the post-GWAS pipeline reported by Vaez et al.24 This showed that rs10908557 on Chr 1 is in high
LD with non-synonymous SNPs in CRTC2 (rs11264680; r2=0.98) and CREB3L4 (rs11264743;
r2=0.94) (see Causal genes, Supplementary Table 5). Interestingly, rs11264743 is considered
‘deleterious’ and ‘probably damaging’ by SIFT and PolyPhen, respectively (Ensembl release 83). In
addition, rs2777888 on Chr 3 is in high LD with two non-synonymous SNPs in MST1R (rs2230590;
r2=0.95 and rs1062633; r2=0.95) (Table 1, Supplementary Table 5).
We subsequently performed a comprehensive analysis using results from the ENCODE25 and
RoadMap Epigenomics26 projects as integrated in RegulomeDB,27 to identify variants that likely
influence downstream gene expression via regulatory pathways. Amongst all SNPs that reached
P<5x10⁻⁸ in the meta-analyses (N=322), 50 SNPs in five loci show the most evidence of having
functional consequences (Table 1, Supplementary Table 6). Two sets of SNPs on Chr 1 (18 SNPs)
and Chr 3 (25 SNPs) particularly stand out. The most promising SNP in the Chr 1 locus (rs6680140)
is located in an H3K27ac mark, often found near active regulatory elements, and lies in a DNaseI
hypersensitivity cluster where eight proteins are anticipated to bind. One of these proteins is cAMP
responsive element binding (CREB) binding protein, encoded by CREBBP (see Causal genes). In the
Chr 3 locus, rs2526397 is located in a transcription factor-binding site and is an eQTL for HYAL3 in
monocytes, while rs2247510 and rs1800688 are located in H3K27ac sites and DNaseI
hypersensitivity clusters where a large number of transcription factors are expected to bind (see
Causal genes, Supplementary Table 6). An analysis using Haplotter showed that rs2247510 and
rs7628058 in the Chr 3 locus are amongst the 5% of signals that show most evidence of positive
selection in the population. The same applies to the lead SNP of the Chr 14 locus for NEB
(rs2415984).
Causal genes
Information on the function and anticipated relevance of genes in the 12 loci identified in the SNP-
based GWAS that are most likely to be causal based on all evidence discussed below is provided in
Table 2.
Cis and trans eQTL and meQTL analyses
Identifying alterations in gene methylation status and/or expression levels in relation to GWAS-
identified variants may help prioritize causal genes. We examined associations with gene expression
and methylation status for the 12 independent lead SNPs in whole-blood BIOS expression (e)QTL
(N=2,116) and methylation (me)QTL databases in cis and trans (N=3,841). 28,29 Seven SNPs were
associated with gene expression in cis of 54 unique genes (Table 1, Supplementary Table 7). Five of
10
the seven SNPs were in high LD (r2>0.8) with the strongest eQTL of at least one of the genes within
the corresponding loci, indicating that the SNP associated with AFB or NEB and the SNP most
significantly associated with expression tag the same functional site, i.e., rs10908557 (associated with
the expression of CRTC2 and SLC39A1), rs1160544 (AFF3), rs2777888 (RBM6, RNF123 and RBM5),
rs2721195 (CYHR1, GPT, RECQL4 and PPP1R16A) and rs293566 (NOL4L). Three SNPs were
associated with the expression of a total of eight genes in trans (Table 1, Supplementary Table 8). Of
these SNPs, only rs2777888 was in high LD (r2>0.8) with the strongest eQTL for three of its five
associated genes: LRFN1, LAMP2 and FGD3.
The meQTL analysis showed that 11 of the 12 independent lead SNPs were associated with DNA
methylation of a total of 131 unique genes in cis (Table 1, Supplementary Table 9). Seven of the 11
SNPs were in high LD (r2>0.8) with the strongest meQTL of one of the corresponding methylation
sites, i.e., rs10908557 (associated with methylation of CRTC2, SLC39A1, CREB3L4, DENND4B and
RAB13), rs1160544 (AFF3), rs2777888 (CAMKV), rs6885307 (C5orf34), rs10056247 (JADE2),
rs2721195 (CYHR1) and rs13161115 (EFNA5). Three of the SNPs were associated with the same
genes for both methylation and gene expression in cis: rs10908557 (CRTC2), rs1160544 (AFF3) and
rs2721195 (CYHR1) (Supplementary Tables 7,9). Three SNPs were associated with methylation of a
total of ten genes in trans (Table 1, Supplementary Table 10). Of these SNPs, only rs2777888 was in
high LD (r2>0.8) with the strongest meQTL of a corresponding methylation site (ASAP3). Of note:
rs2777888 was also a trans eQTL.
Gene prioritization
We used four publicly available bioinformatics tools to systematically identify genes that are more
likely than neighboring genes to cause the associations identified by our GWAS. Of all genes that
reached P<0.05 in analyses using Endeavour,30 MetaRanker31 and ToppGene,32 eight genes were
prioritized for both AFB and NEB: TPM3, GRM7, TKT, MAGI2, PTPRD, PTPRM, RORA and WT1.
Data-driven Expression-Prioritized Integration for Complex Traits (DEPICT) – a fourth,
comprehensive and unbiased recently described gene prioritization tool33 – identified three genes in
GWAS significant loci as likely being causal for AFB (MON1A, RBM6 and U73166.2)
(Supplementary Tables 11, 12).
Gene-based results from RegulomeDB
An analysis using RegulomeDB identified 50 SNPs in five loci that most likely have regulatory
consequences (see Causal variants, Supplementary Table 6). Eighteen and 25 of these SNPs are
within the Chr 1 and Chr 3 loci, respectively. Amongst the genes that – at a protein level – bind at the
site of one or more of the 18 variants in the locus on Chr 1 are CREBBP, HNF4A, CDX2 and ERG.
These genes may act upstream in the causal pathway and influence the expression of causal genes at
11
this locus. Of the 25 SNPs on Chr 3, ten were eQTLs for RBM6 in monocytes, and seven were eQTLs
for HYAL3 in monocytes. Amongst the genes that – at a protein level – bind at rs2247510 and
rs1800688 in the Chr 3 locus are ARID3A, REST and TFAP2C, as well as HNF4A and CDX2, which
also bind at the Chr 1 locus.
Five genes encode proteins that bind at the site of both SNPs on Chr 2 that reach P<5x10⁻⁸ in the
meta-analysis of GWAS. One of these is REST (see Chr 3 locus), another one – ESR1 – is the most
likely causal gene in the Chr 6 locus.
Functional network and enrichment analyses
Functional network analysis using five prioritized candidate gene sets as input (Supplementary Note)
showed no significantly enriched biological function. No biological function was significantly
enriched after correction for multiple testing using the Benjamini-Hochberg procedure. Similarly, no
reconstituted gene sets and cell or tissue types were significantly enriched in the GWAS meta-analysis
results based on results from the DEPICT analysis (Supplementary Tables 13-20). The lack of
significantly enriched genes, tissue sets and biological functions reflects the need for a larger sample
size but also the distal nature of the phenotypes, which are influenced by a mixture of biological,
psychological and socio-environmental factors.
Polygenic prediction
To assess the predictive power of our results, we produced polygenic scores for AFB and NEB using
sets of SNPs whose nominal P-values ranged from P<5x10⁻⁸ (i.e. using only genome-wide significant
SNPs) to 1 (using all SNPs that passed quality control) using PRSice34 (Supplementary Note). We
then performed a series of four different out-of-sample predictions in four independent cohorts: HRS,
Lifelines, STR and TwinsUK. Across the four cohorts, the mean predictive power of a polygenic
score constructed from all measured SNPs is 0.9% for AFB and 0.2% for NEB (Supplementary Figure
2). Despite the low predictive power of the polygenic scores, the results showed that a 1 standard
deviation (SD) increase of the NEB polygenic score is associated with a 9% (95% CI 5%–13%)
decrease in the probability for women to remain childless, with no significant association in men
(Supplementary Table 21). When we control for right-censored data using a survival model for AFB,
we found that a 1SD increase in the AFB polygenic score is associated with an 8% (95% CI 7%–10%)
reduction in the hazard ratio of reproduction in women and 3% (95% CI 1%–5%) in men
(Supplementary Table 22). As an additional test, we examined whether the aforementioned polygenic
scores for AFB and NEB can predict related fertility traits such as age at menopause and age at
menarche (Supplementary Table 23). Our estimates indicate that a 1SD increase of the AFB polygenic
score is associated with a 3% decrease in age at natural menopause (95% CI 1%–5% ) and a 20 day
increase in age at menarche (95% CI 0.4–40 days).
12
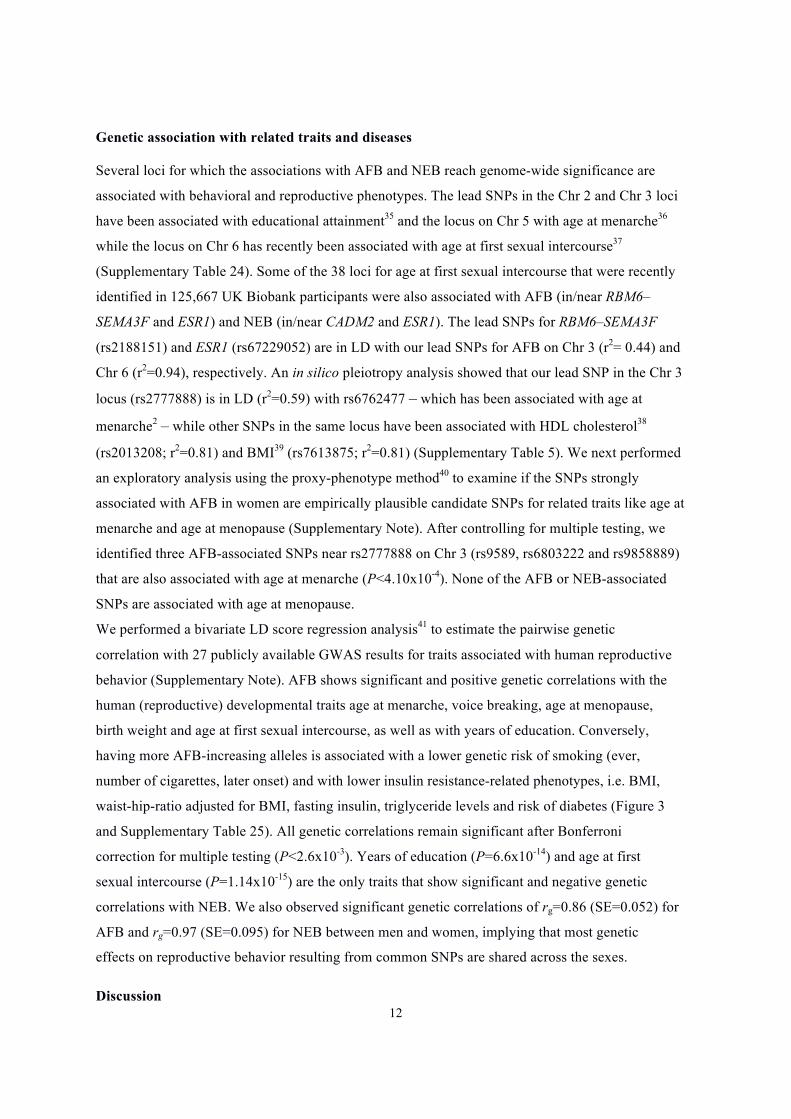
Genetic association with related traits and diseases
Several loci for which the associations with AFB and NEB reach genome-wide significance are
associated with behavioral and reproductive phenotypes. The lead SNPs in the Chr 2 and Chr 3 loci
have been associated with educational attainment35 and the locus on Chr 5 with age at menarche36
while the locus on Chr 6 has recently been associated with age at first sexual intercourse37
(Supplementary Table 24). Some of the 38 loci for age at first sexual intercourse that were recently
identified in 125,667 UK Biobank participants were also associated with AFB (in/near RBM6–
SEMA3F and ESR1) and NEB (in/near CADM2 and ESR1). The lead SNPs for RBM6–SEMA3F
(rs2188151) and ESR1 (rs67229052) are in LD with our lead SNPs for AFB on Chr 3 (r2= 0.44) and
Chr 6 (r2=0.94), respectively. An in silico pleiotropy analysis showed that our lead SNP in the Chr 3
locus (rs2777888) is in LD (r2=0.59) with rs6762477 – which has been associated with age at
menarche2 – while other SNPs in the same locus have been associated with HDL cholesterol38
(rs2013208; r2=0.81) and BMI39 (rs7613875; r2=0.81) (Supplementary Table 5). We next performed
an exploratory analysis using the proxy-phenotype method40 to examine if the SNPs strongly
associated with AFB in women are empirically plausible candidate SNPs for related traits like age at
menarche and age at menopause (Supplementary Note). After controlling for multiple testing, we
identified three AFB-associated SNPs near rs2777888 on Chr 3 (rs9589, rs6803222 and rs9858889)
that are also associated with age at menarche (P<4.10x10⁻⁴). None of the AFB or NEB-associated
SNPs are associated with age at menopause.
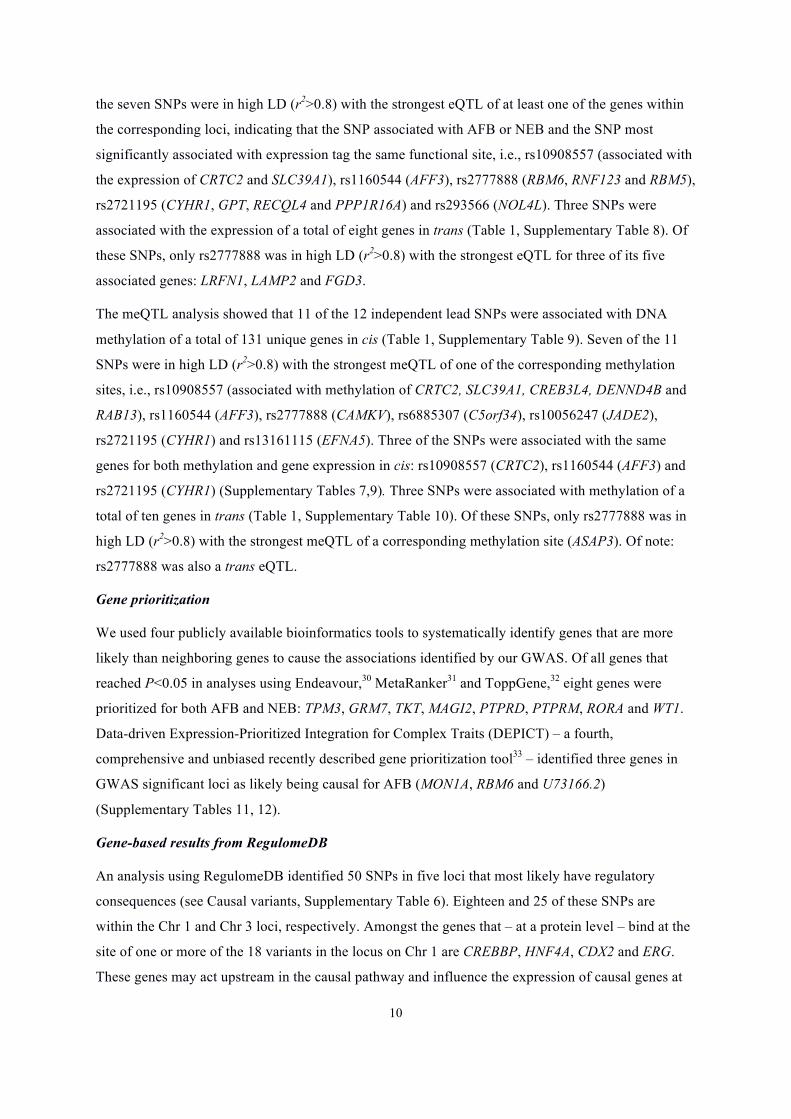
We performed a bivariate LD score regression analysis41 to estimate the pairwise genetic
correlation with 27 publicly available GWAS results for traits associated with human reproductive
behavior (Supplementary Note). AFB shows significant and positive genetic correlations with the
human (reproductive) developmental traits age at menarche, voice breaking, age at menopause,
birth weight and age at first sexual intercourse, as well as with years of education. Conversely,
having more AFB-increasing alleles is associated with a lower genetic risk of smoking (ever,
number of cigarettes, later onset) and with lower insulin resistance-related phenotypes, i.e. BMI,
waist-hip-ratio adjusted for BMI, fasting insulin, triglyceride levels and risk of diabetes (Figure 3
and Supplementary Table 25). All genetic correlations remain significant after Bonferroni
correction for multiple testing (P<2.6x10⁻³). Years of education (P=6.6x10⁻¹⁴) and age at first
sexual intercourse (P=1.14x10⁻¹⁵) are the only traits that show significant and negative genetic
correlations with NEB. We also observed significant genetic correlations of rg=0.86 (SE=0.052) for
AFB and rg=0.97 (SE=0.095) for NEB between men and women, implying that most genetic
effects on reproductive behavior resulting from common SNPs are shared across the sexes.
Discussion
13
This GWAS is the largest genetic epidemiological discovery effort for human reproduction to date,
with critical implications for population fitness and clear physiological mechanisms linking
hypothesized genes and observed phenotypes. Related studies previously focussed on reproductive
life span42,43, age at first sexual intercourse11 and more proximal infertility phenotypes,2–4 largely
overlooking AFB and NEB. The rapid postponement of AFB and increased infertility and involuntary
childlessness in many societies7 makes it important to uncover the genetic and biological architecture
of reproduction. We identify ten novel and confirm two recently identified genetic loci that are
robustly associated with AFB and NEB, as well as variants and genes within these loci that likely
drive these associations. Four additional loci were identified in a gene-based GWAS.
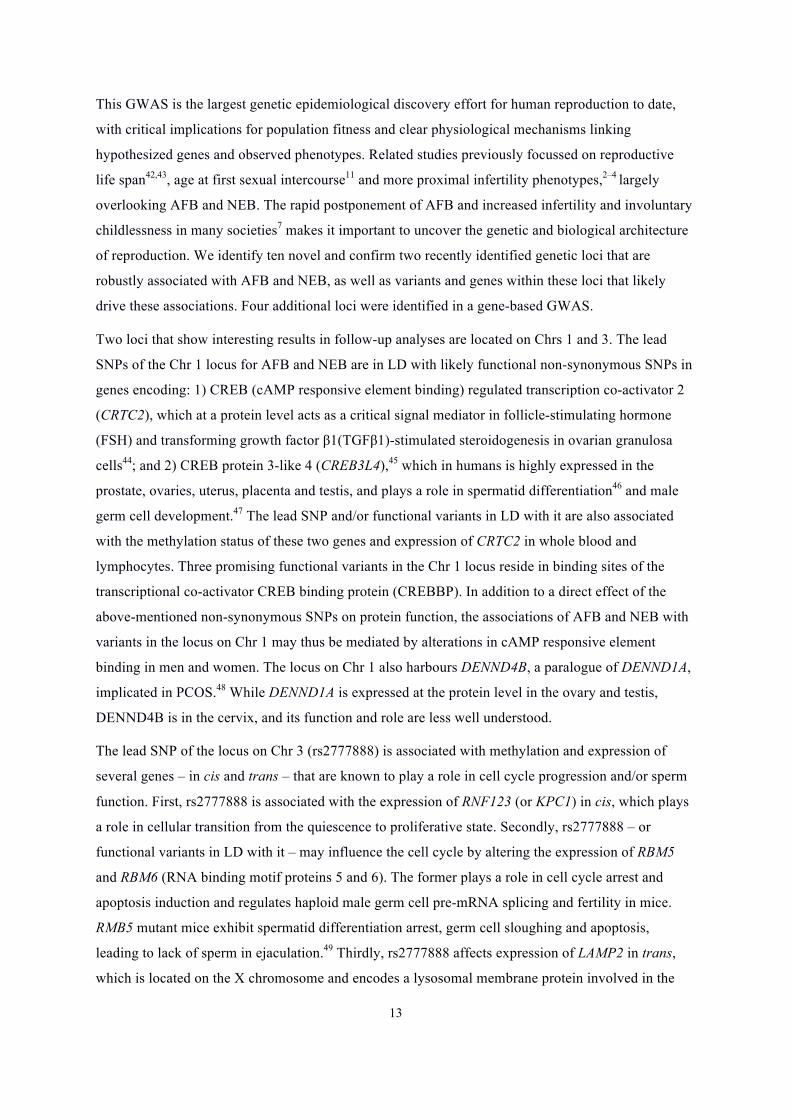
Two loci that show interesting results in follow-up analyses are located on Chrs 1 and 3. The lead
SNPs of the Chr 1 locus for AFB and NEB are in LD with likely functional non-synonymous SNPs in
genes encoding: 1) CREB (cAMP responsive element binding) regulated transcription co-activator 2
(CRTC2), which at a protein level acts as a critical signal mediator in follicle-stimulating hormone
(FSH) and transforming growth factor β1(TGFβ1)-stimulated steroidogenesis in ovarian granulosa
cells44; and 2) CREB protein 3-like 4 (CREB3L4),45 which in humans is highly expressed in the
prostate, ovaries, uterus, placenta and testis, and plays a role in spermatid differentiation46 and male
germ cell development.47 The lead SNP and/or functional variants in LD with it are also associated
with the methylation status of these two genes and expression of CRTC2 in whole blood and
lymphocytes. Three promising functional variants in the Chr 1 locus reside in binding sites of the
transcriptional co-activator CREB binding protein (CREBBP). In addition to a direct effect of the
above-mentioned non-synonymous SNPs on protein function, the associations of AFB and NEB with
variants in the locus on Chr 1 may thus be mediated by alterations in cAMP responsive element
binding in men and women. The locus on Chr 1 also harbours DENND4B, a paralogue of DENND1A,
implicated in PCOS.48 While DENND1A is expressed at the protein level in the ovary and testis,
DENND4B is in the cervix, and its function and role are less well understood.
The lead SNP of the locus on Chr 3 (rs2777888) is associated with methylation and expression of
several genes – in cis and trans – that are known to play a role in cell cycle progression and/or sperm
function. First, rs2777888 is associated with the expression of RNF123 (or KPC1) in cis, which plays
a role in cellular transition from the quiescence to proliferative state. Secondly, rs2777888 – or
functional variants in LD with it – may influence the cell cycle by altering the expression of RBM5
and RBM6 (RNA binding motif proteins 5 and 6). The former plays a role in cell cycle arrest and
apoptosis induction and regulates haploid male germ cell pre-mRNA splicing and fertility in mice.
RMB5 mutant mice exhibit spermatid differentiation arrest, germ cell sloughing and apoptosis,
leading to lack of sperm in ejaculation.49 Thirdly, rs2777888 affects expression of LAMP2 in trans,
which is located on the X chromosome and encodes a lysosomal membrane protein involved in the
14
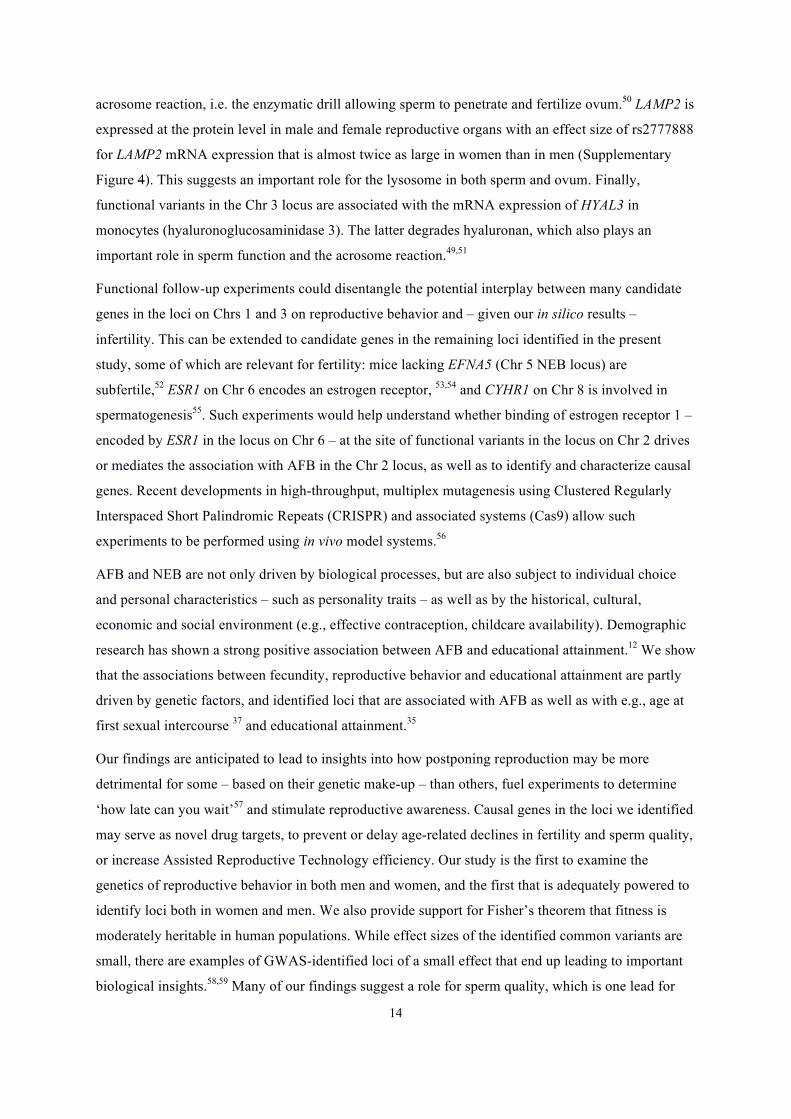
acrosome reaction, i.e. the enzymatic drill allowing sperm to penetrate and fertilize ovum.50 LAMP2 is
expressed at the protein level in male and female reproductive organs with an effect size of rs2777888
for LAMP2 mRNA expression that is almost twice as large in women than in men (Supplementary
Figure 4). This suggests an important role for the lysosome in both sperm and ovum. Finally,
functional variants in the Chr 3 locus are associated with the mRNA expression of HYAL3 in
monocytes (hyaluronoglucosaminidase 3). The latter degrades hyaluronan, which also plays an
important role in sperm function and the acrosome reaction.49,51
Functional follow-up experiments could disentangle the potential interplay between many candidate
genes in the loci on Chrs 1 and 3 on reproductive behavior and – given our in silico results –
infertility. This can be extended to candidate genes in the remaining loci identified in the present
study, some of which are relevant for fertility: mice lacking EFNA5 (Chr 5 NEB locus) are
subfertile,52 ESR1 on Chr 6 encodes an estrogen receptor, 53,54 and CYHR1 on Chr 8 is involved in
spermatogenesis55. Such experiments would help understand whether binding of estrogen receptor 1 –
encoded by ESR1 in the locus on Chr 6 – at the site of functional variants in the locus on Chr 2 drives
or mediates the association with AFB in the Chr 2 locus, as well as to identify and characterize causal
genes. Recent developments in high-throughput, multiplex mutagenesis using Clustered Regularly
Interspaced Short Palindromic Repeats (CRISPR) and associated systems (Cas9) allow such
experiments to be performed using in vivo model systems.56
AFB and NEB are not only driven by biological processes, but are also subject to individual choice
and personal characteristics – such as personality traits – as well as by the historical, cultural,
economic and social environment (e.g., effective contraception, childcare availability). Demographic
research has shown a strong positive association between AFB and educational attainment.12 We show
that the associations between fecundity, reproductive behavior and educational attainment are partly
driven by genetic factors, and identified loci that are associated with AFB as well as with e.g., age at
first sexual intercourse 37 and educational attainment.35
Our findings are anticipated to lead to insights into how postponing reproduction may be more
detrimental for some – based on their genetic make-up – than others, fuel experiments to determine
‘how late can you wait’57 and stimulate reproductive awareness. Causal genes in the loci we identified
may serve as novel drug targets, to prevent or delay age-related declines in fertility and sperm quality,
or increase Assisted Reproductive Technology efficiency. Our study is the first to examine the
genetics of reproductive behavior in both men and women, and the first that is adequately powered to
identify loci both in women and men. We also provide support for Fisher’s theorem that fitness is
moderately heritable in human populations. While effect sizes of the identified common variants are
small, there are examples of GWAS-identified loci of a small effect that end up leading to important
biological insights.58,59 Many of our findings suggest a role for sperm quality, which is one lead for
15
researchers to pursue. Since current sperm tests remain rudimentary, our findings could serve as a
basis for ‘good quality’ sperm markers. We identified variants that are likely causal – both coding and
regulatory – as well as a set of genes that likely underlie the associations we identified. Follow-up
experiments in animal models are required to confirm and characterize the causal genes in these loci.
URLs
Analysis plan pre-deposited in the Open Science Framework website: https://osf.io/53tea/
Gene Network: http://129.125.135.180:8080/GeneNetwork/
Reprogen Website: http://www.reprogen.org/data_download.html
Sociogenome website: http://www.sociogenome.com
Social Science Genetic Association Website: http://thessgac.org
ACKNOWLEDGMENTS
For full acknowledgements, see Supplementary Note. Funding to lead this consortium was provided
by grants awarded to M.C.Mills: ERC Consolidator Grant SOCIOGENOME (615603), Dutch Science
Foundation (NWO, VIDI grant 452-10-012), UK ESRC/NCRM SOCGEN grant. M. den Hoed was
supported by grants from the Swedish research Council (2015-03657) and the Swedish Heart-Lung
Foundation (20140543). Research was carried out in collaboration with the Social Science Genetic
Association Consortium (SSGAC), with funding from the US National Science Foundation (EAGER:
‘Workshop for the Formation of a Social Science Genetic Association Consortium’), a supplementary
grant from the National Institute of Health Office of Behavioral and Social Science Research, the
Ragnar Söderberg Foundation (E9/11), the Swedish Research Council (421-2013-1061), the Jan
Wallander and Tom Hedelius Foundation, an ERC Consolidator Grant (647648 EdGe), the Pershing
Square Fund of the Foundations of Human Behavior, and the NIA/NIH through grants P01-
AG005842, P01-AG005842-20S2, P30-AG012810, and T32-AG000186-23 to NBER and R01-
AG042568-02 to the University of Southern California. X.Shen was supported by a grant from the
Swedish Research Council (No. 537-2014-371). We thank Xueijie Ding for research assistance,
Nicola Pirastu, Kevin Coward and Lawrence Layman for valuable comments and the University of
Oxford Advanced Research Computing (ARC) facility: http://dx.doi.org/10.5281/zenodo.22558.
AUTHOR CONTRIBUTIONS
Senior investigators who led writing, analysis, study design M.C.M, H.S, M.d.H.; Senior investigators
participated in study design: P.K., D.B., D.C., Junior investigator who contributed to the study design
and management: N.B.; Population stratification: N.B. and F.C.T.; Genetic correlations and polygenic
scores prediction: N.B.; Meta-analysis and quality control: N.B., R.dV., J.M., I.M.N.; Biological
annotation: R.J., M.d.H., A.V.; Sex-specific genetic effects: F.T.; Bivariate and Conditional analysis
16
of the two fertility traits: X.S., J.F.W., D.I.C.; Gene-based analysis V.T., S.W.v.d.L. Authors not
listed contributed to recruitment, genotyping, or data processing for the meta-analysis. Results can be
downloaded from the SOCIOGENOME (http://www.sociogenome.com) and SSGAC website
(http://www.thessgac.org/). Data come from multiple studies, most of which are subject to a MTA,
and are listed in the Supplementary Information. Correspondence and requests for materials should be
addressed to the corresponding authors or [email protected].
COMPETING FINANCIAL INTERESTS
The authors declare no competing financial interests.
References
1. Elks, C. et al. Thirty new loci for age at menarche identified by a meta-analysis of genome-wide association studies. Nat. Genet. 42, 1077–1085 (2010).
2. Perry, J. R. B. et al. Parent-of-origin-specific allelic associations among 106 genomic loci for age at menarche. Nature 514, 92–97 (2014).
3. Rahmioglu, N. et al. Genetic variants underlying risk of endometriosis: insights from meta-analysis of eight genome-wide association and replication datasets. Hum. Reprod. Update 20, 702–716 (2014).
4. Day, F. R. et al. Causal mechanisms and balancing selection inferred from genetic associations with polycystic ovary syndrome. Nat. Commun. 6, 8464 (2015).
5. Mehta, D. et al. Evidence for genetic overlap between schizophrenia and age at first birth in women. JAMA Psychiatry (2016).
6. Mills, M. C. & Tropf, F. C. The Biodemography of Fertility: A Review and Future Research Frontiers. Kolner Z. Soz. Sozpsychol. 55, 397–424 (2016).
7. Mills, M. C. et al. Why do people postpone parenthood? Reasons and social policy incentives. Hum. Reprod. Update 17, 848–860 (2011).
8. Boivin, J., Bunting, L., Collins, J. A. & Nygren, K. G. International estimates of infertility prevalence and treatment-seeking: potential need and demand for infertility medical care. Hum. Reprod. 22, 1506–12 (2007).
9. Mascarenhas, M. N., Flaxman, S. R., Boerma, T., Vanderpoel, S. & Stevens, G. A. National, regional, and global trends in infertility prevalence since 1990: a systematic analysis of 277 health surveys. PLoS Med. 9, e1001356 (2012).
10. Venkatesh, T., Suresh, P.S., Tsutsumi, R. New insights into the genetic basis of infertility. Appl Clin Genet 1, 235–43 (2014).
11. Day, F. R. et al. Physical and neurobehavioral determinants of reproductive onset and success. Nat. Genet. doi:10.1038/ng.3551 (2016). doi:10.1038/ng.3551
12. Balbo, N., Billari, F. C. & Mills, M. C. Fertility in Advanced Societies: A Review of Research. Eur. J. Popul. / Rev. Eur. Démographie 29, 1–38 (2012).
13. Tropf, F. C. et al. Human Fertility, Molecular Genetics, and Natural Selection in Modern Societies. PLoS One 10, e0126821 (2015).
17
14. Fisher, R. A. The genetical theory of natural selection. (Oxford University Press, 1930).
15. Price, A. L. et al. Principal components analysis corrects for stratification in genome-wide association studies. Nat. Genet. 38, 904–909 (2006).
16. Van der Most, P. J. et al. QCGWAS: A flexible R package for automated quality control of genome-wide association results. Bioinformatics 30, 1185–86 (2014).
17. Winkler, T. W. et al. Quality control and conduct of genome-wide association meta-analyses. Nat. Protoc. 9, 1192–1212 (2014).
18. Lango Allen, H. et al. Hundreds of variants clustered in genomic loci and biological pathways affect human height. Nature 467, 832–8 (2010).
19. Bulik-Sullivan, B. K. et al. LD Score regression distinguishes confounding from polygenicity in genome-wide association studies. Nat. Genet. (2015).
20. Wood, A. R. et al. Defining the role of common variation in the genomic and biological architecture of adult human height. Nat. Genet. 46, 1173–1186 (2014).
21. Purcell, S. M. et al. Common polygenic variation contributes to risk of schizophrenia and bipolar disorder. Nature 460, 748–752 (2009).
22. Liu, J. Z. et al. A versatile gene-based test for genome-wide association studies. Am. J. Hum. Genet. 87, 139–45 (2010).
23. Mishra, A. & Macgregor, S. VEGAS2: Software for More Flexible Gene-Based Testing. Twin Res. Hum. Genet. 1–6 (2014). doi:10.1017/thg.2014.79
24. Vaez, A. et al. In Silico Post Genome-Wide Association Studies Analysis of C-Reactive Protein Loci Suggests an Important Role for Interferons. Circ. Cardiovasc. Genet. 8, 487–497 (2015).
25. The ENCODE (ENCyclopedia Of DNA Elements) Project. Science 306, 636–40 (2004).
26. Consortium, R. E. et al. Integrative analysis of 111 reference human epigenomes. Nature 518, 317–330 (2015).
27. Boyle, A. P. et al. Annotation of functional variation in personal genomes using RegulomeDB. Genome Res. 22, 1790–7 (2012).
28. Zhernakova, D. et al. Hypothesis-free identification of modulators of genetic risk factors. bioRxiv (Cold Spring Harbor Labs Journals, 2015).
29. Bonder, M. J. et al. Disease variants alter transcription factor levels and methylation of their binding sites. bioRxiv (Cold Spring Harbor Labs Journals, 2015). doi:10.1101/033084
30. Tranchevent, L. C. et al. ENDEAVOUR update: a web resource for gene prioritization in multiple species. Nucleic Acids Res. 36, 377–384 (2008).
31. Pers, T. H., Dworzyński, P., Thomas, C. E., Lage, K. & Brunak, S. MetaRanker 2.0: a web server for prioritization of genetic variation data. Nucleic Acids Res. 41, 104–108 (2013).
32. Chen, J., Bardes, E. E., Aronow, B. J. & Jegga, A. G. ToppGene Suite for gene list enrichment analysis and candidate gene prioritization. Nucleic Acids Res. 37, 305–311 (2009).
33. Pers, T. H. et al. Biological interpretation of genome-wide association studies using predicted gene functions. Nat. Commun. 6, 5890 (2015).
34. Euesden, J., Lewis, C. M. & O’Reilly, P. F. PRSice: Polygenic Risk Score software. Bioinformatics 31, btu848-1468 (2014).
35. A. Okbay, J.P. Beauchamp, M.A. Fontana, J.J. Lee, T.H. Pers, C.A. Rietveld, P. Turley,..., P.M. Visscher, T. Esko, P.D. Koellinger, D. Cesarini, D. J. B. Genome-wide association study identifies 74 loci associated with educational attainment. Nature
18
36. Perry, J. R. B. et al. Parent-of-origin-specific allelic associations among 106 genomic loci for age at menarche. Nature 514, 92–97 (2014).
37. Day, F. R. et al. Physical and neurobehavioral determinants of reproductive onset and success Nat. Genet. 48, 617–23 (2016).
38. Willer, C. J. et al. Discovery and refinement of loci associated with lipid levels. Nat. Genet. 45, 1274–83 (2013).
39. Locke, A. E. et al. Genetic studies of body mass index yield new insights for obesity biology. Nature 518, 197–206 (2015).
40. Rietveld, C. A. et al. Common genetic variants associated with cognitive performance identified using the proxy-phenotype method. Proc Natl Acad Sci US A 111, 13790–13794 (2014).
41. Bulik-Sullivan, B. K. & Al., E. An atlas of genetic correlations across human diseases and traits. Nat. Genet. 47, 1236–41 (2015).
42. Day, Felix R., Katherine S Ruth, Deborah J Thompson, Kathryn L Lunetta, Natalia Pervjakova, Daniel I Chasman, Lisette Stolk, Hilary K Finucane, Patrick Sulem, Brendan Bulik-Sullivan, Tõnu Esko, Andrew D Johnson, Cathy E Elks, Nora Franceschini, Chunyan He, L. M. R. et al. Large-scale genomic analyses link reproductive aging to hypothalamic signaling, breast cancer susceptibility and BRCA1-mediated DNA repair. Nat. Genet. 47, 1294–1303 (2015).
43. Perry, J., Corre, T. & Esko, T. A genome-wide association study of early menopause and the combined impact of identified variants. Hum. Mol. Genet. 1465–1472 (2013).
44. Fang, W.-L. et al. CREB coactivator CRTC2/TORC2 and its regulator calcineurin crucially mediate follicle-stimulating hormone and transforming growth factor β1 upregulation of steroidogenesis. J. Cell. Physiol. 227, 2430–40 (2012).
45. Cao, G., Ni, X., Jiang, M., Ma, Y., Cheng, H., Guo, L., Ji, C., Xie, Y., Mao, Y. Molecular cloning and characterization of a novel human cAMP response element-binding ( CREB) gene ( CREB4). J. Hum. Genet. 47, 373–6 (2002).
46. El-Alfy, M. et al. Stage-specific expression of the Atce1/Tisp40alpha isoform of CREB3L4 in mouse spermatids. J. Androl. 27, 686–94
47. Adham, I. M. et al. Reduction of Spermatogenesis but Not Fertility in Creb3l4-Deficient Mice. Mol. Cell. Biol. 25, 7657–7664 (2005).
48. McAllister, J. M. et al. Overexpression of a DENND1A isoform produces a polycystic ovary syndrome theca phenotype. Proc. Natl. Acad. Sci. U. S. A. 111, E1519-27 (2014).
49. O’Bryan, M. K. et al. RBM5 is a male germ cell splicing factor and is required for spermatid differentiation and male fertility. PLoS Genet. 9, e1003628 (2013).
50. Tsukamoto, S. et al. Functional analysis of lysosomes during mouse preimplantation embryo development. J. Reprod. Dev. 59, 33–9 (2013).
51. Szucs, M., Osvath, P., Laczko, I. & Jakab, A. Adequacy of hyaluronan binding assay and a new fertility index derived from it for measuring of male fertility potential and the efficacy of supplement therapy. Andrologia 47, 519–24 (2015).
52. Buensuceso, A. V et al. Ephrin-A5 is required for optimal fertility and a complete ovulatory response to gonadotropins in the female mouse. Endocrinology en20151216 (2015).
53. Jisa, E. & Jungbauer, A. Kinetic analysis of estrogen receptor homo- and heterodimerization in vitro. J. Steroid Biochem. Mol. Biol. 84, 141–8 (2003).
54. O’Donnell, L., Robertson, K. M., Jones, M. E. & Simpson, E. R. Estrogen and
19
Spermatogenesis 1. Endocr. Rev. 22, 289–318 (2001).
55. Ly-Huynh, J. D. et al. Importin alpha2-interacting proteins with nuclear roles during mammalian spermatogenesis. Biol. Reprod. 85, 1191–202 (2011).
56. Varshney, G. K. et al. CRISPRz: a database of zebrafish validated sgRNAs. Nucleic Acids Res. 44, D822-6 (2015).
57. Menken, J. Age and fertility: How late can you wait? Demography 22, 469–483 (1985).
58. Manolio, T. A. et al. A HapMap harvest of insights into the genetics of common disease. J. Clin. Invest. 118, 1590–1605 (2008).
59. Hindorff, L. A. et al. Potential etiologic and functional implications of genome-wide association loci for human diseases and traits. Proc. Natl. Acad. Sci. 106, 9362–9367 (2009).
60. Fang, W.-L. et al. CREB coactivator CRTC2/TORC2 and its regulator calcineurin crucially mediate follicle-stimulating hormone and transforming growth factor β1 upregulation of steroidogenesis. J. Cell. Physiol. 227, 2430–40 (2012).
61. Okkelman, I. A., Sukaeva, A. Z., Kirukhina, E. V, Korneenko, T. V & Pestov, N. B. Nuclear translocation of lysyl oxidase is promoted by interaction with transcription repressor p66β. Cell Tissue Res. 358, 481–9 (2014).
62. Joshi, N. R. et al. Altered expression of microRNA-451 in eutopic endometrium of baboons (Papio anubis) with endometriosis. Hum. Reprod. 30, 2881–91 (2015).
63. Franklin, R. B. et al. Human ZIP1 is a major zinc uptake transporter for the accumulation of zinc in prostate cells. J. Inorg. Biochem. 96, 435–42 (2003).
64. Lisle, R. S., Anthony, K., Randall, M. A. & Diaz, F. J. Oocyte-cumulus cell interactions regulate free intracellular zinc in mouse oocytes. Reproduction 145, 381–90 (2013).
65. Shan, B. et al. Association of DENND1A gene polymorphisms with polycystic ovary syndrome: a meta-analysis. J. Clin. Res. Pediatr. Endocrinol. (2015).
66. McAllister, J. M. et al. Overexpression of a DENND1A isoform produces a polycystic ovary syndrome theca phenotype. Proc. Natl. Acad. Sci. U. S. A. 111, E1519-27 (2014).
67. Impera, L. et al. A novel fusion 5’AFF3/3’BCL2 originated from a t(2;18)(q11.2;q21.33) translocation in follicular lymphoma. Oncogene 27, 6187–90 (2008).
68. Urano, A. et al. Infertility with defective spermiogenesis in mice lacking AF5q31, the target of chromosomal translocation in human infant leukemia. Mol. Cell. Biol. 25, 6834–45 (2005).
69. Reese, K. L. et al. Acidic hyaluronidase activity is present in mouse sperm and is reduced in the absence of SPAM1: evidence for a role for hyaluronidase 3 in mouse and human sperm. Mol. Reprod. Dev. 77, 759–72 (2010).
70. Heath, E., Sablitzky, F. & Morgan, G. T. Subnuclear targeting of the RNA-binding motif protein RBM6 to splicing speckles and nascent transcripts. Chromosome Res. 18, 851–72 (2010).
71. Kamura, T. et al. Cytoplasmic ubiquitin ligase KPC regulates proteolysis of p27(Kip1) at G1 phase. Nat. Cell Biol. 6, 1229–35 (2004).
72. Kato, J. Y., Matsuoka, M., Polyak, K., Massagué, J. & Sherr, C. J. Cyclic AMP-induced G1 phase arrest mediated by an inhibitor (p27Kip1) of cyclin-dependent kinase 4 activation. Cell 79, 487–96 (1994).
73. O’Bryan, Moira K, Clark, B.J., McLaughlin, E.A., D’Sylva, R.J., O’Donnell, L., Wilce, J.A., Sutherland, J., O’Connor, A.E., Whittle, B., Goodnow, C.C., Ormandy, C.J., Jamsai, D. RBM5 Is a Male Germ Cell Splicing Factor and Is Required for Spermatid Differentiation and Male Fertility. PLoS Genet. 9, e1003628 (2013).
20
74. Bagley, D. C., Paradkar, P. N., Kaplan, J. & Ward, D. M. Mon1a protein acts in trafficking through the secretory apparatus. J. Biol. Chem. 287, 25577–88 (2012).
75. Sakamoto, O. et al. Role of macrophage-stimulating protein and its receptor, RON tyrosine kinase, in ciliary motility. J. Clin. Invest. 99, 701–9 (1997).
76. Buensuceso, A. V et al. Ephrin-A5 is required for optimal fertility and a complete ovulatory response to gonadotropins in the female mouse. Endocrinology en20151216 (2015). doi:10.1210/en.2015-1216
77. Zhang, C. et al. Molecular mechanisms that drive estradiol-dependent burst firing of Kiss1 neurons in the rostral periventricular preoptic area. Am. J. Physiol. Endocrinol. Metab. 305, E1384-97 (2013).
78. Ponglikitmongkol, M., Green, S. & Chambon, P. Genomic organization of the human oestrogen receptor gene. EMBO J. 7, 3385–8 (1988).
79. de Mattos, C. S. et al. ESR1 and ESR2 gene polymorphisms are associated with human reproduction outcomes in Brazilian women. J. Ovarian Res. 7, 114 (2014).
80. Lamp, M. et al. Polymorphisms in ESR1, ESR2 and HSD17B1 genes are associated with fertility status in endometriosis. Gynecol. Endocrinol. 27, 425–33 (2011).
81. O’Donnell, L., Robertson, K. M., Jones, M. E. & Simpson, E. R. Estrogen and spermatogenesis. Endocr. Rev. 22, 289–318 (2001).
82. Chiu, Y.-C. et al. Foxp2 regulates neuronal differentiation and neuronal subtype specification. Dev. Neurobiol. 74, 723–38 (2014).
83. Alves, M. G. et al. Metabolic fingerprints in testicular biopsies from type 1 diabetic patients. Cell Tissue Res. 362, 431–40 (2015).
84. Mojiminiyi, O. A., Safar, F. H., Al Rumaih, H. & Diejomaoh, M. Variations in alanine aminotransferase levels within the normal range predict metabolic and androgenic phenotypes in women of reproductive age. Scand. J. Clin. Lab. Invest. 70, 554–60 (2010).
85. Van Maldergem, L. Baller-Gerold Syndrome. GeneReviews(®) (1993).
86. Ruan, Y., Cheng, M., Ou, Y., Oko, R. & van der Hoorn, F. A. Ornithine decarboxylase antizyme Oaz3 modulates protein phosphatase activity. J. Biol. Chem. 286, 29417–27 (2011).
20
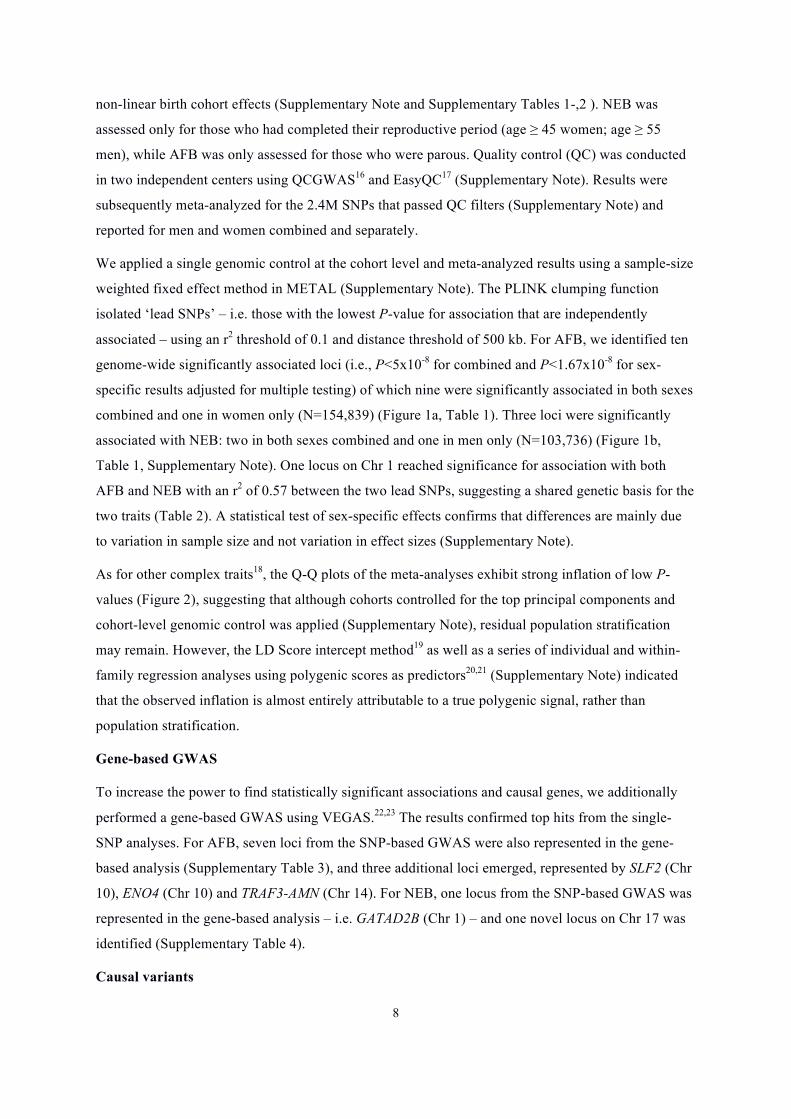
Figure 1. Manhattan plots of SNPs for AFB (age at first birth) and NEB (number of children
ever born) in single genomic control meta-analysis. SNPs are plotted on the x-axis according to
their position on each chromosome against association with AFB (panel a) and NEB (panel b). The
solid blue line indicates the threshold for genome-wide significance (P<5x10-08) and the red line, the
threshold for suggestive hits (P<5x10-06). Blue points indicate SNPs in a ±100 KB region around
genome-wide significant hits. Gene labels are annotated as the nearby genes to the significant SNPs.
Figure 2. Quantile-quantile plots of SNPs for AFB (panel a) and NEB (panel b) in single
genomic control, meta-analysis. The grey shaded areas in the Q-Q plots represent the 95%
confidence bands around the P-values under the null hypothesis.
Figure 3. Genetic overlap between AFB and NEB and other related traits. Results from Linkage-
Disequilibrium (LD) Score regressions: estimates of genetic correlation with developmental,
reproductive, behavioral, neuropsychiatric and anthropometric phenotypes for which GWAS
summary statistics were available in the public domain. The length of the bars indicates the estimates
of genetic correlation. Grey error bars indicate 95% confidence intervals. The mark “*” indicates that
the estimate of genetic correlation is statistically significant after controlling for multiple testing
(P<0.05/27=1.85x10-3).
20
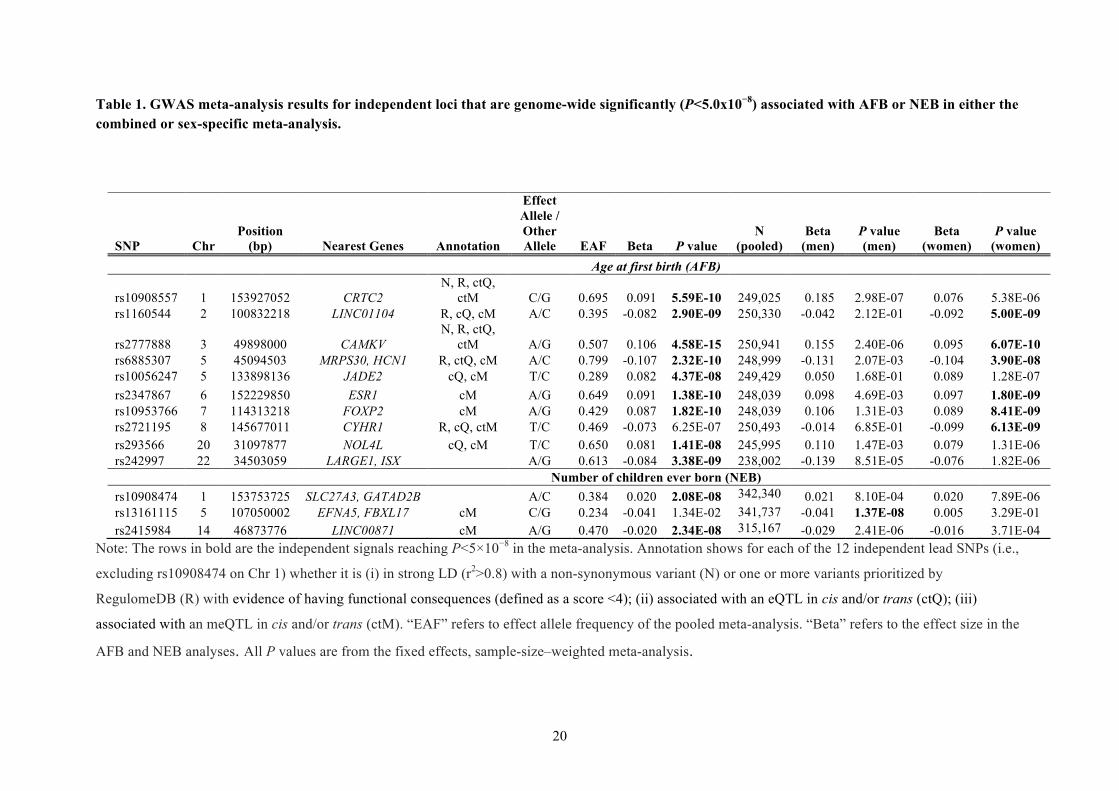
Table 1. GWAS meta-analysis results for independent loci that are genome-wide significantly (P<5.0x10⁻⁸) associated with AFB or NEB in either the combined or sex-specific meta-analysis.
Note: The rows in bold are the independent signals reaching P<5×10⁻⁸ in the meta-analysis. Annotation shows for each of the 12 independent lead SNPs (i.e.,
excluding rs10908474 on Chr 1) whether it is (i) in strong LD (r2>0.8) with a non-synonymous variant (N) or one or more variants prioritized by
RegulomeDB (R) with evidence of having functional consequences (defined as a score <4); (ii) associated with an eQTL in cis and/or trans (ctQ); (iii)
associated with an meQTL in cis and/or trans (ctM). “EAF” refers to effect allele frequency of the pooled meta-analysis. “Beta” refers to the effect size in the
AFB and NEB analyses. All P values are from the fixed effects, sample-size–weighted meta-analysis.
SNP Chr Position
(bp) Nearest Genes Annotation
Effect Allele / Other Allele EAF Beta P value
N (pooled)
Beta (men)
P value (men)
Beta (women)
P value (women)
Age at first birth (AFB)
rs10908557 1 153927052 CRTC2 N, R, ctQ,
ctM C/G 0.695 0.091 5.59E-10 249,025 0.185 2.98E-07 0.076 5.38E-06 rs1160544 2 100832218 LINC01104 R, cQ, cM A/C 0.395 -0.082 2.90E-09 250,330 -0.042 2.12E-01 -0.092 5.00E-09
rs2777888 3 49898000 CAMKV N, R, ctQ,
ctM A/G 0.507 0.106 4.58E-15 250,941 0.155 2.40E-06 0.095 6.07E-10 rs6885307 5 45094503 MRPS30, HCN1 R, ctQ, cM A/C 0.799 -0.107 2.32E-10 248,999 -0.131 2.07E-03 -0.104 3.90E-08 rs10056247 5 133898136 JADE2 cQ, cM T/C 0.289 0.082 4.37E-08 249,429 0.050 1.68E-01 0.089 1.28E-07 rs2347867 6 152229850 ESR1 cM A/G 0.649 0.091 1.38E-10 248,039 0.098 4.69E-03 0.097 1.80E-09 rs10953766 7 114313218 FOXP2 cM A/G 0.429 0.087 1.82E-10 248,039 0.106 1.31E-03 0.089 8.41E-09 rs2721195 8 145677011 CYHR1 R, cQ, ctM T/C 0.469 -0.073 6.25E-07 250,493 -0.014 6.85E-01 -0.099 6.13E-09 rs293566 20 31097877 NOL4L cQ, cM T/C 0.650 0.081 1.41E-08 245,995 0.110 1.47E-03 0.079 1.31E-06 rs242997 22 34503059 LARGE1, ISX A/G 0.613 -0.084 3.38E-09 238,002 -0.139 8.51E-05 -0.076 1.82E-06 Number of children ever born (NEB) rs10908474 1 153753725 SLC27A3, GATAD2B A/C 0.384 0.020 2.08E-08 342,340 0.021 8.10E-04 0.020 7.89E-06 rs13161115 5 107050002 EFNA5, FBXL17 cM C/G 0.234 -0.041 1.34E-02 341,737 -0.041 1.37E-08 0.005 3.29E-01 rs2415984 14 46873776 LINC00871 cM A/G 0.470 -0.020 2.34E-08 315,167 -0.029 2.41E-06 -0.016 3.71E-04
21
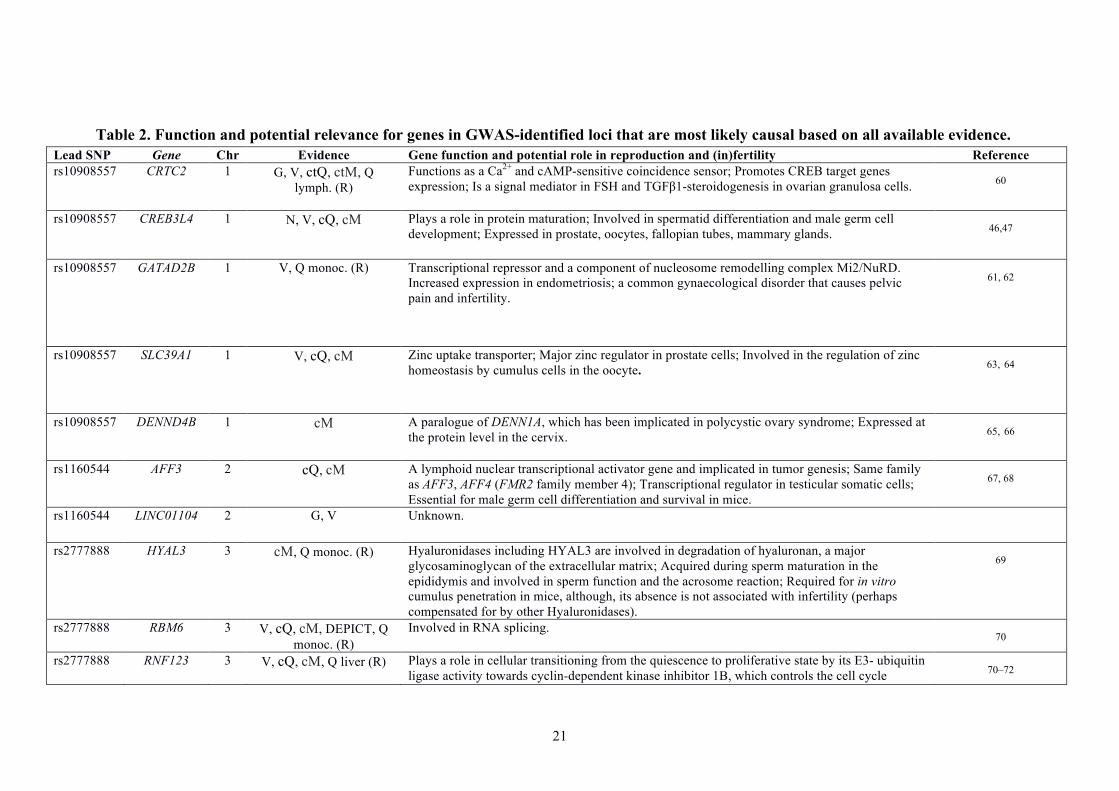
Table 2. Function and potential relevance for genes in GWAS-identified loci that are most likely causal based on all available evidence. Lead SNP Gene Chr Evidence Gene function and potential role in reproduction and (in)fertility Reference rs10908557 CRTC2 1 G, V, ctQ, ctM, Q
lymph. (R) Functions as a Ca2+ and cAMP-sensitive coincidence sensor; Promotes CREB target genes expression; Is a signal mediator in FSH and TGFβ1-steroidogenesis in ovarian granulosa cells.
60
rs10908557 CREB3L4 1 N, V, cQ, cM Plays a role in protein maturation; Involved in spermatid differentiation and male germ cell development; Expressed in prostate, oocytes, fallopian tubes, mammary glands. 46,47
rs10908557 GATAD2B 1 V, Q monoc. (R) Transcriptional repressor and a component of nucleosome remodelling complex Mi2/NuRD.
Increased expression in endometriosis; a common gynaecological disorder that causes pelvic pain and infertility.
61, 62
rs10908557
SLC39A1 1 V, cQ, cM Zinc uptake transporter; Major zinc regulator in prostate cells; Involved in the regulation of zinc homeostasis by cumulus cells in the oocyte. 63, 64
rs10908557
DENND4B 1 cM A paralogue of DENN1A, which has been implicated in polycystic ovary syndrome; Expressed at the protein level in the cervix. 65, 66
rs1160544 AFF3 2 cQ, cM A lymphoid nuclear transcriptional activator gene and implicated in tumor genesis; Same family as AFF3, AFF4 (FMR2 family member 4); Transcriptional regulator in testicular somatic cells; Essential for male germ cell differentiation and survival in mice.
67, 68
rs1160544 LINC01104 2 G, V Unknown.
rs2777888 HYAL3 3 cM, Q monoc. (R) Hyaluronidases including HYAL3 are involved in degradation of hyaluronan, a major glycosaminoglycan of the extracellular matrix; Acquired during sperm maturation in the epididymis and involved in sperm function and the acrosome reaction; Required for in vitro cumulus penetration in mice, although, its absence is not associated with infertility (perhaps compensated for by other Hyaluronidases).
69
rs2777888 RBM6 3 V, cQ, cM, DEPICT, Q monoc. (R)
Involved in RNA splicing. 70
rs2777888 RNF123 3 V, cQ, cM, Q liver (R) Plays a role in cellular transitioning from the quiescence to proliferative state by its E3- ubiquitin ligase activity towards cyclin-dependent kinase inhibitor 1B, which controls the cell cycle 70–72
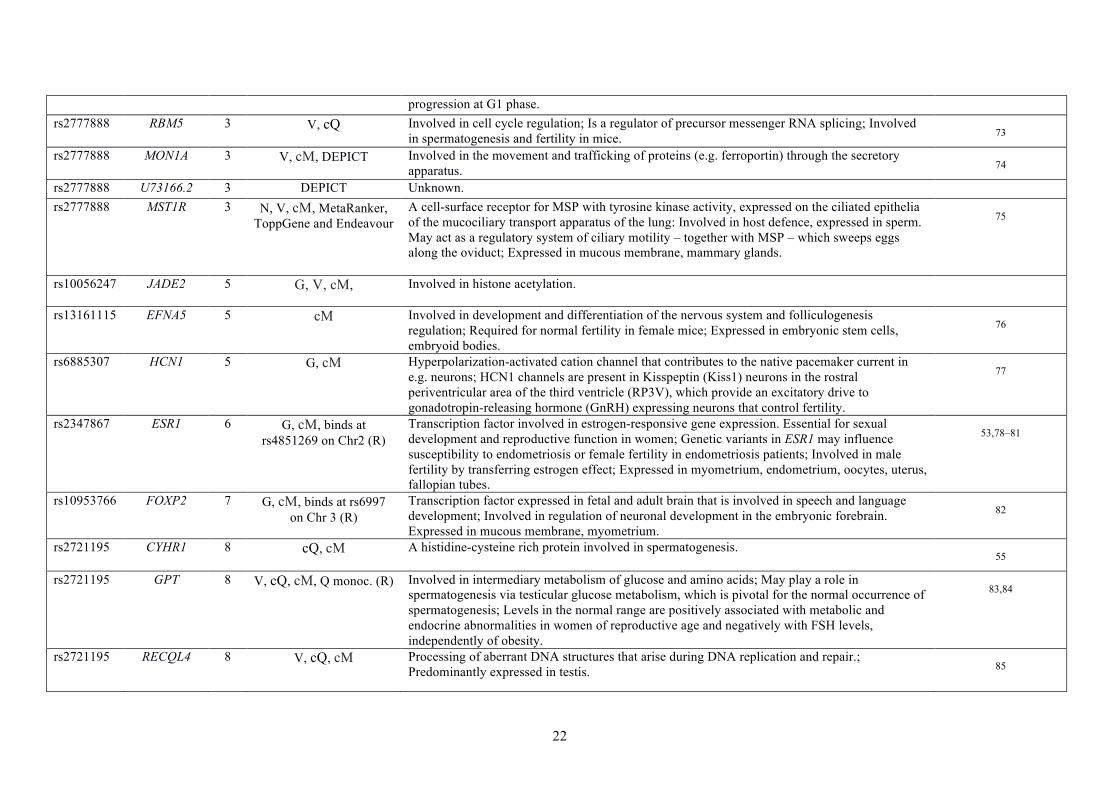
22
progression at G1 phase. rs2777888 RBM5 3 V, cQ Involved in cell cycle regulation; Is a regulator of precursor messenger RNA splicing; Involved
in spermatogenesis and fertility in mice. 73 rs2777888 MON1A 3 V, cM, DEPICT Involved in the movement and trafficking of proteins (e.g. ferroportin) through the secretory
apparatus. 74 rs2777888 U73166.2 3 DEPICT Unknown. rs2777888 MST1R 3 N, V, cM, MetaRanker,
ToppGene and Endeavour A cell-surface receptor for MSP with tyrosine kinase activity, expressed on the ciliated epithelia of the mucociliary transport apparatus of the lung: Involved in host defence, expressed in sperm. May act as a regulatory system of ciliary motility – together with MSP – which sweeps eggs along the oviduct; Expressed in mucous membrane, mammary glands.
75
rs10056247 JADE2 5 G, V, cM, Involved in histone acetylation.
rs13161115 EFNA5 5 cM Involved in development and differentiation of the nervous system and folliculogenesis regulation; Required for normal fertility in female mice; Expressed in embryonic stem cells, embryoid bodies.
76
rs6885307 HCN1 5 G, cM Hyperpolarization-activated cation channel that contributes to the native pacemaker current in e.g. neurons; HCN1 channels are present in Kisspeptin (Kiss1) neurons in the rostral periventricular area of the third ventricle (RP3V), which provide an excitatory drive to gonadotropin-releasing hormone (GnRH) expressing neurons that control fertility.
77
rs2347867 ESR1 6 G, cM, binds at rs4851269 on Chr2 (R)
Transcription factor involved in estrogen-responsive gene expression. Essential for sexual development and reproductive function in women; Genetic variants in ESR1 may influence susceptibility to endometriosis or female fertility in endometriosis patients; Involved in male fertility by transferring estrogen effect; Expressed in myometrium, endometrium, oocytes, uterus, fallopian tubes.
53,78–81
rs10953766 FOXP2 7 G, cM, binds at rs6997 on Chr 3 (R)
Transcription factor expressed in fetal and adult brain that is involved in speech and language development; Involved in regulation of neuronal development in the embryonic forebrain. Expressed in mucous membrane, myometrium.
82
rs2721195 CYHR1 8 cQ, cM A histidine-cysteine rich protein involved in spermatogenesis. 55
rs2721195 GPT 8 V, cQ, cM, Q monoc. (R) Involved in intermediary metabolism of glucose and amino acids; May play a role in spermatogenesis via testicular glucose metabolism, which is pivotal for the normal occurrence of spermatogenesis; Levels in the normal range are positively associated with metabolic and endocrine abnormalities in women of reproductive age and negatively with FSH levels, independently of obesity.
83,84
rs2721195 RECQL4 8 V, cQ, cM Processing of aberrant DNA structures that arise during DNA replication and repair.; Predominantly expressed in testis. 85
23
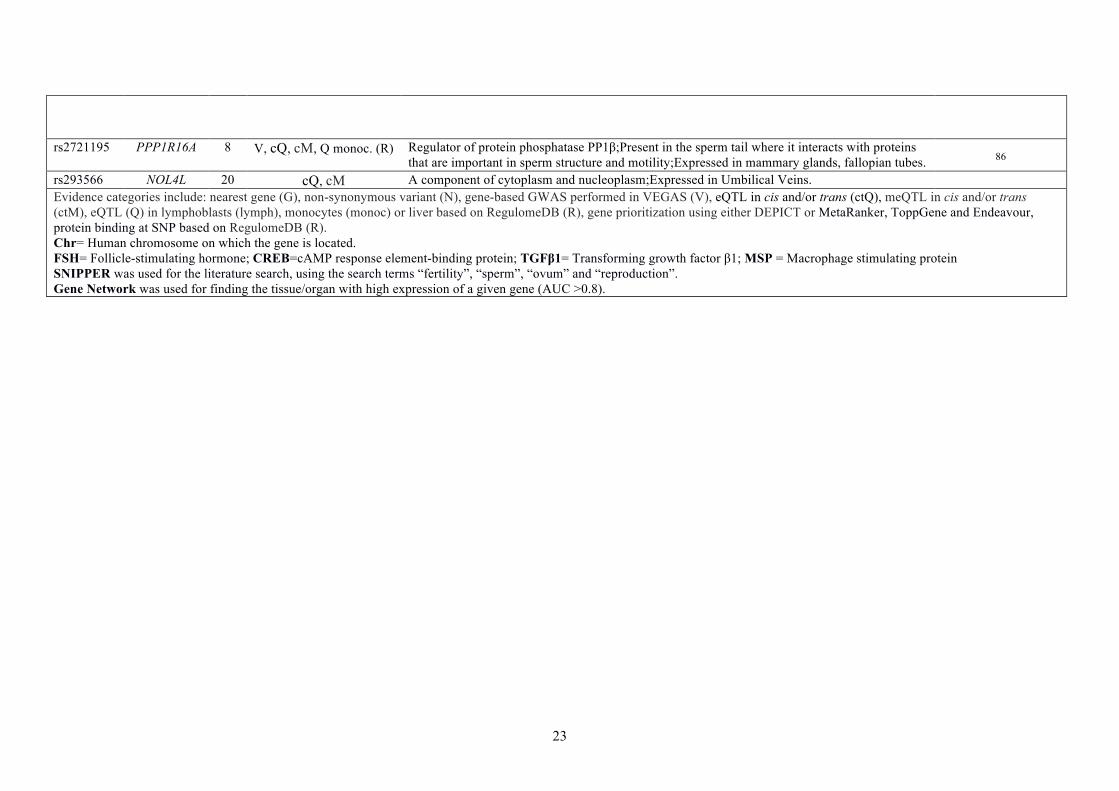
rs2721195 PPP1R16A 8 V, cQ, cM, Q monoc. (R) Regulator of protein phosphatase PP1β;Present in the sperm tail where it interacts with proteins that are important in sperm structure and motility;Expressed in mammary glands, fallopian tubes. 86
rs293566 NOL4L 20 cQ, cM A component of cytoplasm and nucleoplasm;Expressed in Umbilical Veins. Evidence categories include: nearest gene (G), non-synonymous variant (N), gene-based GWAS performed in VEGAS (V), eQTL in cis and/or trans (ctQ), meQTL in cis and/or trans (ctM), eQTL (Q) in lymphoblasts (lymph), monocytes (monoc) or liver based on RegulomeDB (R), gene prioritization using either DEPICT or MetaRanker, ToppGene and Endeavour, protein binding at SNP based on RegulomeDB (R). Chr= Human chromosome on which the gene is located. FSH= Follicle-stimulating hormone; CREB=cAMP response element-binding protein; TGFβ1= Transforming growth factor β1; MSP = Macrophage stimulating protein SNIPPER was used for the literature search, using the search terms “fertility”, “sperm”, “ovum” and “reproduction”. Gene Network was used for finding the tissue/organ with high expression of a given gene (AUC >0.8).
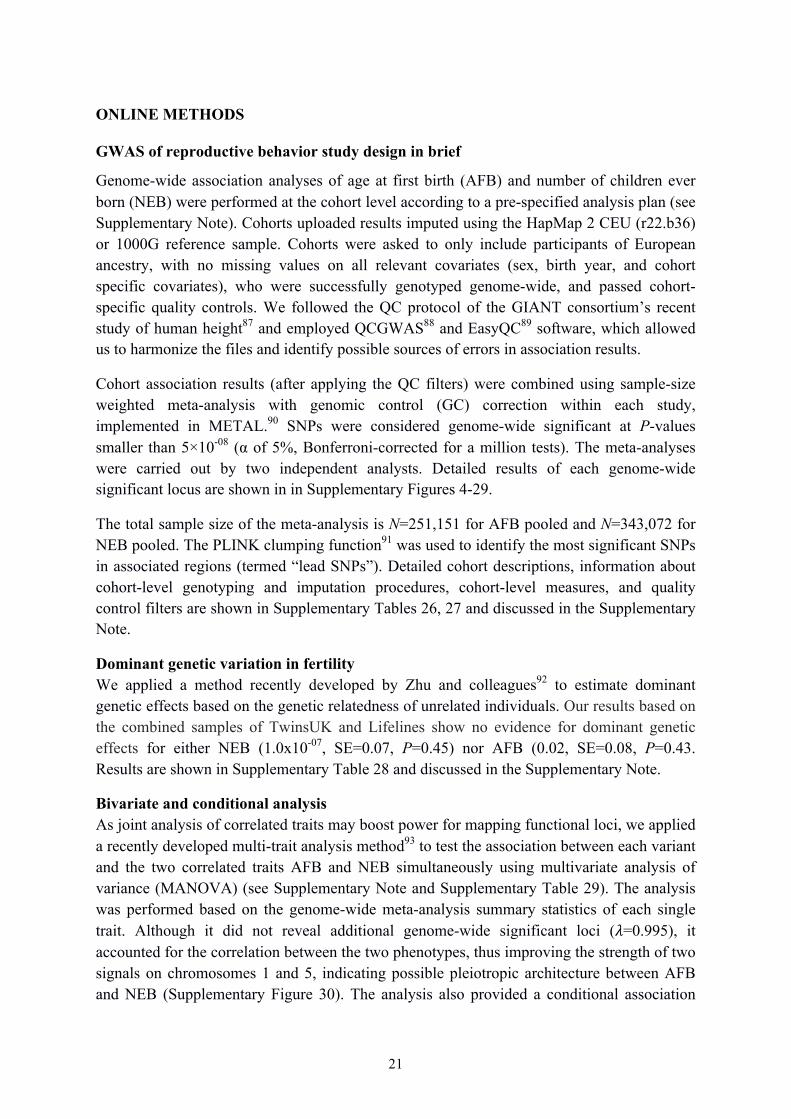
21
ONLINE METHODS
GWAS of reproductive behavior study design in brief
Genome-wide association analyses of age at first birth (AFB) and number of children ever born (NEB) were performed at the cohort level according to a pre-specified analysis plan (see Supplementary Note). Cohorts uploaded results imputed using the HapMap 2 CEU (r22.b36) or 1000G reference sample. Cohorts were asked to only include participants of European ancestry, with no missing values on all relevant covariates (sex, birth year, and cohort specific covariates), who were successfully genotyped genome-wide, and passed cohort-specific quality controls. We followed the QC protocol of the GIANT consortium’s recent study of human height87 and employed QCGWAS88 and EasyQC89 software, which allowed us to harmonize the files and identify possible sources of errors in association results.
Cohort association results (after applying the QC filters) were combined using sample-size weighted meta-analysis with genomic control (GC) correction within each study, implemented in METAL.90 SNPs were considered genome-wide significant at P-values smaller than 5×10-08 (α of 5%, Bonferroni-corrected for a million tests). The meta-analyses were carried out by two independent analysts. Detailed results of each genome-wide significant locus are shown in in Supplementary Figures 4-29.
The total sample size of the meta-analysis is N=251,151 for AFB pooled and N=343,072 for NEB pooled. The PLINK clumping function91 was used to identify the most significant SNPs in associated regions (termed “lead SNPs”). Detailed cohort descriptions, information about cohort-level genotyping and imputation procedures, cohort-level measures, and quality control filters are shown in Supplementary Tables 26, 27 and discussed in the Supplementary Note.
Dominant genetic variation in fertility We applied a method recently developed by Zhu and colleagues92 to estimate dominant genetic effects based on the genetic relatedness of unrelated individuals. Our results based on the combined samples of TwinsUK and Lifelines show no evidence for dominant genetic effects for either NEB (1.0x10-07, SE=0.07, P=0.45) nor AFB (0.02, SE=0.08, P=0.43. Results are shown in Supplementary Table 28 and discussed in the Supplementary Note.
Bivariate and conditional analysis As joint analysis of correlated traits may boost power for mapping functional loci, we applied a recently developed multi-trait analysis method93 to test the association between each variant and the two correlated traits AFB and NEB simultaneously using multivariate analysis of variance (MANOVA) (see Supplementary Note and Supplementary Table 29). The analysis was performed based on the genome-wide meta-analysis summary statistics of each single trait. Although it did not reveal additional genome-wide significant loci (!=0.995), it accounted for the correlation between the two phenotypes, thus improving the strength of two signals on chromosomes 1 and 5, indicating possible pleiotropic architecture between AFB and NEB (Supplementary Figure 30). The analysis also provided a conditional association
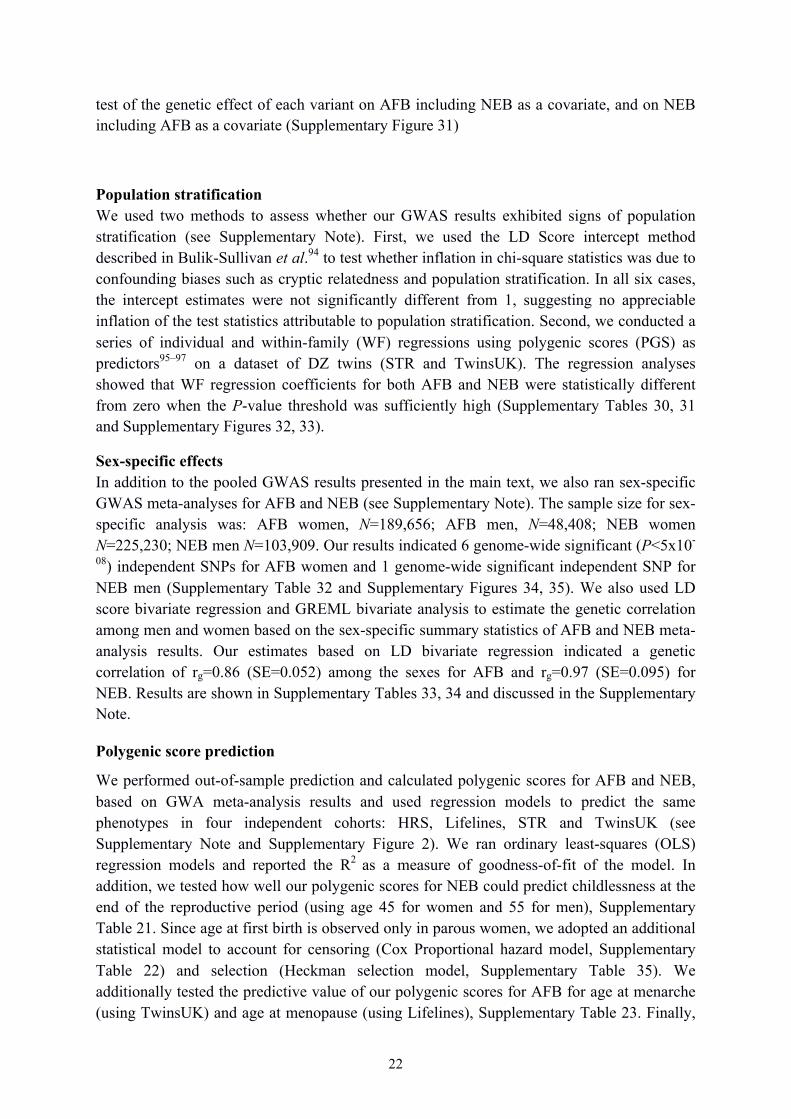
22
test of the genetic effect of each variant on AFB including NEB as a covariate, and on NEB including AFB as a covariate (Supplementary Figure 31)
Population stratification We used two methods to assess whether our GWAS results exhibited signs of population stratification (see Supplementary Note). First, we used the LD Score intercept method described in Bulik-Sullivan et al.94 to test whether inflation in chi-square statistics was due to confounding biases such as cryptic relatedness and population stratification. In all six cases, the intercept estimates were not significantly different from 1, suggesting no appreciable inflation of the test statistics attributable to population stratification. Second, we conducted a series of individual and within-family (WF) regressions using polygenic scores (PGS) as predictors95–97 on a dataset of DZ twins (STR and TwinsUK). The regression analyses showed that WF regression coefficients for both AFB and NEB were statistically different from zero when the P-value threshold was sufficiently high (Supplementary Tables 30, 31 and Supplementary Figures 32, 33).
Sex-specific effects In addition to the pooled GWAS results presented in the main text, we also ran sex-specific GWAS meta-analyses for AFB and NEB (see Supplementary Note). The sample size for sex-specific analysis was: AFB women, N=189,656; AFB men, N=48,408; NEB women N=225,230; NEB men N=103,909. Our results indicated 6 genome-wide significant (P<5x10-
08) independent SNPs for AFB women and 1 genome-wide significant independent SNP for NEB men (Supplementary Table 32 and Supplementary Figures 34, 35). We also used LD score bivariate regression and GREML bivariate analysis to estimate the genetic correlation among men and women based on the sex-specific summary statistics of AFB and NEB meta-analysis results. Our estimates based on LD bivariate regression indicated a genetic correlation of rg=0.86 (SE=0.052) among the sexes for AFB and rg=0.97 (SE=0.095) for NEB. Results are shown in Supplementary Tables 33, 34 and discussed in the Supplementary Note.
Polygenic score prediction
We performed out-of-sample prediction and calculated polygenic scores for AFB and NEB, based on GWA meta-analysis results and used regression models to predict the same phenotypes in four independent cohorts: HRS, Lifelines, STR and TwinsUK (see Supplementary Note and Supplementary Figure 2). We ran ordinary least-squares (OLS) regression models and reported the R2 as a measure of goodness-of-fit of the model. In addition, we tested how well our polygenic scores for NEB could predict childlessness at the end of the reproductive period (using age 45 for women and 55 for men), Supplementary Table 21. Since age at first birth is observed only in parous women, we adopted an additional statistical model to account for censoring (Cox Proportional hazard model, Supplementary Table 22) and selection (Heckman selection model, Supplementary Table 35). We additionally tested the predictive value of our polygenic scores for AFB for age at menarche (using TwinsUK) and age at menopause (using Lifelines), Supplementary Table 23. Finally,
23
we examined whether menopause variants are associated with AFB. We calculated a PGS of age at menopause based on the recent GWAS results from Day et al. (2015)98 and applied them to LifeLines and TwinsUK (Supplementary Table 36).
Genetic correlations
We used information from 27 publicly-available GWAS results to estimate the amount of genetic correlations between AFB and NEB and related traits (Supplementary Table 25 and Figure 3 in the main text) using LD score bivariate regression (see Supplementary Note). Details on these phenotypes are provided in the Supplementary Note. A conservative Bonferroni-corrected P-value threshold of P<1.85×10−03 (=0.05/27) was used to define significant associations. We also tested the correlation between NEB and AFB using a bivariate GREML analysis on the Women’s General Health Study (WGHS, N=40,621).
Lookups and proxy phenotype
Following the results on genetic overlap with other phenotypes we tested – in a quasi-phenotype replication setting – whether the SNPs strongly associated with AFB in women were empirically plausible candidate SNPs for age at menarche and age at menopause (see Supplementary Note). We used a two-stage approach applied in other contexts.99,100 In the first stage, we conducted a meta-analysis of AFB excluding the cohorts that were part of the meta-analysis of the phenotype we intended to replicate. We merged the SNPs from this meta-analysis with the publically available association results of the most recent GWAS on age at menarche2 and age at menopause101 from the Reprogen consortium website.1 SNPs that were not present in both files were dropped from the analysis. We aligned the alleles and the direction of effects using the EasyStrata software.102 We then selected the independent SNPs with a P-value<1x10-05, using the clump procedure in PLINK91, (1000Kb window and LD threshold of R2>0.1) to identify the most significant SNPs in associated regions included in both files. We defined “prioritized SNP associations” as those that passed the Bonferroni correction for the number of SNPs tested (0.05/122=4.10x10-04, both in age at menarche and age at menopause). Our results identified three SNPs after Bonferroni-correction that can be used as good candidates for age at menarche. We did not isolate any clear “candidate SNP” for age at menopause (Supplementary Figure 36).
Gene-based GWAS analysis
We performed gene-based testing with the full GWAS set (~2.5M HapMap-imputed SNPs) of both phenotypes using VEGAS (see Supplementary Note and Supplementary Tables 3,4).23,103 This software has the advantage of accounting for LD structure and the possibility to define a range beyond the gene bounds to include intergenic regions in the analysis. We defined a 50kb extra window surrounding the genes and considered every SNP for the gene-based analysis, ran the analyses per chromosome with up to 1006 permutations and considered P<2.5x10-06 as the threshold for significance (0.05/~20.000 genes).
1Data downloaded in November 2015
24
eQTL and meQTL analysis
For each of the 12 SNPs identified in the GWAS, local (cis, exons/methylation sites < 1 MB from the SNP) and genome-wide (trans, exons/methylation sites > 5 MB from the SNP) effects were identified by computing Spearman rank correlations between SNPs and local or global exons/methylation sites (see Supplementary Note). Bonferroni multiple testing correction was performed for the 12 SNPs tested (P<2.5x10-06 for cis meQTL analysis, P<1x10-08 for trans meQTL analysis, P<1.2 x10-06 for cis eQTL analysis, P<1.3x10-08 for trans eQTL analysis). For each of the significant associations, the exons/methylation sites were selected, the strongest eQTLs were identified for these exons/methylation sites, and LD between the strongest eQTLs and the corresponding SNP identified in the GWAS were computed. LD was computed using BIOS genotypes (the genotypes used for eQTL and meQTL mapping).
Functional variant analysis using RegulomeDB
We used RegulomeDB27 to identify variants amongst the 322 SNPs that reached P<5x10-08 for association with AFB and/or NEB in the meta-analysis of GWAS that likely influenced regulation of gene expression (see Supplementary Note). RegulomeDB integrates results from RoadMap Epigenomics26 and the ENCODE project.104 SNPs showing the most evidence of being functional – defined as a RegulomeDB score <4 – were subsequently examined in more detail in terms of effects on gene expression (eQTLs) and their protein-binding capacity (Supplementary Table 6).
Gene prioritization
Potentially causal genes for the associations identified by GWAS were identified using four previously described bioinformatics tools: ToppGene4, Endeavour5, MetaRanker6, and DEPICT7. To this end, we first retrieved positional coordinates for all lead SNPs according to GRCh37/hg19 using Ensembl’s BioMart. These coordinates were used to extract all genes located within ±40kb of lead SNPs using the UCSC table browser. The identified genes then served as input for ToppGene and Endeavour. Genes with established roles in fertility served as training genes in this procedure, i.e. BRCA1, EGFR, ERBB2-4, HSD17B1, RBM5, ESR1, ESR2 and FSHB. For MetaRanker we provided SNPs that reached P<5x10-04 and their chromosomal position as input, together with the previously mentioned set of training genes. Since ToppGene, Endeavour and MetaRanker are biased towards larger and well-described genes, we also performed a gene prioritization procedure using DEPICT.7 All SNPs that reached P<5x10-04 in the meta-analysis served as input, and information on prioritized genes, gene set enrichment, and tissue/cell type enrichment were extracted. Genes were subsequently prioritized that: 1) reached P<0.05 in DEPICT; or 2) reached P<0.05 in ToppGene, Endeavour and MetaRanker (Supplementary Table 37).
Functional network and enrichment analysis
DEPICT was used to identify gene set, cell type and tissue enrichment analyses, using the GWAS-identified SNPs with P<5x10-04 as input (see Supplementary Note). Due to the relatively small number of identified loci, DEPICT was only able to perform these analyses
25
for AFB and NEB pooled, and AFB women. To construct a functional association network, we combined five prioritized candidate gene sets into a single query gene set which was then used as input for the functional network analysis.24 We applied the GeneMANIA algorithm together with its large set of accompanying functional association data.105 We used the Cytoscape software platform,106 extended by the GeneMANIA plugin (Data Version: 8/12/2014, accessed April 24, 2016).107 All the genes in the composite network, either from the query or the resulting gene sets, were then used for functional enrichment analysis against Gene Ontology terms (GO terms)108 to identify the most relevant GO terms using the same plugin.107
Gene-environment interactions
Previous research based on twin studies shows differential heritability of fertility behavior across birth cohorts.109,110 We used the Swedish Twin Register (STR) to examine whether the effect of a polygenic score (PGS) of AFB and NEB varies across birth cohort. We followed the analysis presented in the recent GWAS of education111 and divide the sample into six groups based on their year of birth. Each group spans five birth years, with the oldest ranging from 1929-1933 and the youngest born between 1954-1958. Supplementary Table 38 reports the estimated coefficient from these regressions. The results indicate a U-shaped trend in AFB and a linear decline in NEB, but do not provide any clear evidence of interaction effects between the PGS’s and birth cohort. We additionally tested the interaction effects between educational level and the PGS of AFB and NEB in three different samples (LifeLines, STR and HRS). Supplementary Table 39 reports the estimated coefficient from these regressions. The results indicate that years of education are positively associated with AFB in both LifeLines and STR, and negatively associated with NEB in the HRS. With the exception of NEB in the HRS, we found no evidence of GxE effects with education.
Robustness checks
To estimate the robustness of our results for AFB, we conducted two additional analyses. First, we estimated how the coefficients change if we control for Educational Attainment (EA). Using data from deCODE, we ran an additional association analysis using the 10 loci that were genome-wide significant in the meta-analysis (P<5x10-08). The analysis has been restricted to individuals born between 1910 and 1975, who also had data available on completed education. The total sample size is 42,187 (17,996 males and 24,191 females). The analysis is adjusted for sex, year of birth (linear, squared and cubic), interaction between sex and year of birth and the first 10 PCAs. Education is measured by years of education, ranging between 10 and 20 years. Supplementary Table 40 reports the association results before and after adjusting for educational attainment. Our analysis shows that the effect sizes shrink after including educational attainment as a covariate, with an average reduction of around 15%. We also estimated the effect of a polygenic risk score of AFB calculated from meta-analysis data excluding the deCODE cohort. The polygenic score remains highly significant. The effect of 1SD of the AFB score decreases from 0.19 years (69 days) without controlling for education to 0.16 years (59 days) when we control for years of education. Second, we estimated how the coefficients change after controlling for Education Attainment (EA) and
26
Age at First Sex using the UKBiobank (N=50,954). We ran two association models: the first follows the GWAS analysis plan with no additional covariates and the second added years of education and age at first sexual intercourse as covariates. The results are presented in Supplementary Table 41 and Supplementary Figure 37. Our analysis shows that the effect sizes of our top hits are highly concordant (R2=0.94). The inclusion of EA and AFS as covariates weakens the effect sizes on average by 40% and increases the P-value of the estimated coefficients. Overall, we interpret this additional analysis as a robustness test that confirm that the top hits from our meta-analysis are robust to the inclusion of the confounding factors of EA and AFS.
Positive selection
We performed a Haploplotter analysis112 to examine if lead SNPs and/or functional variants identified using RegulomeDB show evidence of positive selection. Three variants showed standardized integrated haplotype scores <-2 or >2, indicating that these variants represent the top 5% of signals in the population. These SNPs are: 1) rs7628058 on chromosome 3 for AFB, an eQTLs for RBM6 in monocytes; 2) rs2247510 on chromosome 3 for AFB, an eQTL for RBM6 and HYAL3 in monocytes and binding site for a range of transcription factors; 3) rs2415984, the lead SNP in the chromosome 14 locus for NEB. Results are presented in Supplementary Table 42.
Methods-only references
87. Wood, A. R. et al. Defining the role of common variation in the genomic and biological architecture of adult human height. Nat. Genet. 46, 1173–1186 (2014).
88. van der Most, P. J. et al. QCGWAS: A flexible R package for automated quality control of genome-wide association results. Bioinformatics 30, 1185–1186 (2014).
89. Winkler, T. W. et al. Quality control and conduct of genome-wide association meta-analyses. Nat. Protoc. 9, 1192–1212 (2014).
90. Willer, C. J., Li, Y. & Abecasis, G. R. METAL: Fast and efficient meta-analysis of genomewide association scans. Bioinformatics 26, 2190–2191 (2010).
91. Purcell, S. et al. PLINK: a tool set for whole-genome association and population-based linkage analyses. Am. J. Hum. Genet. 81, 559–575 (2007).
92. Zhu, Z. et al. Dominance genetic variation contributes little to the missing heritability for human complex traits. Am. J. Hum. Genet. 96, 377–385. (2015).
93. Shen, X. et al. Simple multi-trait analysis identifies novel loci associated with growth and obesity measures. bioRxiv (Cold Spring Harbor Labs Journals, 2015).
94. Bulik-Sullivan, B. K. et al. LD Score regression distinguishes confounding from polygenicity in genome-wide association studies. Nat. Genet. 47, 291–295 (2015).
95. Wood, A. R. et al. Defining the role of common variation in the genomic and biological architecture of adult human height. Nat. Genet. (2014).
96. Purcell, S. M. et al. Common polygenic variation contributes to risk of schizophrenia and bipolar disorder. Nature 748–752 (2009).
97. Rietveld, C. A. et al. Common genetic variants associated with cognitive performance identified using the proxy-phenotype method. Proc. Natl. Acad. Sci. 111, 13790–13794 (2014).
98. Day, F., Ruth, K. & Thompson, D. Large-scale genomic analyses link reproductive
27
aging to hypothalamic signaling, breast cancer susceptibility and BRCA1-mediated DNA repair. Nat. Genet. 47, 1294–1303 (2015).
99. Rietveld, C. A. et al. Common genetic variants associated with cognitive performance identified using the proxy-phenotype method. Proc Natl Acad Sci US A 111, 13790–13794 (2014).
100. Okbay, A. et al. Genetic variants associated with subjective well-being, depressive symptoms, and neuroticism identified through genome-wide analyses. Nat. Genet. 48, 624–633 (2016).
101. Day, F. R. et al. Large-scale genomic analyses link reproductive aging to hypothalamic signaling, breast cancer susceptibility and BRCA1-mediated DNA repair. Nat. Genet. 47, 1294–1303 (2015).
102. Winkler, T. W. et al. EasyStrata: evaluation and visualization of stratified genome-wide association meta-analysis data. Bioinformatics 31, 259–261 (2014).
103. Liu, J. Z. et al. A versatile gene-based test for genome-wide association studies. Am. J. Hum. Genet. 87, 139–45 (2010).
104. Encode Consortium. An integrated encyclopedia of DNA elements in the human genome. Nature 489, 57–74 (2013).
105. Mostafavi, S., Ray, D., Warde-Farley, D., Grouios, C. & Morris, Q. GeneMANIA: a real-time multiple association network integration algorithm for predicting gene function. Genome Biol. 9, S4 (2008).
106. Saito, R. et al. A travel guide to Cytoscape plugins. Nat. Methods 9, 1069–1076 (2012).
107. Montojo, J. et al. GeneMANIA Cytoscape plugin: fast gene function predictions on the desktop. Bioinformatics 26, 2927–2928 (2010).
108. Ashburner, M. et al. Gene Ontology: tool for the unification of biology. Nat. Genet. 25, 25–29 (2000).
109. Kohler, H.-P., Rodgers, J. L. & Christensen, K. Is Fertility Behavior in Our Genes? Findings from a Danish Twin Study. Popul. Dev. Rev. 25, 253–288 (1999).
110. Tropf, F. C., Barban, N., Mills, M. C., Snieder, H. & Mandemakers, J. J. Genetic influence on age at first birth of female twins born in the UK, 1919--68. Popul. Stud. (NY). 69, 129–145 (2015).
111. Okbay, A. et al. Genome-wide association study identifies 74 loci associated with educational attainment. Nature 1467–1471 (2016). doi:10.1038/nature17671
112. Voight, B. F., Kudaravalli, S., Wen, X. & Pritchard, J. K. A Map of Recent Positive Selection in the Human Genome. PLoS Biol. 4, e72 (2006).