Barbados Transport Board - Barbados Underground | Bringing ...
Upload
barry-blenmanCategory
view
223download
1description

First Half Report 2012
Overview
Following the performance of the 1st Quarter, trading activity continued to be characterized by
decreases in both the total trading volume and total trading value, as illustrated in Table 1, when
compared to the corresponding period in 2011. Total trading volume decreased by 70% and total trading
value decreased by 92%. There was one (1) extra-ordinary transaction, pursuant to a take-over, which
brought to a close AMCL Holdings Limited bid for all issued and outstanding shares in ANSA McAL
(Barbados) Limited, compared to fourteen (14) extra-ordinary transactions in the corresponding period
for 2011. The Odd-Lot Market was the only market to record any improvement in activity and there was
no trading on the Block Trade Market.
The exclusion of the extra-ordinary transactions, however, paints a much more realistic picture of
market activity. Less the extra-ordinary transactions which occurred in both the first half of 2012 and
2011, total trading volume would have increased by 10% while total trading value would have fallen by
14%. These figures are in line with general market conditions as share prices have fallen thus giving
persons an excellent opportunity to purchase stock in lucrative companies at discounted prices. Falling
share prices have also given these persons the opportunity to purchase more stock with the same level
of investment thus resulting in an increase in the trading volumes.
Table 1 - Total Trading Activity - 1st
Half 2012
Market June June June June % Change % Change
2012 Volume 2011 Volume 2012 Value 2011 Value Volume Value
REGULAR 3,660,142 12,316,659 $ 18,201,636 $ 225,678,597 -70% -92%
ODD-LOT 110,448 86,445 $ 483,971 $ 416,668 28% 16%
PUT - THROUGH 72,415 178,056 $ 431,099 $ 915,939 -59% -53%
JUNIOR 2,000 3,200 $ 20,925 $ 34,400 -38% -39%
BLOCK TRADE - - $ - $ - NA NA
TOTAL 3,845,005 12,584,360 $ 19,137,631 $ 227,045,604 -69% -92%
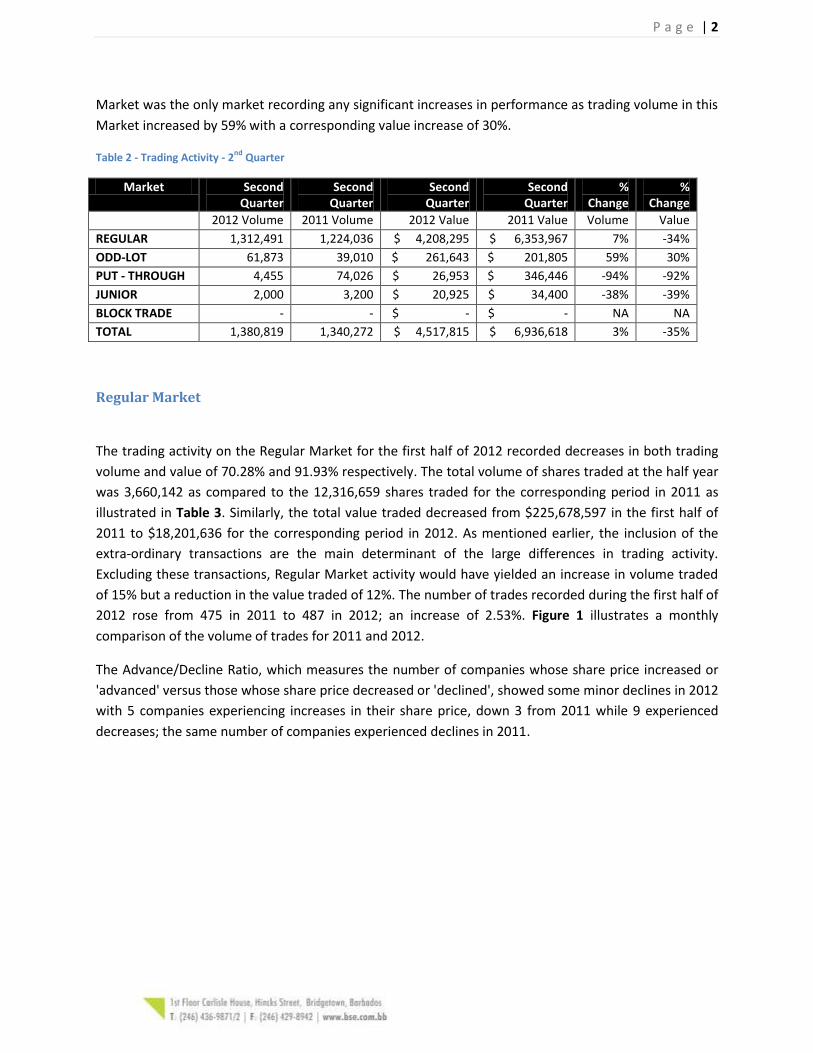
Second quarter 2012 market performance showed some improvements even when taking into account
two extra-ordinary transactions which occurred during the second quarter of 2011. As illustrated in
Table 2 below total trading volume was up 3% while total trading value was down 35%. The Odd-Lot
P a g e | 2
Market was the only market recording any significant increases in performance as trading volume in this
Market increased by 59% with a corresponding value increase of 30%.
Table 2 - Trading Activity - 2nd
Quarter
Market Second Quarter
Second Quarter
Second Quarter
Second Quarter
% Change
% Change
2012 Volume 2011 Volume 2012 Value 2011 Value Volume Value
REGULAR 1,312,491 1,224,036 $ 4,208,295 $ 6,353,967 7% -34%
ODD-LOT 61,873 39,010 $ 261,643 $ 201,805 59% 30%
PUT - THROUGH 4,455 74,026 $ 26,953 $ 346,446 -94% -92%
JUNIOR 2,000 3,200 $ 20,925 $ 34,400 -38% -39%
BLOCK TRADE - - $ - $ - NA NA
TOTAL 1,380,819 1,340,272 $ 4,517,815 $ 6,936,618 3% -35%
Regular Market
The trading activity on the Regular Market for the first half of 2012 recorded decreases in both trading
volume and value of 70.28% and 91.93% respectively. The total volume of shares traded at the half year
was 3,660,142 as compared to the 12,316,659 shares traded for the corresponding period in 2011 as
illustrated in Table 3. Similarly, the total value traded decreased from $225,678,597 in the first half of
2011 to $18,201,636 for the corresponding period in 2012. As mentioned earlier, the inclusion of the
extra-ordinary transactions are the main determinant of the large differences in trading activity.
Excluding these transactions, Regular Market activity would have yielded an increase in volume traded
of 15% but a reduction in the value traded of 12%. The number of trades recorded during the first half of
2012 rose from 475 in 2011 to 487 in 2012; an increase of 2.53%. Figure 1 illustrates a monthly
comparison of the volume of trades for 2011 and 2012.
The Advance/Decline Ratio, which measures the number of companies whose share price increased or
'advanced' versus those whose share price decreased or 'declined', showed some minor declines in 2012
with 5 companies experiencing increases in their share price, down 3 from 2011 while 9 experienced
decreases; the same number of companies experienced declines in 2011.

P a g e | 3
Figure 1
Table 3 - Regular Market Comparison
Regular Market Year on Year Comparison
30-Jun-12 30-Jun-11 % Change
TOTAL SHARE VOLUME 3,660,142 12,316,659 -70.28%
TOTAL SHARE VALUE 18,201,636 225,678,597 -91.93%
AVERAGE DAILY SHARE VOLUME 29,281 100,135 -70.76%
AVERAGE DAILY SHARE VALUE $ 145,613 $ 1,834,785 -92.06%
NUMBER OF TRADES 487 475 2.53%
NUMBER OF TRADE DAYS 125 123 1.63%
AVERAGE SHARE PRICE $ 5.72 $ 6.04 -5.27%
ADVANCE/DECLINE RATIO 5/9 8/9 N/A
LOCAL INDEX 3,200.26 3,333.34 -3.99%
CROSS – LISTED INDEX 1,184.41 1,181.39 0.26%
COMPOSITE MARKET INDEX 722.40 740.38 -2.43%
LOCAL MARKET CAPITALIZATION 9,192,523,517 9,134,276,418 0.64%
CROSS-LISTED MARKET CAPITALIZATION 2,009,717,950 1,953,269,159 2.89%
COMPOSITE MARKET CAPITALIZATION 11,210,041,467 11,095,495,576 1.03%
NUMBER OF LISTED SECURITIES 26 25 4.00%
Table 4 and Table 5 show the top five companies traded in the Regular Market for the first half of 2012
based on volume and value respectively. Sagicor Financial Corporation was the top traded company for
the first half of 2012 in terms of volume, accounting for 29.68% of the total volume traded but was
second in terms of value traded accounting for 13.53% of the value traded. ANSA McAL (Barbados)
0
20
40
60
80
100
120
140
January February March April May June
2012 33 87 132 55 102 78
2011 59 119 100 40 79 78
No
. of
Trad
es
Trade Frequency Comparison

P a g e | 4
Limited, which accounted for 49.09% of the total value traded, was the top traded company in terms of
value.
Table 4 - Top five traded companies by volume -1st
half
2012 2011 2012 2011
Company Volume Volume Value Value
SAGICOR FINANCIAL CORPORATION 1,086,949 334,556 $ 2,465,313 $ 1,008,509
ANSA MCAL (BARBADOS) LIMITED 761,324 2,619,845 $ 8,945,557 $30,783,179
FIRSTCARIBBEAN INTERNATIONAL BANK 435,770 483706 $ 1,354,618 $ 1,495,400
GODDARD ENTERPRISES LIMITED 372,759 215,181 $ 2,216,495 $ 1,294,013
FORTRESS CARIBBEAN PROPERTY FUND 303,156 178,319 $ 269,851 $ 203,909
Table 5 - Top Five Traded Companies by Value –1st
Half
2012 2011 2012 2011
Company Value Value Volume Volume
ANSA MCAL (BARBADOS) LIMITED $ 8,945,557 $ 30,783,179 761,324 2,619,845
SAGICOR FINANCIAL CORPORATION $ 2,465,313 $ 1,008,509 1,086,949 334,556
GODDARD ENTERPRISES LIMITED $ 2,216,495 $ 1,294,013 372,759 215181
FIRSTCARIBBEAN INTERNATIONAL BANK $ 1,354,618 $ 1,495,400 435,770 483,706
CABLE AND WIRELESS BARBADOS LIMITED $ 706,969 $ 2,308,523 132,496 427,721
As Table 6 and Table 7 illustrate, Sagicor Financial Corporation was the top security traded for the 2nd
quarter in terms of both volume and value. Trading 639,222 shares or 48.63% of the volume traded,
they outperformed second place Banks Holdings Limited which only traded 123,624 or 9.40% of the
volume traded. Trading just over $1.4 million, Sagicor accounted for 33.14% of the value traded for the
second half while second place Goddard Enterprises Limited traded $692,939 or 16.38% of the value
traded.
Table 6 - Top Five Traded Companies by Volume –2nd Quarter
2012 2011 2012 2011
Company Volume Volume Value Value
SAGICOR FINANCIAL CORPORATION 639,222 82,356 $ 1,401,525 $ 243,337
BANKS HOLDINGS LIMITED 123,624 76,433 $ 404,719 $ 302,080
GODDARD ENTERPRISES LIMITED 118,833 47,881 $ 692,939 $ 291,276
FIRSTCARIBBEAN INTERNATIONAL BANK 106,127 188,243 $ 331,262 $ 582,375
CABLE AND WIRELESS BARBADOS LIMITED 85,621 209,614 $ 456,496 $ 1,130,878
P a g e | 5
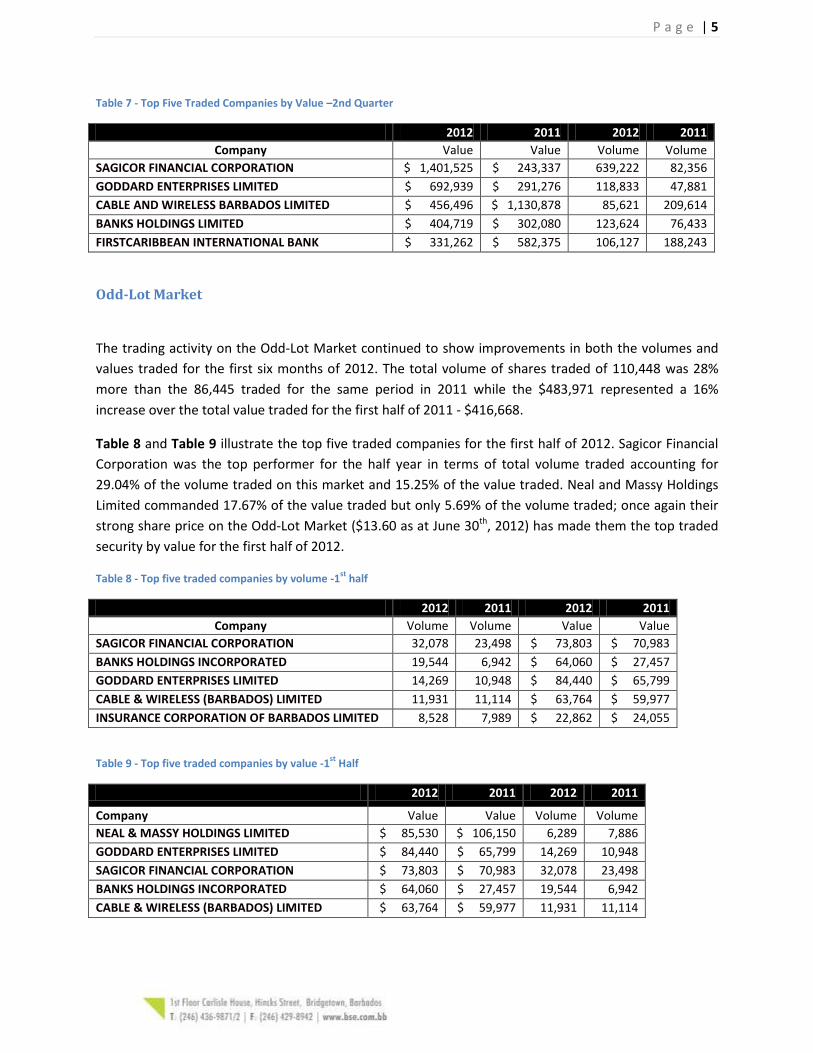
Table 7 - Top Five Traded Companies by Value –2nd Quarter
2012 2011 2012 2011
Company Value Value Volume Volume
SAGICOR FINANCIAL CORPORATION $ 1,401,525 $ 243,337 639,222 82,356
GODDARD ENTERPRISES LIMITED $ 692,939 $ 291,276 118,833 47,881
CABLE AND WIRELESS BARBADOS LIMITED $ 456,496 $ 1,130,878 85,621 209,614
BANKS HOLDINGS LIMITED $ 404,719 $ 302,080 123,624 76,433
FIRSTCARIBBEAN INTERNATIONAL BANK $ 331,262 $ 582,375 106,127 188,243
Odd-Lot Market
The trading activity on the Odd-Lot Market continued to show improvements in both the volumes and
values traded for the first six months of 2012. The total volume of shares traded of 110,448 was 28%
more than the 86,445 traded for the same period in 2011 while the $483,971 represented a 16%
increase over the total value traded for the first half of 2011 - $416,668.
Table 8 and Table 9 illustrate the top five traded companies for the first half of 2012. Sagicor Financial
Corporation was the top performer for the half year in terms of total volume traded accounting for
29.04% of the volume traded on this market and 15.25% of the value traded. Neal and Massy Holdings
Limited commanded 17.67% of the value traded but only 5.69% of the volume traded; once again their
strong share price on the Odd-Lot Market ($13.60 as at June 30th, 2012) has made them the top traded
security by value for the first half of 2012.
Table 8 - Top five traded companies by volume -1st
half
2012 2011 2012 2011
Company Volume Volume Value Value
SAGICOR FINANCIAL CORPORATION 32,078 23,498 $ 73,803 $ 70,983
BANKS HOLDINGS INCORPORATED 19,544 6,942 $ 64,060 $ 27,457
GODDARD ENTERPRISES LIMITED 14,269 10,948 $ 84,440 $ 65,799
CABLE & WIRELESS (BARBADOS) LIMITED 11,931 11,114 $ 63,764 $ 59,977
INSURANCE CORPORATION OF BARBADOS LIMITED 8,528 7,989 $ 22,862 $ 24,055
Table 9 - Top five traded companies by value -1st
Half
2012 2011 2012 2011
Company Value Value Volume Volume
NEAL & MASSY HOLDINGS LIMITED $ 85,530 $ 106,150 6,289 7,886
GODDARD ENTERPRISES LIMITED $ 84,440 $ 65,799 14,269 10,948
SAGICOR FINANCIAL CORPORATION $ 73,803 $ 70,983 32,078 23,498
BANKS HOLDINGS INCORPORATED $ 64,060 $ 27,457 19,544 6,942
CABLE & WIRELESS (BARBADOS) LIMITED $ 63,764 $ 59,977 11,931 11,114
P a g e | 6
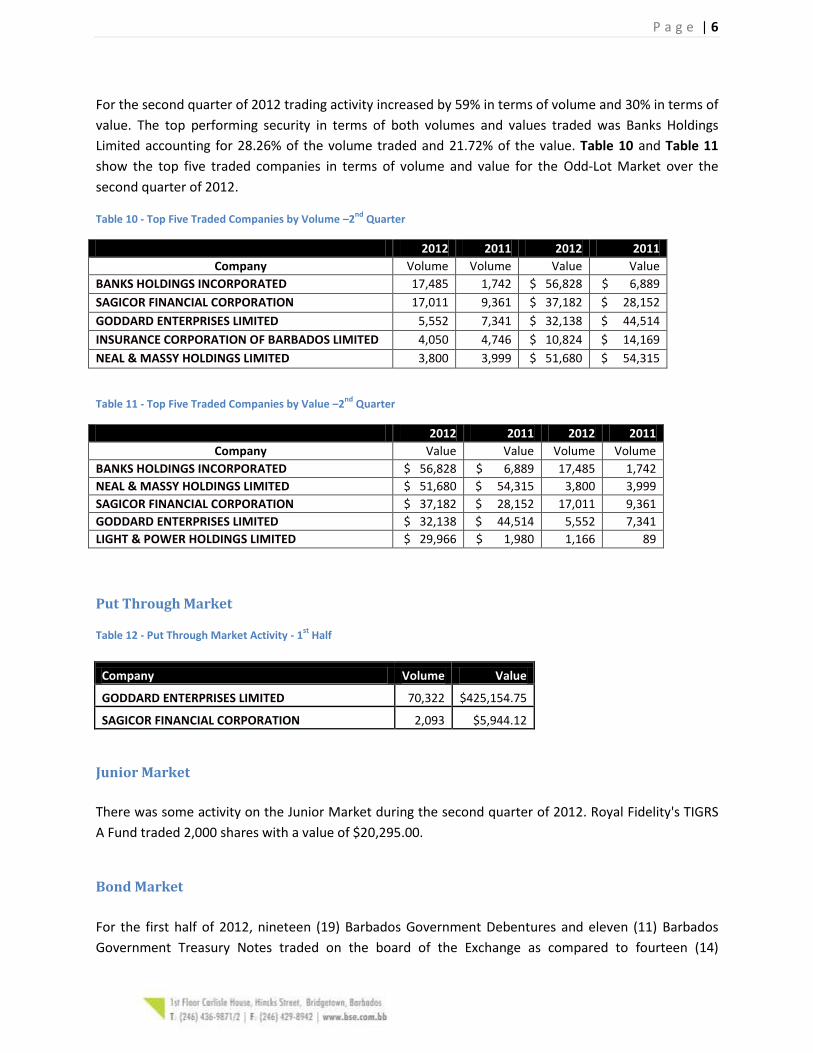
For the second quarter of 2012 trading activity increased by 59% in terms of volume and 30% in terms of
value. The top performing security in terms of both volumes and values traded was Banks Holdings
Limited accounting for 28.26% of the volume traded and 21.72% of the value. Table 10 and Table 11
show the top five traded companies in terms of volume and value for the Odd-Lot Market over the
second quarter of 2012.
Table 10 - Top Five Traded Companies by Volume –2nd
Quarter
2012 2011 2012 2011
Company Volume Volume Value Value
BANKS HOLDINGS INCORPORATED 17,485 1,742 $ 56,828 $ 6,889
SAGICOR FINANCIAL CORPORATION 17,011 9,361 $ 37,182 $ 28,152
GODDARD ENTERPRISES LIMITED 5,552 7,341 $ 32,138 $ 44,514
INSURANCE CORPORATION OF BARBADOS LIMITED 4,050 4,746 $ 10,824 $ 14,169
NEAL & MASSY HOLDINGS LIMITED 3,800 3,999 $ 51,680 $ 54,315
Table 11 - Top Five Traded Companies by Value –2nd
Quarter
2012 2011 2012 2011
Company Value Value Volume Volume
BANKS HOLDINGS INCORPORATED $ 56,828 $ 6,889 17,485 1,742
NEAL & MASSY HOLDINGS LIMITED $ 51,680 $ 54,315 3,800 3,999
SAGICOR FINANCIAL CORPORATION $ 37,182 $ 28,152 17,011 9,361
GODDARD ENTERPRISES LIMITED $ 32,138 $ 44,514 5,552 7,341
LIGHT & POWER HOLDINGS LIMITED $ 29,966 $ 1,980 1,166 89
Put Through Market
Table 12 - Put Through Market Activity - 1st
Half
Company Volume Value
GODDARD ENTERPRISES LIMITED 70,322 $425,154.75
SAGICOR FINANCIAL CORPORATION 2,093 $5,944.12
Junior Market
There was some activity on the Junior Market during the second quarter of 2012. Royal Fidelity's TIGRS
A Fund traded 2,000 shares with a value of $20,295.00.
Bond Market
For the first half of 2012, nineteen (19) Barbados Government Debentures and eleven (11) Barbados
Government Treasury Notes traded on the board of the Exchange as compared to fourteen (14)

P a g e | 7
Barbados Government Debentures and seven (7) Barbados Government Treasury Notes trading for the
corresponding period in 2011. There were a total of 141 trades occurring on the Bond Market resulting
in a volume of 9,977,500 bonds trading. The total face value of the bonds traded was $981,686,750.00.
Table 13 below summarizes all bonds traded for the first half of 2012.
Table 13 - Summary of Bonds Traded
Security Volume
BARBADOS GOVERNMENT DEBENTURE 4.25% 2013 1,000
BARBADOS GOVERNMENT DEBENTURE 4.75% 2016 4,000
BARBADOS GOVERNMENT DEBENTURE 5.25% 2013 1,000
BARBADOS GOVERNMENT DEBENTURE 5.875% 2018 80,000
BARBADOS GOVERNMENT DEBENTURE 6.125% 2021 7,000
BARBADOS GOVERNMENT DEBENTURE 6.25% 2019 9,000
BARBADOS GOVERNMENT DEBENTURE 6.25% 2022 2,000
BARBADOS GOVERNMENT DEBENTURE 6.625% 2020 3,007,000
BARBADOS GOVERNMENT DEBENTURE 6.75% 2022 15,000
BARBADOS GOVERNMENT DEBENTURE 6.875% 2023 3,000
BARBADOS GOVERNMENT DEBENTURE 7% 2017 512,000
BARBADOS GOVERNMENT DEBENTURE 7% 2023 15,000
BARBADOS GOVERNMENT DEBENTURE 7.125% 2026 21,000
BARBADOS GOVERNMENT DEBENTURE 7.375% 2027 5,503,000
BARBADOS GOVERNMENT DEBENTURE 7.5% 2012 100,000
BARBADOS GOVERNMENT DEBENTURE 7.750% 2031 3,000
BARBADOS GOVERNMENT DEBENTURE 8% 2012 10,000
BARBADOS GOVERNMENT DEBENTURE 8.250% 2018 200,000
BARBADOS GOVERNMENT DEBENTURE 8.50% 2018 14,000
BARBADOS GOVERNMENT T/NOTE 4.25% 2013 3,000
BARBADOS GOVERNMENT T/NOTE 6% 2016 63,000
BARBADOS GOVERNMENT T/NOTE 6% 2017 3,000
BARBADOS GOVERNMENT T/NOTE 6.125% 2021 1,000
BARBADOS GOVERNMENT T/NOTE 6.5% 2016 7,500
BARBADOS GOVERNMENT T/NOTE 6.625% 2019 6,000
BARBADOS GOVERNMENT T/NOTE 7.25% 2014 165,000
BARBADOS GOVERNMENT T/NOTE 7.50% 2012 1,000
BARBADOS GOVERNMENT T/NOTE 7.75% 2013 10,000
BARBADOS GOVERNMENT T/NOTE 7.875% 2015 210,000
BARBADOS GOVERNMENT T/NOTE 8% 2014 1,000
TOTAL 9,977,500
P a g e | 8
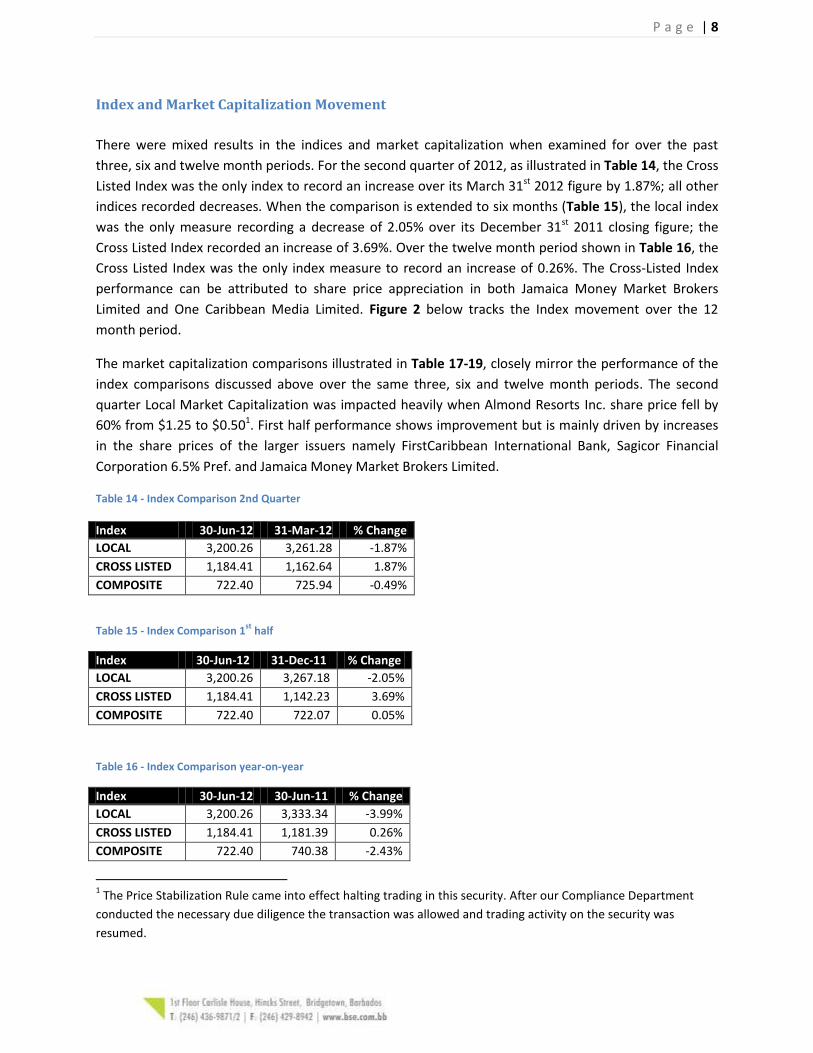
Index and Market Capitalization Movement
There were mixed results in the indices and market capitalization when examined for over the past
three, six and twelve month periods. For the second quarter of 2012, as illustrated in Table 14, the Cross
Listed Index was the only index to record an increase over its March 31st 2012 figure by 1.87%; all other
indices recorded decreases. When the comparison is extended to six months (Table 15), the local index
was the only measure recording a decrease of 2.05% over its December 31st 2011 closing figure; the
Cross Listed Index recorded an increase of 3.69%. Over the twelve month period shown in Table 16, the
Cross Listed Index was the only index measure to record an increase of 0.26%. The Cross-Listed Index
performance can be attributed to share price appreciation in both Jamaica Money Market Brokers
Limited and One Caribbean Media Limited. Figure 2 below tracks the Index movement over the 12
month period.
The market capitalization comparisons illustrated in Table 17-19, closely mirror the performance of the
index comparisons discussed above over the same three, six and twelve month periods. The second
quarter Local Market Capitalization was impacted heavily when Almond Resorts Inc. share price fell by
60% from $1.25 to $0.501. First half performance shows improvement but is mainly driven by increases
in the share prices of the larger issuers namely FirstCaribbean International Bank, Sagicor Financial
Corporation 6.5% Pref. and Jamaica Money Market Brokers Limited.
Table 14 - Index Comparison 2nd Quarter
Index 30-Jun-12 31-Mar-12 % Change
LOCAL 3,200.26 3,261.28 -1.87%
CROSS LISTED 1,184.41 1,162.64 1.87%
COMPOSITE 722.40 725.94 -0.49%
Table 15 - Index Comparison 1st
half
Index 30-Jun-12 31-Dec-11 % Change
LOCAL 3,200.26 3,267.18 -2.05%
CROSS LISTED 1,184.41 1,142.23 3.69%
COMPOSITE 722.40 722.07 0.05%
Table 16 - Index Comparison year-on-year
Index 30-Jun-12 30-Jun-11 % Change
LOCAL 3,200.26 3,333.34 -3.99%
CROSS LISTED 1,184.41 1,181.39 0.26%
COMPOSITE 722.40 740.38 -2.43%
1 The Price Stabilization Rule came into effect halting trading in this security. After our Compliance Department
conducted the necessary due diligence the transaction was allowed and trading activity on the security was
resumed.

P a g e | 9
Table 17 - Market Capitalization comparison 2nd
quarter
Market Capitalization 30-Jun-12 31-Mar-12 % Change
LOCAL 9,192,523,516.72 9,319,483,622.90 -1.36%
CROSS LISTED 2,009,717,949.85 1,987,204,617.63 1.13%
COMPOSITE 11,210,041,466.57 11,314,638,241 -0.92%
Table 18 - Market Capitalization comparison 1st
half
Market Capitalization 30-Jun-12 31-Dec-11 % Change
LOCAL 9,192,523,517 9,127,101,474 0.72%
CROSS LISTED 2,009,717,950 1,896,819,202 5.95%
COMPOSITE 11,210,041,467 11,031,870,677 1.62%
Table 19 - Market Capitalization Comparison year-on-year
Market Capitalization 30-Jun-12 30-Jun-11 % Change
LOCAL 9,192,523,516.72 9,134,276,417.73 0.64%
CROSS LISTED 2,009,717,949.85 1,953,269,158.75 2.89%
COMPOSITE 11,210,041,466.57 11,095,495,576 1.03%
-4.50%
-4.00%
-3.50%
-3.00%
-2.50%
-2.00%
-1.50%
-1.00%
-0.50%
0.00%
0.50%
Pe
rce
nta
ge C
han
ge
Year on Year Index Movement
Local Index
Cross-Listed Index
Composite Index
Figure 2 - Index Movement - 12 months

P a g e | 10
Company Activity Comparative Report
For the first half of the year, ending June 30th 2012, five (5) securities advanced, nine (9) declined, five
(5) remained unchanged and six (6) did not trade with one (1) suspension. This is compared to eight (8)
securities advanced, nine (9) declined, three (3) remained unchanged and six (6) did not trade with one
delisting for the first half of 2011.
Jamaica Money Market Brokers Limited was the top advancer for the first half climbing 50% from $0.10
on December 31st 2011 to $0.15 at June 30th 2012. One Caribbean Media Limited and Insurance
Corporation of Barbados Limited rounded out the top three companies to increase in price during the
first six months of 2012 increasing 20.34% and 7.6% respectively. The two other companies to increase
in price were FirstCaribbean International and Sagicor Financial Corporation 6.5% Pref.
Four companies experienced declines in excess of 10% for the first six months of 2012. Almond Resorts
Incorporated suffered the largest decline as their price fell by 60% during the half. Sagicor Financial
Corporation, Barbados Farms Limited and Fortress Caribbean Property Fund were the other companies
to experience double digit declines for the half of 23.34%, 20.67% and 15% respectively.
Table 20 - 1
st Half Trading Activity by Company (Regular and Junior market only)
1st Half 2012
1st Half 2012 CLOSING PRICE
CLOSING PRICE
% Change
SECURITY Volume Value June 30 2012
December 31 2011
ANSA MCAL (BARBADOS) LIMITED 761,324 $ 8,945,557 11.75 11.75 0.00%
ALMOND RESORTS INC. 10,000 $ 5,000 0.50 1.25 -60.00%
BICO INDUSTRIES LTD. 18,034 $ 33,543 1.86 1.86 0.00%
BARBADOS DAIRY INDUSTRIES LTD. 13,951 $ 73,801 5.29 5.29 0.00%
BARBADOS FARMS LTD. 28,969 $ 34,116 1.19 1.50 -20.67%
BARBADOS NATIONAL BANK INC. 0 $ - 5.50 5.50 0.00%
BANKS HOLDINGS LTD. 211,209 $ 696,994 3.25 3.29 -1.22%
BARBADOS SHIPPING & TRADING CO. LTD. 0 $ - 7.58 7.58 0.00%
FORTRESS CARIBBEAN PROPERTY FUND 303,156 $ 269,851 0.85 1.00 -15.00%
CAVE SHEPHERD AND CO. LTD. 58,772 $ 274,368 4.59 4.60 -0.22%
CABLE AND WIRELESS BARBADOS LTD 132,496 $ 706,969 5.30 5.34 -0.75%
FIRSTCARIBBEAN INTERNATIONAL BANK 435,770 $ 1,354,618 3.12 2.90 7.59%
GODDARD ENTERPRISES LTD. 372,759 $ 2,216,495 5.50 6.00 -8.33%
INSURANCE CORPORATION OF BARBADOS LTD. 104,524 $ 281,044 2.69 2.50 7.60%
JAMAICA MONEY MARKET BROKERS LIMITED 1,000 $ 150 0.15 0.10 50.00%
LIGHT AND POWER HOLDINGS LTD. 5,001 $ 128,526 25.70 25.70 0.00%
LIGHT AND POWER HOLDINGS LTD 5.5% PREF 0 $ - 3.11 3.11 0.00%
NEAL AND MASSEY HOLDINGS LTD. 34,846 $ 473,906 13.60 13.60 0.00%
ONE CARIBBEAN MEDIA LIMITED 63,382 $ 204,746 3.55 2.95 20.34%
SAGICOR FINANCIAL CORPORATION 6.5% PREF 18,000 $ 36,640 2.08 2.00 4.00%
SAGICOR FINANCIAL CORPORATION 1,086,949 $ 2,465,313 2.20 2.87 -23.34%
TRINIDAD CEMENT LTD. 0 $ - 0.80 0.80 0.00%

P a g e | 11
1st Half 2012
1st Half 2012 CLOSING PRICE
CLOSING PRICE
% Change
SECURITY Volume Value June 30 2012
December 31 2011
WEST INDIA BISCUIT CO. LTD. 0 $ - 10.01 10.01 0.00%
THE WEST INDIES RUM DISTILLERIES LTD. 0 $ - 8.00 8.00 0.00%
ROYAL FIDELITY TIGRS A FUND 2,000 $ 20,925 10.50 10.75 -2.33%
ROYAL FIDELITY TIGRS A1 FUND 0 $ - 10.00 10.00 0.00%
TOTAL 3,662,142 $ 18,222,561
For the second quarter, two (2) securities advanced, ten (10) declined, five (5) remained unchanged and
eight (8) did not trade with one (1) suspension. This is compared to three (3) securities advanced, nine
(9) declined, six (6) remained unchanged and seven (7) did not trade in the corresponding period in
2011.
Table 21 - 2nd
Quarter Trading Activity By Company (Regular and Junior market only)
2nd Quarter
2012
2nd Quarter
2012
CLOSING PRICE
CLOSING PRICE
% Change
SECURITY Volume Value June 30 2012
March 31 2012
ANSA MCAL (BARBADOS) LIMITED 0 $ - 11.75 11.75 0.00%
ALMOND RESORTS INC. 10,000 $ 5,000 0.50 1.25 -60.00%
BICO INDUSTRIES LTD. 16,735 $ 31,127 1.86 1.86 0.00%
BARBADOS DAIRY INDUSTRIES LTD. 13,951 $ 73,801 5.29 5.29 0.00%
BARBADOS FARMS LTD. 14,687 $ 16,978 1.19 1.20 -0.83%
BARBADOS NATIONAL BANK INC. 0 $ - 5.50 5.50 0.00%
BANKS HOLDINGS LTD. 123,624 $ 404,719 3.25 3.28 -0.91%
BARBADOS SHIPPING & TRADING CO. LTD. 0 $ - 7.58 7.58 0.00%
FORTRESS CARIBBEAN PROPERTY FUND 37,375 $ 31,591 0.85 0.90 -5.56%
CAVE SHEPHERD AND CO. LTD. 39,672 $ 181,518 4.59 5.00 -8.20%
CABLE AND WIRELESS BARBADOS LTD 85,621 $ 456,496 5.30 5.34 -0.75%
FIRSTCARIBBEAN INTERNATIONAL BANK 106,127 $ 331,262 3.12 3.13 -0.32%
GODDARD ENTERPRISES LTD. 118,833 $ 692,939 5.50 6.00 -8.33%
INSURANCE CORPORATION OF BARBADOS LTD. 37,045 $ 99,202 2.69 2.69 0.00%
JAMAICA MONEY MARKET BROKERS LIMITED 0 $ - 0.15 0.15 0.00%
LIGHT AND POWER HOLDINGS LTD. 3,441 $ 88,434 25.70 25.70 0.00%
LIGHT AND POWER HOLDINGS LTD 5.5% PREF 0 $ - 3.11 3.11 0.00%
NEAL AND MASSEY HOLDINGS LTD. 19,124 $ 260,086 13.60 13.60 0.00%
ONE CARIBBEAN MEDIA LIMITED 31,034 $ 100,977 3.55 3.21 10.59%
SAGICOR FINANCIAL CORPORATION 6.5% PREF 16,000 $ 32,640 2.08 2.00 4.00%
SAGICOR FINANCIAL CORPORATION 639,222 $ 1,401,525 2.20 2.30 -4.35%
TRINIDAD CEMENT LTD. 0 $ - 0.80 0.80 0.00%
WEST INDIA BISCUIT CO. LTD. 0 $ - 10.01 10.01 0.00%
THE WEST INDIES RUM DISTILLERIES LTD. 0 $ - 8.00 8.00 0.00%
ROYAL FIDELITY TIGRS A FUND 2,000 $ 20,925 10.50 10.75 -2.33%
ROYAL FIDELITY TIGRS A1 FUND 0 $ - 10.00 10.00 0.00%
TOTAL 1,312,491 $ 4,208,295 - -

P a g e | 12
Conclusion
Table 22 - Regional Comparison
First Half 2012
First Half 2011 Regional Index Performance
Three Month
Six Month
Twelve Month
Three Month
Six Month
Twelve Month
BSE Composite Index -0.49% 0.05% -2.43% 0.65% 9.66% -1.22%
JSE Market Index -4.36% -8.30% -1.35% 2.42% 3.95% 2.61%
TTSE Composite Index 1.07% 0.94% 7.61% 8.95% 13.70% 16.03%
A look at two of the other major regional exchanges above shows that while the Trinidad and Tobago
Stock Exchange's (TTSE) Composite Index is recording positive movements, the BSE's Composite Index
and the Jamaica Stock Exchange's (JSE) Market Index continue to come to terms with falling share
prices. The BSE recorded its highest positive index change over the six month period while the TTSE
recorded its highest positive change over the twelve month period. The JSE's Market Index was the only
one to record negative changes over the three, six and twelve month periods. A comparison of the index
performance over the same periods at the close of first half of 2011 shows that all markets are currently
experiencing some form of regression in index performance; perhaps due to the slow rate at which
economies are recovering.
The main highlights of the half were the final transaction pursuant to the take-over of ANSA McAL
(Barbados) Limited by AMCL Holdings Limited, the Offer made by Barbados Dairy Industries Limited
(BDI) to repurchase a maximum of 5% of its issued and outstanding shares, excluding those owned by its
parent company - Banks Holdings Limited - pursuant to its delisting from the board of the BSE, the
subsequent decision by the Directors of BDI to defer the delisting of its shares pending the publication of
new BSE "guidelines and procedures for the delisting and repurchase of securities that should better
provide for a delisting process in a manner which takes account of the practical considerations of listed
companies, minority shareholders and the regulatory environment" and finally Neal and Massy Holdings
Limited's decision to close and sell the Almond Resorts properties and said sale and closure's impact on
the listed security Almond Resorts Inc.
In his presentation of the Budgetary Proposal 2012-2013, the Honorable Christopher Sinckler - M.P.,
Minister of Finance and Economic Affairs, made specific mention to initiatives the Government is intent
on implementing in support of the development of the Capital Market in Barbados. The following are
the initiatives proposed:
Undertake Initial Public Offerings of 30% of the shares of Grantley Adams International Airport
Inc, the Oil Company and Barbados Port Authority, and the listing of these companies on the
Barbados Stock Exchange. Over the next few months, a valuation of the entities will be
undertaken and the IPO process initiated. The listing of these three major entities on the stock
exchange will serve to inject some much needed life in the exchange. The IPO process will be

P a g e | 13
undertaken in a manner that will ensure broad share ownership which promotes economic
democracy and market liquidity.
Providing a fiscal incentive for companies to list on the Junior Stock Market, where firms that
choose to list on the Barbados Stock Exchange’s Junior Stock Market will be provided with a tax
incentive2 for ten years structured as follows:
o An income tax holiday on 25% of the company’s operation for the first five years of the
ten year incentive period;
o A full income tax holiday for the first five years of the ten year
o incentive period;
o A half income tax holiday for the second half of the incentive period;
o An exemption from withholding tax on dividends and other distributions from
companies listed on the junior market;
o An exemption from transfer tax on transfers of shares in Junior market companies;
To promote liquidity and encourage economic democracy, in order for a company to qualify for
the above-mentioned tax incentives the following could be required:
o The company must have a minimum of 50 shareholders;
o No single shareholder should own more than 25% of the shares of the company and no
other shareholder should own more than 5% of the shares.
o If at any point these are violated the company must repay the Government all taxes
claimed.
The BSE is very pleased to see that recognition of the importance of the Capital Market in Barbados has
been given; especially the assistance given to further develop the Junior Market of the BSE. The tax
incentives offered should make equity financing a far more attractive option than the traditional debt
financing regime currently prevailing in Barbados. Supporting the Junior Market's development also
further emphasizes Government's commitment and support for SMEs and Entrepreneurs as the main
drivers of economic activity in an economy under duress from the effects of a prolonged recession. The
BSE formally wishes to express its gratitude to the Government of Barbados for providing it with the
opportunities to further develop and enhance the investment and financing opportunities for investors
and issuers of equity securities.
2 The BSE has formally written Minister Sinckler for clarification of the Tax Incentives outlined and the
requirements.

![IB - Barbados International Finance & Business Magazine 2010 [Barbados]](https://static.fdocuments.in/doc/165x107/5553d3efb4c905c4048b4c4b/ib-barbados-international-finance-business-magazine-2010-barbados.jpg)