Banner clouds observed at Mount Zugspitze
15
Atmos. Chem. Phys., 12, 3611–3625, 2012 www.atmos-chem-phys.net/12/3611/2012/ doi:10.5194/acp-12-3611-2012 © Author(s) 2012. CC Attribution 3.0 License. Atmospheric Chemistry and Physics Banner clouds observed at Mount Zugspitze V. Wirth 1 , M. Kristen 2 , M. Leschner 1 , J. Reuder 3 , and J. H. Schween 4 1 Institute for Atmospheric Physics, Johannes Gutenberg-University, Mainz, Germany 2 Wetterwarte Garmisch-Partenkirchen/Zugspitze, Garmisch-Partenkirchen, Germany 3 Geophysical Institute, University of Bergen, Bergen, Norway 4 Institute for Geophysics and Meteorology, University of Cologne, Cologne, Germany We dedicate this paper to the memory of the late Joachim Kuettner, who was our mentor throughout the project. Correspondence to: V. Wirth ([email protected]) Received: 19 September 2011 – Published in Atmos. Chem. Phys. Discuss.: 31 October 2011 Revised: 17 February 2012 – Accepted: 2 April 2012 – Published: 17 April 2012 Abstract. Systematic observations of banner clouds at Mount Zugspitze in the Bavarian Alps are presented and dis- cussed. One set of observations draws on daily time lapse movies, which were taken over several years at this moun- tain. Identifying banner clouds with the help of these movies and using simultaneous observations of standard variables at the summit of the mountain provides climatological informa- tion regarding the banner clouds. In addition, a week-long measurement campaign with an entire suite of instruments was carried through yielding a comprehensive set of data for two specific banner cloud events. The duration of banner cloud events has a long-tailed dis- tribution with a mean of about 40 min. The probability of occurrence has both a distinct diurnal and a distinct seasonal cycle, with a maximum in the afternoon and in the warm sea- son, respectively. These cycles appear to correspond closely to analogous cycles of relative humidity, which maximize in the late afternoon and during the warm season. In addition, the dependence of banner cloud occurrence on wind speed is weak. Both results suggest that moisture conditions are a key factor for banner cloud occurrence. The distribution of wind direction during banner cloud events slightly deviates from climatology, suggesting an influence from the specific Zugspitz orography. The two banner cloud events during the campaign have a number of common features: the windward and the leeward side are characterized by different wind regimes, however, with mean upward flow on both sides; the leeward air is both moister and warmer than the windward air; the background atmosphere has an inversion just above the summit of Mt. Zugspitze; the lifting condensation level increases with al- titude. The results are discussed, and it is argued that they are consistent with previous Large Eddy Simulations using idealized orography. 1 Introduction Banner clouds are cloud plumes which extend downwind of steep mountains or sharp ridges even on otherwise cloudfree days (Glickman, 2000). Examples are the banner clouds at Matterhorn in the Swiss Alps or at Mount Zugspitze in the Bavarian Alps (see Fig. 1). Although this beautiful phe- nomenon is generally well known, only very few observa- tional reports can be found in the scientific literature (Peppler 1927; K¨ uttner 2000). Based on a set of time lapse movies taken on Mount Zugspitze, Schween et al. (2007) provided a detailed definition of what should (and what should not) be considered a banner cloud. According to their analysis, a banner cloud must simultaneously satisfy four criteria: (1) the cloud should be in a fixed relation to the mountain and occur only on its leeward side; (2) the cloud should not be composed of snow crystals blown off the mountain by the wind; (3) the cloud should be persistent; (4) the cloud should not be primarily of convective character. The last criterion is meant to distinguish banner clouds from purely convective clouds on days with vanishing mean wind. Several authors attempted to uncover the key physical in- gredients of a banner clouds. Essentially three hypotheses have emerged, explaining banner clouds as due to either the Published by Copernicus Publications on behalf of the European Geosciences Union.
Transcript of Banner clouds observed at Mount Zugspitze

Atmos. Chem. Phys., 12, 3611–3625, 2012www.atmos-chem-phys.net/12/3611/2012/doi:10.5194/acp-12-3611-2012© Author(s) 2012. CC Attribution 3.0 License.
AtmosphericChemistry
and Physics
Banner clouds observed at Mount Zugspitze
V. Wirth 1, M. Kristen 2, M. Leschner1, J. Reuder3, and J. H. Schween4
1Institute for Atmospheric Physics, Johannes Gutenberg-University, Mainz, Germany2 Wetterwarte Garmisch-Partenkirchen/Zugspitze, Garmisch-Partenkirchen, Germany3 Geophysical Institute, University of Bergen, Bergen, Norway4 Institute for Geophysics and Meteorology, University of Cologne, Cologne, Germany
We dedicate this paper to the memory of the late Joachim Kuettner, who was our mentor throughout the project.
Correspondence to:V. Wirth ([email protected])
Received: 19 September 2011 – Published in Atmos. Chem. Phys. Discuss.: 31 October 2011Revised: 17 February 2012 – Accepted: 2 April 2012 – Published: 17 April 2012
Abstract. Systematic observations of banner clouds atMount Zugspitze in the Bavarian Alps are presented and dis-cussed. One set of observations draws on daily time lapsemovies, which were taken over several years at this moun-tain. Identifying banner clouds with the help of these moviesand using simultaneous observations of standard variables atthe summit of the mountain provides climatological informa-tion regarding the banner clouds. In addition, a week-longmeasurement campaign with an entire suite of instrumentswas carried through yielding a comprehensive set of data fortwo specific banner cloud events.
The duration of banner cloud events has a long-tailed dis-tribution with a mean of about 40 min. The probability ofoccurrence has both a distinct diurnal and a distinct seasonalcycle, with a maximum in the afternoon and in the warm sea-son, respectively. These cycles appear to correspond closelyto analogous cycles of relative humidity, which maximize inthe late afternoon and during the warm season. In addition,the dependence of banner cloud occurrence on wind speedis weak. Both results suggest that moisture conditions are akey factor for banner cloud occurrence. The distribution ofwind direction during banner cloud events slightly deviatesfrom climatology, suggesting an influence from the specificZugspitz orography.
The two banner cloud events during the campaign have anumber of common features: the windward and the leewardside are characterized by different wind regimes, however,with mean upward flow on both sides; the leeward air is bothmoister and warmer than the windward air; the backgroundatmosphere has an inversion just above the summit of Mt.
Zugspitze; the lifting condensation level increases with al-titude. The results are discussed, and it is argued that theyare consistent with previous Large Eddy Simulations usingidealized orography.
1 Introduction
Banner clouds are cloud plumes which extend downwind ofsteep mountains or sharp ridges even on otherwise cloudfreedays (Glickman, 2000). Examples are the banner clouds atMatterhorn in the Swiss Alps or at Mount Zugspitze in theBavarian Alps (see Fig.1). Although this beautiful phe-nomenon is generally well known, only very few observa-tional reports can be found in the scientific literature (Peppler1927; Kuttner2000). Based on a set of time lapse moviestaken on Mount Zugspitze,Schween et al.(2007) provideda detailed definition of what should (and what should not)be considered a banner cloud. According to their analysis,a banner cloud must simultaneously satisfy four criteria: (1)the cloud should be in a fixed relation to the mountain andoccur only on its leeward side; (2) the cloud should not becomposed of snow crystals blown off the mountain by thewind; (3) the cloud should be persistent; (4) the cloud shouldnot be primarily of convective character. The last criterionis meant to distinguish banner clouds from purely convectiveclouds on days with vanishing mean wind.
Several authors attempted to uncover the key physical in-gredients of a banner clouds. Essentially three hypotheseshave emerged, explaining banner clouds as due to either the
Published by Copernicus Publications on behalf of the European Geosciences Union.
3612 V. Wirth et al.: Banner clouds at Mount Zugspitze
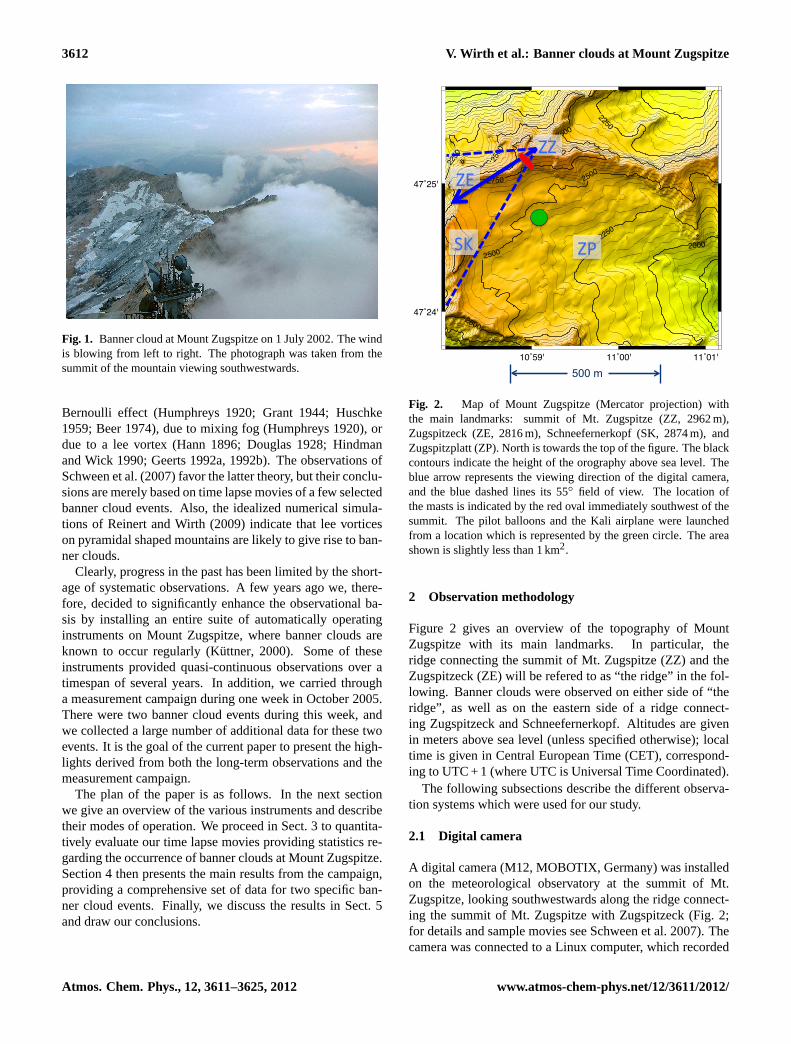
Fig. 1. Banner cloud at Mount Zugspitze on 1 July 2002. The windis blowing from left to right. The photograph was taken from thesummit of the mountain viewing southwestwards.
Bernoulli effect (Humphreys1920; Grant 1944; Huschke1959; Beer1974), due to mixing fog (Humphreys1920), ordue to a lee vortex (Hann 1896; Douglas1928; Hindmanand Wick1990; Geerts1992a, 1992b). The observations ofSchween et al.(2007) favor the latter theory, but their conclu-sions are merely based on time lapse movies of a few selectedbanner cloud events. Also, the idealized numerical simula-tions of Reinert and Wirth(2009) indicate that lee vorticeson pyramidal shaped mountains are likely to give rise to ban-ner clouds.
Clearly, progress in the past has been limited by the short-age of systematic observations. A few years ago we, there-fore, decided to significantly enhance the observational ba-sis by installing an entire suite of automatically operatinginstruments on Mount Zugspitze, where banner clouds areknown to occur regularly (Kuttner, 2000). Some of theseinstruments provided quasi-continuous observations over atimespan of several years. In addition, we carried througha measurement campaign during one week in October 2005.There were two banner cloud events during this week, andwe collected a large number of additional data for these twoevents. It is the goal of the current paper to present the high-lights derived from both the long-term observations and themeasurement campaign.
The plan of the paper is as follows. In the next sectionwe give an overview of the various instruments and describetheir modes of operation. We proceed in Sect.3 to quantita-tively evaluate our time lapse movies providing statistics re-garding the occurrence of banner clouds at Mount Zugspitze.Section4 then presents the main results from the campaign,providing a comprehensive set of data for two specific ban-ner cloud events. Finally, we discuss the results in Sect. 5and draw our conclusions.
10˚59' 11˚00' 11˚01'
47˚24'
47˚25'
2000225
0
2250
2250
2500
2500
2500
2500
2500
2750
2750
!!"
!#"
$%" !&"
500 m
Fig. 2. Map of Mount Zugspitze with the main landmarks: Summit of Mt. Zugspitze (ZZ, 2962 m), Zugspitzeck
(ZE, 2816 m), Schneefernerkopf (SK, 2874 m), and Zugspitzplatt (ZP). North is towards the top of the figure.
The black contours indicate the height of the orography above sea level. The blue arrow represents the viewing
direction of the digital camera, and the blue dashed lines its 55◦ field of view. The location of the masts is
indicated by the red oval immediately southwest of the summit. The pilot balloons and the Kali airplane were
launched from a location which is represented by the green circle. The area shown is slightly less than 1 km2.
pixels) every 5 seconds during daylight hours, i.e. from approximately 30 minutes before sunrise75
until approximately 30 minutes after sunset. The images where converted into standard mpeg-1 time
lapse movies during the following night. The camera was operational between December 2002 and
October 2006. Altogether we obtained time lapse movies for 797 days from 38 different months.
The corresponding statistics are summarized in table 1.
2.2 Meteorological data from the summit of Mt. Zugspitze80
The German weather service operates a weather station at the summit of Mt. Zugspitze, providing a
wealth of in-situ observations. In this work we used hourly data (with only very few gaps) of wind
and relative humidity spanning the range 1 January 2002 – 31 December 2006. Based on these data
we computed climatologies of the respective variables.
4
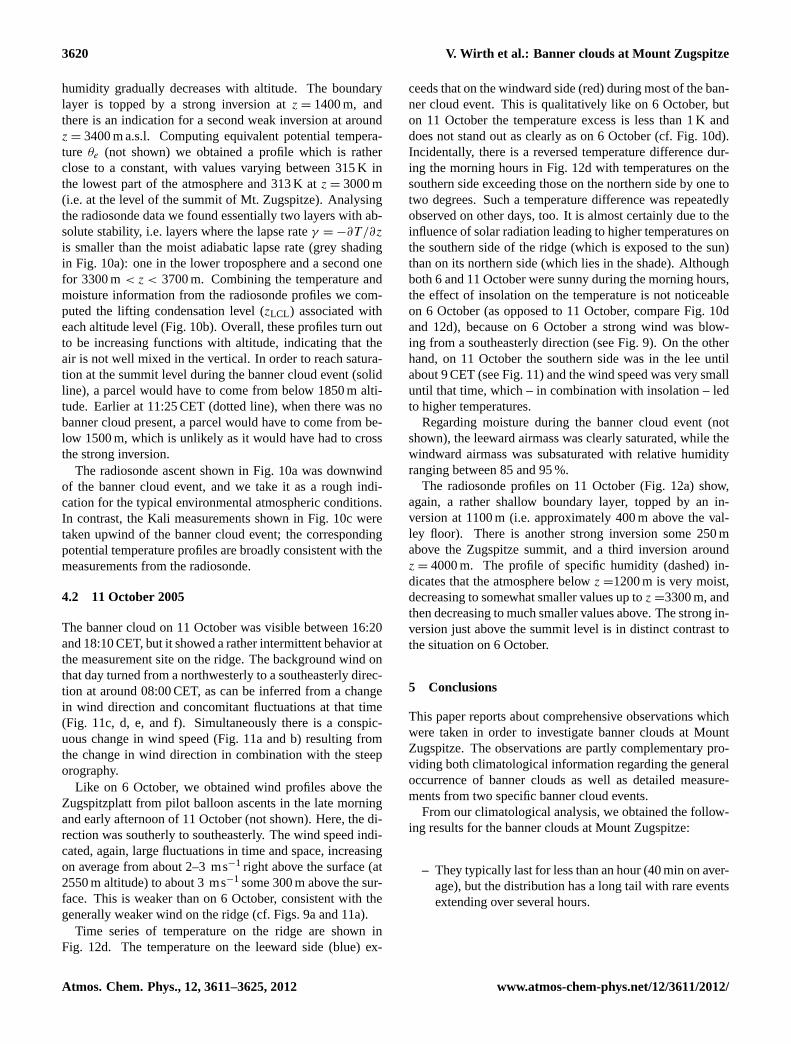
Fig. 2. Map of Mount Zugspitze (Mercator projection) withthe main landmarks: summit of Mt. Zugspitze (ZZ, 2962 m),Zugspitzeck (ZE, 2816 m), Schneefernerkopf (SK, 2874 m), andZugspitzplatt (ZP). North is towards the top of the figure. The blackcontours indicate the height of the orography above sea level. Theblue arrow represents the viewing direction of the digital camera,and the blue dashed lines its 55◦ field of view. The location ofthe masts is indicated by the red oval immediately southwest of thesummit. The pilot balloons and the Kali airplane were launchedfrom a location which is represented by the green circle. The areashown is slightly less than 1 km2.
2 Observation methodology
Figure 2 gives an overview of the topography of MountZugspitze with its main landmarks. In particular, theridge connecting the summit of Mt. Zugspitze (ZZ) and theZugspitzeck (ZE) will be refered to as “the ridge” in the fol-lowing. Banner clouds were observed on either side of “theridge”, as well as on the eastern side of a ridge connect-ing Zugspitzeck and Schneefernerkopf. Altitudes are givenin meters above sea level (unless specified otherwise); localtime is given in Central European Time (CET), correspond-ing to UTC + 1 (where UTC is Universal Time Coordinated).
The following subsections describe the different observa-tion systems which were used for our study.
2.1 Digital camera
A digital camera (M12, MOBOTIX, Germany) was installedon the meteorological observatory at the summit of Mt.Zugspitze, looking southwestwards along the ridge connect-ing the summit of Mt. Zugspitze with Zugspitzeck (Fig.2;for details and sample movies seeSchween et al.2007). Thecamera was connected to a Linux computer, which recorded
Atmos. Chem. Phys., 12, 3611–3625, 2012 www.atmos-chem-phys.net/12/3611/2012/

V. Wirth et al.: Banner clouds at Mount Zugspitze 3613
Fig. 3. Photographs showing the two masts, one on the northern side (left panel) and the other one on the
southern side (right panel) of the ridge. The view is from the southwest looking upwards towards the summit of
Mt. Zugspitze. Measurements at each mast are taken at two altitudes, namely at z = 3.7 m and z = 9 m above
ground.
measurements difficult. Fischer uses a standard capacitive humidity sensor (HIH-3605, Honeywell,
USA) which delivers voltages proportional to relative humidity. This signal has to be corrected for
a slight temperature dependence of the sensor. Prior to installation the temperature sensors were105
calibrated in a climate chamber (relative to a calibrated reference pt100), resulting in an accuracy
better than 0.05 K within the range −30◦C to +30◦C.
A box mounted at 2.6 m above the foot of each mast housed power supply, data logger and a
pressure sensor (Fischer, Germany). Data were measured every 2 seconds and stored as 5 minute av-
erages by electronic data loggers (Combilog, Theodor Friedrichs, Germany). They were transferred110
via mobile phone around midnight every day.
The masts were installed in September 2005. In December 2005 the north mast collapsed in a
storm. The southern mast remained in operation until November 2006 and stood until September
2008, when it was dismounted.
6
Fig. 3. Photographs showing the two masts, one on the northern side (left panel) and the other one on the southern side (right panel) of theridge. The view is from the southwest looking upwards toward the summit of Mt. Zugspitze. Measurements at each mast are taken at twoheights, namely 3.7 and 9 m above ground.
one image (640× 480 pixels) every 5 s during daylight hours,i.e. from approximately 30 min before sunrise until approx-imately 30 min after sunset. The images were convertedinto standard mpeg-1 time lapse movies during the follow-ing night. The camera was operational between December2002 and October 2006. Altogether we obtained time lapsemovies for 797 days from 38 different months. The corre-sponding statistics are summarized in Table1.
2.2 Meteorological data from the summit ofMt. Zugspitze
The German Weather Service operates a weather station atthe summit of Mt. Zugspitze, providing a wealth of in situobservations. In this work we used hourly data (with onlyvery few gaps) of wind and relative humidity spanning therange 1 January 2002–31 December 2006. Based on thesedata we computed climatologies of the respective variables.
2.3 Masts at the ridge
Two 9 m masts were installed, one on either side of the ridgeat roughly the same altitude, located approximately 120 msouthwest of the summit of Mt. Zugspitze (see Fig.2). Twophotographs are shown in Fig.3. The masts are about 15 mapart, one on the northern and the other one on the south-ern side of the ridge. Instruments were mounted at 3.7 and9 m above the foot of the mast, such that the lower positionwas well below the ridge and the upper position was slightlyabove the ridge. The mast location was just outside the fieldof view of the digital camera.
At both measurement heights the masts were equippedwith sensors for wind, temperature, and humidity. Wind wasmeasured using 2-D heated sonic anemometers (Windob-server II, Gill, UK). They were chosen for their robustnessand a heating option, which proved to be very useful duringcloud episodes at temperatures below 0◦C. Two anemome-ters were mounted at each height, one horizontally and one
www.atmos-chem-phys.net/12/3611/2012/ Atmos. Chem. Phys., 12, 3611–3625, 2012

3614 V. Wirth et al.: Banner clouds at Mount Zugspitze
vertically, respectively, such that all three components of thewind vector could be measured. Temperature and humid-ity were measured with combined temperature and humid-ity sensors (Fischer, Germany). The latter were installed inventilated radiation shields. At the upper position we in-stalled additional, more robust sensors for both temperatureand humidity (HMP243, Vaislala, Finland). The Vaisala hu-midity sensor is a heated Humicap®KC sensor also used inthe Vaisala RS90 radiosondes. Heating the sensor improvesthe accuracy of the humidity readings especially under fastchanging conditions at high relative humidity, when conden-sation on the sensor renders measurements difficult. Fischeruses a standard capacitive humidity sensor (HIH-3605, Hon-eywell, USA) which delivers voltages proportional to rela-tive humidity. Prior to installation the temperature sensorswere calibrated in a climate chamber (relative to a calibratedreference Pt100), resulting in an accuracy better than 0.05 Kwithin the range−30◦C to+30◦C.
A box mounted at 2.6 m above the foot of each masthoused power supply, data logger and a pressure sensor (Fis-cher, Germany). Data were measured every 2 s and storedas 5 min averages by electronic data loggers (Combilog,Theodor Friedrichs, Germany). They were transferred viamobile phone around midnight every day.
The masts were installed in September 2005. In December2005 the north mast collapsed in a storm. The southern mastremained in operation until November 2006 and stood untilSeptember 2008, when it was removed.
2.4 Measurement campaign
In order to complement the information from the long-termmeasurements, an intensive observation campaign was con-ducted in Autumn 2005. Measurements took place during6–7 and 11–13 October. Two occurrences of a banner cloudwere sampled with all instruments up and running: one on 6October and a second one on 11 October.
Radiosondes (RS90, Vaisala, Finland) were launched threetimes a day (in the morning, around noon, and in the af-ternoon) from the office of the German Weather Service(DWD) in Grainau, which is located on the valley floor about10 km northeast of the summit of Mt. Zugspitze at 720 m alti-tude. Profiles of potential temperature were obtained throughθ = T (p0/p)R/cp , wherep is pressure,p0 = 1000 hPa,R isthe gas constant for dry air, andcp is the specific heat at con-stant pressure.
A remote controlled miniature airplane called “Kali” waslaunched from Zugspitzplatt at 2575 m altitude to provideprofiles of temperature and humidity. In total 14 flights wereperformed, reaching heights between 550 and 1280 m abovethe starting altitude. This measurement system was describedin more detail byEgger et al.(2002).
A total of 42 pilot balloons were launched on an hourlybasis and tracked typically several 100 m above the startingpoint. They provided wind profiles above the Zugspitzplatt.
Table 1. Overview of the time lapse movies: each row represents aclimatological month, the number of days with available data (i.e.with the digital camera operating) is denoted byNd, the number ofobserved banner cloud days is denoted byNbc, the duration of thedaily operations is denoted byTd. As an estimate for the statisticalerror we use1Nbc =
√Nbc.
Nd Nbc 1Nbc Td (h)
Jan 58 2 1.4 9.8Feb 87 10 3.2 11.2Mar 104 20 4.5 12.8Apr 62 18 4.2 14.6May 45 18 4.2 16.2Jun 65 25 5.0 17.1Jul 55 17 4.1 16.7Aug 58 16 4.0 15.4Sep 49 20 4.5 13.7Oct 68 12 3.5 11.9Nov 71 7 2.6 10.1Dec 75 5 2.2 9.3
Total 797 170
Fig. 4. Distribution of the duration of the observed banner cloud events. The error bars represent the statistical
error; they are equal to ±√
n, with n denoting the number of events in each bin.
interpreting this histogram, since a summer day has more hours of daylight than a winter day. As150
mentioned before, our digital camera was operational each day approximately from 30 minutes
before sunrise until 30 minutes after sunset. Here, we define the “daily operation time” Td as the time
interval from 30 minutes before sunrise to 30 minutes after sunset (see the third column of table 1).
The boundaries of this interval were determined for the 15th of each month and interpolated to each
day of the year. We then calibrated the time of occurrence of each banner cloud event with respect to155
the daily observation time. The corresponding histogram is provided in figure 5(b). Apparently, the
chance of occurrence of a banner cloud event on a given day has a distinct diurnal cycle, starting with
low values in the morning and increasing to much larger values in the late afternoon; the maximum
rate of occurrence during the late afternoon is almost three times as large as the minimum rate
of occurrence in the morning. Analyzing the different seasons separately (no plots shown), we160
found approximately the same qualitative behavior for all seasons except winter, but the number of
available observations slightly too limited in order to provide statistically significant diurnal cycles
for the individual seasons.
Banner clouds were observed to occur throughout the year, although not with the same frequency
in all seasons. The dark bars in figure 6 represent the climatology for the number of banner cloud165
days per month, computed from the numbers in table 1 as Nbc/Nd× (number of days per month).
Apparently, there is a clear seasonal cycle with much larger numbers in summer (approx. 10 per
month) than in winter (approx. 2 per month). However, interpreting these numbers requires care
because, again, the seasonal cycle of the daylight time needs to be accounted for: at winter solstice
the daily observation time Td is around 10 hours, while at summer solstice it is around 17 hours (see170
table 1). For this reason, the plot in figure 6 contains another histogram (light grey) representing
8
Fig. 4. Distribution of the duration of the observed banner cloudevents. The error bars represent the statistical error; they are equalto ±
√n, with n denoting the number of events in each bin.
A detailed description of the pilot balloon tracking systemcan be found inEgger(1999).
3 Banner cloud statistics
Each occurrence of a banner cloud according to the defi-nition by Schween et al.(2007) is called abanner cloudevent. In ambigous cases we decided to be conservativein the sense that only those events were taken into accountwhich clearly satisfied our criteria. Ambiguous cases in-cluded cases with blowing snow, clouds which were at least
Atmos. Chem. Phys., 12, 3611–3625, 2012 www.atmos-chem-phys.net/12/3611/2012/

V. Wirth et al.: Banner clouds at Mount Zugspitze 3615
5 7 9 11 13 15 17 19 210
10
20
30
40
50
60all months
Time of day (CET)
Num
ber o
f eve
nts
0 0.2 0.4 0.6 0.8 10
10
20
30
40
50
60
70
80
all months
Time of day (fraction of obs time)
Num
ber o
f eve
nts
(a) (b)
Fig. 5. Distribution of the time of occurrence of the observed banner cloud events. Panel (a) bins the different
events in terms of the hour of occurrence in CET, while panel (b) bins the different events in terms of time
relative to the “daily observation time”, which is essentially the time between sunrise and sunset. The error bars
represent the statistical error; they are equal to ±√
n, with n denoting the number of events in each bin.
a hypothetical distribution which one would obtain by assuming that the total number of observed
banner cloud days is distributed according the length of the daily observation time. Comparing
these two distributions reveals that the seasonal cycle of observed banner cloud days is significantly
stronger than the seasonal cycle of the daily observation time. We conclude that the probability of175
occurrence of a banner cloud day has a distinct seasonal cycle: it is significantly larger during the
warm season than during the cold season.
What is the underlying reason for these distinct diurnal and seasonal cycles of banner cloud oc-
currence? In this context, the availability of moisture is expected to play an important role. For this
reason we used the humidity data from the summit (see section 2.2) in order to compute a clima-180
tology of the diurnal and the seasonal cycles of relative humidity. The results are shown in figure 7
a and b, respectively. Except in the winter season, the diurnal cycle shows a pronounced minimum
few hours after sunrise, followed by a monotonic increase, reaching a maximum in the late afternoon
or early evening; at night the values are intermediate. Restricting attention to the daylight hours, the
rise of relative humidity during the day is similar to the increase of banner cloud occurrence in figure185
5b. Presumably, the decrease in relative humidity during the morning hours results from a tempera-
ture increase due to solar radiation, which heats the ground and the air adjacent to the ground. The
increase in relative humidity during the day is likely to result from — on average — the onset of
thermal circulations, which advect moister air from below up to the summit level.
Do the banner clouds have a preference for a certain wind speed or wind direction? In order to190
address this question, we analyzed wind data from the summit (see section 2.2). Climatological
information is obtained by using the full data set. In addition, wind characteristics during the pres-
9
Fig. 5. Distribution of the time of occurrence of the observed banner cloud events. Panel(a) bins the different events in terms of the hour ofoccurrence in CET, while panel(b) bins the different events in terms of time relative to the time interval of daily operations (see text). Theerror bars represent the statistical error; they are equal to±
√n, with n denoting the number of events in each bin.
1 2 3 4 5 6 7 8 9 10 11 120
2
4
6
8
10
12
14
16Number of BC events per month
Month
Num
ber o
f ban
ner c
loud
day
s
Fig. 6. Seasonal cycle of banner cloud occurrence. The dark bars indicate the average number of observed
banner cloud days as a function of climatological month (with the error bars quantifying the statistical error).
The light grey background histogram represents a hypothetical distribution for which the same total number of
events is distributed according to the length of daylight.
0 5 10 15 2060
65
70
75
80
85
90
95
100
Local time (CET)
Rela
tive
hum
idity
(in
%)
RH four seasons
DJFMAMJJASON
1 2 3 4 5 6 7 8 9 10 11 1260
65
70
75
80
85
90
95
100RH seasonal cycle
Month
Rel
ativ
e hu
mid
ity (i
n %
)
(a) (b)
Fig. 7. Climatology of relative humidity at the summit of Mt. Zugspitze: (a) diurnal cycle, and (b) seasonal
cycle. The colored dots in panel (a) indicate the time of sunrise and sunset at the middle of the respective
seasons.
10
Fig. 6. Seasonal cycle of banner cloud occurrence. The dark barsindicate the average number of observed banner cloud days as afunction of climatological month (with the error bars quantifyingthe statistical error). The light grey background histogram repre-sents a hypothetical distribution for which the same total number ofevents is distributed according to the length of daylight.
partly of convective character, or cases with only brief oc-currences of a cloud in the lee and otherwise lots of cloudsaround the ridge. For each banner cloud event we registeredthe time of onset and decay of the banner cloud. Each day onwhich at least one banner cloud event was detected is calleda banner cloud day. The numbersNbc of observed bannercloud days are given in the second column of Table1. Thetotal number of banner cloud days during the four-year pe-
riod was 170. On some of these days we observed more thanone banner cloud event, yielding a total of 221 banner cloudevents.
The mean duration of a banner cloud event was 40 min.The distribution of the duration is shown in Fig.4. It is highlyskewed with a dominance of short events of less than half anhour, but the distribution has a long tail representing a fewevents that lasted for several hours.
Banner clouds were observed throughout the day. Fig-ure 5a shows the distribution of the banner cloud events asa function of the time of day. The most frequent occur-rence of banner clouds is in the afternoon between 14:00 and18:00 CET. However, care needs to be exercised when inter-preting this histogram, since a summer day has more hours ofdaylight than a winter day. As mentioned before, our digitalcamera was operational each day approximately from 30 minbefore sunrise until 30 min after sunset. Here, we definethe duration of the daily operationsTd as the time intervalfrom 30 min before sunrise to 30 min after sunset (third col-umn of Table1). The boundaries of this interval were deter-mined for the 15th of each month and interpolated to eachday of the year. We then calibrated the time of occurrence ofeach banner cloud event with respect to the time interval ofdaily operations. The corresponding histogram is providedin Fig. 5b. Apparently, the chance of occurrence of a bannercloud event on a given day has a distinct diurnal cycle, start-ing with low values in the morning and increasing to muchlarger values in the late afternoon; the maximum rate of oc-currence during the late afternoon is almost three times aslarge as the minimum rate of occurrence in the morning. An-alyzing the individual seasons separately (no plots shown),we found approximately the same qualitative behavior for all
www.atmos-chem-phys.net/12/3611/2012/ Atmos. Chem. Phys., 12, 3611–3625, 2012

3616 V. Wirth et al.: Banner clouds at Mount Zugspitze
1 2 3 4 5 6 7 8 9 10 11 120
2
4
6
8
10
12
14
16Number of BC events per month
Month
Num
ber o
f ban
ner c
loud
day
s
Fig. 6. Seasonal cycle of banner cloud occurrence. The dark bars indicate the average number of observed
banner cloud days as a function of climatological month (with the error bars quantifying the statistical error).
The light grey background histogram represents a hypothetical distribution for which the same total number of
events is distributed according to the length of daylight.
0 5 10 15 2060
65
70
75
80
85
90
95
100
Local time (CET)
Rela
tive
hum
idity
(in
%)
RH four seasons
DJFMAMJJASON
1 2 3 4 5 6 7 8 9 10 11 1260
65
70
75
80
85
90
95
100RH seasonal cycle
Month
Rel
ativ
e hu
mid
ity (i
n %
)
(a) (b)
Fig. 7. Climatology of relative humidity at the summit of Mt. Zugspitze: (a) diurnal cycle, and (b) seasonal
cycle. The colored dots in panel (a) indicate the time of sunrise and sunset at the middle of the respective
seasons.
10
Fig. 7. Climatology of relative humidity at the summit of Mt. Zugspitze:(a) diurnal cycle, and(b) seasonal cycle. The colored dots in panel(a) indicate the time of sunrise and sunset at the middle of the respective seasons.
0 2 4 6 8 10 12 14 16 180
5
10
15
20
25
30
35
40all months
Wind speed (m/s)
Num
ber o
f eve
nts
0 90 180 270 3600
5
10
15
20
25
30
35
40
45
50all months
Wind direction (degr)
Num
ber o
f eve
nts
(a) (b)
Fig. 8. Histogram of (a) wind speed and (b) wind direction. The dark bars represent the number n associated
with banner cloud events, with the error bar denoting±√
n; the light grey background histograms represent the
respective climatologies, which have been normalized such as to contain the same total number of events. Bin
size is 1 m/s in (a) and 20◦ in (b).
ence of a banner cloud are obtained by selecting only those data which coincide with a banner cloud
event.
A histogram of wind speed for all banner cloud events is shown in figure 8a (dark bars). Ap-195
parently, banner clouds can occur for almost any wind speed. Comparing this histogram with the
corresponding climatology (light gray background histogram in fig. 8a) indicates that, given our
statistics, at least for the bulk of wind speeds |v| < 13 ms−1 there is hardly any significant differ-
ence. This suggests that the existence of a banner cloud is essentially independent of wind speed.
The histogram for wind direction is shown in figure 8b (dark bars). There are three maxima:200
two of these (approximately northerly and southeasterly) correspond to flow which is approximately
perpendicular to the ridge, from opposing directions. The third maximum is for westerly flow; in
this case the respective banner clouds occur along the ridge connecting Zugspitzeck and Schneefern-
erkopf (see fig. 2); the latter runs roughly north-south such that westerly flow corresponds to flow
at right angles to that ridge. The angle distribution in 8b broadly reflects the climatology (light grey205
background histogram), except that the banner cloud sample seems to slightly avoid the northerly
direction and slightly prefer the southeasterly direction.
4 Results from the measurement campaign
There were two banner cloud events during our intensive observation period in October 2005: the
first on October 6, and the second on October 11. The banner cloud on October 6 persisted for over210
five hours and was clearly identifiable throughout this time. The event on October 11, by comparison,
was shorter and more intermittent.
11
Fig. 8. Histogram of(a) wind speed and(b) wind direction. The dark bars represent the numbern associated with banner cloud events, withthe error bar denoting±
√n; the light grey background histograms represent the respective climatologies, which have been normalized such
as to contain the same total number of events. Bin size is 1 m s−1 in (a) and 20◦ in (b).
seasons except winter, but the number of available observa-tions was slightly too limited to provide robust statistics.
Banner clouds occurred throughout the year, although notwith the same frequency in all seasons. The dark bars inFig. 6 represent the climatology for the number of bannercloud days per month, computed from the numbers in Ta-ble 1 asNbc/Nd× (number of days per month). Apparently,there is a clear seasonal cycle with much larger numbers insummer (approx. 10 per month) than in winter (approx. 2per month). However, interpreting these numbers requirescare because, again, the seasonal cycle of the daylight timeneeds to be accounted for: at winter solstice the duration ofdaily operationsTd is around 10 h, while at summer solstice
it is around 17 h (see Table1). For this reason, the plot inFig. 6 contains another histogram (light grey) representinga hypothetical distribution which one would obtain by as-suming that the total number of observed banner cloud daysis distributed according the duration of the daily operations.Comparing these two distributions reveals that the seasonalcycle of observed banner cloud days is significantly morepronounced than the seasonal cycle of the duration of dailyoperations. We conclude that the probability of occurrenceof a banner cloud day has a distinct seasonal cycle: it is sig-nificantly larger during the warm season than during the coldseason.
Atmos. Chem. Phys., 12, 3611–3625, 2012 www.atmos-chem-phys.net/12/3611/2012/

V. Wirth et al.: Banner clouds at Mount Zugspitze 3617
What is the underlying reason for these distinct diurnaland seasonal cycles of banner cloud occurrence? In this con-text, the availability of moisture is expected to play an im-portant role. For this reason we used the humidity data fromthe summit (see Sect. 2.2) in order to compute a climatologyof the diurnal and the seasonal cycles of relative humidity.The results are shown in Fig.7a and b, respectively. Exceptin the winter season, the diurnal cycle shows a pronouncedminimum a few hours after sunrise, followed by a monotonicincrease, reaching a maximum in the late afternoon or earlyevening; at night the values are intermediate. Restricting at-tention to the daylight hours, the rise of relative humidityduring the day is similar to the increase of banner cloud oc-currence in Fig.5b. Presumably, the decrease in relative hu-midity during the morning hours results from a temperatureincrease due to solar radiation, which heats the ground andthe air adjacent to the ground. The increase in relative hu-midity during the day is likely to result from – on average– the onset of thermal circulations, which advect moister airfrom below up to the summit level.
Do the banner clouds have a preference for a certain windspeed or wind direction? In order to address this question,we analyzed wind data from the summit (see Sect. 2.2). Cli-matological information is obtained by using the full dataset. In addition, wind characteristics during the presence of abanner cloud are obtained by selecting only those data whichcoincide with a banner cloud event.
A histogram of wind speed for all banner cloud events isshown in Fig.8a (dark bars). Apparently, banner clouds canoccur for almost any wind speed. Comparing this histogramwith the corresponding climatology (light gray backgroundhistogram in Fig.8a) indicates that, given our statistics, atleast for the bulk of wind speeds|v| < 13 m s−1 there ishardly any significant difference. This suggests that the ex-istence of a banner cloud is essentially independent of windspeed.
The histogram for wind direction is shown in Fig.8b (darkbars). There are three maxima: two of these (approximatelynortherly and southeasterly) correspond to flow which is ap-proximately perpendicular to the ridge, from opposing direc-tions. The third maximum is for westerly flow; in this casethe respective banner clouds occur along the ridge connect-ing Zugspitzeck and Schneefernerkopf (see Fig.2); the latterruns roughly north-south such that westerly flow correspondsto flow at right angles to that ridge. The angle distribution in8b broadly reflects the climatology (light grey backgroundhistogram), except that the banner cloud sample seems toslightly avoid the northerly direction and slightly prefer thesoutheasterly direction.
4 Results from the measurement campaign
There were two banner cloud events during our intensive ob-servation period in October 2005: the first on 6 October, andthe second on 11 October. The banner cloud on 6 Octo-ber persisted for over five hours and was clearly identifiablethroughout this time. The event on 11 October, by compari-son, was shorter and more intermittent.
4.1 6 October 2005
The banner cloud on 6 October was clearly visible between12:30 and 18:00 CET. Wind conditions on the ridge through-out the day are displayed in Fig.9. Denoting the three-dimensional wind vector byu = (u,v,w), the wind speed(panels a and b) is given by|u| =
√u2 + v2 + w2, the angle
α with respect to the horizontal (panels e and f) is computedasα = arctan(w/
√u2 + v2), and the horizontal wind direc-
tion (panels c and d) is obtained similarly fromu andv.Throughout the day, the wind on the windward side was
blowing steadily from southeast, which is at right angles to-ward the ridge (Fig.9a and c); the wind speed during the ban-ner cloud event was between 3 and 5 ms−1 at z = 3.7 m andbetween 4 and 6 ms−1 at z = 9 m, indicating a distinct ver-tical shear. By contrast, on the leeward side the wind direc-tion was not at right angle towards the ridge; the wind speedwas between 1 and 1.5 ms−1 at bothz = 3.7 m andz = 9 m(Fig. 9b) with large fluctuations in direction (Fig.9d). Theangleα is close to 45◦ on the southern side throughout theday (Fig.9e), while it features a broad distribution on thenorthern side (Fig.9f). Note, however, that on average thevertical component on the leeward side is upward, too. In-terestingly, the termination of the banner cloud event around18:00 CET is accompanied by an increase in wind speed onboth the windward and the leeward side (panels a and b) anda change in direction on the leeward side (panels d and f).This suggests that the termination of this banner cloud maybe at least partly due to a change in the dynamical conditions.
In addition to the measurements on the ridge, we obtainedwind profiles above the Zugspitzplatt from the pilot balloonascents in the late morning and early afternoon (not shown).They indicated flow from east to southeast with large fluctua-tions of wind speed (both in time and space), increasing – onaverage – from about 3–4 ms−1 right above the surface (at2575 m altitude) to 6–8 ms−1 some 300 m above the surface.
Thermodynamic conditions during 6 October 2005 aresummarized in Fig.10. Panel d shows time series of temper-ature on both sides of the ridge. Interestingly, during the pe-riod of the banner cloud event (gray shading) the temperatureon the leeward side (blue) is up to 2 degrees higher than onthe windward side (red). On the other hand, the temperaturedifference between both sides is significantly less during therest of the day. Regarding moisture (not shown), the leewardair mass is saturated throughout most of the day, while thewindward airmass has a relative humidity varying between
www.atmos-chem-phys.net/12/3611/2012/ Atmos. Chem. Phys., 12, 3611–3625, 2012

3618 V. Wirth et al.: Banner clouds at Mount Zugspitze
(a) (b)
(c) (d)
(e) (f)
Fig. 9. Wind observations from the masts on both sides of the ridge on 6 October 2005. The left column
represents the southern side, the right column represents the northern side of the ridge. (a) and (b): wind
speed (in m/s), (c) and (d): wind direction (in degrees), (e) and (f) angle of the wind vector with respect to the
horizontal (in degrees). Red color represents measurements at 3 m above ground, while blue color represents
measurements at 9 m above ground. The straight gray lines in (c) and (d) indicate the direction corresponding
to oncoming flow at right angles to the ridge; the straight grey lines in (e) and (f) indicate strictly horizontal
flow. The thick solid blue and red lines in panels (c) through (f) delineate one-hour running means. The period
during which a banner cloud was observed is denoted by gray shading.
13
Fig. 9. Wind observations from the masts on both sides of the ridge on 6 October 2005. The left column represents the southern side, theright column represents the northern side of the ridge.(a) and(b): wind speed (m s−1), (c) and(d): wind direction (degrees),(e) and(f):angle of the wind vector with respect to the horizontal (degrees). Red color represents measurements at 3.7 m above ground, while blue colorrepresents measurements at 9 m above ground. The straight gray lines in(c) and(d) indicate the direction corresponding to oncoming flowat right angles to the ridge; the straight grey lines in(e) and(f) indicate strictly horizontal flow. The thick solid blue and red lines in panels(c) through(f) delineate two-hour running means using a Hann window. The period during which a banner cloud was observed is denotedby gray shading.
Atmos. Chem. Phys., 12, 3611–3625, 2012 www.atmos-chem-phys.net/12/3611/2012/

V. Wirth et al.: Banner clouds at Mount Zugspitze 3619
Abbildung 2: Höhe aufgetragen gegen θ und qv für den 06.10.05., mit vertikaler
Achse bis 4 km
5
Abbildung 5: Höhe aufgetragen gegen lcl für den 06.10.05.(Gegenüberstellung von
Aufstiegen 1,2 und 3), mit vertikaler Achse bis 4 km
8
Abbildung 60: Höhe aufgetragen gegen θ. 06.10.05., Auf- und Abstieg gemittelt
63
(a) (b)
(c) (d)
Fig. 10. Observations of thermodynamic conditions on 6 October 2006. (a) Profiles of potential temperature
θ (solid) and specific humidity qv (dashed) from a radiosonde ascent made at the foot of Mount Zugspitze in
Garmisch-Partenkirchen at 16:44 CET (start time). Layers which are absolutely stable are indicated by grey
shading. (b) Profiles of lifting condensation level zLCL as a function of altitude, computed from two radiosonde
ascents: no. 1 (dashed) was started at 7:47 CET, no. 2 (dotted) was started at 11:25 CET, no. 3 (solid) was started
at 16:44 CET. The latter corresponds to the ascent shown in (a). (c) Profiles of potential temperature θ from
a Kali flight at 14:41 CET (start time). There are two profiles, one representing ascent and the other one
representing descent of the aircraft. Take-off of the aircraft is denoted by an asterisk, and the altitude of the
ridge is denoted by a straight dotted line. (d) Time series of temperature on the southern (red) and northern
(blue) side of the ridge at z = 9 m above ground. The period during which the banner cloud was observed is
indicated by gray shading.
14
Fig. 10. Observations of thermodynamic conditions on 6 October 2006.(a) Profiles of potential temperatureθ (solid) and specific humidityqv (dashed) from a radiosonde ascent made at the foot of Mount Zugspitze in Garmisch-Partenkirchen at 16:44 CET (launch time). Layerswhich are absolutely stable are indicated by grey shading.(b) Profiles of lifting condensation levelzLCL as a function of altitude, computedfrom the three radiosonde ascents which were made during the day. The legend for the different lines denotes the respective launch time. Thelatest ascent (solid line) corresponds to the ascent shown in(a). (c) Potential temperatureθ from a Kali flight at 14:41 CET (launch time).The profile was computed as an average between the values from the ascent and the descent of the aircraft in order to minimize hysteresiseffects; in addition, the profile was smoothed with a Hann window over 5 adjacent altitude bins. Take-off of the aircraft is denoted by anasterisk, and the altitude of the ridge is denoted by a straight dotted line.(d) Time series of temperature on the southern (red) and northern(blue) side of the ridge atz = 9 m above ground. The period during which the banner cloud was observed is indicated by gray shading.
90 and 100 %. During the period of the banner cloud, bothsides are close to saturation, but again the leeward air massis overall somewhat moister than the windward airmass.
The profiles from the radiosonde ascent (Fig.10a) indi-cate a well-mixed boundary layer below 1300 m. The levelof the Zugspitze summit belongs to the free tropospherewhere potential temperature gradually increases and specific
www.atmos-chem-phys.net/12/3611/2012/ Atmos. Chem. Phys., 12, 3611–3625, 2012
3620 V. Wirth et al.: Banner clouds at Mount Zugspitze
humidity gradually decreases with altitude. The boundarylayer is topped by a strong inversion atz = 1400 m, andthere is an indication for a second weak inversion at aroundz = 3400 m a.s.l. Computing equivalent potential tempera-ture θe (not shown) we obtained a profile which is ratherclose to a constant, with values varying between 315 K inthe lowest part of the atmosphere and 313 K atz = 3000 m(i.e. at the level of the summit of Mt. Zugspitze). Analysingthe radiosonde data we found essentially two layers with ab-solute stability, i.e. layers where the lapse rateγ = −∂T /∂z
is smaller than the moist adiabatic lapse rate (grey shadingin Fig. 10a): one in the lower troposphere and a second onefor 3300 m< z < 3700 m. Combining the temperature andmoisture information from the radiosonde profiles we com-puted the lifting condensation level (zLCL) associated witheach altitude level (Fig.10b). Overall, these profiles turn outto be increasing functions with altitude, indicating that theair is not well mixed in the vertical. In order to reach satura-tion at the summit level during the banner cloud event (solidline), a parcel would have to come from below 1850 m alti-tude. Earlier at 11:25 CET (dotted line), when there was nobanner cloud present, a parcel would have to come from be-low 1500 m, which is unlikely as it would have had to crossthe strong inversion.
The radiosonde ascent shown in Fig.10a was downwindof the banner cloud event, and we take it as a rough indi-cation for the typical environmental atmospheric conditions.In contrast, the Kali measurements shown in Fig.10c weretaken upwind of the banner cloud event; the correspondingpotential temperature profiles are broadly consistent with themeasurements from the radiosonde.
4.2 11 October 2005
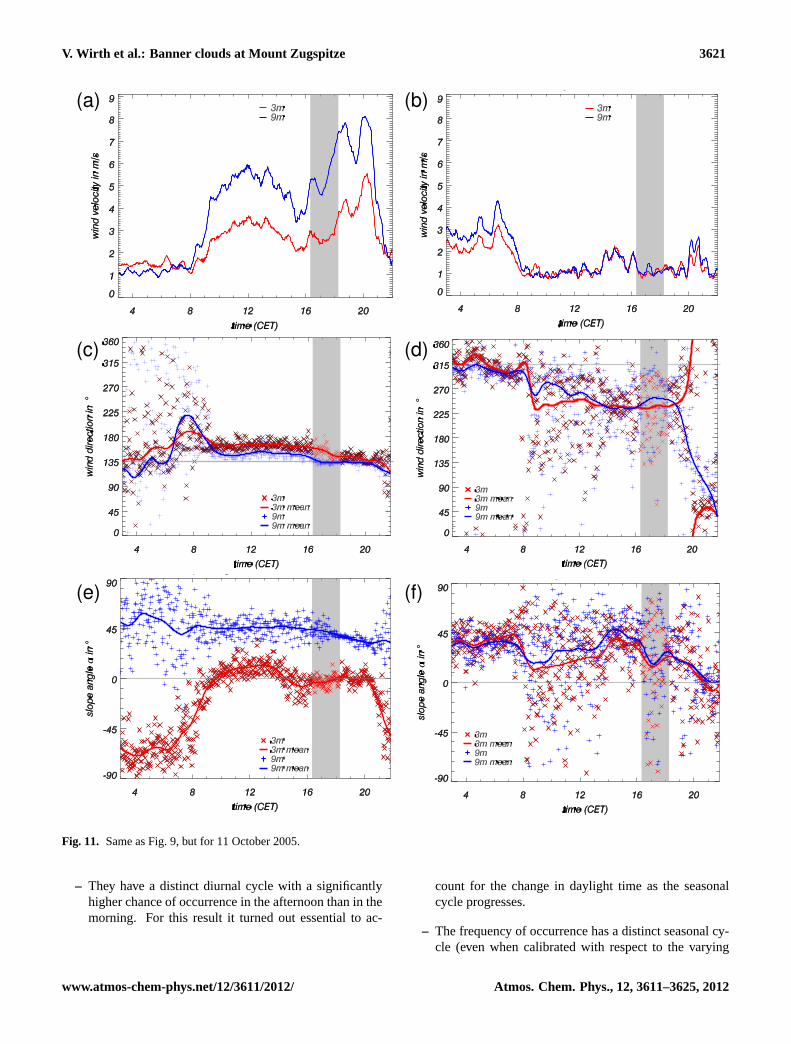
The banner cloud on 11 October was visible between 16:20and 18:10 CET, but it showed a rather intermittent behavior atthe measurement site on the ridge. The background wind onthat day turned from a northwesterly to a southeasterly direc-tion at around 08:00 CET, as can be inferred from a changein wind direction and concomitant fluctuations at that time(Fig. 11c, d, e, and f). Simultaneously there is a conspic-uous change in wind speed (Fig.11a and b) resulting fromthe change in wind direction in combination with the steeporography.
Like on 6 October, we obtained wind profiles above theZugspitzplatt from pilot balloon ascents in the late morningand early afternoon of 11 October (not shown). Here, the di-rection was southerly to southeasterly. The wind speed indi-cated, again, large fluctuations in time and space, increasingon average from about 2–3 ms−1 right above the surface (at2550 m altitude) to about 3 ms−1 some 300 m above the sur-face. This is weaker than on 6 October, consistent with thegenerally weaker wind on the ridge (cf. Figs.9a and11a).
Time series of temperature on the ridge are shown inFig. 12d. The temperature on the leeward side (blue) ex-
ceeds that on the windward side (red) during most of the ban-ner cloud event. This is qualitatively like on 6 October, buton 11 October the temperature excess is less than 1 K anddoes not stand out as clearly as on 6 October (cf. Fig.10d).Incidentally, there is a reversed temperature difference dur-ing the morning hours in Fig.12d with temperatures on thesouthern side exceeding those on the northern side by one totwo degrees. Such a temperature difference was repeatedlyobserved on other days, too. It is almost certainly due to theinfluence of solar radiation leading to higher temperatures onthe southern side of the ridge (which is exposed to the sun)than on its northern side (which lies in the shade). Althoughboth 6 and 11 October were sunny during the morning hours,the effect of insolation on the temperature is not noticeableon 6 October (as opposed to 11 October, compare Fig.10dand 12d), because on 6 October a strong wind was blow-ing from a southeasterly direction (see Fig.9). On the otherhand, on 11 October the southern side was in the lee untilabout 9 CET (see Fig.11) and the wind speed was very smalluntil that time, which – in combination with insolation – ledto higher temperatures.
Regarding moisture during the banner cloud event (notshown), the leeward airmass was clearly saturated, while thewindward airmass was subsaturated with relative humidityranging between 85 and 95 %.
The radiosonde profiles on 11 October (Fig.12a) show,again, a rather shallow boundary layer, topped by an in-version at 1100 m (i.e. approximately 400 m above the val-ley floor). There is another strong inversion some 250 mabove the Zugspitze summit, and a third inversion aroundz = 4000 m. The profile of specific humidity (dashed) in-dicates that the atmosphere belowz =1200 m is very moist,decreasing to somewhat smaller values up toz =3300 m, andthen decreasing to much smaller values above. The strong in-version just above the summit level is in distinct contrast tothe situation on 6 October.
5 Conclusions
This paper reports about comprehensive observations whichwere taken in order to investigate banner clouds at MountZugspitze. The observations are partly complementary pro-viding both climatological information regarding the generaloccurrence of banner clouds as well as detailed measure-ments from two specific banner cloud events.
From our climatological analysis, we obtained the follow-ing results for the banner clouds at Mount Zugspitze:
– They typically last for less than an hour (40 min on aver-age), but the distribution has a long tail with rare eventsextending over several hours.
Atmos. Chem. Phys., 12, 3611–3625, 2012 www.atmos-chem-phys.net/12/3611/2012/
V. Wirth et al.: Banner clouds at Mount Zugspitze 3621
(a) (b)
(c) (d)
(e) (f)
Fig. 11. Same as figure 9, but for 11 October 2005.
16
Fig. 11. Same as Fig.9, but for 11 October 2005.
– They have a distinct diurnal cycle with a significantlyhigher chance of occurrence in the afternoon than in themorning. For this result it turned out essential to ac-
count for the change in daylight time as the seasonalcycle progresses.
– The frequency of occurrence has a distinct seasonal cy-cle (even when calibrated with respect to the varying
www.atmos-chem-phys.net/12/3611/2012/ Atmos. Chem. Phys., 12, 3611–3625, 2012

3622 V. Wirth et al.: Banner clouds at Mount Zugspitze
Abbildung 7: Höhe aufgetragen gegen θ und qv für den 11.10.05., mit vertikaler
Achse bis 4 km
10
Abbildung 10: Höhe aufgetragen gegen lcl für den 11.10.05.(Gegenüberstellung von
Aufstiegen 1,2 und 3), mit vertikaler Achse bis 4 km
13
Abbildung 62: Höhe aufgetragen gegen θ und qv. 11.10.05., Auf- und Abstieg ge-
mittelt
65
(a) (b)
(c) (d)
Fig. 12. Same as figure 10, but for 11 October 2005. The radiosonde ascent in (a) was at 14:24 CET (start
time). In panel (b), start time of ascent no. 1 (dashed) was 7:36 CET, start time of ascent no. 2 (dotted) was
11:33 CET, and start time of ascent no. 3 (solid) was 14:24 CET. The latter corresponds to the ascent shown in
(a). The Kali flight in (c) was at 15:00 CET (start time); this panel shows both potential temperature (solid) and
specific humidity (dashed).
18
Fig. 12. Same as Fig.10, but for 11 October 2005. The radiosonde ascent in(a) was at 14:24 CET (launch time), corresponding to thesolid line in panel(b). The Kali flight in(c) was at 15:00 CET (launch time); this panel shows both potential temperature (solid) and specifichumidity (dashed).
length of the day), with an increased frequency duringthe warm season and a decreased frequency during thecold season.
– Both the diurnal and the seasonal cycle of banner cloudoccurrence have close analogs in similar behavior of cli-matological relative humidity. This suggests that themoisture availability is a key ingredient with highermoisture conditions favoring banner cloud occurrenceon average.
– The banner clouds do not have any significant prefer-ence regarding wind speed. However, there is a slight
preference regarding wind direction, favoring south-easterly flow and avoiding northerly flow.
Our time lapse movies do not allow to make any statementabout the occurrence of banner clouds at night. The basicdynamical processes which are believed to be important forbanner cloud occurrence are independent of the presence ofdaylight. This suggests that banner clouds occur also duringthe night, and indeed beautiful samples of this phenomenonhave been observed repeatedly by one of us (M. Kristen).On the other hand, thermodynamic conditions, in particularthe availability of moisture at the summit level, changes bothwith season and with the time of day (which is reflected in
Atmos. Chem. Phys., 12, 3611–3625, 2012 www.atmos-chem-phys.net/12/3611/2012/

V. Wirth et al.: Banner clouds at Mount Zugspitze 3623
the pronounced diurnal and seasonal cycles of banner cloudoccurrence that we obtained). The rate of occurrence at nightmay, therefore, differ from the rate of occurrence duringthe day.
The slight preference of banner clouds for southeasterlywind direction, which is consistent with the report ofHauer(1949), may be associated with the complex orography ofMount Zugspitze. In particular, a vertical section cutting atright angles through the ridge, where measurements weretaken, indicates a rather precipitous drop in altitude on thenorthern side, while the southern side is characterized bythe “Zugspitzplatt”, which is sort of a high plateau that onlygradually leads to lower altitudes. This provokes the hypoth-esis that the asymmetry in terrain is responsible for the ob-served sensitivity regarding wind direction. We are planningto test this hypothesis using simulations with both idealizedand realistic orography.
We were surprised to find banner clouds for virtually anywind speed, with no significant preference for larger values.This is in striking contrast to numerous earlier authors whounanimously contend that banner clouds tend to occur forstrong wind (Hann, 1896; Douglas, 1928; Geerts, 1992a).The fact that banner clouds do not have a preference forstronger wind speed renders the Bernoulli hypothesis (seeintroduction) implausible. That hypothesis posits that thepressure decrease along quasi-horizontal trajectories dictatedby conservation of the Bernoulli function, and the associatedadiabatic cooling, may lead to banner cloud formation. Ifthat hypothesis were to be true, banner clouds should havea preference for stronger wind speeds, because in that casethe pressure drop would be larger thus increasing the likeli-hood for cloud formation. Our observations do not provideany indication for such a dependence, and we conclude thatthe Bernoulli hypothesis does probably not capture the ma-jor mechanism for banner cloud formation. The Bernoullihypothesis appears implausible for other reasons, too. Aback-of-the-envelope calculation indicates that a vertical up-lift within the lee vortex on the order of 100 m is associatedwith a much larger pressure drop than an increase in windspeed on the order of a few m s−1. This is also consistentwith our preliminary numerical simulations, which indicatea negative pressure anomaly (with respect to a hydrostaticreference state) in the lee; although this “helps” to producea cloud in the lee, the amplitude of this anomaly is only afew Pascals, and this is at least two orders of magnitude lessthan the pressure drop expected from a vertical uplift of some100 m.
The detailed observations of two specific banner cloudevents in October 2005 featured the following results:
– The windward and the leeward side of the ridge werecharacterized by different wind regimes. On the wind-ward side the wind was strong, its direction was steady,and it had vertical shear between 3 and 9 m; on the lee-ward side the wind was much weaker with large scatter
in wind direction and no vertical shear on average. Thisis consistent withScorer(1955), who mentions “shel-tered regions with almost stagnant air” in the lee of ob-stacles. We also found that the wind was upward onboth sides of the ridge, corresponding to flow towardsthe ridge following the local terrain.
– The banner cloud episodes – most of the time – did notshow signs of significantly changed wind regime com-pared to the time just before and just after the bannercloud event. This suggests that it is mostly the ther-modynamic conditions (especially moisture) that weresubtly different during the banner cloud event comparedwith before and afterwards. However, at one of thetwo banner cloud occurrences the termination coincidedwith a slight change in wind conditions, indicating thatoccasionally the dynamics may play a role for the onsetor the termination of a banner cloud.
– The banner cloud episodes showed a windward-leewarddifference in relative humidity, with the leeward side be-ing saturated and the windward side being mostly sub-saturated. Of course this is not surprising; rather, it is asimple consequence of our definition of a banner cloud,requiring that the cloud should occur on one side of themountain (or ridge) only. More interesting was the ob-servation that the banner cloud episodes were charac-terized by higher temperatures (by some 1 to 2◦) onthe leeward (cloudy) side compared to the windward(cloudfree) side. As a consequence, specific humiditywas significantly higher on the leeward (cloudy) sidecompared to the windward (cloudfree) side
– The background atmosphere in both cases indicated aninversion several hundred meters above the summit ofMount Zugspitze associated with a layer of absolute sta-bility. This clearly prevents convection to extend muchbeyond the summit altitude. Without such a stable layerthe cloud on the leeward side might easily develop amore convective character; the latter, however, wouldexclude the cloud from being categorized as a bannercloud (see the definition ofSchween et al.2007).
Our observations indicating both moister and warmer air inthe lee are consistent with the idealized Large Eddy Simula-tions of a banner cloud made byReinert and Wirth(2009).The authors assumed a horizontally homogeneous reference(initial) atmosphere. In their simulations the pronouncedasymmetry in Lagrangian vertical displacement resulted inmuch larger uplift on the leeward side in comparison withthe windward side. The temperature excess in the cloudy aircould be traced back essentially to the release of latent heatwithin the cloud. This view is also supported by our obser-vations of the thermodynamic properties of the backgroundatmosphere: in both cases higher levels were associated withhigher lifting condensation levels than lower levels. It fol-lows that a cloudy parcel at summit level must have suffered
www.atmos-chem-phys.net/12/3611/2012/ Atmos. Chem. Phys., 12, 3611–3625, 2012

3624 V. Wirth et al.: Banner clouds at Mount Zugspitze
a larger uplift than a cloud-free parcel. Again, this is consis-tent with a significant difference in Lagrangian vertical dis-placement on the two sides of the ridge. Note that this argu-ment implicitly assumes that the environmental atmosphereis horizontally homogeneous; our observations seem to beconsistent with this assumption.
According toReinert and Wirth(2009), favorable condi-tions for banner clouds include both a (dry) dynamical aspectand a (moist) thermodynamical aspect. The present worksuggests that given suitable orography and wind direction,the dynamical conditions are rather easy to satisfy. In ad-dition, however, the moisture conditions, too, must be justright, and this seems to be the harder to satisfy. In par-ticular, the free atmosphere at Mount Zugpitze in winter isoften rather dry on otherwise cloud-free days, which pre-vents banner cloud formation; in summer, on the other hand,the atmospheric boundary layer is likely to be much deeper,thus bringing moist air from below close to the summit ofthe mountain and increasing the likelihood for banner cloudformation. Overall, this view renders it plausible why ban-ner clouds, albeit regularly occurring, are not a very frequentphenomenon.
We caution that some of our results may be specific to theconditions at Mount Zugspitze. For instance, it is unclearto what extent the correlations between banner cloud occur-rence and relative humidity regarding the diurnal and sea-sonal cycle apply to other mountains. Similarly, the prefer-ence of banner clouds for certain wind directions is believedto depend, at least to some extent, on the specific orographyof the mountain under consideration.
In summary, this paper provided, for the first time,comprehensive observations of banner clouds at MountZugspitze. The observations are consistent with the notionthat banner clouds essentially form in the upwelling part of alee vortex like in the simulations ofReinert and Wirth(2009).The next steps would be to investigate to what extent the con-ditions at Mount Zugspitze are generic and apply to othersites of banner cloud occurrences. Progress in this direc-tion can be made through similar observations at other sites,or through numerical simulations. The latter should benefitfrom the results presented in this paper.
Acknowledgements.This work involved substantial help fromnumerous people. The installation of the masts in the rugged terrainon the ridge would not have been possible without the supportof Andreas Oppenrieder, Sonja Stangl, and Markus Garhammer.We thank the Austrian Telekom for giving us access to the powersupply at their relay mast. Preliminary data analysis was done byAlexandra Mittermeyer. Essential help during the measurementcampaign was provided by Markus Ablinger, Matthias Zink,Claudia Schmidt, Lars Wiegand, Hilbert Wendt, Heinz Lossleinand Robert Goler. The Kali airplane was operated by HansAschenbrenner and Phillip Kolb. We thank Julia Schreiber forevaluating the banner cloud movies. The German Weather Service
kindly provided the data from the summit of Mount Zugspitze.This work was supported by the German Research Foundationgrant Wi 1685/5-1, Wi 1685/5-4, and RE 1710/1-1.
Edited by: T. J. Dunkerton
References
Beer, T.: Atmospheric Waves. Adam Hilger Ltd., London, 315 pp.,1974.
Douglas, C.: Some alpine cloud forms, Quart. J. Roy. Met. Soc., 54,175–178, 1928.
Egger, J., Bajrachaya, S., Egger, U., Heinrich, R., Reuder,J., Shakya, P., Wendt, H., and Wirth, V.: Diurnal winds in theHimalayan Kali Gandaki valley. Part I: Observations, Mon. Wea.Rev., 128, 1106–1122, 1999.
Egger, J., Heinrich, R., Kolb, P., Mech, M., Reuder, J., Schween,J., Wendt, H., Bajrachaya, S., Shakya, P., Lammlein, S.,and Schaper, W.: Diurnal Winds in the Himalayan Kali Gan-daki Valley, Part III: Remotely Piloted Aircraft Soundings, Mon.Wea. Rev., 130, 2042–2058, 2002.
Geerts, B.: The origin of banner clouds: a case of scientific amne-sia?, Bull Austr. Meteorol. Ocean. Soc., 5, 6–9, 1992a.
Geerts, B.: The origin of banner clouds: a potential vorticity per-spective. Preprint volume, Sixth Conference on Mountain Me-teorology, American Meteorological Society, Portland, Oregon(USA), 97–98, 29 Sept–2 Oct, 1992.
Glickman, T. S.: Glossary of Meteorology, American Meteorolog-ical Society, 855 pp., Boston, Massachusetts, USA, 2nd Edn.,2000.
Grant, H. D.: Clouds and Weather Atlas, Cowand-McCann, 294 pp.,New York, USA, 1944.
Hann, J.: Allgemeine Erdkunde, Druck von Gebruder Stiepel, Re-ichenberg, 1896.
Hauer, H.: Ein schauerauslosender Sogeffekt auf der Zugspitze,Met. Rundschau, 2, 326–327, 1949.
Hindman, E. E. and Wick, E. J.: Air motions in the vicinity of Mt.Everest as deduced from pilatus porter flights, Technical Soar-ing, 14, 52–56, 1990.
Humphreys, W. J.: Physics of the air, McGraw-Hill, 1st Edn.,702 pp., The Franklin Institute Press of J. B. Lippincott Com-pany, Philadelphia, 1920.
Huschke, R. E. (ed.): Glossary of Meteorology. American Meteo-rological Society, Boston, Massachusetts (USA), viii + 638 pp.,1959.
Kuttner, J.: Erinnerungen 1945–1948, in: Die Geschichte derWetterstation Zugspitze; Geschichte der Meteorologie, editedby: Wege, K., 4, 70–75, Selbstverlag des Deutschen Wetterdi-enstes, Offenbach/Main, Germany, 2000.
Peppler, W.: Hinderniswolken am Santisgipfel, Das Wetter, 44,212–213, 1927.
Reinert, D. and Wirth, V.: A new LES model for simulating airflow and warm clouds above highly complex terrain, Part II: Themoist model, Bound.-Lay. Meteorol., 133, 113–136, 2009.
Atmos. Chem. Phys., 12, 3611–3625, 2012 www.atmos-chem-phys.net/12/3611/2012/

V. Wirth et al.: Banner clouds at Mount Zugspitze 3625
Schween, J. H., Kuettner, J., Reinert, D., Reuder, J., and Wirth, V.:Definition of “banner clouds” based on time lapse movies, At-mos. Chem. Phys., 7, 2047–2055,doi:10.5194/acp-7-2047-2007,2007.
Scorer, R. S.: Theory of airflow over mountains: IV – separationof flow from the surface, Quart. J. Roy. Met. Soc., 81, 340–350,1955.
www.atmos-chem-phys.net/12/3611/2012/ Atmos. Chem. Phys., 12, 3611–3625, 2012