
Banking across Borders with Heterogeneous Banks · borders, banking sector e ciencies and returns...
55
This paper presents preliminary findings and is being distributed to economists and other interested readers solely to stimulate discussion and elicit comments. The views expressed in this paper are those of the author and are not necessarily reflective of views at the Federal Reserve Bank of New York or the Federal Reserve System. Any errors or omissions are the responsibility of the author. Federal Reserve Bank of New York Staff Reports Banking across Borders with Heterogeneous Banks Friederike Niepmann Staff Report No. 609 April 2013
Transcript of Banking across Borders with Heterogeneous Banks · borders, banking sector e ciencies and returns...

This paper presents preliminary findings and is being distributed to economists and other interested readers solely to stimulate discussion and elicit comments. The views expressed in this paper are those of the author and are not necessarily reflective of views at the Federal Reserve Bank of New York or the Federal Reserve System. Any errors or omissions are the responsibility of the author.
Federal Reserve Bank of New York Staff Reports
Banking across Borders with Heterogeneous Banks
Friederike Niepmann
Staff Report No. 609 April 2013

Banking across Borders with Heterogeneous Banks Friederike Niepmann Federal Reserve Bank of New York Staff Reports, no. 609 April 2013 JEL classification: F12, F21, F23, G21
Abstract Individual banks differ substantially in their foreign operations. This paper introduces heterogeneous banks into a general equilibrium framework of banking across borders to explain the documented variation. While the model matches existing micro and macro evidence, novel and unexplored predictions of the theory are also strongly supported by the data: The efficiency of the least efficient bank active in a host country increases the greater the impediments to banking across borders and the efficiency of the banking sector in the host country. There is also evidence of a tradeoff between proximity and fixed costs in banking. Banks hold more assets and liabilities in foreign affiliates relative to cross-border positions if the target country is further away and the cost of foreign direct investment is low. These results suggest that fixed costs play a crucial role in the foreign activities of banks. Key words: cross-border banking, heterogeneity, multinational banks, foreign direct investment, trade in services _________________
Niepmann: Federal Reserve Bank of New York (e-mail: [email protected]). The author is grateful to Andrew Bernard, Giancarlo Corsetti, and Russell Cooper for advice and encouragement. For their helpful comments, she also thanks Silja Baller, Tim Schmidt-Eisenlohr, Jan-Peter Siedlarek, and participants in seminars at the Federal Reserve Bank of New York, the European University Institute, and the University of Oxford. Special thanks go to Deutsche Bundesbank, where part of this paper was written while Niepmann was a visiting researcher. The views expressed in this paper are those of the author and do not necessarily reflect the position of the Federal Reserve Bank of New York or the Federal Reserve System.

1 Introduction
Banks differ substantially with respect to their foreign operations. Larger and more efficient
banks are more likely to lend and borrow abroad (see table 1).1 They also engage more often
in foreign direct investment. Similarly, bank size and efficiency have a positive effect on the
intensive margins. Larger banks hold more foreign assets and liabilities on their domestic
balance sheets as well as on the balance sheets of their foreign affiliates.2
This paper develops a general equilibrium model of trade and foreign direct investment
(FDI) in banking to explain this heterogeneity. Building on Niepmann (2012), I establish
a link between bank efficiency, size and the foreign operations of banks in a model where
banking across borders arises from differences in banking sector efficiencies and differences in
relative factor endowments between countries. Beyond matching the observed covariation of
the extensive and the intensive margins to bank size and efficiency, the model predicts how
the foreign activities of individual banks vary with host country characteristics. Drawing on
German bank-level data, I find strong support for these new implications of the theory.
In the model, banks have two roles. First, they channel capital from depositors to
firms. Second, banks monitor firms at a cost. Monitoring costs differ across banks that
are not observable by depositors, similar to the structure in Holmstrom and Tirole (1997).
To credibly commit to monitor, banks invest their own capital in the client firms. Banks
with higher monitoring efficiency are able to intermediate more external capital for the same
amount of equity capital and make higher profits.3
This microstructure carries over to the open economy where countries differ in their
relative endowments of capital and labor and in aggregate banking sector efficiency. These
differences cause the return on loans that banks earn and the rate on deposits they have to
pay to vary across countries. When capital accounts and banking sectors are open, banks
1For details on table 1, see the discussion on page 23.2Equivalent relationships have been documented in depth for manufacturing firms. See Bernard et al.
(2012) for a recent survey of empirical works on firm heterogeneity and international trade. Buch, Koch andKoetter (2011) show that size and efficiency also matter for the cross-border lending activities and FDI ofbanks. Table 1 confirms these findings providing additional evidence on the intensive and extensive marginsof foreign borrowing.
3In the model, bank capital is fixed and cannot relocate from one bank to the other preventing the mostefficient bank from serving the entire market.
1

lend and borrow across borders to maximize the return on loans and to minimize funding
costs.
Banks have the choice between two different modes to serve foreign markets. They can
either lend and borrow across borders, or they can invest in FDI. It is assumed that the fixed
costs of cross-border lending and borrowing are lower than the fixed cost of FDI and that
banks save on variable costs by opening up a foreign branch. As more efficient banks have
larger lending volumes and make higher profits, only they are able to cover the higher fixed
costs. Sorting similar to Melitz (2003) and Helpman, Melitz and Yeaple (2004) emerges: the
most efficient banks establish foreign affiliates abroad, while less efficient banks only engage
in cross-border lending and borrowing. Banks at the lower end of the efficiency distribution
remain domestic.
When the two banking sectors become integrated and banks borrow and lend across
borders, banking sector efficiencies and returns to capital equilibrate. Capital relocates from
the capital abundant to the capital scarce country. In the country that hosts the more
efficient banking sector, new banks enter. In the other country, the least efficient banks
exit and are replaced by foreign banks. Through these mechanisms, banking across borders
affects the equilibrium bank size distribution. Because banks that go global can increase the
return on loans and lower funding costs, their balance sheets expand. As a consequence, the
bank size distribution becomes more unequal.
The theory delivers rich predictions on the foreign positions of single banks. These depend
on bank characteristics (efficiency) as well as home and host country variables. I focus on
novel bank-level implications of the model that can be tested using disaggregated data. In
particular, I analyze how the cross-border lending cutoff, the cross-border borrowing cutoff
and the FDI cutoff vary with the costs of operating abroad as well as with factor endowments
and banking sector efficiency in the host country.
For the empirical analysis, I draw on data from the so-called Auslandsstatus-Report
provided by Deutsche Bundesbank, which collects information on the foreign activities of all
German banks and their affiliates in a large number of countries. In order to measure the
efficiency of single banks, three different proxies are used: a bank’s overhead costs to total
2

assets, its size and its labor productivity.
The first set of empirics shows that sorting on host country characteristics is consistent
with the model: the efficiency of the least efficient bank that engages in cross-border borrow-
ing and lending increases the further away the host market and the higher the fixed costs of
operating abroad measured inversely by the bureaucratic quality and the financial freedom in
the host country. While this pattern may also arise in alternative models with corresponding
cost structures, the empirical findings support specific implications of the presented theory:
the efficiency of the least efficient bank that holds cross-border liabilities in a market increases
with bank efficiency and the return to capital in the host market. Complementing Niepmann
(2012), this provides additional evidence for the relevance of banking sector efficiencies and
relative factor endowments in determining foreign bank positions and supports an approach
to banking across borders drawing on concepts from international trade in goods.
In the second part of the empirical analysis, I analyze the firms’ decision between op-
erating cross-border and operating through FDI. The results indicate that banks face a
proximity-fixed cost tradeoff: they operate more through foreign affiliates, the further away
the host market and the lower the cost of serving foreign customers through FDI.
These empirical findings suggest that fixed costs play a crucial role for the foreign ac-
tivities of banks. In the broader context of the current debate among policy makers and
researchers on optimal bank size, the results imply that banks have to have a certain size to
channel capital across borders. Moreover, larger banks are the ones that may bring better
technology to host markets.4
Related Literature This research contributes to the growing literature on cross-border
banking. Similar to Niepmann (2012), this paper takes a trade approach modeling Heckscher-
Ohlin endowment differences and Ricardian technology differences, which drive banking
across borders. In contrast to the aforementioned work, the framework presented here ex-
hibits imperfect competition and allows for bank-level heterogeneity.
The paper also relates to Ennis (2001) who incorporates a moral hazard problem at the
4See, e.g., an article in the New York Times from October 2012:http://dealbook.nytimes.com/2012/10/15/fed-governor-offers-a-way-to-limit-bank-size/
3

side of bankers in a multi-regional banking model, focussing on the effect of integration on
the size distribution of banks. In his model, banks differ with respect to equity, in contrast
to the efficiency differences modeled here. Banking across regions allows the bank with the
largest equity to diversify lending, which relaxes information problems and increases profits.
De Blas and Russ (2010, 2012) study the effects of financial liberalization on banks’ loan
pricing and the distribution of markups in a general equilibrium framework with heteroge-
neous banks.5 The former paper relies on a structure where banks offer differentiated services
in line with Bernard et al. (2003). In the latter work, banks with different efficiencies co-
exist, as not all firms can visit the most efficient bank. Cross-border lending arises because
firms apply for loans also at foreign banks to minimize expected costs. FDI and cross-border
lending are analyzed as separate scenarios. Sorting does not occur.
More broadly my research adds to the literature on heterogeneous firms in international
trade and investment. The proposed theoretical structure differs substantially from existing
work-horse models with firm heterogeneity. In the class of models following Melitz (2003),
heterogeneous manufacturing firms produce differentiated goods as a result of consumers’
love for variety. These models predict trade flows of goods. In this paper instead, banks
provide a homogenous intermediation service across borders with implications for banks’
foreign asset and liability holdings. In this regard, this work also contributes to services
trade research (see Francois and Hoekman (2010) for a literature review).
The assumptions on fixed and variables costs that banks face follow Helpman, Melitz
and Yeaple (2004) and result in a similar concentration-fixed-cost tradeoff here. Buch, Koch
and Koetter (2009) and Lehner (2009) model such a tradeoff for banks in partial equilibrium
frameworks in contrast to the general equilibrium approach in this paper.
This work also extends the empirical literature on cross-border banking. Several papers
have analyzed how country characteristics affect the foreign activities of banks (see, e.g.,
Papaioannou (2009); Buch (2003); Buch (2005); Focarelli and Pozzolo (2005)). Niepmann
(2012) shows that the foreign positions of banks are determined by differences in endowments
and differences in banking sector efficiencies between countries. Buch, Koch and Koetter
(2009) and Buch, Koch and Koetter (2011) document that the cross-border lending activities
5De Blas and Russ (2010) is an earlier version of De Blas and Russ (2012).
4

and FDI of German banks vary systematically with their size and efficiency.
The empirical analysis in this paper complements these works in particular by analyzing
the sorting behavior of banks with respect to host country characteristics. While existing
research studies the extensive margin, that is, the number of banks that are active abroad,
this paper investigates the behavior of the cross-border lending, the cross-border borrowing
and the FDI cutoff using the efficiency of the least efficient bank that operates in a given
country as the measure. The empirical approach is along the lines of Yeaple (2009) who
explores the sorting of manufacturing firms into FDI.
In addition, this papers tests for a proximity-fixed cost tradeoff in banking. While several
papers consider the choice of banks between cross-border operations and FDI (see, e.g., Buch
and Lipponer (2007)), this paper is the first to show empirical evidence for the relevance of
this tradeoff.6
The paper is structured as follows. Section 2 presents the theoretical model. First, the
closed economy is introduced. Then the open economy model and the results of comparative
statics are discussed. Section 3 provides empirical evidence, and section 4 concludes.
2 A Banking Model with Heterogeneity
2.1 Closed Economy
2.1.1 Setup
There is a continuum of capitalists of measure K, who can become bankers or depositors, and
a continuum of workers of measure L. Each capitalist is endowed with one unit of capital.
Each worker supplies inelastically one unit of labor. Furthermore, there is a continuum of
potential entrepreneurs who can run firms. Firms are perfectly competitive and produce
a single consumption good using capital and labor. Each firm operates under the same
constant returns to scale technology. The production function takes the form F (l, z). It is
assumed to be continuous, strictly increasing and concave in l. The capital input per firm z
6See also Helpman, Melitz and Yeaple (2004) for empirical evidence on the relevance of such a tradeoffin goods trade.
5
is fixed.7
There are two periods: in the first period, investments are made. In the second period,
firms produce. With probability λ, production is successful so that capitalists and workers
are paid and consume. It is useful to determine equilibrium factor prices first. In equilibrium,
all capital is employed in production, which implies that the measure of operating firms is
N = K/z. As firms compete for labor and are symmetric, they employ the same amount
of labor l. Labor market clearing implies that l = L/N . Under perfect competition, the
returns to the production factors are pinned down by their marginal products. The gross
return to capital is R = (1 + Fz(1, z/l)) = (1 + FK(1, K/L)). The wage rate is given by
w = FL(1, K/L).
Each capitalist decides whether to become a banker or a depositor in the first period.
Bankers have two tasks in the economy: first, they channel capital from depositors to firms
because depositors cannot lend to firms directly. Second, bankers monitor the firms they
lend to at a cost to increase the probability that production is successful. As the suppliers of
capital, bankers collect the gross return to capital R in the second period. Depositors invest
their endowments in banks and obtain the return RD, which is endogenously determined.8
Before each capitalist makes his occupational choice, he learns about his efficiency as a
banker. Each capitalist draws a monitoring cost γ > 0 from a continuous distribution g(γ)
with support γ ∈ [γ, γ]. The lower the cost draw the higher the capitalist’s efficiency as a
banker.
The role of monitoring and incentive problems in the model are similar to the framework
in Holmstrom and Tirole (1997). The success probability of the firm depends on the effort
exerted by the entrepreneur. With effort, the success probability is λ. Without effort, it
is λL < λ. Production is only economically viable if the entrepreneur exerts effort, that is
λLR < 1 < λR. Furthermore, only monitoring by banks induces the entrepreneur to exert
effort. Therefore, for investment and hence production to take place, banks have to monitor
and all firms operate with a high probability of success in equilibrium. It is assumed that
7Instead of fixing z exogenously, one could endogenously limit the size of a single firm by introducing amoral hazard problem at the side of the entrepreneur similar to Ju and Wei (2010).
8Parameters are such that depositors always prefer to invest their capital in banks over storing it at home,that is, λRD > 1.
6

monitoring costs are sufficiently low so that financial intermediation and monitoring are
beneficial.9
Depositors do not observe whether a banker monitors but they can observe his monitoring
cost (type) γ. To credibly commit to monitor, a banker invests his own capital in the firms
he lends to.10 A banker only monitors a firm if the expected return under monitoring is
higher than the return without monitoring, which results in the following condition:
λRz − λRD(z − v)− γz ≥ λLRz − λLRD(z − v), (1)
where γz are the total monitoring costs incurred and v represents the banker’s capital (equity)
invested in the firm. To maximize profits, each banker maximizes the number of firms he
monitors and lends to. This implies minimizing v.11 Therefore, in equilibrium, condition 1
holds with equality. Solving the condition for bank capital v(γ) yields:
v(γ) =
(1− R
RD+
γ
(λ− λL)RD
)z. (2)
Note that in equilibrium, each banker must invest a positive amount of bank capital to
commit to monitor because (λ − λL)(RD − R) + γ > 0 so that v(γ) > 0 ∀ γ > γ.12 As
bank capital v(γ) invested per firm is proportional to the capital input z of the firm, z is
normalized to 1. The return of a banker with monitoring cost γ per firm that he monitors
and lends to is then obtained as:
λR− λRD(1− v(γ))− γ =γλLλ− λL
. (3)
9There must be enough capitalists with sufficiently low cost draws such that it is beneficial to employthem as bankers. For all active bankers, the investment must still be viable even after the monitoring cost isincurred, i.e. λR − γ > 1 > λLR ∀γ < γ∗. This condition automatically ensures that the bank capital v(γ)that each banker has to invest in a single firm with capital input z is smaller than z. This, in turn, impliesthat the bank entry cutoff γ∗ < γ.
10It is assumed that the success of firms is perfectly correlated so that banks must invest their own capitalto solve the moral hazard problems. See Holmstrom and Tirole (1997).
11To see this, substitute n = 1/v in the expression for total profits to obtain π = n(λRz−λRDz−γz)+λRD.12To see this, plug in the equilibrium expression for RD, which is derived later in the text. Then the
condition becomes: γ − (λ− λL)γ∗
λ > 0, which holds because γ∗ < γ/(1− λL/λ) as is shown in the proof ofproposition 1.
7

The number (measure) of firms that one banker endowed with one unit of capital can monitor
is n(γ) = 1v(γ)
.13 The higher a banker’s monitoring efficiency, i.e. the lower γ, the more
external capital he channels from depositors to firms and the larger his balance sheet. A
banker of type γ operates under the following leverage:
debt
equity=
depositor capital
bank capital=n(γ)x(γ)
1=
1
v(γ)− 1, (4)
where x(γ) = 1− v(γ) is the depositor capital that a banker of type γ lends to a single firm.
Profits of the banker of type γ are given by:
π(γ) = n(γ)(λR− λRD(1− v(γ))− γ) =1
v(γ)
γλlλ− λL
=1
1− RRD + γ
(λ−λL)RD
γλLλ− λL
.(5)
The return that the banker makes per firm, which corresponds to the second term in expres-
sion (5), depends only on the banker’s monitoring cost γ and on the success probabilities λ
and λL. These parameters are exogenous and fixed. The lower γ, the higher λ and the lower
λL are, the higher are the banker’s profits. The endogenous variables of the model, R and
RD, affect profits only through the measure of firms n(γ) that the banker serves, i.e. through
the lending volume, and, as bank capital is fixed, through the leverage. The banker’s lending
volume and profits are higher, the higher the gross return to capital R and the lower the
cost of external funding reflected in RD.14
While the profits of a banker depend on his type γ, all depositors are paid the same
return. This is because the monitoring cost draw of a depositor is assumed to remain private
information in contrast to the draw of a banker.
2.1.2 Equilibrium
Two equilibrium conditions close the model. First, there is free entry into banking. Second,
the market for financial intermediation clears, i.e. all operating bankers in the economy must
intermediate the available capital.
13Integer problems are ignored. One firm may borrow from several banks.14Under the assumption made previously that λR − λLR − γ > 0 the derivative of π(γ) with respect to
RD is always negative.
8

First, consider free entry into banking. Each capitalist has the choice between becoming
a banker or a depositor. The marginal capitalist γ∗ who is indifferent between the two
occupational choices is determined by setting the expected profits of a capitalist as a banker
equal to his expected profits as a depositor:
π(γ∗) =1
1− RRD + γ∗
(λ−λL)RD
γ∗λLλ− λL
= λRD. (6)
Because profits are strictly decreasing in γ, all capitalists for whom γ > γ∗ become depositors
and those for whom γ ≤ γ∗ become bankers.
All active bankers together must intermediate the existing capital in the economy. The
economy is endowed with capital of measure K. A banker of type γ is able to supply a
measure of n(γ) firms with capital. Thus the market for financial intermediation clears if:
K
∫ γ∗
γ
n(γ)g(γ)dγ = K. (7)
Equations (6) and (7) constitute a system of two equations in two unknowns RD and γ∗,
which fully determine the equilibrium. Solving equation (6) with respect to RD yields:
RD = R− γ∗
λ= (1 + FK(1,
K
L))− γ∗
λ. (8)
The return to depositors RD depends on the marginal product of capital (MPK) and, there-
fore, on the relative factor endowments of the economy, as well as on banking sector efficiency
reflected in γ∗. The lower the aggregate banking sector efficiency in the economy, the larger
the wedge between the gross return to capital R and the return on deposits RD.15
Plugging the expression for RD into the market clearing condition (7) yields:
1 =
∫ γ∗
γ
(R− γ∗
λ)(λ− λL)
γ − (λ− λL)γ∗
λ
g(γ)dγ. (9)
Expression (9) implicitly gives a solution for the bank entry cutoff γ∗.16
15This is similar to Antras and Caballero (2009) and Ju and Wei (2010).16Because the integral increases with the upper limit γ∗ and ∂n
∂γ∗ > 0, equation 9 has a unique solution for
9
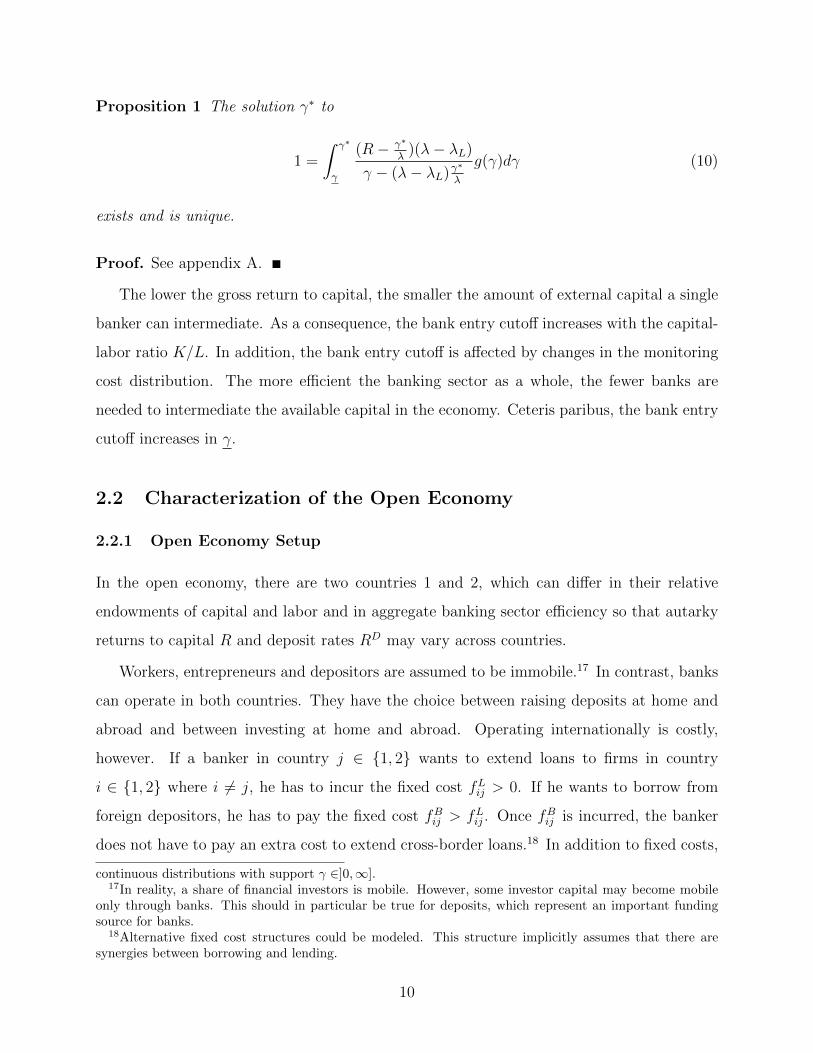
Proposition 1 The solution γ∗ to
1 =
∫ γ∗
γ
(R− γ∗
λ)(λ− λL)
γ − (λ− λL)γ∗
λ
g(γ)dγ (10)
exists and is unique.
Proof. See appendix A.
The lower the gross return to capital, the smaller the amount of external capital a single
banker can intermediate. As a consequence, the bank entry cutoff increases with the capital-
labor ratio K/L. In addition, the bank entry cutoff is affected by changes in the monitoring
cost distribution. The more efficient the banking sector as a whole, the fewer banks are
needed to intermediate the available capital in the economy. Ceteris paribus, the bank entry
cutoff increases in γ.
2.2 Characterization of the Open Economy
2.2.1 Open Economy Setup
In the open economy, there are two countries 1 and 2, which can differ in their relative
endowments of capital and labor and in aggregate banking sector efficiency so that autarky
returns to capital R and deposit rates RD may vary across countries.
Workers, entrepreneurs and depositors are assumed to be immobile.17 In contrast, banks
can operate in both countries. They have the choice between raising deposits at home and
abroad and between investing at home and abroad. Operating internationally is costly,
however. If a banker in country j ∈ {1, 2} wants to extend loans to firms in country
i ∈ {1, 2} where i 6= j, he has to incur the fixed cost fLij > 0. If he wants to borrow from
foreign depositors, he has to pay the fixed cost fBij > fLij . Once fBij is incurred, the banker
does not have to pay an extra cost to extend cross-border loans.18 In addition to fixed costs,
continuous distributions with support γ ∈]0,∞].17In reality, a share of financial investors is mobile. However, some investor capital may become mobile
only through banks. This should in particular be true for deposits, which represent an important fundingsource for banks.
18Alternative fixed cost structures could be modeled. This structure implicitly assumes that there aresynergies between borrowing and lending.
10
the banker also faces variable costs, which take the form of “iceberg” costs. If the gross
return Ri is collected in country i, only a fraction of the return, τRi, where τ < 1, arrives at
the bank in country j. At the same time for the return RDi to go to depositors in country i,
φRDi units have to be transported, where φ > 0.19
Banks can eliminate variable costs by opening up an affiliate abroad. However, foreign
direct investment requires paying a higher fixed cost fFij > fBij .
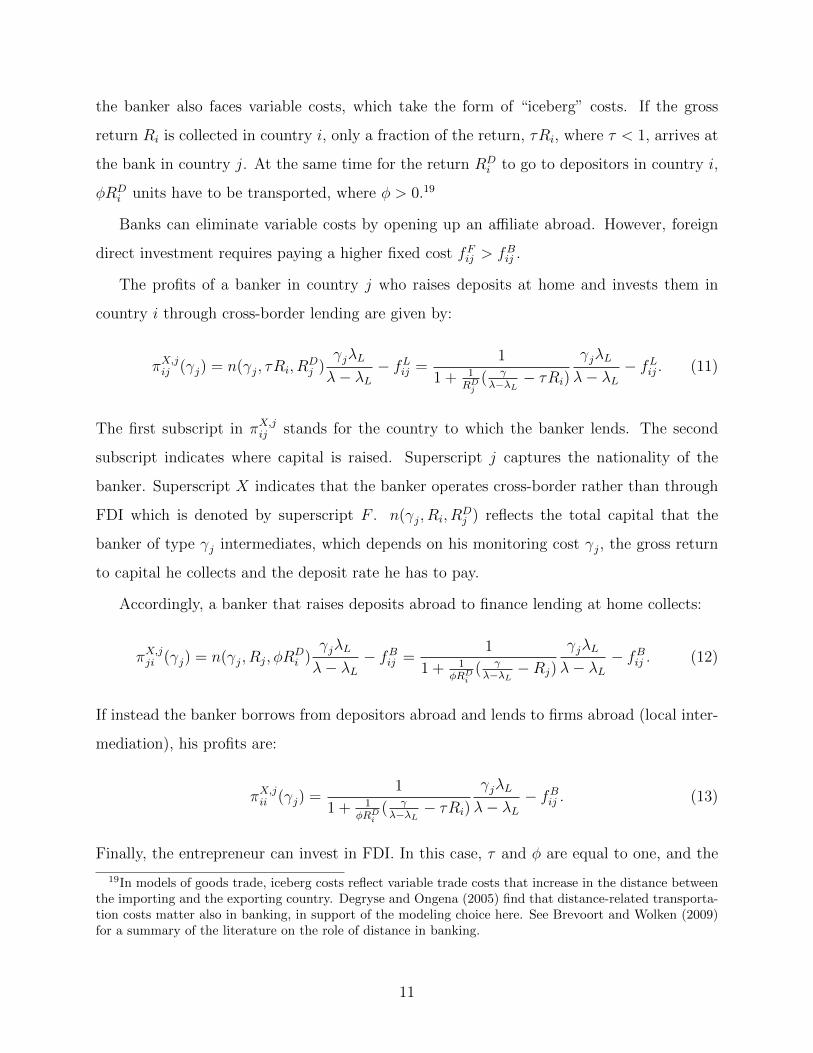
The profits of a banker in country j who raises deposits at home and invests them in
country i through cross-border lending are given by:
πX,jij (γj) = n(γj, τRi, RDj )
γjλL
λ− λL− fLij =
1
1 + 1RD
j( γλ−λL
− τRi)
γjλL
λ− λL− fLij . (11)
The first subscript in πX,jij stands for the country to which the banker lends. The second
subscript indicates where capital is raised. Superscript j captures the nationality of the
banker. Superscript X indicates that the banker operates cross-border rather than through
FDI which is denoted by superscript F . n(γj, Ri, RDj ) reflects the total capital that the
banker of type γj intermediates, which depends on his monitoring cost γj, the gross return
to capital he collects and the deposit rate he has to pay.
Accordingly, a banker that raises deposits abroad to finance lending at home collects:
πX,jji (γj) = n(γj, Rj, φRDi )
γjλL
λ− λL− fBij =
1
1 + 1φRD
i( γλ−λL
−Rj)
γjλL
λ− λL− fBij . (12)
If instead the banker borrows from depositors abroad and lends to firms abroad (local inter-
mediation), his profits are:
πX,jii (γj) =1
1 + 1φRD
i( γλ−λL
− τRi)
γjλL
λ− λL− fBij . (13)
Finally, the entrepreneur can invest in FDI. In this case, τ and φ are equal to one, and the
19In models of goods trade, iceberg costs reflect variable trade costs that increase in the distance betweenthe importing and the exporting country. Degryse and Ongena (2005) find that distance-related transporta-tion costs matter also in banking, in support of the modeling choice here. See Brevoort and Wolken (2009)for a summary of the literature on the role of distance in banking.
11

fixed cost is replaced by fFij in the last three equations.
Each banker chooses between the seven options (πjjj, πX,jij , πX,jii , πX,jji , πF,jij , πF,jii , and πF,jji )
taking the gross returns to capital Ri and Rj, the returns on deposits RDi and RD
j as well as
costs as given.
If banks lend capital to foreign firms or raise capital abroad for investment at home,
capital flows across borders. This affects the gross return to capital in both countries. Similar
to the notation for profits, Kjij represents the aggregate capital that banks from country j
raise at home and invest abroad. Equivalently, Kiij stands for the aggregate capital that
banks from country i raise in country j for investment at home. The gross return to capital
in country i is then given by:
Ri = 1 + FK
(1,Ki +Kij
Li
), (14)
where Kij = Kiij +Kj
ij.
2.2.2 Sorting
It is useful to establish a key result of the model before defining the equilibrium in the
open economy: bankers sort into cross-border lending, borrowing and FDI according to their
monitoring cost γ.
Consider the general profit function:
π(R,RD, γ, τ , φ) =1
1− τRφRD + γ
(λ−λL)φRD
γλLλ− λL
. (15)
Substitute RD = φRD and R = τR. The function π(R, RD, γ) is supermodular in γ and
−R and in γ and RD, i.e. π−R,γ > 0 and πRD,γ > 0. Mrazova and Neary (2011) show that
supermodularity is a sufficient condition for sorting in a way that the high-efficiency banks
engage in the activity that requires paying the (higher) fixed cost, whereas low-efficiency
banks engage in the activity with no (the lower) fixed cost. This result facilitates the
equilibrium computation because once the banker who is indifferent between two activities
is found, the decisions of all other active bankers follow immediately.
12

Proposition 2 If bankers of different types engage in different activities in equilibrium, then
sorting is such that the most efficient bankers sort into the activity that requires paying the
(higher) fixed cost while the low efficiency bankers engage in the activity with no (the lower)
fixed cost.
Proof. See appendix A.
In the following, γLj (γBj ) denotes the cross-border lending (borrowing) cutoff, i.e. all
bankers with γj ≤ γLj (γBj ) find it profitable to lend (borrow) across borders. Similarly, all
bankers with γj ≤ γFj find it profitable to operate in country i by establishing a foreign
affiliate. A banker is only willing to pay a fixed cost if he can collect a higher return on
the loan or obtain cheaper funding abroad. Once the cost is incurred, it is optimal for the
banker to invest the entire capital in the high return location and to raise all deposits in
the low-interest country. Similarly, if a bank opens up a foreign representation, it conducts
all business through the foreign affiliate to save on variable costs.20 As more efficient banks
operate under a higher leverage, that is, they borrow and lend more, they hold more cross-
border assets, cross-border liabilities as well as more assets and liabilities in their foreign
affiliates. The model therefore predicts that not only the extensive margins of banking
across borders increase with efficiency but also the different intensive margins.
2.2.3 Equilibrium Definition
The equilibrium in the open economy is defined as follows:
Definition 1 An equilibrium in the open economy is characterized by the bank entry cutoff
γ∗j , the cross-border lending cutoff γLj , the cross-border borrowing cutoff γBj , the FDI cutoff
γFj , returns to depositors RDj and gross returns to capital Rj for j ∈ {1, 2}, i ∈ {1, 2} and
j 6= i for which the following conditions hold:
(i) Capitalists in each country optimally choose whether to become depositors or bankers.
(ii) Bankers in each country optimally choose to lend at home and abroad.
20Bankers will always choose to raise deposits either at home or abroad. They will also, in general, eitherinvest at home or abroad. These results could be relaxed by introducing heterogeneous firms/depositorsleading to assortative matching or by including a motive of banks and depositors to diversify lending andborrowing.
13

(iii) Bankers in each country optimally choose to raise capital at home and abroad.
(iv) Bankers in each country optimally choose between the two modes of operating abroad
(cross-border versus FDI).
(v) Capital flows are consistent with the choice of bankers to invest and to raise capital
abroad.
(vi) Labor markets clear.
(vii) All capital is employed in production (capital market clearing).
(viii) The market for financial intermediation clears.
The solution to the general model is complex as different equilibrium cases exist. Which
case occurs depends on the exact parameter values. Niepmann (2012) analyzes the different
equilibrium cases and resulting cross-border flows in detail in a similar model. In this paper,
I focus on the novel, bank-level implications of the theory. To that end, the analysis is
narrowed to one equilibrium case, in which banking sector j invests domestic capital in firms
in country i and banking sector i raises funding from depositors in country j for investment
at home. This allows me to derive and provide intuition for the results of comparative statics
that are tested in the empirical part of the paper.21 Appendix B provides more details on
the general model illustrating the different equilibrium cases that exists.
2.3 Equilibrium with Cross-border Lending, Borrowing and FDI
2.3.1 Equilibrium
Assume in the following that factor endowments are such that in autarky Ri > Rj. Further-
more, banking sector i is more efficient than banking sector j.22
For simplicity, I assume that capitalists in the two countries draw from a uniform mon-
itoring cost distribution with different lower supports, that is, γi< γ
j. This implies that
21The logic of the model presented here follows Niepmann (2012) who shows that comparative statics holdwithin and across equilibrium cases.
22To illustrate, think of country i as the United States. Country j may correspond to Germany. In 2000,Germany had a higher capital-labor ratio and less efficient banks than the United States. The human-capitaladjusted capital-labor ratio of Germany was 51.16 compared to 39.58 in the U.S. The average overhead coststo total assets for the German banking sector were 0.0435, in contrast to a value of 0.0346 for the U.S.banking sector.
14

even if gross returns to capital are equal in the two countries, γ∗i < γ∗j so that RDi > RD
j .
In this case, because banks incur additional costs from operating abroad, banking across
borders can only take two forms under the assumed parameter values: banking sector j
lends to firms in country i and/or banking sector i borrows from depositors in country j.
If differences in endowments between countries are large relative to differences in banking
sector efficiencies, if variable and fixed costs are not prohibitively high and if country sizes
are not too dissimilar, an interior equilibrium prevails where both banking sectors operate
across borders and engage in FDI.
The results on sorting imply that, in such an equilibrium, capitalists below the cutoff
γ∗j become bankers. All bankers for whom γLj < γj ≤ γ∗j operate only at home. Bankers
in the range γFj < γj ≤ γLj extend loans to firms in country i cross-border. Bankers with
γj < γj ≤ γFj establish foreign affiliates in country i to lend to firms there. In country i,
in turn, active bankers have monitoring costs γi ≤ γ∗i . All bankers for whom γBi < γi ≤ γ∗i
engage only in domestic banking. Bankers in the range γFi < γi ≤ γBi raise funding in
country j cross-border. Bankers of type γi < γi ≤ γFi establish foreign affiliates in country
j to borrow from depositors in the host market.
According to definition 1, the following equations have to hold in equilibrium:
Ri = (1 + F ′K(1, (Ki +Kij)/Li)) [return to capital in i], (16)
Rj = (1 + F ′K(1, (Kj −Kij)/Lj)) [return to capital in j], (17)
Kij = Kjij +Ki
ij, [capital flow] (18)
where
Kjij = Kj
∫ γFj
γj
n(γj, Ri, RDj )gj(γj)dγj +Kj
∫ γLj
γFj
n(γj, τRi, RDj )gj(γj)dγj, (19)
15

and
Kiij = Ki
∫ γFi
γi
n(γi, Ri, RDj )gi(γi)dγi +Ki
∫ γBi
γFi
n(γi, Ri, φRDj )gi(γi)dγi
− Ki
∫ γBi
γi
gi(γi)dγi. (20)
Kj −Kiij = Kj
∫ γFj
γj
n(γj, Ri, RDj )gj(γj)dγj +Kj
∫ γLj
γFj
n(γj, τRi, RDj )gj(γj)dγj
+ Kj
∫ γ∗j
γLj
n(γj, Rj, RDj )gj(γj)dγj [market clearing j], (21)
Ki +Kiij = Ki
ij +Ki
∫ γBi
γi
gi(γi)dγi +Ki
∫ γ∗i
γBi
ni(γi, Ri, RDi )gi(γi)dγi [market clearing i],
πkkk(γ∗k) = λRD
k ∀k ∈ {1, 2} [free entry], (22)
πL,jij (γLj ) = πjjj(γLj ) if γLj > γj [lending cutoff j]. (23)
πL,iij (γBi ) = πiii(γBi ) if γBi > γi [borrowing cutoff i]. (24)
πF,jij (γFj ) = πL,jjj (γFj ) if γFj > γj [FDI cutoff j]. (25)
πF,iij (γFi ) = πB,iii (γFi ) if γFi > γi [FDI cutoff i]. (26)
The first two equations above give the equilibrium gross return to capital in country i
and in country j, which are both functions of the capital flow Kij. The third condition
determines the equilibrium capital flow which consists of two components that are explicitly
stated in equations (19) and (20). The former equation delivers an expression for the capital
Kjij that bankers in country j lend to firms in country i. The latter equation corresponds to
the capital Kiij that bankers in country i raise from depositors in country j for investment
at home. Note that the equity capital of bankers in country i that borrow from depositors
in country j does not cross the border. It is therefore subtracted from the total capital that
banks in country i invest in firms at home (The last term in equation (20) reflects this equity
16

capital).
Equations (21) and (22) are clearing conditions of the market for financial intermediation
in country j and in country i, respectively. As banking sector i raises capital in country j,
banking sector j has to intermediate only Ki − Kiij units of capital. In turn, bankers in
country i that get funding from abroad, have to intermediate the additional capital Kiij.
The remaining conditions determine the entry cutoffs in the two countries, the cross-border
lending cutoff in country j, the cross-border borrowing cutoff in country i and the FDI cutoffs
of banks in country j and in country i. Together, the conditions constitute a system of 12
equations in 12 unknowns that has a unique solution.
Proposition 3 The solution to equations 16 to 26 is unique.
Proof. See appendix A.
2.3.2 Open Economy versus Autarky
To illustrate the effects of banking across borders, I provide a numerical example. The upper
panel of table 2 lists the exogenously chosen parameters. In the lower panel, solutions for
the 12 variables are given for the cases of autarky and of the open economy. Figure 1 shows
the corresponding size distribution of banks in the two countries.
In the open economy equilibrium, both banking sectors engage in banking across borders,
channeling capital from country j to country i. Hence, the equilibrium gross return to capital
is higher in country j and lower in country i than in autarky. In addition, integration leads
to entry into banking in country i and exit in country j. Because banking sector i is
more efficient, it expands by intermediating foreign deposits. As displayed in figure 1, the
bank entry cutoff in country i moves up (γ∗AUTi > γ∗i ) while it goes downs in country j
(γ∗AUTj < γ∗j). A country’s deposit rate is a function of the gross return to capital and the
domestic bank entry cutoff. As a consequence, the deposit rate RD decreases in country i
and increases in country j.
Figure 1 shows the effect of integration on the size distribution of banks in the two
countries. In both countries the more efficient banks that borrow and lend abroad, either
17

cross-border or through FDI, are able to enlarge their balance sheets. Because they can
obtain a higher return on loans (country j) or reduce funding costs (country i), their capacity
to intermediate external capital is augmented.
The size of banks that only operate at home is also affected because domestic gross
returns to capital and deposit rates change as well. The equilibrium gross return and the
deposit rate that prevail in country i are both lower in the open economy than in autarky.
The opposite holds for country j. Increases in gross returns and deposit rates have opposite
effects on the balance sheet capacity of purely domestic banks. It turns out that, in the
numerical example, domestic banks in country i become bigger. In country j, the balance
sheets of domestic banks shrink.
In summary, financial integration equilibrates gross returns, banking sector efficiencies
and deposit rates and affects the balance sheet capacity of banks. Larger and more efficient
banks become even larger so that the bank size distribution becomes more unequal.
2.3.3 Comparative Statics
The previous section has discussed how allocations change when countries move from autarky
to an integrated world. In the following section, I analyze how the open economy equilibrium
varies with the characteristics of the trading partners. In the model, countries may differ in
their banking sector efficiencies, their relative factor endowments and in their impediments
to cross-border lending, cross-border borrowing and FDI. As these exogenous factors change,
all endogenous variables in the model, such as the equilibrium gross return to capital, the
capital flow, the aggregate foreign assets of a banking sector, etc., respond. The analysis
here focuses on the effects of varying country characteristics on four endogenous objects: the
cross-border lending cutoff γLj , the cross-border borrowing cutoff γBi and the FDI cutoffs γFj
and γFi . These comparative statics are tested in the empirical part of the paper.
As the data that are available for the empirical analysis vary across host countries while
the home country is always the same, comparative statics are derived with respect to host
country variables only. I start by analyzing how the cross-border lending cutoff of country
j is affected by changes in the characteristics of (host) country i. Then, I show how the
18

cross-border borrowing cutoff of country i varies with alternative characteristics of (host)
country j. Finally, I discuss how the FDI cutoffs in the two countries respond to alternative
host country characteristics.
The effect of host country characteristics on the cross-border lending cutoff In
the model presented, banking across borders is driven by Ricardian technology differences
and Heckscher-Ohlin endowment differences. This is a distinct feature of the theory and
differs from many models in the literature that are based on portfolio theory. Consider how
the cross-border lending cutoff γLj responds as the efficiency of the banking sector in the
host country declines. From the perspective of country j, the host country is country i. An
increase in γi implies that the average monitoring cost of banks in country i goes up. As a
consequence, the deposit rate in country i decreases. Together this implies that more banks
in country i prefer to raise funding at home. As fewer banks in country i take deposits
in country j, the capital flow goes down so that the gross return to capital Ri is higher,
everything else equal. This, in turn, makes it more attractive for banks in country j to
invest in firms in country i. The cross-border lending cutoff γLj increases.
Changes in the capital endowment of a country affect the mass of banks in the country
and, hence, the capacity of the banking sector to channel capital across borders. Therefore,
I only consider variation in the capital-labor ratio of the host country in the form of changes
in its labor endowment, keeping the capital endowment fixed.23 The lower country i’s labor
endowment Li is, the lower the gross return to capital in country i is and the less profitable it
is for banks in country j to lend to firms abroad. Therefore, the cross-border lending cutoff
γLj decreases as Li goes down.
Host countries may also vary with respect to the costs that banks incur from operating
there. With a higher variable cost, reflected in a lower τ , and a higher fixed cost of cross-
23This point is related to the effect of changes in host country size through changes in K, which dependon the underlying functional forms and parameters of the model. Consider an increase in Kj and Lj so thatKj/Lj is unchanged. An increase in Kj increases the mass of bankers in country j that find it profitable tolend to firms abroad. At the same time, the capital flow necessary to equilibrate gross returns in the twocountries increases. The overall effects of size on the cross-border borrowing cutoff γBi and the FDI cutoffγFi depend on the relative magnitudes of these two effects. In cases where the host country’s banking sectoroperates only domestically, the effect of size is unambiguous. Then cutoffs increase in the size of the hostcountry.
19

border lending fLij , fewer banks in country j find it optimal to extend cross-border loans.
As a consequence, the lending cutoff γLj goes down. An increase in the fixed cost of FDI
has the opposite effect. The higher fFij , the fewer banks invest in FDI and the less capital
flows from country j to country i. This implies that the gross return to capital is higher
in country i ceteris paribus, which increases the incentives for banks in country j to engage
in cross-border lending. The cross-border lending cutoff γLj increases in fFij . Proposition 4
summarizes the results.
Proposition 4 The extensive margin of cross-border lending γLj
(i) increases in γi,
(ii) decreases in the capital abundance of host country i reflected in a decrease in Li,
(iii) decreases in the fixed cost of cross-border lending fLij ,
(iv) increases in τ , the inverse of the variable cost of cross-border lending,
(v) and increases in the fixed cost of FDI fFij .
Proof. See appendix A.
The effect of host country characteristics on the cross-border borrowing cutoff
Now take the perspective of banks in country i. The host country for these banks is country
j. As banking sector j becomes less efficient, i.e. as γj increases, the deposit rate in country
j declines. Hence, it becomes more attractive for banks in country i to raise deposits in
country j, and the cutoff γBi increases. Comparing this result to the effect of lower banking
sector efficiency in the host country on the lending cutoff, we see that they go in the same
direction. Both the cross-border lending and the cross-border borrowing cutoff increase as
the banking sector in the host country becomes less efficient.
In contrast, the effect of a higher labor endowment in the host country goes in the
opposite direction for the cross-border lending cutoff and the cross-border borrowing cutoff.
The lower country j’s endowment of labor is, the lower are the gross-return to capital Rj
and the deposit rate RDj . With lower funding costs in country j, more banks in country i
want to borrow from depositors in country j. Thus, the cross-border borrowing cutoff γBi
increases as Lj decreases.
20
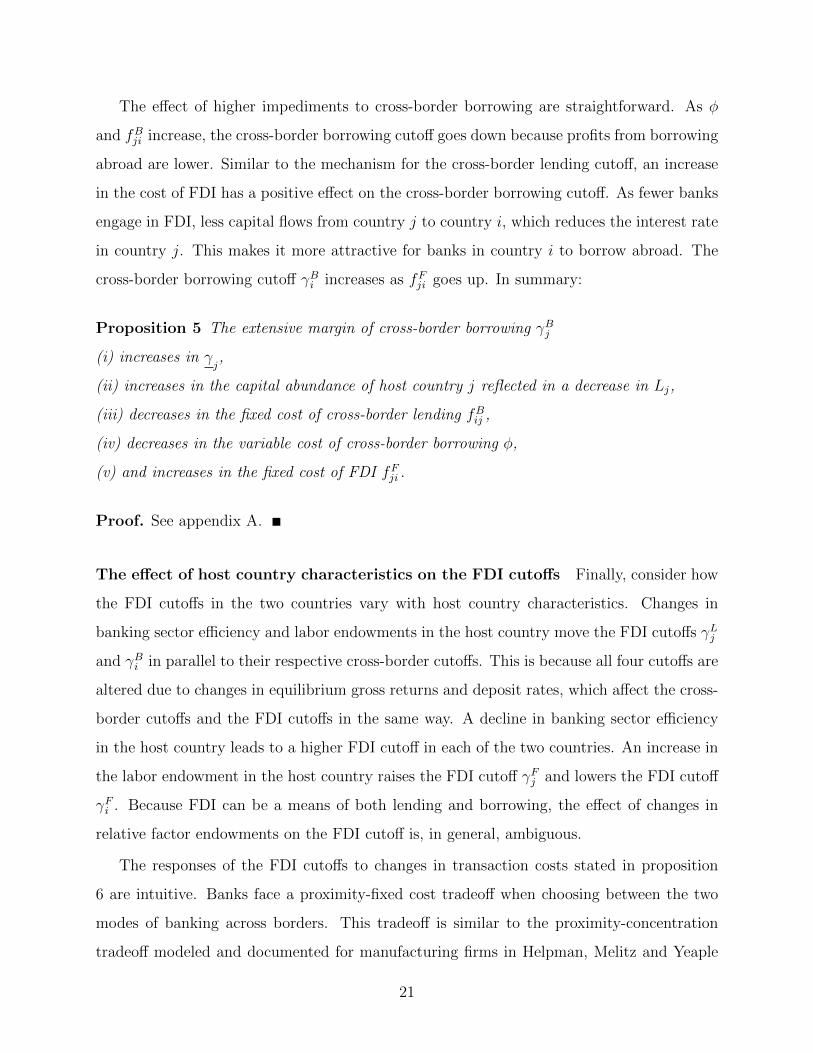
The effect of higher impediments to cross-border borrowing are straightforward. As φ
and fBji increase, the cross-border borrowing cutoff goes down because profits from borrowing
abroad are lower. Similar to the mechanism for the cross-border lending cutoff, an increase
in the cost of FDI has a positive effect on the cross-border borrowing cutoff. As fewer banks
engage in FDI, less capital flows from country j to country i, which reduces the interest rate
in country j. This makes it more attractive for banks in country i to borrow abroad. The
cross-border borrowing cutoff γBi increases as fFji goes up. In summary:
Proposition 5 The extensive margin of cross-border borrowing γBj
(i) increases in γj,
(ii) increases in the capital abundance of host country j reflected in a decrease in Lj,
(iii) decreases in the fixed cost of cross-border lending fBij ,
(iv) decreases in the variable cost of cross-border borrowing φ,
(v) and increases in the fixed cost of FDI fFji .
Proof. See appendix A.
The effect of host country characteristics on the FDI cutoffs Finally, consider how
the FDI cutoffs in the two countries vary with host country characteristics. Changes in
banking sector efficiency and labor endowments in the host country move the FDI cutoffs γLj
and γBi in parallel to their respective cross-border cutoffs. This is because all four cutoffs are
altered due to changes in equilibrium gross returns and deposit rates, which affect the cross-
border cutoffs and the FDI cutoffs in the same way. A decline in banking sector efficiency
in the host country leads to a higher FDI cutoff in each of the two countries. An increase in
the labor endowment in the host country raises the FDI cutoff γFj and lowers the FDI cutoff
γFi . Because FDI can be a means of both lending and borrowing, the effect of changes in
relative factor endowments on the FDI cutoff is, in general, ambiguous.
The responses of the FDI cutoffs to changes in transaction costs stated in proposition
6 are intuitive. Banks face a proximity-fixed cost tradeoff when choosing between the two
modes of banking across borders. This tradeoff is similar to the proximity-concentration
tradeoff modeled and documented for manufacturing firms in Helpman, Melitz and Yeaple
21

(2004) and Yeaple (2009). Higher costs to cross-border operations make it relatively more
attractive for banks to operate through foreign affiliates and increase the FDI cutoffs. Higher
costs to FDI make it less attractive, thus lowering the two cutoffs.
Proposition 6 The extensive margin of FDI γFj (γFi )
(i) increases in γi
(γj),
(ii) decreases in τ (increases in φ),
(iii) increases in the fixed cost of cross-border lending fLij (cross-border borrowing fBji ),
(iv) and decreases in the fixed cost of FDI fFij (fFji ).
Proof. See appendix A.
Combining these results with the previous discussion shows that changes in variable and
fixed costs have the exact opposite effects on the cross-border cutoffs and the FDI cutoffs.
The gap between the FDI and the cross-border cutoff is smaller when the cost of FDI is
lower and when the costs of cross-border activities are higher, and vice versa.
The focus of the paper is on the bank-level predictions of the presented theory. Note,
however, that the model has similar aggregate implications as Niepmann (2012).24 Aggregate
foreign assets and liabilities of a banking sector increase in the efficiency advantage of the
home country relative to the host country. Aggregate foreign assets increase and aggregate
foreign liabilities decrease in the capital abundance of the home country relative to the host
country. The theory therefore matches not only the empirical evidence on sorting, but is
also consistent with the observed variation of aggregate foreign bank positions.
3 Empirical Analysis
3.1 Data
In order to test the theoretical implications of the model, I use bank-level data on the foreign
activities of German banks collected by Deutsche Bundesbank. The so called Auslandsstatus-
Report provides information on the foreign assets and liabilities of all German banks and
24While aggregate implications are the same, the model in this paper does not reduce to the one inNiepmann (2012) if all banks had the same efficiency because the microstructures differ substantially.
22

their foreign affiliates around the globe.25 The full dataset that comprises the universe of
German banks is available to me for 2005. In that year, there are 1998 banks, the total
assets and total liabilities of which are observed in 178 countries.
In addition to the foreign positions data, I draw on balance sheet and income and loss
data, also available at Bundesbank, to compute efficiency measures for single banks. Three
different simple proxies are employed. First, efficiency of bank k is measured as the average
size of the domestic balance sheet of bank k in year t− 1. This is in line with the theoretical
model where the efficiency of a bank determines its size. Second, overhead costs to total
assets in year t − 1 are calculated for each bank. Third, as a robustness check, the labor
productivity of bank k is measured as the average size of bank k’s domestic balance sheet
over the number of employees.26 Table 3 shows the correlations between the three measures.
The dataset is complemented by information on host country i characteristics such as
distance and GDP.27 As profit and loss data is not available for all banks in the sample and
as host country variables are only observed in a limited number of countries, the sample size
reduces depending on the exact specification.
Table 1 illustrates the positive effect of size and efficiency on the extensive and the
intensive margins of banking across borders. To examine the relationship between size and
efficiency and the extensive margin, I estimate several logit specifications (columns (1) to
(3)). In column (1), the dependent variable takes value 1 if a bank k has cross-border assets,
in column (2), if it has cross-border liabilities and, in column (3), if it has FDI in a given
country i. In addition, I test for the effects of size and efficiency on the volume of banks’
foreign operations using OLS regressions. In columns (4) and (6), the dependent variables
are the cross-border assets and liabilities, respectively, of bank k in country i. In column
(5) (column (7)), the assets (liabilities) on the balance sheets of foreign affiliates are used
as the regressand.28 Each of the dependent variables is regressed on size and, alternatively,
25For a detailed description of the data source, see Buch, Koch and Koetter (2011).26Profit and loss data and data on the number of employees is for the parent bank including its branches
abroad. However, subsidiaries are excluded. Data for parent banks only is not available.27For more details on variables and data sources, see the data appendix.28In this case, assets/liabilities correspond to the positions of all affiliates of bank k located in country i
toward residents of country i (so called local assets/liabilities). They comprise only the local business of theaffiliates excluding the activities that these entities conduct with residents from other countries.
23

on the ratio of overhead costs to total assets. All specifications include country-fixed effects
and dummies for the type of bank.29 Standard errors are clustered at the bank level. The
highly significant regression coefficients clearly show that the probability that a bank has
foreign assets, foreign liabilities and FDI increases with the size of its domestic business and
its efficiency. Larger banks also hold more foreign assets and liabilities on their domestic
balance sheets as well as on the balance sheets of their foreign affiliates.
3.2 Sorting on Host Country Characteristics
Propositions 4 and 5 predict that the cross-border lending cutoff and the cross-border borrow-
ing cutoff decrease ceteris paribus in the efficiency of the banking sector in the host country,
in variable transactions costs, and in the fixed costs attributed to lending and borrowing in
the host country. Moreover, the cross-border lending cutoff is expected to be higher and the
cross-border borrowing cutoff to be the lower, the lower the capital-labor ratio in the host
country is.
I test these hypotheses in the narrowest possible way by focussing on the behavior of
the different cutoffs measured by the least efficient bank that holds cross-border assets or
liabilities in a given market. To explore whether cutoffs vary with host country characteristics
as the theory prescribes, I regress the log of the overhead costs of the least efficient bank
that has positive cross-borders assets or liabilities in a given host country on host country
variables. As an alternative to the log of overhead costs, I also employ the two other efficiency
measures and use the log of size and the log of the labor productivity of the least efficient
bank as the dependent variable.
Efficiency of the banking sector in the host country is proxied by the average overhead
costs to total assets of all banks residing in the country. This measure comes from the
Financial Structure Database provided by the World Bank. As it is endogenous to the
operations of foreign banks because it is computed including foreign banks, the variable
is lagged by 5 years. Capital abundance of country i is measured by the human-capital
29Nine dummy variables indicate whether an entity is a i) commercial bank, ii) state bank, iii) savingsbank, (iv) cooperative central bank, v) cooperative savings bank, vi) building credit society, vii) bank withspecial functions, viii) savings and loan association, iv) other.
24

adjusted capital-labor ratio of country i. A country’s capital-labor ratio is endogenous to
foreign borrowing and lending so this measure is also lagged by five years. In the regression,
I include the negative of the log of the capital-labor ratio of country i and interpret it as a
measure of the return to capital. Variable transaction costs are proxied by distance between
the home and the host country. Financial freedom, which captures bank entry barriers, and
the bureaucratic quality in the host country are used as proxies for fixed costs. Ideally, one
would like to have separates measures for the fixed cost of cross-border operations and the
fixed cost of FDI. These are, however, not available. Overhead costs, GDP, GDP per capita
as well as distance enter the regression in logs.
Table 4 summarizes the signs of the different coefficients that are expected from the
model. Signs depend on whether the cross-border lending or the cross-border borrowing
cutoff is analyzed as well as on the dependent variable that is used. The upper panel of
table 4 summarizes the effects of host country characteristics on the cross-border lending
cutoff. The lower panel shows the effects on the cross-border borrowing cutoff. In both
panels, column (1) indicates the expected signs if the dependent variable collects maximum
overhead costs. Signs should switch when bank size or labor productivity is used (see column
(2)). As a robustness check, I also run regressions on the number of banks that are active
in a given host market. The expected signs of the coefficient are the same as in column (1).
Table 6 shows the results for the cross-border lending cutoff. Summary statistics of the
underlying sample are reported in table 5. There is one observation for each country in the
sample resulting in a total of 86. Column (1) of table 6 displays the estimated coefficients
when the dependent variable collects maximum overhead costs. With the exception of the
coefficient on the return to capital, all estimates are highly significant and consistent with
the model predictions. The positive coefficient on host country overhead costs implies that
the efficiency of the least efficient bank that holds positive cross-border assets decreases with
the efficiency of the banking sector in the host country. The estimates related to financial
openness and bureaucratic quality indicate that lower fixed costs increase the cross-border
lending cutoff. Distance has a negative effect: banks that operate in a country that is further
away are more efficient. Finally, the larger the host market is, the higher the overhead costs
of the least efficient bank are that holds positive cross-border assets.
25

Columns (2) and (3) show the effects on minimum size and minimum labor productivity.
The signs of the coefficients are exactly the opposite of those in column (1), as expected. In
column (4), the number of active banks in a host country is used as the dependent variable,
confirming again the hypotheses of the model. The R2 is remarkably high throughout.
Around 70% of the variation in the cross-border lending cutoff is explained by the covariates.
In table 7, the same exercise is conducted as in table 6 but now for the cross-border
borrowing cutoff. As before, the dependent variable reflects maximum overhead costs in
column (1). Column (2) uses size, and column (3) uses the labor productivity of the least
efficient banks that holds positive liabilities. In column (4), the number of banks with positive
cross-border liabilities is the regressand. Coefficients are highly significant and strongly
support the model. As for cross-border assets, the efficiency of the least efficient bank that
is active abroad is higher in countries that host more efficient banking sectors. In contrast to
the regressions based on assets, the return coefficient is now significant. It indicates that the
efficiency of banks that have cross-border liabilities is higher in host countries that exhibit
higher returns to capital, consistent with the theory.
The regressions in table 6 and 7 show a negative effect of GDP per capita on both the
extensive margin of cross-border lending and the extensive margin of cross-border borrowing.
Only the most efficient banks lend and borrow in higher income countries. This is in contrast
to evidence on manufacturing firms in Yeaple (2009) who finds that only the most productive
manufacturing firms have FDI in lower income countries.
Note that all results for both cutoffs also hold when the average efficiency of all banks
operating in a given country is used as the dependent variable instead of the efficiency of
the least efficient bank. With all coefficients showing the expected signs for both cutoffs, the
analysis provides strong evidence that banks sort into cross-border lending and borrowing
based on host country characteristics as the model prescribes. Evidence in line with sorting
according to the return to capital and banking sector efficiency in the host country is partic-
ularly relevant. These findings suggest that differences in factor endowments and differences
in technology drive banking across borders, consistent with the theory and in support of the
trade perspective proposed in this paper.
26

According to proposition 6, the efficiency of the least efficient bank with FDI in a given
country decreases in the fixed and variable costs of cross-border operations, increases in the
fixed cost of FDI and increases in the efficiency of the banking sector in the host country.
The effect of the return to capital in the host country is ambiguous because FDI can be a
means of both borrowing and lending abroad. I repeat the exercise in tables 6 and 7 for FDI
including all control variables as before to make the regression results comparable. Table
8 shows the results. Coefficients are mostly insignificant. This may be due to the small
number of observations in the underlying sample, which is reduced to 37.30 The values of
the R2 displayed are very similar to those obtained from the previous regressions however,
suggesting that the model fits equally well.
The distance coefficient is significant in all columns. It exhibits signs that are in opposi-
tion to what the theory predicts. The estimates imply that the efficiency of the least efficient
bank that engages in FDI declines with distance. This result is not surprising though as dis-
tance may also be correlated with the fixed cost of FDI. I show in the next section that
results do support a proximity-fixed cost tradeoff, when the relative effect on the margins is
considered.
3.3 Cross-border Lending and Borrowing versus FDI
Another way to test the predictions of the model is to analyze the behavior of the FDI
cutoff relative to the the cross-border lending or the cross-border borrowing cutoff. The
model predicts that the gap between the FDI cutoff and the cross-border cutoffs decreases
as variable costs increase. The gap should be larger if the fixed costs related to establishing
a presence in the foreign market are higher.
I test for this hypothesis explicitly by regressing the log difference between the average
efficiency of banks that do FDI and the average efficiency of banks that engage in cross-
border lending in a given country on the proxies of variable costs and fixed costs. Distance
should have a negative effect on the log difference. Bureaucratic quality and financial free-
dom should have a positive effect if financial freedom and bureaucratic quality impede FDI
30In 2005, German banks had FDI in 58 countries compared to positive cross-border assets (liabilities) in177 (178) countries.
27

more than cross-border operations. Table 9 reports the results. While coefficients on bureau-
cratic quality and financial freedom are insignificant, the distance coefficient in column (2)
is significant and exhibits a negative sign consistent with the theory. This suggests that the
average efficiency of banks that engage in FDI versus banks that extend loans cross-border is
more similar if the variable costs of operating from home are high.31 The R2 is high, taking
a value of 0.495.
In the following, alternative evidence for the presence of a proximity-fixed cost tradeoff is
presented, which goes beyond the theoretical framework developed in this paper. I test for
a proximity-cost tradeoff on the intensive margin as opposed to the extensive margin. By
regressing the ratio of local assets to cross-border assets of bank k on country variables, I
investigate whether banks that are engaged in cross-border lending and FDI, operate more
through foreign affiliates if variable costs are high and fixed costs are low. As an alternative
to local and cross-border assets, I also use the ratio of banks’ local liabilities to cross-border
liabilities and the ratio of the sum of assets and liabilities as dependent variables. The log
of GDP and the log of GDP per capita are added to control for systematic differences in the
ratios arising from differences in economic development and size similar to before.
The number of banks that engage in FDI in any given year is small.32 In order to increase
sample size, a pseudo cross-section is constructed. While the universe of German banks is
only observed in the year 2005, panel data is available for those banks that have at least one
branch or subsidiary abroad in the period from 2002 and 2009. The sample uses the base
year 2005 and includes bank-country observations of the other years if these are not already
in the sample. Bank-country observations are unique in the pseudo cross-section.33 Columns
(1) to (3) show the results based on the enlarged sample. Regressions in columns (4) to (6)
are based on the full panel where the same bank-country pair is observed over several years.
In columns (1) and (4) of table 10, the dependent variable is based on assets, in column
(2) and (5) on liabilities. Columns (3) and (6) use the sum of assets and liabilities. All
regressions include year-fixed effects and bank-fixed effects. Standard errors are clustered on
31Coefficient are mostly insignificant when the average efficiency of banks that have positive liabilities inany given country or if the log difference between minimum efficiencies is used.
32In 2005, only 52 out of 1998 banks have at least one affiliate in at least one country.33I start with the base year 2005 and add all bank-country observations of the year 2006 that are not
already in the sample. Then additional pairs are included that are observed in 2004, 2007, 2003 and so on.
28

host countries.
The distance coefficient is positive and significant at a 10% significance level in all six
columns of table 10. Banks hold more assets and liabilities on the balance sheet of their
affiliates than on their own in more distant countries, that is, if variable transaction costs
are higher. The coefficients related to bureaucratic quality and financial freedom are all
positive. Standard errors are in part large but overall the regressions show a negative effect
of fixed costs on the ratio. This suggests that bureaucratic quality and financial freedom
decrease the costs related to FDI more than the fixed costs of cross-border operations. Note
that the effect of GDP per capita is highly significant and negative indicating that banks
operate more through foreign affiliates in less developed countries similar to the effect of
GDP per capita on the extensive margins. Together, the results provide strong evidence for
the presence of a proximity-fixed cost tradeoff in banking. Such a tradeoff has been modeled
and discussed before, but this paper provides the first evidence for its empirical relevance.
4 Conclusions
Banks differ substantially in their foreign activities. In this paper, I allow for within-country
heterogeneity in bank efficiency in a general equilibrium model of banking across borders to
explain this variation. The model is consistent both with recent evidence on sorting of banks
into cross-border lending and FDI, and with aggregate patterns of foreign bank positions. It
also delivers predictions regarding the extensive margin of bank assets and liabilities that go
beyond the existing evidence. I focus theoretically and empirically on these new bank-level
implications. In line with the theory, I find that the efficiency of the least efficient bank
that is active in a given country is higher the higher the efficiency of the banking sector in
that country, the further away the market and the higher the costs of operating there. I also
present evidence for a proximity-fixed cost tradeoff in banking.
While several implications of the model also follow from alternative frameworks with
corresponding cost structures, sorting with respect to banking sector efficiency and relative
factor endowments is a unique feature of the model, supported by the data. This finding
is additional evidence for the two driving forces of banking across borders, differences in
29
banking sector efficiencies and differences in returns to capital.
Altogether, the empirical results suggest that fixed costs play a key role for the foreign
operations of banks. Only larger banks are able to overcome these costs, channel capital
across borders and potentially supply low cost intermediation services to entrepreneurs and
depositors in foreign markets. Global banks are necessarily bigger than purely domestic
banks.
In the theoretical framework presented, a single bank either invests abroad or at home.
Similarly, it either raises deposits at home or abroad. This result is altered if the success
of firms is not perfectly correlated and capitalists are risk averse. Another characteristic of
the model is that banks are capacity constrained. As a consequence, the volume of foreign
lending and borrowing adjusts primarily through the extensive margin. This would change
if equity was traded. Introducing diversification into the model and allowing for mergers and
acquisitions are promising avenues for future research.
30

References
Antras, Pol, and Ricardo J. Caballero. 2009. “Trade and Capital Flows: A Financial
Frictions Perspective.” Journal of Political Economy, 117(4): 701–744.
Barro, Robert J., and Jong-Wha Lee. 2010. “A New Data Set of Educational Attain-
ment in the World, 19502010.” National Bureau of Economic Research NBER Working
Papers 15902.
Beck, Thorsten, Asli Demirguc-Kunt, and Ross Levine. 2009. “Financial institutions
and markets across countries and over time - data and analysis.” The World Bank Policy
Research Working Paper Series 4943.
Bernard, Andrew B., J. Bradford Jensen, Stephen J. Redding, and Peter K.
Schott. 2012. “The Empirics of Firm Heterogeneity and International Trade.” Annual
Review of Economics, 4(1): null.
Bernard, Andrew B., Jonathan Eaton, J. Bradford Jensen, and Samuel Kor-
tum. 2003. “Plants and Productivity in International Trade.” American Economic Review,
93(4): 1268–1290.
Brevoort, Kenneth P, and John D Wolken. 2009. “Does distance matter in banking?”
The Changing Geography of Banking and Finance, 27–56.
Buch, Claudia M. 2003. “Information or Regulation: What Drives the International Ac-
tivities of Commercial Banks.” Journal of Money Credit and Banking, 35(6): 851–869.
Buch, Claudia M. 2005. “Distance and International Banking.” Review of International
Economics, 13(4): 787–804.
Buch, Claudia M., and Alexander Lipponer. 2007. “FDI versus exports: Evidence
from German banks.” Journal of Banking & Finance, 31(3): 805–826.
Buch, Claudia M., Catherine Tahmee Koch, and Michael Koetter. 2009. “Margins
of International Banking: Is there a Productivity Pecking Order in Banking, too?” CESifo
Group Munich CESifo Working Paper Series 2891.
31

Buch, Claudia M., Catherine Tahmee Koch, and Michael Koetter. 2011. “Size,
productivity and international banking.” Journal of International Economics, 85(2): 329–
334.
De Blas, Beatriz, and Katheryn Russ. 2010. “FDI in the Banking Sector.” National
Bureau of Economic Research NBER Working Papers 16029.
De Blas, Beatriz, and Katheryn Russ. 2012. “All banks great, small, and global: Loan
pricing and foreign competition.” International Review of Economics and Finance. Forth-
coming.
Degryse, Hans, and Steven Ongena. 2005. “Distance, Lending Relationships, and Com-
petition.” The Journal of Finance, 60(1): 231–266.
Ennis, Huberto M. 2001. “On the size distribution of banks.” Economic Quarterly, Fall: 1–
25.
Focarelli, Dario, and Alberto F. Pozzolo. 2005. “Where Do Banks Expand Abroad?
An Empirical Analysis.” Journal of Business, 78(6): 2435–2464.
Francois, Joseph, and Bernard Hoekman. 2010. “Services Trade and Policy.” Journal
of Economic Literature, 48(3): 642–92.
Hall, Robert, and Charles I. Jones. 1999. “Why Do Some Countries Produce So Much
More Output Per Worker Than Others?” The Quarterly Journal of Economics, 114(1): 83–
116.
Helpman, Elhanan, Marc J. Melitz, and Stephen R. Yeaple. 2004. “Export Versus
FDI with Heterogeneous Firms.” American Economic Review, 94(1): 300–316.
Holmstrom, Bengt, and Jean Tirole. 1997. “Financial Intermediation, Loanable Funds,
and the Real Sector.” The Quarterly Journal of Economics, 112(3): 663–91.
Ju, Jiandong, and Shang-Jin Wei. 2010. “Domestic Institutions and the Bypass Effect of
Financial Globalization.” American Economic Journal: Economic Policy, 2(4): 173–204.
32

Lehner, Maria. 2009. “Entry mode choice of multinational banks.” Journal of Banking
and Finance, 33: 1781–1792.
Mayer, Thierry, and Soledad Zignago. 2005. “Market Access in Global and Regional
Trade.” CEPII research center Working Papers 2005-02.
Melitz, Marc J. 2003. “The Impact of Trade on Intra-Industry Reallocations and Aggregate
Industry Productivity.” Econometrica, 71(6): 1695–1725.
Mrazova, Monika, and J. Peter Neary. 2011. “Selection effects with heterogeneous
firms.” University of Oxford, Department of Economics Economics Series Working Papers
588.
Niepmann, Friederike. 2012. “Banking across Borders.” Federal Reserve Bank of New
York Staff Reports 576.
Papaioannou, Elias. 2009. “What drives international financial flows? Politics, institutions
and other determinants.” Journal of Development Economics, 88(2): 269–281.
Yeaple, Stephen R. 2009. “Firm heterogeneity and the structure of U.S. multinational
activity.” Journal of International Economics, 78(2): 206–215.
Appedix A: Proofs
Proof of Proposition 1
The bank entry cutoff is the solution to the following equation:
1 =
∫ γ∗
γ
(R− γ∗
λ)(λ− λL)
γ − (λ− λL)γ∗
λ
g(γ)dγ, (4.27)
The RHS of the equation is continuously increasing in γ∗ because the integral increases in γ∗
and ∂n(.)/∂γ∗ > 0. For γ∗ = γ, the RHS of the above equation is 0. For γ∗ → γ/(1−λL/λ),
RHS→∞. Thus the function has a unique solution where γ∗ ∈]γ, γ/(1−λL/λ)[, which shows
that γ∗ < γ/(1− λL/λ) so that the ICC of all active bankers always binds in equilibrium.
33

Proof of Proposition 2
πB(−R, RD, γ) is supermodular in−R and γ and in RD and γ. Supermodularity of πB(−R, γ)
corresponds to πB−R,γ > 0.
− ∂π2
∂ − R∂γ=
RD(λ− λL)λL
(RD(λ− λL)− R(λ− λL) + γ)3
(−RD(λ− λL) + R(λ− λL) + γ
). (4.28)
The first term, the fraction, is positive given that v(γ) is positive, i.e. that the ICC of the
banker binds. The second term in brackets is also positive if RD < R. Both conditions holds
in equilibrium. Therefore π−R,γ > 0.
Supermodularity of π(RD, γ) corresponds to πRD,γ > 0.
− ∂π2
∂RD∂γ=
λL(λ− λL)
(RD(λ− λL)− R(λ− λL) + γ)3
((R(λ− λL)− γ)(R− RD) + γRD
). (4.29)
The first term, the fraction, is positive given that v(γ) is positive. The second term in
brackets is also positive if RD < R and R(λ − λL) − γ > 0. The three conditions hold in
equilibrium. Therefore πBRD,γ
> 0.
Assume Rj < τRi. Supermodularity of π(−R, γ) implies that for any two bankers of
type γ1 and γ2 < γ1:
π(Rj, γ1)− π(Rj, γ2) > π(τRi, γ1)− π(τRi, γ2) (4.30)
⇒ π(τRi, γ2)− π(Rj, γ2) > π(τRi, γ1)− π(Rj, γ1) (4.31)
⇒ π(τRi, γ2)− fLij − π(Rj, γ2) > π(τRi, γ1)− fLij − π(Rj, γ1) (4.32)
⇒ πX,jij (γ2)− πX,jjj (γ2) > πX,jij (γ1)− π
X,jjj (γ1) (4.33)
This relationship holds for any pair of bankers. Let γL,Xj denote the banker who is indifferent
between investing at home and abroad. If some bankers invest abroad while others invest
only at home, then this implies that all bankers of type γj ≤ γL,Xj invest abroad while
all bankers for whom γj > γL,Xj invest at home. A similar logic applies to sorting into
cross-border borrowing and sorting into FDI.
34

Proof of Proposition 3
To show: The solution to the system is unique.
Note that the equations that determine the different cutoffs, which are quadratic equa-
tions, have at most one solution that is permissible. Therefore equations 16 and 17 as well as
equation 22 to 26 give the following variables as functions of Kij, γ∗i and γ∗j . Rj(Kij), Ri(Kij),
RDi (Kij, γ
∗i ), R
Dj (Kij, γ
∗j), γ
Bi (γ∗i , γ
∗j , Kij), γ
Fi (γ∗i , γ
∗j , Kij), γ
Lj (γ∗j , Kij) and γFj (γ∗j , Kij).
It is easy to derive the following partial derivatives using implicit function theorems.
∂Ri
∂Kij< 0,
∂Rj
∂Kij> 0,
∂RDi
∂Kij< 0,
∂RDj
∂Kij> 0,
∂RDi
∂γ∗i< 0,
∂RDj
∂γ∗j< 0,
∂γLj∂γ∗j
> 0,∂γLjKij
< 0,∂γFj∂γ∗j
> 0,
∂γFjKij
< 0 ,∂γBi∂γ∗i
< 0,∂γBi∂γ∗j
> 0,∂γBi∂Kij
< 0,∂γFi∂γ∗i
< 0,∂γFi∂γ∗j
> 0,∂γFi∂Kij
< 0.
The system reduces to a system of three equations in three unknown, Kij, γ∗i and γ∗j :
Kij = Kj
∫ γFj
γj
n(γj, Ri, RDj )gj(γj)dγj +Kj
∫ γLj
γFj
n(γj, τRi, RDj )gj(γj)dγj (4.34)
+ Ki
∫ γFi
γi
n(γi, Ri, RDj )gi(γi)dγi +Ki
∫ γBi
γFi
n(γi, Ri, φRDj )gi(γi)dγi
− Ki
∫ γBi
γi
gi(γi)dγi.
Kj −Kij = Kj
∫ γ∗j
γLj
n(γj, Rj, RDj )gj(γj)dγj. (4.35)
1 =
∫ γBi
γi
gi(γi)dγi +
∫ γ∗i
γBi
ni(γi, Ri, RDi )gi(γi)dγi. (4.36)
For any given γ∗j and γ∗i , equation (4.34) gives a unique solution of Kij; Kij(γ∗j , γ∗i ). While
the LHS strictly increases going from zero to infinity for Kij ∈ [0, Kij(Ri = Rj) < Kj], the
RHS strictly decreases going from Kj to 0. (To see this note that the volume of lending n
in the first four terms decreases as Kij increases. Furthermore all four cutoffs go down.).
Applying the implicit function theorem,dKij
dγ∗i< 0 and
dKij
dγ∗j> 0. Note also that
dγLjdγ∗j
< 0
anddγBidγ∗i
< 0. An increase in Kij only happens if n(.) increases through changes in deposit
rates and gross returns, which at the same time change γLj and γBi .
Equation 4.35 delivers a unique solution for γ∗j as a function of γ∗j . The LHS of equation
35

4.35 decreases in γ∗j becausedKij
dγ∗j> 0 taking a positive value in the range ]0, Kj] because
0 ≤ Kij < Kj. The RHS strictly increases in γ∗j from 0 to a value above Kj for γ∗j ∈ [γj, γj]
becausedγLjdγ∗j
< 0,∂nj(Rj ,R
Dj )
∂Kij> 0 and
∂nj(Rj ,RDj )
dγ∗j> 0. Thus there exists a unique γ∗i (γ
∗j).
BecausedKij
dγ∗i< 0,
dγ∗jdγ∗i
> 0.
Equation 4.36 delivers a unique solution for γ∗i . The RHS of equation 4.36 strictly
increases in γ∗i from 0 to a value that is greater than 1 for γi ∈ [γj, γj] becausedγBidγ∗i
< 0,
dKij
dγ∗i< 0. Therefore the solution to the system is unique.
Proof of Proposition 4
(i) To show:dγLjdγi
> 0.dγLjdγi
=∂γLj∂γi
+∂γLj∂Kij
dKij
dγi+
∂γLj∂γ∗j
dγ∗jdγi
. It is easy to see that∂γLj∂γi
= 0,∂γLj∂Kij
< 0
and∂γLj∂γ∗j
> 0.dKij
dγi< 0. Suppose not, i.e.
dKij
dγi≥ 0. Then
dKjij
dγi=
∂Kjij
∂γi+
∂Kjij
∂Kij
dKij
dγi< 0 and
dKiij
dγi=
∂Kiij
∂γi+
∂Kiij
∂Kij
dKij
dγi< 0, which is a contradiction. Next,
dγ∗jdγi
> 0. To see why, consider
the capital market clearing condition of country j:
Kj −Kij =
∫ γ∗j
γLj
n(γj, Rj, RDj )gj(γj)dγj. (4.37)
dK∗ij
dγi< 0 and
∂γLj∂Kij
> 0, and∂n(γj ,Rj ,R
Dj )
∂Kij> 0 ⇒ dγ∗j
dγi> 0. Therefore
dγLjdγi
> 0.
(ii)dγLjd1/Li
< 0.dγLjd1/Li
=∂γLj∂1/Li
+∂γLj∂Kij
dKij
d1/Li+
∂γLj∂γ∗j
dγ∗jd1/Li
.∂γLj∂1/Li
< 0,∂γLj∂Kij
< 0 and∂γLj∂γ∗j
> 0.
SupposedγLjd1/Li
≥ 0. ThendKj
ij
d1/Li> 0 and also
dKiij
d1/Li> 0. If
dKiij
d1/Li> 0, then
dγ∗jd1/Li
< 0. But thendγLjd1/Li
< 0, which is a contradiction.
(iii) To show:dγLjdfLij
< 0. SupposedγLjdfLij≥ 0.
dγLjdfLij
=∂γLj∂fLij
+∂γLj∂Kij
dKij
dfLij+
∂γLj∂γ∗j
dγ∗jdfLij
. Because
∂γLj∂fLij
< 0,∂γLj∂Kij
< 0 and∂γLj∂γ∗j
> 0, fordγLjdfLij≥ 0, either
dKij
dfLij< 0 and/or
dγ∗jdfLij
> 0. GivendγLjdfLij≥ 0,
dKij
dfLij> 0 using
∂γFj∂fLij
> 0, and hencedγ∗jdfLij
< 0. This impliesdγLjdfLij
< 0 so there is a contradiction.
(iv) To show:dγLjdτ
> 0. SupposedγLjdτ≤ 0.
dγLjdτ
=∂γLj∂τ
+∂γLj∂Kij
dKij
dτ+
∂γLj∂γ∗j
dγ∗jdτ
. Because
∂γLj∂τ
> 0,∂γLj∂Kij
< 0 and∂γLj∂γ∗j
> 0, fordγLjdτ≤ 0, either
dKij
dτ> 0 and/or
dγ∗jdτ
< 0. But given
dγLjdτ≤ 0,
dKij
dτ< 0 using
∂γFj∂τ
< 0, and hencedγ∗jdτ
> 0. This impliesdγLjdτ
> 0. So there is a
contradiction.
(v) To show:dγLjdfFij
> 0. SupposedγLjdfFij≤ 0.
dγLjdfFij
=∂γLj∂Kij
dK∗ij
dfFij+
∂γLj∂γ∗j
dγ∗jdfFij
. Because∂γLj∂Kij
< 0
36

and∂γLj∂γ∗j
> 0, fordγLjdfFij≤ 0, either
dKij
dfFij> 0 and/or
dγ∗jdfFij
< 0. GivendγLjdfFij≤ 0,
dKij
dfFij< 0 using
∂γFj∂fFij
> 0, and hencedγ∗jdfFij
< 0. ThendγLjdfFij
> 0, which is a contradiction.
Proof of Proposition 5
(i) To show:dγBidγj
> 0. Note that∂Kj
ij
∂γj< 0 and
∂γ∗j∂γj
> 0. SupposedγBidγj≤ 0. If
dγBidγj≤ 0, then
dKiij
dγj≤ 0 and
dγ∗idγj≤ 0. Yet if
dKiij
dγj≤ 0 ⇒ dKij
dγj< 0 ⇒ dγ∗j
dγj> 0 and
dγ∗idγj
< 0. But this implies
dγBidγj
> 0, which is a contradiction.
(ii) To showdγBid1/Lj
> 0.dγBid1/Lj
=∂γBi∂1/Lj
+∂γBi∂Kij
dK∗ij
d1/Lj+∂γBi∂γ∗j
dγ∗jd1/Lj
+∂γBi∂γ∗i
dγ∗id1/Lj
. SupposedγBid1/Lj
≤ 0,
thendKij
d1/Lj< 0 ⇒ dγ∗j
d1/Lj> 0 and
dγ∗id1/Lj
< 0. But thendγBid1/Lj
< 0, which is a contradiction.
(iii) To show:dγBidfBji
< 0. SupposedγBidfBji≥ 0.
dγBidfBji
=∂γBi∂fBji
+∂γBi∂Kij
dKij
dfBji+
∂γBi∂γ∗i
dγ∗idfBji
+∂γBi∂γ∗j
dγ∗jdfBji
.
Because∂γBi∂fBji
< 0,∂γBi∂Kij
< 0,∂γBi∂γ∗j
> 0 and∂γBi∂γ∗i
< 0, fordγBidfBji≥ 0, either
dKij
dfBji< 0 and/or
dγ∗jdfBji
> 0 and/ordγ∗idfBji
< 0 . But givendγBidfBji≥ 0,
dKiij
dfBji> 0 using
∂γFi∂fBji
> 0, and thereforedγ∗idfBji
> 0
anddγ∗jdfBji
< 0. This impliesdγBidfBji
< 0 so there is a contradiction.
(iv) To show:dγBidφ
< 0. SupposedγBidφ≥ 0.
dγBidφ
=∂γBi∂φ
+∂γBi∂Kij
dKij
dφ+
∂γBi∂γ∗i
dγ∗idφ
+∂γBi∂γ∗j
dγ∗jdφ
.
Because∂γBi∂φ
< 0,∂γBi∂Kij
< 0,∂γBi∂γ∗j
> 0 and∂γBi∂γ∗i
< 0, fordγBidφ≥ 0, either
dKij
dφ< 0 and/or
dγ∗jdφ
> 0 and/ordγ∗idφ
< 0 . But givendγBidφ≥ 0,
dKiij
dφ> 0 using
∂γFi∂φ
> 0, and thereforedγ∗idφ
> 0
anddγ∗jdφ
< 0. This impliesdγBidφ
< 0, which is a contradiction.
(v) To show:dγBidfFji
> 0. SupposedγBidfFji≤ 0.
dγBidfFji
=∂γBi∂Kij
dKij
dfFji+
∂γBi∂γ∗j
dγ∗jdfFji
+∂γBi∂γ∗i
dγ∗idfFji
. Because
∂γBi∂Kij
< 0,∂γBi∂γ∗j
> 0 and∂γBi∂γ∗i
< 0, fordγBidfFji≤ 0, either
dKij
dfFij> 0 and/or
dγ∗jdfFji
< 0 and/ordγ∗idfFji
> 0.
GivendγBidfFji≤ 0,
dKij
dfFji< 0 using
∂γFi∂fFji
< 0. Thendγ∗jdfFji
> 0 anddγ∗idfFji
< 0, which impliesdγBidfFji
> 0
so there is a contradiction.
Proof of Proposition 6
(i) To show:dγFjdγi
> 0.dγFjdγi
=∂γFj∂γi
+∂γFj∂Kij
dKij
dγi+
∂γFj∂γ∗j
dγ∗jdγi
. It is easy to see that∂γFj∂γi
= 0,∂γFj∂Kij
< 0
and∂γFj∂γ∗j
> 0. UsingdKij
dγi< 0 and
dγ∗jdγi
> 0 as shown in the proof of proposition 4 (i),dγFjdγi≥ 0.
To show:dγFidγj
> 0. As shown in the proof of proposition 5 (i),dγBidγj
> 0 because of
equilibrium changes in Ri and RDj . If the equilibrium gross return is higher and/or the
equilibrium deposit is lower, thendγFidγj
> 0 becausedγFidRi
> 0 anddγFidRD
j< 0.
37

(ii) To show:dγFjdfLij
> 0. SupposedγFjdfLij≤ 0.
dγFjdfLij
=∂γFj∂fLij
+∂γLj∂Kij
dKij
dfLij+
∂γLj∂γ∗j
dγ∗jdfLij
. Because
∂γFj∂fLij
> 0,∂γFj∂Kij
< 0 and∂γFj∂γ∗j
> 0, fordγFjdfLij≤ 0, either
dKij
dfLij> 0 and/or
dγ∗jdfLij
< 0. GivendγFjdfLij≤ 0,
dKij
dfLij< 0 using
∂γLj∂fLij
< 0, anddγ∗jdfLij
> 0. So there is a contradiction.
To show:dγFidfBji
< 0. SupposedγFidfBji≤ 0.
dγFidfBji
=∂γFi∂fBji
+∂γFi∂Kij
dKij
dfBji+
∂γFi∂γ∗i
dγ∗idfFji
+∂γBi∂γ∗j
dγ∗jdfBji
. Because
∂γFi∂fBji
> 0,∂γFi∂Kij
< 0,∂γFi∂γ∗j
> 0 and∂γFi∂γ∗i
< 0, fordγFidfBji
< 0, eitherdK∗
ij
dfBji> 0 and/or
dγ∗jdfBji
< 0 and/or
dγ∗idfBji
> 0 . But givendγFidfBji≤ 0,
dKi,∗ij
dfBji< 0 using
∂γBi∂fBji
< 0, and thereforedγ∗idfBji
< 0 anddγ∗jdfBji
> 0.
So there is a contradiction.
(iii) To show:dγFjdτ
< 0. SupposedγFjdτ≥ 0.
dγFjdτ
=∂γFj∂τ
+∂γFj∂Kij
dKij
dτ+
∂γFj∂γ∗j
dγ∗jdτ
. Because
∂γFj∂τ
< 0,∂γFj∂Kij
< 0 and∂γFj∂γ∗j
> 0, fordγFjdτ≥ 0, either
dKij
dτ< 0 and/or
dγ∗jdτ
> 0. But given
dγFjdτ≥ 0,
dKij
dτ> 0 using
∂γLj∂τ
> 0, anddγ∗jdτ
< 0. So there is a contradiction.
To show:dγFidφ
> 0. SupposedγFidφ≤ 0.
dγFidφ
=∂γFi∂φ
+∂γFi∂Kij
dKij
dφ+
∂γFi∂γ∗i
dγ∗idφ
+∂γFi∂γ∗j
dγ∗jdφ
. Because
∂γFi∂φ
> 0,∂γFi∂Kij
< 0,∂γFi∂γ∗j
> 0 and∂γFi∂γ∗i
< 0, fordγFidφ
< 0, eitherdKij
dφ> 0 and/or
dγ∗jdφ
< 0 and/or
dγ∗idφ
> 0 . But givendγFidφ≤ 0,
dKij
dφ< 0 using
∂γBi∂φ
< 0 and thereforedγ∗idφ
< 0 anddγ∗jdφ
> 0. So
there is a contradiction.
(iv) To show:dγFjdfFij
< 0. SupposedγFjdfFij≥ 0.
dγFjdfFij
=∂γFj∂fFij
+∂γFj∂Kij
dKij
dfFij+
∂γFj∂γ∗j
dγ∗jdfFij
. Because
∂γFj∂fFij
< 0,∂γFj∂Kij
< 0 and∂γFj∂γ∗j
> 0, fordγFjdfFij≥ 0, either
dKij
dfFij< 0 and/or
dγ∗jdfFij
> 0. GivendγFjdfFij≥ 0,
dKij
dfFij> 0 and
dγ∗jdfFij
< 0. So there is a contradiction.
To show:dγFidfFji
< 0. SupposedγFidfFji≥ 0.
dγFidfFji
=∂γFi∂fFji
∂γFi∂Kij
dKij
dfFji+
∂γFi∂γ∗j
dγ∗jdfFji
+∂γFi∂γ∗i
dγ∗idfFji
. Because
∂γFi∂fFji
< 0,∂γFi∂Kij
< 0,∂γFi∂γ∗j
> 0 and∂γFi∂γ∗i
< 0, fordγFidfFji
> 0, eitherdKij
dfFij< 0 and/or
dγ∗jdfFji
> 0 and/or
dγ∗idfFji
< 0. GivendγFidfFji≥ 0,
dKij
dfFji> 0,
dγ∗jdfFji
< 0 anddγ∗idfFji
> 0. So there is a contradiction.
Appendix B: General Model with τ = φ = 1
In the following, I characterize the general model. I discuss the different equilibrium cases
that can occur for various parameter values and provide intuition for how the equilibrium
case changes with key parameters of the model. To reduce the dimensionality, I assume that
there are no variable costs to operating cross-border, i.e. τ = φ = 1. This removes the
decision of firms between operating from home or through FDI.
The following equilibrium cases can occur:
38

Proposition 7 Assume φ = τ = 1. Then the following equilibrium cases are conceivable
where i, j ∈ {1, 2} and i 6= j:
(i) No trade.
(ii) Cross-border lending by banking sector j: Some banks from country j invest
domestic deposits in country i. γLj exists.
(iii) Cross-border lending and local intermediation by banking sector j: Some
banks from country j invest domestic deposits in country i; others raise foreign deposits and
invest them in the foreign market. γLj and γBj both exist.
(iv) Local intermediation by banking sector j: Some banks from country j raise foreign
deposits and invest them in the foreign market. γBj exists and Ri > Rj.
(v) Local intermediation and cross-border borrowing by banking sector j: Some
banks from country j raise deposits in country i and invest them at home and abroad. γBj
exists and Ri = Rj.
(vi) Cross-border lending by banking sector j and cross-border borrowing by
banking sector i: Some banks from country j invest domestic deposits abroad, while some
banks from country i raise deposits in country j and invest them at home. γLj and γBi both
exist.
(vii) Cross-border borrowing by banking sector i: Some banks from country i raise
deposits in country j and invest them at home. γBi exists and Ri > Rj.
Proof. Assume ∆(K/L) ≥ 0 without loss of generality.
(a) ∆(K/L) ≥ 0 implies that in equilibrium Ri ≥ Rj. To see this note that if Ri > Rj in
autarky, it must be the case that Ri ≥ Ri in equilibrium. It is possible that banks source
so much foreign capital from abroad that rates of return to capital equalize in equilibrium.
If Ri = Rj in autarky, then in equilibrium Ri = Rj. This leaves the following combinations
possible:
(1) Ri > Rj & RDi < RD
j
(2) Ri > Rj & RDi > RD
j
(3) Ri > Rj & RDi = RD
j
(4) Ri = Rj & RDi < RD
j
(5) Ri = Rj & RDi > RD
j
39

(6) Ri = Rj & RDi = RD
j
(b) There are no upper limits on fLij , fLji, f
Bij and fBji . So any of these fixed costs can be
prohibitively high.
(c) In each country j ∈ {1, 2}, there are four possibilities: γLj and γBj both do not exist ,
only γLj exists, only γBj exists, both γLj and γBj exist.
(d) Investing at home is costless in any case. Therefore if Ri > Rj, all banks in country i
must invest in country i.
(e) Capital must always flow in one direction, i.e. it cannot be the case that banks from
country j invest in country i and banks from country i invest in j.
(f) If Ri = Rj, no banker incurs the fixed cost of cross-border lending in equilibrium.
(g) It is not possible that banks in both countries raise deposits abroad in equilibrium. If
RDi > RD
j only banks in country i have incentives to invest in the fixed cost of FDI.
(h) If RDi = RD
j , no banker incurs the fixed cost of cross-border borrowing in equilibrium.
Combining (a)-(h), we have that:
(1) If Ri > Rj & RDi < RD
j , γLi does not exit and γBi does not exist.
(2) If Ri > Rj & RDi > RD
j , γLi does not exit and γBi does not exist. Banks in country i all
invest in country i.
(3) If Ri > Rj & RDi = RD
j , γLi does not exit and γBi and γBj do not exist.
(4) If Ri = Rj & RDi > RD
j , γLi , γLj and γBj do not exist. Banks in both countries are
indifferent where to invest.
(5) If Ri = Rj & RDi < RD
j , γLi , γLj and γBi do not exist. Banks in both countries are
indifferent where to invest.
(6) If Ri = Rj & RDi = RD
j , γLi , γLj , γBi and γBj do not exist. The equilibrium corresponds
to autarky.
Therefore, it can be that:
(A) There is no trade. Possible in all cases.
(B) Only γLj exists. Possible for cases (1) and (2).
(C) γLj and γBj both exist: Possible for case (1).
(D) γLj and γBi both exist: Possible for case (2).
(E) γBj exists: Possible for case (1) and (5).
40
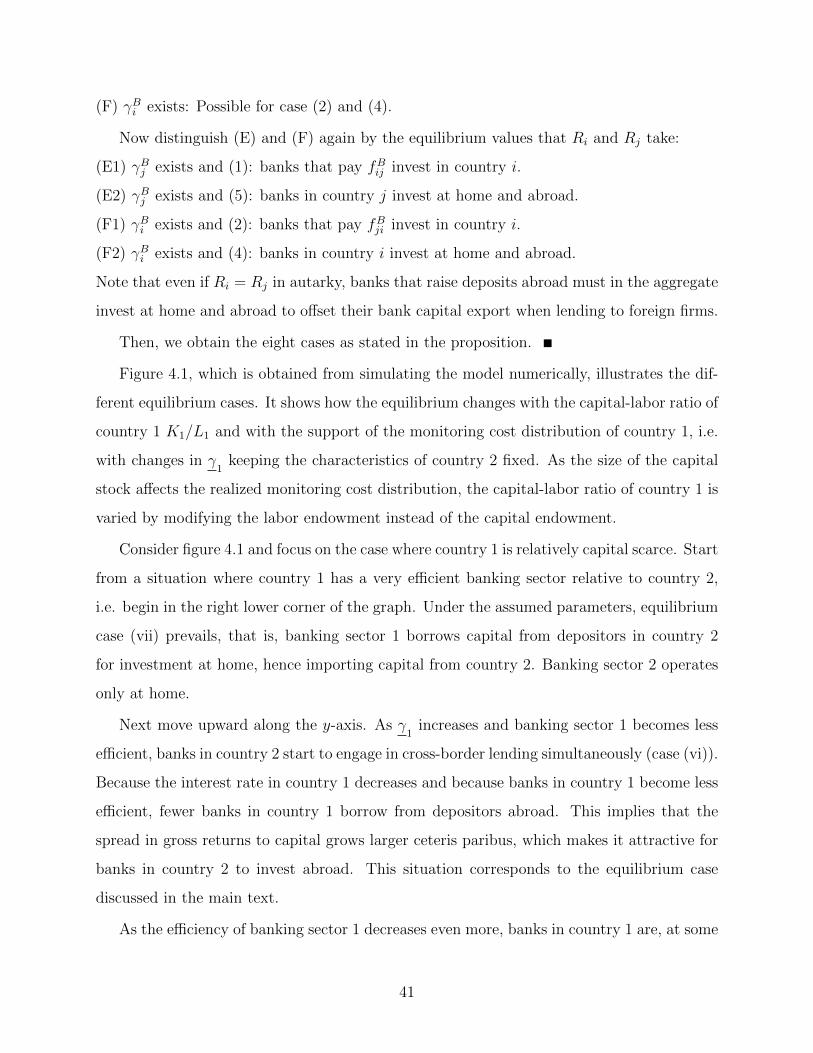
(F) γBi exists: Possible for case (2) and (4).
Now distinguish (E) and (F) again by the equilibrium values that Ri and Rj take:
(E1) γBj exists and (1): banks that pay fBij invest in country i.
(E2) γBj exists and (5): banks in country j invest at home and abroad.
(F1) γBi exists and (2): banks that pay fBji invest in country i.
(F2) γBi exists and (4): banks in country i invest at home and abroad.
Note that even if Ri = Rj in autarky, banks that raise deposits abroad must in the aggregate
invest at home and abroad to offset their bank capital export when lending to foreign firms.
Then, we obtain the eight cases as stated in the proposition.
Figure 4.1, which is obtained from simulating the model numerically, illustrates the dif-
ferent equilibrium cases. It shows how the equilibrium changes with the capital-labor ratio of
country 1 K1/L1 and with the support of the monitoring cost distribution of country 1, i.e.
with changes in γ1
keeping the characteristics of country 2 fixed. As the size of the capital
stock affects the realized monitoring cost distribution, the capital-labor ratio of country 1 is
varied by modifying the labor endowment instead of the capital endowment.
Consider figure 4.1 and focus on the case where country 1 is relatively capital scarce. Start
from a situation where country 1 has a very efficient banking sector relative to country 2,
i.e. begin in the right lower corner of the graph. Under the assumed parameters, equilibrium
case (vii) prevails, that is, banking sector 1 borrows capital from depositors in country 2
for investment at home, hence importing capital from country 2. Banking sector 2 operates
only at home.
Next move upward along the y-axis. As γ1
increases and banking sector 1 becomes less
efficient, banks in country 2 start to engage in cross-border lending simultaneously (case (vi)).
Because the interest rate in country 1 decreases and because banks in country 1 become less
efficient, fewer banks in country 1 borrow from depositors abroad. This implies that the
spread in gross returns to capital grows larger ceteris paribus, which makes it attractive for
banks in country 2 to invest abroad. This situation corresponds to the equilibrium case
discussed in the main text.
As the efficiency of banking sector 1 decreases even more, banks in country 1 are, at some
41

Figure 4.1: Equilibrium types as a function of K1/L1 and γ1
iii) Local intermediation and cross-
border lending 2
vi) Cross-border lending 2, cross-
border borrowing 1
γ1
K2/L
2 -K
1/L
1
viii) Local intermediation and
cross-border borrowing 1,
R1=R
2
vii) Cross-border borrowing 1
ii) Cross-border lending 2i) �o trade
iv) Local
intermediation 2
v) Local intermediation and
cross-border borrowing 2,
R1=R
2
The graph is obtained from simulating the model for the following parameter values:Cobb-Douglas production function with a labor share of 0.3, λL = 0.5, λ = 0.985, fL =0.13, fB = 0.16, uniform distribution, γ
2= 0.04 and γ1 = γ2 = 0.4, K2/L2 = 20/3,
K1/L1 ∈ [20/3, 20/4.5], γ1∈ [0.035, 0.05].
42

point, not efficient enough and differences in deposit rates are not large enough to make any
bank in country 1 incur the fixed cost of cross-border borrowing. In this case, only banking
sector 2 is active across borders and lends to firms in country 1 (case (ii)).
With a further decline in γ1, the deposit rate in country 1 can decrease to the point
where it is profitable for banks in country 2 not only to lend to firms in country 1 but also to
borrow from depositors in country 1. Then, banking sector 2 engages in both cross-border
lending and borrowing in equilibrium, exporting capital on net (case (iii)).
Next, consider how the equilibrium varies along the x-axis, that is, with changes in
K1/L1. Start where countries have equal capital endowments so that there is no reason why
capital should flow across borders. If differences in efficiencies are also small (γi ≈ 0.04),
there is no trade in banking services at all. The equilibrium corresponds to autarky. If,
however, one banking sector is sufficiently more efficient than the other, that banking sector
expands by intermediating foreign deposits locally. With equal gross returns to capital in
the two countries, banks incur the fixed cost of cross-border borrowing and invest at home
and abroad to keep returns equated. Which banks lend to firms at home and abroad, is not
determined in this case. Because gross returns to capital are equal, all banks that pay the
fixed cost are indifferent between investing at home and abroad.
Now let country 1 become capital scarce, that is, move to the right along the x-axis. As
the capital-labor ratio of country 1 declines, additional banks become internationally active.
Whether these are banks in country 1 or in country 2 depends on which banking sector is
more efficient. In a nutshell: differences in capital-labor ratios determine the direction of the
cross-border capital flow. Differences in banking sector efficiencies fix which banks channel
capital across borders.
Appendix C: Data Appendix
Auslandsstatus-Report: Total cross-borders assets and liabilities of bank k in country i
are measured as the cross-border assets and liabilities of parent bank k minus the liabilities
of its affiliates located in country i vis-a-vis the parent. Local assets (liabilities) comprise the
assets (liabilities) of all affiliates of bank k located in country i towards residents of country
43
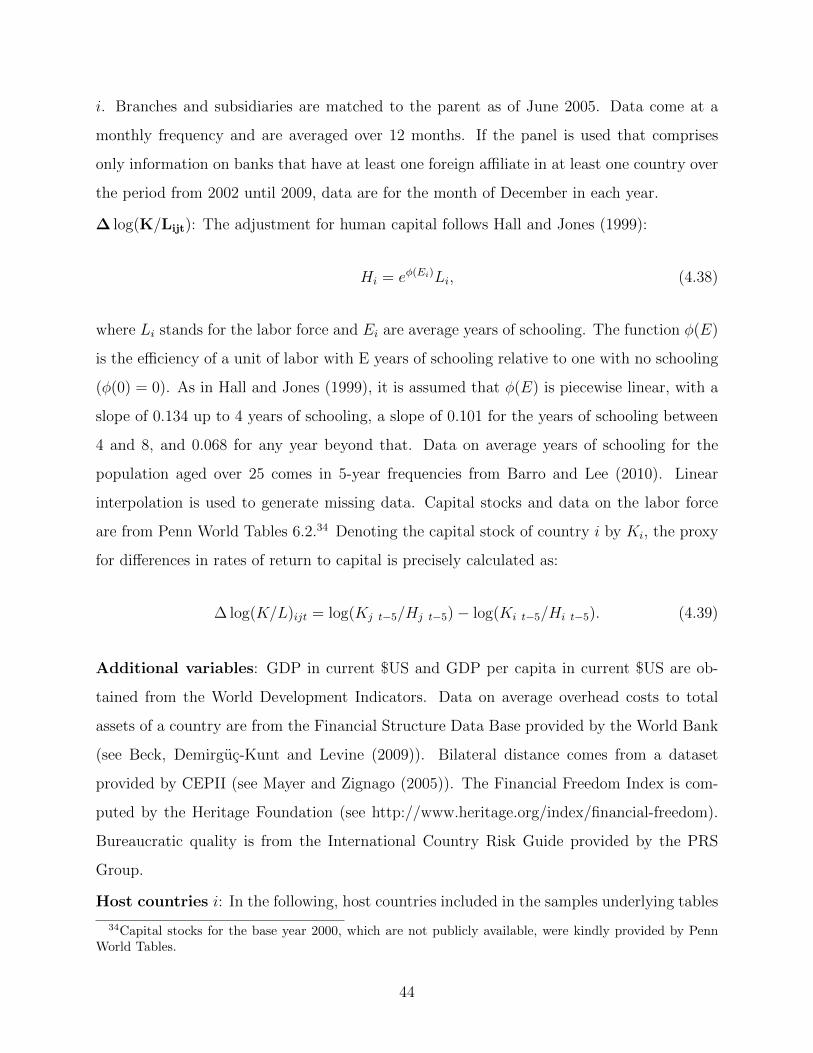
i. Branches and subsidiaries are matched to the parent as of June 2005. Data come at a
monthly frequency and are averaged over 12 months. If the panel is used that comprises
only information on banks that have at least one foreign affiliate in at least one country over
the period from 2002 until 2009, data are for the month of December in each year.
∆ log(K/Lijt): The adjustment for human capital follows Hall and Jones (1999):
Hi = eφ(Ei)Li, (4.38)
where Li stands for the labor force and Ei are average years of schooling. The function φ(E)
is the efficiency of a unit of labor with E years of schooling relative to one with no schooling
(φ(0) = 0). As in Hall and Jones (1999), it is assumed that φ(E) is piecewise linear, with a
slope of 0.134 up to 4 years of schooling, a slope of 0.101 for the years of schooling between
4 and 8, and 0.068 for any year beyond that. Data on average years of schooling for the
population aged over 25 comes in 5-year frequencies from Barro and Lee (2010). Linear
interpolation is used to generate missing data. Capital stocks and data on the labor force
are from Penn World Tables 6.2.34 Denoting the capital stock of country i by Ki, the proxy
for differences in rates of return to capital is precisely calculated as:
∆ log(K/L)ijt = log(Kj t−5/Hj t−5)− log(Ki t−5/Hi t−5). (4.39)
Additional variables: GDP in current $US and GDP per capita in current $US are ob-
tained from the World Development Indicators. Data on average overhead costs to total
assets of a country are from the Financial Structure Data Base provided by the World Bank
(see Beck, Demirguc-Kunt and Levine (2009)). Bilateral distance comes from a dataset
provided by CEPII (see Mayer and Zignago (2005)). The Financial Freedom Index is com-
puted by the Heritage Foundation (see http://www.heritage.org/index/financial-freedom).
Bureaucratic quality is from the International Country Risk Guide provided by the PRS
Group.
Host countries i: In the following, host countries included in the samples underlying tables
34Capital stocks for the base year 2000, which are not publicly available, were kindly provided by PennWorld Tables.
44

6, 7 and 8 are listed. The liability sample comprises the same countries as the asset sample ex-
cept from Gabon, which is not in the liability sample. Host countries that are included in the
FDI sample (table 8) are indicated with asterisks: Algeria, Argentina*, Australia*, Austria*,
Bangladesh, Bahrain, Belgium*, Bolivia, Botswana, Brazil*, Cameroon, Canada*, Chile*,
China*, Columbia, Republic of Congo, Costa Rica, Cuba, Ivory Cost, Cyprus, Denmark,
Ecuador, Egypt, El Salvador, Finland*, France*, Gabon, Ghana, Guatemala, Honduras,
Hong Kong*, Hungary*, Iceland, India*, Indonesia*, Iran, Ireland, Israel, Italy*, Japan*,
Jordan, Kenya, Republic of Korea* Kuwait, Luxembourg*, Malawi, Mali, Malaysia*, Malta,
Mexico*, Mongolia, Morocco, Mozambique, the Netherlands*, Nicaragua, Niger, Norway,
Pakistan*, Panama, Paraguay, Peru, Philippines*, Poland*, Portugal*, Qatar, Romania,
Saudi Arabia, Senegal, Sierra Leone, Singapore*, South Africa*, Spain*, Sri Lanka*, Swe-
den*, Switzerland*, Thailand*, Trinidad and Tobago, Tunisia, Turkey*, Uganda, United
Arab Emirates*, the United Kingdom* the United States of America*, Uruguay*, Venezuela,
Zambia, Zimbabwe
45

Figure 1: Bank size in autarky and in the open economy
Domestic banking
Cross‐border borrowing
FDI
ϒBi ϒ*i ϒBi ϒFi ϒ*AUTi
Cross‐border borrowing
Bank
size
Bank
size
Country i
Domestic banking
ϒLj ϒLj ϒFj ϒ*j ϒ*AUTj
Cross‐border lending
Cross‐border lending
Domestic banking
Domestic banking
FDI
Bank
size
Bank
size
Country j
The upper two graphs show the size of banks in country i as a function of γ in autarky (green line) and in the openeconomy equilibrium (blue line). The upper right graph zooms into the upper left graph. The lower two graphs displaythe size of banks in country j.
46

Tab
le1:
Eff
ect
ofsi
zean
deffi
cien
cyon
the
exte
nsi
vean
din
tensi
vem
argi
ns
Exte
nsi
veM
arg
in:
Logit
Mod
elIn
tensi
ve
Marg
in:
OL
S
cr.
asse
tscr
.li
ab
ilit
ies
FD
Icr
.ass
ets
loca
lass
ets
cr.
liab
ilit
ies
loca
lli
ab
ilit
ies
(1)
(2)
(3)
(4)
(5)
(6)
(7)
log(s
ize k
)1.
023*
**1.1
47***
1.2
77***
0.7
94***
0.4
43***
0.8
69***
0.8
77***
(0.0
275)
(0.0
315)
(0.1
30)
(0.0
395)
(0.1
36)
(0.0
331)
(0.1
95)
Ob
serv
atio
ns
342,
130
344,0
74
112,0
56
36598
258
60623
248
(Pse
ud
o)R
20.
570
0.4
94
0.6
67
0.4
47
0.6
03
0.3
92
0.5
68
log(o
verh
ead
cost
s k)
-0.8
07**
*-0
.850***
-0.9
22***
-1.6
82***
-0.3
86
-1.3
47***
0.0
0515
(0.1
35)
(0.1
26)
(0.2
53)
(0.2
32)
(0.3
90)
(0.2
32)
(0.8
89)
Ob
serv
atio
ns
337,
705
339,6
24
110,6
06
35758
251
59259
241
(Pse
ud
o)R
20.
483
0.3
75
0.4
58
0.4
08
0.5
71
0.2
71
0.4
76
Clu
ster
edst
an
dard
erro
rsin
pare
nth
eses
.R
egre
ssio
ns
incl
ud
eco
untr
y-fi
xed
effec
tsan
dd
um
mie
sfo
rb
an
kty
pe.
***
p<
0.0
1,
**
p<
0.0
5,
*p<
0.1
.
47

Table 2: Numerical example
Parameter valuesExogeneous parameters ValueSize of capital input per firm z 1Capital share α in Cobb-Douglas production function 0.3Success probability without monitoring λL 0.5Success probability with monitoring λ 0.985Variable cost of lending abroad τ 0.999Variable cost of borrowing abroad φ 1.001Fixed cost of lending abroad fLij 0.13Fixed cost of borrowing abroad fBji 0.16Cost of FDI for banking sector j fFij 0.198Cost of FDI for banking sector i fFji 0.245Lower limit of uniform monitoring cost distribution γj 0.04
Lower limit of uniform monitoring cost distribution γi 0.038
Upper monitoring cost limit γj = γi 0.4Capital-labor ratio Kj/Lj 20/3Capital-labor ratio Ki/Li 20/4
SolutionEndogeneous parameters Autarky value Equilibrium valueEntry cutoff γ∗j 0.054175 0.052671Cross-border lending cutoff γLj - 0.04009FDI cutoff γFj - 0.040038Entry cutoff γ∗i 0.051288 0.052543Cross-border borrowing cutoff γBi - 0.038877FDI cutoff γFi - 0.0380189
Capital flow through banks in j Kjij 0 0.2050368
Capital flow through banks in i Kiij 0 2.099895
Gross return to capital Rj 1.0795 1.0866183Gross return to capital Ri 1.09724 1.0900913Deposit rate RD
j 1.0245 1.033145Deposit rate RD
i 1.04517 1.036748
48

Table 3: Correlation coefficients for different measures of bank efficiency
log(overhead costsk) log(sizek) log(labor productivityk)log(overhead costsk) 1.0000log(sizek) -0.5476 1.0000log(labor productivityk) -0.9264 0.5344 1.0000
Table 4: Expected signs
Cross-border lending cutoff
(1) (2) (3)max. overhead costs min. size/ labor prod. # banks
return to capitali + - +overhead costi + - +distanceij - + -financial freedomi + - +bureaucratic qualityi + - +
Cross-border borrowing cutoff
(1) (2) (3)max. overhead costs min. size/ labor prod. # banks
return to capitali - + -overhead costi + - +distanceij - + -financial freedomi + - +bureaucratic qualityi + - +
49

Table 5: Summary statistics for sample underlying table 6
Obs Mean Std. Dev. Min Max# banks with cr. assetsi 86 4.97309 1.45347 1.94591 7.552238log(return to capitali) 86 -9.365102 1.219936 -11.26792 -6.071978log(overhead costsi) 86 -3.277382 .6695559 -5.003277 -2.015182log(distanceij) 86 8.30332 1.060289 5.156315 9.71491financial freedomi 86 54.4186 22.67959 10 90bureaucratic qualityi 86 2.442345 1.071736 0 4log(GDPi) 86 25.03863 1.960676 20.93789 30.16311log(GDP per capitai) 86 8.530896 1.670926 5.307277 11.3017
Table 6: Effects of host country characteristics on the cross-border lending cutoff
log(max overhead) log(min size) log(min lab. prod.) log(# banks)(1) (2) (3) (4)
log(return to capitali) 0.0154 0.239 0.0501 -0.236(0.120) (0.161) (0.105) (0.143)
log(overhead costsi) 0.190** -0.484*** -0.319*** 0.325***(0.0846) (0.116) (0.0819) (0.101)
log(distanceij) -0.262*** 0.285*** 0.248*** -0.376***(0.0749) (0.0907) (0.0813) (0.0678)
financial freedomi 0.00625** -0.00450 -0.00758*** 0.00788**(0.00296) (0.00420) (0.00264) (0.00305)
bureaucratic qualityi 0.150** -0.470*** -0.168*** 0.377***(0.0686) (0.118) (0.0592) (0.0839)
log(GDPi) 0.208*** -0.244*** -0.181*** 0.412***(0.0444) (0.0617) (0.0435) (0.0437)
log(GDP per capitai) -0.0465 0.135 0.0287 -0.130(0.0950) (0.149) (0.0824) (0.122)
Constant 1.924 15.62*** 9.810*** -3.604***(1.222) (1.621) (1.201) (1.167)
Observations 86 86 86 86R2 0.651 0.724 0.695 0.869
Robust standard errors in parentheses.*** p<0.01, ** p<0.05, * p<0.1.
50

Table 7: Effects of host country characteristics on the cross-border borrowing cutoff
(1) (2) (3) (4)log(max overhead) log(min size) log(min lab. prod.) log(# banks)
log(return to capitali) -0.0233 0.491*** 0.0732 -0.454***(0.120) (0.175) (0.0974) (0.123)
log(overhead costsi) 0.257*** -0.354*** -0.257*** 0.285***(0.0790) (0.124) (0.0737) (0.0927)
log(distanceij) -0.0969* 0.150* 0.0474 -0.234***(0.0540) (0.0805) (0.0542) (0.0609)
financial freedomi 0.00616* -0.0129*** -0.00622** 0.00701**(0.00320) (0.00398) (0.00262) (0.00284)
bureaucratic qualityi 0.206*** 0.00799 -0.101 0.302***(0.0686) (0.106) (0.0629) (0.0795)
log(GDPi) 0.235*** -0.320*** -0.228*** 0.380***(0.0311) (0.0590) (0.0320) (0.0386)
log(GDP per capitai) -0.105 0.364** 0.0453 -0.397***(0.0938) (0.154) (0.0757) (0.104)
Constant 0.233 18.13*** 12.51*** -2.844**(1.000) (1.656) (0.911) (1.081)
Observations 87 87 87 87R2 0.628 0.554 0.665 0.835
Robust standard errors in parentheses.*** p<0.01, ** p<0.05, * p<0.1.
51

Table 8: Effects of host country characteristics on the FDI cutoff
(1) (2) (3) (4)log(max overhead) log(min size) log(min lab. prod.) log(# banks)
log(return to capitali) -0.348** 1.518* 0.229* -0.328(0.166) (0.793) (0.128) (0.496)
log(overhead costsi) 0.0619 -0.515 -0.0638 -0.0336(0.101) (0.455) (0.0706) (0.262)
log(distanceij) -0.257*** 0.856*** 0.217*** -0.357***(0.0433) (0.180) (0.0300) (0.116)
financial freedomi 4.30e-05 -0.00698 -0.00110 0.00858(0.00274) (0.0118) (0.00211) (0.00820)
bureaucratic qualityi -0.0907 -0.181 0.0313 -0.100(0.0906) (0.538) (0.0794) (0.232)
log(GDPi) 0.0199 0.0399 -0.0254 0.152(0.0337) (0.152) (0.0226) (0.0951)
log(GDP per capitai) -0.142 0.644 0.123 -0.00273(0.107) (0.470) (0.0842) (0.331)
Constant 2.832* 18.13*** 8.801*** -3.494(1.412) (5.067) (1.040) (3.031)
Observations 37 37 37 37R2 0.669 0.601 0.664 0.616
Robust standard errors in parentheses.*** p<0.01, ** p<0.05, * p<0.1.
52

Table 9: Proximity-fixed cost tradeoff: extensive margin
(1) (2) (3)∆ log(mean overhead costs) ∆ log(mean size) ∆ log(mean lab. prod.)
log(distanceij) -0.0288 -0.223* -0.0987*(0.0439) (0.121) (0.0570)
financial freedomi 0.00405 -0.00210 0.00234(0.00257) (0.00601) (0.00484)
bureaucratic qualityi -0.0136 0.223 -0.0379(0.0606) (0.192) (0.0791)
log(GDP per capitai) 0.0497* 0.350** 0.117**(0.0312) (0.0912) (0.0389)
log(GDPi) 0.0365 0.0247 0.122(0.0408) (0.119) (0.0866)
Constant -1.008 -5.481** -2.507(0.781) (1.634) (0.957)
Observations 53 53 53R2 0.240 0.495 0.381
Robust standard errors in parentheses.** p<0.05, * p<0.1.
Table 10: Proximity-fixed cost tradeoff: intensive margin
(1) (2) (3) (4) (5) (6)local assetscr. assets
local liabcr. liab
local as+liabcr. ass+liab
local assetscr. assets
local liabcr. liab
local as+liabcr. ass+liab
log(distanceij) 0.494* 0.465* 0.800* 0.375* 0.654** 1.003**(0.279) (0.263) (0.471) (0.199) (0.146) (0.316)
financial freedomi 0.0408* 0.00611 0.0254 0.0372** 0.0117 0.0447(0.0233) (0.0296) (0.0472) (0.0145) (0.0186) (0.0285)
bureaucratic qualityi 0.350 1.065 1.707 0.141 0.610 0.611(0.669) (0.692) (1.208) (0.508) (0.426) (0.730)
log(GDP per capitai) -1.510** -1.258* -3.063** -1.569** -0.978** -2.478**(0.444) (0.649) (0.966) (0.344) (0.362) (0.646)
log(GDPi) 0.241 -0.0175 0.00469 0.449** 0.00392 0.153(0.214) (0.300) (0.431) (0.154) (0.162) (0.261)
Observations 236 217 191 1088 1196 937R2 0.509 0.431 0.522 0.460 0.443 0.539
Clustered standard errors in parentheses.Regressions include year- and bank-fixed effects.
** p<0.05, * p<0.1.
53