
Bank stocks inform higher growth – A System GMM analysis ...
36
Munich Personal RePEc Archive Bank stocks inform higher growth – A System GMM analysis of ten emerging markets in Asia Mittal, Amit and Garg, Ajay Kumar Indian Institute of Management, Lucknow 31 December 2018 Online at https://mpra.ub.uni-muenchen.de/98253/ MPRA Paper No. 98253, posted 26 Jan 2020 15:19 UTC brought to you by CORE View metadata, citation and similar papers at core.ac.uk provided by Munich RePEc Personal Archive
Transcript of Bank stocks inform higher growth – A System GMM analysis ...

Munich Personal RePEc Archive
Bank stocks inform higher growth – A
System GMM analysis of ten emerging
markets in Asia
Mittal, Amit and Garg, Ajay Kumar
Indian Institute of Management, Lucknow
31 December 2018
Online at https://mpra.ub.uni-muenchen.de/98253/
MPRA Paper No. 98253, posted 26 Jan 2020 15:19 UTC
brought to you by COREView metadata, citation and similar papers at core.ac.uk
provided by Munich RePEc Personal Archive

Bank stocks inform higher growth – A System GMM analysis of ten emerging
markets in Asia
Amit Mittal*, Ajay Kumar Garg
Indian Institute of Management, Lucknow
Email: [email protected]. [email protected]
* Corresponding Author
December 31, 2018
Declarations of interest: none

Bank stocks inform higher growth – A System GMM analysis of ten emerging
markets in Asia
Abstract
The paper aims to recover the critical role of banks in defining the relationship between
Financial Development and growth. We hypothesize that Banks can positively motivate
templatized GDP growth. A System GMM estimation of GDP growth in a sample of high
growth emerging markets from Asia investigates if bank stocks contain information beyond the
monetary and banking aggregates.
In a sample of emerging markets with 5% GDP growth, bank stocks create 0.22% of GDP
growth for every 1 SD excess return in a weighted portfolio of bank stocks. The chosen
emerging markets are homogenous based on WGI Indicators from World Bank. This
coefficient is much higher than the recovered relationship presented by Cole, Moshirian and
Wu (2008). Government ownership of banks and close monitoring of banks is found to be a
positive for the overall economy while the market index is found to be not so informative about
economic growth.
A relook at a GMM system study from Cole, Moshirian and Wu (2008) shows better growth
for Emerging market investors without compromising quality. The research establishes the
advantages of selecting emerging markets portfolios that reward better governance. A set of
Homogenized emerging markets can engender higher causative effects between banks and
GDP growth allowing investors to focus on investment opportunity.
Keywords: Banks, Economic Growth, Asia, Emerging Markets, GMM system, 2-step GMM
JEL: C23; F02; G21; G02; G14
1. Introduction and Motivation
The recent financial crisis has polarized opinions about the banking sector and its contribution
to economic growth. Empirical research has established their significant contribution to
economic growth at firm, industry and country levels. A pre-crisis evaluation by Cole et al
(2008) utilized specific bank stock returns to move away from aggregate macroeconomic
measures in quantifying financial sector influence on future economic growth. Such an analysis
combines the study of economic growth with conventional asset pricing theory with a focused
investigation of the specific information content of individual bank stock returns independent
of the information presented in market indices. This obviates the need for measuring financial
market contribution in terms of indices and provides us with a greater level of detail. The
differing nature of Institutional frameworks in Asia and its continuing growth memes reflect in
an urgency to complete our understanding of growth mechanics in this region. Banks
significantly contribute to economic growth and we show that this is not limited to the growth
of private sector credit or money supply measures (Badaruddin, Ariff and Khalid, 2011).
Do Bank stocks even lead economic growth? While a study of macroeconomic factors shows
the contribution of the financial sector in pushing economic growth, the study of stock markets
is generally limited to a study of the relationship between economic growth and stock indices.
Cole et al (2008) studies 36 markets -- 18 developed markets and 18 emerging markets are
included in the sample. It is one of the rare research studies in the literature that move away
from macroeconomic aggregates of bank credit and financial markets representations by a
general index to study the determinants of economic growth. While ibid. presents a positive
relation between bank stocks and economic growth, Moshirian and Wu (2012) complete the
analysis using the same dataset documenting the negative relationship of economic growth with
bank stock volatility. Both the studies affirm the direct impact of country specific Institutional,
legal and regulatory frameworks including insider trading, government ownership and
accounting disclosure standards. Macroeconomic aggregates and Financial sector development
relating banking performance to growth in panels across both highly developed and developing
countries (Al-Moulani and Alexio, 2017; Wallis, 2017; Diallo, 2017; Diallo and Koch, 2017;
Fufa and Kim, 2017; Issahaku, Abor and Harvey, 2017) or country specific examples (Arize,
Kalu and Nkwor, 2017; Pan and Mishra, 2018; Diallo and Zhang, 2017; Banerjee, Ahmed and
Hossain, 2017; Kapingura, 2017). Some studies use these empirical results to build theoretical
frameworks around bank models (Hamada, Kanako and Yanagihara, 2017; He and Niu, 2017)
or trace the motivations of Foreign banks and their performance (Claessens and Horen, 2016;
Bongini et al, 2017). Mishra and Narayan (2015) use Linear Panel data models to confirm the
significant effect of Market capitalization and stock prices on the GDP.
This paper contributes to the literature in analyzing the bank stock returns’ contribution to the
GDP growth in a meaningful way in a sample of high GDP growth countries. We undertake a
GMM estimator-based analysis of dynamic panel data using GDP growth rates and specific
bank stock returns to isolate the growth effects of banks in ten emerging market economies,
considered homogenous from a descriptive analysis of World Bank Governance indicators and
geographically similar. We also find significant state monitoring in the banking sector in these
ten regimes and factor in regulatory effectiveness as well as state ownership of banks. A
contemporaneous data generating process underlies opportunity generation, identification,
analysis and information enrichment as well as decision making and financing of growth. This
data generating process along with common information processes feeds market information
and macroeconomic aggregates. Banks possess superior private information on the economic
opportunity universe and an analysis of specific bank stock portfolio returns shows that banks’

contribution to the processes that lead to generation of growth. However, this also explains an
almost total lack of contemporaneous correlation as tested by us in a Structural VAR analysis
available on request from the authors. (Pairwise correlations are reported in Table 2)
Our paper also contributes to the current findings in the literature about the lack of information
in market indices in relation to GDP growth. Our sample includes Asian economies in India,
China, Singapore, Hongkong, Taiwan, Korea, Malaysia, Indonesia, Philippines and Thailand.
While we expect bank stocks in general to explain more about future growth expectations, we
cannot neglect the effects of the global financial crisis in changing these expectations about
growth materially. It can be seen that banks reacted differently and more intensely to the crisis,
but stocks healed well to regulatory pronouncements and may have led the economy back with
a bigger coefficient for their effect on economic growth during the crisis years compared with
a negative effect of banks in the developed markets in the crisis period. We find that Asian
stock market indices are not in tune with GDP growth measures allowing bank stocks to carry
most of the GDP growth specific information in these countries. However, other studies with
recent data have confirmed that the stock market index is no longer a significant informant or
determinant of GDP growth memes. As found earlier in an 18-country emerging market sample
by Cole, Moshirian and Wu(2008) a market capitalization weighted index of bank stocks in
these countries contributes much higher though there is a limited bi-directional causality
between bank stocks and GDP growth. We expect this to be the import of a contemporaneous
data generating process which is enhanced by banks’ using their private information. Given the
systemically critical role of banks we find that while Stock Market indices do not specify GDP
growth, there is a direct effect of bank portfolio returns on the high mean GDP growth.
We present literature that helps strengthen our understanding and revisit some other papers that
have a different view of the interaction between bank and stock market in their contribution to
economic development (Deidda and Fattouh, 2008).

We extend the analysis to ten countries in Asia that have retained the growth memes. Average
GDP growth in the sample is over 5% (Table 1). 3-month Treasury Bill rates in each domestic
regime are utilized to compute excess returns from quarterly returns to regress against quarterly
GDP growth and its immediate lag. While economic aggregates and banking sector specific
aggregates including Private sector credit are usually studied for bi-directional causality with
GDP growth, we isolate the effective nature of government ownership of banks found in 7 of
the 10 regimes studied. Also, we found that the ongoing global crisis only dented GDP growth
by 30-40 basis points while bank stocks specify a higher than 2% contribution to GDP growth
for 1% excess returns. We expect to also isolate the effects of bank mergers and bank stock
volatility in a separate research to supplement these results.
Our research uncovers the critical interplay between Government ownership and effectiveness
of government based on the dimension indices in the World Bank WGI Indicators. Instead of
Insider trading Law and Accounting disclosure standards we employ a rule of law indicator
also from another dimensional index of the World Bank WGI indicators.
The insignificance of market indices might denote the stable expectations of GDP growth
marginalizing market indices’ overall role in tracking GDP growth, while excess returns in the
Bank sample retain significant information contribution to GDP growth over and above
measures of Private sector credit, liquidity and the size of banking assets in relation to the
central bank balance sheet.
This research explores relevant literature in Section 3. Section 4 and 5 discuss the data and the
methodology in detail only in the main document. We end with our main results and discuss
the future implications of this research.
2. Literature Review
There is a rich recent literature around bank equities and Financial development as well as
delineation of the recent Global Financial crisis. Gibson, Hall and Tavlas (2017) review the
modeling of bank equity prices during the crisis deploying a three-equation model in Panel
GMM (log-level of Prices) to recover a recursive impact of the crisis between sovereigns and
banks. Our study of the crisis in Asia shows that such a recursive relationship was instrumental
in extending the crisis in Asian markets. Allegret, Raymond and Rharrabti (2017) do a similar
analysis and justify the period of extended crisis in Europe using an endogenous definition of
crisis periods. They also point to delayed connections across sovereign swaps and bank equity
markets.
Other considered estimators that connects Financial sector variables and GDP growth include
mixed frequency sampling or MIDAS regressions. These are likely to measure banking sector
growth as part of economic aggregates as in the macroeconomic literature. Fufa and Kim
(2017) look at some homogenous panels, continuing in the tradition of using Panel GMM to
measure financial sector aggregates against economic development in high income and low-
income countries.
Our research relates more to the literature corresponding to causation in individual bank level
governance as well as regulation and growth. Diallo (2017) recover the important effect of
better Corporate Governance levels at a country level on 34 external finance dependent
manufacturing sectors, moderating the effect of bank concentration and economic growth.
Mishkin (2009) points to the advantages of financial globalization and the critical role of
property rights and a well-directed financial system to achieving high economic growth in
emerging markets. Williams (2014) analyses the influence of national governance on bank
level risk in Asia.

Beck and Levine (2004) established a dynamic panel and produced the first recent robust
evidence that stock markets and banks influence economic growth controlling for omitted
variables and unobserved country specific effects. They take into consideration various theories
expecting financial development to harm growth and stability and explaining the role of banks
in easing information frictions. Prior studies before them model aggregate variables like
M3/GDP to model financial sector’s impact on GDP growth but do not consider any enhancing
role of the stock markets. Mishra and Narayan (2015) use a non-parametric model to match np
financial system variables in measuring Economic growth and use Private Credit and Domestic
credit to represent the Financial system and alternate with Market Capitalization(significant)
and Volume of Stocks traded (insignificant). Ductor and Grechyna (2015) establish the
relationship between Financial Development and Growth as non-linear heightening the chances
of a negative relationship when Credit does not translate into growth in real output. Goes(2016)
shows that institutional quality improvement by 1% leads to a 1.7% increase in GDP per capita.
Thus, we analyze the impact of our domestic institutions on bank growth directly through their
stock returns on growth memes. We find that the selected characteristics describe salience of
the selected sample of countries along governance parameters and perceptible superior returns
in weighted bank stock portfolios reflecting the advantage of private information of the growth
generating processes.
However, Ma and Wohar(2014) caution against the indiscriminate specification of VAR
models and use of expected returns in valuation models and also show the value impact of
operating cash flow measures. We may incorporate later research using cash flows as well.
Du et al (2016) use a recent sample spanning the GFC in 37 countries to measure the
information content in bank stock prices, resolving how banks with higher information
disclosures reduce extreme negative returns, extending our results to the positive nature of
transparent disclosure requirements in bank supervision regimes. Umar and Sun(2017) study

the different impact of leverage on stock liquidity for large (positive) and small (negative)
banks in a BRICS sample. We however do not consider stock liquidity in our research.
Similarly, Banerjee et al (2017) show the risk impact of off-balance sheet derivatives, primarily
rate swaps while reflecting the impact of size, interest spreads and capital ratios. Shezaad and
Haan (2013) show the quick bounce back of bank stocks in Emerging markets due to the crisis
and continuing lower prices of banks in the developed world. Managerial efficiency and loan
quality continue to be effective measures of value in the GFC and large bank stocks were more
underpriced in the developed world during the crisis. Badaruddin et al (2011) use bank stock
returns to support the endogeneity theory of money supply and the effect of money supply on
stock prices.
Effects of international central bank cooperation and other expected spillovers from
international markets, may be significantly transmitted by banks’ stock prices to growth or vice
versa. (Andries et al, 2017). The crisis also affected public discussions on bank stock ratings
(Salvador, 2017) and meaningfully impacted bank stock returns as well as GDP growth. We
do analysis to heighten any structure and magnitude differences during the crisis in the chosen
Financial markets. Allegret et al (2017) do a similar analysis limited to the sovereign debt crisis
period in Europe using a four-factor model enhanced with sovereign risk.
Bank governance issues reflect an important endpoint for readers of this research in affecting
investor attractiveness. Pathan and Faff(2013) show the effect of important governance
variables in recent data. Masulis and Zhang(2017), Banerjee, Masulis and Upadhyay(2018) and
Liu et al (2017) represent a leading body of corporate governance literature closely examining
issues of corporate governance and institutions.

3. Hypothesis
A quickly deployed VAR system (available with the authors) specifying the inter relationships
between bank stock portfolios, stock index and GDP growth shows no relationship between the
three variables because of contemporaneous interplay of all three through investors, experts
and industry on one hand and traders, investors and bankers on the other hand, as well as firm,
sector and industry specific unobserved heterogeneity at play. Our intuition suggests banks
possess superior private information about macroeconomic and microeconomic factors as well
as the specific skills with entrepreneurs that can be gainfully employed in a given economic
opportunity universe. Banks can harness this private information and will likely be rewarded
for the same notwithstanding selfish motives of managers and other losses on the way to
information production and consequent GDP growth based on real production and value added
in the economy.
Hypothesis 1: Banks will produce superior market returns because of their private information
and these superior returns will lead consequent economic growth
As GDP growth is higher in emerging markets, the likely relation of GDP growth to bank stock
portfolios will be higher and consequent in choosing bank portfolios for superior returns in
these markets.
Hypothesis 2: Markets proxied by stock indices will be unable to produce superior market
returns because of their inability to reach bank specific private information.
This may prima facie be because industrials without unlisted Private equity / Venture Capital
investments and apart from expert private information in banks, no longer possess any
contemporaneous information advantages that lead GDP growth and rely on announcements
and public information and may thus lag GDP growth. Pan and Mishra(2018) and Banerjee,
Ahmed and Hossain (2017) find that stock markets as providers of capital
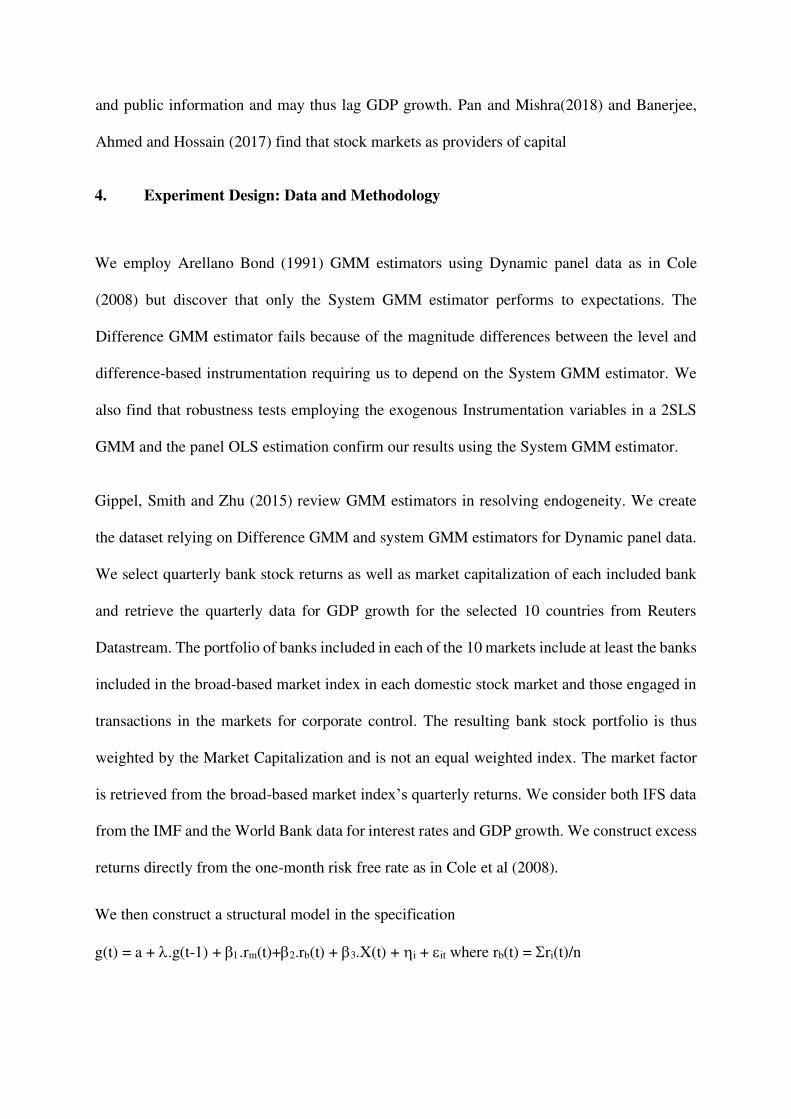
4. Experiment Design: Data and Methodology
We employ Arellano Bond (1991) GMM estimators using Dynamic panel data as in Cole
(2008) but discover that only the System GMM estimator performs to expectations. The
Difference GMM estimator fails because of the magnitude differences between the level and
difference-based instrumentation requiring us to depend on the System GMM estimator. We
also find that robustness tests employing the exogenous Instrumentation variables in a 2SLS
GMM and the panel OLS estimation confirm our results using the System GMM estimator.
Gippel, Smith and Zhu (2015) review GMM estimators in resolving endogeneity. We create
the dataset relying on Difference GMM and system GMM estimators for Dynamic panel data.
We select quarterly bank stock returns as well as market capitalization of each included bank
and retrieve the quarterly data for GDP growth for the selected 10 countries from Reuters
Datastream. The portfolio of banks included in each of the 10 markets include at least the banks
included in the broad-based market index in each domestic stock market and those engaged in
transactions in the markets for corporate control. The resulting bank stock portfolio is thus
weighted by the Market Capitalization and is not an equal weighted index. The market factor
is retrieved from the broad-based market index’s quarterly returns. We consider both IFS data
from the IMF and the World Bank data for interest rates and GDP growth. We construct excess
returns directly from the one-month risk free rate as in Cole et al (2008).
We then construct a structural model in the specification
g(t) = a + .g(t-1) + .rm(t)+2.rb(t) + 3.X(t) + i + it where rb(t) = ri(t)/n
for each of the n banks included in the domestic market analyzed. To motivate the GMM Panel
analysis we employ country specific impulse response functions (IRF) and a SVAR framework
to discover the limitations of VAR frameworks in eliciting contemporaneous constructs. The
same is available with the authors on request. We determine the importance of the underlying
data generating process in missing correlations between bank stock portfolios and GDP growth
and use GMM estimators in Dynamic Panel Estimation to isolate the coefficient of weighted
bank stock portfolios on economic growth to establish a baseline for these countries and
compare with the global environment, given the structural isolation of the developed world in
USA and Europe as well as the various longer lasting influences of the crisis on emerging
markets. The limited nature of correlations between the bank portfolio returns and GDP growth
processes strengthens our belief in a common data generating process reliant on the banks’ own
private information. We attempt both one step and two step Dynamic panel data estimations
using xtabond2 in stata and confirm with Baum’s ivreg2 command (Baum, 2014) using highly
correlated memes like Private Credit and Money supply as well as Government effectiveness
and rule of law in the first stage instrumentation. Alternate instrumental variables and panel
regression designs were employed using robust and newey west errors for comparison. The
results of two step Dynamic panel data estimations are robust with the instrumental 2SLS
design. The 2SLS design and other robustness tests compensate for the overidentification
problem in the original formulation with 10 country panels and 71 time series observations.
The GMM Difference specification of the Arellano Bond estimators used in Cole et al (2008)
suffers from the problem of larger instruments using only the differences as instruments. The
GMM System estimator can recover robust estimates using both the level and differences as
instruments (Bond et al., 2001). The resulting overidentification as indicated in the Sargan test
is mitigated by using instrumental variable regression for the same specifications. Additional
variables and removal of various macroeconomic aggregates loads the Government’s role in
GDP growth in the bank ownership parameter, thus underlining the importance of robust legal
regulatory and Institutional frameworks in the homogenous sample selected by ourselves. This
is especially true when panel regressions are attempted without the lag GDP growth variable.
However, VAR analysis shows the structural measurement of GDP growth to be a near
certainty and the same is retained. Bond and Söderbom (2009) elicits more information in
structurally modelled parameters and GMM estimation. Stationarity restrictions are maintained
in the model. Endogeneity between the variables is considered carefully in the use of Arellano
and Bond estimators as the specification implies macroeconomic data generation processes
raising issues of simultaneity, heterogeneity and omitted variables. As an example, our
selection of governance indicators seems to be ceding a large magnitude of the effect to
Government ownership of banks as the residual cause of regulatory governance in the GDP
growth generation process. World Bank Data provides a comprehensive six-dimensional index
of World Governance indicators which are highly correlated but each sub index measures a
different dimension of Governance standards at the country level. The use of WGI indicators
are therefore beneficial to the formulation and we replace rule of law dimension scores and
Government effectiveness dimension scores from the WGI data in the original Cole et al (2008)
formulation for insider trading law and accounting changes.
We consider a single panel of all the ten markets. The average growth rate for GDP is positive
and expected market risk factors are in line for growth markets. The average bank excess return
mapped to the Cole et al (2008) methodology is largely positive. The correlation between GDP
and bank stock returns is less than 0.15. We experiment with other control variables to regress
with weighted bank stock portfolio returns and include it in the vector of Xi (where only lagged
returns are considered in the base specification as instruments).
Bank stocks may not reflect their true valuations because of the larger private information
associated with sophisticated bank managers. Blau et al (2017) show this opacity adversely
affects banks’ stock prices in delays and market inefficiency, yet we expect our analysis of
stock prices to be more informative of banks’ effects on GDP growth than macroeconomic
measures of credit and/or deposits.
In the robustness tests we use the endogeneity theory of money supply and the seeming relation
between Rule of Law and Government effectiveness (observed correlations of 70%) Trade and
FDI impact on the variables were not required in the control set but may be grounds for future
research especially for active investment professionals along with causation from higher
moments including skew and kurtosis.
4. Results and Discussion
The entire data series extends from 1999q1-2017q3 resulting in 71 observations for each
country in the sample. 10 portfolios are constructed from individual banks using data from
Reuters Datastream(Eikon). The series of banks is selected from Datastream , already adjusted
for survivor bias till 1995. The corresponding macroeconomic aggregates are retrieved on a
quarterly basis as Financial development measures including ratios of Private credit(Priv) to
GDP and Commercial-Central Bank(CCB) asset ratios. The Money supply aggregate ratios
(M2Liq) are directly retrieved from the World Bank data series. As emerging market data is
available in depth as of 2018, this seems to be a doable task for any homogenous group of
countries or in determining such a group of homogenous countries. We apply World Bank
Governance indicators to verify the homogeneity of the group of countries as macroeconomic
aggregate data from the group has different outliers in each series. Two out of the six WGI
indicators, namely Rule of Law (Law) and Government effectiveness(Geff) are used in line with
the research design and we drop Insider trading law and Bank accounting disclosure variables
for the same. The Dummy crisis indicator (Dcris) is deployed as 1 for the period in 2009q1-

2012q2 in line with our analysis reflecting a late incidence of crisis in the emerging markets
(The MSCI EM Index returns for 2008 are upwards of 35%) and the extensive overlap with the
European sovereign debt crisis in 2011. The World Bank survey data on banks has three data
points on bank ownership by the state, (Govt).
As in Cole(2008) our experiment shows that one standard deviation change in bank stock
returns would increase economic growth by 10-15 basis points on average , and much higher
for higher growth dispensations. The market factor may have a higher effect, but this also
includes the growth effects engendered by the bank relationships and the bank equity returns’
contribution is over and above the contribution from the market factor. However even the bank
equity factor excludes cash flows to unlisted sectors /privately held firms that is increasing with
the rise of venture capital and private equity funded service economy firms. Banks are
significant harbingers of growth in emerging markets driven by growth. We find substantial
contribution of public sector banks in the specification for India led by the State Bank of India.
Serial acquirers such as ICICI Bank and Kotak are also significant contributors. Similarly,
active acquirers are found to be significant in the sample in China, India and Singapore among
others.
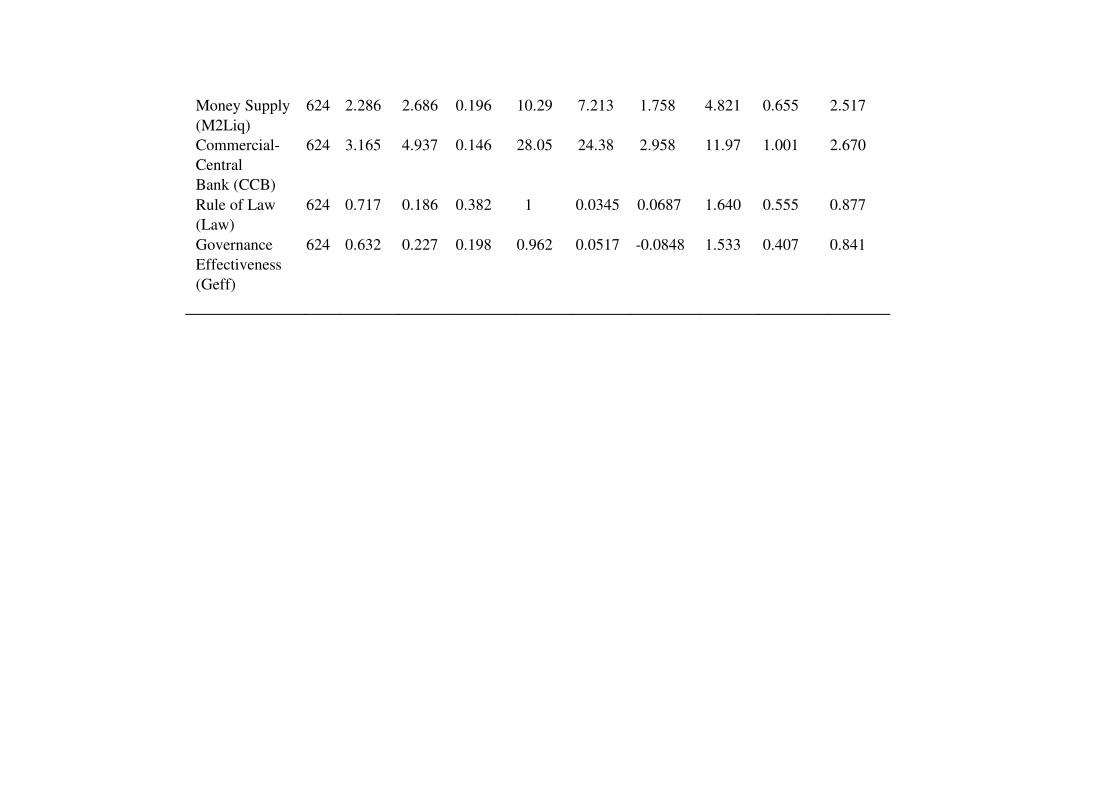
[Insert Table 1 here]

Table 1 presents the descriptive statistics of the sample. GDP growth in the chosen sample is
a high 5.1% on average and government ownership of banks is a high 28%. The sample
countries are homogenous on World Governance Indicators with Singapore and Hongkong city
states , nearly 100% in both Rule of Law and Government Effectiveness. The mean for the
sample is 71.7% rank in Rule of Law and 63.2% in Government effectiveness. In the chosen
sample countries, we have chosen a contiguous period of the Global Financial Crisis and the
European Sovereign Debt crisis in consultation with the various literature foregoing extensive
Crises database references considering the extensive impact of the twin crises on the global
economy. The crisis impacted the region late, incident from 2009 Q1 and lasted till mid 2012
(2012 Q2) lasting 14 quarters. The Market index returns may have been attenuated because of
the higher short-term rates prevalent in the region, with a mean of just 0.56%. 213 banks
contributed to bank portfolios from Datastream and quarterly Rb averages 2%.
(The Kuala Lumpur index data is only available from 2009 and similar restrictions reduce the
data at the country level from the 71 quarters)
[Insert Table 2 here]

We deploy the GMM System estimator recommended in Cole , Moshirian and Wu (2008). The
pairwise correlations (Table 2) also provide hints to motivate a well- formed response in Panel
GMM estimation when Rm and Rb are considered endogenous in the specification.
[Insert Table 3 here]
Panel GMM results are shown in Table 3 for the complete specification in Model 6. Wald test
holds for more sparse specifications wherein we found effective results for the unbalanced
panel with just Rm and Rb , and consequently with the addition of each exogenous variable
with quarterly of annual series data. The Sargan test shows overidentification as expected and
we step on to the 2SLS to show the same results in an exactly identified specification. A high
degree of heterogeneity is confirmed in the data, eliciting the most important cause for
heterogeneity. The Hausman test confirms use of fixed effects in light of the heterogeneity.
Government effectiveness may be highly correlated to Rule of Law and are also used in the,
but the result is likely robust given the adopted methodology.
[Insert Table 4 here]
Bank stocks seem to contain contemporaneous information regarding macroeconomic success
beyond banking aggregates in high growth emerging markets. This superior information in
bank stock performance outperforms the market index which does not contain any valuable
information regarding the expectedly high economic growth. A one SD shock to Bank stock
returns can create a positive GDP growth shock of a further 22 basis points in the countries in
the sample. The results also suggest increases in the Rule of Law variable and continued
government ownership of banks create positive growth momentum in the region rewarding
good governance. SVAR results available with the authors do show a significant variance
component of Bank stock returns to GDP growth in Singapore, Malaysia and Hongkong where
banks are privately owned. However, the economies of the area have largely benefitted from
the closer monitoring of the banking sector and the capitalization/ ownership of banks by
governments and in regressions without the lagged variables or Macroeconomic aggregates,
Govt (Government ownership by banks) loads the coefficients showing its importance in the
formulation and consequently lack of availability in the instrumentation. Table 4 presents the
System GMM specification without the constant, confirming the same results. We find the
crisis effect damped when t_qtr* is directly used in the specification but primary variables
retain their significance and direction of effect.
4.2 Robustness
Table 5 presents alternate robustness tests using instrumentation in endogenous supply of
money (Priv and M2Liq) and the correlations between sub-indices of WGI in Law and Geff.
The appendix includes other specifications using ordinary regression (cluster) panel
instrumental regression, and other instrumental variable regressions. They all reflect the
superiority of the GMM Panel specification in mitigating endogeneity, thereby emphasizing

the impact of the Crisis even in emerging country panels and sometimes eliciting false effects
especially of Commercial credit and overall market indices (reduced by the uniform higher
risk-free rates in the region)
[Insert Table 5 here]
4.3 Other significant results
Al-Moulani and Alexiou(2017) use GMM estimators for Dynamic panel data models used here
to investigate the overall relationship between banking sector depth and economic growth in
194 countries confirming some of our findings and providing insight into the negative relation
between Private Credit measures and GDP growth. The negative effect of Private credit is
uniform in the sample based on the observed inflection point of 80-100% ratio of Private sector
credit to GDP.
Soedarmano, Sitorus and Tarazi (2017) point out significant deterioration in bank systemic risk
from abnormal loan growth using credit standards during a crisis. This partly explains the
important effects of Governance and resulting premium on sustained GDP growth that can be
further improved with increase in governance standards.
We also expect stock market returns to be consistently motivated by the same data generating
process as the GDP growth and based in generated private information on the state of the
economy and opportunities and avenues for investment and growth including external finance
dependent firms that do well in crises, the bank stocks easily outperform the market index and
provide such additional information through prices of bank equities. Though restricted to single
non-representative stock markets Pan and Mishra(2018) and Banerjee, Ahmed and Hossain

(2017) also confirm that stock market indices do not contain similar information thus negating
earlier results till the early 2000s.
5. Future Implications
Bank stocks are significant determinants of GDP growth in strong emerging market economies
and stronger institutional characteristics shown by acquisition active firms and stronger
corporate governance banks can lead to deepening and consistency of growth memes for the
broader industry and the larger public economy in these markets. Even during the crises GDP
growth and bank stock returns remain highly positive for these economies. None of the selected
economies is significantly affected by dollarization. Risk and Investment managers can
significantly extract value from the away shares of their portfolios and gainfully achieve the
objectives of meaningfully increasing the away share of larger closed and open-ended funds by
choosing emerging markets with better and consistent governance memes. An investment in
national bank portfolios can gainfully mark entry into unknown investment destinations if
supported by minimum institutional frameworks. The analysis establishes that portfolio
managers can extract benefits intelligently by grouping similar country sets on better
governance and parameters available in contemporary data for a large set of emerging markets.
This may follow both geographically contiguous outlines or noncontiguous country sets
defined by similar institutional frameworks.
Stock returns of banks can meaningfully predict vital economic growth and markets for
corporate control significantly impact this growth accretion positively.

6. References
Allegret, J., -P., Raymond, H., and Rharrabti, H. (2017), “The impact of the European sovereign
debt crisis on banks stocks. Some evidence of shift contagion in Europe”, Journal of Banking
and Finance, Vol. 74, pp.24-37, doi//10.1016/j.jbankfin.2016.10.004
Al-Moulani, A., and Alexiou, C. (2017), “Banking sector depth and economic growth nexus: a
comparative study between the natural resource-based and the rest of the world’s economies”,
International Review of Applied Economics, pp. 1–26, doi:10.1080/02692171.2017.1299115
Andries, A.M., Fischer, A.M., and Yesin, P., (2017), “The asymmetric effect of international
swap lines on banks in emerging markets”, Journal of Banking and Finance, Vol. 75,
pp.215-234. doi//10.1016/j.jbankfin.2016.11.021
Arize, A., Ume, K., and Nkwor, N. (2017), “Banks versus Markets: Do They Compete,
Complement or Co-evolve in the Nigerian Financial System? An ARDL Approach”, Research
in International Business and Finance.
doi:10.1016/j.ribaf.2017.07.174
Badaruddin, Z.E., Ariff, M., and Khalid, A.M., (2011), “Money supply endogeneity and bank
stock returns”, Applied Financial Economics, Vol. 21, pp. 1035-1048.
Banerjee, G., Das, A., Jana, K., and Shetty, S., (2016), “Effects of derivatives usage and
financial statement items on capital market risk measures of Bank stocks: evidence from India”,
Journal of Economics and Finance, Vol. 41, pp. 487-504.
doi//10.1007/s12197016-9366-6
Banerjee, P., Ahmed, M., and Hossain, M. (2017). “Bank, Stock Market and Economic Growth:
Bangladesh Perspective”, The Journal of Developing Areas, Vol. 51 No. 2, pp. 17–29.
doi:10.1353/jda.2017.0028
Baum, C.F ., Schaffer, M.E., Stillman, S. (2007), “Enhanced routines for instrumental
variables/GMM estimation and testing”, Stata Journal, 7(4). http://stata-journal.com
Beck, T., and Levine, R., (2004), “Stock markets, banks, and growth: Panel evidence”, Journal
of Banking and Finance, Vol. 28 No. 3, pp.423-442, doi//10.1016/S0378-4266(02)00408-9
Beltratti, A., and Paladino, G., (2012), “Is M & A different during a crisis? Evidence from the
European Banking sector”, Available at SSRN. http://ssrn.com/abstract=1928513
Blau, B.M., Brough, T.J., and Griffith, T.J., (2017), “Bank opacity and the efficiency of stock
prices”, Journal of Banking and Finance, 76, 32-47.
doi:10.1016/j.jbankfin.2016.11.026
Bond, S.R., Hoeffler, A., and Temple, J. (2001), “GMM estimation of Empirical growth
models”, CEPR Discussion Papers No. 3048. http://www.cepr.org/pubs/dps/DP3048.asp
Bond, S.R., Söderbom, M., (2009), “Conditional investment-cash flow sensitivities and
financing constraints”, Oxford University Working Papers.
https://www.nuffield.ox.ac.uk/users/bond/index.html
Bongini, P., Iwanicz-Drozdowska, M., Smaga, P., and Witkowski, B. (2017), “Financial
Development and Economic Growth: The Role of Foreign-Owned Banks in CESEE
Countries”, Sustainability, Vol. 9 No. 3, pp. 335. doi:10.3390/su9030335
Chen, Q., and Vashishtha, R., (2017), “The effects of bank mergers on corporate information
disclosure”, Journal of Accounting and Economics, 64, 56-77.
doi:10.1016/j.jacceco.2017.05.003
Claessens, S., and van Horen, N. (2016), “The Impact of the Global Financial Crisis on Banking
Globalization”, IMF Economic Review, Vol. 63 No. 4, pp. 868–918. doi:10.1057/imfer.2015.38
Cole, R., A., Moshirian, F., and Wu, Q., (2008), “Bank stock returns and economic growth”,
Journal of Banking and Finance, Vol. 32 No. 6, pp. 995-1007,
doi:10.1016/j.jbankfin.2007.07.006
Deidda, L., and Fattouh, B. (2008), “Banks, financial markets and growth”, Journal of
Financial Intermediation, Vol. 17 No. 1, pp.6–36. doi:10.1016/j.jfi.2006.04.003
Diallo, B. (2017), “Corporate governance, bank concentration and economic growth”,
Emerging Markets Review, 32, 28–37. doi:10.1016/j.ememar.2017.05.003
Diallo, B., and Koch, W. (2017), “Bank Concentration and Schumpeterian Growth: Theory and
International Evidence”, The Review of Economics and Statistics.
doi:10.1162/REST_a_00679
Diallo, B., and Zhang, Q. (2017), “Bank concentration and sectoral growth: Evidence from
Chinese provinces”, Economics Letters, Vol. 154, pp. 77–80.
doi:10.1016/j.econlet.2017.02.013
Du, C., Song, L., and Wu, J., (2016), “Bank accounting disclosure, information content in stock
prices, and stock crash risk: Global evidence”, Pacific Accounting Review, Vol. 28 No. 3,
pp.260-278, doi:10.1108/PAR-09-2015-0037
Ductor, L., and Grechyna, D., (2015), “Financial development, real sector, and economic
growth” International Review of Economics and Finance, Vol. 37, pp.393-405,
doi:10.1016/j.iref.2015.01.001
Ferrara, L., and Marsilli, C. (2013), “Financial variables as leading indicators of GDP growth:
Evidence from a MIDAS approach during the Great Recession”, Applied Economics
Letters, Vol. 20 No. 3, pp.233–237. doi:10.1080/13504851.2012.689099
Fufa, T., and Kim, J. (2017), “Stock Markets, Banks, and Economic Growth: Evidence from
more homogeneous panels”, Research in International Business and Finance.
doi:10.1016/j.ribaf.2017.07.120
Gibson, H.D., Hall, S.G., and Tavlas, G.S., (2016), “How the euro-area sovereign-debt crisis
led to a collapse in bank equity prices”, Journal of Financial Stability. Vol. 26, pp.266-275.
doi:10.1016/j.jfs.2016.07.010
Gippel, J., Smith, T., and Zhu, Y. (2015), “Endogeneity in Accounting and Finance Research:
Natural Experiments as a State‐of‐the‐Art Solution”, Abacus, Vol. 51, No. 2, pp.143–168.
doi:10.1111/abac.12048
Goes, C., (2016), “Institutions and Growth: A GMM IV Panel VAR approach”, Economics
Letters, Vol. 138, pp.85-91. doi:10.1016/j.econlet.2015.11.024
Hamada, K., Kaneko, A., and Yanagihara, M. (2017), “Oligopolistic competition in the banking
market and economic growth”, Economic Modelling. doi:10.1016/j.econmod.2017.07.017
He, Z., and Niu, J. (2017), “The effect of economic policy uncertainty on bank valuations”,
Applied Economics Letters, Vol. 1–3. doi:10.1080/13504851.2017.1321832
Issahaku, H., Abor, J., and Harvey, S. (2017), “Remittances, banks and stock markets: Panel
evidence from developing countries”, Research in International Business and
Finance, Vol. 42, pp. 1413–1427. doi:10.1016/j.ribaf.2017.07.080
Kapingura, F. (2013), “Finance and economic growth nexus: Complementarity and
substitutability between the banking sector and financial markets in Africa, using South Africa
as a case”, Journal of Economics and International Finance, Vol. 5, No. 7, pp. 273–286.
doi:10.5897/JEIF2013.0524
Ma, J., and Wohar, M., E., (2014), “Expected Returns and Expected Growth: time to rethink
the established literature”, Applied Economics, Vol. 46, No. 21, pp.2462–2476,
doi//10.1080/00036846.2014.899674
Masulis, R.W. and Zhang, E. J., (2018), “How valuable are independent directors? Evidence
from external distractions”, Available at SSRN. doi:10.2139/ssrn.2816470
Liu, C.Y., Low, A., Masulis, R.W., Zhang, L. (2018), “Monitoring the monitor: Distracted
institutional investors and board governance”, ECGI Working Papers no. 531.
doi:10.2139/ssrn.2934755

Banerjee, S., Masulis, R.W., and Upadhyay. A., (2018), “Mitigating Effects of Gender Diverse
Boards in Companies with Overconfident CEOs”, Available at SSRN.
doi:10.2139/ssrn.2989857
Mishkin, F., (2009). “Why we shouldn’t turn our backs on Financial Globalization”, IMF
Working Papers.
Mishra, S., and Narayan, P.K., (2015), “A nonparametric model of financial system and
economic growth”, International Review of Economics and Finance, Vol. 39, pp.175-191,
doi:10.1016/j.iref.2015.04.004
Moshirian, F., and Wu, Q. (2012), “Banking industry volatility and economic growth”,
Research in International Business and Finance, Vol. 26, No. 3, pp.428–442.
doi:10.1016/j.ribaf.2012.01.004
Pathan, S., and Faff, R. (2013), “Does board structure in banks really affect their
performance?”, Journal of Banking and Finance, Valume 37, Issue 5, pp.1573-1589,
doi:10.1016/j.jbankfin.2012.12.016
Pan, L., and Mishra, V. (2018), “Stock market development and economic growth: Empirical
evidence from China”, Economic Modelling, Vol. 68, pp. 661–673.
doi:10.1016/j.econmod.2017.07.005
Salvador, C., (2017), “Effect of signals of bank ratings on stock returns before and during the
financial crisis”, Spanish Review of Financial Economics, Vol. 15 No. 1, pp.1-11.
doi//10.1016/j.srfe.2017.01.002
Shezaad, C.T., and de Haan, J., (2013), “Was the 2007 crisis really a global banking crisis?”,
North American Journal of Economics and Finance, Vol. 24, pp. 113-124.
Soedarmono, W., Sitorus, D. and Tarazi, A., (2017), “Abnormal loan growth, credit
information sharing and systemic risk in Asian banks”, Research in International Business and
Finance. doi:10.1016/j.ribaf.2017.07.058
Umar, M., and Sun, G., (2016), “Bank leverage and stock liquidity: evidence from BRICS
countries”, Journal of Financial Economic Policy, Vol. 8 Issue: 3, pp.298-315,
https://doi.org/10.1108/JFEP-07-2015-0040
Wallis, J. (2017), “Banks and Democracy”, In P. Rousseau and P. Wachtel (Eds.), Financial
Systems and Economic Growth: Credit, Crises, and Regulation from the 19th Century to the
Present (Studies in Macroeconomic History, pp. 105-131). Cambridge:
Cambridge University Press. doi:10.1017/9781316493281.005

Williams, B. (2014), “Bank risk and national governance in Asia”, Journal of Banking and
Finance, Vol. 49, pp.10–26. doi:10.1016/j.jbankfin.2014.08.0

TABLE 1
Table 1: Descriptive Statistics of Performance and control variables.
The entire data series extends from 1999q1-2017q3 resulting in 71 observations for each country in the sample. 10 portfolios are constructed from
individual banks using data from Reuters Datastream for India, China, Hongkong, Taiwan, Korea, Singapore, Malaysia, Thailand, Indonesia and
the Philippines. Control measures (Financial Development) are used as ratios of GDP (Priv, M2Liq) and Central Bank assets (CCB). World Bank
Governance Indicators (Law, Geff) and Govt ownership of banks (Govt) while Crisis Dummy is binary 0 or 1. The Quarterly returns of the Market
index in each case is netted by the three-month Risk-free rate. All data is referenced from Reuters Eikon/Datastream including the IMF Economic
Series. Annual data from World Bank Statistics is used where aggregate data is required only as an exogenous regressor as the series does not
have any missing data. World Governance Indictors series provide data for Rule of Law (Law) and Government effectiveness (Geff) from among
the six dimensions available for these indicators.
(1) (2) (3) (4) (5) (6) (7) (8) (9) (10)
VARIABLES N Mean Sd Min max Var skewness kurtosis p25 p75
Growth (Dyg)
624
0.0510
0.0352
-0.0946
0.249
0.00124
0.0269
6.490
0.0315
0.0687
Market index
Returns (Rm)
624 0.00568 0.118 -0.466 0.419 0.0140 -0.281 4.321 -0.0474 0.0741
Bank Portfolio
Returns (Rb)
624 0.0211 0.141 -0.470 0.637 0.0200 0.320 5.631 -0.0503 0.0924
Crisis Dummy
(Dcris)
624 0.212 0.409 0 1 0.167 1.413 2.996 0 0
Govt
ownership
of banks
(Govt)
624 0.284 0.294 0 1 0.0862 1.079 3.131 0 0.385
Private Credit
(Priv)
624 1.499 1.654 0.182 6.338 2.735 2.051 5.907 0.446 1.417
Money Supply
(M2Liq)
624 2.286 2.686 0.196 10.29 7.213 1.758 4.821 0.655 2.517
Commercial-
Central
Bank (CCB)
624 3.165 4.937 0.146 28.05 24.38 2.958 11.97 1.001 2.670
Rule of Law
(Law)
624 0.717 0.186 0.382 1 0.0345 0.0687 1.640 0.555 0.877
Governance
Effectiveness
(Geff)
624
0.632
0.227
0.198
0.962
0.0517
-0.0848
1.533
0.407
0.841
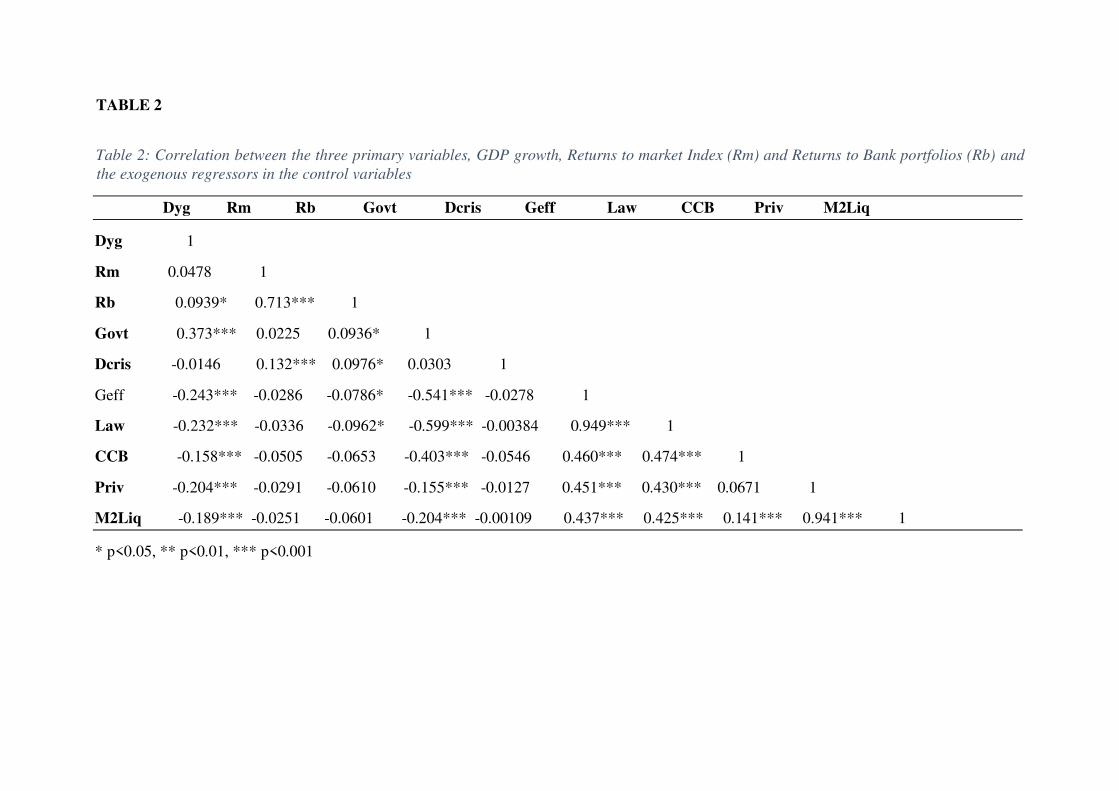
TABLE 2
Table 2: Correlation between the three primary variables, GDP growth, Returns to market Index (Rm) and Returns to Bank portfolios (Rb) and
the exogenous regressors in the control variables
Dyg Rm Rb Govt Dcris Geff Law CCB Priv M2Liq
Dyg 1
Rm 0.0478 1
Rb 0.0939* 0.713*** 1
Govt 0.373*** 0.0225 0.0936* 1
Dcris -0.0146 0.132*** 0.0976* 0.0303 1
Geff -0.243*** -0.0286 -0.0786* -0.541*** -0.0278 1
Law -0.232*** -0.0336 -0.0962* -0.599*** -0.00384 0.949*** 1
CCB -0.158*** -0.0505 -0.0653 -0.403*** -0.0546 0.460*** 0.474*** 1
Priv -0.204*** -0.0291 -0.0610 -0.155*** -0.0127 0.451*** 0.430*** 0.0671 1
M2Liq -0.189*** -0.0251 -0.0601 -0.204*** -0.00109 0.437*** 0.425*** 0.141*** 0.941*** 1
* p<0.05, ** p<0.01, *** p<0.001
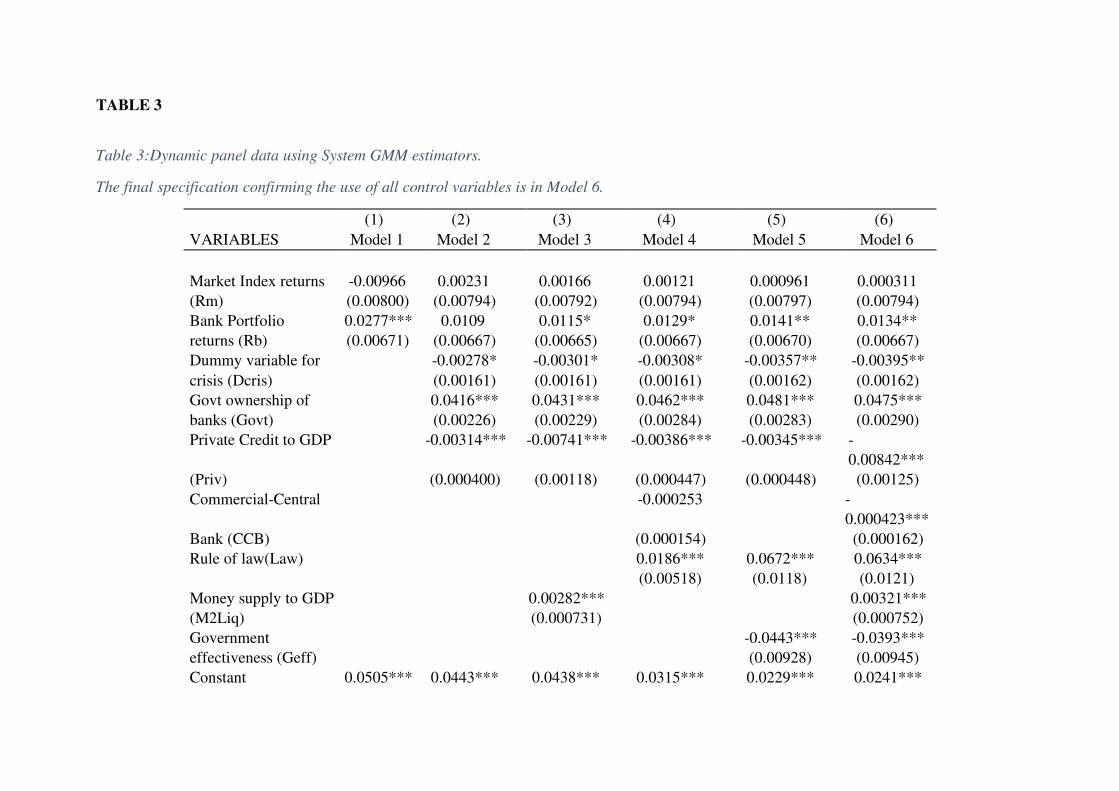
TABLE 3
Table 3:Dynamic panel data using System GMM estimators.
The final specification confirming the use of all control variables is in Model 6.
(1) (2) (3) (4) (5) (6)
VARIABLES Model 1 Model 2 Model 3 Model 4 Model 5 Model 6
Market Index returns
-0.00966
0.00231
0.00166
0.00121
0.000961
0.000311
(Rm) (0.00800) (0.00794) (0.00792) (0.00794) (0.00797) (0.00794)
Bank Portfolio 0.0277*** 0.0109 0.0115* 0.0129* 0.0141** 0.0134**
returns (Rb) (0.00671) (0.00667) (0.00665) (0.00667) (0.00670) (0.00667)
Dummy variable for -0.00278* -0.00301* -0.00308* -0.00357** -0.00395**
crisis (Dcris) (0.00161) (0.00161) (0.00161) (0.00162) (0.00162)
Govt ownership of 0.0416*** 0.0431*** 0.0462*** 0.0481*** 0.0475***
banks (Govt) (0.00226) (0.00229) (0.00284) (0.00283) (0.00290)
Private Credit to GDP -0.00314*** -0.00741*** -0.00386*** -0.00345*** -
0.00842***
(Priv) (0.000400) (0.00118) (0.000447) (0.000448) (0.00125)
Commercial-Central -0.000253 -
0.000423***
Bank (CCB) (0.000154) (0.000162)
Rule of law(Law) 0.0186*** 0.0672*** 0.0634***
(0.00518) (0.0118) (0.0121)
Money supply to GDP 0.00282*** 0.00321***
(M2Liq) (0.000731) (0.000752)
Government -0.0443*** -0.0393***
effectiveness (Geff) (0.00928) (0.00945)
Constant 0.0505*** 0.0443*** 0.0438*** 0.0315*** 0.0229*** 0.0241***

(0.000671) (0.00119) (0.00120) (0.00390) (0.00436) (0.00448)
Observations
624
624
624
624
624
624
Number of ctry 10 10 10 10 10 10
Standard errors in parentheses
*** p<0.01, ** p<0.05, * p<0.1
The lag GDP term is included in all specifications but suppressed (the coefficient is always more than 70-75%)
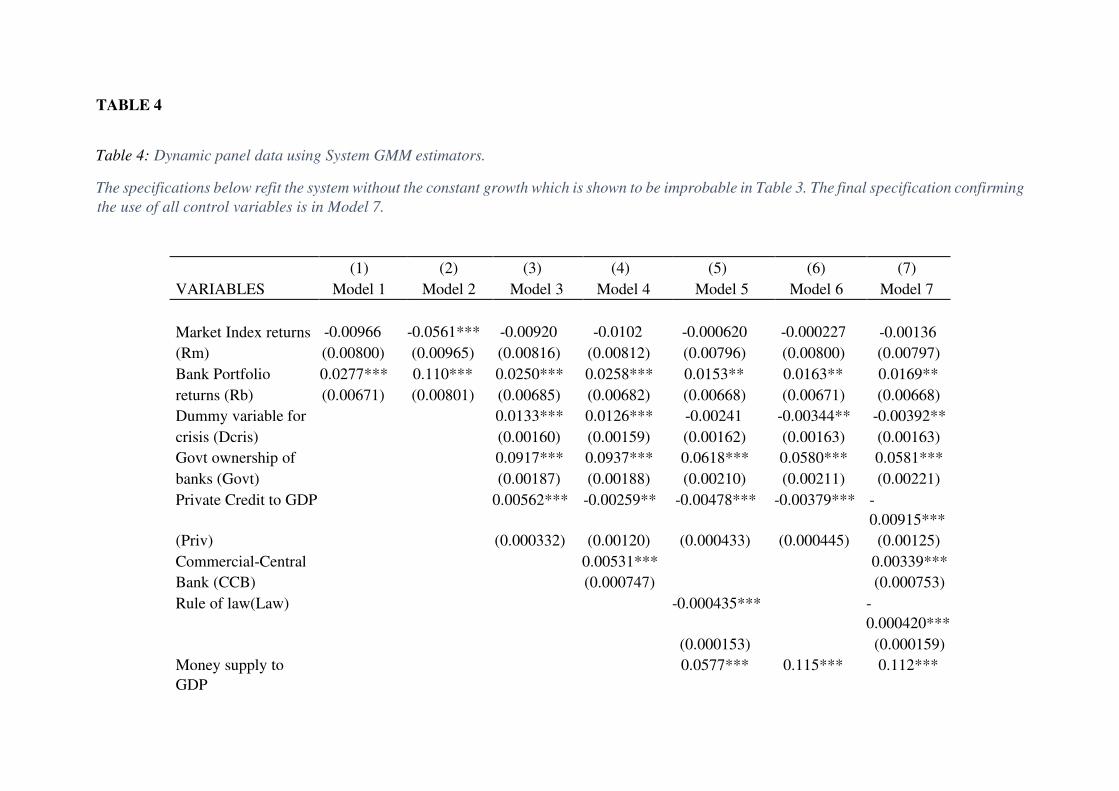
TABLE 4
Table 4: Dynamic panel data using System GMM estimators.
The specifications below refit the system without the constant growth which is shown to be improbable in Table 3. The final specification confirming
the use of all control variables is in Model 7.
(1) (2) (3) (4) (5) (6) (7)
VARIABLES Model 1 Model 2 Model 3 Model 4 Model 5 Model 6 Model 7
Market Index returns
-0.00966
-0.0561***
-0.00920
-0.0102
-0.000620
-0.000227 -0.00136
(Rm) (0.00800) (0.00965) (0.00816) (0.00812) (0.00796) (0.00800) (0.00797)
Bank Portfolio 0.0277*** 0.110*** 0.0250*** 0.0258*** 0.0153** 0.0163** 0.0169**
returns (Rb) (0.00671) (0.00801) (0.00685) (0.00682) (0.00668) (0.00671) (0.00668)
Dummy variable for 0.0133*** 0.0126*** -0.00241 -0.00344** -0.00392**
crisis (Dcris) (0.00160) (0.00159) (0.00162) (0.00163) (0.00163)
Govt ownership of 0.0917*** 0.0937*** 0.0618*** 0.0580*** 0.0581***
banks (Govt) (0.00187) (0.00188) (0.00210) (0.00211) (0.00221)
Private Credit to GDP 0.00562*** -0.00259** -0.00478*** -0.00379*** -
0.00915***
(Priv) (0.000332) (0.00120) (0.000433) (0.000445) (0.00125)
Commercial-Central 0.00531*** 0.00339***
Bank (CCB) (0.000747) (0.000753)
Rule of law(Law) -0.000435*** -
0.000420***
(0.000153) (0.000159)
Money supply to
GDP
0.0577*** 0.115*** 0.112***

(M2Liq) (0.00187) (0.00763) (0.00764)
Government -0.0668*** -0.0610***
effectiveness (Geff) (0.00827) (0.00837)
Constant
0.0505***
(0.000671)
Observations 624 624 624 624 624 624 624
No.of ctry 10 10 10 10 10 10 10
Standard errors in parentheses
*** p<0.01, ** p<0.05, * p<0.1
The lag GDP term is included in all specifications but suppressed (the coefficient is always more than 70-75%)
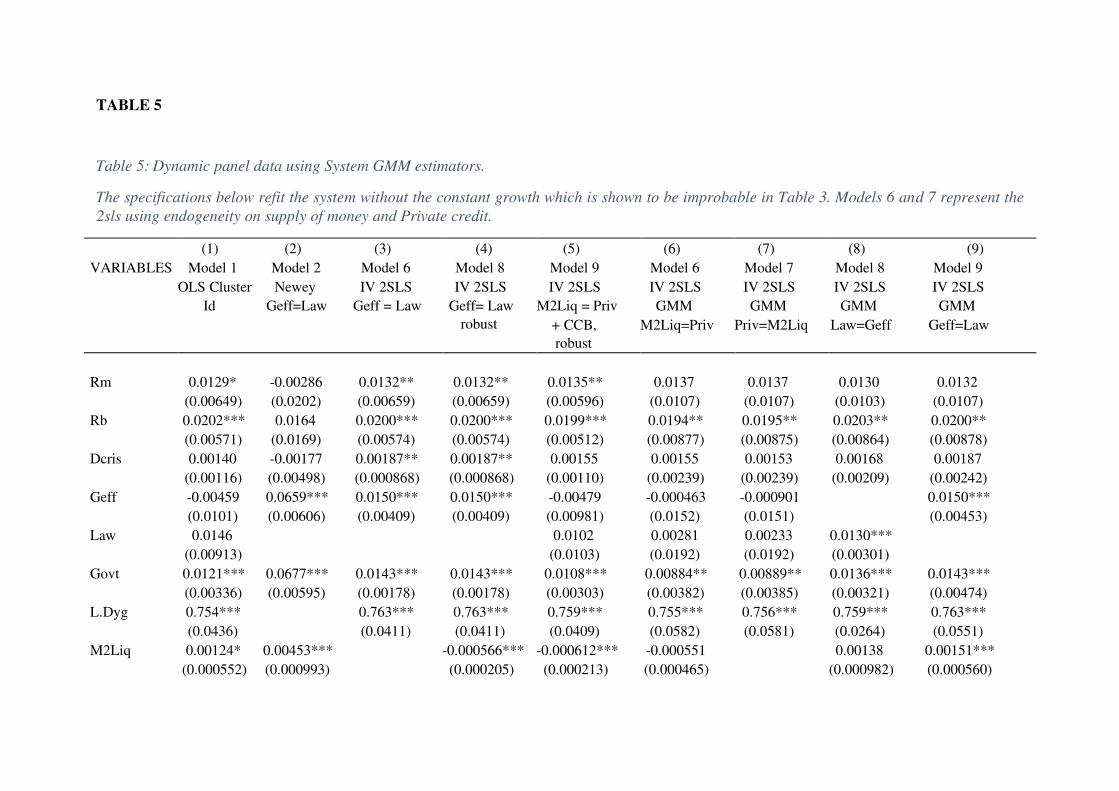
TABLE 5
Table 5: Dynamic panel data using System GMM estimators.
The specifications below refit the system without the constant growth which is shown to be improbable in Table 3. Models 6 and 7 represent the
2sls using endogeneity on supply of money and Private credit.
(1) (2) (3) (4) (5) (6) (7) (8) (9)
VARIABLES Model 1
OLS Cluster
Id
Model 2
Newey
Geff=Law
Model 6
IV 2SLS
Geff = Law
Model 8
IV 2SLS
Geff= Law
robust
Model 9
IV 2SLS
M2Liq = Priv
+ CCB,
robust
Model 6
IV 2SLS
GMM
M2Liq=Priv
Model 7
IV 2SLS
GMM
Priv=M2Liq
Model 8
IV 2SLS
GMM
Law=Geff
Model 9
IV 2SLS
GMM
Geff=Law
Rm
0.0129*
-0.00286
0.0132**
0.0132**
0.0135**
0.0137
0.0137
0.0130
0.0132
(0.00649) (0.0202) (0.00659) (0.00659) (0.00596) (0.0107) (0.0107) (0.0103) (0.0107)
Rb 0.0202*** 0.0164 0.0200*** 0.0200*** 0.0199*** 0.0194** 0.0195** 0.0203** 0.0200**
(0.00571) (0.0169) (0.00574) (0.00574) (0.00512) (0.00877) (0.00875) (0.00864) (0.00878)
Dcris 0.00140 -0.00177 0.00187** 0.00187** 0.00155 0.00155 0.00153 0.00168 0.00187
(0.00116) (0.00498) (0.000868) (0.000868) (0.00110) (0.00239) (0.00239) (0.00209) (0.00242)
Geff -0.00459 0.0659*** 0.0150*** 0.0150*** -0.00479 -0.000463 -0.000901 0.0150***
(0.0101) (0.00606) (0.00409) (0.00409) (0.00981) (0.0152) (0.0151) (0.00453)
Law 0.0146 0.0102 0.00281 0.00233 0.0130***
(0.00913) (0.0103) (0.0192) (0.0192) (0.00301)
Govt 0.0121*** 0.0677*** 0.0143*** 0.0143*** 0.0108*** 0.00884** 0.00889** 0.0136*** 0.0143***
(0.00336) (0.00595) (0.00178) (0.00178) (0.00303) (0.00382) (0.00385) (0.00321) (0.00474)
L.Dyg 0.754*** 0.763*** 0.763*** 0.759*** 0.755*** 0.756*** 0.759*** 0.763***
(0.0436) (0.0411) (0.0411) (0.0409) (0.0582) (0.0581) (0.0264) (0.0551)
M2Liq 0.00124* 0.00453*** -0.000566*** -0.000612*** -0.000551 0.00138 0.00151***
(0.000552) (0.000993) (0.000205) (0.000213) (0.000465) (0.000982) (0.000560)

Priv -0.00289** -0.0126*** -0.00360*** -0.00360*** -0.000571 -0.00315* -0.00360***
(0.000897) (0.00209) (0.000786) (0.000786) (0.000714) (0.00163) (0.00125)
CCB -0.000242** -0.000789* -0.000326*** -0.000326*** -0.000144 -0.000154 -0.000262 -0.000326*
(9.67e-05) (0.000476) (0.000123) (0.000123) (0.000184) (0.000187) (0.000209) (0.000187)
t_qtr 1.27e-05 2.52e-05
(1.94e-05) (1.72e-05)
Constant 0.00883* 0.00902*
(0.00494) (0.00501)
Observations 614 624 614 614 614 614 614 614 614
R-squared 0.885 0.645 0.646 0.885 0.884
Robust standard errors in parentheses
*** p<0.01, ** p<0.05, * p<0.1
The lag GDP term is included in all specifications but suppressed (the coefficient is always more than 70-75%)