
Bank Saint Petersburg 1Q2011 IFRS Results
19
• Образец текста • Второй уровень • Третий уровень • Четвертый уровень • Пятый уровень 1 BANK SAINT PETERSBURG 1Q 2011 IFRS Results June 9, 2011
-
Upload
bank-saint-petersburg -
Category
Economy & Finance
-
view
187 -
download
1
Transcript of Bank Saint Petersburg 1Q2011 IFRS Results
Образец заголовка
• Образец текста
• Второй уровень
• Третий уровень
• Четвертый уровень
• Пятый уровень
1
BANK SAINT PETERSBURG
1Q 2011 IFRS Results
June 9, 2011

Образец заголовка
• Образец текста
• Второй уровень
• Третий уровень
• Четвертый уровень
• Пятый уровень
2

Образец заголовка
• Образец текста
• Второй уровень
• Третий уровень
• Четвертый уровень
• Пятый уровень
3
Summary –
Bank Saint Petersburg at a glance
2
Regional leader
Focused on
North-West
Selected financial
and operational
results
A leading privately-owned universal bank in St. Petersburg and the Leningrad region
St. Petersburg market share as at April 1, 2011*:
• Assets: 12.8%
• Loans: 16.0% - corporate, 4.8% - retail
• Deposits: 11.1% - corporate, 8.1% - retail
As at April 1, 2011
Client base: over 1 million retail and 35 thousand corporate customers
36 branches and outlets (primarily in St. Petersburg), 472 ATMs
As at April 1, 2011:
16th largest bank by assets and 15th by retail deposits among the Russian banks**
Ratings: Moody’s Ba3 (Stable outlook)
Total assets: RUB 282.4 bn (USD 9.9 bn)
Total capital: RUB 37.4 bn (USD 1.3 bn)
Net income: RUB 2.1 bn (USD 73.3 mln)
Cost/Income ratio: 26.2%
ROAE: 28.6%
Total capital adequacy: 12.7%
2,488 employees
* Association of North-West banks, Bank Saint Petersburg own estimates
** Interfax
Образец заголовка
• Образец текста
• Второй уровень
• Третий уровень
• Четвертый уровень
• Пятый уровень
4
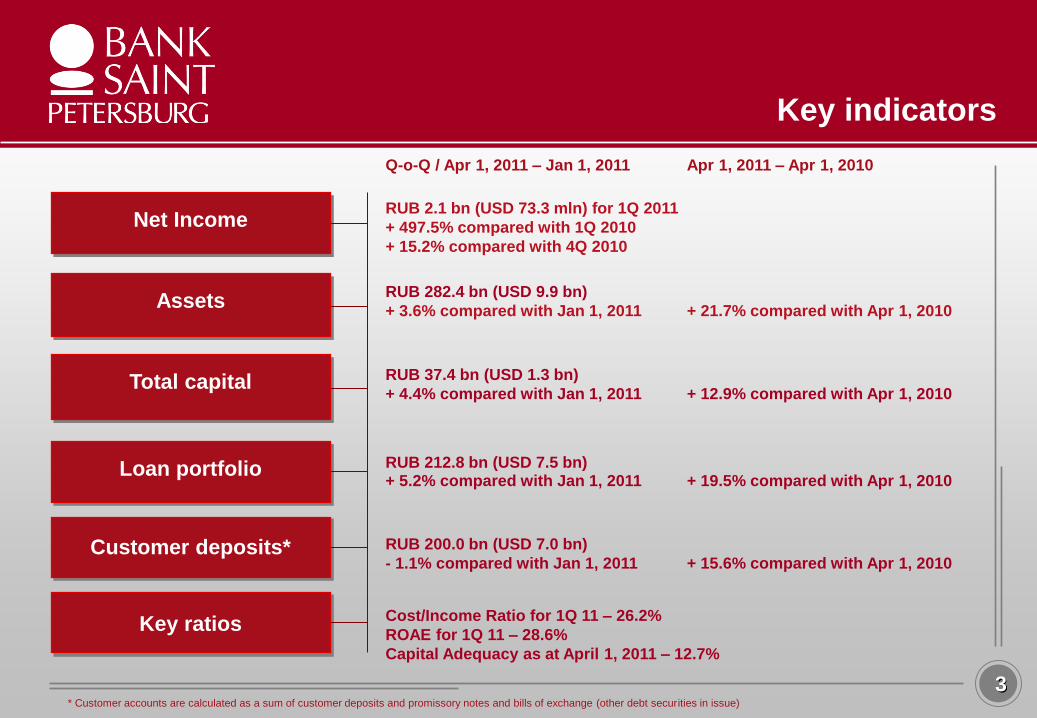
RUB 2.1 bn (USD 73.3 mln) for 1Q 2011
+ 497.5% compared with 1Q 2010
+ 15.2% compared with 4Q 2010
Q-o-Q / Apr 1, 2011 – Jan 1, 2011 Apr 1, 2011 – Apr 1, 2010
Net Income
Assets
Total capital
Loan portfolio
Customer deposits*
Cost/Income Ratio for 1Q 11 – 26.2%
ROAE for 1Q 11 – 28.6%
Capital Adequacy as at April 1, 2011 – 12.7%
Key ratios
RUB 212.8 bn (USD 7.5 bn) + 5.2% compared with Jan 1, 2011 + 19.5% compared with Apr 1, 2010
RUB 200.0 bn (USD 7.0 bn)
- 1.1% compared with Jan 1, 2011 + 15.6% compared with Apr 1, 2010
* Customer accounts are calculated as a sum of customer deposits and promissory notes and bills of exchange (other debt securities in issue)
RUB 282.4 bn (USD 9.9 bn)
+ 3.6% compared with Jan 1, 2011 + 21.7% compared with Apr 1, 2010
RUB 37.4 bn (USD 1.3 bn)
+ 4.4% compared with Jan 1, 2011 + 12.9% compared with Apr 1, 2010
Key indicators
3

Образец заголовка
• Образец текста
• Второй уровень
• Третий уровень
• Четвертый уровень
• Пятый уровень
5
Table of contents
4
I. Bank’s market position
II. Financial highlights and business overview
III. Recent developments and prospects
Образец заголовка
• Образец текста
• Второй уровень
• Третий уровень
• Четвертый уровень
• Пятый уровень
6
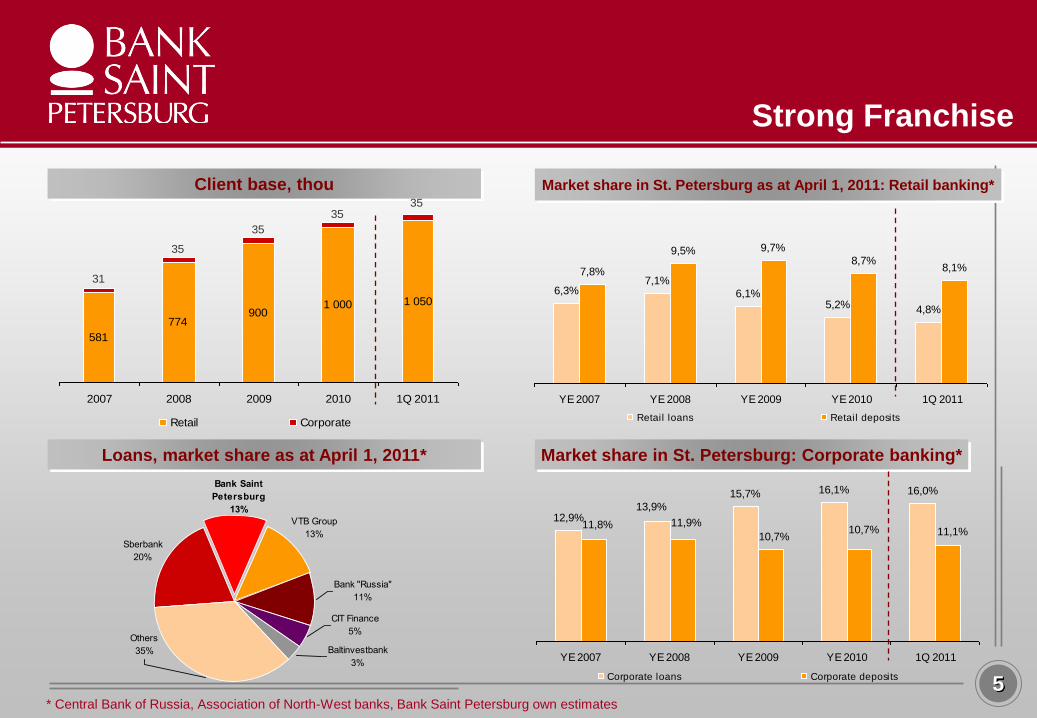
Strong Franchise
Client base, thou Market share in St. Petersburg as at April 1, 2011: Retail banking*
Market share in St. Petersburg: Corporate banking*
* Central Bank of Russia, Association of North-West banks, Bank Saint Petersburg own estimates
5
Loans, market share as at April 1, 2011*
6,3%7,1%
6,1%5,2% 4,8%
7,8%
9,5% 9,7%
8,7%8,1%
YE 2007 YE 2008 YE 2009 YE 2010 1Q 2011
Retail loans Retail deposits
581
774900
1 000
31
35
35
35
1 050
35
2007 2008 2009 2010 1Q 2011
Retail Corporate
12,9%
16,1% 16,0%
13,9%
15,7%
11,8% 11,9%
10,7%10,7% 11,1%
YE 2007 YE 2008 YE 2009 YE 2010 1Q 2011
Corporate loans Corporate deposits
Sberbank
20%
VTB Group
13%
Bank Saint
Petersburg
13%
Others
35%
CIT Finance
5%
Baltinvestbank
3%
Bank "Russia"
11%
Образец заголовка
• Образец текста
• Второй уровень
• Третий уровень
• Четвертый уровень
• Пятый уровень
7
Table of contents
6
I. Bank’s market position
II. Financial highlights and business overview
III. Recent developments and prospects
Образец заголовка
• Образец текста
• Второй уровень
• Третий уровень
• Четвертый уровень
• Пятый уровень
8
33,1 33,5 34,535,9
37,4
April 1, 2010 July 1, 2010 October 1, 2010 January 1, 2011 April 1, 2011
232,1 239,5 247,4
272,6282,4
April 1, 2010 July 1, 2010 October 1, 2010 January 1, 2011 April 1, 2011
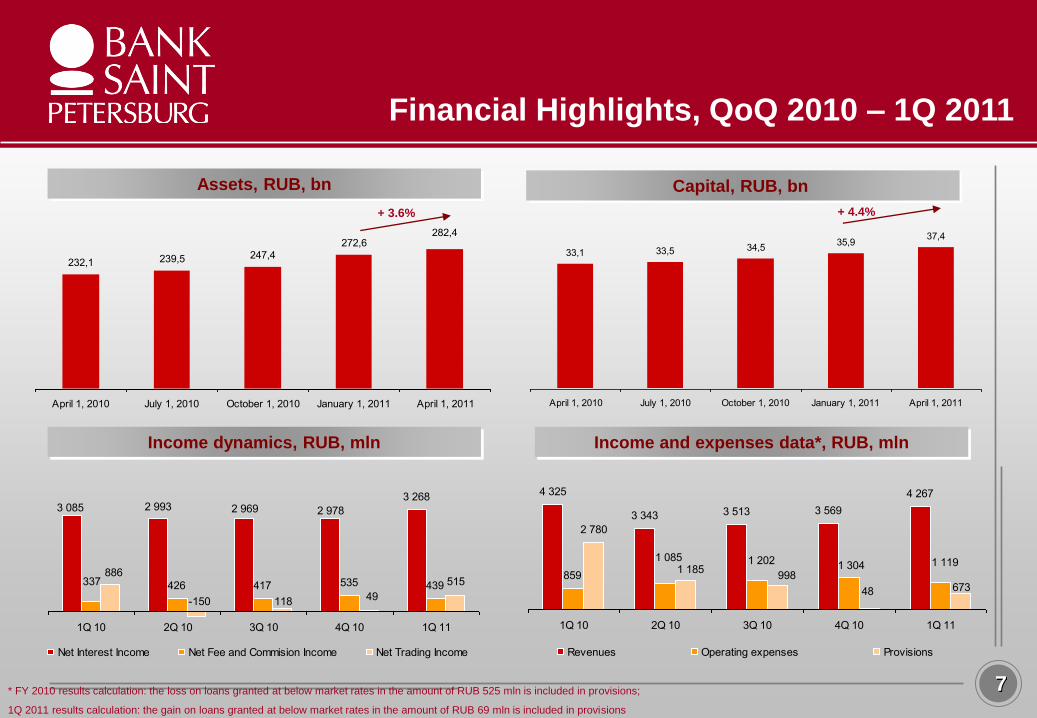
Financial Highlights, QoQ 2010 – 1Q 2011
Assets, RUB, bn
Income dynamics, RUB, mln Income and expenses data*, RUB, mln
Capital, RUB, bn
7
+ 3.6% + 4.4%
* FY 2010 results calculation: the loss on loans granted at below market rates in the amount of RUB 525 mln is included in provisions;
1Q 2011 results calculation: the gain on loans granted at below market rates in the amount of RUB 69 mln is included in provisions
3 268
426 417 535 439
2 9782 9692 9933 085
337
49118-150
886515
1Q 10 2Q 10 3Q 10 4Q 10 1Q 11
Net Interest Income Net Fee and Commision Income Net Trading Income
4 325
3 343 3 513 3 569
4 267
859
2 780
1 085 1 202 1 304 1 1191 185
998
48 673
1Q 10 2Q 10 3Q 10 4Q 10 1Q 11
Revenues Operating expenses Provisions
Образец заголовка
• Образец текста
• Второй уровень
• Третий уровень
• Четвертый уровень
• Пятый уровень
9
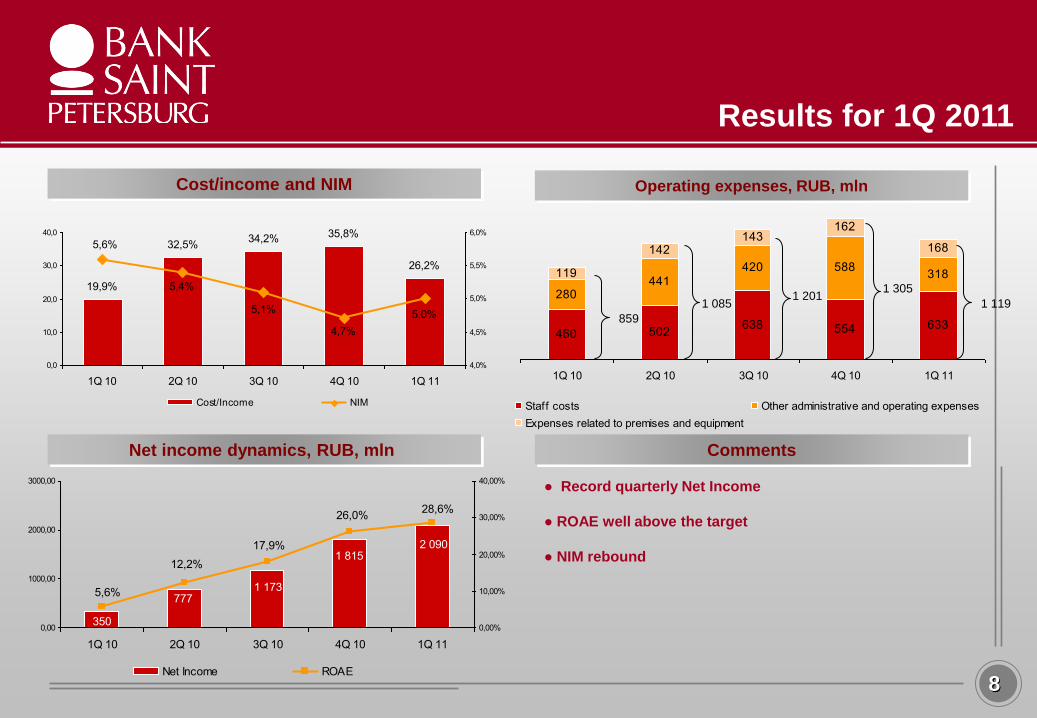
460 502638 554 633
280441
420 588318119
142143
162
168
1Q 10 2Q 10 3Q 10 4Q 10 1Q 11
Staff costs Other administrative and operating expenses
Expenses related to premises and equipment
Results for 1Q 2011
Cost/income and NIM Operating expenses, RUB, mln
Comments Net income dynamics, RUB, mln
8
● Record quarterly Net Income
● ROAE well above the target
● NIM rebound
859
1 085 1 201
1 305
1 119
19,9%
32,5%34,2% 35,8%
26,2%
5,0%
4,7%
5,1%
5,6%
5,4%
0,0
10,0
20,0
30,0
40,0
1Q 10 2Q 10 3Q 10 4Q 10 1Q 11
4,0%
4,5%
5,0%
5,5%
6,0%
Cost/Income NIM
1 173
2 0901 815
350
777
17,9%
26,0%28,6%
12,2%
5,6%
0,00
1000,00
2000,00
3000,00
1Q 10 2Q 10 3Q 10 4Q 10 1Q 11
0,00%
10,00%
20,00%
30,00%
40,00%
Net Income ROAE
Образец заголовка
• Образец текста
• Второй уровень
• Третий уровень
• Четвертый уровень
• Пятый уровень
10
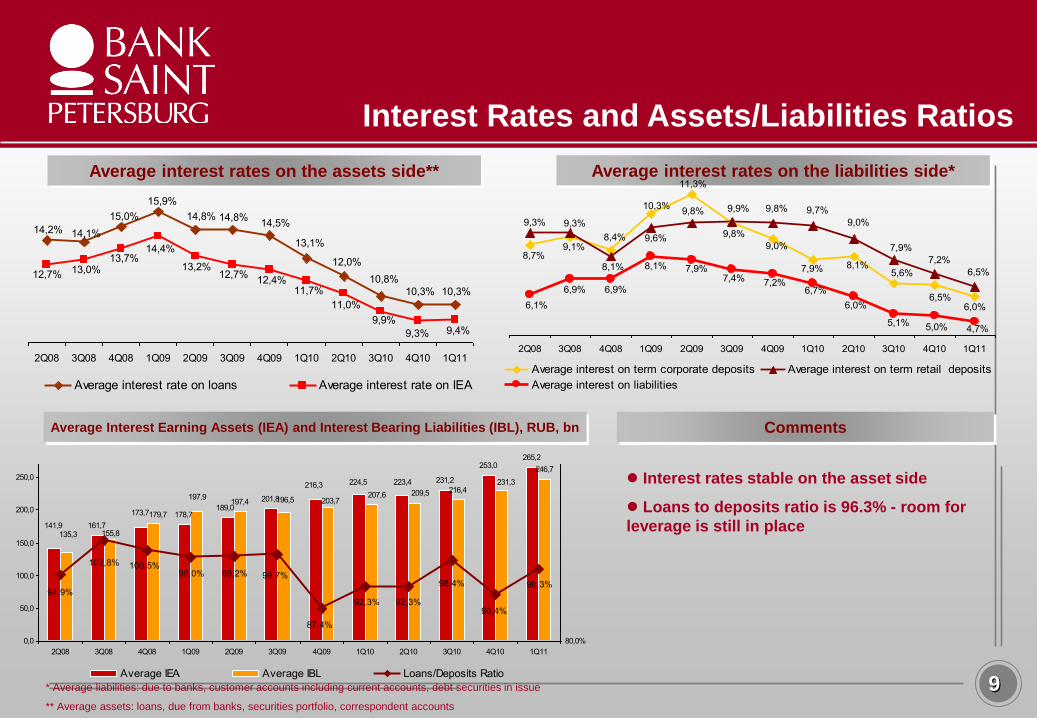
161,7
178,7
201,8
231,2
253,0265,2
197,4
216,4
246,7
189,0
141,9
173,7
216,3 223,4224,5
135,3
209,5207,6203,7
179,7
155,8
197,9 196,5
231,3
96.3%98,4%
92,3%92,3%
87,4%
99,7%99,2%99,0%100,5%102,8%
94,9%
90,4%
0,0
50,0
100,0
150,0
200,0
250,0
2Q08 3Q08 4Q08 1Q09 2Q09 3Q09 4Q09 1Q10 2Q10 3Q10 4Q10 1Q11
80,0%
Average IEA Average IBL Loans/Deposits Ratio
Average interest rates on the assets side**
Interest Rates and Assets/Liabilities Ratios
Average interest rates on the liabilities side*
9
Comments Average Interest Earning Assets (IEA) and Interest Bearing Liabilities (IBL), RUB, bn
* Average liabilities: due to banks, customer accounts including current accounts, debt securities in issue
** Average assets: loans, due from banks, securities portfolio, correspondent accounts
Interest rates stable on the asset side
Loans to deposits ratio is 96.3% - room for
leverage is still in place
6,0%
11,3%
10,3%
8,7%9,1%
8,4% 9,8%
9,0%
7,9% 8,1%5,6%
6,5%
6,5%8,1%
9,6%
9,8%
9,3%9,3%
9,7%9,9% 9,8%
9,0%
7,9%
7,2%
4,7%
8,1% 7,9%
6,9%6,9%
6,1%
7,2%7,4%
6,7%
6,0%
5,1% 5,0%
2Q08 3Q08 4Q08 1Q09 2Q09 3Q09 4Q09 1Q10 2Q10 3Q10 4Q10 1Q11
Average interest on term corporate deposits Average interest on term retail deposits
Average interest on liabilities
10,3%10,3%
14,2% 14,1%
15,0%
15,9%
14,8%
12,0%
13,1%
14,5%14,8%
10,8%
9,4%9,3%
13,2%
14,4%13,7%
13,0%12,7% 12,7%12,4%
11,7%
11,0%
9,9%
2Q08 3Q08 4Q08 1Q09 2Q09 3Q09 4Q09 1Q10 2Q10 3Q10 4Q10 1Q11
Average interest rate on loans Average interest rate on IEA
Образец заголовка
• Образец текста
• Второй уровень
• Третий уровень
• Четвертый уровень
• Пятый уровень
11
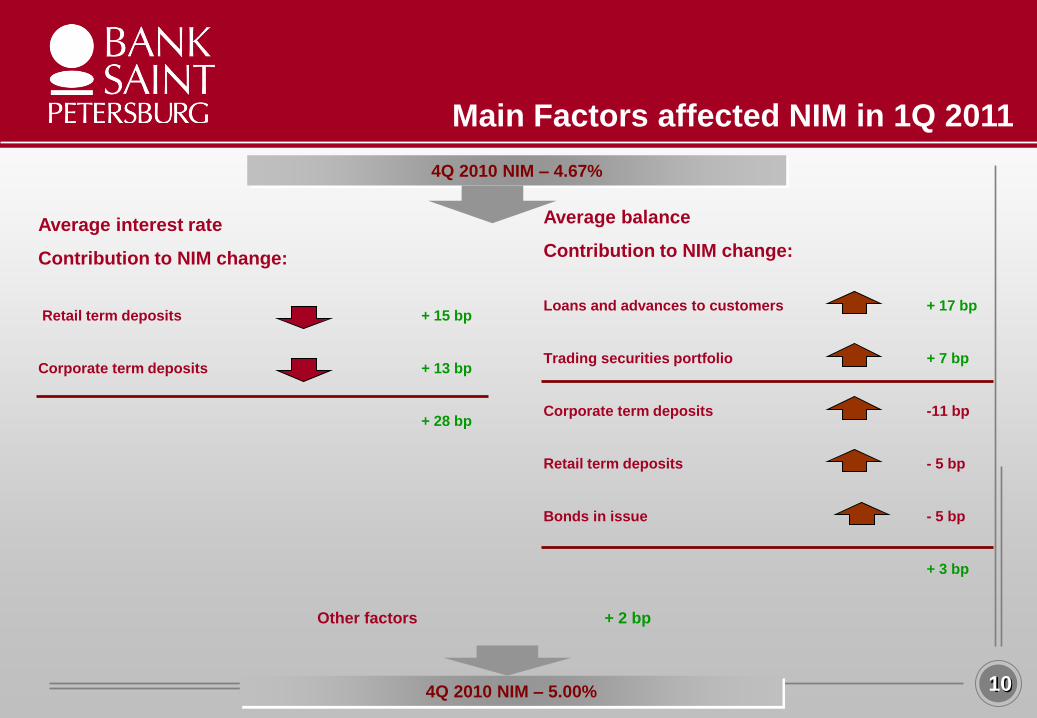
Main Factors affected NIM in 1Q 2011
4Q 2010 NIM – 4.67%
10 4Q 2010 NIM – 5.00%
Average interest rate
Contribution to NIM change:
Retail term deposits + 15 bp
Corporate term deposits + 13 bp
+ 28 bp
Average balance
Contribution to NIM change:
Loans and advances to customers + 17 bp
Trading securities portfolio + 7 bp
Corporate term deposits -11 bp
Retail term deposits - 5 bp
Bonds in issue - 5 bp
+ 3 bp
Other factors + 2 bp
Образец заголовка
• Образец текста
• Второй уровень
• Третий уровень
• Четвертый уровень
• Пятый уровень
12
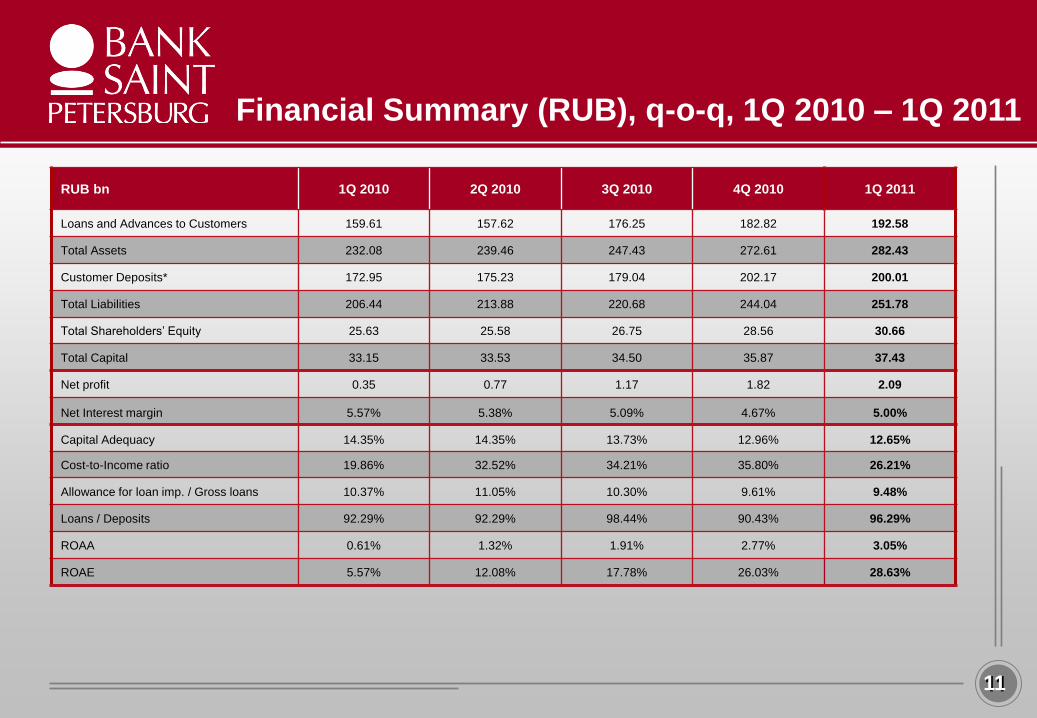
Financial Summary (RUB), q-o-q, 1Q 2010 – 1Q 2011
RUB bn 1Q 2010 2Q 2010 3Q 2010 4Q 2010 1Q 2011
Loans and Advances to Customers 159.61 157.62 176.25 182.82 192.58
Total Assets 232.08 239.46 247.43 272.61 282.43
Customer Deposits* 172.95 175.23 179.04 202.17 200.01
Total Liabilities 206.44 213.88 220.68 244.04 251.78
Total Shareholders’ Equity 25.63 25.58 26.75 28.56 30.66
Total Capital 33.15 33.53 34.50 35.87 37.43
Net profit 0.35 0.77 1.17 1.82 2.09
Net Interest margin 5.57% 5.38% 5.09% 4.67% 5.00%
Capital Adequacy 14.35% 14.35% 13.73% 12.96% 12.65%
Cost-to-Income ratio 19.86% 32.52% 34.21% 35.80% 26.21%
Allowance for loan imp. / Gross loans 10.37% 11.05% 10.30% 9.61% 9.48%
Loans / Deposits 92.29% 92.29% 98.44% 90.43% 96.29%
ROAA 0.61% 1.32% 1.91% 2.77% 3.05%
ROAE 5.57% 12.08% 17.78% 26.03% 28.63%
11
Образец заголовка
• Образец текста
• Второй уровень
• Третий уровень
• Четвертый уровень
• Пятый уровень
13
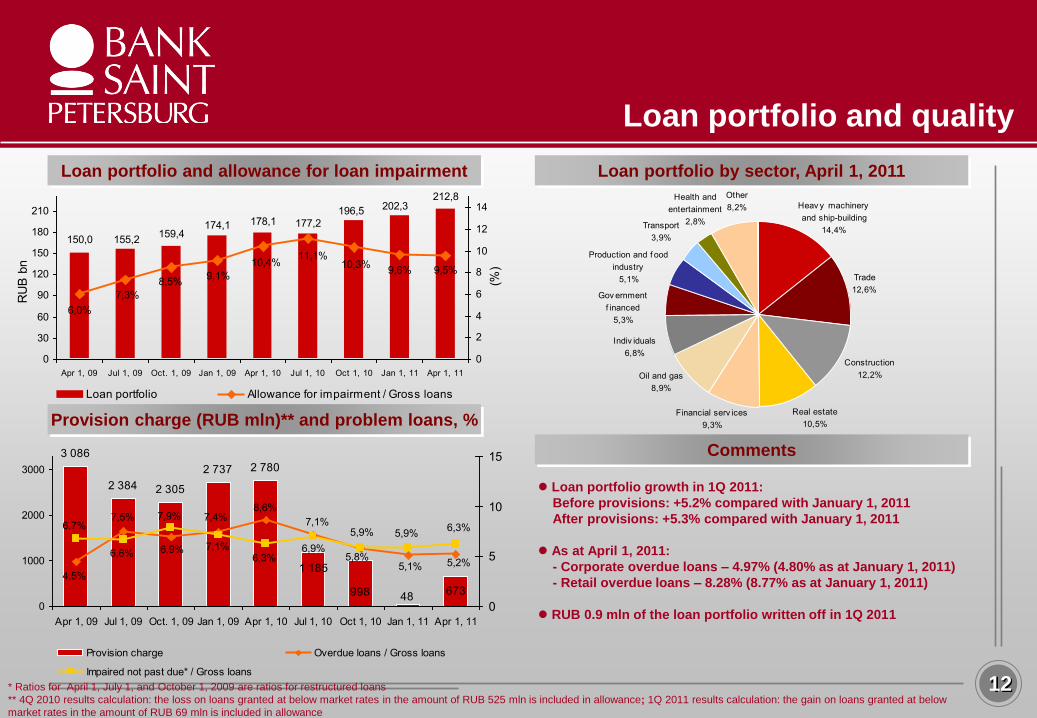
Loan portfolio and quality
Loan portfolio and allowance for loan impairment Loan portfolio by sector, April 1, 2011
Comments
Provision charge (RUB mln)** and problem loans, %
12
Loan portfolio growth in 1Q 2011:
Before provisions: +5.2% compared with January 1, 2011
After provisions: +5.3% compared with January 1, 2011
As at April 1, 2011:
- Corporate overdue loans – 4.97% (4.80% as at January 1, 2011)
- Retail overdue loans – 8.28% (8.77% as at January 1, 2011)
RUB 0.9 mln of the loan portfolio written off in 1Q 2011
* Ratios for April 1, July 1, and October 1, 2009 are ratios for restructured loans
** 4Q 2010 results calculation: the loss on loans granted at below market rates in the amount of RUB 525 mln is included in allowance; 1Q 2011 results calculation: the gain on loans granted at below
market rates in the amount of RUB 69 mln is included in allowance
212,8
178,1174,1159,4
155,2150,0
177,2
196,5 202,3
7,3%
6,0%
8,5%9,1%
10,4%11,1%
10,3%9,6% 9,5%
0
30
60
90
120
150
180
210
Apr 1, 09 Jul 1, 09 Oct. 1, 09 Jan 1, 09 Apr 1, 10 Jul 1, 10 Oct 1, 10 Jan 1, 11 Apr 1, 11
RU
B b
n
0
2
4
6
8
10
12
14
(%)
Loan portfolio Allowance for impairment / Gross loans
Trade
12,6%
Construction
12,2%
Real estate
10,5%
Gov ernment
f inanced
5,3%
Transport
3,9%
Production and f ood
industry
5,1%
Indiv iduals
6,8%
Heav y machinery
and ship-building
14,4%
Financial serv ices
9,3%
Oil and gas
8,9%
Other
8,2%
Health and
entertainment
2,8%
3 086
2 384 2 305
2 737 2 780
67348998
1 1855,2%5,1%
5,8%
8,6%7,4%
6,9%
7,5%
4,5%
7,1%6,3%
5,9%5,9%
6,3%7,1%
7,9%
6,6%
6,7%
6,9%
0
1000
2000
3000
Apr 1, 09 Jul 1, 09 Oct. 1, 09 Jan 1, 09 Apr 1, 10 Jul 1, 10 Oct 1, 10 Jan 1, 11 Apr 1, 11
0
5
10
15
Provision charge Overdue loans / Gross loans
Impaired not past due* / Gross loans
Образец заголовка
• Образец текста
• Второй уровень
• Третий уровень
• Четвертый уровень
• Пятый уровень
14
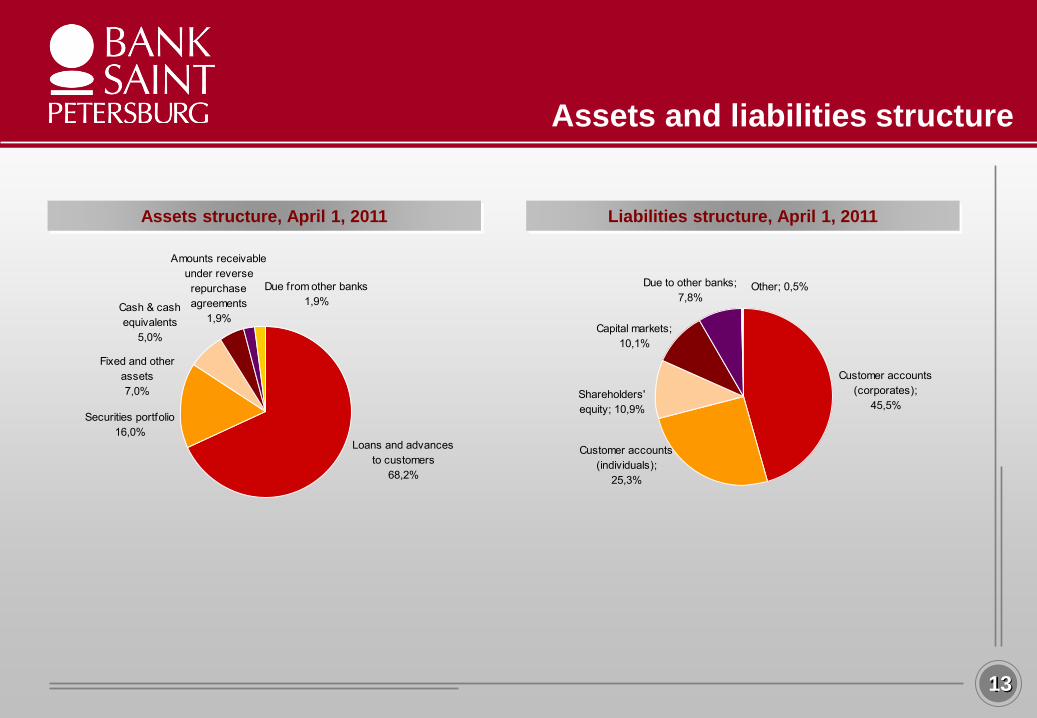
Assets and liabilities structure
Assets structure, April 1, 2011 Liabilities structure, April 1, 2011
13
Loans and advances
to customers
68,2%
Securities portfolio
16,0%
Cash & cash
equivalents
5,0%
Amounts receivable
under reverse
repurchase
agreements
1,9%
Due from other banks
1,9%
Fixed and other
assets
7,0%
Customer accounts
(corporates);
45,5%
Customer accounts
(individuals);
25,3%
Shareholders'
equity; 10,9%
Capital markets;
10,1%
Due to other banks;
7,8%Other; 0,5%
Образец заголовка
• Образец текста
• Второй уровень
• Третий уровень
• Четвертый уровень
• Пятый уровень
15
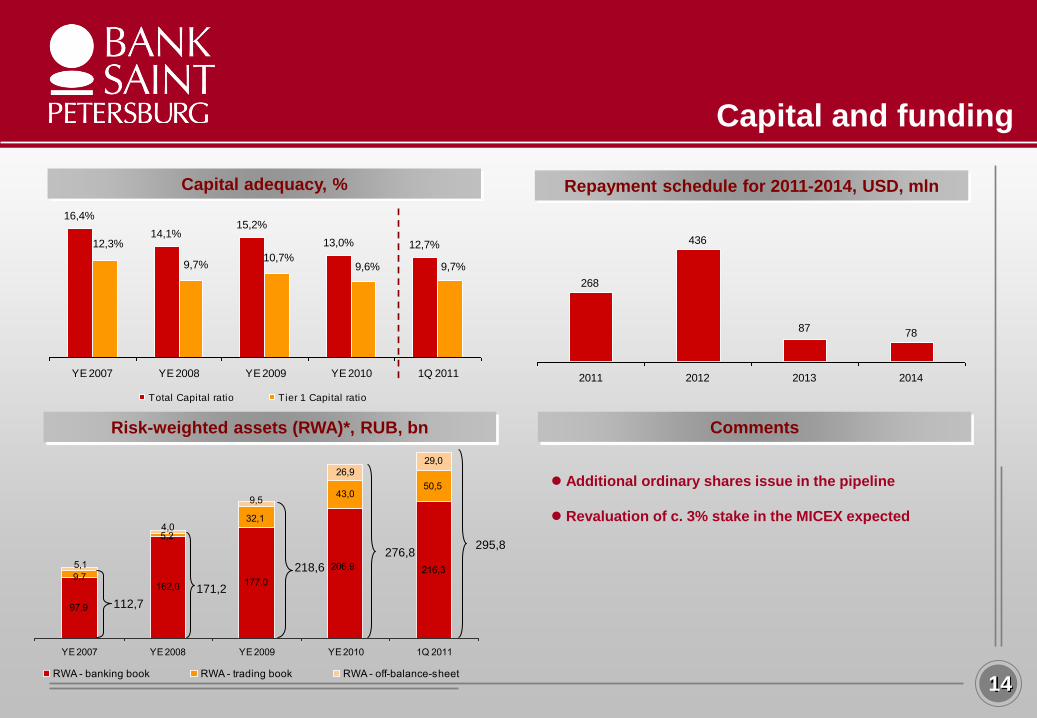
97,9
162,0 177,0
216,3
26,9
29,0
206,99,7
5,2
50,543,0
32,1
9,5
4,0
5,1
YE 2007 YE 2008 YE 2009 YE 2010 1Q 2011
RWA - banking book RWA - trading book RWA - off-balance-sheet
Capital and funding
Capital adequacy, % Repayment schedule for 2011-2014, USD, mln
Comments
14
Risk-weighted assets (RWA)*, RUB, bn
112,7
171,2
218,6
276,8
Additional ordinary shares issue in the pipeline
Revaluation of c. 3% stake in the MICEX expected
268
436
87 78
2011 2012 2013 2014
295,8
16,4%
14,1%15,2%
13,0% 12,7%12,3%
9,7%10,7%
9,6% 9,7%
YE 2007 YE 2008 YE 2009 YE 2010 1Q 2011
Total Capital ratio Tier 1 Capital ratio
Образец заголовка
• Образец текста
• Второй уровень
• Третий уровень
• Четвертый уровень
• Пятый уровень
16
Table of contents
15
I. Bank’s market position
II. Financial highlights
III. Recent developments and prospects
Образец заголовка
• Образец текста
• Второй уровень
• Третий уровень
• Четвертый уровень
• Пятый уровень
17
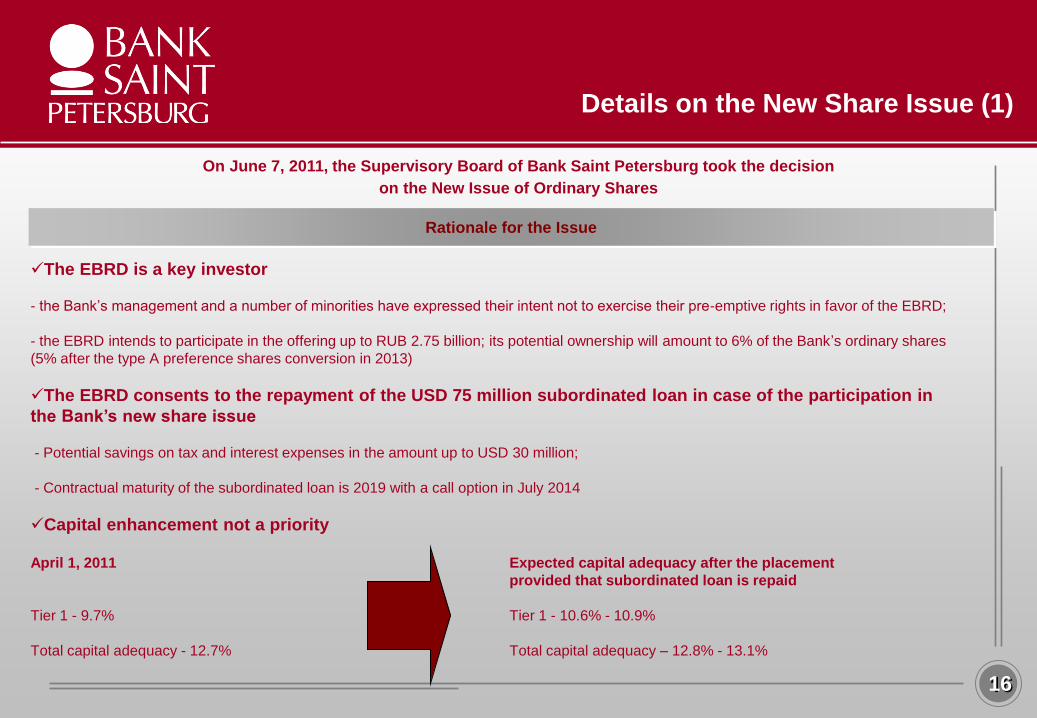
The EBRD is a key investor
- the Bank’s management and a number of minorities have expressed their intent not to exercise their pre-emptive rights in favor of the EBRD;
- the EBRD intends to participate in the offering up to RUB 2.75 billion; its potential ownership will amount to 6% of the Bank’s ordinary shares
(5% after the type A preference shares conversion in 2013)
The EBRD consents to the repayment of the USD 75 million subordinated loan in case of the participation in
the Bank’s new share issue
- Potential savings on tax and interest expenses in the amount up to USD 30 million;
- Contractual maturity of the subordinated loan is 2019 with a call option in July 2014
Capital enhancement not a priority April 1, 2011 Expected capital adequacy after the placement
provided that subordinated loan is repaid
Tier 1 - 9.7% Tier 1 - 10.6% - 10.9%
Total capital adequacy - 12.7% Total capital adequacy – 12.8% - 13.1%
Details on the New Share Issue (1)
16
On June 7, 2011, the Supervisory Board of Bank Saint Petersburg took the decision
on the New Issue of Ordinary Shares
Rationale for the Issue
Образец заголовка
• Образец текста
• Второй уровень
• Третий уровень
• Четвертый уровень
• Пятый уровень
18
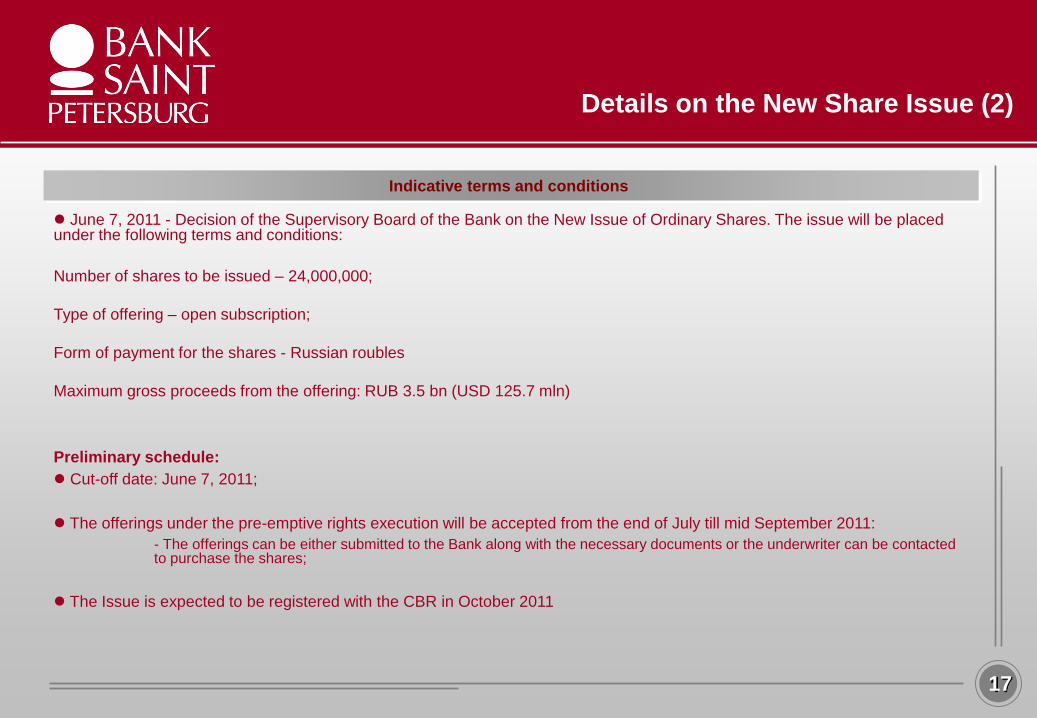
Indicative terms and conditions
Details on the New Share Issue (2)
17
June 7, 2011 - Decision of the Supervisory Board of the Bank on the New Issue of Ordinary Shares. The issue will be placed under the following terms and conditions:
Number of shares to be issued – 24,000,000;
Type of offering – open subscription;
Form of payment for the shares - Russian roubles
Maximum gross proceeds from the offering: RUB 3.5 bn (USD 125.7 mln)
Preliminary schedule:
Cut-off date: June 7, 2011;
The offerings under the pre-emptive rights execution will be accepted from the end of July till mid September 2011:
- The offerings can be either submitted to the Bank along with the necessary documents or the underwriter can be contacted to purchase the shares;
The Issue is expected to be registered with the CBR in October 2011

Образец заголовка
• Образец текста
• Второй уровень
• Третий уровень
• Четвертый уровень
• Пятый уровень
19 18