
Bank risk taking and liquidity creation following regulatory interventions and …€¦ · ·...
44
Bank risk taking and liquidity creation following regulatory interventions and capital support Allen N. Berger 1 University of South Carolina, Wharton Financial Institutions Center, and CentER – Tilburg University Christa H. S. Bouwman 2 Case Western Reserve University and Wharton Financial Institutions Center Thomas Kick 3 Deutsche Bundesbank Klaus Schaeck 4 Bangor Business School Abstract During times of bank distress, authorities often engage in regulatory interventions and provide capital support to reduce bank risk taking. An unintended effect of such actions may be a reduction in bank liquidity creation, with possible adverse consequences for the economy as a whole. This paper tests hypotheses regarding the effects of regulatory interventions and capital support on bank risk taking and liquidity creation using a unique dataset over the period 1999- 2009. We find that both types of actions are generally associated with statistically significant reductions in risk taking and liquidity creation in the short run. While the effects of regulatory interventions are also economically significant, the effects of capital support are generally not economically significant. A long-run analysis suggests that 1) the changes in risk taking and liquidity creation did not precede the regulatory interventions and capital support, and 2) most of the changes in risk taking and liquidity creation occur in the short term and remain in place in the long run. Thus, both types of actions have important intended and unintended consequences with implications for policymakers. Keywords: risk taking, liquidity creation, bank distress, regulatory interventions, capital support JEL Classification: G21, G28 1 Moore School of Business, University of South Carolina, 1705 College Street, Columbia, SC 29208, United States. E-mail: [email protected] 2 Case Western Reserve University, Weatherhead School of Management, 10900 Euclid Avenue, 362 Peter B. Lewis Bldg, Cleveland, OH 44106, United States. E-mail: [email protected] 3 Deutsche Bundesbank, Wilhelm-Epstein-Strasse 14, 60431 Frankfurt am Main, Germany. E-mail: [email protected] 4 Bangor Business School, Bangor University, Hen Goleg, College Road, Bangor LL57 2DG, United Kingdom. E-mail: [email protected] Acknowledgements We thank Yener Altunbas, Christina Bannier, Charles Calomiris, Hans Degryse, Bob DeYoung, Klaus Düllmann, Mariassunta Giannetti, Martin Goetz, Owain ap Gwilym, Philipp Hartmann, Alexey Levkov, Thilo Liebig, Gyongyi Loranth, Angela Maddaloni, Phil Molyneux, Leonard Nakamura, Lars Norden, Enrico Onali, Steven Ongena, Sascha Steffen, Wolf Wagner, Tanju Yorulmazer, and seminar and conference participants at the Bundesbank Seminar on Banking and Finance, Bangor Business School, the European Central Bank, the Royal Economic Society Conference in Guildford, the European Economic Association Meeting in Glasgow, the European Finance Association Meeting in Frankfurt, the conference on “Information, Liquidity and Trust in Incomplete Financial Markets” in Freiburg, the conference on “Liquidity and Liquidity Risks” in Frankfurt, the Financial Management Association Meeting in New York, the Financial Intermediation Research Society Meeting in Sydney, and the 3 rd Financial Stability Conference in Tilburg for helpful comments and suggestions. Klaus Schaeck was visiting the Deutsche Bundesbank when this project was initiated. He acknowledges support from the Leverhulme Trust (Grant F/00174/Q) and the hospitality of the Deutsche Bundesbank. This paper represents the authors’ personal opinions and does not necessarily reflect the views of the Deutsche Bundesbank or its staff.
Transcript of Bank risk taking and liquidity creation following regulatory interventions and …€¦ · ·...

Bank risk taking and liquidity creation following
regulatory interventions and capital support Allen N. Berger1
University of South Carolina, Wharton Financial Institutions Center, and CentER – Tilburg University
Christa H. S. Bouwman2 Case Western Reserve University and Wharton Financial Institutions Center
Thomas Kick3
Deutsche Bundesbank
Klaus Schaeck4 Bangor Business School
Abstract
During times of bank distress, authorities often engage in regulatory interventions and provide capital support to reduce bank risk taking. An unintended effect of such actions may be a reduction in bank liquidity creation, with possible adverse consequences for the economy as a whole. This paper tests hypotheses regarding the effects of regulatory interventions and capital support on bank risk taking and liquidity creation using a unique dataset over the period 1999-2009. We find that both types of actions are generally associated with statistically significant reductions in risk taking and liquidity creation in the short run. While the effects of regulatory interventions are also economically significant, the effects of capital support are generally not economically significant. A long-run analysis suggests that 1) the changes in risk taking and liquidity creation did not precede the regulatory interventions and capital support, and 2) most of the changes in risk taking and liquidity creation occur in the short term and remain in place in the long run. Thus, both types of actions have important intended and unintended consequences with implications for policymakers.
Keywords: risk taking, liquidity creation, bank distress, regulatory interventions, capital support JEL Classification: G21, G28
1 Moore School of Business, University of South Carolina, 1705 College Street, Columbia, SC 29208, United States. E-mail: [email protected]
2 Case Western Reserve University, Weatherhead School of Management, 10900 Euclid Avenue, 362 Peter B. Lewis Bldg, Cleveland, OH 44106, United States. E-mail: [email protected]
3 Deutsche Bundesbank, Wilhelm-Epstein-Strasse 14, 60431 Frankfurt am Main, Germany. E-mail: [email protected]
4 Bangor Business School, Bangor University, Hen Goleg, College Road, Bangor LL57 2DG, United Kingdom. E-mail: [email protected]
Acknowledgements We thank Yener Altunbas, Christina Bannier, Charles Calomiris, Hans Degryse, Bob DeYoung, Klaus Düllmann, Mariassunta Giannetti, Martin Goetz, Owain ap Gwilym, Philipp Hartmann, Alexey Levkov, Thilo Liebig, Gyongyi Loranth, Angela Maddaloni, Phil Molyneux, Leonard Nakamura, Lars Norden, Enrico Onali, Steven Ongena, Sascha Steffen, Wolf Wagner, Tanju Yorulmazer, and seminar and conference participants at the Bundesbank Seminar on Banking and Finance, Bangor Business School, the European Central Bank, the Royal Economic Society Conference in Guildford, the European Economic Association Meeting in Glasgow, the European Finance Association Meeting in Frankfurt, the conference on “Information, Liquidity and Trust in Incomplete Financial Markets” in Freiburg, the conference on “Liquidity and Liquidity Risks” in Frankfurt, the Financial Management Association Meeting in New York, the Financial Intermediation Research Society Meeting in Sydney, and the 3rd Financial Stability Conference in Tilburg for helpful comments and suggestions. Klaus Schaeck was visiting the Deutsche Bundesbank when this project was initiated. He acknowledges support from the Leverhulme Trust (Grant F/00174/Q) and the hospitality of the Deutsche Bundesbank. This paper represents the authors’ personal opinions and does not necessarily reflect the views of the Deutsche Bundesbank or its staff.

-1-
Introduction
During times of bank distress, authorities often intervene in banks and may also provide
capital support in order to reduce bank risk taking (e.g., Dahl and Spivey (1995); Bhattacharya,
Boot, and Thakor (1998); Oshinsky and Olin (2005); Giannetti and Simonov (2010); Hoshi and
Kashyap (2010)).1 However, a potential unintended consequence of these actions may be that
banks create less liquidity by, for example, making fewer loans, issuing fewer loan commitments,
or shifting into liquid assets. This may not be desirable given that liquidity creation is one of
banks’ raisons d’être (e.g., Bryant (1980); Diamond and Dybvig, (1983); Boot, Greenbaum, and
Thakor (1993); Holmstrom and Tirole (1998); Kashyap, Rajan, and Stein (2002)),2
The key question we ask in this paper therefore is: What are the effects of regulatory
interventions and capital support on bank risk taking and liquidity creation? Addressing this
question informs the current debate about the efficacy of different ways of intervening and
dealing with distressed banks and helps fill a gap in the literature that lacks empirical evidence on
whether regulatory interventions and capital support are beneficial.
and reduced
liquidity creation may have negative consequences for the macroeconomy (Bernanke (1983);
Gibson (1995); Ongena, Smith, and Michalsen (2003); Dell’Ariccia, Detragiache, and Rajan
(2008); Khwaja and Mian (2008); Chava and Purnanandam (2011)). Understanding whether
regulatory interventions and capital support succeed in inducing banks to reduce their risk taking,
and what the consequences are for bank liquidity creation is critical for academics, regulatory
authorities, and policymakers (e.g., Webb (2000); Acharya, Bharath, and Srinivasan (2007); Bank
of England (2008); Acharya, Shin, and Yorulmazer (2009)). Nonetheless, the effects of both
types of actions are not well understood.
While regulatory interventions and capital support take place in many countries, data on such
actions are typically impossible to obtain and previous studies are therefore usually confined to
analyzing the effects of laws and regulations on bank soundness (e.g., Barth, Caprio, and Levine
(2004); Demirgüç-Kunt, Detragiache, and Tressel (2008)). We use a unique dataset from the
Deutsche Bundesbank (the German central bank) which covers the entire universe of German
1 Other benefits include avoiding gridlock in the payments system, restoring financial market confidence, and
enhancing systemic stability. These latter factors benefit the real economy and it is not uncommon that governments justify such interventions and capital support measures on the grounds that “Saving Wall Street is a considered necessary step to help Main Street” as Giannetti and Simonov (2010, p. 1) put it.
2 Another key role of banks is to transform risk (e.g., Diamond (1984); Ramakrishnan and Thakor (1984); Boyd and Prescott (1986)).

-2-
banks for the period 1999-2009. The specific advantage of our dataset is that it contains a
complete set of information on all the interventions and all the capital support provided. Over
this time period, regulatory authorities intervened in 17% of all banks, and provided capital
support (averaging 18% of their Tier 1 capital) to 14% of all banks. Thus, a sizeable proportion
of banks received interventions and capital support, allowing for meaningful analyses.
To address how the different actions affect banks’ risk taking and liquidity creation, we
formulate hypotheses and test them using ordered logit models in which we regress the changes
in risk taking and liquidity creation on a regulatory intervention dummy, the amount of capital
support received (if any), and a set of control variables. We focus on substantial changes in risk
taking and liquidity creation, defined as changes of at least 3%.
By way of preview, we find that regulatory interventions are generally associated with
statistically and economically significant reductions in both risk taking and liquidity creation in
the short run. Capital support is associated with statistically significant reductions in both risk
taking and liquidity creation in the short run, although neither effect is economically significant.
A long-run analysis suggests that 1) the changes in risk taking and liquidity creation did not
precede the regulatory interventions and capital support, and 2) most of the changes in risk taking
and liquidity creation occur in the short term and remain in place in the long run.
We perform a number of additional analyses in which we run regressions separately for:
different bank pillars (i.e., private, public, and cooperative banks); small banks (total assets below
the median of € 329 million) and large banks (total assets above the median); poorly- and better-
capitalized banks (split at the median bank’s balance sheet equity capital ratio of 8.73%); and
crisis years (2001 and 2007-2009) and non-crisis years (1999-2000 and 2002-2006).
To assess robustness of our results, we perform several sensitivity analyses. First, we use
alternative cutoffs to define what constitutes a substantial change in risk taking and liquidity
creation. Second, we run regressions for subsamples of merged and non-merged banks. Third,
we use alternative measures of risk taking and liquidity creation. Fourth, to deal with a potential
endogeneity issue (bank distress may result in both regulatory interventions and capital support
on the one hand, and reductions in risk taking and liquidity creation on the other hand), we use
lagged regulatory interventions and lagged capital support in our main regressions. Recognizing
that this may not be sufficient, we also run instrumental variable regressions. In all cases, we
obtain results that are similar to the main findings.

-3-
We emphasize that although we use German data, our results are likely representative for a
broad number of countries, including the U.S., Japan, and various European countries. To see
that, it is important to note that Germany has many small- and medium-sized banks that provide
financial services in local areas (Puri, Rocholl, and Steffen (2011)). That also holds for the U.S.,
where the vast majority of all banks are considered to be community banks that are the primary
providers of credit for small- and medium-sized businesses. These community banks are locally
owned and operated like savings and cooperative banks in Germany. Japan and various
European countries including Austria, Switzerland, Italy, France, and Spain, also have similar
financial institutions, regulations, and economic environments as Germany. In addition, all those
countries exhibit similarities in terms of dealing with distressed banks. Regulatory interventions
of various forms, and capital support measures have been repeatedly observed in the U.S., Japan,
and in many European economies (e.g., Oshinsky and Olin (2005); Berrospide and Edge (2010);
Giannetti and Simonov (2010); Hoshi and Kashyap (2010); Stolz and Wedow (2010)).
Our paper is related to the studies about prompt corrective action and regulator’s closure
policies (e.g., Boot and Thakor (1993); Mailath and Mester (1994); Dahl and Spivey (1995); Noe,
Rebello, and Wall (1996); Aggarwal and Jacques (2001)), and on the effect of capital support on
banks’ lending behavior (e.g., Berrospide and Edge (2010); Giannetti and Simonov (2010)). To
our knowledge, this paper is the first study that sheds light on how regulatory interventions and
capital support affect bank risk taking and liquidity creation. By examining the effects of
regulatory interventions and capital support on risk taking, we address an issue of first-order
importance. By focusing on the effects of these actions on liquidity creation instead of examining
their effects on lending behavior, our research takes a more holistic perspective using a superior
concept of bank output that includes all on- and off-balance sheet activities.
We organize the paper as follows: Section I provides a brief overview of the German banking
sector and the regulatory interventions and capital support provided during our sample period.
Section II develops our hypotheses. Section III describes the regression framework, data, and
variables. Section IV reports our main empirical results for the short-run effects of regulatory
interventions and capital support on bank risk taking and liquidity creation, and includes
additional analyses and robustness checks. In Section V, we examine the long-run effects of
regulatory interventions and capital support. Concluding remarks are offered in Section VI.

-4-
I. Institutional background, regulatory interventions, and capital support
This section first describes the institutional background of the German banking system. It
then discusses the actions taken by the government and bankers associations in response to bank
distress, i.e., regulatory interventions and capital support.
A. German banking system
Germany has a bank-based financial system, where retail and corporate customers depend
heavily on liquidity provision by financial institutions (Schmidt, Hackethal, and Tyrell (1999)).
The German banking sector consists of three pillars: private banks, public sector banks, and
credit cooperatives. While all these banks are universal banks, the three pillars differ in terms of
ownership structure (Brunner, Decressin, Hardy, and Kudela (2004)). The private bank pillar
contains large nationwide banks, regional banks, and branches and subsidiaries of foreign banks.
The larger private banks are organized as joint-stock companies, whereas their smaller
counterparts are partnerships, private limited companies or even sole proprietors. The public
sector banks include savings banks and Landesbanks owned by governments at the city-, county-,
or state-level. The cooperative banking pillar comprises cooperative banks and central credit
cooperatives. These banks are organized as mutuals. Additional details about these different
types of institutions – particularly with respect to geographical reach and type of business
activities – are provided in Altunbas, Evans, and Molyneux (2001), and Puri et al. (2011).3
Each banking pillar has its own bankers associations. In addition to three umbrella
organizations in each pillar, there are a number of bankers associations at the state and regional
level. Together, they operate a tightly-knit framework of support schemes (Brunner et al. (2004);
Puri et al. (2011)). Across the three pillars, these support schemes not only offer deposit
insurance coverage that exceeds the statutory required coverage of € 20,000 per depositor per
bank, but – important for our paper – they also provide distressed institutions with capital support
to avoid disruptions of confidence in the system that would arise from closures.
3 The large private banks tend to operate national branch office networks, whereas smaller private banks operate in
local or regional markets. Savings banks operate in locally delimited areas. They are linked to Landesbanks in three ways. First, Landesbanks are partially owned by savings banks and, second, they provide wholesale services to savings banks. Third, Landesbanks offer services to the savings banks’ customers that the local savings banks are not able to provide, e.g., international banking and securities business. Cooperative banks also operate in local banking markets. The central credit cooperatives are owned by the local cooperative banks. The key task of the central cooperatives is similar to the role of Landesbanks for the savings banks.

-5-
B. Actions by the government and bankers associations: Regulatory interventions and capital
support
Supervision of banks in Germany is the joint responsibility of the Federal Financial
Supervisory Authority and the Deutsche Bundesbank. Based on financial statement data, audit
reports, and on-site examinations, the Bundesbank collects and processes information about
banks’ operations and their financial positions. When banks violate the principles of the Banking
Act,4
The actions by the Federal Financial Supervisory Authority depend on the severity of the
recorded violations. In case of minor violations, it may intensify supervision or issue warnings
and conduct hearings of the bank’s board of directors. If the violations are more serious, it may
take actions such as prohibiting the origination of new loans or dismissing senior executives.
Before such serious interventions into the bank’s business activities take place, the Federal
Financial Supervisory Authority typically gives the bank time to correct the deficiencies by
issuing a warning letter. Neither the serious nor the weaker interventions are publicly known, but
they are available in our dataset. Our empirical tests focus on the serious interventions by the
regulator because such intrusions into their business operations are more likely to significantly
affect banks’ risk taking and their ability to create liquidity than mere warning letters and/or
intensified supervision.
the Bundesbank forwards this information to the Federal Financial Supervisory Authority,
which is ultimately responsible for all disciplinary actions against banks.
5
The government and the bankers associations may also provide capital support to distressed
banks to prevent them from failing and to stabilize the financial system. The government did this
during the recent financial crisis. It set up a Financial Market Stabilization Fund (SoFFin) which
provided capital support mainly to large private banks and to the Landesbanks.
6 The bankers
associations provided capital support to their members over our entire sample period from 1999-
2009.7
4 The Banking Act is the statutory banking supervision guide for banks in Germany.
Our empirical analysis combines the capital support by the government and the bankers
associations. However, the results are not driven by this combination.
5 In unreported regressions, we confirm that risk taking and liquidity creation are not significantly affected when weak measures are administered by the Federal Financial Services Supervisory Agency.
6 SoFFin also provided guarantees and purchased securities via open market operations. 7 The insurance schemes of the bankers associations obtain information about bank soundness either indirectly
from the auditors or directly from the regulatory authorities. If a member institution is considered unsound, the support scheme often injects capital and informs the regulator. The member banks are obliged to disclose any

-6-
Capital restoration measures are publicly known, as they are reported in the banks’ financial
statements. Bankers associations are normally aware of regulatory interventions at an early stage,
and vice versa. There is no predetermined ordering with respect to the timing of when regulatory
interventions and capital support take place. Capital support may precede or follow regulatory
interventions, and either may occur without the other.
II. Hypothesis development
This section develops our risk-taking and liquidity-creation hypotheses.
A. Risk-taking hypotheses
Our first hypothesis focuses on the fact that the primary concern of regulators is to limit undue
risk taking. The reason is that regulatory authorities aim to avoid losses to the deposit insurer,
lower resolution costs, incentivize healthy banks to avoid becoming distressed, and reduce the
number of failures (e.g., James (1987); Dahl and Spivey (1995)). To achieve this, they are
equipped with the power to revoke the bank license in extreme cases, and the threat thereof can
trigger portfolio adjustments and affect future asset choices in banks (Mailath and Mester
(1994)). While banks may not face the immediate threat of closure, we argue that imposing
restrictions on certain activities likely limits a bank’s scope for undertaking such activities. We
therefore expect risk taking to decline after interventions. Risk taking may also decline due to
increased regulatory monitoring after an intervention. We formulate our first hypothesis as
follows:
H1. Regulatory Intervention Risk Reduction Hypothesis: Regulatory interventions are
associated with reductions in risk taking.
Capital support is generally given to enhance the survival odds of ailing institutions. Capital
support has two components: an injection of capital and increased post-injection monitoring of
the bank.
While it is expected that post-capital-injection monitoring of the bank by a regulator or a
bankers association would lead to lower risk, the theoretical literature is divided on whether
information to the bankers association that is necessary to allow for a transparent assessment of the bank’s financial position (see Dam and Koetter (2011)).

-7-
higher capital by itself reduces bank risk. One set of theories argues that higher bank capital goes
hand in hand with lower bank risk taking. Morrison and White (2005) focus on moral hazard.
The idea in their paper is that if banks do not have enough equity at stake, they may be tempted to
make excessively risky investments. Higher capital reduces such moral hazard incentives and
hence should lead to reduced risk taking. Other papers reach a similar conclusion, but by
focusing on the strengthened bank monitoring incentives that accompany higher bank capital
(Holmstrom and Tirole (1997), Allen, Carletti and Marquez (forthcoming), and Mehran and
Thakor (forthcoming)).
Other theories argue that higher bank capital may be accompanied by an increase in bank risk
taking. This may occur if banks react to the higher capital by shifting into riskier portfolios and
are not prevented from doing so by regulators (e.g., Koehn and Santomero (1980)). Calomiris
and Kahn (1991) also show that a capital structure with sufficiently high demand deposits (and
by implication lower equity) leads to more effective monitoring of bank managers by informed
depositors and hence a smaller likelihood of bad investment decisions. Thus, banks with higher
capital, and consequently a lower proportion of the portfolio financed by demandable deposits,
may operate with higher credit risk and insolvency risk.8
Thus, theoretically the combined effect of higher capital in the bank and greater post-capital-
injection monitoring of the bank could go either way, depending on whether the incentive effect
of higher capital on the bank dominates the effect of the loss of creditor discipline due to higher
capital. We summarize this as the following hypotheses, but note that we can only measure the
net effect:
H2a. Capital Support Risk Reduction Hypothesis: Capital support is associated with
reductions in risk taking.
H2b. Capital Support Risk Increase Hypothesis: Capital support is associated with
increases in risk taking.
B. Liquidity-creation hypotheses
While Germany, unlike the U.S., does not have a formal framework for prompt corrective
action that ties individual regulatory measures to thresholds in terms of bank capitalization, the
8 See Freixas and Rochet (2008) for an overview on the literature on the market discipline role of bank leverage.

-8-
measures taken against distressed institutions in Germany (see Section III C below) resemble
several of the actions taken by the authorities in the U.S.9
H3. Regulatory Discipline Hypothesis: Regulatory interventions are associated with
reductions in liquidity creation.
For instance, restrictions on asset
growth, deposit taking, dismissals of senior executives, and other instructions to restructure
business activities are observed in Germany as well as in the U.S. The types of interventions
follow the principle that serious manifestations of distress trigger more extensive sanctions by the
regulator (e.g., Dahl and Spivey (1995)); Aggarwal and Jacques (2001)). Since any one of those
active interventions into the banks’ operations are likely to impede the scope and scale of banks’
activities, we hypothesize that regulatory interventions have a negative effect on liquidity
creation:
On the issue of how bank capital affects liquidity creation, the theoretical literature provides
opposing predictions. We turn to these theories to extract hypotheses on how capital support is
expected to affect liquidity creation.
Some theories posit that bank capital may impede liquidity creation because it makes the
bank’s capital structure less fragile. A fragile capital structure encourages the bank to commit to
monitoring its borrowers, and hence allows it to extend loans. Additional equity capital makes it
harder for the less-fragile bank to commit to monitoring, which in turn hampers the bank’s ability
to create liquidity (e.g., Diamond and Rajan (2000, 2001)). We refer to these ideas as the
‘financial fragility’ theory.
Other theories focus on banks’ role as risk transformers. They argue that liquidity creation
exposes banks to risk (Allen and Santomero (1998); Allen and Gale (2004)), and that higher
capital improves banks’ ability to absorb risk (e.g., Bhattacharya and Thakor (1993); Repullo
(2004); von Thadden (2004); Coval and Thakor (2005)), so higher capital ratios may allow banks
to create more liquidity.10
The ‘financial fragility’ theory suggests that liquidity creation decreases after capital support,
while the ‘risk absorption’ theories predict increases in liquidity creation. Both effects may be at
We refer to these collectively as the ‘risk absorption’ theories.
9 Dahl and Spivey (1995) and Aggarwal and Jacques (2001) provide more detailed overviews of prompt corrective
action measures in the U.S. 10 Capital injections may also increase banks’ willingness to lend by reducing the debt overhang problem
(Bhattacharya and Nyborg, 2010).

-9-
play, which implies that our tests will pick up the net effect of capital support on liquidity
creation. Thus, we formulate the following two hypotheses:
H4a. Capital Support Financial Fragility Hypothesis: Capital support is associated with
reductions in liquidity creation.
H4b. Capital Support Risk Absorption Hypothesis: Capital support is associated with
increases in liquidity creation.
Note that all of our hypotheses in essence focus on the supply side of banking services. That
is, they focus on the responses of banks to regulatory interventions and capital support. We
acknowledge here that there may be some demand effects as well. Capital support is made
public through financial statements. To some extent, regulatory interventions may become
public knowledge as well.11
When customers become aware of the banks’ distress, they may
reduce their demand for loans and other banking services (for details see, e.g., Slovin, Sushka,
and Poloncheck (1993); Cornett and Tehranian (1994); Ongena, Smith, and Michalsen (2003);
Watanabe (2007)). This may cause bank risk taking and liquidity creation to decline. In this
paper, we cannot distinguish between demand and supply side effects because we do not have
information on loan applications or other indicators of demand.
III. Regression framework, data, and variables
This section first discusses our regression framework. It then describes the data. Finally, it
explains the key independent variables (regulatory interventions and capital support), the key
dependent variables (changes in risk taking and liquidity creation), and the control variables. All
financial variables are expressed in real € 2000 terms using the GDP deflator.
A. Regression framework
To test our hypotheses, we model changes in risk taking and liquidity creation as functions of
regulatory interventions, capital support, and a set of control variables. To ensure that our results
are not driven by small changes in risk taking and liquidity creation, we use ordered logit models 11 An example of a regulatory intervention eventually surfacing in the public domain is the unanticipated turnover
of an executive. Such information may affect customers’ choices about the banks from which to purchase their financial services.

-10-
which distinguish between substantial changes in bank behavior and relatively constant
behavior.12
The general formula for an ordered logit model with three categories expresses the probability
of observation
Specifically, in our risk-taking ordered logit models, the dependent variable takes on
the value of 1 if the bank experienced a drop in risk taking (relative to the previous year) of more
than 3% (DECR). It takes on the value 2 if risk taking remained constant within a narrow band of
+/- 3% (CONST), and it takes on the value 3 if risk taking increased by more than 3% (INCR). In
our liquidity-creation ordered logit models, we also use cutoffs of +/- 3%. In a robustness test,
we use alternative cutoffs (see Section IV C).
i of variable Y falling into category j in year t as:
, j = 1,2 (1)
and
(2)
where Xi,t-1 is the vector of independent variables for observation i in year t-1, the α’s are the
intercepts, and the β’s are the slope coefficients.
In our model, Yi,t is the change in risk taking or liquidity creation (see Section III D) which
falls in one of three categories (it decreases (DECR), stays relatively constant (CONST), or
increases (INCR)); Xi,t-1 is the vector of regulatory interventions and capital injections (see
Section III C), and control variables (see Section III E), all lagged by one period. Thus, in our
model, the equations are:
(3)
(4)
(5)
The β’s on regulatory interventions or capital support are the coefficients of primary interest.
In the tables, we will report odds ratios which are the exponentiated β’s, unless stated otherwise.
12 An ordinary least squares approach could be dominated by small changes.

-11-
In the risk-taking (liquidity-creation) regressions, an odds ratio of 1 (β is 0) for regulatory
interventions or capital support indicates that the probability of observing an increase or a
decrease in risk taking (liquidity creation) following the action is equally likely. If the odds ratio
is above 1 (β is positive), this implies that the intervention or support results in a higher
probability of an increase in risk taking (liquidity creation). Similarly, if the odds ratio is below 1
(β is negative), this implies that the intervention or support results in a lower probability of an
increase in risk taking (liquidity creation) (see Section IV).13
B. Data
We obtain annual data for all the banks that operate in Germany between 1999 and 2009 from
the Bundesbank. We exclude banks if they have i) no loans outstanding, ii) zero deposits, iii)
unused commitments that exceed 4 times total assets, iv) balance sheet items with negative
values, or v) total assets below € 25 million. Our dataset has 17,662 bank-year observations for
2,735 banks, of which 234 are private banks, 591 belong to the public banking sector, and 1,910
institutions are in the cooperative pillar. In most analyses, we include banking pillar dummies.
In some analyses, we instead split the sample into large versus small banks (above and below
median assets).
During the sample period, the banking sector experienced a consolidation wave.
Consequently, we identify merged institutions, and create a new institution after the merger to
avoid spikes in risk taking and liquidity creation that are attributable to the merger.14
13 Note that the ordered logit model makes a ‘parallel odds’ assumption that the slope coefficients β are constant. In
the context of our study, this means that interventions and support are assumed to have equiproportionate effects on the probabilities of either increases or decreases in risk taking and liquidity creation. For example, if the effect of regulatory interventions is twice the effect of capital support in reducing risk taking (relative to an increase or constant risk taking), then it will also have twice the effect in reducing or constant risk taking (relative to an increase). Wald tests (not reported) show that that the ‘parallel odds’ assumption cannot be statistically rejected, implying that our use of ordered logit models is valid.
This causes
14 We consider several possible ways to treat mergers: (1) excluding merged banks, (2) merging banks ‘backwards’ into one institution over the entire time period, and (3) creating a new institution after the merger. The first option leads to loss of information as a number of mergers took place during the sample period. Furthermore, a bias would be created as a large fraction of the mergers are classified as ‘distressed mergers,’ i.e., dropping these banks would also mean dropping some of the most troubled institutions. The second option would be based upon the assumption that banks do not change their behavior after consolidation, i.e., they behave as one entity prior to the merger and do not change their behavior following the merger. We choose the third option, and create a new institution after two banks merge. For a detailed description of possible merger treatment procedures, see Merkl and Stolz (2006).

-12-
the number of banks in our sample to increase as we have three independently-treated banks: the
two pre-merger banks and the post-merger bank.15
C. Key independent variables: Regulatory interventions and capital support
We use a dummy variable Regulatory interventions to capture serious disciplinary actions by
the regulator against banks. The variable takes on the value one if one or more of the following
measures was imposed in that year:
(1) Hearings about and actual dismissal of executives16
(2) Fines for the institution or its executives
(3) Instructions to the bank’s management
(4) Appointment of trustee
(5) Restrictions and prohibitions of profit distribution
(6) Restrictions and prohibitions of deposit taking
(7) Restrictions and prohibitions of lending activities
(8) Restructuring of business activities
(9) Threat of measures according to the Bank Act17
We have information on the size of capital injections, and construct a variable Capital Support
measured as capital injection/Tier 1 capital. We scale by Tier 1 capital to measure the relative
importance of the support to the bank. We use Tier 1 capital rather than total regulatory capital in
the denominator as the latter includes subordinated debt, loan loss reserves, and other less
relevant components.
Table I contains summary statistics on regulatory interventions and capital support for the full
sample and for the sample broken down by bank type (private/public sector/cooperative banks)
and bank size (large/small banks). In addition, the table also shows a breakdown of banks that
only recorded regulatory interventions, only received capital support, and received both.
15 As we show below in Section IV C, results are similar for merged and non-merged banks. 16 We include measures against senior executives because these individuals determine the key funding and
investment decisions of a bank, which have important effects on both risk taking and liquidity creation. The corporate finance literature argues that changing the figurehead is frequently associated with changes in corporate policies (e.g., Weisbach (1988)). Re-running our regressions based on a regulatory intervention dummy that excludes the dismissals of senior executives does not materially change our inferences.
17 This includes threats to impose any of the above measures and a grave letter, i.e., a letter threatening to put the bank out of business.

-13-
In total, we record 452 regulatory interventions. Regulatory authorities intervened in 17% of
all banks. Most of these interventions were in cooperative banks (22%). The dataset contains
371 cases of capital support, 14% of all banks received capital support. Most of this support is
observed in cooperative banks (17%). The average support is 18% of Tier 1 capital. In the
sample, 71 banks were subject to both regulatory interventions and capital support. All our
regressions include both regulatory intervention and capital support variables, which enables us
to obtain the independent effects of these actions on risk taking and liquidity creation through
their respective regression coefficients.
[Table I Summary statistics for regulatory interventions and capital support]
Table II shows a breakdown of the timing and types of regulatory interventions. As shown in
the first row of the table, most of the regulatory interventions occur following capital support
measures. The remainder of the table breaks down the regulatory interventions first into less
strong versus more strong interventions, and then into whether the inventions occurred on the
asset side, liability side, or other interventions. As shown, most of the interventions were of the
less strong type, such as hearings, fines, warnings, and threats, and fewer were of the more strong
type, such as dismissals and activity restrictions. The table also shows that relatively few of the
interventions were directly aimed at restricting or prohibiting deposit taking, lending – most were
more general hearings, fines, warnings, threats, and dismissals. This is important for our
liquidity creation analyses because it shows that in virtually all cases, the interventions do not
directly require the bank to reduce liquidity creation.
[Table II Timing and types of regulatory interventions]
D. Dependent variables: Changes in risk taking and liquidity creation
The dependent variables are the changes in risk taking and liquidity creation. For ease of
exposition, however, we discuss these variables below in levels.
Our measure of risk is the Basel I risk-weighted assets divided by total assets (RWA / TA),
which has been used in prior research (see, e.g., Logan (2001), Berger and Bouwman (2011)).
This measure covers credit risk both on and off the balance sheet. We record a drop in risk (Y =
DECR) if RWA / TA decreases by more than 3%, an increase in risk (Y = INCR) if RWA / TA
increases by more than 3%, and constant risk (Y = CONST) otherwise.

-14-
Our liquidity creation measure takes into account all on- and off-balance sheet activities. We
calculate the amount of liquidity created by each bank using a slight variation on Berger and
Bouwman’s (2009) preferred measure and convert it into real € 2000 terms. The reasons for the
change and the three-step procedure used to construct this measure are explained in detail in the
Appendix. We record a drop in liquidity creation (Y = DECR) if liquidity creation decreases by
more than 3%, an increase in liquidity creation (Y = INCR) if liquidity creation increases by more
than 3%, and constant liquidity creation (Y = CONST) otherwise.18
E. Control variables
All of the control variables (except for dummy variables) are measured in changes. For ease
of exposition, we discuss these variables below in levels. We also indicate how we expect them
to correlate with risk taking and liquidity creation.
Total assets (natural log) is included to account for bank size. We expect size to be positively
correlated with risk taking because large banks have a greater capacity to absorb risk, and
because in some cases, the largest institutions may be considered to be too-important-to-fail.
Size is also expected to be positively correlated with liquidity creation (see Berger and Bouwman
(2009)). Return on equity controls for profitability. Profitable banks may be less keen to take on
risks (Laeven and Levine (2009)). The effect of profitability on liquidity creation is not clear ex
ante. We control for loan portfolio concentration using a Herfindahl-Hirschman index of
lending activities across eight industry sectors.19
18 Scaling our liquidity creation measure by total assets does not qualitatively alter our inferences. However, we
believe that focusing on changes in the total amount of liquidity created by each bank like we do is more appropriate than focusing on changes in the amount of liquidity created per dollar of assets.
While banks with more concentrated loan
portfolios are riskier (all else equal), they may choose assets with higher or lower risk weights.
The expected effect of loan portfolio concentration on liquidity creation is also ambiguous. The
number of Bank branches is included because more branches offer more opportunities to make
loans as well as potentially better monitoring of these loans. The effect on risk taking is
ambiguous because of the greater lending but potentially lower risk per loan. More branches
offer more business opportunities for providing loans and deposits to customers and may
therefore result in greater liquidity creation. To account for the economic environment, we
include the Interest rate spread, measured as the difference between 10-year and 1-year
government bonds. When the interest rate spread is wide, banks have an incentive to provide
19 The eight industry sectors are i) agriculture, forestry and fishing; ii) utilities and mining; iii) construction; iv) manufacturing; v) trade; vi) transportation; vii) financial services; and viii) other services.

-15-
more loans, which may lead to increased risk taking and higher liquidity creation. Finally, we
also include the dummy variables Public bank and Cooperative bank that provide information on
bank types. We omit the dummy for Private banks to avoid perfect collinearity.
Table III contains summary statistics for the dependent variables and the control variables.
While the regressions are run in changes, we report levels and changes for all the variables.
Panel A presents the statistics for the full sample, and Panels B and C show a detailed breakdown
for the banks that experienced regulatory interventions and received capital support, respectively.
[Table III Summary statistics for dependent variables and control variables]
IV. How do risk taking and liquidity creation respond to regulatory interventions and capital support?
This section tests our hypotheses on how regulatory interventions and capital support affect
bank risk taking and liquidity creation. We first present the main results. We then show the
results for subsamples by banking pillar, size, capitalization, and subperiods. Following that, we
show results where the regulatory interventions are decomposed into several categories. Next,
we perform robustness checks in which we use alternative cutoffs, run regressions for subsamples
of merged and non-merged banks, use alternative measures of risk taking and liquidity creation,
and employ ordered probit (instead of ordered logit) models. Finally, we discuss the robustness
of our inferences to using instrumental variable regressions.
A. Main results: The effects of regulatory interventions and capital support on bank risk taking and liquidity creation
Table III shows the main results. Panels A and B use changes in risk (ΔRWA / TA) and
changes in liquidity creation (Δ LC) as the dependent variables, respectively.
Panel A shows that regulatory interventions are associated with decreases in risk, consistent
with the Regulatory Intervention Risk Reduction Hypothesis (H1). The odds ratio of 0.7819 is
statistically significantly different from one. It implies that an intervention is associated with a
21.81% increase in the likelihood of a drop in risk, which is also economically significant.20
20 The percentage change in odds per one-unit change is (eβ – 1) * 100, where eβ is the odds ratio and β is the
regression coefficient.
The
odds ratio on capital support, 0.9818, is also statistically significant. However, it is not

-16-
economically significant. It implies that a mean capital support of 18% of Tier 1 capital (see
Table I Panel A) is associated with only a 0.33% increase in the likelihood of a drop in risk.21
[Table III Main regression results]
This finding suggests that the effects of the Capital Support Risk Reduction Hypothesis (H2a)
and the Capital Support Risk Increase Hypothesis (H2b) are either weak or approximately offset
each other, and that capital support is not associated with a substantial change in risk taking, at
least not in the short run.
Panel B reveals that regulatory interventions are associated with decreases in liquidity
creation, consistent with the Regulatory Discipline Hypothesis (H3). The odds ratio of 0.6398 is
statistically significantly different from one and suggests that an intervention is associated with a
36.02% increase in the likelihood of a drop in liquidity creation. This finding is also
economically significant, suggesting that sanctions by the regulator have non-negligible effects
on the scope and scale of bank activities. The odds ratio on capital support, 0.9839, is again
statistically significant, but not economically insignificant. A mean capital support of 18% is
associated with only a 0.29% increase in the likelihood of a drop in liquidity creation. This
suggests that the effects of the Capital Support Financial Fragility Hypothesis (H4a) and the
Capital Support Risk Absorption Hypothesis (H4b) are weak or approximately net each other out,
and that capital support is not associated with a major change in liquidity creation in the short
run.
The control variables in Panels A and B generally have the expected effects and tend to be
statistically significant. Increases in bank size, the number of bank branches, and the interest rate
spread are associated with increases in risk taking and liquidity creation. Increases in
profitability are associated with a small reduction in risk, and have no effect on liquidity creation.
Changes in loan portfolio concentration do not have a significant effect on risk or liquidity
creation. Finally, public and cooperative banks are relatively more likely to experience increases
in risk taking and liquidity creation than private banks.
B. Results for subsamples by banking pillar, size, capitalization, and subperiods
21 The percentage change in odds per mean capital support is (eβ * mean capital support – 1) * 100, where eβ is the odds
ratio and β is the regression coefficient.

-17-
In this subsection, we examine whether the main results hold for subsamples by banking pillar,
size, capitalization, and crisis versus non-crisis subperiods. Table IV contains the results. For
brevity, we only report the odds ratios on the main variables of interest, regulatory interventions
and capital support. All regressions, however, include the full set of control variables.
[Table IV Regression results for banks split by banking pillar, size, capitalization, and
subperiods]
First, since our discussion above revealed various differences among banks in the three
banking pillars, we investigate whether the main results hold for all three types. As shown in
Panel I-A, the effect of regulatory interventions on risk taking are only statistically and
economically significant for cooperative banks. For these banks, the odds ratio of 0.7470 implies
that an intervention is associated with a 25.30% increase in the likelihood of a drop in risk. This
finding is not surprising, given that the vast majority of regulatory interventions took place in
cooperative banks. The odds ratios on capital support are close to one for all three pillars,
showing a lack of economic significance, as in the full sample. Turning to the liquidity creation
results in Panel I-B, regulatory interventions are found to be statistically and economically
significant in reducing liquidity creation in both the public and cooperative banking pillars.
Since public and cooperative banks are on average also smaller than private banks, have less
flexible business models in terms of scope and scale of activities, and tend to operate in
geographically delimited areas, they may find it harder to adapt to regulatory sanctions than their
more flexible counterparts from the private banking sector. The effects of capital support are
again economically insignificant across the three subsamples.
Next, recognizing that banks of different size classes have different balance sheet
compositions (Berger, Miller, Petersen, Rajan, and Stein (2005)), we examine whether regulatory
interventions and capital support have different effects for banks of different size classes. We
split our sample into small and large banks using the median bank size (€ 329 million) as the
cutoff. We find in Panel II-A that the effects of regulatory interventions on risk taking appear to
occur primarily in small banks, possibly because large banks may have more countervailing
power relative to regulators and in some cases may be too-important-to-fail. The effects of
regulatory interventions on liquidity creation in Panel II-B are statistically and economically
significant for both size classes. While there is no statistically significant effect of capital support

-18-
on liquidity creation for small banks, we again uncover a significant but no economically
significant effect of capital support for large banks.
One may expect that regulatory interventions and capital support have stronger effects on risk
taking and liquidity creation when banks are poorly capitalized (e.g., Dahl and Spivey (1995);
Aggarwal and Jacques (2001)). To examine this idea, we split the sample into poorly- and better-
capitalized banks. As cutoffs, we use the median bank’s equity capital ratio (8.73%). Panels III-
A and III-B show the results. As expected, the effects of regulatory interventions on bank risk
taking and liquidity creation are stronger for the poorly-capitalized institutions. Capital support
again results in statistically but not economically significant changes in risk taking and liquidity
creation.
Financial crises raise the question of how effectively banks can be disciplined in episodes of
extraordinary distress and what the impact is of capital support during such times (Berrospide and
Edge (2010); Giannetti and Simonov (2010)). From a policy perspective, it is therefore important
to ascertain whether the effects of regulatory interventions and capital support differ for crisis and
non-crisis periods. We classify the years 2001 and 2007-2009 in our sample as crisis years, and
the remaining years 1999-2000 and 2002-2006 as non-crisis years. The year 2001 is considered a
crisis year because the terrorist attacks on September 11 in the U.S. and the bursting of the
dot.com bubble both depressed financial markets.22
In Panels IV-A and IV-B, we find that risk taking only responds to regulatory interventions
during non-crisis years. This result may be attributable to the too-many-to-fail phenomenon
which predicts that closure of a bank by the regulator is rendered unlikely when the number of
distressed banks is large, because the closure option is unattractive for the regulator and bailouts
The subprime lending crisis that emerged in
2007 gave rise to major difficulties in financial markets with interbank markets seizing up due to
banks’ reluctance to roll over debt, reflecting concerns about the soundness of other banks and
their exposure to structured products containing subprime mortgages. During that period,
numerous banks such as Industriekreditbank, Bayerische Landesbank, and SachsenLB in
Germany and Countrywide and Bear Stearns in the U.S. had to be bailed out or collapsed (e.g.,
Berger and Bouwman (2010)).
22 The high growth segment of the German stock market collapsed. As a result, the Deutsche Börse (the German
stock market operator) stopped providing information about high growth stocks on neuermarkt.com at the end of 2001, and subsequently abolished the entire market segment. Classifying 2001 as a non-crisis year yields similar results (not shown for brevity).

-19-
are the preferred option (Acharya and Yorulmazer (2008); Brown and Dinc (forthcoming)).
Expecting a bailout, banks may not adjust their risk taking. This problem may be amplified by
the observation that during crisis periods, ailing banks evergreen their loans to avoid further
write-downs (Peek and Rosengren (2005)). In contrast, liquidity creation reacts statistically and
economically significantly to regulatory interventions during both subperiods. The effects of
capital support measures remain economically insignificant during both subperiods.
To summarize the findings for the subsamples in Table IV, regulatory interventions result in
reduced risk taking in only some of the subsamples – cooperative banks, small banks, poorly-
capitalized banks, and banks during non-crisis years. However, these interventions tend to
reduce liquidity creation for almost all subsamples (private banks being the lone exception). For
most of the subsamples (as for the full sample), capital support generally has a statistically but
not economically significant effect on risk taking and liquidity creation.
C. Decomposition of regulatory interventions
Table VI shows regression results when we subdivide the regulatory interventions into less
strong versus more strong interventions in Panel I and then into whether the inventions occurred
on the asset side, liability side, or affected management in Panel II. Recall that the definitions
and summary statistics of these different types of interventions are shown in Table II. Again, we
only report the odds ratios on the main variables of interest, but include the full set of control
variables.
As shown in Panel I, both less strong and more strong interventions result in reduced risk
taking and liquidity creation, although the effect of less strong interventions on risk taking is not
statistically significant. Capital support remains statistically but not economically significant. In
Panel II, only the asset-side interventions are statistically significant in reducing risk taking, but
all types of interventions appear to reduce liquidity creation. The effects of capital support are
similar to those reported in Panel I.
[Table VI Decomposition of regulatory interventions]
D. Robustness tests
In this subsection, we perform several additional robustness checks. First, we use alternative
cutoffs for the dependent variables to check whether our results are sensitive to our choice of 3%

-20-
cutoffs. Second, we perform tests for subsamples that only contain merged and non-merged
banks, respectively. Third, we use alternative measures of risk taking and liquidity creation.
Finally, we reestimate all our risk taking and liquidity creation regressions using probit analysis
to verify our results are insensitive to the choice of modeling technique.
Table VII contains most of the results. As before, we only report the odds ratios on the main
variables of interest, regulatory interventions and capital support, for brevity. All regressions do,
however, include the vector of control variables discussed above.
[Table VII Robustness]
Our first check examines whether our results are sensitive to the choice of 3% cutoffs. We
show robustness tests with alternative cutoffs for the two dependent variables using 1% and 5%
changes. We find that for both alternative cutoffs, regulatory interventions reduce risk taking and
liquidity creation (statistically and economically significant), and that capital support has
economically insignificant effects on both risk taking and liquidity creation (see Panels A I and B
I). Thus, our main regression results are robust to these alternative cutoffs.
Our second check reestimates our regressions for subsamples of merged and non-merged
banks, respectively. As shown in Panels A II and B II, our findings remain qualitatively
unchanged, although the significance declines for regulatory interventions from 1% in the main
regressions to the 10% level.
Our third check examines whether our results are robust to using alternative measures of risk
taking and liquidity creation. Consider risk taking first. Panel A III shows the results using an
alternative measure of risk taking – the Tier 1 equity capital to risk-weighted assets ratio (Tier 1 /
RWA). This is an inverse risk measure in that higher values imply less risk. This variable
captures the extent to which the regulatory interventions and capital support affect the banks’
regulatory capital ratios. To avoid confusion, we record a 1 if the ratio increased by more than
3% (i.e., risk dropped) and a 3 if the ratio decreased by more than 3% (i.e., risk went up). As
shown, our results are robust to using this alternative risk measure. Regulatory interventions
have a statistically and economically significant effect in lowering risk taking (i.e., in increasing
Tier 1 / RWA), and capital support has a statistically, but not economically significant effect –
both findings are consistent with our main results.

-21-
Consider liquidity creation next. A change in liquidity creation may be due to a change in
assets, a change in liabilities, a change in off-balance sheet activities, or some combination of
these. We decompose our aggregate liquidity creation measure into three components – assets,
liabilities, and off-balance sheet activities – to determine which are most affected by regulatory
interventions and capital support. Panel B III shows that regulatory interventions and capital
support reduce asset-based and off-balance sheet-based liquidity creation, but have no
measurable effect on liability-based liquidity creation. These effects are also economically
significant for regulatory interventions but not for capital support.
Finally, we reestimate all regressions reported in the previous tables using ordered probit
models, and obtain qualitatively similar results (not reported). This suggests that our results are
not driven by the modeling technique chosen. We prefer to present our main results using
ordered logit models because the odds ratio has a natural interpretation.
E. Instrumental variable regressions
Our results so far show statistically and economically significant associations between
regulatory interventions and reductions in risk taking and liquidity creation, but the effect of
capital support on these bank behaviors is only statistically significant. However, there is a
potential endogeneity concern. Specifically, bank distress may result in both regulatory
interventions and capital support on the one hand, and reductions in risk taking and liquidity
creation on the other hand. To address this potential endogeneity concern in our main analysis,
we used lagged interventions and capital support. Recognizing that this may not be sufficient, we
now turn to an instrumental variable (IV) approach.
Since we are not aware of an IV approach using ordered logit models, we instead use IV
ordered probit estimators.23
Below, we first discuss the instruments and then explain the first- and second-stage
regressions. We use several instruments for our two potentially endogenous variables, regulatory
We estimate two systems of equations: one system for the effects of
regulatory interventions and capital support on risk taking, and a separate system for the effects
of these actions on liquidity creation. We estimate systems of equations to take into account the
correlations between the error terms of the first- and second-stage equations.
23 Since all results presented above hold using ordered logit and ordered probit models (see the last robustness
check in Section III C), the use of IV ordered probit should not materially affect our results.

-22-
interventions and capital support. Some of the instruments are used in both first-stage
regressions while others are only used in the capital support equation. We first describe the
instruments that are used in both.
Our first instrument exploits variation in the share of Capital support at the county level. This
instrument measures capital support in small geographical areas, and captures information about
the soundness of regionally-delimited banking markets. Building on the too-many-to-fail effect
identified by Acharya and Yorulmazer (2008), we argue that distressed banks are more likely to
receive an intervention or be bailed out if other local banks are weak. Thus, regulatory
interventions and capital support may be more likely to take place if capital support in that
market is prevalent.
In addition, we use the levels of bank risk, captured by the Capital adequacy ratio (Tier 1
capital / RWA), Loan loss provisions/Customer loans, and Risk (RWA/TA). Regulatory
interventions and capital support take place when bank risk taking is deemed too high.
Consequently, the two types of actions are directly related to risk levels. Note, however, that risk
levels and our dependent variables that capture changes in risk taking are not directly related.
We now describe the additional instruments that are only used in the capital support first-stage
regression.
Since recent research offers suggestive evidence for a politicization of the bank resolution
process (Brown and Dinc (2005); Imai (2009)), we exploit variation in local voter behavior to
shed light on whether the composition of the local political landscape affects the way bankers
associations deal with distressed institutions in their geographic area.24
24 A growing body of literature examines the politicization of the bank resolution process. Brown and Dinc (2005)
report evidence that distressed banks are less likely to be bailed out or have their charter revoked prior to elections than after elections in emerging market economies. They conclude that bank resolutions are affected by political considerations. Imai (2009) shows that bank regulators exhibit a propensity of delaying declarations of insolvency in regions that support senior politicians of the ruling party in Japan.
Specifically, we include
the Shares of conservative, liberal, and green party voters per county (shares of the social
democratic party are excluded to avoid collinearity) as instruments for capital support. We
expect a reduced propensity to observe capital support in banks that are located in counties with

-23-
more conservative, liberal, and green party voters, reflecting their stronger belief in market
forces.25
Finally, we include Bankers Association Dummies for membership in regional bankers
associations. In total, 32 such dummy variables enter our equation. In doing so, we account for
potential differences in the propensities and willingness of these individual associations to
provide capital support (Dam and Koetter (2011)).
Our instruments satisfy the criteria of relevance and exogeneity. We argue they are all
relevant because they affect the two potentially endogenous variables, but there are no reasons to
believe that capital support at the county level, special audits, the levels of risk, voters’ shares, or
bankers association membership directly affect changes in bank risk taking or liquidity creation.
As mentioned above, we estimate two systems of equations. For ease of exposition, we use
the terms “first-stage” and “second-stage” regressions in our discussion below, but emphasize
that both are jointly estimated.
We run two first-stage regressions: a probit regression in which the probability of a regulatory
intervention is regressed on capital support at the county level, the special audit dummy, the risk
measures, and all of the control variables from our main analysis; and an OLS regression in
which capital support (Capital injection / Tier 1 capital) is regressed on the instruments and
control variables included in the regulatory intervention regression, plus the shares of
conservative / liberal / green voters, and bankers association dummies.
In the second stage, we run ordered probit regressions of the change in risk and liquidity
creation on the predicted values of the two potentially endogenous variables – regulatory
interventions and capital support – and all the control variables.
Table VIII presents the instrumental variable regression results. We report coefficients
because exponentiated probit coefficients cannot be interpreted as odds ratios as in logit models.
The results show that most of the instruments have the predicted effect on regulatory
interventions and capital support, although some of them are not significant. F-tests indicate the
joint significance of our dummies for the bankers associations. Importantly, we find that –
25 In stark contrast to the U.S., where liberals and conservatives are opposite extremes, in Germany both liberals
and conservatives strongly believe in market forces.
-24-
consistent with the results above – regulatory interventions and capital support are statistically
significant in reducing risk taking and liquidity creation.
[Table VIII Instrumental variable regressions]
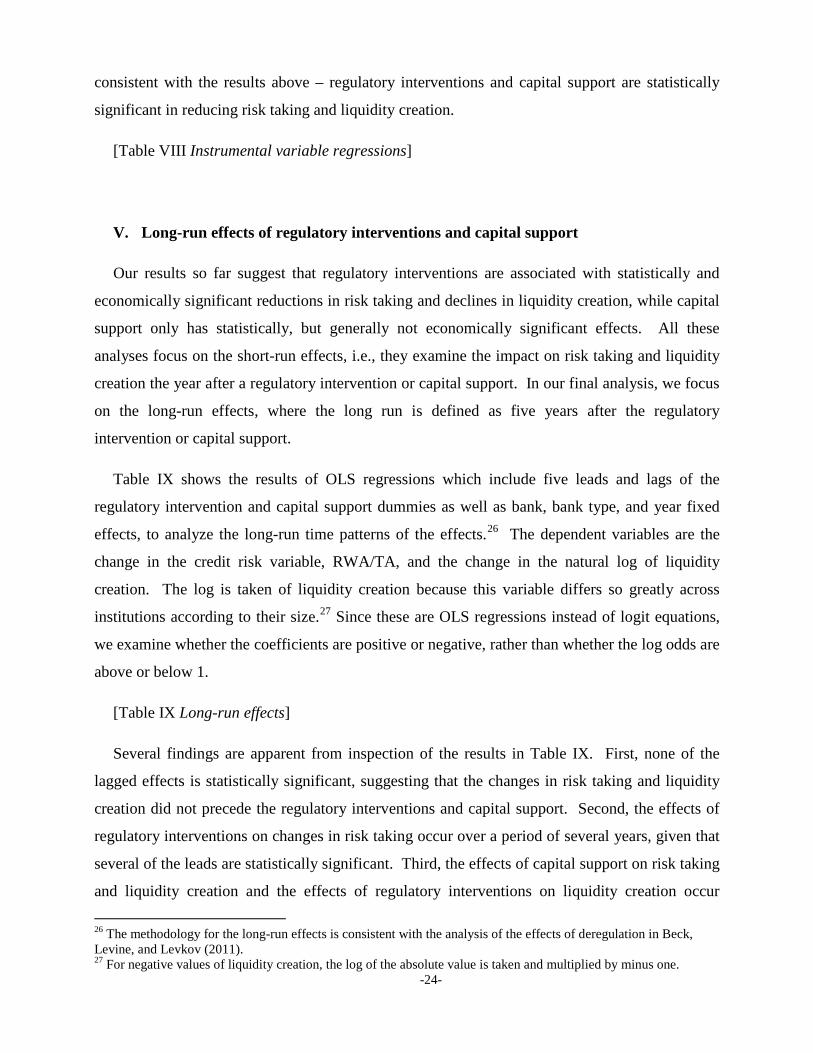
V. Long-run effects of regulatory interventions and capital support
Our results so far suggest that regulatory interventions are associated with statistically and
economically significant reductions in risk taking and declines in liquidity creation, while capital
support only has statistically, but generally not economically significant effects. All these
analyses focus on the short-run effects, i.e., they examine the impact on risk taking and liquidity
creation the year after a regulatory intervention or capital support. In our final analysis, we focus
on the long-run effects, where the long run is defined as five years after the regulatory
intervention or capital support.
Table IX shows the results of OLS regressions which include five leads and lags of the
regulatory intervention and capital support dummies as well as bank, bank type, and year fixed
effects, to analyze the long-run time patterns of the effects.26 The dependent variables are the
change in the credit risk variable, RWA/TA, and the change in the natural log of liquidity
creation. The log is taken of liquidity creation because this variable differs so greatly across
institutions according to their size.27
[Table IX Long-run effects]
Since these are OLS regressions instead of logit equations,
we examine whether the coefficients are positive or negative, rather than whether the log odds are
above or below 1.
Several findings are apparent from inspection of the results in Table IX. First, none of the
lagged effects is statistically significant, suggesting that the changes in risk taking and liquidity
creation did not precede the regulatory interventions and capital support. Second, the effects of
regulatory interventions on changes in risk taking occur over a period of several years, given that
several of the leads are statistically significant. Third, the effects of capital support on risk taking
and liquidity creation and the effects of regulatory interventions on liquidity creation occur 26 The methodology for the long-run effects is consistent with the analysis of the effects of deregulation in Beck, Levine, and Levkov (2011). 27 For negative values of liquidity creation, the log of the absolute value is taken and multiplied by minus one.

-25-
primarily in the short term and remain in place in the long run, given that the one-year lead and
none of the following coefficients are significant.
VI. Concluding remarks
In this paper, we formulate hypotheses regarding the effects of regulatory interventions and
capital support on bank risk taking and liquidity creation, and test these using a unique dataset.
Since the reduction of bank risk taking is a primary goal of these actions, and the creation of
liquidity by banks is essential for the macroeconomy, these issues are of first-order importance
for academics, bank regulators, and policymakers.
We find that regulatory interventions are generally associated with statistically and
economically significant reductions in both risk taking and liquidity creation in the short run. We
also find that capital support is associated with statistically significant reductions in both risk
taking and liquidity creation in the short run, although neither effect is economically significant.
A long-run analysis suggests that most of the changes in risk taking and liquidity creation occur
in the short term and remain in place in the long run.
In terms of policy implications, the results suggest that regulatory interventions and capital
support have intended and unintended consequences. Policy makers should be aware that while
these policies may be effective in reducing bank risk taking, they may also have adverse effects
on the macroeconomy through reductions in bank liquidity creation.
We conclude by pointing out that our research naturally gives rise to several critically
important questions that are beyond the scope of our study. At which point in time should
regulators intervene in ailing institutions? What is the optimal level of bank liquidity creation?
Do capital support measures distort the competitive landscape in banking? We leave these
questions to future research.

-26-
References
Acharya, V., S. Bharath, and A. Srinivasan, 2007, Does industry-wide distress affect defaulted firms? Evidence from creditor recoveries, Journal of Financial Economics 85: 787–821.
Acharya, V., H. S. Shin, and T. Yorulmazer, 2009, Crisis resolution and bank liquidity, Working paper.
Acharya, V., and T. Yorulmazer, 2008, Cash-in-the-market pricing and optimal resolution of bank failures, Review of Financial Studies 21: 2705–2742.
Aggarwal, R., and K. T. Jacques, 2001, The impact of FDICIA and prompt corrective action on bank capital and risk: Estimates using a simultaneous equations model, Journal of Banking and Finance 25: 1139–1160.
Allen, F., E. Carletti, and R. Marquez, forthcoming, Credit market competition and capital regulation, Review of Financial Studies.
Allen, F., and D. Gale, 2004, Financial intermediaries and markets, Econometrica 72: 1023–1061.
Allen, F., and A. M. Santomero, 1998, The theory of financial intermediation, Journal of Banking and Finance 21: 1461–1485.
Altunbas, Y., L. Evans, and P. Molyneux, 2001, Bank ownership and efficiency, Journal of Money, Credit, and Banking 33: 926–954.
Bank of England, 2008, Financial Stability Report October 2008, Issue No. 24, London: Bank of England.
Barth, J. R., G. Caprio Jr., and R. Levine, 2004, Bank regulation and supervision: what works best?, Journal of Financial Intermediation 13: 205-248.
Beck, Thorsten, Ross Levine, and Alexey Levkov, 2011, Big bad banks? The winners and losers from bank deregulation in the United States, Working paper.
Berger, A. N., and C. H. S. Bouwman, 2009, Bank liquidity creation, Review of Financial Studies 22: 3779–3837.
Berger, A. N., and C. H. S. Bouwman, 2010, Bank liquidity creation, monetary policy, and financial crises, Working paper.
Berger, A. N., and C. H. S. Bouwman, 2011, How does capital affect bank performance during financial crises? Working paper.
Berger, A. N., N. H. Miller, M. A. Petersen, R. G. Rajan, and J. C. Stein, 2005, Does function follow organizational form? Evidence from the lending practices of large and small banks, Journal of Financial Economics 76: 237–269.
Bernanke, B. S., 1983, Nonmonetary effects of the financial crisis in propagation of the Great Depression, American Economic Review 73: 257–276.
Berrospide, J. M., and R. M. Edge, 2010, The effects of bank capital on lending: What do we know, and what does it mean? International Journal of Central Banking : 5-54.
Bhattacharya, S., A. W. A. Boot, and A. V. Thakor, 1998, The economics of bank regulation, Journal of Money, Credit and Banking 30: 745-770.
Bhattacharya, S., and K. G. Nyborg, 2010, Bank bailout menus, Working paper.

-27-
Bhattacharya, S., and A. V. Thakor, 1993, Contemporary banking theory, Journal of Financial Intermediation 3: 2–50.
Boot, A. W. A., S. Greenbaum, and A. V. Thakor, 1993, Reputation and discretion in financial contracting, American Economic Review 83: 1165-1183.
Boot, A. W. A., and A. V. Thakor, 1993, Self-interested bank regulation, American Economic Review 83: 206-212.
Boyd, J., and E. E. Prescott, 1986, Financial intermediary-coalitions, Journal of Economic Theory 38: 211–232.
Brown, C. O., and S. Dinc, forthcoming, Too many to fail? Evidence of regulatory forbearance when the banking sector is weak, Review of Financial Studies.
Brown, C. O., and S. Dinc, 2005, The politics of bank failures: Evidence from emerging markets, Quarterly Journal of Economics 120: 1413–1444.
Brunner, A., J. Decressin, D. Hardy, and B. Kudela, 2004, Germany’s three-pillar banking system – cross-country perspectives in Europe, Working paper International Monetary Fund, Washington DC, Occasional Paper No. 233.
Bryant, J., 1980, A model of reserves, bank runs, and deposit insurance, Journal of Banking and Finance 4: 335–344.
Calomiris, C. W., and C. M. Kahn, 1991, The role of demandable debt in structuring optimal banking arrangements, American Economic Review 81: 497–513.
Chava, S., and A. Purnanandam, 2011, The effect of banking crisis on bank-dependent borrowers, Journal of Financial Economics 99, 116-135.
Coval, J. D., and A. V. Thakor, 2005, Financial intermediation as a beliefs-bridge between optimists and pessimists, Journal of Financial Economics 75: 535–569.
Cornett, M., and H. Tehranian, 1994, An examination of voluntary versus involuntary security issuances by commercial banks: The impact of capital regulations on common stock returns, Journal of Financial Economics 35: 99- 122.
Dahl, D., and M. F. Spivey, 1995, Prompt corrective action and bank efforts to recover from undercapitalization, Journal of Banking and Finance 19: 225-243
Dam, L., and M. Koetter, 2011, Bank bailouts, interventions, and moral hazard. Unpublished manuscript. University of Groningen
Dell’Ariccia, G., E. Detragiache, and R. Rajan, 2008, The real effects of banking crises, Journal of Financial Intermediation 17: 89–112.
Demirgüç-Kunt, A., E. Detragiache, and T. Tressel, 2008, Banking on the principles: Compliance with Basel Core Principles and bank soundness , Journal of Financial Intermediation 17: 511-542.
Diamond, D. W., 1984, Financial intermediation and delegated monitoring, Review of Economic Studies 51: 393–414.
Diamond, D. W. and P. H. Dybvig, 1983, Bank runs, deposit insurance, and liquidity, Journal of Political Economy 91: 401–419.
Diamond, D. W., and R. G. Rajan, 2000, A theory of bank capital, Journal of Finance 55: 2431–2465.
-28-
Diamond, D. W., and R. G. Rajan, 2001, Liquidity risk, liquidity creation, and financial fragility: A theory of Banking, Journal of Political Economy 109: 287–327.
Freixas, X., and J.-C. Rochet, 2008, Microeconomics of banking, 2nd edition, MIT Press.
Giannetti, M., and A. Simonov, 2010, On the real effects of bank bailouts: Micro-evidence from Japan, Unpublished manuscript.
Gibson, M. S., 1995, Can bank health affect Investment? Evidence from Japan, Journal of Business 68: 281–308.
Holmstrom, B., and J. Tirole, 1997, Financial intermediation, loanable funds, and the real sector, Quarterly Journal of Economics 112: 663-691.
Holmstrom, B., and J. Tirole, 1998. Public and private supply of liquidity, Journal of Political Economy 106: 1–40.
Hoshi, T., and A. Kashyap, 2010, Will the U.S. bank recapitalization succeed? Eight lessons from Japan, Journal of Financial Economics 97: 398-417
Imai, M., 2009, Political influence and declarations of bank insolvency in Japan, Journal of Money, Credit, and Banking 41: 131–158.
James, C., 1987, The losses realized in bank failures, Journal of Finance 46: 1223-1242
Kashyap, A. K.; R. G. Rajan, and J. C. Stein, 2002, Banks as liquidity providers: An explanation for the coexistence of lending and deposit-taking, Journal of Finance 57: 33–73.
Khwaja, A. I., and A. Mian, 2008, Tracing the Impact of Bank Liquidity Shocks: Evidence from an Emerging Market, American Economic Review 98, 1413-1442.
Kim, D., and A. M. Santomero, 1988, Risk in banking and capital regulation, Journal of Finance 43: 1219–1233.
Koehn, M., and A. M. Santomero, 1980, Regulation of bank capital and portfolio risk, Journal of Finance 35: 1235–1244.
Laeven, L., and R. Levine, 2009, Bank governance, regulation, and risk taking, Journal of Financial Economics 93: 259–275.
Mailath, G. J., and L. J. Mester, 1994, A positive analysis of bank closure. Journal of Financial Intermediation 3: 272-299
Mehran, H., and A. V. Thakor, forthcoming, Bank capital and value in the cross-section, Review of Financial Studies.
Merkl, C., and S. Stolz, 2006, Banks’ regulatory buffers, liquidity networks and monetary policy transmission, Bundesbank Discussion Paper, Series 2: Banking and Financial Studies, No 06/2006.
Morrison, A. D., and L. White, 2005, Crises and capital requirements in banking. American Economic Review 95: 1548–1572.
Noe, T. H., M. J. Rebello, and L. D. Wall, 1996, Managerial rents and regulatory intervention in troubled banks, Journal of Banking and Finance 20: 331–350.
Ongena, S., D. C. Smith, and D. Michalsen, 2003, Firms and their distressed banks: lessons from the Norwegian banking crisis, Journal of Financial Economics 67: 81–112

-29-
Oshinsky, R., and V. Olin, 2005, Troubled Banks: Why don’t they all fail? FDIC Working Paper 2005-03, Federal Deposit Insurance Corporation, Washington, D.C.
Peek, J., and E. Rosengren, 2005, Unnatural selection: Perverse incentives and the allocation of credit in Japan, American Economic Review 95, 1144-1166.
Puri, M., J. Rocholl, and S. Steffen, 2011, Global retail lending in the aftermath of the US financial crisis: Distinguishing between supply and demand effects, Journal of Financial Economics 100: 556-578.
Ramakrishnan, R. T.S., and A. V. Thakor, 1984, Information reliability and a theory of financial intermediation, Review of Economics Studies 51: 415–432.
Repullo, R., 2004, Capital requirements, market power, and risk-taking in banking, Journal of Financial Intermediation 13: 156–182.
Schmidt, R. H., A. Hackethal, and M. Tyrell, 1999, Disintermediation and the role of banks in Europe: An international comparison, Journal of Financial Intermediation 8: 36–67.
Slovin, M. B., M. E. Sushka, and J. A. Poloncheck, 1993, The value of bank durability: Borrowers as bank stakeholders, Journal of Finance 48: 247-266.
Stolz, S. M., and M. Wedow, 2010, Extraordinary measures in extraordinary times – Public measures in support of the financial sector in the EU and the United States, European Central Bank, Occasional Paper No. 117]
von Thadden, E.-L., 2004, Bank capital adequacy regulation under the new Basel Accord, Journal of Financial Intermediation 13: 90–95.
Watanabe, W., 2007, Prudential regulation and the “Credit Crunch”: Evidence from Japan, Journal of Money, Credit, and Banking, 39, 639-665.
Webb, D. C., 2000, The impact of liquidity constraints on bank lending policy, Economic Journal 110: 69–91.
Weisbach, M., 1988, Outside directors and CEO turnover, Journal of Financial Economics 20: 431–460.

-30-
Appendix: Bank liquidity creation
This Appendix explains how we measure liquidity creation and shows how liquidity creation
changed over our sample period.
A. Measuring bank liquidity creation
We calculate a bank’s € amount of liquidity creation using a slight variation on Berger and
Bouwman’s (2009) three-step procedure, which is discussed below and illustrated in Table A-1.
In the first step, we classify bank assets, liabilities, and equity as liquid, semi-liquid, or illiquid
based on the ease, cost, and time it takes for customers to withdraw liquid funds from the bank,
and the ease, cost and time it takes for a bank to dispose of their obligations to meet these
liquidity demands. We follow a similar principle for off-balance sheet items.
A key difference between our calculation of liquidity creation and the approach in Berger and
Bouwman (2009) exists. They argue that all activities should be classified based on information
on both product category and maturity. However, due to data limitations, Berger and Bouwman
(2009) have to classify loans according to either category or maturity. The unique database from
the Bundesbank, however, enables us to exploit information on both loan category and maturity
when classifying these items.28
In the second step, we assign weights of either +½, 0, or -½ to all bank activities that are
classified in the previous step. The signs of the weights are consistent with liquidity creation
theory, which states that liquidity is created when banks transform illiquid assets into liquid
liabilities. Liquidity is destroyed when liquid assets are financed by illiquid liabilities or equity.
Hence, we allocate positive weights to illiquid assets and liquid liabilities, while negative weights
are applied to liquid assets and illiquid liabilities and equity. We use weights of +½ and -½
because liquidity creation is only half determined by the source or use of funds alone. We apply
the intermediate weight of 0 to semi-liquid assets and liabilities, based on the assumption that
semi-liquid activities fall halfway between liquid and illiquid activities. In terms of off-balance
28 Another difference is that Berger and Bouwman’s (2009) preferred measure includes the gross fair values of off-
balance sheet derivatives. Since only notional amounts are available in the Bundesbank database and since derivatives affect liquidity creation only marginally in the U.S., we assume that this holds in Germany as well and exclude derivatives from our measure of liquidity creation. This exclusion should not have a large effect since most banks operate with close to matched books.

-31-
sheet items, we follow Berger and Bouwman (2009) and apply positive weights to all illiquid
guarantees.
In the third step, we combine the activities as classified and weighted in the first two steps to
obtain two liquidity creation measures. ‘Mat Cat Fat’ represents our classification of activities
based on both maturity and category with the inclusion of off-balance sheet activities. ’Mat Cat
Nonfat’ excludes off-balance sheet activities. The calculation of both measures is illustrated in
Table A-1.
B. Bank liquidity creation from 1999 to 2009
We briefly explore how liquidity creation has evolved from 1999 to 2009 and further
investigate how it varies across different types of banks (see Figure A-1). Assessing liquidity
creation by ‘Mat Cat Fat’ (our preferred measure) and ‘Mat Cat Nonfat’ reveals similar trends
over time. However, the level of liquidity created by banks doubles when we include off-balance
sheet activities, a finding that is similar to the U.S. Since banks create a substantial amount of
liquidity off the balance sheet we focus on ‘Mat Cat Fat’ in the rest of the paper.
[Fig. 1 Liquidity creation: Mat Cat Nonfat and Mat Cat Fat]
Based on our preferred measure ‘Mat Cat Fat,’ we find that liquidity creation increased
sharply at the beginning of the period before it peaked in 2001 and began to decline steadily
thereafter. Liquidity creation rose again from 2004 onwards whereby it reached the highest level
of approximately € 1.5 trillion in 2006. The financial crisis that began in 2007 coincided with a
massive plunge in liquidity creation. The level of aggregate liquidity creation at the end of the
period is lower than at the beginning of our sample period. Banks created around € 1.014 trillion
of liquidity in 1999, compared with € 1.250 trillion in 2009. An examination of the median
bank’s liquidity creation in Table A-2, however, suggests that the median bank’s liquidity
creation increased from € 42 million in 1999 to € 102 million in 2009, we obtain a similar picture
when we investigate liquidity creation divided by total assets (increases from 21% to over
28%).29
[Table A-2 Liquidity Creation in Germany]
29 The increase in liquidity creation for the median bank is due to the fact that banks grew considerably during the
sampling period. This growth is, at least partially, due to extensive merger activities in the banking sector.

-32-
Table A-1 Classification of bank activities and construction of two liquidity creation measures
Step 1: Classify all bank activities as liquid, semi-liquid, or illiquid based on product category (Cat) and maturity (Mat). Step 2: Assign weights to the activities classified in Step 1. ASSETS:
Illiquid assets (weight = ½) Semi-liquid assets (weight = 0) Liquid assets (weight = - ½) Cat Mat Cat Mat Loans to credit institutions > 1 year Loans to credit institutions <= 1 year Cash and due from other institutions Loans to customers > 1 year Loans to customers <= 1 year Loans to credit institutions (due daily) Premises Exchange listed fixed income securities Intangible assets Exchange listed equities and other non fixed income securities Non exchange listed fixed income securities Exchange listed participation rights Non exchange listed equities and other non fixed income securities Exchange listed investments in unconsolidated subsidiaries Non exchange listed investments in unconsolidated subsidiaries Non exchange listed participation rights Subordinated loans to customers Subordinated loans to credit institutions Other subordinated assets Other real estate owned LIABILITIES PLUS EQUITY:
Liquid liabilities (weight = ½) Semi-liquid liabilities (weight = 0) Illiquid liabilities (weight = - ½) Liabilities to credit institutions (overnight funds) Cat Mat Cat Mat Other liabilities to customers (transactions deposits) Savings deposits All maturities Liabilities to credit institutions >1 year Time deposits All maturities Other tradable liabilities >1 year Liabilities to credit institutions <= 1 year Bank's liability on bankers acceptances Other tradable liabilities <= 1 year Subordinated debt Equity OFF-BALANCE SHEET ACTIVITIES:
Illiquid guarantees (weight = ½) Commercial and similar letters of credit Unused irrevocable loan commitments Unused revocable commitments Net standby letters of credit All other off-balance sheet liabilities
Step 3: Combine bank activities as classified in Step 1 and as weighted in Step 2 to construct "Mat Cat Fat" and "Mat Cat Nonfat" liquidity creation measures. Mat Cat Fat = + ½*illiquid assets + ½*liquid assets + ½*illiquid guarantees + 0* semi-liquid assets + 0* semi-liquid liabilities - ½* liquid assets - ½* illiquid liabilities - ½* equity Mat Cat Nonfat = + ½*illiquid assets + ½*liquid assets + 0* semi-liquid assets + 0* semi-liquid liabilities - ½* liquid assets - ½* illiquid liabilities - ½* equity
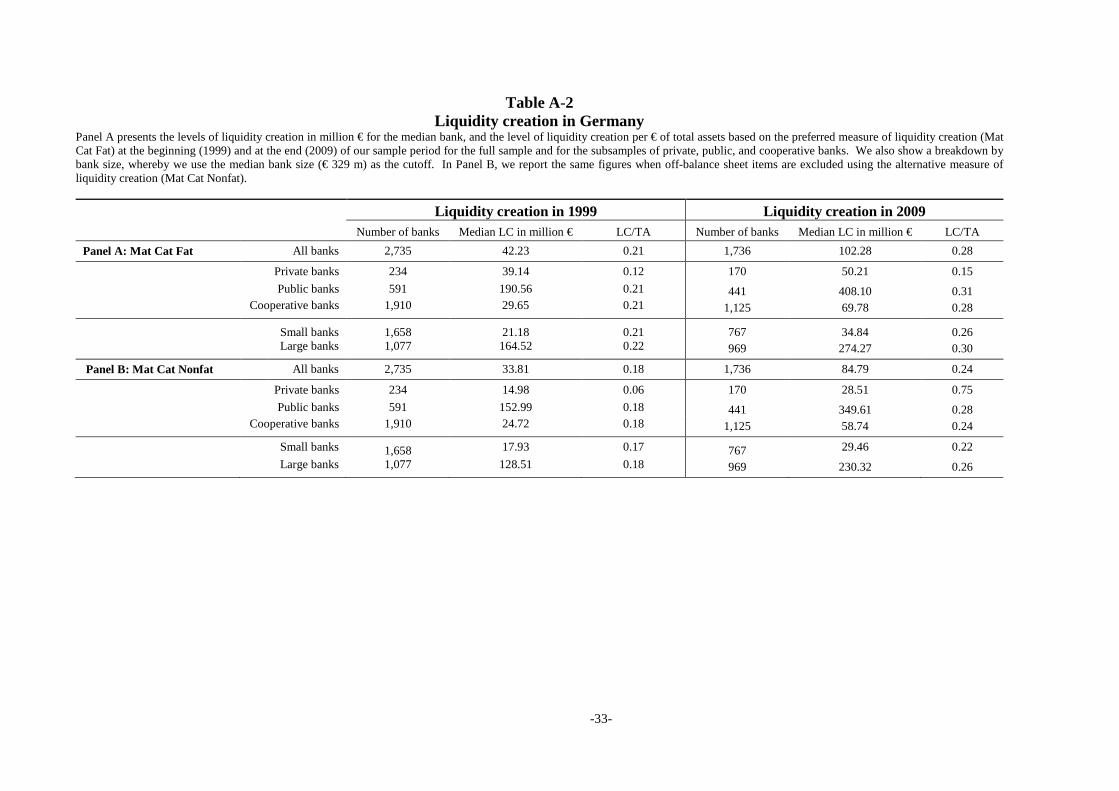
-33-
Table A-2 Liquidity creation in Germany
Panel A presents the levels of liquidity creation in million € for the median bank, and the level of liquidity creation per € of total assets based on the preferred measure of liquidity creation (Mat Cat Fat) at the beginning (1999) and at the end (2009) of our sample period for the full sample and for the subsamples of private, public, and cooperative banks. We also show a breakdown by bank size, whereby we use the median bank size (€ 329 m) as the cutoff. In Panel B, we report the same figures when off-balance sheet items are excluded using the alternative measure of liquidity creation (Mat Cat Nonfat).
Liquidity creation in 1999 Liquidity creation in 2009 Number of banks Median LC in million € LC/TA Number of banks Median LC in million € LC/TA Panel A: Mat Cat Fat All banks 2,735 42.23 0.21 1,736 102.28 0.28
Private banks 234 39.14 0.12 170 50.21 0.15 Public banks 591 190.56 0.21 441 408.10 0.31 Cooperative banks 1,910 29.65 0.21 1,125 69.78 0.28
Small banks 1,658 21.18 0.21 767 34.84 0.26 Large banks 1,077 164.52 0.22 969 274.27 0.30
Panel B: Mat Cat Nonfat All banks 2,735 33.81 0.18 1,736 84.79 0.24
Private banks 234 14.98 0.06 170 28.51 0.75 Public banks 591 152.99 0.18 441 349.61 0.28 Cooperative banks 1,910 24.72 0.18 1,125 58.74 0.24
Small banks 1,658 17.93 0.17 767 29.46 0.22 Large banks 1,077 128.51 0.18 969 230.32 0.26

-34-
Figure A-1 Liquidity creation over time
This Figure shows how liquidity creation changed from 1999 – 2009. The left panel presents liquidity creation (measured using the Mat Cat Fat and the Mat Cat Nonfat measures) of all universal banks. The middle panel shows liquidity creation (Mat Cat Fat only) of the three banking pillars: public banks, private banks, and cooperative banks. The right panel presents liquidity creation (Mat Cat Fat only) of small versus large banks (below and above median assets). Liquidity creation is expressed in real € 2000 terms using the GDP deflator.
050
010
0015
00
1999 2001 2003 2005 2007 2009
Mat Cat Fat
Mat Cat NonFat
All universal banks
050
010
0015
00
1999 2001 2003 2005 2007 2009
Public banks
Private banks
Cooperative banks
Banking Pillars (Mat Cat Fat only)
050
010
0015
00
1999 2001 2003 2005 2007 2009
Large banks
Small banks
Small vs. large banks (Mat Cat Fat only)
Data source: Deutsche Bundesbank's prudential data base (BAKIS).
Billion EURLiquidity creation over time

-35-
Table I Summary statistics for regulatory interventions and capital support
This table provides the number and proportion of banks with regulatory interventions and capital support, and includes the mean and standard deviation of capital support for banks that received capital injections. Regulatory interventions is a dummy that takes on the value one if the supervisory authority intervened in a bank and zero otherwise. More details for interventions are provided in Table II. Capital support is the amount of capital injected scaled by Tier 1 equity capital. Panel A provides these statistics for the full sample. Panel B offers a breakdown by banking pillar into private, public, and cooperative banks. Panel C shows a breakdown by bank size into small and large banks (below and above median total assets (€ 329 million, respectively).
Regulatory interventions Capital support (Capital injection/Tier 1 capital) Number of banks Number of banks with interventions Number of banks with capital support Mean capital support S.D. of capital support
Panel A: Full sample All banks 2,735 452 371 0.18 0.11
(Proportion) (0.17) (0.14)
Panel B: Breakdown by banking pillar
Private banks 234 16 26 0.19 0.11 (Proportion) (0.07) (0.11)
Public banks 591 24 24 0.13 0.11
(Proportion) (0.04) (0.04)
Cooperative banks 1,910 412 321 0.18 0.11 (Proportion) (0.22) (0.17)
Panel C: Breakdown by size
Small banks 1,658 256 170 0.19 0.10 (Proportion) (0.15) (0.10)
Large banks 1,077 196 201 0.16 0.11
(Proportion) (0.18) (0.19)

-36-
Table II Timing and types of regulatory interventions
This table presents a breakdown about the timing and types of regulatory interventions. Since banks can have repeated capital support measures, we primarily discuss the timing for regulatory interventions prior to, during, and following the initial capital support measures. This analysis focuses on bank-years, i.e., regulatory interventions per bank in a specific year. Therefore, the breakdown of the restrictions relative to the total number of interventions does not sum up to 452 because one bank can have multiple restrictions from different types of interventions (e.g., a bank can have both less strong and more strong interventions but this would show up as only one intervention for a bank in a specific year). In addition, we also report the number of interventions following subsequent capital support measures and those interventions that are not related to any capital support measure.
Description of regulatory interventions Total number of regulatory interventions
Number of interventions in five years before
initial capital support
Number of interventions
in year of initial capital
support
Number of interventions in five years after initial capital
support
Number of interventions
following subsequent capital support measures and
interventions not related to capital
support Base model with all interventions for all banks (Regression results reported in Tables IV, V, VII, VIII, and IX)
452 58 33 44 317
Model with less strong and more strong interventions for all banks* (Regression results reported in Table VI Panel I)
Less strong interventions hearings about dismissal of executives, fines for executives, fines for the institution, warnings of executives, threat of measures according to the Bank Act 369 22 14 34 299
More strong interventions dismissal of executives, instructions to the bank’s management, appointment of trustee, restrictions and prohibitions of profit distribution, restrictions and prohibitions of deposit taking, restrictions and prohibitions of lending activities, restructuring of business activities (primarily of lending activities)
109 39 28 20 22
Model with interventions on asset side, liability side, and management for all banks * (Regression results reported in Table VI Panel II)
Interventions on the asset side restrictions and prohibitions of lending activities, restructuring of business activities (primarily of lending activities) 84 36 23 13 12
Interventions on the liability side restrictions and prohibitions of deposit taking, restrictions and prohibitions of profit distributions 11 1 3 4 3
Interventions affecting management hearings about dismissal of executives, fines for executives, fines for the institution, warnings of executives, threat of measures according to the Bank Act, dismissal of executives, instructions to the bank’s management, appointment of trustee
381 25 15 35 306
* Dummies for the respective categories do not sum up to the total number of restrictions as a bank can have restrictions from different categories per year.

-37-
Table III Summary statistics for dependent variables and control variables
While regressions are run in changes, we report means of levels and changes of the variables. Panel A shows summary statistics for the full sample. Panels B and C report these statistics for banks with regulatory interventions and capital support. Risk is measured as risk-weighted assets divided by total assets (RWA/TA). Liquidity creation is calculated using our Mat Cat Fat measure. The controls include total assets (natural log used in regressions); return on equity (net income divided by equity capital); loan portfolio concentration (a Herfindahl-Hirschman index measuring loan portfolio concentration); the number of branch offices; interest rate spread (between a 10-year and a 1-year German government bond); and public and cooperative bank dummies (the private bank dummy is excluded as the base case). Liquidity creation and total assets are measured in real € 2000.
Panel A: Full sample Observations Mean of level Mean of change Dependent variables Risk (RWA/TA) 17,662 0.60 -0.02 Liquidity creation in million € (Mat Cat Fat) 17,662 602.00 0.22 Control variables Total assets in million € 17,662 2,400.00 0.02 Return on equity 17,662 0.11 -0.04 Loan portfolio concentration 17,662 0.31 0.02 Bank branches 17,662 19.66 -0.59 Interest rate spread 17,662 0.01 0.01 Private bank 17,662 0.08 n/a Public bank 17,662 0.26 n/a Cooperative bank 17,662 0.66 n/a
Panel B: Banks with regulatory interventions Dependent variables Risk (RWA/TA) 452 0.63 0.00 Liquidity creation in million € (Mat Cat Fat) 452 1,130.00 0.19 Control variables Total assets in million € 452 4,410.00 0.02 Return on equity 452 0.06 0.06 Loan portfolio concentration 452 0.29 0.05 Bank branches 452 16.02 -0.48 Interest rate spread 452 0.01 0.01 Private bank 452 0.04 n/a Public bank 452 0.05 n/a Cooperative bank 452 0.91 n/a
Panel C: Banks with capital support Dependent variables Risk (RWA/TA) 371 0.61 -0.02 Liquidity creation in million € (Mat Cat Fat) 371 542.00 0.18 Control variables Total assets in million € 371 3,480.00 -0.02 Return on equity 371 0.03 0.03 Loan portfolio concentration 371 0.31 0.04 Bank branches 371 17.61 -1.13 Interest rate spread 371 0.01 0.01 Private bank 371 0.07 n/a Public bank 371 0.06 n/a Cooperative bank 371 0.86 n/a

-38-
Table IV Main regression results
We estimate ordered logit models for changes in risk and liquidity creation. The dependent variable takes on the value 1 if there was a drop in risk (Panel A) or liquidity creation (Panel B) of at least 3% relative to the previous year, it takes on the value 2 if risk (Panel A) or liquidity creation (Panel B) remained within the interval +/- 3%, and it takes on the value 3 if there was an increase in risk (Panel A) or liquidity creation (Panel B) of more than 3%. All variables are defined in the notes to Table III. The dummy for private banks is omitted to avoid perfect collinearity. All variables enter the regression in changes, unless dummy variables are used. We report odds ratios, and test the null hypothesis that the odds ratios are significantly different from one. Robust z-statistics are presented in brackets. *** p≤0.01, ** p≤0.05, * p≤0.1 Panel A: Risk
(∆ RWA/TA) Panel B: Liquidity creation
(∆ LC) Variable of interest Regulatory interventions 0.7819*** 0.6398*** [-2.73] [-5.02] Capital support 0.9818*** 0.9839*** [-3.52] [-3.47] Control variables Δ Log total assets 1.0518*** 1.0365*** [14.99] [11.98] Δ Return on equity 0.9885*** 1.0015 [-7.03] [0.97] Δ Loan portfolio concentration 0.9954 1.0041 [-0.68] [0.66] Δ Bank branches 1.0226** 1.0357*** [2.06] [2.87] Δ Interest rate spread 2.2491*** 1.3606*** [31.97] [12.42] Public bank dummy 1.4290*** 1.5082*** [4.60] [6.08] Cooperative bank dummy 1.1508* 1.3452*** [1.87] [4.63] α1 1.4235*** 0.9125 [4.41] [-1.33] α2 10.8454*** 1.8456*** [28.55] [8.90] Observations 17,662 17,662 Pseudo R-squared 0.039 0.011

-39-
Table V Subsample results for banks split by banking pillar, size, capitalization, and subperiods
This table presents results based on ordered logit models for different subsamples. Subpanel I splits banks by banking pillar into private, public, and cooperative banks. Subpanel II splits banks by size into small and large banks, i.e., banks with assets below and above the median, respectively. Subpanel III splits banks by capitalization into poorly- and well-capitalized banks, i.e., banks with capital below and above the median capital adequacy ratio (Tier 1 plus tier 2 capital/Risk-weighted assets), respectively. Subpanel IV splits the sample into non-crisis years (1999-2000 and 2002-2006) and crisis years (2001, 2007-2009). Panels A and B present the risk and liquidity creation results, respectively. The dependent variable takes on the value 1 if there was a drop in risk (Panel A) or liquidity creation (Panel B) of at least 3% relative to the previous year, it takes on the value 2 if risk (Panel A) or liquidity creation (Panel B) remained within the interval +/- 3%, and it takes on the value 3 if there was an increase in risk (Panel A) or liquidity creation (Panel B) of more than 3%. All control variables used in Table IV are included but not shown due to space constraints. We report odds ratios and test the null hypothesis that the odds ratios are significantly different from one. Robust z-statistics are presented in brackets. *** p≤0.01, ** p≤0.05, * p≤0.1
Subsamples I
Banking pillar II
Size III
Capitalization IV
Subperiods Private
banks Public banks
Cooperative banks
Small banks
Large banks
Poorly-capitalized banks
Better-capitalized bank
Non-crisis years
Crisis years
Panel A: Risk (∆ RWA/TA) Regulatory interventions 1.0988 1.1169 0.7470*** 0.7158*** 0.9012 0.7066*** 0.9165 0.6716*** 0.7997 [0.15] [0.28] [-3.02] [-2.91] [-0.71] [-3.03] [-0.57] [-3.57] [-1.21] Capital support 0.9811 0.9715* 0.9828*** 0.9842** 0.9791*** 0.9827*** 0.9807** 0.9760*** 0.9775** [-0.94] [-1.80] [-2.98] [-2.13] [-2.93] [-2.58] [-2.24] [-3.83] [-2.07] Observations 1,415 4,635 11,612 8,839 8,823 8,833 8,829 10,795 6,867 Pseudo R-squared 0.007 0.051 0.049 0.04450 0.03788 0.046 0.033 0.022 0.160 Panel B: Liquidity creation (∆ LC) Regulatory interventions 0.6623 0.2942*** 0.6599*** 0.7519** 0.5000*** 0.5774*** 0.7417** 0.6132*** 0.6794** [-0.74] [-3.00] [-4.41] [-2.43] [-5.02] [-4.82] [-1.99] [-4.60] [-2.41] Capital support 1.0052 0.9714 0.9830*** 0.9919 0.9761*** 0.9727*** 1.0073 0.9812*** 0.9907 [0.30] [-1.59] [-3.34] [-1.23] [-3.58] [-4.73] [0.84] [-3.46] [-1.03] Observations 1,415 4,635 11,612 8,839 8,823 8,833 8,829 10,795 6,867 Pseudo R-squared 0.013 0.006 0.016 0.015 0.011 0.017 0.008 0.010 0.014

-40-
Table VI Decomposition of regulatory interventions
This table disaggregates our regulatory interventions into less strong and more strong regulatory interventions in Subpanel I, and into interventions that affect the bank’s asset side, the liability side, and the bank’s management in Subpanel II. (For summary statistics and definitions of these subcategories: see Table II.) We measure capital support as before. Panel A contains the risk regressions and Panel B shows the results for liquidity creation. All control variables used in Table IV are included but not shown due to space constraints. We report odds ratios and test the null hypothesis that the odds ratios are significantly different from one. Robust z-statistics are presented in brackets. *** p≤0.01, ** p≤0.05, * p≤0.1
I Less strong and more strong regulatory interventions
II Interventions on the asset side, on the liability side,
and actions taken against management Panel A: Risk (∆ RWA/TA) Regulatory interventions (less strong) 0.8901 [-1.22] Regulatory interventions (more strong) 0.4973*** [-3.18] Regulatory interventions (asset side) 0.4651*** [-3.18] Regulatory interventions (liability side) 0.4033 [-1.26] Regulatory interventions (management) 0.8862 [-1.27] Capital support 0.9842*** 0.9844*** [-2.99] [-2.92] Observations 17,662 17,662 Pseudo R-squared 0.0396 0.0397 Panel B: Liquidity creation (∆ LC) Regulatory interventions (less strong) 0.7082*** [-3.52] Regulatory interventions (more strong) 0.5249*** [-3.35] Regulatory interventions (asset side) 0.5889** [-2.39] Regulatory interventions (liability side) 0.2474** [-2.10] Regulatory interventions (management) 0.7055*** [-3.62] Capital support 0.9853*** 0.9850*** [-3.08] [-3.13] Observations 17,662 17,662 Pseudo R-squared 0.0111 0.0110

-41-
Table VII Robustness tests
This table presents ordered logit models that test the robustness of our main results. Panel A contains the risk regressions and Panel B shows the results for liquidity creation. All control variables used in Table IV are included but not shown due to space constraints. Subpanel I uses alternative cutoffs of 1% and 5% changes in risk and liquidity creation. Subpanel II presents the results for banks that were engaged in merger activities during the sample period versus banks that were not involved in such activities. Subpanel III use alternative dependent variables: an alternative (inverse) risk taking measure defined as Tier 1 equity capital divided by risk-weighted assets, and three alternative liquidity creation measures which decompose total liquidity creation into asset-based, liability-based, and off-balance sheet-based liquidity creation. We report odds ratios and test the null hypothesis that the odds ratios are significantly different from one. Robust z-statistics are presented in brackets. *** p≤0.01, ** p≤0.05, * p≤0.1
I Alternative cut-offs
II Alternative subsamples
III Alternative dependent variables
Panel A: Risk (∆ RWA/TA) 1% change 5% change Merged banks only Merged banks excluded Insolvency risk (∆ Tier 1/RWA) Regulatory interventions 0.7952** 0.8484* 0.7640* 0.7875** 0.8285** [-2.37] [-1.64] [-1.68] [-2.18] [-1.99] Capital support 0.9821*** 0.9840*** 0.9924 0.9723*** 0.9867*** [-3.61] [-2.93] [-1.00] [-3.80] [-2.64] Observations 17,662 17,662 5,506 12,156 17,662 Pseudo R-squared 0.030 0.055 0.050 0.034 0.011 Panel B: Liquidity creation (∆ LC) 1% change 5% change Merged banks only Merged banks excluded ∆ LC assets ∆ LC liabilities ∆ LC off-balance sheet Regulatory interventions 0.6791*** 0.6634*** 0.5545*** 0.6942*** 0.7283*** 1.0228 0.6701*** [-4.06] [-4.65] [-3.74] [-3.37] [-3.28] [0.24] [-4.10] Capital support 0.9863*** 0.9826*** 0.9915 0.9789*** 0.9896** 1.0006 0.9824*** [-2.95] [-3.67] [-1.23] [-3.30] [-2.17] [0.13] [-3.95] Observations 17,662 17,662 5,506 12,156 17,662 17,662 17,607 Pseudo R-squared 0.011 0.011 0.016 0.009 0.013 0.012 0.009
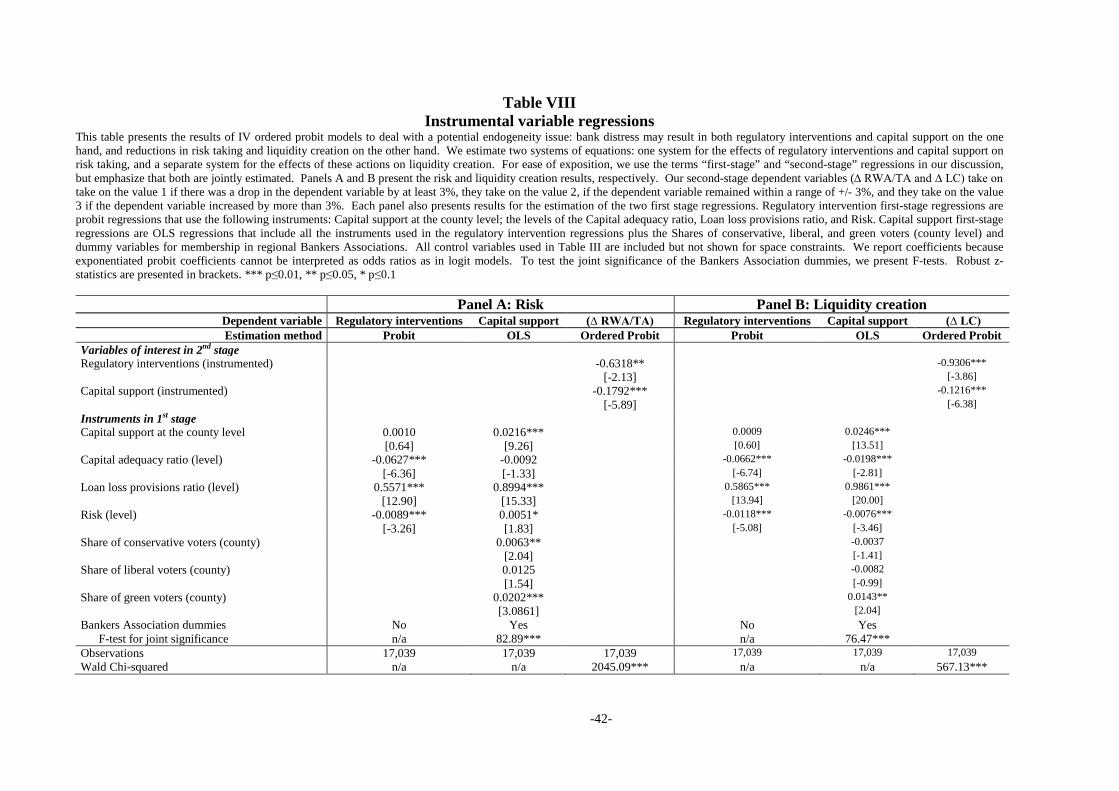
-42-
Table VIII Instrumental variable regressions
This table presents the results of IV ordered probit models to deal with a potential endogeneity issue: bank distress may result in both regulatory interventions and capital support on the one hand, and reductions in risk taking and liquidity creation on the other hand. We estimate two systems of equations: one system for the effects of regulatory interventions and capital support on risk taking, and a separate system for the effects of these actions on liquidity creation. For ease of exposition, we use the terms “first-stage” and “second-stage” regressions in our discussion, but emphasize that both are jointly estimated. Panels A and B present the risk and liquidity creation results, respectively. Our second-stage dependent variables (∆ RWA/TA and ∆ LC) take on take on the value 1 if there was a drop in the dependent variable by at least 3%, they take on the value 2, if the dependent variable remained within a range of +/- 3%, and they take on the value 3 if the dependent variable increased by more than 3%. Each panel also presents results for the estimation of the two first stage regressions. Regulatory intervention first-stage regressions are probit regressions that use the following instruments: Capital support at the county level; the levels of the Capital adequacy ratio, Loan loss provisions ratio, and Risk. Capital support first-stage regressions are OLS regressions that include all the instruments used in the regulatory intervention regressions plus the Shares of conservative, liberal, and green voters (county level) and dummy variables for membership in regional Bankers Associations. All control variables used in Table III are included but not shown for space constraints. We report coefficients because exponentiated probit coefficients cannot be interpreted as odds ratios as in logit models. To test the joint significance of the Bankers Association dummies, we present F-tests. Robust z-statistics are presented in brackets. *** p≤0.01, ** p≤0.05, * p≤0.1
Panel A: Risk Panel B: Liquidity creation Dependent variable Regulatory interventions Capital support (∆ RWA/TA) Regulatory interventions Capital support (∆ LC) Estimation method Probit OLS Ordered Probit Probit OLS Ordered Probit
Variables of interest in 2nd stage Regulatory interventions (instrumented) -0.6318** -0.9306*** [-2.13] [-3.86] Capital support (instrumented) -0.1792*** -0.1216*** [-5.89] [-6.38] Instruments in 1st stage Capital support at the county level 0.0010 0.0216*** 0.0009 0.0246*** [0.64] [9.26] [0.60] [13.51] Capital adequacy ratio (level) -0.0627*** -0.0092 -0.0662*** -0.0198*** [-6.36] [-1.33] [-6.74] [-2.81] Loan loss provisions ratio (level) 0.5571*** 0.8994*** 0.5865*** 0.9861*** [12.90] [15.33] [13.94] [20.00] Risk (level) -0.0089*** 0.0051* -0.0118*** -0.0076*** [-3.26] [1.83] [-5.08] [-3.46] Share of conservative voters (county) 0.0063** -0.0037 [2.04] [-1.41] Share of liberal voters (county) 0.0125 -0.0082 [1.54] [-0.99] Share of green voters (county) 0.0202*** 0.0143** [3.0861] [2.04] Bankers Association dummies No Yes No Yes F-test for joint significance n/a 82.89*** n/a 76.47*** Observations 17,039 17,039 17,039 17,039 17,039 17,039 Wald Chi-squared n/a n/a 2045.09*** n/a n/a 567.13***

-43-
Table IX
Long-run effects This table shows the results of OLS regressions used to study the long-run effects of interventions and capital support on risk taking (Panel A) and liquidity creation (Panel B). The regressions include five leads and lags of the dummies for regulatory interventions and capital support, bank type dummies, and year fixed effects. Robust z-statistics are presented in brackets. *** p≤0.01, ** p≤0.05, * p≤0.1 Risk taking
(∆RWA/TA) Liquidity creation
(∆LC, ln) Regulatory intervention t+5 -0.2993 -0.3576 [-1.16] [-0.36] Regulatory intervention t+4 -0.4114* -0.7844 [-1.70] [-0.82] Regulatory intervention t+3 -0.1304 -0.0224 [-0.54] [-0.02] Regulatory intervention t+2 -0.5718** 0.3736 [-2.48] [0.43] Regulatory intervention t+1 -0.7550*** -2.7957*** [-3.01] [-2.89] Regulatory intervention t-1 -0.3692 -0.4837 [-0.42] [-0.19] Regulatory intervention t-2 0.3634 1.4919 [0.70] [0.81] Regulatory intervention t-3 -0.3356 2.5347 [-0.72] [1.55] Regulatory intervention t-4 -0.0040 1.1546 [-0.01] [0.94] Regulatory intervention t-5 0.0544 -0.3309 [0.18] [-0.30] Capital support t+5 -0.0978 -0.4828 [-0.36] [-0.44] Capital support t+4 0.2674 0.5288 [1.05] [0.54] Capital support t+3 -0.3640 0.2686 [-1.28] [0.26] Capital support t+2 -0.1570 -0.2582 [-0.53] [-0.22] Capital support t+1 -0.9037*** -2.8206** [-2.58] [-2.41] Capital support t-1 0.1091 -1.5015 [0.25] [-1.00] Capital support t-2 -0.3947 0.1127 [-0.97] [0.06] Capital support t-3 0.7513 2.3106 [1.62] [1.22] Capital support t-4 -0.1589 1.6102 [-0.19] [0.76] Capital support t-5 -1.0144 0.3076 [-1.32] [0.11] Bank fixed effects Yes Yes Bank type and year dummies Yes Yes Observations 17,662 17,662 R-squared 0.499 0.045 Number of banks 2,947 2,947