Bank Restructuring in Asia: Crisis management in the ... Abstract This paper analyzes the bank...
67
DP RIETI Discussion Paper Series 07-E-039 Bank Restructuring in Asia: Crisis management in the aftermath of the Asian financial crisis and prospects for crisis prevention -Malaysia- ITO Takatoshi RIETI HASHIMOTO Yuko Toyo University The Research Institute of Economy, Trade and Industry http://www.rieti.go.jp/en/
Transcript of Bank Restructuring in Asia: Crisis management in the ... Abstract This paper analyzes the bank...

DPRIETI Discussion Paper Series 07-E-039
Bank Restructuring in Asia:Crisis management in the aftermath of the Asian financial
crisis and prospects for crisis prevention -Malaysia-
ITO TakatoshiRIETI
HASHIMOTO YukoToyo University
The Research Institute of Economy, Trade and Industryhttp://www.rieti.go.jp/en/

1
RIETI Discussion Paper Series 07-E-039
Bank Restructuring in Asia: Crisis management
in the aftermath of the Asian financial crisis
and
prospects for crisis prevention
-Malaysia-
Takatoshi Ito♠
and Yuko Hashimoto♦
April 16, 2007
1. Introduction 2. Resolution of NPLs
3. Loan Activities and Capital Adequacy 4. Management of Banking Sector
5. Danaharta 6. Danamodal
7. CDRC 8. Summary and Conclusions
Appendix: Measures and New Guidelines
___________________________________________________________________________________________________
♠
Faculty of Economics, University of Tokyo, Japan ♦
Faculty of Economics, Toyo University, Japan.

1
Abstract This paper analyzes the bank restructuring process in Malaysia from the currency crisis of 1997 to present. Even though the banking sector in Malaysia had relatively lower NPLs compared to other Asian countries, financial sector suffered financial crisis and various problems emerged. This paper covers topics such as setting up financial restructuring agencies, a scheme of capital injection to weak banks, and a corporate restructuring process conducted by the Malaysian government. Plans of Mergers/ closures of banks, setting up an asset management company, a recapitalization agency, and a corporate debt restructuring committee, such as Pengurusan Danaharta Nasional Berhad (Danaharta), Danamodal Nasional Berhad (Danamodal), and the Corporate Debt Restructuring Committee (CDRC), were accompanied by several policy measures such as an exchange rate system pegged to the U.S. dollar, capital controls, and a fiscal stimulus package.
Through these measures, the authorities, to some extent, succeeded in bringing down NPLs and in merging several banks to some extent. The reform was considered basically completed by 2002. The banking sector was reorganized with 10 banking groups, and two of the restructuring agencies were closed by 2003.

2
1. Introduction This paper analyzes the bank restructuring process in Malaysia from the currency crisis of 1997 to the present. In the wake of the currency crisis, similar to its neighboring countries, Malaysia went through a currency crisis and banking problems. The economy suffered a severe recession that exposed a lack of supervisory schemes and the vulnerability of the banking system. After a brief period of fiscal tightening in 1997, the Malaysian Government implemented a number of medium- to long-term development plans, starting with fiscal measures to end the recession, followed by measures such as capital outflow control and re-adoption of the fixed exchange rate pegged to the U.S. dollar in 1998. This paper covers topics such as setting up financial restructuring agencies, a scheme of capital injection to weak banks, and the corporate restructuring process. Malaysia, just like other Asian countries, faced a massive task at the outset of the crisis in 1997. The crisis management strategy included continued structural reforms to promote competition and efficiency and to maintain financial stability in order to protect itself from future shocks and avoid another crisis.1 After going through bank restructuring for a few years, banking sector reform was basically complete by 2002. The banking sector was reorganized with 10 banking groups. Two of the three fixed-term restructuring agencies were closed by 2003.
As an emerging market economy, Malaysia showed clear success in its development strategy. During the past decades, prior to the crisis of 1997, the GDP growth rate averaged about 6% per year. The country's investment ratio was the highest in the region due to the development plans implemented from 1970 to the mid-1990s. By the early 1980s, the high growth rate was accompanied by increased budget deficits that accumulated to an unsustainable level of public debt. The authorities took measures to reduce the Government deficit.
1 Meesook et al. (2001) gives an overview of the Malaysian economy after the crisis and summarizes policy measures.

3
The strong economic performance continued during the 1990s prior to the crisis. Real output growth averaged 8.5% per year, the exchange rate remained stable, and international reserves were robust. Following nine consecutive years of robust economic growth, the banking institutions experienced strong performance in the first half of 1997. Non-performing loans had been on a downward trend. At the end of June 1997, the banking system had a NPL ratio of 3.6%, while loan loss reserves (specific provisions, general provisions and suspended interest payments (interest-in-suspense)) amounted to 92% of total NPLs. Based on performance in the first half of the year, the banking system was expecting a period of relative stability for the rest of the year. There were, however, also signs of stress: the investment-led growth strategy was successful in raising output and income, while investment quality had deteriorated. This eventually led to major balance sheet weaknesses in the banking and corporate sectors, exposing the economy to the contagion effect from other Asian countries.

4
The environment changed drastically in the second half of 1997. In July 1997, the ringgit began to fall as a result of the first wave of contagion effects of the regional financial crisis triggered by Thai baht floatation on July 2, 1997. As currency traders took speculative positions in the offshore ringgit market in anticipation of a large devaluation, the offshore ringgit interest rates increased markedly, relative to the domestic rates. The fall in the value of the ringgit, accompanied by the sharp drop in the stock prices at the Kuala Lumpur Stock Exchange, strongly affected the earnings and overall performance of the corporate sector. As market confidence dramatically diminished along with the rest of the region, large portfolio outflows took place, as equity and property values declined substantially. Thus, the corporate sector experienced significant loss due to the sharp falls in the value of real estate and equities used as bank collateral. As a result, the banking sector was hit badly by the crisis. In the second half of 1997, every banking institution had to cope with emerging difficulties such as a heightened upward pressure on domestic interest rates, intensified outflows of ringgit funds, tight liquidity conditions, loan provisioning requirements, and problematic borrowers. As a result, banks found themselves with increasing non-performing loans ratios. The intermediation function continued to function although several inefficiencies emerged. The total NPL ratio in the banking sector rose to 5.7% at the end of 1997. However, the NPL ratio in Malaysia was lower

5
than that in other crisis-affected Asian countries.
In response to the deteriorating economy, the authorities raised interest rates and tightened fiscal policy in an attempt to restore market confidence in the financial system. In early 1998, fiscal policy was revised to a more expansionary stance. This policy mix was aimed at correcting external imbalances. However, the economic contraction was far worse than anticipated. The GDP growth rates slowed and turned sharply negative in 1998.2
In September 1998, several policy measures, such as an exchange rate system pegged to the U.S. dollar, capital controls, and a fiscal stimulus package, were launched by the Malaysian authorities.3 These measures were successful to some extent in protecting Malaysian industries from exchange rate fluctuations and in lowering of interest rates. The authorities also pursued fundamental reforms in the financial and corporate sectors, including a bank consolidation program and an upgrading of prudential regulation and supervision in line with international
2 GDP growth in East Asia’s crisis countries turned sharply negative in 1998. The steep decline in output was driven by a severe drop in private capital investment and, to lesser degree, by a reduction in private consumption. The largest drops in investment occurred in Indonesia and Malaysia. See Claessens, Djankov and Klingebiel (2001). 3 See IMF (2000) for details.

6
best practices.
In 1998, several measures were introduced in order to stabilize the banking sector and to lead further to reform that would continue for the medium and long term.4 The consolidation of the banking sector was initiated through mergers. The restructuring plan for strengthening the banking system was accompanied by the setting up of an asset management company, a recapitalization agency, and a corporate debt restructuring committee.
In the second half of 1998, Pengurusan Danaharta Nasional Berhad (Danaharta), an asset management company, was set up as a pre-emptive measure to remove the NPLs from banking institutions. The objective of Danaharta was to maintain the level of NPLs in the banking system at a manageable proportion. Danamodal Nasional Berhad (Danamodal) was subsequently set up. Danamodal aimed to recapitalize banking institutions by capital injection. The setting up of the Corporate Debt Restructuring Committee (CDRC) was to provide a mechanism for the banking institutions and debtors to work out feasible debt restructuring schemes. Since the cases dealt with by the CDRC involved those with loans exceeding RM50 million, special loan rehabilitation units were also established to manage smaller amounts of distressed loans. The debt restructuring progress was deemed to be complete and the CDRC was closed in August 2002. (For more details, see sections 6, 7 and 8.)
In view of the importance of the intermediation role, the banking system is subject to Government supervision and intervention. The Malaysian Government was mindful of the importance of the banking system. The risk-weighted capital ratio of the banking system was 11.3% as of the end of June 1998, well above the minimum BIS requirement. The economic slowdown, however, caused increases in the level of NPLs. This would erode the capital base of the banking institutions. The setting up of Pengurusan Danaharta Nasional Berhad (Danaharta) was aimed at dealing with the problems of rising NPLs in the banking system and to maintain the smooth and efficient functioning of the intermediation process. To address the issue of recapitalization, Danamodal was established as a pre-emptive measure to recapitalize and to enable domestic banking institutions to be more resilient, in terms of generating new lending activities. In this regard, the setting up of Danamodal and Danaharta would
4 The bank recapitalization strategies and financial distress resolutions of four East Asian countries (Indonesia, Republic of Korea, Malaysia and Thailand) are summarized in Claessens, Djankov and Klingebiel (2001).

7
complement each other towards strengthening the banking system and thereby accelerate the pace of economic recovery. The policy response of the Malaysian monetary authorities was prompt and appropriate.
Consolidation through the merger process took place in 1999. The Government announced it was to form all domestic banking institutions into six banking groups in the second half of the year. However, only some institutions approved the plan because it was viewed by many to be politically-oriented and would not improve efficiency in the banking sector. The plan was finally frozen in September 1999. In one case, it was proposed that a small Malay bank would take over a larger non-Malay bank. After the protest, the plan to consolidate financial institutions into six banks was revised to 10 banks in October 1999. The consolidation of the domestic banking sector into 10 banking groups was completed by the end of 2001. Whether the merger has improved the efficiency and asset quality in the banking system still needs to be observed.
The NPL ratio reached its peak at the end of 1998 and then declined. The net NPL ratio based on 3-month classification declined to 9.6% at the end of 2000, while the NPL ratio based on both actual and 6-month classification remained relatively stable throughout 2000. The resolution of NPLs did not show improvement during the course of 2001: the net NPL ratio of banking system based on both the 3-month and 6-month classification began to increase to 11.5% and 8.1%, respectively.
In addition to the merger programs and the NPL resolution programs established by the three agencies, Danaharta, Danamodal and CDRC, several measures were implemented to support small and medium sized enterprises back on the recovery track.
On the surface, through these measures, the authorities, to some extent, succeeded in bringing down NPL ratios and in merging several banks. However, there were some skeptics. The decline of NPLs slowed down, especially during the course of 2001, due to the increase in NPLs in the manufacturing and property sectors. By the end of 2004, NPLs were again decreasing, but the level of NPLs was still as high as it was in 2000 at the 3-month classification and exceeded the level in 2000 at the 6-month classification. With regard to Danaharta, some observers feared that it would become a “warehouse” for NPLs, that is, it

8
would hold assets for a long time in the hope of asset price recovery in the future, rather than working out or auctioning off NPLs. It may take several years before we can conclude that the final resolution of the NPL problem is done and the scars from the 1997-98 crisis have been erased.
The recovery in 1999–2000 was strong, accompanied by reduced vulnerability of the financial system.5
Although banking sector restructuring was not easy, significant progress had been
made with NPL restructuring. In the latter half of 2000, however, downside risks of the economy emerged. The worldwide slowdown in the information technology sector, together with the depreciations of the yen and other regional currencies, adversely affected exports from Malaysia. Although financial restructuring has shown steady progress, it is important to continue restructuring the financial sector in order to improve the capacity of banks to manage risks and to deal with external shocks.
5 See Barro (2002), for example. In the Asian crisis countries, economic growth rebounded in 1999–2000, however, investment ratios did not significantly rebound, which might suggest that the crisis would have an adverse effect on long-term growth prospects. Park and Lee (2002) found a V-shaped recovery of real GDP growth following a crisis, but it was not unique to the East Asian countries. However, they show that East Asia experienced a far sharper contraction and recovery, which they attributed to more severe liquidity crises and weaker corporate and bank balance sheets.

9
The rest of this paper is organized as follows. Section 2 reviews the resolution of non-performing loans in the banking sector. Section 3 describes the loan activities and capital adequacy. Section 4 summarizes the consolidation process of financial institutions through mergers and closures. Section 5 describes the creation of an asset management company, Danaharta, and its function. Section 6 presents a review of the fiscal support (public fund injection) for restructuring of the banking system. Section 7 summarizes the corporate Debt Restructuring Scheme in Malaysia. Section 8 concludes the paper. 2. Resolution of Non-Performing Loans The financial turmoil following the devaluation of the Thai baht in July 1997 had a devastating effect on the Malaysian economy. The ringgit was floated in July 1997, and trended down following the Thai baht.6 In the fall of 1997, the Malaysian policy against the currency crisis was similar to that in Thailand (IMF program of August 1997) and Indonesia (November 1997). The interest rate was raised, fiscal balance was tightened, and other austerity measures, such as suspension of public works, were taken. However, these measures deteriorated bank loan quality, as borrowers faced difficulties in their businesses and loan payments. The depreciation of the currencies in the region accelerated as crises in Korea and Indonesia deepened in December 1997. The quality of bank loans in Malaysia quickly deteriorated towards the end of 1997.
<NPLs in the banking system> Expressed as a percentage of total loans, NPLs in the banking system rose from 3.6% at the end of June 1997 to 5.7% at the end of 1997. The increase in the net NPL ratio was most significant in the case of finance companies. The net NPL ratio rose dramatically within six months in 1997: from 4.3% in June to 7.8% in December. The net NPL ratio of the merchant banks was at 4.5%, and of commercial banks at 5.0%, at the end of 1997. In calculating NPLs, asset classification is a crucial problem. Malaysia had, until the end of December 1997, defined NPLs as those loans up to six months overdue, and then revised the criterion to those loans up to three months overdue on January 1, 1998.
The tightening of the classification of NPLs was aimed at recognizing problem loans held by banks and other financial institutions. It was expected to smooth the reduction in NPLs to promote banks’ lending activities and to fund projects that were still viable. The asset quality of 6 Malaysia officially adopted a floating exchange rate regime since 1975 (Bank Negara Malaysia, Annual Report 1997, p56), but the ringgit exchange rate level has been de facto fixed against US dollar.

10
the banking system, however, had worsened during 1998, reflecting the contraction of economic activities partly due to high interest rates. This was evident in the sharp increase in NPLs in the banking system in 1998. It was pointed out that the newly-introduced 3-month classification in that year increased the amount of NPLs in the banking system.
Under these circumstances, Bank Negara Malaysia increased the time required for classifying a loan as non-performing from three months to six months in September 1998. The relaxing of the classification was intended to give borrowers more time to work out bad loans. However, this policy was against the ongoing strengthening of prudential regulations, and the new rule was inconsistent with the international practice of the 3-month classification as well.
Table 2-1: Classification of Non-Performing Loans -Dec 97 Jan 98 Sep 98
default period 6-month 3- month 6-month* * Loan classification is based on individual banking institution's NPL classification policy; i.e. 3-month or 6-month classification (referred to "Actual").
On a net basis, the actual NPL ratio of the banking system increased from 5.7% in December 1997 to 9% in December 1998. The “actual” refers to the individual institution’s classification policy of either a 3-month or 6-month classification. Therefore, the “actual” NPL number and/or NPL ratio is taken from between the 3-month and 6-month numbers.
11
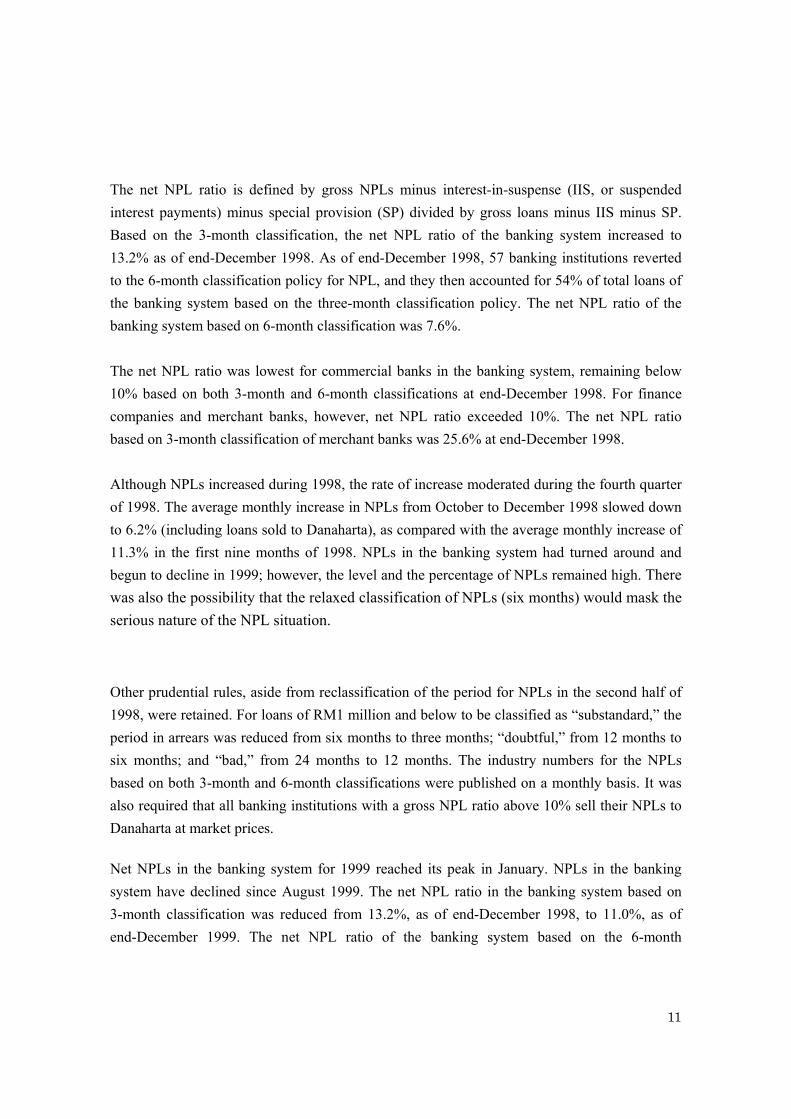
The net NPL ratio is defined by gross NPLs minus interest-in-suspense (IIS, or suspended interest payments) minus special provision (SP) divided by gross loans minus IIS minus SP. Based on the 3-month classification, the net NPL ratio of the banking system increased to 13.2% as of end-December 1998. As of end-December 1998, 57 banking institutions reverted to the 6-month classification policy for NPL, and they then accounted for 54% of total loans of the banking system based on the three-month classification policy. The net NPL ratio of the banking system based on 6-month classification was 7.6%.
The net NPL ratio was lowest for commercial banks in the banking system, remaining below 10% based on both 3-month and 6-month classifications at end-December 1998. For finance companies and merchant banks, however, net NPL ratio exceeded 10%. The net NPL ratio based on 3-month classification of merchant banks was 25.6% at end-December 1998.
Although NPLs increased during 1998, the rate of increase moderated during the fourth quarter of 1998. The average monthly increase in NPLs from October to December 1998 slowed down to 6.2% (including loans sold to Danaharta), as compared with the average monthly increase of 11.3% in the first nine months of 1998. NPLs in the banking system had turned around and begun to decline in 1999; however, the level and the percentage of NPLs remained high. There was also the possibility that the relaxed classification of NPLs (six months) would mask the serious nature of the NPL situation.
Other prudential rules, aside from reclassification of the period for NPLs in the second half of 1998, were retained. For loans of RM1 million and below to be classified as “substandard,” the period in arrears was reduced from six months to three months; “doubtful,” from 12 months to six months; and “bad,” from 24 months to 12 months. The industry numbers for the NPLs based on both 3-month and 6-month classifications were published on a monthly basis. It was also required that all banking institutions with a gross NPL ratio above 10% sell their NPLs to Danaharta at market prices. Net NPLs in the banking system for 1999 reached its peak in January. NPLs in the banking system have declined since August 1999. The net NPL ratio in the banking system based on 3-month classification was reduced from 13.2%, as of end-December 1998, to 11.0%, as of end-December 1999. The net NPL ratio of the banking system based on the 6-month

12
classification declined to 6.4% as of end-December 1999.
Despite several measures undertaken for the rehabilitation of NPLs prior to 1999, gross actual NPLs In the banking sector rose by 3.5% during the course of 2000. There was an optimistic view with regard to the increase in NPLs, in that most of the increase came from accumulated overdue interest payments. Excluding interest-in-suspense, which rose by 21.5% to RM8 billion during the year, the principal NPLs increased marginally by RM0.2 billion or 0.5% to RM39.8 billion, as of end-December 2000. Based on the 3-month classification, gross NPLs declined by 3.5% to RM62.5 billion as of end-December 2000. Gross NPLs based on the 6-month classification, however, slightly rose to RM47.8 billion at the end of 2000. This showed that most NPLs became long-term NPLs rather than newly-created NPLs at this point. The fact is that the level of the net NPL ratio relatively remained the same at the end of 2000 when compared to the level at the end of 1999. Although the banking system experienced a lower level of NPLs in 2000, compared to the peak level in 1998, the amount of NPLs remained relatively high. The net NPL ratio on a 6-month classification basis reduced slightly from 6.4% as of end-December 1999 to 6.3% as of end-December 2000. The asset quality of the banking sector worsened during the course of 2001, reflecting the increasing difficulties in the economic environment. The NPL ratio, on actual basis, increased by 2.2% from 7.1% at the end of 2000 to 9.3% at the end of 2001. The NPL ratios based on 3-month classification and 6-month classification rose to 11.5% and 8.1%, respectively. The NPLs, on actual basis, rose by RM14 billion to RM66.6 billion and the NPLs on the 6-month classification amounted to RM60.7 billion at the end of 2001, both of which exceeded the level of the record-high NPL in 1998. With the prolonged economic stagnation of both the Malaysian economy as well as the world economy, the banking sector was expected to operate in a more competitive and severe environment. The NPL ratio in the banking system as a whole has decreased, and it was 7.8% for 3-month classification at the end of 2004. However, it still exceeded 3.3%: the level of 1996. <Individual financial institutions> In terms of the performance of different banking institutions, both commercial banks and finance companies were found to experience decline in their NPL ratios on a net basis, while the merchant banks could not reduce the NPL ratio in 1999. The net NPL ratio for commercial banks based on both 3-month and 6-month classifications declined in 1999. For the finance

13
companies, their net NPL ratio showed significant improvement. The actual NPL ratio, on the net basis, declined from 14.0% as of end-1998 to 9.7% as of end-1999. The net NPL ratio based on both 3-month and 6-month classifications declined from 21.8% as of end-1998 to 16.3% as of end-1999, and from 12.2% to 8.6%, respectively. The net NPL ratio for the merchant banks, however, remained high during 1999. The actual NPL ratio increased from 11.5% as of end-1998 to 12.7% as of end-1999 on a net basis. The net NPL ratio based on the 6-month classification also increased from 10.9% as of end-1998 to 12.3% as of end-December 1999. The net NPL ratio based on the 3-month classification still exceeded 20% and was 23.46% by end-December 1999. NPLs in the banking sector decreased from RM59 billion at the end of 1998 to RM51 billion at the end of 1999. The loan loss provisions (interest-in-suspense, specific provisions, and general provisions) of the banking system did not decline. They increased slightly from RM33.1 billion as of end-1998 to RM33.2 billion as of end-1999, due to increases in interest-in-suspense. Interest-in-suspense outstanding increased by RM619.4 million; in line with continued suspension of interest payments on the NPLs in the banking system. General provisions declined by RM553.7 million due to the reduction in the loan base of the banking system. Specific provisions outstanding of the banking system remained relatively stable.

14
With regard to resolution of the NPLs of small and medium scale enterprises, progress remained relatively slow. BNM launched the Enterprise Program to support viable businesses in order to hasten the speed of resolving the SME loans. The program had the following goals: (1) Application of standard loan restructuring guidelines with business, and (2) Provision of funding support to viable SMEs. New loans extended under the program were partly guaranteed by the Government through the Credit Guarantee Corporation Malaysia Berhad. The credit risk share was 70% for the Credit Guarantee Corporation Malaysia Berhad and the remaining 30% for the lending institutions.
The strategies implemented in 1998, 1999 and 2000 to strengthen the banking sector, especially

15
the resolution of NPLs in the banking system, have been very difficult to evaluate. There were several impacts of the NPL resolution on NPL restructuring aside from the institutional arrangements implemented by the Government. Despite the measures undertaken for rehabilitation of NPLs prior to 1999, gross NPLs on actual basis in the banking sector had turned and begun to rise during the course of 2001. The rate of increase in NPL ratio was around 2% in commercial banks. The NPL ratio in merchant banks, however, was incredibly high: 21.7% on actual basis, 26.2% on 3-month basis, and 21.6% on 6-month basis. The resolution of NPLs in commercial banks and merchant banks was very slow.
By the end of 2004, the NPL ratio in all commercial banks, finance companies, and merchant banks decreased to some extent. The NPL ratio on 3-month basis was 6.8% for commercial banks, 11.3% for finance companies, and 19.4% for merchant banks. Although there was the NPL ratio in commercial banks, it was difficult to rate the resolution of NPLs in finance companies and merchant banks as satisfactory.

16
Table 2-2: Non-performing Loans (as of end of year) 1996 1997 1998 1999 2000
Classification**** Classification**** Classification****
Group of Banks Actual* Actual* Actual* 3-month 6-month Actual* 3-month 6-month Actual* 3-month 6-month Commercial Banks
Non-performing loans** 8163.0 14508.0 37253.5 44896.0 32082.0 33451.4 40267.1 29182.6 35441.9 40640.9 31329.5 Net NPL ratio(%)*** 3.6 5.0 7.3 9.7 5.9 6.5 8.8 5.4 6.4 8.1 5.3
Finance companies Non-performing loans** 4002.0 8497.0 17901.3 25122.0 16320.0 14415.2 19073.4 13570.5 14255.4 17725.3 13481.5
Net NPL ratio(%)*** 4.7 7.8 14.0 21.8 12.2 9.7 16.3 8.6 9.3 13.4 8.8 Merchant banks
Non-performing loans** 315.0 1039.0 4122.1 7197.0 3888.0 3764.5 5589.9 3487.5 3018.4 4289.7 3059.6 Net NPL ratio(%)*** 1.7 4.5 11.5 25.6 10.9 12.7 23.4 12.3 10.5 18.2 10.9
Banking System Non-performing loans** 12480.0 24044.0 59276.9 77215.0 52294.0 51631.1 64930.3 46240.6 52715.7 62655.8 47870.7
Net NPL ratio(%)*** 3.3 5.7 9.0 13.2 7.6 7.4 11.0 6.4 7.1 9.6 6.3
Source: Bank Negara Malaysia Annual Report, various issues. * Loans classified as NPL based on individual banking institutions' NPL classification policy; i.e. 3-month or 6-month classification. ** RM million *** Net NPL ratio=(NPL less IIS less SP) / (Gross loans less IIS less SP) x 100%. IIS: interest in suspense, SP: special provision **** The default period for classifying a loan as non-performing was reduced from six months to three months from January 1 1998, then the default period for classifying a loan as non-performing was lengthened from three months to six months from September 1 1998.

17
Table 2-3: Banking System: Loan Loss Provision (RM million) June 1997 Dec 1997 December 1998 December 1999 December 2000
Classification** Classification** Classification** Group of Banks Actual* Actual* Actual* 3-month 6-month Actual* 3-month 6-month Actual* 3-month 6-month
Commercial Banks Interest-in-suspense Specific provision General provision
1825 1935 5138
6216 1805 3268
6501 4087 12602
6555 4201 13348
5693 3643 11704
6376 4845 11317
6419 4934 11493
5034 4397 10179
6367 5598 11268
6339 5967 11436
5217 5281 10438
Total provision Non-performing loans
8893 9233
11289 14508
23190 37254
24104 44896
21040 32086
22538 33451
22846 40267
19610 29183
23233 35442
23742 40641
20936 31330
Finance companies Interest-in-suspense Specific provision General provision
843 963 1530
1788 990 1923
1824 2193 3601
1824 2640 3822
1824 2237 3551
1442 2031 5188
1211 2092 4894
1259 2010 5194
1671 2343 4765
1664 2476 4930
1681 2226 4469
Total provision Non-performing loans
3336 4240
4701 8497
7618 17901
8286 25122
7612 16320
8661 14415
8197 19073
8463 13571
8779 14255
9070 17725
8376 13482
Merchant banks Interest-in-suspense Specific provision General provision
63 95 397
443 91 211
446 463 1274
446 624 1416
446 456 1189
415 481 1084
407 521 998
408 441 880
396 506 819
355 566 810
356 821 781
Total provision Non-performing loans
555 433
745 1039
2183 4122
2486 7197
2091 3888
1980 3765
1926 5590
1729 3488
1721 3018
1731 4290
1958 3060
Banking System Interest-in-suspense Specific provision General provision
2731 2944 7065
8447 2886 5402
8771 6743 17477
8825 7465 18586
7963 6336 16444
8234 7358 17588
8037 7547 17384
6700 6848 16254
8434 8447 16853
8358 8439 17176
7253 8028 15657
Total provision Non-performing loans
12789 13906
16735 24044
32991 59277
34876 77215
30743 52294
33180 51631
32968 64930
29802 46242
33734 52715
33973 62656
30938 47872
December 2001 December 2002 December 2003 December 2004
Classification** Classification** Classification** Classification**
Group of Banks Actual* 3-month 6-month Actual* 3-month 6-month Actual* 3-month 6-month Actual* 3-month 6-month Commercial Banks
Interest-in-suspense Specific provision General provision
6632 14134 6126
6662 13976 6134
6436 13189 5417
6623 12939 6421
6686 12971 6424
6483 12392 5503
6201 11763 6896
6028 10871 5845
6373 11463 8415
6094 10384 7118
Total provision Non-performing loans
26892 46935
26772 51579
25041 41683
25983 43937
26081 47957
24378 40012 24860
44542 22744 37562 26251
46214 23596 38869
Finance companies Interest-in-suspense Specific provision General provision
2641 4971 1823
2849 5095 1803
2580 4840 1803
2534 4081 1820
2622 4210 1820
2486 3804 1820
2504 3617 1906
2314 3206 1906
1491 2059 830
1413 1927 830
Total provision Non-performing loans
9434 15266
9747 18781.8
9223 14602.9
8435 14394
8652 17345
8110 13487 8027
16026 7426
12841 4380 9496
4170 7424
Merchant banks Interest-in-suspense Specific provision General provision
523 1057 379
540 1074 341
523 1017 375
534 954 276
547 969 277
534 954 277
453 603 241
442 589 241
401 496 236
391 497 236
Total provision Non-performing loans
1959 4415.8
1954 5029.3
1914 4373.9
1764 3989
1793 4458
1765 3989 1297
3205 1272 2819 1133
2569 1124 2340
Banking System Interest-in-suspense Specific provision General provision
9796 20162 8327
10051 20145 8277
9538 19046 7594
9691 17974 8517
9855 18150 8521
9503 17150 7600
9158 15983 9043
8784 14666 7992
8265 14018 9481
7898 12808 8184
Total provision Non-performing loans
38285 66616.6
38474 75390
36178 60659.5
36182 62320
36526 69760
34253 57488 34184
65774 31442 54798 31764
60431 28890 50302
Source: Bank Negara Malaysia Annual Report, various issues. * Loans classified as NPLs based on individual banking institutions' NPL classification policy; i.e. 3-month or 6-month classification. ** The default period for classifying a loan as non-performing was reduced from six months to three months from January 1 1998, then the default period for classifying a loan as non-performing was lengthened from three months to six months from September 1 1998.

18

19
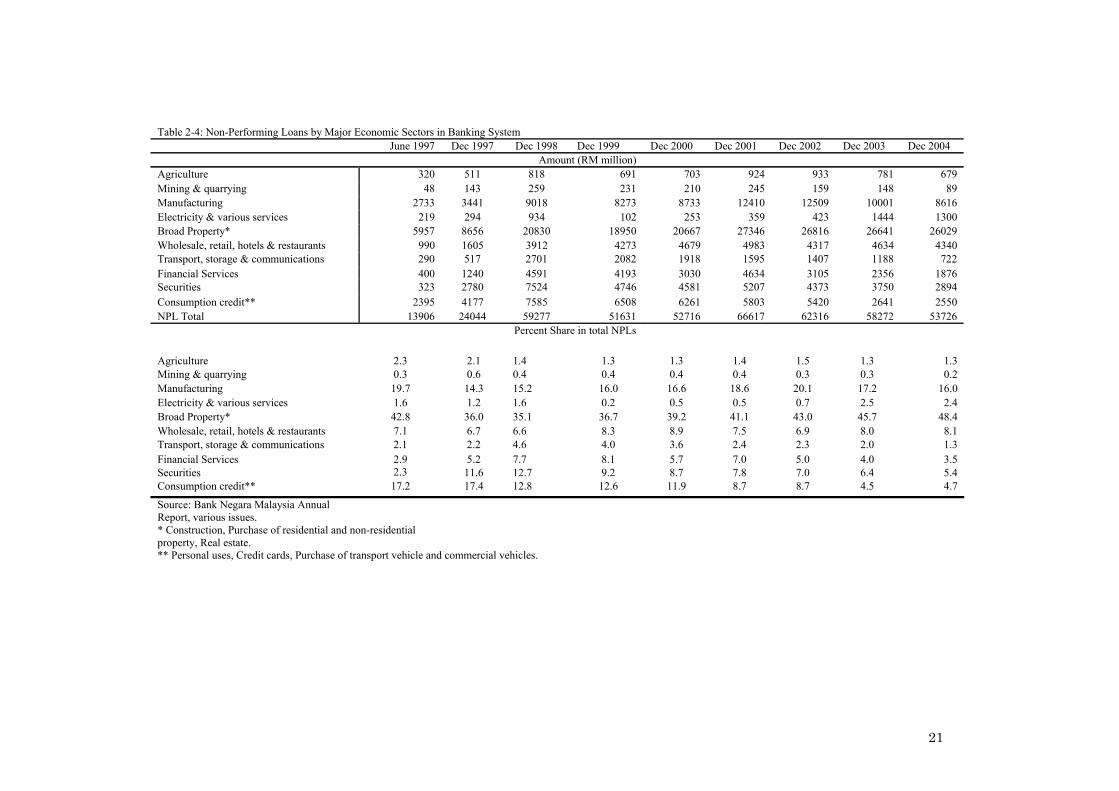
<Sectoral Breakdown> In terms of major economic sectors, the bulk of the banking system’s NPLs remained concentrated in the manufacturing, broad property and consumption credit sectors.
NPLs in the manufacturing sector peaked in 1998 then declined during 1999. However, the level of NPLs grew by 5.6% in 2000, which was still below the level in 1998. The percentage share in the total NPLs, however, increased from 16.0% at the end of 1999 to 16.6% at the end of 2000, 1.4 points above the level in 1998. The NPLs in the sector were mainly concentrated on loans granted to SMEs. Although several measures have been introduced by the Government to assist SME borrowers, such as the Enterprise Program, the progress in resolution of NPLs in SMEs was relatively slow due to some extent to the slowdown of economic recovery.
The NPLs of the broad property sector included NPLs in construction, purchase of residential and non-residential property, and real estate sectors. As of December 2000, the total amount of NPLs in the sector increased by RM1717 million and accounted for 39.2% of total NPLs in the banking sector. The NPL ratio of the sector grew by 2.5% from 36.7% as of December 1999. Considering the contraction in outstanding loans to this sector in the aftermath of crisis, the increase in level of NPLs as well as the share in total NPLs should be dealt with as early as possible. NPLs in this sector were expected to worsen further, especially when the construction sector as a whole was not projected to register a positive growth.

20
NPLs in the consumption credit sector as a whole, however, decreased from 12.6% as of end-1999 to 11.9% as of December 2000. The level of NPLs declined by RM247 million to RM6261 million at the end of 2000. From December 1998, the gross NPLs for this sector declined by 18%.
Reflecting the negative impact of the world economy on the Malaysian economy, NPLs in many sectors increased during 2001. The most severely affected sectors were manufacturing, broad property and financial services. The total increase in NPLs in these three sectors from 2000 to 2001, RM12 billion, accounted for 86% of the total increase in NPLs in the RM14 billion banking system. Percentage share in total NPLs in manufacturing, broad property and financial services rose by about 2% to 18.6%, 41.1%, and 7.9%, respectively. The increase of NPLs was mainly due to the persistent economic slowdown and partly due to the effects of September 11 on the world economy.
By the end of 2004, total NPLs in each sector had decreased. However, when the percentage share of NPLs was examined individually, it showed an increase in the wholesale, retail, hotels & restaurants, as well as the consumption credit sectors. Broad property sector had the largest percentage share in NPLs within the banking sector and, in addition, it did not show a decrease at all.
21
Table 2-4: Non-Performing Loans by Major Economic Sectors in Banking System
June 1997 Dec 1997 Dec 1998 Dec 1999 Dec 2000 Dec 2001 Dec 2002 Dec 2003 Dec 2004 Amount (RM million)
Agriculture 320 511 818 691 703 924 933 781 679 Mining & quarrying 48 143 259 231 210 245 159 148 89 Manufacturing 2733 3441 9018 8273 8733 12410 12509 10001 8616 Electricity & various services 219 294 934 102 253 359 423 1444 1300 Broad Property* 5957 8656 20830 18950 20667 27346 26816 26641 26029 Wholesale, retail, hotels & restaurants 990 1605 3912 4273 4679 4983 4317 4634 4340 Transport, storage & communications 290 517 2701 2082 1918 1595 1407 1188 722 Financial Services 400 1240 4591 4193 3030 4634 3105 2356 1876 Securities 323 2780 7524 4746 4581 5207 4373 3750 2894 Consumption credit** 2395 4177 7585 6508 6261 5803 5420 2641 2550 NPL Total 13906 24044 59277 51631 52716 66617 62316 58272 53726
Percent Share in total NPLs Agriculture 2.3 2.1 1.4 1.3 1.3 1.4 1.5 1.3 1.3 Mining & quarrying 0.3 0.6 0.4 0.4 0.4 0.4 0.3 0.3 0.2 Manufacturing 19.7 14.3 15.2 16.0 16.6 18.6 20.1 17.2 16.0 Electricity & various services 1.6 1.2 1.6 0.2 0.5 0.5 0.7 2.5 2.4 Broad Property* 42.8 36.0 35.1 36.7 39.2 41.1 43.0 45.7 48.4 Wholesale, retail, hotels & restaurants 7.1 6.7 6.6 8.3 8.9 7.5 6.9 8.0 8.1 Transport, storage & communications 2.1 2.2 4.6 4.0 3.6 2.4 2.3 2.0 1.3 Financial Services 2.9 5.2 7.7 8.1 5.7 7.0 5.0 4.0 3.5 Securities 2.3 11.6 12.7 9.2 8.7 7.8 7.0 6.4 5.4 Consumption credit** 17.2 17.4 12.8 12.6 11.9 8.7 8.7 4.5 4.7
Source: Bank Negara Malaysia Annual Report, various issues.
* Construction, Purchase of residential and non-residential property, Real estate.
** Personal uses, Credit cards, Purchase of transport vehicle and commercial vehicles.

22
<Summary> The level of NPLs was substantially lower than those in Thailand and Indonesia. This can be attributed to three factors. First, Danaharta, the national asset management company, was created in an early stage of the financial crisis, and Danaharta purchased NPLs from financial institutions.

23
Second, macroeconomic policy became expansionary in early August 1998,7 and some fiscal
spending resumed much earlier than that in other countries. Third, the classification standard of NPLs was relaxed from 3-months overdue to 6-months overdue in September 1998. Since the third factor served less substantial purpose, the first and second factors should be credited as better crisis management.
Despite the several measures undertaken for rehabilitation of NPLs prior to 1999, the NPLs in the banking system as a whole did not show an improvement: NPLs in most of the financial institutions that increased in 1998 turned around and declined in 1999. However, resolution of NPLs slowed down during 2000: the actual NPL ratio remained constant, in general. By contrast, the increase in NPLs continued in 2001. The NPLs in the banking sector rose dramatically by RM13 billion on actual basis from the end of 2000 to the end of 2001. The NPL ratio in merchant banks was most striking in that it increased from 10.5% as of the end of 2000 to 21.7% as of the end of 2001, on actual basis. By the end of 2004, the NPL ratio in the banking sector, as well as the financial institutions, decreased significantly.
Regarding the sectoral breakdown of NPLs, most of the increase in NPLs in the banking system came from manufacturing, broad property and financial services. Resolution of NPLs in these sectors, specifically rehabilitation of SMEs, would be critical in bringing down the total level of NPLs. 3. Loan Activities, and Capital Adequacy It has been well recognized, especially after the financial turmoil in the region following the Thai baht crash and its subsequent contagion effects, that the mismatch between long-term capital investments and short-term funding would increase the vulnerability of the banking system. To avoid undue pressure on the banking institutions, Bank Negara Malaysia (BNM) required in 1999 that any new capital injection performed by the shareholders of banking institutions be funded through non-debt sources or extremely long-term debt instruments. In addition, banking institutions were no longer allowed to lend to their shareholders with controlling and/or influential interest. These new measures complemented the existing rules of
7 Official data released on August 27, 1998 revealed that the economy had slipped into deep recession. Therefore, BNM relaxed monetary policy that day. These measures included; (1) reduction of BNM intervention rate from 10% to 9.5%, and (2) reduction of statutory reserve requirement (SRR) from 8% to 6%.

24
prohibiting banking institutions from lending to their directors and officers. This prohibition was aimed at curtailing any potential misuse and irregular practices by the shareholders. During the Asian financial crisis, it was evident that poor asset quality as well as the absence of sound risk management in banking institutions could threaten the solvency of the institutions and further threaten economic activities as a whole. It was necessary to establish prudent risk management in order to maintain asset quality in the banking system, thereby minimizing the risk of potential bank failures. BNM issued guidelines on credit risk management. They denoted specific requirements and practices that banking institutions ought to adopt. The objectives of the guidelines were to ensure adequate supervision, to control risks in the banking institutions, and to include credit exposure measurements, minimum capital funds requirements, disclosure requirements, and guidelines on liquidity. Details are in section 5. The limit on credit facilities to a single customer was also tightened from 30% to 25% of capital funds.
Outstanding loans of the banking system, including loans sold to Cagamas and Danaharta, rose from RM426.6 billion as of end-1998 to RM431.0 billion as of end-1999 and then to RM454.2 billion as of end-2000. Including loans written-off and loan conversion into equity, total outstanding loans increased by an annual rate of 6.8%.
No minimum loan growth target was set for the year 2000 by Bank Negara Malaysia. Instead, tax incentives were accorded to those banking institutions that registered an annual loan growth of 10% or more for the calendar year 2000. For these institutions, net interest income from loans and business income derived from Islamic financing activities in excess of 8% would be exempted from taxable income. Approximately 25 banking institutions (including two Islamic banks) were eligible for the tax incentives.

25
Table 2-5: Loans sold to Danaharta (RM million)
as of end-1998 as of end-1999 as of end-2000 as of end-2001 as of end-2002 Performing Total Performing Total Performing Total Performing Total Performing
Group of Banks NPLs Loans Loans NPLs Loans Loans NPLs Loans Loans NPLs Loans Loans NPLs Loans Commercial Banks 10571.5 573.7 11145.2 22707.6 6205.4 28913.0 24032.9 6357.4 30660.3 24665.2 6743.0 31408.1 24665.2 6743.0 Finance companies 763.1 126.9 890.0 3172.2 267.1 3439.3 3536.1 274.3 3810.4 3261.3 274.3 3535.6 3261.3 274.3 Merchant Banks 877.5 128.5 1005.9 2757.6 259.6 3017.2 2964.1 286.9 3251.0 2892.4 286.9 3179.3 2863.6 286.9 Banking System 12212. 1 829.1 13041.1 28637.4 6732.1 35369.5 30533.1 6918.6 37721.7 30818.9 7304.2 38123.0 30790.1 7304.2
Source: Bank Negara Malaysia Annual Report, various issues.

26
4. Management of Banking Sector The liquidity problems with large NPLs in some banking institutions deterred the banking institutions on the recovery track from expanded lending activities after the financial crisis in 1997. The primary objective of Bank Negara Malaysia was to introduce the Two-tier Regulatory System (TTRS) for commercial banks in 1994. The system extended to financial companies and merchant banks in 1996, as it consolidated the banking industry by way of mergers (stronger institutions merged with the weaker ones).8
However, in 1997, only three mergers were instituted: DCB Bank with Kwong Yik Bank,9 DCB Finance with Kwong Yik Finance, and United Overseas Bank with Chung Khiaw Bank. Both DCB Bank and Kwong Yik Bank were tier-1 institutions.10 The tier-2 system did not produce the desired results of consolidation of the banking system by enhancing mergers between tier-1 and tier-2 institutions. The tier-2 system did not meet the primary objective; the smaller banks in tier-2 instead increased their capital to become tier-1 status. In order to secure a sufficient return on capital, several tier-2 banks had been aggressively lending. The Two-tier Regulatory System (TTRS) for banking institutions was abolished on April 10, 1999.
Due to the severe impact of the financial crisis, the Government took stronger measures to promote (force) merging of banking institutions. Five finance companies were identified to be the anchor companies of mergers. It was envisaged that, by March 31, 1998, the respective finance companies should be identified and they would agree on the merger partners as well as the terms and conditions of the mergers. However, the effectiveness of this policy remained doubtful. The market’s perception was that strong finance companies would suffer as they merged with the weaker ones.
In fact, some banking institutions suffered substantial losses from high levels of NPLs during 1998. In order to prevent further deterioration of these banking institutions, BNM assumed control over the operations of four banking institutions: Kewangan Bersatu Berhad, MBf Finance Berhad, Sabah Finance Berhad and Sime Merchant Bankers Berhad. With the 8 Since the mid-1980s, only two market-oriented mergers were successfully implemented, between Kwong Yik Bank Berhad and DCB Bank Berhad and between Chung Khiaw Bank (Malaysia) Berhad and United Overseas Bank (Malaysia) Berhad. 9 Rassid Hussain Bank (RHB) was formed out of a merger between DCB Bank and Kwong Yik Bank as the second largest bank and later agreed to buy Sime Bank, which suffered a large loss for the second half-year of 1997. 10 As of the end of 1997, 10 commercial banks were accorded tier-1 status.

27
exception of MBf Finance Berhad, control over the operations and management of the three banking institutions remained under BNM. The three banking institutions were also restricted from engaging in new lending activities. As part of the rescue operations, Kewangan Bersatu Berhad and Sabah Finance Berhad were absorbed by Mayban Finance Berhad and Multi-Purpose Bank Berhad, respectively. Pengurusan Danaharta Nasional Berhad (Danaharta) was set up in 1998 to manage the distressed assets of the banks and institutions prior to the merger. The capital position of MBf Finance Berhad was resolved through capital injection amounting to RM2.3 billion in the form of tier-1 capital by Danamodal Nasional Berhad (Danamodal). Danamodal also appointed its nominees to oversee its investment, as well as to enhance the effectiveness of the board and management of MBf Finance Berhad. Reacting to a worsening situation in the banks, the Government announced that five institutions (two banks and three finance companies) should recapitalize in February 1998, based on their positions at the end of 1997. On March 3, 1998, BNM revealed that Sime Bank, the country’s sixth largest bank, had lost RM1.6 billion (US$420 million) in the second half of the previous year and needed US$320 million in new capital. It also disclosed that Bank Bumiputra, the second largest bank, needed US$200 million in new capital. BNM also announced that two small finance companies were operating in difficulties. In 1999, two of the larger domestic commercial banks, Bank Bumiputra Malaysia Berhad and Sime Bank Berhad, merged. Sime Bank Berhad was taken over by RHB Bank Berhad and Bank Bumiputra Malaysia Berhad was absorbed by Bank of Commerce (M) Berhad. These two mergers, Sime Bank Berhad and Bank Bumiputra Malaysia Berhad, were completed on June 30 1999 and September 30 1999, respectively. Table 4-1: Number of Banks (at the end of reporting year)
Group of Banks 1996 1997 1998 1999 2000 2001 2002 2003 2004 Commercial Banks 37 35 35 33 31 25 24 23 23
Domestic banks 23 22* 22 20*** 17 11 11 10***** 10****** Foreign banks 14 13** 13 13 14 14 13**** 13 13
Finance companies 40 39 33 23 19 12 11 11 6 Merchant banks 12 12 12 12 12 10 10 10 10 Source: Bank Negara Malaysia: Annual Report and Financial Sector Stability, The Masterplan, various issues. * DCB Bank Berhad and Kwong Yik Bank Berhad were merged in 1997, after which DCB was renamed as RHB Bank Berhad. ** Chung Khian Bank Berhad (CKB) merged with United Overseas Bank Berhad in 1997. *** Sime Bank Berhad was taken over by RHB Bank Berhad on June 30 1999 and ****Bank Bumiputra Malaysia Berhad was absorbed by Bank of Comemrce Berhad on September 30 1999. Overseas Union Bank merged with United Overseas Banjk(malaysia)Berhad with effect from Feb. 2, 2002. *****RHBBank Berhad merged with Bank Utama (Malaysia) Berhad with effect from May 1, 2003. ******Alliance Bank Malaysia Berhad merged with Alliance Finance Berhad with effect from 1 Aug 2004. EON Bank Berhad marged with EON Finance Berhad with effect from Nov. 1, 2005. Hong Leong Bank Berhad merged with Hong Leong Finance Berhad with effect from Aug. 1, 2004. Malayan Banking Berhad merged with Mayban Finance Berhad with effect from Oct. 1, 2004. Public Bank Nerhad merged with Public Finance Berhad.

28
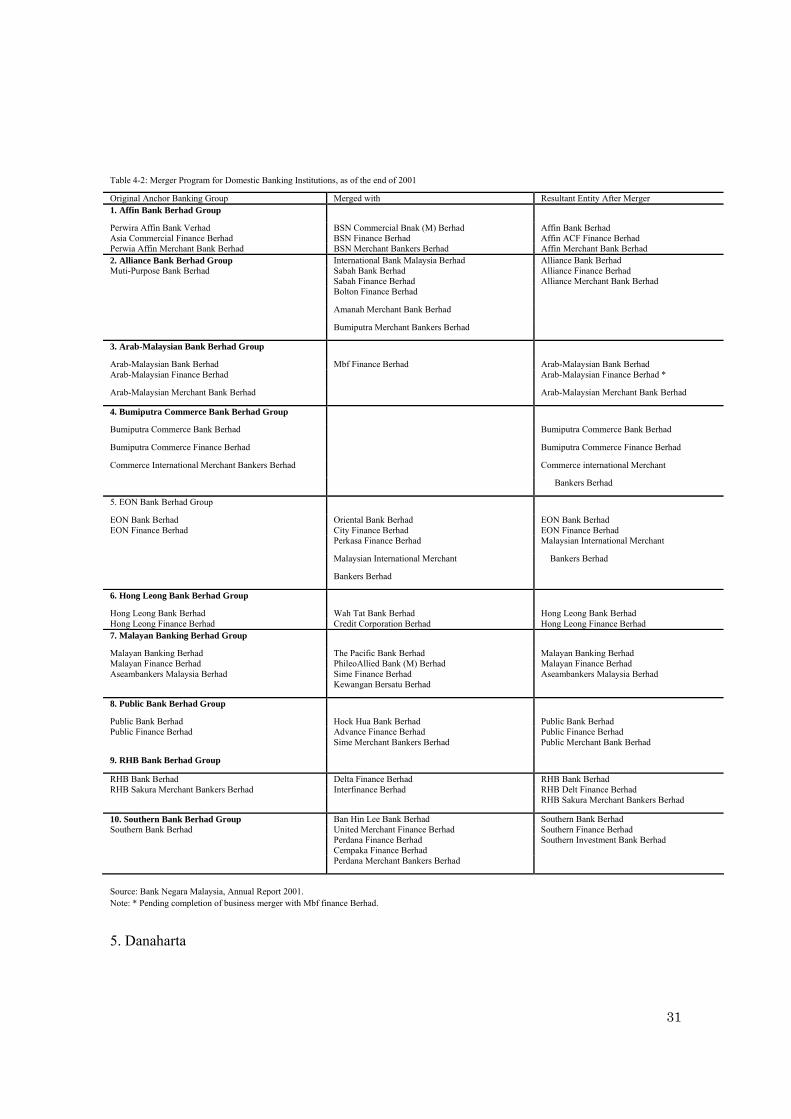
<Was the Government-led Merger Plan Successful?> The merger program for the finance company industry initiated in 1998 was extended to the domestic banking sector as a whole in 1999. On July 27, 1999, it was announced that all domestic banking institutions should be restructured so that six banking groups would be formed. BNM chose a leader company in each group as an anchor. All banking institutions were required to approve the plan by the end of September 1999. There was criticism that the grouping and the choice of a leader bank was politically motivated rather than based on efficiency. In addition, there remained uncertainty over the impact of mergers on the asset quality of the newly formed groups, and particularly on the anchor companies. The six anchor companies had their own NPLs, in addition to those of the merger partners. The plan was finally frozen at the end of September 1999. Regarding the unsuccessful plan, the Government announced a new merger plan: all domestic banking institutions forming merger groups should choose their own leaders in each group by the end of January 200l. In response to this approach, approval was granted for the formation of 10 banking groups. It was also Government’s intention to avoid the turmoil in financial markets due to the drastic reduction of financial institutions. The 10 anchor banks were: Malayan Banking Berhad, RHB Bank Berhad, Public Bank Berhad, Bumiputra-Commerce Bank Berhad, Multi-Purpose Bank Berhad, Hong Leong Bank Berhad, Perwira Affin Bank Berhad, Arab-Malaysian Bank Berhad, Southern Bank Berhad and EON Bank Berhad. Each bank had a

29
minimum of RM2 billion in shareholders’ funds and an asset base of at least RM25 billion. Among these 10 anchor banks, the asset quality of Hong Leong Bank Berhad was the market’s top concern. With the formation of these 10 banking groups, the number of domestic banking institutions reduced substantially to 29 banking institutions (10 commercial banks, 10 finance companies and 9 merchant banks).
By the end of December 2000, progress of the merger program was not functioning as expected. Only one banking institution had completed its merger process by March 1, 2000. The other institutions were given approval to commence negotiations with other anchor banking groups. The merger negotiations of Arab-Malaysian Bank Berhad as an anchor with other banking institutions failed. The minimum capital funds unimpaired by losses for domestic banking groups were increased to RM2 billion to further strengthen the capital base of the banking groups, while foreign banking institutions were required to increase their minimum capital funds to RM 300 million by December 31, 2001. By the first quarter of 2001, only one domestic banking group and five foreign banking institutions complied with the new minimum capital funds requirement. Initiated in 1999, the merger program for domestic banking institutions was expected to be completed by 2000 and was finally executed in 2001. The 10 anchor banks that emerged had to comply with all the requirements for anchor bank status, such as minimum capitalization, total asset size, and other prudential requirements. The focus of the domestic banking groups entered the next stage to complete the business integration processes and rationalization exercises, e.g., branch, workforce, etc.
With regard to mergers, it is essential to understand that the consolidation of the banking system cannot be attained through only mergers. Furthermore, it is not clear if there are a sufficient number of healthy banks with shareholders who are willing to invest in weaker institutions, given the asset quality situation. The process of liberalization to allow entry of foreign investors, as well as foreign banks, is restricted. The Government-led strong restructuring plan was temporarily necessary during severe times but, as shown in Barth, Cario and Levine (2001), the relationship between the tightness of the restrictions placed on bank activity and the inefficiency of bank management was important, and the process should be directed to market-oriented restructure. Otherwise, the Government-led, and often Government-protected, banking system would very likely to be exposed to a banking crisis.

30
For all the debate about the Government-led restructure, the consolidation through mergers were still one of the useful strategies. Between 2002 and 2004, there was a series of bank mergers. In 2002 and 2003, there were two mergers: Overseas Union Bank merged with United Overseas Banjk(malaysia)Berhad with effect from February 2, 2002. RHB Bank Berhad merged with Bank Utama (Malaysia) Berhad with effect from May 1, 2003. In 2004, several announcements on planned mergers were released. Alliance Bank Malaysia Berhad merged with Alliance Finance Berhad with effect from August 1, 2004. EON Bank Berhad merged with EON Finance Berhad with effect from November 1, 2004. Hong Leong Bank Berhad merged with Hong Leong Finance Berhad with effect from August 1, 2004. Malayan Banking Berhad merged with Mayban Finance Berhad with effect from October 1, 2004. Public Bank Nerhad was planned to merge with Public Finance Berhad.
31
Table 4-2: Merger Program for Domestic Banking Institutions, as of the end of 2001
Original Anchor Banking Group Merged with Resultant Entity After Merger 1. Affin Bank Berhad Group Perwira Affin Bank Verhad BSN Commercial Bnak (M) Berhad Affin Bank Berhad Asia Commercial Finance Berhad BSN Finance Berhad Affin ACF Finance Berhad Perwia Affin Merchant Bank Berhad BSN Merchant Bankers Berhad Affin Merchant Bank Berhad 2. Alliance Bank Berhad Group International Bank Malaysia Berhad Alliance Bank Berhad
Sabah Bank Berhad Alliance Finance Berhad Muti-Purpose Bank Berhad Sabah Finance Berhad Alliance Merchant Bank Berhad
Bolton Finance Berhad
Amanah Merchant Bank Berhad Bumiputra Merchant Bankers Berhad 3. Arab-Malaysian Bank Berhad Group Arab-Malaysian Bank Berhad Mbf Finance Berhad Arab-Malaysian Bank Berhad Arab-Malaysian Finance Berhad Arab-Malaysian Finance Berhad *
Arab-Malaysian Merchant Bank Berhad Arab-Malaysian Merchant Bank Berhad
4. Bumiputra Commerce Bank Berhad Group Bumiputra Commerce Bank Berhad Bumiputra Commerce Bank Berhad
Bumiputra Commerce Finance Berhad Bumiputra Commerce Finance Berhad
Commerce International Merchant Bankers Berhad Commerce international Merchant
Bankers Berhad
5. EON Bank Berhad Group EON Bank Berhad Oriental Bank Berhad EON Bank Berhad EON Finance Berhad City Finance Berhad EON Finance Berhad
Perkasa Finance Berhad Malaysian International Merchant
Malaysian International Merchant Bankers Berhad
Bankers Berhad 6. Hong Leong Bank Berhad Group Hong Leong Bank Berhad Wah Tat Bank Berhad Hong Leong Bank Berhad Hong Leong Finance Berhad Credit Corporation Berhad Hong Leong Finance Berhad 7. Malayan Banking Berhad Group Malayan Banking Berhad The Pacific Bank Berhad Malayan Banking Berhad Malayan Finance Berhad PhileoAllied Bank (M) Berhad Malayan Finance Berhad Aseambankers Malaysia Berhad Sime Finance Berhad Aseambankers Malaysia Berhad
Kewangan Bersatu Berhad 8. Public Bank Berhad Group Public Bank Berhad Hock Hua Bank Berhad Public Bank Berhad Public Finance Berhad Advance Finance Berhad Public Finance Berhad
Sime Merchant Bankers Berhad Public Merchant Bank Berhad
9. RHB Bank Berhad Group RHB Bank Berhad Delta Finance Berhad RHB Bank Berhad RHB Sakura Merchant Bankers Berhad Interfinance Berhad RHB Delt Finance Berhad
RHB Sakura Merchant Bankers Berhad
10. Southern Bank Berhad Group Ban Hin Lee Bank Berhad Southern Bank Berhad Southern Bank Berhad United Merchant Finance Berhad Southern Finance Berhad
Perdana Finance Berhad Southern Investment Bank Berhad Cempaka Finance Berhad
Perdana Merchant Bankers Berhad Source: Bank Negara Malaysia, Annual Report 2001. Note: * Pending completion of business merger with Mbf finance Berhad. 5. Danaharta

32
<Objective> Owned by the Ministry of Finance, Pengurusan Danaharta Nasional Berhad (Danaharta) was established under the Companies Act 1965 on June 20, 1998. Danaharta’s primary goals were to remove bad assets and to undertake strategic investments in financial institutions. Danaharta was an asset management company that focused on management of the assets and loan restructuring to maximize the recovery value of assets.
There were a variety of approaches in response to Government assumption of financial losses in the banking system.11 The options were: direct injection of capital into banks in the form of subordinated debt; provision of loss-sharing arrangements on some pools of assets; grants of Government loans, etc. The advantages and disadvantages of these approaches were summarized in Klingebiel (2001). In recent years, countries undergoing crises have used publicly-owned asset management companies (AMC). The AMCs can be classified into two types. The first type is to help and expedite corporate restructuring, whereas the second type is to dispose of assets acquired or transferred to the Government during the crisis. The latter is also known as a rapid asset disposition vehicle.
Danaharta began its acquisition of NPLs in August 1998. As Danaharta moved from the establishment phase to the management phase, the composition of its NPLs also changed from unresolved to recovery-processed NPLs. Based on the current pace of resolution, Danahrta had been on track to achieve its targeted unwinding by 2005.
<Operations> To encourage banks to sell their NPLs to Danaharta, Bank Negara Malaysia (BNM) provided
several incentives, as follows: (1) Banking institutions with a gross NPL ratio exceeding 10% were required to sell all their eligible NPLs to Danaharta; otherwise, (2) banking institutions would have to write down the value of these loans by 20% below the price Danahrta offered and restructure them; (3) BNM allowed banking institutions to amortize losses resulting from the sale to Danaharta up to five years; (4) Profit sharing arrangements between Danaharta and the selling institution are as follows: Danaharta would share any surplus recovery (after deducting recovery and holding cost) from the sale of the
11 For discussion and survey on banking sector restructuring through public funds, including setting up AMC and direct capital injection, see Enoch, Garcia and Sundararajan (2001).

33
loans/assets with the selling institutions on a 80:20 (selling institution:Danaharta) basis.
Table 5-1: Danaharta
Danaharta: Asset management and disposition
<Asset valuation and selection> Danaharta purchased NPLs that had minimum gross values of at least RM5 million.12 Any security associated with the loan was also transferred to the AMC. Danaharta pays a “fair market value” for the loans. The fair market value was the purchase price determined by Danaharta. Loans could be acquired with or without recourse, and payment periods could be varied as needed. Danaharta indicated that only loans that had value or the potential for value were selected for acquisition.13 Small loans, such as consumer loans and credit cards would be left out. Danaharta looked at all loans held by financial institutions in the country. There was no obligation for any institution to sign an agreement with the AMC, although banking institutions
12 NPLs under RM5 million are to be sold to a special-purpose vehicle. 13 Asset acquisition guideline, in 2. Criteria, “The assets acquired must have value.”

34
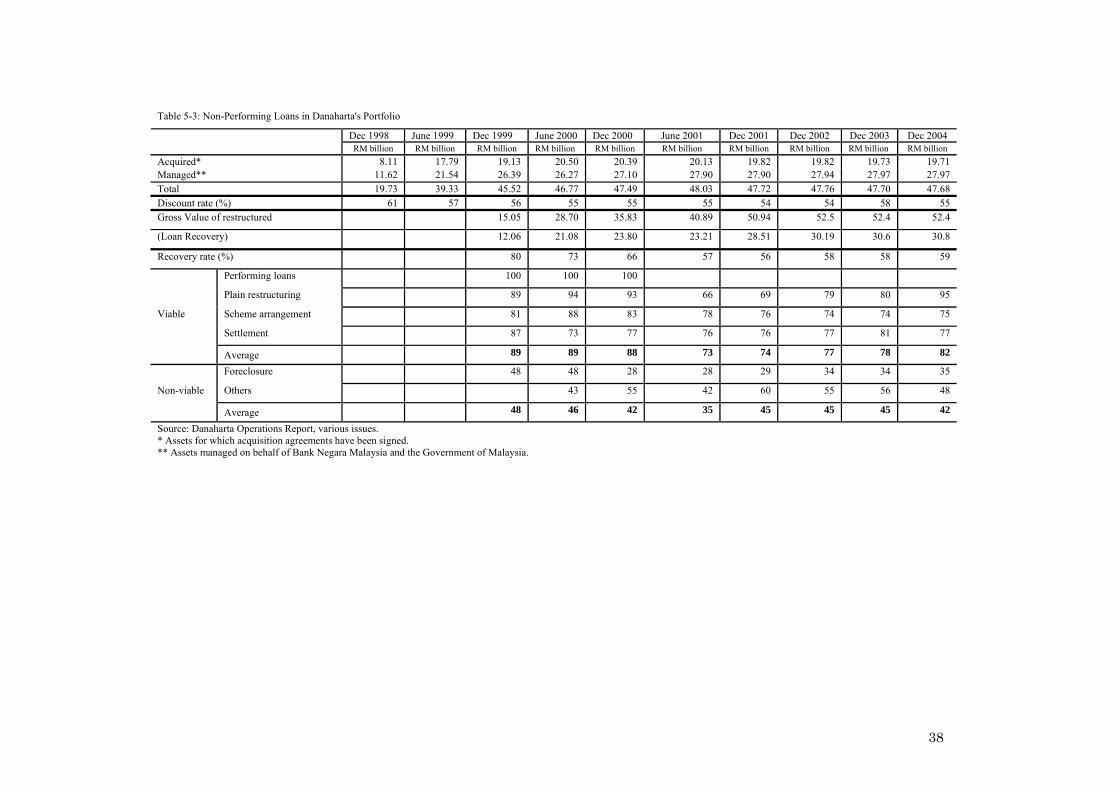
that received capital assistance from Danamodal were required to sell their eligible NPLs to Danaharta. Pricing of loans and the asset acquisition process are important. Private analysts were concerned about Danaharta’s ability to determine a fair market value given the thin markets and uncertain times. While banks were supposed to voluntarily sell their loans to Danaharta, the market believed that banks would be forced to provide the most-likely-to-attract-buyers NPLs at discounted values to Danaharta. On the other hand, banks would be left with many bad NPLs that were unrecoverable at any time. <Loan and Asset Management> At the end of December 1998, Danaharta acquired RM8.11 billion from financial institutions and was managing RM11.62 billion in NPLs from Sime Bank Group and Bank Bumiputra Malaysia Berhad Group on behalf of Bank Negara Malaysia and the Government of Malaysia. The total loan rights amounted to RM19.73 billion. The overall weighted average discount rate for the acquired NPLs was about 61%.14 At the end of June 1999, Danaharta acquired RM17.79 billion from financial institutions and was managing RM21.54 billion of NPLs in respect of Sime Bank Group and Bank Bumiputra Malaysia Berhad Group. Total NPLs under Danaharta’s management amounted to RM39.33 billion. The overall weighted average discount rate for the acquired NPLs was about 57%. As of December 31, 1999, the NPLs with loan rights under the management of Danaharta amounted to RM45.5 billion, of which RM26.39 billion was the loan right of Sime Bank Group and Bank Bumiputra Malaysia Berhad Group. The removal of these NPLs from the banking sector reduced the residual NPL level to 6.6% (based on 6-month classification) as of end-December 1999, from the peak of 9% (based on 6-month classification) as of end-November 1998. The overall weighted average discount rate for the acquired NPLs was about 56%. 14 Discount rate is defined as the Danaharta purchase value divided by book value of selling institutions.

35
5-2: Loans sold to Danaharta (RM million) end-1998 end-1999 end-2000
Group of Banks NPLs Performing Loans Total Loans NPLs Performing Loans Total
Loans NPLs Performing Loans Total Loans
Commercial Banks 10571.5 573.7 11145.2 22707.6 6205.4 28913 24032.9 6357.4 30660.3
Merchant Banks 763.1 126.9 890 3172.2 267.1 3439.3 3536.1 274.3 3810.4
Finance Companies 877.5 128.5 1005.9 2757.6 259.6 3017.2 2964.1 286.9 3251
Banking System 12212.1 829.1 13041.1 28637.4 6732.1 35369.5 30533.1 6918.6 37721.7
end-2001 end-2002
Group of Banks NPLs Performing Loans Total Loans NPLs Performing Loans Total
Loans
Commercial Banks 24665.2 6743 31408.1 24665.2 6743 31408.1 Merchant Banks 3261.3 274.3 3535.6 3261.3 274.3 3535.6
Finance Companies 2892.4 286.9 3179.3 2863.6 286.9 3150.5
Banking System 30818.9 7304.2 38123 30790.1 7304.2 38094.2
Source: Bank Negara Malaysia Annual Report, various issues.
Danaharta embarked on asset management and disposition in 1999. When Danaharta acquired an NPL, Danaharta first assessed the viability of the loan. Borrowers with viable loans restructured them using Danaharta’s loan management guidelines. Danaharta gave the borrower only one opportunity in implementing a scheme in order to prevent borrowers from making revisions once the scheme was implemented. Non-viable loans were placed under asset management. Borrowers who failed to produce restructuring proposals which were acceptable to Danaharta, or failed to comply with the loan restructuring guidelines, were also transferred to asset management. Asset management involved the sale of a borrower’s business or the collateral of an NPL. The sale of property was carried out by either open tender or private contract. Foreign currency loans (non-ringgit loans and marketable

36
securities extended to or issued by foreign borrowers) were disposed by way of Restricted Tender Exercise. The management and disposition of loans are shown in the chart below. The market was concerned that Danaharta might take an unduly long time to maximize the value of the assets purchased and in the process hold on to those assets until the domestic economy would revive, given the slow recovery of economy as well as the slow process of liberalization to allow entry of foreign investors. There were still some concerns as to the ability of Danaharta to function independently without Government interference. As an asset purchase consideration, Danaharta paid cash and/or issued zero-coupons with Government-guarantee. Danaharta managed NPLs of Sime Bank Group and Bank Bumiputra Malaysia Berhad Group on behalf of Bank Negara Malaysia and the Government of Malaysia.
As of December 31, 1999, the recovery rate on average for the loans was about 80%, but the recovery rate for foreclosed properties was only 48%.15
At the end of June 2000, Danaharta was managing NPLs with loan rights amounting to RM46.77 billion from the financial system, of which RM20.5 billion was the loan rights acquired from the banking system and the rest of RM26.3 billion was assets managed on behalf of Bank Negara Malaysia and the Government of Malaysia. The overall weighted average discount rate for the acquired NPLs was about 55%. The recovery rate for the loans reduced to 73% on average. The recovery rate for foreclosed properties remained at 48%.
As of December 31 2000, Danaharta had acquired RM20.4 billion in NPLs from financial institutions and was managing RM27.1 billion in NPL loan rights for Sime Bank Group and Bank Bumiputra Malaysia Berhad Group. The book value of the loans removed from the banking system was RM37.5 billion, representing 44% of the NPLs in the banking system. On December 31 2000, the net NPL ratio of the banking system was moderated to 6.3% based on the 6-month classification, from its peak of 9% as of end-November 1998. The weighted average discount rate for the acquired NPLs by Danaharta remained relatively constant, at 55% as of end-December 2000. The recovery rate declined on average by 7 basis points to 66%. The recovery rate for foreclosed loans was 28%, reduced by 20 basis points from the preceding period.
15 Recovery rate is defined as the sold value divided by book value of selling institutions.

37
As of end-June 2001, Danaharta had acquired NPLs of RM20.1 billion from financial institutions and was managing NPLs of RM27.9 billion with respect to Sime Bank Group and Bank Bumiputra Malaysia Berhad Group. The weighted average discount rate for the acquired NPLs by Danaharta remained constant at 55%. The recovery rate for NPLs was 57%, reduced by 9 basis points from the preceding period. The recovery rate for foreclosed loans remained extremely low at 28%.
Danaharta entered into the loan and asset management stage in 1999. As of December 31, 2000, Danaharta had restructured RM35.8 billion of loans (representing approximately 74% of loans under its portfolio), with expected recoveries of RM23.8 billion. This amount translated into a 66% recovery rate of outstanding loans.
Danaharta did not make direct purchases from the banking institutions in 2001. As of December 2001, total loan rights acquired and managed by Danaharta amounted to RM47.7 billion, of which RM39.8 billion was from the banking system. This accounted for approximately 40% of the total non-performing loans of the banking sector. The discount rate for the acquired NPLs by Danahrta was 54%, 1 percentage point lower than the previous 3 years. The recovery rate for NPLs remained almost constant at 56%.
38
Table 5-3: Non-Performing Loans in Danaharta's Portfolio
Dec 1998 June 1999 Dec 1999 June 2000 Dec 2000 June 2001 Dec 2001 Dec 2002 Dec 2003 Dec 2004 RM billion RM billion RM billion RM billion RM billion RM billion RM billion RM billion RM billion RM billion
Acquired* 8.11 17.79 19.13 20.50 20.39 20.13 19.82 19.82 19.73 19.71 Managed** 11.62 21.54 26.39 26.27 27.10 27.90 27.90 27.94 27.97 27.97 Total 19.73 39.33 45.52 46.77 47.49 48.03 47.72 47.76 47.70 47.68 Discount rate (%) 61 57 56 55 55 55 54 54 58 55 Gross Value of restructured 15.05 28.70 35.83 40.89 50.94 52.5 52.4 52.4
(Loan Recovery) 12.06 21.08 23.80 23.21 28.51 30.19 30.6 30.8
Recovery rate (%) 80 73 66 57 56 58 58 59
Performing loans 100 100 100 Plain restructuring 89 94 93 66 69 79 80 95
Viable Scheme arrangement 81 88 83 78 76 74 74 75
Settlement 87 73 77 76 76 77 81 77 Average 89 89 88 73 74 77 78 82
Foreclosure 48 48 28 28 29 34 34 35
Others 43 55 42 60 55 56 48 Non-viable
Average 48 46 42 35 45 45 45 42
Source: Danaharta Operations Report, various issues. * Assets for which acquisition agreements have been signed. ** Assets managed on behalf of Bank Negara Malaysia and the Government of Malaysia.

39
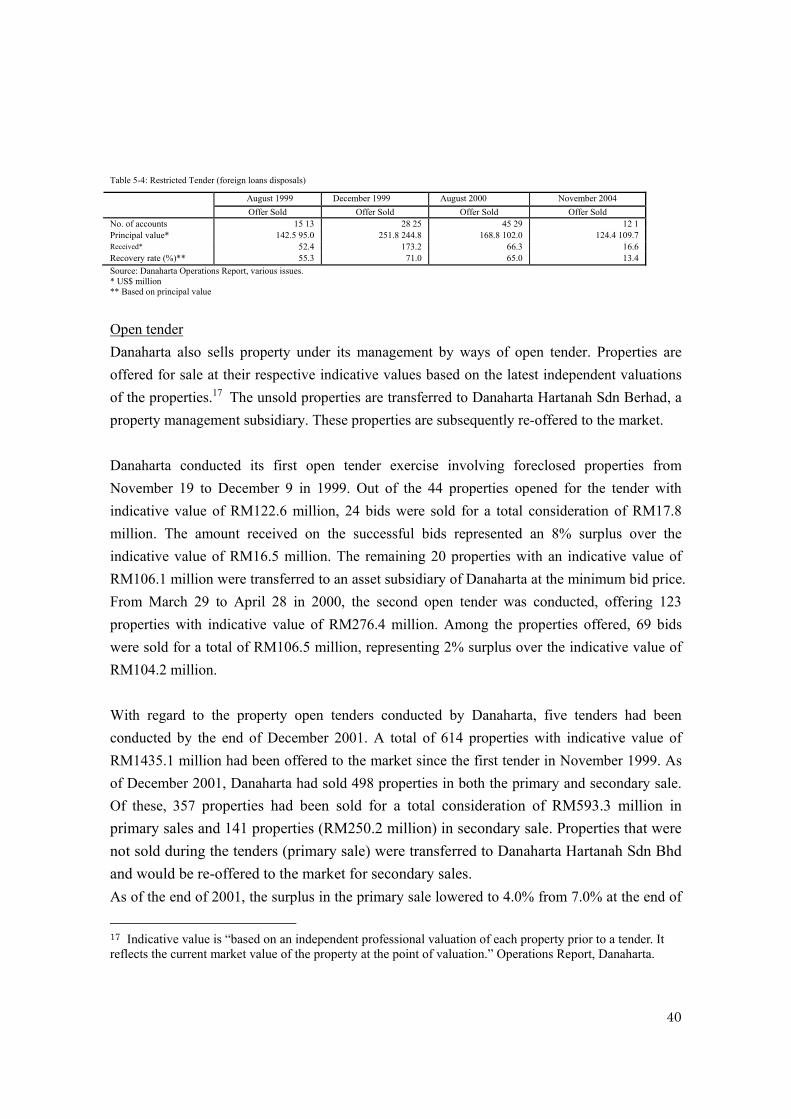
<Tenders> Asset management involves the sale of a borrower’s business or the collateral of an NPL.16 The sale of property is carried out mainly by restricted tender exercise (RTE) to dispose foreign currency loans and by open tender to manage collateral. Restricted Tender Exercise Danaharta has conducted restricted tender exercise (RTE) to dispose foreign currency loans, i.e. non-ringgit loans and marketable securities extended to or issued by foreign borrowers. As of June 30, 2001, Danaharta had completed three RTEs—in August 1999, December 1999, and September 2000—involving 88 offered accounts worth US$394.2 million in principal value, of which 63 accounts were sold with a total consideration value of US$291.9 million. The average recovery rate of these three tenders was approximately 65%. Under the initial tender exercise, Danaharta achieved a recovery rate of 55.3% on 13 of the accounts. The second RTE involved 28 accounts with a total value of US$251.8 million. Danaharta received US$169.3 million from 25 accounts with a recovery rate of 71%. With these two tender exercises, Danaharta disposed foreign currency assets with a principal value of US$339.8 million. The average recovery rate for the first and second RTEs was 66%. The third RTE involved 45 accounts with a total value of US$168.81 million. Danaharta received a total consideration of US$66.3 million, in 29 out of the 45 accounts. The average loan recovery rate for the third RTE was 65%. The fourth RTE in November 2004 involved 12 accounts with a principal value of US$124.4 million, of which only one account was successfully sold. The average loan recovery rate significantly decreased to 13.4%. 16 Asset management by Danaharta involves not only the sale of a borrower’s business or collateral of an NPL, but also the appointment of Special Administrators (SAs) over companies. The SAs would formulate workout proposal for the companies for which they are responsible through a variety of options, including restructuring by the borrower, rescue by a third party investor, sale of assets, and if all else, fails liquidation.
40
Table 5-4: Restricted Tender (foreign loans disposals)
August 1999 December 1999 August 2000 November 2004 Offer Sold Offer Sold Offer Sold Offer Sold
No. of accounts 15 13 28 25 45 29 12 1 Principal value* 142.5 95.0 251.8 244.8 168.8 102.0 124.4 109.7 Received* 52.4 173.2 66.3 16.6 Recovery rate (%)** 55.3 71.0 65.0 13.4 Source: Danaharta Operations Report, various issues. * US$ million ** Based on principal value
Open tender Danaharta also sells property under its management by ways of open tender. Properties are offered for sale at their respective indicative values based on the latest independent valuations of the properties.17 The unsold properties are transferred to Danaharta Hartanah Sdn Berhad, a property management subsidiary. These properties are subsequently re-offered to the market. Danaharta conducted its first open tender exercise involving foreclosed properties from November 19 to December 9 in 1999. Out of the 44 properties opened for the tender with indicative value of RM122.6 million, 24 bids were sold for a total consideration of RM17.8 million. The amount received on the successful bids represented an 8% surplus over the indicative value of RM16.5 million. The remaining 20 properties with an indicative value of RM106.1 million were transferred to an asset subsidiary of Danaharta at the minimum bid price. From March 29 to April 28 in 2000, the second open tender was conducted, offering 123 properties with indicative value of RM276.4 million. Among the properties offered, 69 bids were sold for a total of RM106.5 million, representing 2% surplus over the indicative value of RM104.2 million. With regard to the property open tenders conducted by Danaharta, five tenders had been conducted by the end of December 2001. A total of 614 properties with indicative value of RM1435.1 million had been offered to the market since the first tender in November 1999. As of December 2001, Danaharta had sold 498 properties in both the primary and secondary sale. Of these, 357 properties had been sold for a total consideration of RM593.3 million in primary sales and 141 properties (RM250.2 million) in secondary sale. Properties that were not sold during the tenders (primary sale) were transferred to Danaharta Hartanah Sdn Bhd and would be re-offered to the market for secondary sales. As of the end of 2001, the surplus in the primary sale lowered to 4.0% from 7.0% at the end of
17 Indicative value is “based on an independent professional valuation of each property prior to a tender. It reflects the current market value of the property at the point of valuation.” Operations Report, Danaharta.

41
July 2001. Between July 5, 2001 and December 31, 2001, the Sales & Purchase Agreements of eight properties, with total indicative value of RM64.1 million did not meet certain conditions. As of July 2001, they were classified as “Sold to successful bidders in tenders” but are now reclassified as “Unsold in tenders”. This caused a decrease in the number of properties sold in the primary sale from 364 properties (as of July 2001) to 357 (as of December 2001).
Properties that do not attract bids above the minimum prices set by Danaharta in each tender are transferred to Danaharta Hartanah at the minimum price via an automatic bid mechanism. These unsold properties are subsequently re-offered to the market (“secondary sales”). These secondary sales can be conducted in a variety of ways, including sale by private contract (direct negotiation between Danaharta Hartanah and a prospective buyer) or by offering the properties in the next open tender, together with other newly foreclosed properties.
A total of 257 properties unsold in the primary sale were offered to the secondary market as of the end of 2001. Among them, 141 properties were sold, of which 97 were sold via private contract and 44 were in subsequent tenders. The total consideration of received amounted to RM250.2 million, representing approximately 78% of indicative value of RM320.5 million. The percentage of property sold in the secondary sale gradually increased from 37% as of the end of 2000 to 55% as of the end of 2001. This is partly due to the increasing number of properties offered in the secondary sale.
As of the end of 2003, a total of 511 unsold properties from the primary sales had been transferred to Danaharta Hartanah. Of these, a total of 269 properties were eventually sold via private contract sales or through Danaharta’s subsequent property tenders amounting to RM543.8 million. This represented 79.6% of the indicative value of RM683.4 million. The rest of 242 properties remained unsold even in the secondary sales and would further be transferred to other sales. The percentage of property sold in the secondary sale was about 53%.
In sum, although properties sold in the primary sales represented surplus over the indicative value, the percentage sold was only 60%. Among re-offered properties for secondary sales, only 40% were sold with less than 80% of the indicative value. Another alarming signal was the significant drop of the surplus rate in the primary sale to 1% at the end of 2003. This means that there had been a growing number of properties unsold in the tender. Not only was it getting difficult to sell all the accounts offered in the primary sale, but the quality of the properties was

42
also not as high as it had been. In total, properties sold in both primary and secondary sales generated consideration value of RM1707.6 million as of December 2003, with indicative value of RM1831.2 million. Other properties, unsold or withdrawn from sales, remained within Danaharta Hartanah’s portfolio.
The composition of Danaharta’s assets would change over time from unresolved NPLs to various asset groups and ultimately into cash. As Danaharta moved from its establishment phase to its management phase, the composition of its NPLs also changed from being unresolved to ongoing resolving NPLs.
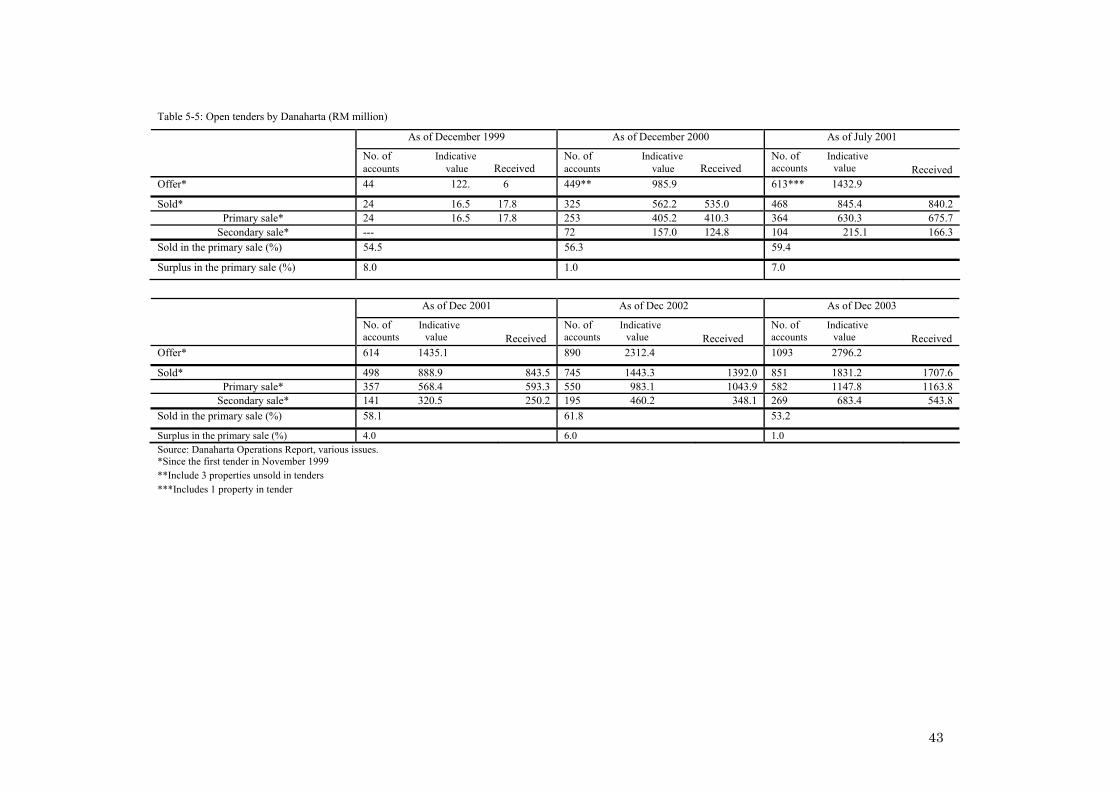
43
Table 5-5: Open tenders by Danaharta (RM million)
As of December 1999 As of December 2000 As of July 2001 No. of Indicative accounts value Received
No. of Indicative accounts value Received
No. of Indicative accounts value Received
Offer* 44 122. 6 449** 985.9 613*** 1432.9 Sold* 24 16.5 17.8 325 562.2 535.0 468 845.4 840.2
Primary sale* 24 16.5 17.8 253 405.2 410.3 364 630.3 675.7 Secondary sale* --- 72 157.0 124.8 104 215.1 166.3
Sold in the primary sale (%) 54.5 56.3 59.4 Surplus in the primary sale (%) 8.0 1.0 7.0
As of Dec 2001 As of Dec 2002 As of Dec 2003 No. of Indicative accounts value Received
No. of Indicative accounts value Received
No. of Indicative accounts value Received
Offer* 614 1435.1 890 2312.4 1093 2796.2 Sold* 498 888.9 843.5 745 1443.3 1392.0 851 1831.2 1707.6
Primary sale* 357 568.4 593.3 550 983.1 1043.9 582 1147.8 1163.8 Secondary sale* 141 320.5 250.2 195 460.2 348.1 269 683.4 543.8
Sold in the primary sale (%) 58.1 61.8 53.2 Surplus in the primary sale (%) 4.0 6.0 1.0 Source: Danaharta Operations Report, various issues. *Since the first tender in November 1999 **Include 3 properties unsold in tenders ***Includes 1 property in tender

44
Table 5-6: Results of secondary sales (RM million)
As of December 2000 As of July 2001 As of December 2001 No. of Indicative accounts value (A) Received (B) B/A (%)
No. of Indicative accounts value Received B/A (%)
No. of Indicative accounts value received
B/A (%)
Total Re-offered* 193 577.1 248 801.0 257 866.7 Sold* 72 157.0 124.8 79 104 215.1 166.3 77 141 320.5 250.2 78 Sold via private contract 41 44.0 35.6 81 60 94.8 69.7 74 97 200.1 153.55 77 Sold in subsequent tenders 31 113.1 89.2 79 44 120.3 96.6 80 44 120.3 96.63 80 Unsold or withdrawn from sale* 121 420.1 144 585.9 116 546.3 Sold in the secondary sale (%) 37.3 41.9 54.9
As of Dec 2002 As of Dec 2003 No. of Indicative accounts value Received B/A (%)
No. of accounts
Indicative value Received B/A (%)
Total Re-offered* 290 893.8 290 893.8 Sold* 195 460.2 348.1 76 215 546.7 366.1 73 Sold via private contract 102 252.0 191.16 76 116 315.9 226.75 72 Sold in subsequent tenders 93 208.2 156.92 76 99 230.8 170.55 74 Unsold or withdrawn from sale* 95 75 Sold in the secondary sale (%) 67.2 74.1 Source: Danaharta Operations Report, various issues. *Since the first tender in November 1999

45

46
6. Danamodal <Establishment> Danamodal Nasional Berhad (Danamodal) was incorporated on August 10, 1998 as a wholly-owned subsidiary of Bank Negara Malaysia. By the statement on the establishment of the special purpose vehicle (SPV) to recapitalize and consolidate the banking sector on July 13, 1998, Bank Negara Malaysia announced the details of the establishment of the SPV to spearhead the recapitalization and restructuring of domestic banking institutions. The SPV was incorporated and known as Danamodal and commenced its operations in September 1998. Danamodal was formed as a limited liability corporation. When it was first established, Bank Negara Malaysia provided the initial seed capital of RM1.5 billion. In the worst case scenario, Bank Negara Malaysia estimated that RM16 billion would have been required to bring the risk weighted capital ratio of all domestic banking institutions to at least 9%. These funds were raised in the form of equity, hybrid instruments, or debt in both the domestic and international markets. Danamodal tried to broaden its shareholder base by inviting the participation of

47
supranational/multilateral agencies and other institutional investors, both domestic and foreign. Bank Negara Malaysia aimed to work closely with Danamodal and Danaharta to ensure a well-coordinated capital raising program. The setting up of Danamodal was expected to play an important role in facilitating the consolidation and rationalization of banking institutions. The recapitalization and consolidation expedited the formation of a core group of domestic banking institutions which were not only well capitalized but were also efficient and competitive. An efficient and competitive banking system was essential to increase confidence and stimulate the real economy, as well as increase the financial sector’s own contribution to GDP growth. Danamodal also coordinated its activities with Danaharta and with domestic banking institutions in their initiatives to restore their capital, liquidity, and profitability position. Danamodal was closed in 2003. <Objective> The objectives of Danamodal were to (1) recapitalize and strengthen the banking industry; and (2) help facilitate the consolidation and rationalization of the banking system to support the next phase of economic development. Danamodal was expected to operate under the existing regulatory and supervisory framework and aimed to minimize the use of public funds. In order to minimize the tax payers’ burden, it was aimed to operate based on commercial and market-oriented principles and to ensure equitable burden sharing among stockholders. <Operation> Banking institutions were required to submit their recapitalization plans under various operations and NPL scenarios. Danamodal then assessed the financial health as well as long-term viability of those banking institutions. In identifying the banking institutions that required capital injections, Danamodal implemented standards developed by BNM. Similarly, to identify institutions that required recapitalization, Danamodal established objective guidelines. Steps to be followed included, but were not be limited to: (i) in-depth analysis of the competitive position and financial standing of each banking institution; (ii) quantification of potential synergies to be realized through consolidation; and (iii) CAMEL (capital, assets, management, earnings, liquidity) analysis.
48
Banking institutions receiving capital injection had to meet several conditions such as: (i) the submission of a thorough business plan; (ii) monthly reporting; and (iii) the establishment of a comprehensive list of performance targets.
Danamodal only injected capital into banking institutions after the institutions had sold their NPLs to Danaharta, whereby the existing shareholders would have to bear the losses from the sales. Danamodal only recapitalized viable banking institutions based on the assessment and the diligent review conducted by reputable, international financial advisors. The capital injection was in the form of equity or hybrid instruments. In making its investment decisions, Danamodal used market-based principles and methodologies. Once the capital injection was carried out, Danamodal instituted micro reforms through its nominees appointed to the respective boards of these banking institutions.
<Capital Injection > The recapitalization process took four steps: (1) assessing recap requirements, (2) recapitalization and investment, (3) financing of recapitalization, and (4) restructuring and monitoring stages.
In the case of recapitalization exercised by Danamodal, total capital injection into the initial 10 banking institutions declined from RM6.4 billion to RM5.3 billion at the end of December 1999, following repayments by five banking institutions.
Danamodal has made no additional capital injection since 2000. Eight banking institutions repaid their loans to Danamodal amounting to RM3.4 billion, bringing the outstanding amount of capital injection to RM3.7 billion on January 31, 2001. As a result of the merger process, two banking institutions repaid their loans to Danamodal. Danamodal still holds stakes in some banking institutions and also redeems its bonds amounting to RM11 billion that matured in 2003. As of November 2003, all the banking institutions except RHB Bank Berhad completed the repayment of their loans to Danamodal.

49
Table 6-1 Recapitalization by Danamodal (RM million)
Dec 31, 1999 Dec 22, 2000 Dec 20, 2001 Nov 5, 2003 Injection Repayment Balance Injection Repayment Balance Injection Repayment Balance Injection Repayment Balance
RHB Bank Berhad 1500 500 1000 1500 500 1000 1500 500 1000 1500 500 1000 Arab-Malaysian Bank Berhad 800 0 800 800 340 460 800 340 460 800 800 0 MBf Finance Berhad 1600 0 1600 2280 0 2280 2280 1600 680 2280 2280 0 United Merchant Finance Berhad 800 800 0 800 800 0 800 800 0 800 800 0 Oriental Bank Berhad 700 0 700 700 0 700 700 700 0 700 700 0 Arab-Malaysian Finance Berhad 500 500 0 500 500 0 500 500 0 500 500 0 BSN Commercial Bank Berhad 420 0 420 420 420 0 420 420 0 420 420 0 Arab-Malaysian Merchant Berhad 400 400 0 400 400 0 400 400 0 400 400 0 Sabah Bank 140 140 0 140 140 0 140 140 0 140 140 0 Perdana Merchant Bankers 50 0 50 50 50 0 50 50 0 50 50 0 Total 6910 2340 4570 7590 3150 4440 7590 5450 2140 7590 6590 1000
Source: Danamodal, Press Release.

50
7. Corporate Debt Restructuring Committee (CDRC) <Objective> The Corporate Debt Restructuring Committee (CDRC) was established in July 1998 to provide a platform for both the borrowers and creditors to work out feasible debt restructuring schemes.18 On October 28, 1998, the procedures and guidelines for the operations of the Corporate Debt Restructuring Committee (CDRC) were unveiled and CDRC initiated its operation. CDRC was set up so that the borrowers would be able to direct their debt restructuring to CDRC without having to resort to legal proceedings.19 CDRC assisted in the restructuring of debts of viable companies with total aggregate debts of at least RM50 million from more than one financial institution. In addition, the Government also established several special funds. These special funds included the Fund for Small and Medium Industries (RM11.5 billion), the Special Scheme for Low and Medium Cost Houses (RM2 billion) and the Rehabilitation Fund for Small and Medium Industries (RM750 million). The Rehabilitation Fund for Small and Medium Industries was established to provide financial assistance to viable small- and medium-sized industries that were facing NPLs and temporary cash flow problems. The progress of corporate debt restructuring was deemed to be finalized and, therefore, CDRC was closed in August 2002.
18 Firms in the crisis countries of East Asia were heavily indebted. Despite weak creditor protection, they were highly leveraged before the crisis, partly because of the even weaker protection for outside equity holders. See La Porta, Lopez-de-Silanes, and Shleifer (2000). Corporate statistics and the auction procedure of Asian countries are summarized in Hausch and Ramachandran (2001). 19 The case of bankruptcy brought into court: The bankruptcy laws and their effectiveness of enforcement vary across countries. When the legal rights of creditors are well protected, firms’ access to credit expands substantially and therefore, improving creditors’ rights amounts to a sound strategy to develop credit markets. However, reforming creditors’ rights can prove politically treacherous in that the bankruptcy reform may be more complicated. It is also difficult from the viewpoint of political expediency as well as fairness. See Hart et al. (1997) and La Porta and Lopez-de-Silanes (2001) for details. The latter analyzes some of the recent failed reform attempts and suggests a more viable option to reform bankruptcy law that relies on a market-run procedure using auctions. This option is found to be appropriate in countries with weak judicial systems.

51
<Operations> CDRC did not have legal power. It only provided an informal framework outside court proceedings. If the process under CDRC could not obtain consensus among the banking institutions, Danaharta would assist by buying over these NPLs from the dissenting banking institutions, thereby facilitating the restructuring process. The debt restructuring approach by CDRC could not and did not guarantee the survival of businesses. The approach to corporate debt restructuring was premised upon co-operation between the stakeholders through which the mutual interests of both debtor and creditors could be addressed in a mutually collaborative environment. CDRC assisted in restructuring debts of viable companies with total aggregate debt of approximately RM50 million or more from more than one financial institution. Below are the five stages in a CDRC workout process:
(1) Initial meetings of debtors and creditors to consider debt restructuring exercise and to obtain temporary standstill. Creditors’ Committee was formed and a Lead Creditor was identified. (2) Consultants were appointed when necessary. (3) Consultants to conduct initial review and report on findings on the viability of the business and their recommendations therein. (4) If restructuring exercise proceeded, a formal standstill should be executed amongst the creditors, and consultants should formulate strategies for restructuring. (5) Implementation of strategies.
Because CDRC did not have legal powers and as all legal rights of the parties coming to CDRC were preserved, it was critical that all parties voluntarily agreed to abide by the guidelines set. <Restructuring> With regard to the corporate debt restructuring exercise, the CDRC received submission of 65 applications with total debt value of RM35.6 billion from companies at the end of 1999. Among those, 15 cases with debt of RM3.5 billion were rejected. CDRC completed the restructuring of 13 cases with debts amounting to RM12 billion. At the end of February 2000, CDRC completed the restructuring of 19 cases with debts amounting to RM14.1 billion, while 10 cases were referred to Danaharta. CDRC expected to complete the debt restructuring of 26 cases involving outstanding debts amounting to RM16.4 billion by the third quarter of 2000.

52
As of December 31, 2000, there were 75 applications to the CDRC, with debts amounting to RM47.2 billion. CDRC resolved debts of 42 companies amounting to RM27.3 billion. It also withdrew or rejected 21 cases with debts of RM7.8 billion. Therefore, at the end of December 2000, CDRC had 12 outstanding cases to be resolved with total debts of RM12.1 billion.
The progress of corporate debt restructuring was relatively slower than expected, given the following factors: (i) larger number of creditors involved in the debt restructuring exercises; (ii) the need to obtain 100% consensus from the parties; and (iii) the lackluster performance of the capital markets in recent months, resulting in difficulties for some borrowers to implement their debt restructuring schemes.
In order to accelerate the pace of corporate debt restructuring, several changes were made to the CDRC debt restructuring framework. In previous years, the size and complexity of the cases referred to the CDRC became increasingly difficult to deal with. Therefore, several changes were introduced to the CDRC framework to facilitate and expedite the restructuring efforts in August 2001. The criteria for acceptance of loans to participate in a restructuring exercise under the CDRC were also changed to be eligible only to cases which involved an aggregate borrowing of RM100 million, compared to the previous RM50 million, and for the borrower to have exposure to at least five creditor banks as opposed to two creditor banks in previous years.
Under the revised framework, CDRC targeted to resolve 10 cases with total debts of RM10.2 billion between August 1 and December 31, 2001. At the end of December 2001, CDRC resolved eight of these cases, with debts accounting for 83.5% of the total targeted amount. In total, CDRC resolved 11 cases in the year 2001, involving debts amounting to RM11.9 billion.20
<Closure of the CDRC> In a press conference held on August 20, 2002, the closure of the CDRC dated August 15, 2002, was announced. The Governor of Bank Negara Malaysia stated that the closure of CDRC marked a major milestone achieved in the restructuring process of the banking system. CDRC, together with Danaharta and Danamodal, comprised the institutional arrangements that were put in place to resolve the problems of non-performing loans in the banking system that
20 The CDRC would be wound up in July 2002 having achieved its objectives. (Comments from Bank Negara Malaysia.)

53
emerged during the Asian financial crisis. The objective of CDRC, in corporation with Danaharta and Danamodal, to preserve stability and to enhance the effectiveness and competitiveness of the banking system was complemented by various measures. The banking sector consolidated from 69 institutions prior to the crisis, to 30 institutions post-merger. At the end of June 2002, the level of capitalization of the banking system improved to 12.8%. Non-performing loans of the banking sector stabilized at 8.1%. Lending activities of the banking sector had continued to increase, with loan approvals and disbursements recording strong growth of 10% and 7%, respectively, at the end of June 2002, compared to the corresponding period in 2001. As to the corporate restructuring, the progress was headed for a successful conclusion. As of August 15, 2002, CDRC had resolved 47 cases with total debts amounting to RM43.971 billion. This included the debt restructuring of Land & General property which was approved by its foreign bondholders on August 13, 2002. In total, the resolved cases represented approximately 65% of the total cases under the auspices of the debt mediating agency. Among the 47 cases resolved, 28 were fully implemented and 19 were pending implementation. The recovery profile of the resolved cases showed that 83% of the recovery proceeds were in the form of cash, redeemable instruments and rescheduled debts. As of August 15, 2002, only debt restructuring of the Lion Group, amounting to RM8.6 billion, was still waiting to be approved by its creditors. The creditors were expected to vote on the proposed restructuring scheme as approved by both the Creditors Steering Committee of Lion Group and the Securities Commission by August/early September 2002. Upon the closure of CDRC, the Lion Group and cases which required implementation would be monitored by the respective account's Creditors Steering Committee and Danaharta. Regardless of the closure of CDRC, bankers and borrowers are required to work together, on a voluntary basis, to address any large NPLs in the future, if any.

54
Table 7-1: Progress of Restructuring at Corporate Debt Restructuring Committee (CDRC)
Application Total Rejection Transferred to Completed Resolved with Cases Received Debt Danaharta Danaharta Outstanding
(NOB) (RM mil) (NOB) (RM mil) (NOB) (RM mil) (NOB) (RM mil) (NOB) (RM mil) (NOB) (RM mil) 3Q/1998 20 5350.2 20 5350.2 4Q/1998 36 11028.15 2 344.5 2 954.3 34 10683.65 1Q/1999 52 26018.52 4 849.85 4 1153.3 2 954.3 44 24015.37 2Q/1999 62 33039.64 8 2053.05 10 10249.4 2 954.3 42 19782.37 3Q/1999 63 35024.65 14 3259.35 11 11234.89 2 954.3 36 19576.13 4Q/1999 66 35652.77 15 3504.35 8 2764.7 13 11778.29 2 954.3 28 16651.13 1Q/2000 68 36519.2 13 2760.45 10 3298.44 17 13106.84 2 954.3 26 16399.17 2Q/2000 71 39643.01 16 3822.63 9 1813.54 23 17392.49 2 954.3 21 15660.05 3Q/2000 75 45938.82 18 4072.57 9 1813.54 28 23085.17 2 954.3 18 16013.24 4Q/2000 75 47209.75 21 7825.89 9 1813.54 31 25476.92 2 954.3 12 11139.1 1Q/2001 75 47209.75 21 7825.89 9 1813.54 33 25816.82 2 954.3 10 10799.2 2Q/2001 75 47378.75 21 7825.89 9 1813.54 33 27576.92 2 954.3 8 9208.1
Source: Bank Negara Malaysia, Annual Report 2001.

55
Table 7-2: CDRC resolved Cases, August 21, 2002
Total Resolved Cases RM 43.97 billion TRANSFERRED TO DANAHARTA WITHDRAWN CASES
Approved by lenders but pending implementation RM 9.71 billion
Fully Implemented RM 34.26 billion
RM 2.47 billion
RM8.67 billion
1 Mycom Group of Companies 20 Renong Bhd 1 NCK Corporation Bhd 1 HICOM Holding Bhd 2 Negeri Sembilan Cement Industries Sdn Bhd 21 TIME Engineering Bhd 2 Abrar Group International Sdn Bhd 2 KESAS Sdn Bhd 3 MetroVision Television Network 22 Johor Corporation 3 Jupiter Securities Bhd 3 Metroplex Berhad 4 Dataprep Holdings Bhd 23 Titan Group 4 Timber Master Industries Bhd 4 First Time Holdings Ltd 5 Hai Ming Holdings Berhad 24 Projek Usahasama Transit Ringan Automatik Sdn Bhd 5 PERSTIMA Bhd 5 Diversified Resources Bhd 6 Gadek (M) Berhad 25 United Engineers (M) Bhd 6 Cableview Services Sdn Bhd 6 Pengkalen Holdings Bhd 7 Idris Hydraulic (M) Bhd 26 Sistem Transit Aliran Ringan Sdn Bhd ("STAR") 7 Bridgecon Holdings Bhd 7 Kelanamas Industries Bhd 8 Cygal Berhad 27 Linkedua Bhd 8 Abrar Corporation Berhad 8 United Mal-Jal Air-Conditioning
Sdn B 9 Plantation & Development (M) Bhd 28 Expressway Lingkaran Tengah Sdn Bhd ("ELITE") 9 Magnitude Network Sdn Bhd 9 Minho (M) Bhd 10 Trans Capital Holding Bhd 29 Faber Group Bhd 10 Red Box (M) Bhd 10 Econstates Bhd 11 Nam Fatt Corporation Bhd 30 Naluri Bhd 11 Suasa Unik (M) Sdn Bhd 11 Silver Concept Sdn Bhd 12 Sistem Televisyen Malaysia Berhad ("TV3") 31 PROLINK Development Sdn Bhd 13 Chase Perdana Berhad 32 Tongkah Holdings Bhd REJECTED CASES (Borrowers)
12 Sutera Harbour Golf & Country Club 13 Beloga Sdn Bhd
14 Johan Holdings Berhad 33 Asian Pac Holdings Berhad RM 3.95 billion 15 George Kent (M) Berhad 34 Advance Synergy Bhd
35 Tanco Holding Berhad 1 Gunawan Iron & Steel Sdn Bhd 2 Parit Perak Holdings Bhd
14 Nauticalink
16 Kretam Holdings Berhad 36 Inter Heritage Sdn Bhd 3 Anson Perdana Bhd 17 Sriwani Holdings Berhad 37 Lien Hoe Corporation Bhd
38 United Merchant Group Bhd 4 Instangreen Corporation Bhd 5 Seremban-Port Dickson Highway
18 Perbadanan Kemajuan Negeri Pahang ("PKNP") 39 Vibrant Omega Sdn Bhd 40 Park May Bhd
6 Sarawak Clinker Sdn Bhd 7 Taiping Securities Sdn Bhd
19 Land & General 41 Pembangunan Bandar Mutiara S/B 42 Setegap Berhad
8 PTB Westwharft Sdn Bhd 9 Redimarketing Sdn Bhd
43 Man Yau Holdings Berhad 10 PSC Industries Berhad 44 Orlando Holdings Bhd
45 Chongai Corporation Bhd 11 Business Focus Sdn Bhd 12 Actacorp Holdings Berhad
46 Tenco Bhd 47 UH Dove Holdings Bhd
13 HVD Holdings Sdn Bhd 14 Intrakota Komposit Sdn Bhd
Source: CDRC

56
8. Summary and Conclusion The Malaysian banking sector has suffered from the Asian financial crisis since 1997. The direct reasons for the problems included a downturn of the economy and collapse of the property and stock markets. However, more fundamental reasons existed in the banking sector itself: lack of competition, lack of independent supervision, and lack of prudential regulations. Several measures such as setting up Danaharta, Danamodal and CDRC have been taken to resolve NPLs and to restructure the banking sector. Bank Negara Malaysia (BNM) also forced mergers for consolidation of the banking sector. Regarding mergers, the merger plan BNM proposed in 1999 was criticized as being politically motivated. The plan was modified and completed in 2001. The domestic banking sector was finally consolidated into 10 groups. It is essential to understand that the consolidation of the banking system cannot be attained by mergers alone. Furthermore, it is not clear if there are a sufficient number of healthy banks with shareholders who are willing to invest in weaker institutions, given that asset quality is questionable. The speed of the liberalization process to allow entry of foreign investors, as well as foreign banks, has been slow. The banking sector restructuring, in consolidation and merger progress, is yet to be finalized. BNM has focused on reducing NPLs in each financial sector to a manageable level. In September 1998, BNM relaxed the default period for classifying a loan as non-performing from three months to six months. However, this classification was against the strengthening of the prudential regulations and was inconsistent with the international practice of three months. The legal framework must be strengthened in line with the best international practices. BNM has taken the right steps by establishing the asset management company of Danaharta, as well as the special purpose vehicle Danamodal, to deal with NPLs and recapitalization. On the surface, these measure have, to some extent, succeeded in bringing down NPL ratios. However, there was skepticism that Danaharta would become a “warehouse” for NPLs. In fact, properties sold in open tender sales generated consideration value of RM840.2 million as of July 2001, with indicative (assessed) value of RM845.4 million. Other properties, unsold or withdrawn from sales, remained within Danaharta’s portfolio as a great concern. NPLs in the banking system as a whole remained roughly constant, or even increased, during 2000. Specifically, NPLs on actual basis rose during the course of 2000. Regarding

57
the sectoral breakdown of NPLs, most of the increase in NPLs came from manufacturing, broad property and consumption sectors. The level of NPLs in the manufacturing sector grew by 5.6% and the percentage share in total NPLs rose by 1.4% to 16.6% at the end of 2000. The total amount of NPLs in the property sector increased by RM1.717 billion and accounted for 39.2% of total NPLs in the banking sector as of December 2000.
Despite the measures undertaken for rehabilitation of NPLs, the gross NPLs on actual basis, in the banking sector continued to increase during the course of 2001, reflecting the negative impact of the world economy on the Malaysian economy. The rate of increase in NPL ratio was about 2% among commercial banks. The NPL ratio in merchant banks, however, was incredibly high: 21.7% on actual basis, 26.2% on 3-month basis, and 21.6% on 6-month basis. The resolution of NPLs in commercial banks and merchant banks had been very slow.
The most severely affected sectors were manufacturing, broad property and financial services. There was an increase in total NPLs of these three sectors from 2000 to 2001, RM12 billion, accounted for 86% of the total increase in NPLs in the banking system of RM14 billion. Percentage share in total NPLs in manufacturing, broad property and financial services rose by about 2% to 18.6%, 41.1%, and 7.9%, respectively. The build up of NPLs was mainly due to the persistent economic slowdown and partly due to the negative impact of September 11 on the world economy.
The NPLs in these sectors were mainly concentrated in SMEs. In line with the downward economy, SMEs as a whole cannot be anticipated to recover further, but NPLs in these manufacturing and property sectors are likely to worsen further. Resolution of NPLs in these sectors, specifically rehabilitation of SMEs, would be critical in bringing down the total level of NPLs.

58
Appendix: Measures and New Guidelines, 1997-1999 Year 1997 <Risk-Weighted Capital Requirement: Measurement of Credit Exposure > Effective on June 1, 1997, all banking institutions were required to value their credit exposure for interest rate and foreign exchange-related contracts by using the “current exposure method” instead of the “original exposure method”.
The “current exposure method” provided a more updated and continuously revised exposure of a contract as it progressed to maturity. Marking-to-market measured the current credit exposure of a contract, while the “add-on” factor estimated the potential exposure of the contract that might be further incurred over time.
However, BNM’s revised standards differed slightly from the BIS standards in terms of the quantification of risk. As Malaysian banking institutions operate mainly in the local interest rate and foreign exchange market, the set of “add-on” factors used in estimating the potential future exposure was revised based on risks arising from the local interest rate and foreign exchange rate environment.
<Disclosure Requirements for the Financial Statements of Banking Institutions> Effective on October 17, 1997, BNM had further increased the level of transparency in the annual financial statements of banking institutions. The additional disclosure requirements are: (1) Director’s Report on Business Strategy and Outlook, (2) Sectoral Concentration of Loans, (3) Non-Performing Loans, (4) Capital Adequacy (details of the risk-weighted assets according to the various categories of risk-weights should be disclosed), (5) Bank Rating.
Year 1998 <Minimum Capital Funds> The minimum capital funds of the finance companies increased from the existing RM5 million to RM300 million by mid-1999. The minimum requirement was further raised to RM600 million by end-2000. In addition, the risk-weighted capital ratio of the finance companies increased from 8%, as prescribed under the Basle Capital Accord, to 9% by end-1998 and to 10% by end-1999. Prudential regulations were also tightened, and

59
supervisory efforts were intensified to aim at the early identification of problem loans and solvency issues. <Funds for SMIs> The small- and medium-sized industries (SMIs) got into difficult conditions as a result of the adverse effects of the crisis. The strains on their cash flow had affected their debt servicing capability leading to deteriorating financial health. Access to financing also became increasingly limited. To ensure that viable SMIs continued to have access to credit, the Fund for Small and Medium Industries was set up with an initial allocation of RM1 billion in January 1998 to provide financing to the SMIs at a maximum lending rate of 10% per annum. The allocation under the Fund was increased by RM500 million to RM1.5 billion in May 1998. The list of participating institutions was also expanded to include all commercial banks, 10 identified finance companies, all merchant banks and four development finance institutions. The maximum lending rate under the Fund was reduced to 8.5% per annum in December 1998.
<Disclosure Requirements for the Banking Institutions> The disclosure requirements in the banking institutions’ half-year financial statements were tightened in 1998. Individual banking institutions were required to publish the semi-annual income and expenditure statement in greater detail. They were also required to provide information on capital adequacy, non-performing loans, breakdown of their commitments and contingencies, movements in specific provision, general provision and interest-in-suspense as well as credit exposure according to economic sectors.
In addition, the banking institutions were required to disclose their off-balance sheet items and their respective on-balance sheet credit risk equivalents in their annual financial statements. This disclosure requirement was intended to promote market discipline by encouraging prudent behavior. The published information would also help monitor the performance of the banking institutions.
In the attempt to enhance the degree of transparency, banking institutions were required to publish key financial indicators on a quarterly basis. Nevertheless, as the crisis became worse, vulnerabilities arising from the crisis became more relevant. There was rising concern that quarterly publication posed a heavy administrative burden on the banking institutions. In this

60
regard, the requirement on the quarterly publication of financial indicators was temporary. Banking institutions were, however, still required to make their financial indicators public on a semi-annual basis.
<Minimum Requirement for General Provisions for Bad and Doubtful Debts> BNM raised the minimum level of general provisions for bad and doubtful debts that should be maintained by banking institutions to 1.5% of total loans (net of specific provision and interest-in-suspense), effective from January 1, 1998. Since 1990, the minimum level of general provisions for bad and doubtful debts has been set at 1% of total loans (net of specific provision and interest-in-suspense).
However, the need for banking institutions to increase their resilience and build up their reserves as an additional buffer against possible future loan losses would become more crucial in the years ahead. In anticipation of such a need, BNM raised the minimum level of general provision required to put together with the package of economic reforms in the 1998 budget.
<Guidelines on Provisions for Substandard Debts> With effect from financial year beginning January 1, 1998, banking institutions were required to provide 20% specific provisions against the uncollateralized portion of substandard loans. Banking institutions were also required to set aside provisions for off-balance sheet items where the banking institution faced credit risk from the failure of counter parties to fulfill their contractual obligations. These guidelines were mainly to increase the resilience of the banking institutions. However, banking institutions with high loan loss reserves as determined by BNM would not automatically be required to make provisions for their sub-standard loans.
<Guidelines on Single Customer Limit> With effect from March 25, 1998, the limit on single customer exposure was reduced from 30% to 25% of the total capital. Banking institutions were also required to comply with the single customer limit on a consolidated group basis. Lowering of the limit was to reduce the concentration of risk to a single customer.
<Risk-Weighted Capital Ratio (RWCR) Compliance Requirement> With effect from financial quarter ended on March 31, 1998, banking institutions were required
61
to comply with the minimum risk-weighted capital ratio on a consolidated basis every quarter rather than annually.
As the economy contracted and as activities in the capital market became extremely thin during the first three quarters of the year 1998, the ability of shareholders to raise additional capital was constrained. In this regard, compliance with the increased minimum capital funds of RM600 million by the finance companies and risk-weighted capital ratio of 10% was deferred until such time when the economy has recovered and the capital market has stabilized.
This new requirement will enable BNM to monitor the capital adequacy position of banking institutions on a consolidated basis in a timely manner.
<Reduction of Liquid Asset Ratio> With effect from September 3, 1998, the liquid asset ratio requirement for commercial banks was reduced from 17% to 15% of their total eligible liabilities. The reduction has also enabled gradual phasing in the new liquidity framework introduced by BNM.
<New Liquidity Framework> In July 1998, BNM introduced a new liquidity framework to replace the present liquid asset ratio requirement for the banking institutions. To ensure a smooth transition, the system of banking institutions was revised to a new framework on January 1, 2000. All banking institutions were required to comply with the new framework by January 1, 2000.
Under the new framework, the liquidity needs of a banking institution is assessed based on its ability to match its short-term liquidity requirement with maturing assets. Banking institutions are required to make projections on the maturity profile of their assets, liabilities and off-balance sheet commitments in a series of maturity ladders, which are expected to assess their potential future liquidity surplus and shortfall. To ensure that there is sufficient liquidity to meet their liability obligations in the short term, banking institutions are required to maintain, as a minimum requirement, adequate liquidity surplus. The new framework ensures the banking institutions are aware of their funding structure and their ability to manage their assets and liabilities portfolio.
Year 1999 <Abolishment of TTRS>

62
The Two-Tier Regulatory System (TTRS) for banking institutions was abolished on April 10, 1999. As the result, incentives that were previously accorded to Tier-1 banking institutions were made available to all institutions, subject to the approval of BNM.
The TTRS was aimed at improving capital quality as well as capital quantity in each banking institution through monitoring various measures. However, the TTRS emphasized absolute capital size as one of the pre-requisites for the attainment of Tier-1 status, and therefore led banking institutions to embark on over-capital expansion funded by borrowings. Consequently, significant pressures were exerted on the management of these banking institutions to aggressively increase their loan portfolio in order to generate the requisite returns to meet debt servicing obligations. This, in turn, contributed to poor asset quality, particularly during the economic downturn.
<Approval for Increases in Capital Funds> With effect from April 14, 1999, BNM required future capitalization of banking institutions by controlling shareholders to come from non-obligatory sources of financing such as equity, internally generated funds and extremely long-term debt (preferably by way of bond issue) of at least 10 years maturity. Banking institutions which seek BNM’s approval to issue new capital will have to provide BNM a statement on the capital injection according to the degree of leverage.
<Prohibition on Lending to Controlling and/or Influential Shareholders> Effective from August 4, 1999, BNM’s guidelines on “Prohibition of loans to its directors, staff and their interested corporations” (BNM/GP6) was expanded. It attempted to prohibit the granting of credit facilities to shareholders with controlling and/or influential interests in the banking institution. It was also intended to prevent granting of credit facilities to any related companies of the shareholder, any firm in which the shareholder has interest as a partner, manager, agent or guarantor and any person for whom the shareholder is a guarantor.
<Masterplan> BNM has embarked on a master plan for the Malaysian financial system that focuses on building the foundation and charting the strategic direction of the banking sector for the next 10 years. The master plan will provide a long-term vision for the development of a resilient, efficient, and competitive banking sector. The objective of the master plan is to ensure that the

63
banking sector operates effectively in the changing domestic and external environments and also meets the needs of emerging technological advances.

64
Reference: Asian Development Bank. 1999. Rising to the challenge in Asia: A study of Financial Markets Volume 2. Special Issues. Asian Development Bank. 1999. Rising to the challenge in Asia: A study of Financial Markets Volume 8. Malaysia. Bank Negara Malaysia. 1997. 1998. 1999. 2000. 2001. 2002. Annual Report Bank Negara Malaysia. 2001. The Masterplan: building a secure future. Bank Negara Malaysia. 1999. The Central Bank and the Financial System in Malaysia, A Decade of Change in 1989-1999. Barro, R. J. 2002. Economic Growth in East Asia Before and After the Financial Crisis. In Coe, D. T., and Se-Jik Kim, eds. Korean Crisis and Recovery. International Monetary Fund and Korea Institute for International Economic Policy. International Monetary Fund. Washington, D.C. Barth, J. R., Gerard Caprio Jr., and Ross Levine. 2001. Banking Systems around the Globe. In Mishkin, F. S., ed. Prudential Supervision. National Bureau of Economic Research. Chicago: University of Chicago Press. Claessens, S., Simeon Djankov, and Daniela Klingebiel. 2001. Financial Restructuring in East Asia: Halfway There? In Claessens, S., Simeon Djankov and Ashoka Mody, eds. Resolution of Financial Distress. World Bank Institute. The World Bank. Washington, D.C. Danaharta. Operations Report. Various issues. Danaharta. Directors’ Report. Various issues. Enoch, C., Gillian Garcia, and V. Sundararajan. Recapitalizing Banks with Public Funds. IMF Staff Papers 48(1):58-110. Hart, O., Rafael La Porta, Florencio Lopez-de-Silanes, and John Moore. 1997. A New

65
Bankruptcy Procedure that Uses Multiple Auctions. European Economic Review 41(3): 61-73. Hausch, D. B., and S. Ramachandran. 2001. Corporate Debt Restructuring: Auctions Speak Louder Than Words. In Claessens, S., Simeon Djankov, and Ashoka Mody, eds. Resolution of Financial Distress. World Bank Institute. The World Bank. Washington, D.C. Institute for International Monetary Affairs. 2000. Malaysia. International Monetary Fund. 1999. IMF-Supported Programs in Indonesia: Korea, and Thailand. International Monetary Fund. Washington, D.C. International Monetary Fund. 2000. Capital Controls: Country Experiences with their Use and Liberalization. IMF Occasional Paper 190. Part 2 of 3. International Monetary Fund. Washington, D.C. May 17. Klingebiel, D. 2001. Asset Management Companies. In Claessens, S., Simeon Djankov and Ashoka Mody, eds. Resolution of Financial Distress. World Bank Institute. The World Bank. Washington, D.C. La Porta, R., Florencio Lopez-de-Silanes, and Andrei Shleifer. 2000. Investor Protection and Corporate Government. Journal of Financial Economics 58(1):3-27. La Porta, R., and Florencio Lopez-de-Silanes. 2001. Creditor Protection and Bankruptcy Law Reform. In Claessens, S., Simeon Djankov and Ashoka Mody, eds. Resolution of Financial Distress. World Bank Institute. The World Bank. Washington, D.C. Meesook, K., Il Houng Lee, Olin Liu, Yougesh Khatri, Natalia Tamirisa, Michael Moore, and Mark H. Krysl. 2001. Malaysia: From Crisis to Recovery. IMF Occasional Paper 207. August 27. Park, Y. C., and Jong-Wha Lee. 2002. Recovery and Sustainability in East Asia. In Coe, D. T., and Se-Jik Kim, eds. Korean Crisis and Recovery. International Monetary Fund and Korea Institute for International Economic Policy. International Monetary Fund. Washington, D.C.