Bank of the Ryukyus Management Briefing for FY2014 › common › uploads-archives › 2016 › 02...
41
By Chie Tengan Winner of the 23nd (fiscal 2014) Bingata Design Contest presented by the Bank of the Ryukyus Bank of the Bank of the Ryukyus Ryukyus Management Briefing Management Briefing for FY2014 for FY2014
Transcript of Bank of the Ryukyus Management Briefing for FY2014 › common › uploads-archives › 2016 › 02...

By Chie Tengan
Winner of the 23nd (fiscal 2014) Bingata Design Contest presented by the Bank of the Ryukyus
Bank of the Bank of the RyukyusRyukyus Management BriefingManagement Briefing
for FY2014for FY2014

The Financial and Economic Environment of Okinawa Prefecture
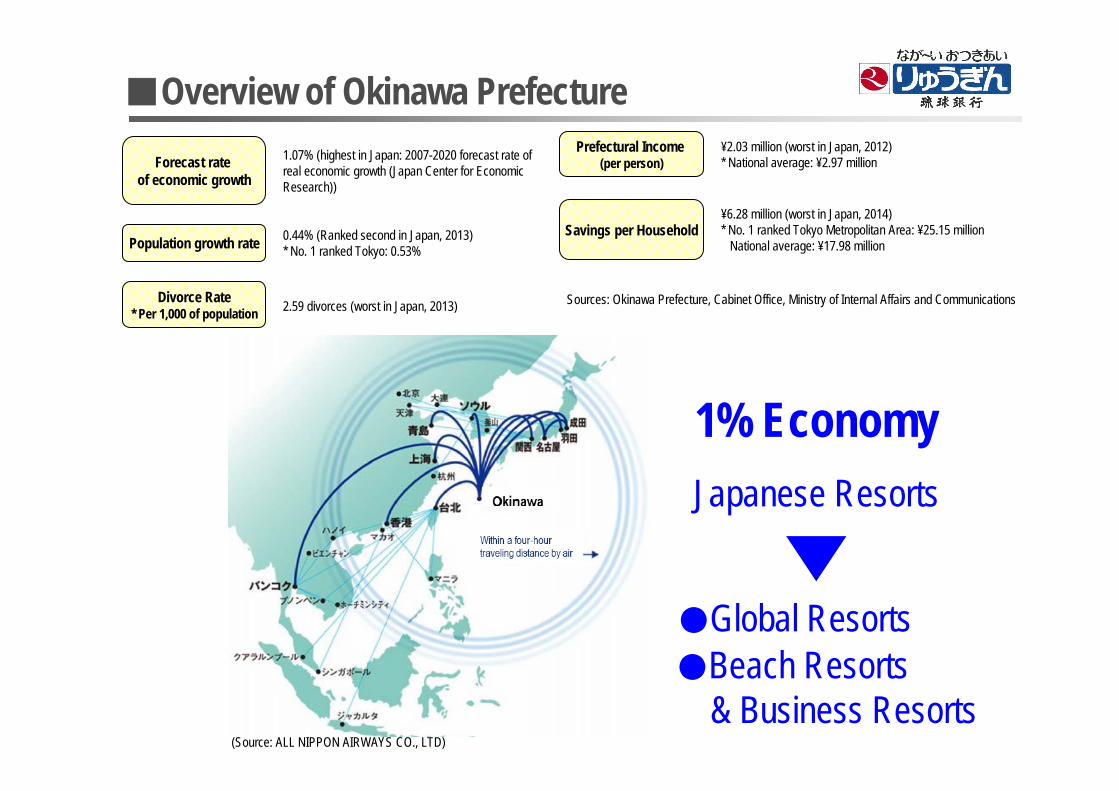
■Overview of Okinawa Prefecture
Savings per Household
Prefectural Income (per person)
Divorce Rate* Per 1,000 of population 2.59 divorces (worst in Japan, 2013)
Population growth rate 0.44% (Ranked second in Japan, 2013)* No. 1 ranked Tokyo: 0.53%
Forecast rate of economic growth
1.07% (highest in Japan: 2007-2020 forecast rate of real economic growth (Japan Center for Economic Research))
(Source: ALL NIPPON AIRWAYS CO., LTD)
Sources: Okinawa Prefecture, Cabinet Office, Ministry of Internal Affairs and Communications
1% EconomyJapanese Resorts
●Global Resorts
¥2.03 million (worst in Japan, 2012)* National average: ¥2.97 million
¥6.28 million (worst in Japan, 2014)* No. 1 ranked Tokyo Metropolitan Area: ¥25.15 million
National average: ¥17.98 million
●Beach Resorts & Business Resorts

■Regional Economic Climate Chart (May 2015)2014 2015
May ~ May Personal consumption
Residential construction
Facility investment Public works Exports Production
activities Tourism Employment conditions
HOKKAIDOAREA
TOHOKUAREA
KANTOARE
KOSHINETSUAREA
HOKURIKUAREA
TOKAIAREA
KINKIAREA
CHUGOKUAREA
SHIKOKUAREA
KYUSYUAREA
OKINAWAPREFECTURE
Source: Regional Banks Association of Japan

■Economic Trends (Bank of Japan Tankan)
Bank of Japan Tankan
-60
-50
-40
-30
-20
-10
0
10
20
30
40
Feb.’92 Feb.’93 Feb.’94 Feb.’95 Feb.’96 Mar.’97 Mar.’98 Mar.’99 Mar.’00 Mar.’01 Mar.’02 Mar.’03 Mar.’04 Mar.’05 Mar.’06 Mar.’07 Mar.’08 Mar.’09 Mar.’10 Mar.’11 Mar.’12 Mar.’13 Mar.’14 Mar.’15
Japan OkinawaMar.2015
+24
Mar.2015+7
( Business condition diffusion index : Strong-Week)
Source: Bank of Japan, Naha Branch* Drawn up using “new base” numerical values from December 2014
Level exceeded 20 over five periods for first time in 23 years

■Projected Population
Projected Population
100.0 101.0
100.0103.5
106.9109.4 110.7 111.3 111.0 110.3 109.2 107.5
101.7 101.9 100.898.8
92.889.2
85.4
96.0
65
75
85
95
105
115
1995 2000 2005 2010 2015 2020 2025 2030 2035 2040
Japan Okinawa(1995=100)
Okinawa Prefecture’s population is projected to increase for the foreseeable future
Peak
10 Years
(Source: Prepared from census figures provided by Japan’s Ministry of Internal Affairs and Communications through to 2010 as well as estimates for 2015 and beyond provided by the National Institute of Population and Social Security Research)

■Projected Population
Okinawa Prefecture Popuration Trends
0
200,000
400,000
600,000
800,000
1,000,000
1,200,000
1,400,000
1,600,000
1980 1985 1990 1995 2000 2005 2010 2015 2020 2025 2030 2035 2040
Total population
Working-age population
Elderly population
Youth population
Estimated value
(References) Compiled from National Population Census (Ministry of Internal Affairs and Communications), Regional Population Projections for Japan , March 2013 projections(National Institute of Population and Social Security Research)
Actual values
Working-Age Population Already in Decline(Persons)

■Employment
Trends in the overall unemployment rate
3.6%
5.4%
0.0%
1.0%
2.0%
3.0%
4.0%
5.0%
6.0%
7.0%
8.0%
9.0%
1991 1992 1993 1994 1995 1996 1997 1998 1999 2000 2001 2002 2003 2004 2005 2006 2007 2008 2009 2010 2011 2012 2013 2014
Japan
Okinawa
Improving trend in Employment
(Source: Labor force survey by Japan’s Ministry of Internal Affairs and Communications)
Aeon Mall Okinawa Rycom opened April 25, 2015

■Trends in Land PricesUpward trend in prices within the Prefecture for both commercial- and residential-use land
Commercial-use land (YoY)
+0.8%
-12.0%
-10.0%
-8.0%
-6.0%
-4.0%
-2.0%
0.0%
2.0%
4.0%
6.0%
8.0%
10.0%
12.0%
14.0%
Jan.1991 Jan.1994 Jan.1997 Jan.2000 Jan.2003 Jan.2006 Jan.2009 Jan.2012 Jan.2015
Japan Okinawa
0.0%
Residential-use land (YoY)
+0.6%
-12.0%
-10.0%
-8.0%
-6.0%
-4.0%
-2.0%
0.0%
2.0%
4.0%
6.0%
8.0%
10.0%
12.0%
14.0%
Jan.1991 Jan.1994 Jan.1997 Jan.2000 Jan.2003 Jan.2006 Jan.2009 Jan.2012 Jan.2015
Japan Okinawa
-0.4%
(Source: Land prices published by Japan’s Ministry of Land, Infrastructure, Transport and Tourism)

Actual and forecast numbers of international tourists by arrival point
177.3304.1
475.3620
74482
204
355
535
109
149.7
199
248
50.3
85
134
101
149
22.862.3
60.9
277
528
940
1,360
1,809
0
200
400
600
800
1,000
1,200
1,400
1,600
1,800
2,000
1980 1995 2010 2020 2030
(Millions)
Middle East
Africa
America
Asia-Pacific
Europe
Estimated values Actual values
■Long-Term Forecasts for Tourists from Overseas
(Source) United Nations World Tourism Organization (UNWTO)
In 2013, the global number of overseas tourists is expected to reach 180 million

■Tourism
251 230 284 280 376
5,793 5,420 5,5705,135
5,4595,862
6,164
550 893
436.4
390.4407.0
373.4390.5
433.9
6,0465,650 5,855
5,415
7,058
6,413
5,835
0
1,000
2,000
3,000
4,000
5,000
6,000
7,000
8,000
9,000
2008 2009 2010 2011 2012 2013 2014
(Thousands)
0
50
100
150
200
250
300
350
400
450
500(Billions of Yen)
Visitors from overseas (Left scale) Visitors from other parts of Japan (Left scale) Revenues from tourism (Right scale)
(12.7%)(8.6%)(5.2%) (6.5%)(4.1%) (4.9%)(4.2%)
(87.3%)
(91.4%)
(93.5%)(94.8%)
(95.9%) (95.1%)(95.8%)
(Source: Statistical overview of the number of tourists entering Okinawa Prefecture)
For two years in succession, visitor numbers to Okinawa have been all-time highs of more than 7 million!
?
* Figures inside ( ) show rate of increase

Financial Results for FY2014
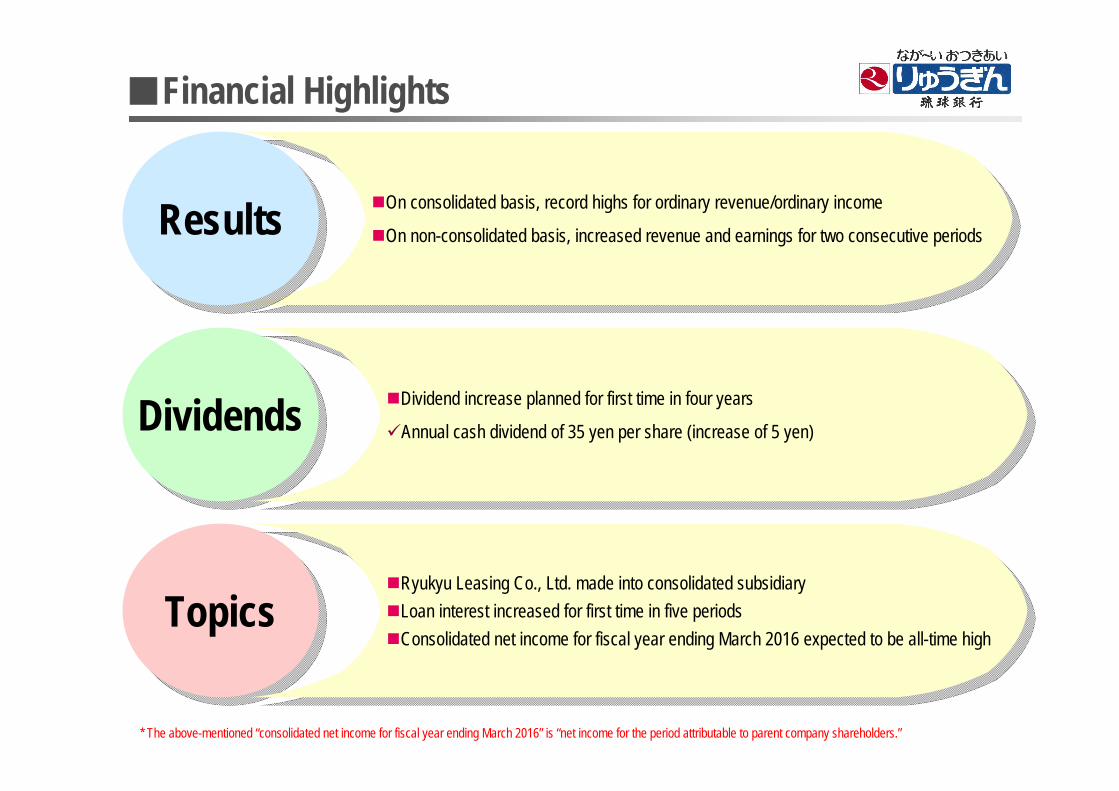
■Financial Highlights
* The above-mentioned “consolidated net income for fiscal year ending March 2016” is “net income for the period attributable to parent company shareholders.”
On consolidated basis, record highs for ordinary revenue/ordinary income
On non-consolidated basis, increased revenue and earnings for two consecutive periods
On consolidated basis, record highs for ordinary revenue/ordinary income
On non-consolidated basis, increased revenue and earnings for two consecutive periodsResultsResults
DividendsDividends Dividend increase planned for first time in four years
Annual cash dividend of 35 yen per share (increase of 5 yen)
Dividend increase planned for first time in four years
Annual cash dividend of 35 yen per share (increase of 5 yen)
TopicsTopics Ryukyu Leasing Co., Ltd. made into consolidated subsidiaryLoan interest increased for first time in five periodsConsolidated net income for fiscal year ending March 2016 expected to be all-time high
Ryukyu Leasing Co., Ltd. made into consolidated subsidiaryLoan interest increased for first time in five periodsConsolidated net income for fiscal year ending March 2016 expected to be all-time high

■Factors Contributing to Non-consolidated /Consolidated Differences in Net Income for Current Fiscal Year
Factors Contributing to Non-consolidated/Consolidated Differences in Net Income for Current Fiscal Year
4,296
5,553
1,067
559 -120-250
Non-connsoridated Connsoridated
(Millions of Yen)
Non-consolidated/consolidated scale factor attributable to making Ryukyu Leasing a consolidated subsidiary: 1.29 times
+ ¥1,257 millionGain on negative goodwill
Total profit from subsidiaries
Minority interest
Others

4.2
3.4
2.42.3
4.2
0
1
2
3
4
5
6
End Mar.'11 End Mar.'12 End Mar.'13 End Mar.'14 End Mar.'15
(Billions of Yen)
■Factors Behind the Change in Net Income (Non-Consolidated)
Factors Behind the Change in NetIncome (Non-Consolidated)
4,296
931
603
3,414
7149
-808
End Mar.'15End Mar.'14
(Millions of Yen)
Increase in total income taxes
Others
Increase in earnings due to such factors as increase in net business profits, decrease in credit limit costs
Decrease in net credit costs
Increase in real net business profit
Improvem
ent in gains/losses on shares
+ ¥882 million
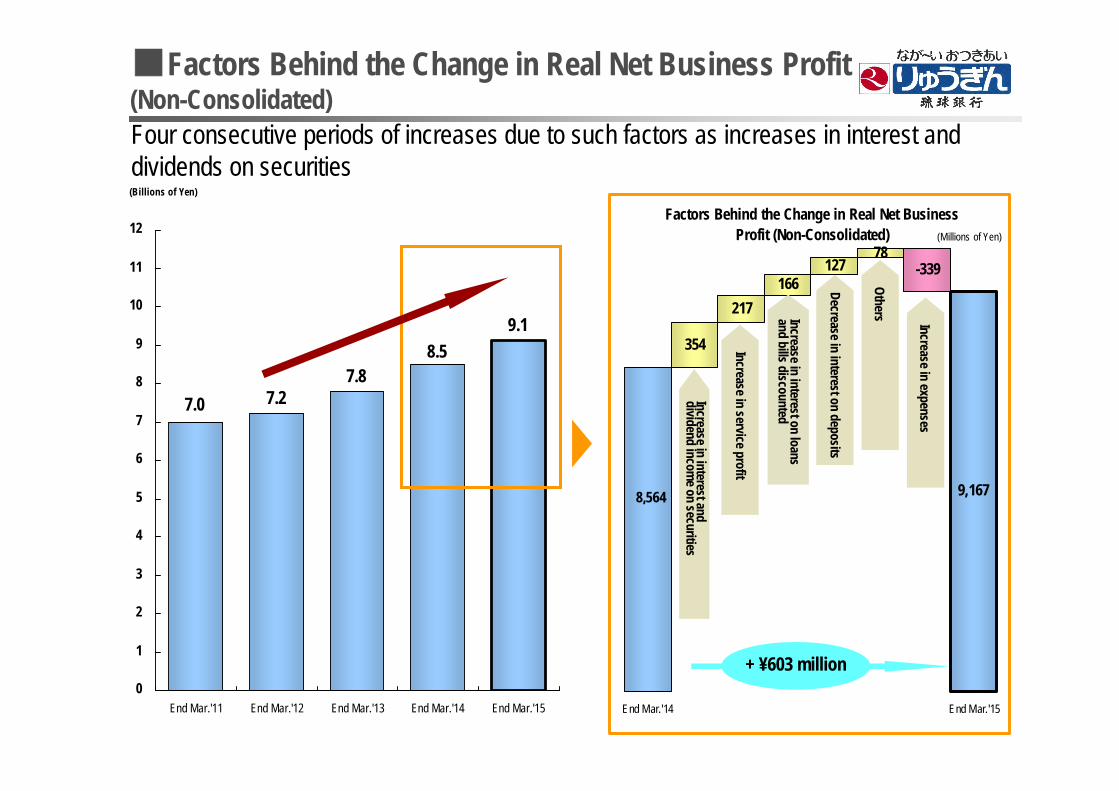
7.0 7.27.8
8.59.1
0
1
2
3
4
5
6
7
8
9
10
11
12
End Mar.'11 End Mar.'12 End Mar.'13 End Mar.'14 End Mar.'15
(Billions of Yen)
■Factors Behind the Change in Real Net Business Profit (Non-Consolidated)
Factors Behind the Change in Real Net BusinessProfit (Non-Consolidated)
354
217166
12778
8,564 9,167
-339
End Mar.'15End Mar.'14
(Millions of Yen)
Decrease in interest on deposits
Increase in service profit
Increase in interest on loans and bills discounted
Increase in interest anddividend incom
e on securities
Increase in expenses
Others
Four consecutive periods of increases due to such factors as increases in interest and dividends on securities
+ ¥603 million

■Loans (Non-Consolidated)
■Loans (Non-Consolidated)
120.7
694.5518.7 540.3 572.3 611.1 649.1
584.0
566.0542.3
529.7520.7
559.7
124.7 127.9 114.5109.7
121.1
13,9921,330.0
1,209.5 1,210.6 1,216.6 1,241.6
0
200
400
600
800
1,000
1,200
1,400
End Mar.'10 End Mar.'11 End Mar.'12 End Mar.'13 End Mar.'14 End Mar.'15
(Billion of Yen)
Corporations
Indiv iduals
Local publicauthoritiesand other
Favorable increases in both private and corporate businesses
1,399.2

Business Loans (Non-Consolidated)
246.0 265.9 298.7 320.7 349.4
114.1 108.9 104.2 102.2 105.9 97.376.6 69.3 62.5 60.4 59.8 59.153.4 52.0 53.8 49.6 61.8 67.769.8 67.7 65.0 50.252.5 49.5
175.9 163.8 153.6 144.3151.6 166.5
254.6
736.0 716.5 705.3 705.67,525
789.8
0
200
400
600
800
1,000
End Mar.'10 End Mar.'11 End Mar.'12 End Mar.'13 End Mar.'14 End Mar.'15
(Billions of Yen)
Real estate, rental and leasing Wholesale and retail Construction Medical and welfare Manufacturing Others
■Business Loans (Non-Consolidated)
* Individual business loans are handled in a different manner and as such data does not reconcile with data for loans to corporations on page 16
Increase mainly in loans to the real estate sector including apartment loans as well as the medical and welfare sector
Medical and welfare
Real estate, rental and leasing

■Estimates of the Number of Households
Estimates of the Number of Households
100.0
106.5100.0
110.3
120.8
128.9135.1
139.6143.0 145.5
111.7114.5 115.2 114.8
111.1113.5
65
75
85
95
105
115
125
135
145
1995 2000 2005 2010 2015 2020 2025 2030
Japan Okinawa(1995=100)
Continued increase in the number of households
Peak
(Source: Prepared from estimates as of March 2014 provided by the National Institute of Population and Social Security Research)

■Consumer Loans (Non-Consolidated)
* Data does not include individual business loans and as such does not reconcile with data for loans to individuals on page 16* Figures inside ( ) show rate of increase
Consumer Loans (Non-Consolidated)
310.6 323.6 347.1 370.4 390.7
382.2406.2
430.7454.9
476.1
406.5
58.8 58.659.0
60.364.1
69.6
369.4
0
50
100
150
200
250
300
350
400
450
500
End Mar.'10 End Mar.'11 End Mar.'12 End Mar.'13 End Mar.'14 End Mar.'15
(Billions of Yen)
Favorable increase due to sales of new products and other factors
(4.0%)
(8.5%)
(6.7%)(7.3%)
(4.2%)
(5.5%)
(4.3%)
(6.3%)
(▲0.3%)(0.7%)
(0.2%)
(2.3%)
Other loans
Mortgage loans

■Deposits (Non-Consolidated)
Deposits (Non-Consolidated)
529.2126.2
141.0165.2
129.3161.9
179.4
1,021.7 1,087.2 1,155.9
1,199.6
1,226.2 12,585
376.1412.4
437.7468.8 494.6
1,882.8
1,524.11,640.7
1,758.9 1,797.8
0
200
400
600
800
1,000
1,200
1,400
1,600
1,800
2,000
2,200
End Mar.'10 End Mar.'11 End Mar.'12 End Mar.'13 End Mar.'14 End Mar.'15
(Billions of Yen)
(4.5%)(4.7%)
(2.2%)(7.2%)
(7.7%)
(7.3%)
Increases in personal, corporate and public funds, exceeding ¥1,900 billion yen
* Figures inside ( ) show rate of increase
Corporations
Individuals
Public funds1,967.2
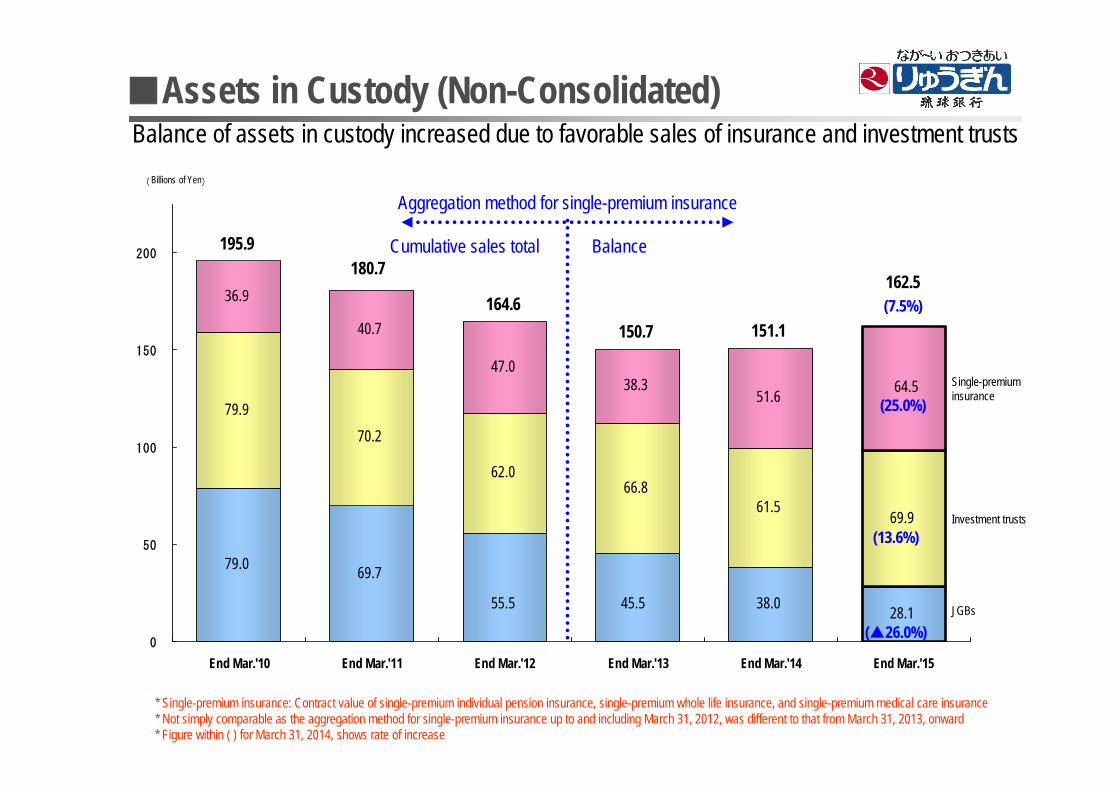
■Assets in Custody (Non-Consolidated)
79.0 69.7
38.0 28.1
79.970.2
62.066.8
61.569.9
36.9
40.7
47.038.3
45.555.5
51.6 64.5
162.5
151.1150.7164.6
180.7195.9
0
50
100
150
200
End Mar.'10 End Mar.'11 End Mar.'12 End Mar.'13 End Mar.'14 End Mar.'15
(Billions of Yen)
* Single-premium insurance: Contract value of single-premium individual pension insurance, single-premium whole life insurance, and single-premium medical care insurance* Not simply comparable as the aggregation method for single-premium insurance up to and including March 31, 2012, was different to that from March 31, 2013, onward
Balance of assets in custody increased due to favorable sales of insurance and investment trusts
Cumulative sales total Balance
Aggregation method for single-premium insurance
(25.0%)
(13.6%)
(▲26.0%)
* Figure within ( ) for March 31, 2014, shows rate of increase
(7.5%)
Single-premium insurance
Investment trusts
JGBs

■Securities (Non-Consolidated)
Securities (Non-Consolidated)
180.5223.3
304.6251.5 279.2 262.9
122.7
29.0
26.4
22.6 15.3
107.7
176.5 187.5204.0
58.3
102.013.5
16.1 12.619.4
13.1
16.6
29.0
577.6525.5
456.1466.2
365.4
284.5
0
100
200
300
400
500
600
700
800
End Mar.'10 End Mar.'11 End Mar.'12 End Mar.'13 End Mar.'14 End Mar.'15
( Billions of Yen)
Balance buildup while operations diversified
Other (foreign bonds, etc.)
Local government bonds
Bonds
JGBs
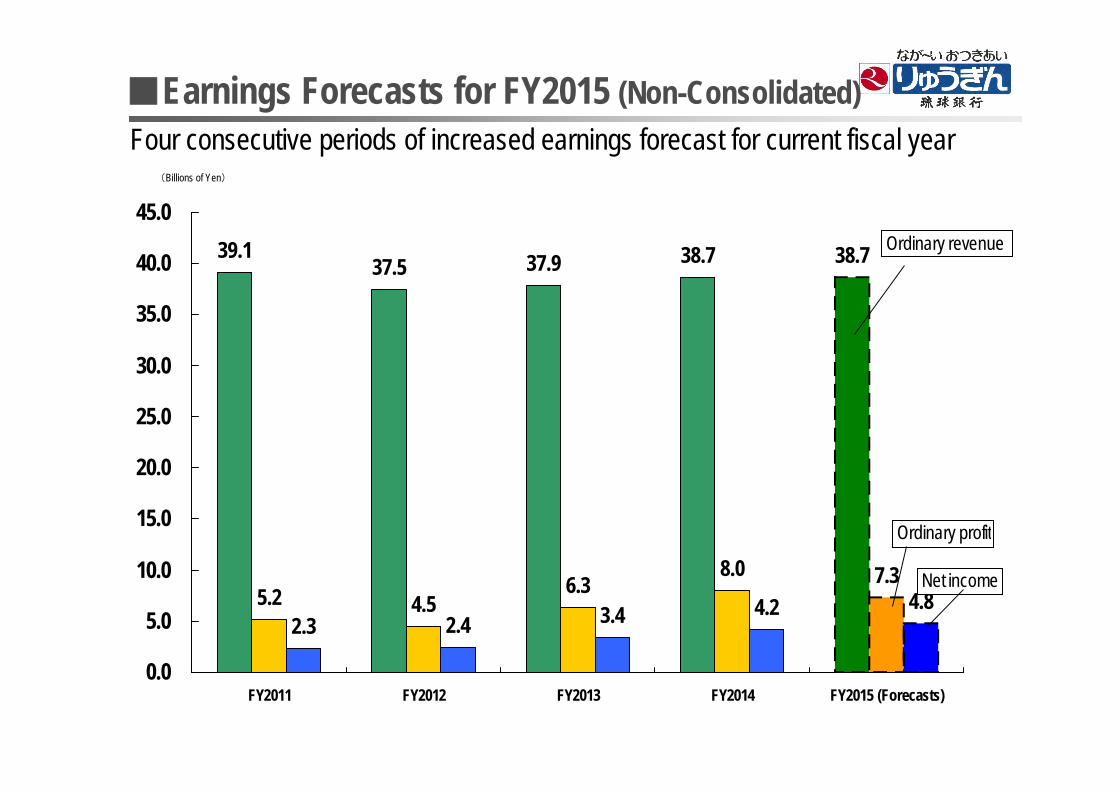
■Earnings Forecasts for FY2015 (Non-Consolidated)
(Billions of Yen)
Four consecutive periods of increased earnings forecast for current fiscal year
39.137.5 37.9 38.7 38.7
5.2 4.56.3
8.0 7.3
2.3 2.4 3.4 4.2 4.8
0.0
5.0
10.0
15.0
20.0
25.0
30.0
35.0
40.0
45.0
FY2011 FY2012 FY2013 FY2014 FY2015 (Forecasts)
Ordinary revenue
Net income
Ordinary profit

■Earnings Forecasts for FY2015 (Consolidated)Significant increase in earnings ultimately expected following the making of OCS, Ltd. into a subsidiary
40.5 39.3 39.9
55.057.4
5.7 5.6 7.49.5 8.9
2.3 2.74.9 5.5
9.9
0.0
10.0
20.0
30.0
40.0
50.0
60.0
FY2011 FY2012 FY2013 FY2014 FY2015 (Forecasts)
Net income
Ordinary profit
Ordinary revenue
* “Consolidated net income for fiscal year ending March 2016” is “net income for the period attributable to parent company shareholders.”
(Billions of Yen)

Bank of the Ryukyus Strategy

■Long-Term Vision
Providing Our Customers with the Three “S’s” (Value)
By providing value that is unmatched by other financial institutions and unique to us, we aim to remain “the Bank of the Ryukyus Group that is our customers’ bank of preference and enjoys the overwhelming support of the local community.”
Providing zero lead-time services
A partner that sympathizes with customers’ thoughts and feelings
SympathySympathy
SpeedSpeed
The Bank of the Ryukyus Group that is our customers’ bank of preference and enjoys
the overwhelming support of the local community.”
Unique solutions from a bank that possesses local knowledge
SolutionSolution

■Strategic Systems
Firm stance on compliance with laws, etc., strengthening of risk management, governance
A bank that is cherished and enjoys the trust of those in the local area and contributes to the development of local communities
While providing the three “S’s,” the Bank of the Ryukyus Group is our customers’ bank of preference and enjoys the overwhelming support of the local community
Promote comprehensive trading by building solid customer relations
Rebuild value creation capabilities by strengthening IT/human resources, etc.
Growth Strategies
Capability Strategy
Management Philosophy
Long-Term Vision
Speed Solution Sympathy
Shared Value 2015-Establishing value provided to customers by displaying the Group’s comprehensive capabilities-
(April 2015 to March 2018)
New Medium-Term Management Plan

■New Medium-Term Management Plan (April 2015 to March 2018)
Shared Value 2015-Establishing value provided to customers by displaying the Group’s comprehensive capabilities-
Boost growth strategies
Corporate Business StrategyGrowth Strategies
Promote comprehensive trading by building solid customer relations
‐Review BPR/organizations from perspectives that maximize customer relations‐
‐Create business opportunities that utilize information‐
‐Strategic rebuilding of human resources and promotion of diversity‐
‐Provide one-stop services that leverage Group capabilities-
Capability StrategyRebuild value creation capabilities
by strengthening IT/human resources, etc.
Individual Business Strategy
‐Provide growth-field support and comprehensive solutions‐
‐Establish life-plan sales stance by omni-channel processes‐
Group Strategy
IT/Sales Information Strategy
Organizational / Business Process Reengineering
(BPR) StrategyHuman Resource Strategy

In top class of nationwide banks in terms of number of holders of medical manager examination qualifications
■Medical/Welfare Field (Corporate Business Strategy)
52.053.8
49.6
61.8
67.7
40
45
50
55
60
65
70
End Mar.'10 End Mar.'11 End Mar.'12 End Mar.'13 End Mar.'14
(Billions of Yen)
Medical and Welfare PromotionGroup established December 2014
Trends in Outstanding Loans for Medical/Welfare Field Development of Human Resources Familiar with Medical Management
Holding of Medical Seminars
Based on declining birth rate and growing proportion of elderly people, strengthen support systems geared toward medical/welfare field

■Support for Ryugin Sixth Industrialization Fund (Corporate Business Strategy)Proactively support business development, etc. by Ryugin Sixth Industrialization Fund
Fund Composition
Bank of the Ryukyus
Agriculture, Forestry and Fisheries Fund Corporation for Innovation,
Value-chain and Expansion Japan (A-FIVE)
Yamada Business Consulting Co., Ltd.
Ryugin Sixth Industrialization
Fund¥500 million
Agricultural, forestry, and fishery business operators
Partner corporations
Holding of Seminars
Capital injection
NOMURA Agri-Planning and Advisory
Moku Moku Rural Industry Research Laboratories Co., Ltd.
Seminars held at five venues in
Okinawa, including Sakishima Islands
First Project
Utilizing the manufacture and sale of Japanese food for followers of Islam as well as logistics hub to export to Southeast Asia
Agricultural Business Revitalization Seminars
2nd There is still time!
Ryugin Sixth Industrialization Fund and Halal Market
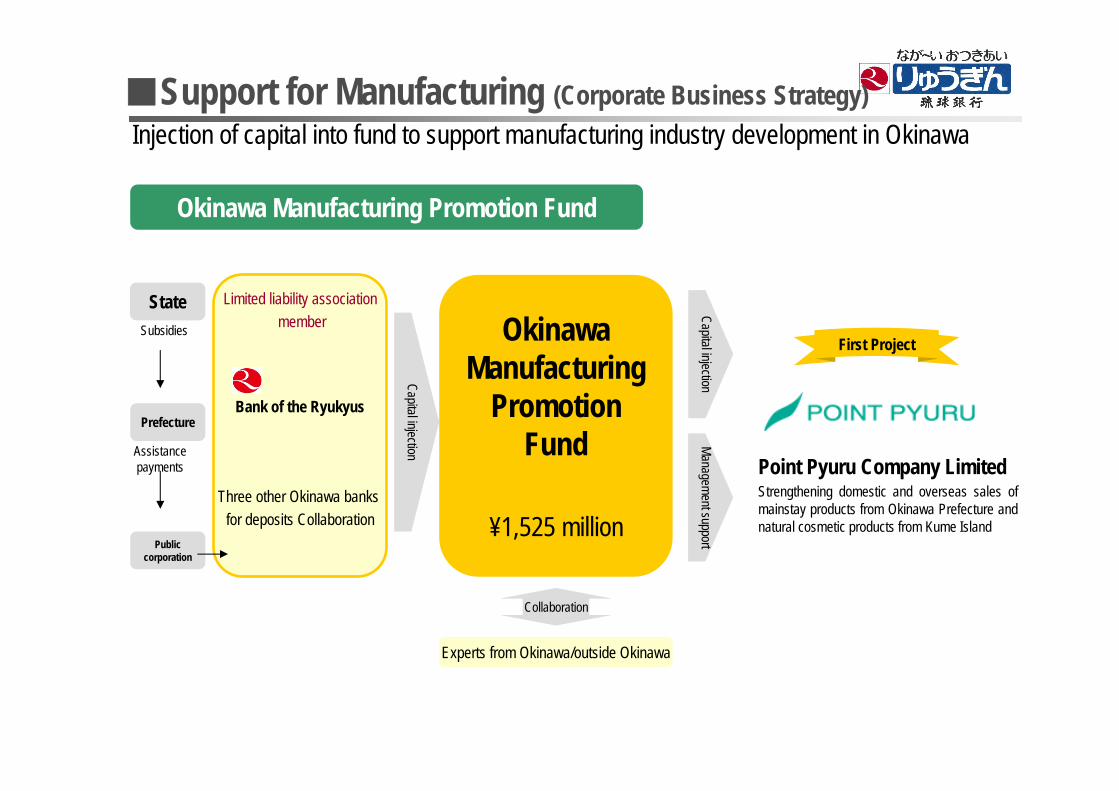
Limited liability associationmember
Bank of the Ryukyus
Three other Okinawa banks for deposits Collaboration
■Support for Manufacturing (Corporate Business Strategy)
Okinawa Manufacturing Promotion Fund
Injection of capital into fund to support manufacturing industry development in Okinawa
Okinawa Manufacturing
Promotion Fund
¥1,525 million
Collaboration
State
Capital injection
Prefecture
Subsidies
Public corporation
Assistance payments
Experts from Okinawa/outside Okinawa
Capital injectionManagement support
First Project
Point Pyuru Company LimitedStrengthening domestic and overseas sales of mainstay products from Okinawa Prefecture and natural cosmetic products from Kume Island

■ Industry-Academia Collaboration (Corporate Business Strategy)
Industry-Academia-Government Partnership Agreement with University of the Ryukyus
Utilizing Bank of the Ryukyus networks to match University of the Ryukyus with local companies
Areas of joint research:Composition (mixing) of concrete repair material made with fly ash (coal ash) and performance-related research, including resistance to salt damage
Zero-emission Technology Okinawa
First Project
in Okinawa
Seeds of Each Faculty’s Research
I want to make use of my foreign language knowledge
Find out about latest management strategies/theories
Provision of new technologies/intellectual property
I need personnel capable of dealing with overseas customers
I want to boost sales
I want the latest technology
Sales Store Trading Needs
Okinawa-based Organization for the Promotion of Industry, University and Government Collaboration
Bank of the Ryukyus Consulting Sales Department
Objectives
New products, business creation, human resource hiringNew products, business creation, human resource hiring

■Sales Channel Expansion Support (Corporate Business Strategy)
【Overview】
Participating companies
68 Companies◇Operators of food-related businesses 49◇Tourism company operators 19
Invited buyers 29 Companies◇Operators of food-related businesses 26◇Tourism company operators 3
Third Business Forum to Convey Okinawa’s Culinary and Visual Charms Held June 4
Support for overseas development by joint holding of business forum by three Okinawanfinancial institutions

■Overseas NetworksBuilding frameworks capable of responding to various overseas development needs
Nippon Asia Halal Association
JETRO Singapore Representative Office
Chinatrust Financial Holding Co.,Ltd (Taiwan)
Halalbusiness support
Overseas development
support
Foreign bank partners
Bank of the Ryukyus
Okinawa Prefectural International Logistics and Commerce Division
Okinawa Prefectural International Logistics and Commerce Division
Okinawa Prefectural Government Hong Kong Representative Office
Okinawa Prefectural Government Hong Kong Representative Office
Nippon Export and Investment Insurance
DBJ Asia Financial Support Center
Aioi Nissay Dowa Insurance Co.,LtdAioi Nissay Dowa Insurance Co.,Ltd
Mitsui Sumitomo Insurance Company, LimitedMitsui Sumitomo Insurance Company, Limited
Tokio Marine & Nichido Fire Insurance Co., Ltd.Tokio Marine & Nichido Fire Insurance Co., Ltd.
Joint Stock Commercial Bank for Foreign Trade of Vietnam
Metropolitan Bank and Trust Company (Philippines)
Metropolitan Bank and Trust Company (Philippines)
Kasikornbank PCL. (Thailand)
MHC Co., Ltd.MHC Co., Ltd.
Brand Research Institute, Inc.Brand Research Institute, Inc.
Halal Japan Business Association
Employee dispatch
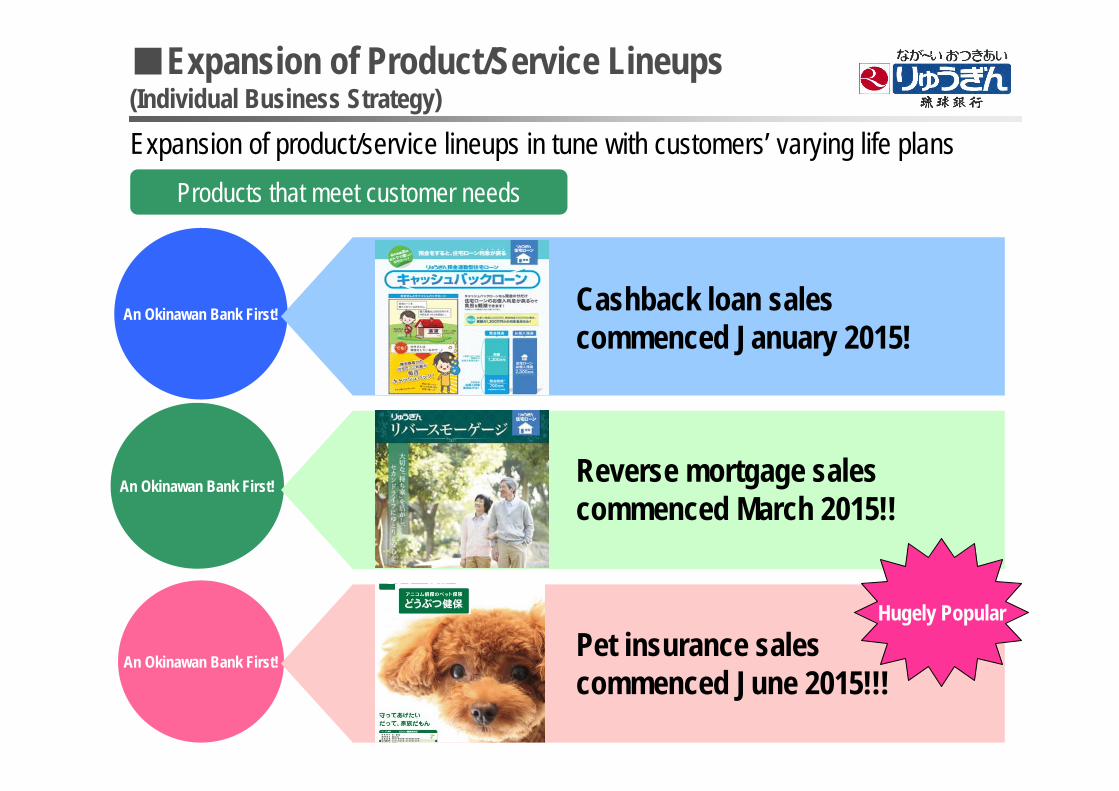
An Okinawan Bank First!
■Expansion of Product/Service Lineups (Individual Business Strategy)
Products that meet customer needs
An Okinawan Bank First!
Expansion of product/service lineups in tune with customers’ varying life plans
Cashback loan sales commenced January 2015!
Reverse mortgage sales commenced March 2015!!
An Okinawan Bank First!Pet insurance sales commenced June 2015!!!
Hugely Popular

■Group StrategyProvide comprehensive services that leverage Group capabilities
April 2014Ryukyu Leasing Co., Ltd. made consolidated subsidiary
April 2015Okinawa Credit Service Co., Ltd. made wholly owned subsidiary
April 2014Ryugin Hosho Co., Ltd . made wholly owned subsidiary
Ryukyu Leasing Co., Ltd.
Okinawa Credit Service Co., Ltd.
Ryugin Hosho Co., Ltd.
Ryugin DC Co., Ltd. Ryugin Research Institute., Ltd.
Ryugin Business Service Co., Ltd.
Ryugin Office Service Co., Ltd.*

■IT/Sales Information Strategy
SNSTel
Range of workplaces
Branch / Loan Center
Home visits
Mobile
PC
Seminar
Evolution of One-to-One marketing
May 2015 Ryugin Azukari Archive fully operational at all branches
May 2014 BankNeo sales support system fully operational
From February 2014 Distribution of iPad600 devices
April 2015 Introduction of mobile printers
Multi-Channel
Omni-Channel
Sales support systems

■Organizational/Business Process Reengineering (BPR) StrategyDevelop branches that make customers feel at home
Café Sty
le
Chatan Loan Center opened September 2013
Makabi Branch opened March 2013
Ohjana Branch openedFebruary 2015

■ Human Resource Strategy
3338
4557
1920
24
233
35
4
25
25
21
2
1
1
3
0
20
40
60
80
100
120
140
End Mar.'12 End Mar.'13 End Mar.'14 End Mar.'15
(Staff)
Personal PropertyAssessment Adv isors
Medical ManagementConsultants
Small/Medium EnterpriseConsultants
FP1 Class
AgriculturalManagement Adv isors
Dispatch of individual award winners for overseas training
Of the 10 award winners in fiscal 2014, seven were
women
Train human resources who have provided expertise based on high level of their capabilitiesTrends in Numbers of Professionally Qualified Personnel
Azukari Archive Meisters

All enquiries regarding this presentation should be addressed to:Bank of the Ryukyus,Limited
General Planning DepartmentTelephone: +81-98-860-3787
Fax: +81-98-862-3672E-mail: [email protected]
The information in this presentation is on a non-consolidated basis unless otherwise specified.
Information is based on summaries of published data, and some totals presented in this presentation may not add up due to rounding.
This material contains information about the future(forward-looking information)such as forecasts, outlooks, objectives and plans concerning the Bank. The forward-looking information was created based on information available as of May 14,2015 and does not represent a guarantee of future performance. Certain assumptions and hypotheses are used for the description of forward-looking information, but these assumptions and hypotheses could be inaccurate from an objective perspective and may not materialize in the future. Forward-looking information involves risks and uncertainties, and we ask readers to refer to the brief notes on the settlement of accounts and securities report of the Bank for more details. The Bank will not update the forward-looking information contained in this material.
■About This Presentation