Bank of Israel Research Department - boi.org.il and do not necessarily reflect those of the Bank of...
46
Bank of Israel Research Department Does Financial Regulation Unintentionally Ignore Less Privileged Populations? The Investigation of a Regulatory Fintech Advancement, Objective and Subjective Financial Literacy 1 Maya Haran Rosen* and Orly Sade** Discussion Paper No. 2017.10 August 2017 _______________________ Bank of Israel - http://http://www.boi.org.il * Haran Rosen: Finance Department, Jerusalem School of Business, The Hebrew University of Jerusalem, The Bank of Israel. Research Department - Email: [email protected] Phone: 972-6552694 ** Sade: Finance Department, Jerusalem School of Business, The Hebrew University of Jerusalem, Email: [email protected]. 1 We have benefited from comments by Noam Zussman, Anne Lavigne, Yishay Yafeh, Adi Brender, Avi Wohl, Dan Galai, Yoram Landskroner, Yaniv Dover and Naomi Hausman, participants at the 2016 Industrial Organization, Regulation and Competition Policy in Israel, the 2017 Law and Finance Research Meeting at the Hebrew University, the 10 th Financial Risks International Forum: Retail Finance and Insurance: The Impact of Fintech, and seminar participants at the Hebrew University of Jerusalem, the Bank of Israel, the The Center for Academic Studies Or Yehuda, and the Israel Antitrust Authority. This project received financial support from the Krueger Center at the Hebrew University (Sade). Sade thanks the Stern School of Business at NYU for support and hospitality. Any views expressed in the Discussion Paper Series are those of the author and do not necessarily reflect those of the Bank of Israel Research Department, Bank of Israel. POB 780, 91007 Jerusalem, Israel
-
Upload
hoangquynh -
Category
Documents
-
view
217 -
download
0
Transcript of Bank of Israel Research Department - boi.org.il and do not necessarily reflect those of the Bank of...

Bank of Israel Research Department
Does Financial Regulation Unintentionally Ignore Less
Privileged Populations? The Investigation of a Regulatory
Fintech Advancement, Objective and Subjective
Financial Literacy1
Maya Haran Rosen* and Orly Sade**
Discussion Paper No. 2017.10
August 2017
_______________________
Bank of Israel - http://http://www.boi.org.il
* Haran Rosen: Finance Department, Jerusalem School of Business, The Hebrew University of Jerusalem, The Bank of Israel. Research Department - Email: [email protected] Phone: 972-6552694** Sade: Finance Department, Jerusalem School of Business, The Hebrew University of Jerusalem, Email: [email protected].
1 We have benefited from comments by Noam Zussman, Anne Lavigne, Yishay Yafeh, Adi Brender, Avi Wohl, Dan Galai, Yoram Landskroner, Yaniv Dover and Naomi Hausman, participants at the 2016 Industrial Organization, Regulation and Competition Policy in Israel, the 2017 Law and Finance Research Meeting at the Hebrew University, the 10th Financial Risks International Forum: Retail Finance and Insurance: The Impact of Fintech, and seminar participants at the Hebrew University of Jerusalem, the Bank of Israel, the The Center for Academic Studies Or Yehuda, and the Israel Antitrust Authority. This project received financial support from the Krueger Center at the Hebrew University (Sade). Sade thanks the Stern School of Business at NYU for support and hospitality.
Any views expressed in the Discussion Paper Series are those of the
author and do not necessarily reflect those of the Bank of Israel� �
������������� ������������������������� �
Research Department, Bank of Israel. POB 780, 91007 Jerusalem, Israel

���
������������������������������������������������������������������� ��
���������������!������������� ������������������������������ �
�
������� !������������ �
������
���� ���� ������������������������������������������������������� ������
�� ������� ������������!���������������������������� ���������!�"�������������
���������� ���������� ������������!�������� ��������������������!�� �
���������������#�"������������!������������������������������!���
�� �������� ��������#�����$����������������� ����������������������%����� ��������
��������������������������!���"������ �� ���������������������������������
�&��&�����!�������������������������� �������� ��������� �!���� ��������������
�������������� !���������������"�� �������������������������� ��� !���!����
���� ���!������������������ ������ �!�������������"���������������������
��������!���� ��!�����!�� �'�������������� �������"� �������������������
�������� ���������������!�'���������������!����&��&���������������
�������� �� ���������!����������'�������������������#���������������
���� �������������
�
� �
�

2
�
Does Financial Regulation Unintentionally Ignore Less Privileged Populations?
The Investigation of a Regulatory Fintech Advancement, Objective and Subjective
Financial Literacy
�
Maya Haran Rosen and Orly Sade
Abstract
In 2013-2015, the Israeli insurance and long term savings regulator reached out to the
Israeli population, recommending the use of a new centralized Internet portal created by
the regulator to help individuals find inactive retirement plans and withdraw inactive
funds. We find that the government's effort did not result in withdrawals of the majority
of the accounts, and did not reach all subpopulations equally. Provident fund records
indicate that those who took action and withdrew funds following the campaign live in
central locations that have higher socioeconomic rankings, and they are relatively older.
Using survey data, we found evidence that those with low financial literacy and
confidence in their knowledge of retirement planning and the unemployed were less
likely to have been aware of the financial regulatory campaigns. It seems that
confidence in one's financial knowledge is more important for financial action than
objective literacy. The survey further shows the importance of gender, age, education,
and immigration status. We conclude that less privileged populations were less likely to
have been aware of the campaign, to enter the Internet portal, and to have taken action
based on the information.
�

���
1. Introduction
In recent decades, financial regulation around the globe has transferred financial
responsibilities (e.g., long term savings) from the government and employers to individuals.
There is an emphasis on transparency and disclosure, with the aim of individuals using this
available information rationally and in their best interest. In addition, the advancement of
technology has enabled regulators to use digital media and Internet portals as a platform for
their financial action. The use of these portals is intended to promote efficient direct
interaction or to provide aggregation of information in timely manner while bypassing
intermediaries. However, this transfer of responsibility, combined with the increased use of
technology, has been criticized in that it does not take into account the public’s financial
literacy and hence the regulation can be unsuccessful—people may not respond to the
regulation as intended, and the regulation may not reach all subpopulations equally. This
can also impact on public opinion of, and trust in, the financial sector and financial
regulators.� This leads to the questions, which warrants empirical answers, of whether all
individuals are receiving the needed information and whether they are acting upon it. The
answer to these questions can be based on two channels: the first channel is information
dissemination and comprehension, and the second is transaction costs and behavioral
biases.2
This paper uses a natural experiment in Israel (“"Money Mountain"”) and focuses on the
information dissemination and comprehension channel, which can have a different effect on
different sub-populations. In this paper, we explore who responded to a financial regulatory
change in retirement savings and check whether the regulatory initiative unintentionally
ignored certain populations, who may not have been cognizant of, understood, or acted
upon the information provided.
Our work is related to literature documenting underprivileged populations that failed to
receive benefits in designated programs such as the Earned Income Tax Credit and the State
���������������������������������������� �������������������1 Zingales (2015) and Campbell (2016).
2 For a summary on issues regarding time preferences, risk preferences, social preferences,
overconfidence, projection bias, framing, limited attention, menu effects, persuasion and social pressure, and emotions please refer to DellaVigna (2009).

4
�
Health Insurance Program3, and indicates that an information channel is an important factor
in explaining the uptake.4
In the Israeli pension system, there is a high percentage of inactive accounts (over 50% of
accounts in some vehicles5), many of which are very small and savers are probably unaware
of their existence. These accounts were created because employers opened new accounts
for their workers, often deciding for the employees about many aspects of the plan
including the institution that will manage it, and there is no automatic continuity of savings
after a change in the workplace. This means that a new account, in a different vehicle or
with a different service provider, can be opened when working in more than one job at a
time or when starting a new job. Recent developments in technology enabled the regulator
to (a) gather information about these accounts, and (b) build a digital platform that allows
the population to access their personal information while upholding privacy standards. In
2014, the Israeli insurance regulator in the Ministry of Finance reached out to the Israeli
public to inform them of a new service—an Internet portal intended to help individuals find
inactive retirement plans. The campaign was named "Money Mountain" which implied the
possibility of finding great sums of lost money. A year after the "Money Mountain"
campaign, a tax exemption on small inactive plans in provident funds came into effect, to
encourage individuals to withdraw funds and avoid new minimum management fees that
would exhaust the funds over time.
The first campaign, the "Money Mountain" campaign, was used to try to raise the
population’s awareness of the fact that they may have inactive funds in retirement plans
that they are not aware of, and to inform them of a new service—an Internet portal that
indicates whether one has such an inactive fund and at which retirement plan provider. This
first campaign was publicized via a commercial on television, radio and the Internet, and
was aimed at a broad population. The second campaign, regarding the tax exemption, was
not as broad, and focused on small inactive funds in provident funds, where there is a
strong incentive to withdraw funds because of new minimum management fees that would
���������������������������������������� �������������������3 Currie (2006).
4 Eg. Russel et al. (2014) Herd et al (2013), Riphahn (2001), Leventhal, Singer, and Jones (1965), Coe
(1983) and Daponte et al. (1998). Coe (1983) emphasized lack of information as the most significant explanation for the unsatisfactory rate of uptake of the food stamps program, even though the program was heavily publicized. Ebenstein and Stage (2010) suggest that reducing application barriers alone may not be an effective tool for increasing program participation and that information barriers may still exist. �
The 2014 CMISD annual report shows that in 2014, 48% of accounts in the new pension system were
inactive and about 80% of accounts in the old pension system were inactive.

���
exhaust the small inactive funds over time. The second campaign did not use a commercial,
and its message was distributed via professional media and news and by a letter which the
provident funds were obligated to send to eligible individuals. By the end of the second
campaign, only 16 percent of eligible accounts were withdrawn6, much lower than initially
expected. In examining the effectiveness of the financial regulation, we investigate which
individuals responded to the regulation—that is, were aware of the financial regulation,
entered the Internet portal and/or took financial action. We define financial action as
actually making withdrawals from retirement vehicles or contacting the retirement fund
manager with the intention of withdrawing the account.
There are several advantages of using these financial campaigns as our case study: 1.They
are relevant to the general adult population; 2. They were publicized nationally; 3. They are
related to long-term retirement savings, a topic important to the public in Israel
(Mugerman, Sade, and Shayo 2014); 4. Even though the actions required are simple, the
long term financial "jargon" might deter individuals and affect information dissemination;
5. There is no stigma for people who act upon the regulation, as well as relatively low
transaction costs, which allow us to focus on the information effect on take-up.7 In
additional, it is interesting to focus on the technological and digital aspect of the
regulation—particularly, as there are no mediators or advisors when using an Internet
portal, financial literacy and other socioeconomic characteristics might play a bigger role.
The Organization for Economic Cooperation and Development (OECD) describes financial
literacy as the "...combination of customers’/investors’ understanding of financial products
and concepts, and their ability and confidence to appreciate financial risks and
opportunities, to make informed choices, to know where to go for help, and to take other
effective actions to improve their financial well-being” (Atkinson and Messy 2012). We
will use the term "financial literacy" to describe objective financial literacy in this paper.
The academic literature documents that financial literacy is connected to financial
behavior—planning and saving for retirement8, personal debt management9, participation in
���������������������������������������� �������������������6 Data received by Capital Markets, Insurance and Savings Division representatives. �
Currie (2006) cites three channels that were found to affect less privileged populations: lack of
information, as well as behavioral explanations: stigma and the cost of the transaction. Moffit (1983) provides an economic model of stigma and Baumberg (2016) shows a quantitative measure of the effect of stigma on benefit take-up in the UK. 8 Hilgert, Hogarth and Beverly (2003), Bayer, Bernheim, Scholz (2009), Lusardi and Mitchell (2014) for
a review, Clark, Lusardi and Mitchell (2015) and Uppal (2016). 9 Lusardi and Tufano (2009).

6
�
the stock market10, choosing mutual funds with lower fees11 and wealth accumulation and
management.12 Financial literacy is correlated with sociodemographic characteristics such
as gender, education, wealth, race and ethnicity.13 In addition, financial literacy has a
generational effect—it has been documented that parent’s financial literacy affects the
child’s financial literacy and financial behavior.14
In this paper we investigate another aspect of the financial literacy definition; subjective
financial literacy, which is confidence in one's own knowledge of financial issues.
Confidence can affect a person’s financial behavior, in addition to one's objective
knowledge. Having confidence in one's own knowledge of the issue mitigates the perceived
difficulty of the task (even more than actual knowledge) and hence overcomes the tendency
to procrastinate and delay taking action.15 Allgood and Walstad (2012) showed that both
financial literacy and financial confidence are important when looking at financial
behavior.16 Individuals with high self-reported knowledge of economics or financial
knowledge were more likely to plan their finances, have substantially more retirement
wealth and to pay fewer management fees. Financial knowledge is also correlated with
sociodemographic characteristics. It has been documented that older, better educated, and
male respondents are more likely to have a subjective financial literacy.17
In order to investigate the effectiveness of the "Money Mountain" financial campaigns, we
use two data sets. The first data set is from a provident fund provider, and contains
information on withdrawals from tax exempt funds, totaling over 12,000 eligible accounts.
The second data set is a nationally representative Internet survey sample of 504 people,
which was distributed in 2015 after the end of the campaigns. It is complemented by an
additional sample of 124 respondents from the same Internet survey who stated they were
aware of the "Money Mountain" campaign. We begin our research first with an estimate of
the percentage of accounts that were withdrawn. Then, using the provident fund data and ���������������������������������������� �������������������10
Van Rooij, Lusardi, and Alessie (2011). 11
Hastings and Tejeda-Ashton (2012), Hastings et al. (2010), and Hastings and Mitchell (2011). 12
Stango and Zinman (2007), Hilgert, Hogarth, and Beverly (2003) and Lusardi (2008). 13
OECD (2005), Lusardi and Mitchell (2008), Atkinson and Messy (2012), Brown and Graf (2013), Lusardi and Mitchel (2014) and Bucher-Koenen, Lusardi, Alessie, and Van Rooij (2014). Financial literacy is also related to personal attributes such as cognitive ability and motivation, e.g., Fernandes, Lynch and Netemeyer (2014), Rooij, Lusardi and Alessie (2011) and Lusardi, Mitchel and Curto (2010). 14
Lusardi, Mitchel and Curto (2010) and Mandell (2008). 15
For additional discussion see Tversky and Shafir (1992) and Heath and Tversky (1991). 16
Financial confidence was found to be important in Parker et al. (2011), Rooij, Lusardi and Asserdie (2011b), Lusardi and Mitchel (2007, 2009), Lusardi and Beeler (2006), Lusardi and Samek et al. (2014) and while using different measures, Hadar, Sood and Fox (2013). 17
Lusardi and Mitchel (2014) for a review, Drolet (2016).

(��
the survey, we try to find how and when financial literacy, confidence in retirement
knowledge, geography, age and other sociodemographic characteristics of individuals affect
the awareness and the actions taken by people following the financial campaigns. As
administrative data from provident funds and survey data each have their own
shortcomings, by using both data sources we receive a richer evaluation of the actual effect
of the financial regulation on the population.
The proprietary data and the survey data indicate a low withdrawal rate of around 15
percent, which is consistent with the one received from the regulator (indicating that our
samples are representative of the total population in this matter). In this paper, we show
evidence from both data sources that having a higher socioeconomic ranking is correlated
with being aware of financial regulation and taking financial action. The proprietary data
from the provident fund show that individuals who withdrew funds come from localities
with higher socioeconomic indices and are relatively older. The survey data show evidence
that people with low financial literacy, low confidence in their financial knowledge,
younger generations, people with low education and women experience difficulties in being
aware of and understanding regulatory financial campaigns and have difficulties taking
actual financial action in this context. As expected, financial literacy is correlated with the
socioeconomic locality index. The fact that we find gender to be important in the survey
data but not in the data from the provident fund can be explained by the fact that we do not
know which family member actually carries out the actual withdrawal of funds, and that a
male family member may be withdrawing funds for a female family member. Additionally,
for entering the Internet portal, education seems to play a role. We also find that immigrants
are less aware of widespread financial campaigns broadcast in mass media. When looking
at entries to the Internet portal and financial action taken by individuals, confidence in one's
own knowledge is more important than one's objective knowledge.
Our use of a survey in addition to the provident fund data enables us to investigate
individuals who declared that they contacted the fund management with intent to withdraw
funds, and not just the actual withdrawals. This helps us to disentangle the information
channel from transaction costs and technical difficulties. We are also able to connect
objective and subjective financial literacy as explanatory variables to the effectiveness of
the financial regulation and zoom in on their effect on the success of the Internet portal.

8
�
Financial long term savings regulations that are aimed at the general public are expected to
be widespread, as part of the transfer of responsibility to the individuals which makes this
research and outcomes important for future regulations.
The paper is organized as follows. Section 2 provides institutional details on the two
financial campaigns in Israel as well as an overview of the Israeli retirement savings market
and demographics, and Section 3 describes the data. Section 4 discusses results for the
provident fund data. Section 5 describes the main independent variables: how the financial
literacy index is built, and how we defined subjective financial variables as well as results
for the survey data. Section 6 concludes.
2. Setting
This section describes the two retirement financial regulations, with an overview of the
broader context in Israel, including Israel’s retirement savings market and a brief outline of
Israel’s demographics. The section continues with a description of two socioeconomic
geographical indices and a summary of past findings regarding financial literacy in Israel.
2.1 “Money Mountain” campaign and tax exemption campaign
In the beginning of 2013, the Capital Markets, Insurance and Savings Division of Israel’s
Ministry of Finance (hereinafter, “CMISD”), which regulates retirement saving vehicles,
launched an Internet portal and search engine allowing people to find inactive accounts
(Figure 1). Inactive accounts are defined as accounts that have had no new deposits in the
past two years, in old or new pension funds and in provident funds. In May 2013, the
CMISD ran a campaign called "Money Mountain". The campaign was named "Money
Mountain", implying the possibility of finding great sums of lost retirement money, and
was publicized with commercials on television and radio, and on Internet sites. The
campaign was aimed at promoting the simple action of entering the designated Internet
portal, and it used retirement savings "jargon". The campaign did not have explicit
information on the process and how to use the Internet portal although explicit information
was found to be important in promoting action.18
���������������������������������������� �������������������18
Leventhal, Singer, and Jones (1965) show that a communication about tetanus shots was effective in changing beliefs and attitudes, but only 3% took the step of getting inoculated, compared with 28% of those who received a more precise explanation of how to get to the place where the inoculations were taking place and to schedule a time.

)��
Figure 1 - CMISD Campaigns timeline
This figure shows the CMISD “Money Mountain” and tax exemption from small inactive accounts in provident funds campaigns from the beginning of 2013 until the beginning of 2016.
The portal uses information collected from all long term savings providers in Israel. The
financial institutions were obligated by law to provide this information to the regulator. The
Internet portal allowed individuals to enter the portal using data from their identity card and
view all of their inactive funds (as long as they have inactive plans).19 To move or
withdraw the inactive funds, the individuals needed to contact the retirement plan provider
and get further instructions that include either sending in forms or physically arriving at the
provider's office or a bank branch.
In June 2013, the CMISD commissioned a survey in order to evaluate the success of the
campaign, on a representative Internet sample of 504 non-ultra-Orthodox Jews between the
ages of 30 and 60. The findings include: 67 percent were aware of the "Money Mountain"
campaign, and the percentage was higher for older individuals and secular Jews. Fifty-four
percent of respondents stated that they entered the "Money Mountain" Internet campaign
site, and the proportion was higher for individuals aged 30–39, secular Jews and individuals
with higher income. Of the people who were aware of the campaign, 66 percent indicated
���������������������������������������� ���������������������
As well as the providers where these accounts are held, and the providers’ information (telephone
number, fax number, email and street address).
Beginning of 2013:
Launch of Internet site and search
engine for non-active retirement accounts.
May 2013:
One month "Money
Mountain" campaign on television, radio and
Internet sites.
June 2013:
CMISD evaluation
of the "Money
Mounatin" camapign.
April 2014:
Start of a one-year tax
exemption period which was extended
until July 2015, for
withdrawal of small accounts from provident
funds.
January 2015:
Start of minimum fees in provident funds which will exhaust funds from
small inactive accounts in provident
funds.
August 2015: Representative
internet survey.
The beginning of 2016: The tax
exemption period for
small inactive accounts
was extended
indefinitely.

10
�
that they used or intended to use the "Money Mountain" Internet portal. But, it is interesting
to note that 51 percent of the people who were not previously aware of the campaign stated
that they used or intended to use the "Money Mountain" Internet portal and that this number
was higher for older individuals and secular Jews. Additionally the CMISD assesses that
there were over 1.2 million entrances to the "Money Mountain" Internet portal during the
month of May 2013.
At the same time as the “Money Mountain” campaign, the CMISD was working on passing
a tax exemption for withdrawals of small inactive saving accounts (under 1,800 USD20)
from provident funds for a short period of time (a year). The reason for the need for the tax
exemption was that in the beginning of 2015, legislation from 2013 would come into effect
and impose new minimum management fees in new provident funds. Provident funds have
maximum fees that they can collect as a percentage of deposits and accruals. The new
minimum fees regulation allows new provident funds to collect a fixed amount of 2 USD21
per month, if they collect less than this amount using the maximum percentage fees. The
new minimum management fees would exhaust small inactive funds over time. The
regulator hoped that the tax exemption would encourage individuals to withdraw funds
from small inactive accounts in provident funds and avoid losing their investment in the
fund to fees. The tax exemption was put into effect in April 2014 for a year, but was then
extended for another three months until the end of July 2015. The provident funds were
also obligated to send owners of small inactive accounts a letter which describes their
ability to withdraw their funds, tax exempt, for a short period of time, and the technicalities
of how the funds can be withdrawn (via the fund or a bank). The CMISD assessed that
there are about 1.8 million small inactive accounts, valued at a total of around USD 680
million.22 During the first tax exemption period there was press coverage of the tax
exemption in news and lifestyle content on television, radio, the Internet and in print media.
In the first quarter of the tax exemption, until the end of June 2014, only 300 million
accounts were withdrawn (11.5 percent of the accounts), and by the end of the period
CMISD stated that only around 15 percent of the accounts were withdrawn, equal to
approximately 19 percent of the total funds in these accounts.23 During the tax exempt
���������������������������������������� �������������������20
Approximately NIS 7,000. 21
NIS 6 22
Over NIS 2 billion. 23
Data received by CMISD representatives.

����
period, withdrawing funds from the provident fund was easier than in normal times and the
funds published the procedure in the letter they sent to clients with eligible accounts.
The CMISD originally expected that the majority of funds would be withdrawn during the
tax exemption campaign and were surprised by the relatively low withdrawal rate.
In July 2015, the CMISD extended the tax exemption again from the beginning of 2016
indefinitely.
2.2 Retirement plans in Israel
In Israel there are three retirement savings vehicles: provident funds, pension funds and
insurance funds. These in general allow the withdrawal of funds as an annuity24, except for
money saved in provident funds up until 2008, which can be withdrawn as a lump sum after
15 years of savings. Because of this, historically, provident funds were used as a medium
term savings vehicle as well as a retirement savings vehicle.
Since 2008, saving in an occupational retirement savings vehicle is mandatory for non-self-
employed workers, and as of 2016 the minimum contribution level is a total of 17.5% of
salary.25 In 2014, there were 11 new (opened in 1995) defined contribution (DC) pension
funds, 19 old (due to regulation, they were closed to new savers as of 1995) defined benefit
(DB) pension funds, 12 insurance companies and 76 active provident funds.26
When workers in Israel change their place of work they do not automatically continue
saving in their former occupational savings vehicles. This means that a large percentage of
workers who change jobs have inactive accounts in former savings vehicles. The CMISD
assessed at the time of the "Money Mountain" campaign that 40% of the accounts in all
retirement saving vehicles are inactive and that there are more than USD 2.5 billion27 in
these inactive accounts. The 2014 CMISD annual report shows that in 2014, 48% of
accounts in the new pension system were inactive and about 80% of accounts in the old
pension system were inactive.
���������������������������������������� �������������������24
As of 2016, an amount permitting an annuity of at least USD 1,200 is needed in order to be able to withdraw sums as a lump sum without a fine. 25
This is another reason why the "Money Mountain" campaign is relevant to the general population as well as its appeal to inheritance from inactive relative's funds. 26
Capital Markets, Insurance and Savings Division, Annual Report 2014. 27
NIS 10 billion.

12
�
2.3 Israel: Demographics
Compared to other OECD countries, Israel is characterized by high income inequality
(Figure 2). Nineteen percent of families in Israel live in poverty. Poverty rates are higher
for ultra-Orthodox Jews and Arab families (both had a poverty rate of over 50 percent in
2014), families where the head of the household has less than 8 years of education, families
where the head of the family is unemployed, immigrant families, and families living in the
geographic periphery of the country.28 The poverty rate for women in Israel (18.3% in
2014) is higher than for men (17.1% in 2014) and the gender gap for earnings in Israel is
higher than the OECD average.
Figure 2 – Gini coefficient on disposable income, 2012
This figure shows the inequalty index of the Gini coefficient on disposable income in selected countries in 2012. Israel is colored in red. The data is publicly available from the OECD Employment Database.
Competence in a digital environment of Israeli adults from the 2014-2015 Program for the
International Assessment of Adult Competencies (PIAAC) shows that Israeli adults have a
slightly lower average grade (274) than the OECD average (279). The survey also shows a
considerable difference between the Jewish population which has a grade slightly higher
than the OECD average (280) and the Arab population which has a much lower grade
(238).29
���������������������������������������� �������������������28
National Insurance Institute of Israel, Poverty and Social Gaps Report, 2014. ��
The Israeli Central Bureau of Statistics.
0
0.05
0.1
0.15
0.2
0.25
0.3
0.35
0.4
0.45
0.5
Gin
i co
effi
cien
t

����
2.4 Israel: Geographical indices
The proprietary data gives us information on individual's localities. We then match the
locality data with geographical indices. Israel’s Central Bureau of Statistics publishes two
sociodemographic indices for Israeli local authorities—the socioeconomic cluster
membership index and the periphery index. These indices can be used to characterize
localities and their population, on average. These indices are noisy proxies for individual
data because they use average characteristics of the localities, and there can be large
internal differences in the conditions of the population in these localities.
The socioeconomic locality index is calculated using data from the 2008 national survey on
demographic and standard-of-living features of the population in each locality, such as data
on income, level of education, level of employment and national insurance allowances
given to the population in each locality. Each locality is given a ranking between 1 and 10,
where 1 is given to localities with very low socioeconomic conditions and 10 to localities
that have very high socioeconomic conditions. Ninety percent of the localities with a low
grade of between 1 and 3 are Arab localities.
The periphery index is based on data from 2004 and grades the localities’ proximity to
economic activity or potential for activity. The index is calculated using data of the
proximity to the Tel Aviv district, the locality’s size and the locality’s proximity to other
local authorities. Each locality is given a ranking between 1 and 5, where 1 is given to the
most peripheral localities and 5 to localities that are the least peripheral. Scores of 4 and 5
are given to localities in the proximity of the Tel Aviv district and the Jerusalem district.
2.5 Israel: Financial literacy
In 2012, the Israeli Central Bureau of Statistics (hereinafter, CBS) published a financial
literacy survey that included a representative survey of 1,200 people in Israel over the age
of 20.30 The survey showed that relative to the OECD average31, the Israeli population has
low financial literacy. The survey shows that 59% of the Israeli population understands
how to calculate interest paid on a loan (versus an international average of 82%), 65%
���������������������������������������� �������������������30
Financial Literacy Survey: Knowledge, Opinions and Behavior in Financial Issues, November 2012, CBS. 31
The average was calculated for the following countries: England, Germany, Norway, Ireland, Poland, Peru, Albania, South Africa, Estonia, Hungary, Armenia, the Czech Republic, Albania and the Virgin Islands.

14
�
know the definition of inflation (versus an international average of 80%) and 48%
understand diversification (versus an international average of 71%).
The survey also indicated that the Israeli population has a very positive attitude toward long
term saving. Only 18% stated that they would rather spend money today and not save for
the long term versus a 45% OECD international average. This second finding may indicate
that Israel’s population might have a more positive attitude toward retirement saving than
in other countries.
Meir, Mugerman and Sade (2016) analyzed financial literacy, general financial behavior,
retirement planning and numeracy abilities in Israel, using an Internet survey taken in 2012
of 501 Israeli individuals between the ages of 46 and 61. The findings of financial literacy
in Israel in their paper are higher than those in the CBS financial literacy survey. They
document that their financial literacy index is positively correlated with being male, having
higher education, having higher income and being a non-immigrant. Additionally, the paper
shows that retirement planning is correlated with a higher financial literacy index.
3. Data description
The data was obtained from two sources: A large provident fund and two Internet surveys
(a main survey and a complementary survey).
3.1 Provident fund data
The first data source is proprietary data obtained from a large provident fund in Israel, and
contains data on 12,735 inactive accounts eligible for tax-exempt withdrawal beginning
March 1, 2014, with an indication if these funds were withdrawn before the end of the tax
exemption period that ended in July 2015.32 For the provident fund, we have data on
account holder’s gender (does not have to be the person who actually withdraws the funds),
age, value of funds, locality and if the account was withdrawn. Using the locality data we
are able to identify if the locality is Arab, as well as the locality’s CBS socioeconomic
index and CBS periphery index.
���������������������������������������� �������������������32
We were not able to retrieve data from earlier periods of time.

����
In the provident fund there is a majority of females and the average population has stronger
socioeconomic indices than the country’s average—54% are female, 4% are from Arab
localities, the average socioeconomic index is 5.7, which is above the country’s average of
4.8, and the periphery index is 3.6, which is also above the country’s average of 2.8. The
average eligible fund size is around USD 450 (median USD 250).33
3.2 Internet surveys—Main survey and complementary survey
Our Internet survey consisted of questions regarding retirement savings, and included
questions about awareness of the two financial campaigns and financial action taken
because of the campaigns. The survey also included objective questions about financial
literacy, subjective questions about how the respondent feels toward the issue of retirement
savings, and several demographic questions.
The main Internet survey, based on a nationally representative sample of 504 people, was
conducted in August 2015 using a professional survey company. This sample is supposed
to represent the general population, even though, like all Internet surveys, it represents only
the technologically skilled population and underrepresents certain parts of the population
such as ultra-Orthodox Jews and Arabs.
Our sample is similar to the CBS Expenditure Survey of 2014, which is a representative
sample of the Israeli population (percentage found in CBS survey in parentheses): 48%
males (48%), 57% married (64%), 29% with traditional beliefs (29%), 15% with religious
beliefs (13%), 6% retirees (5%) and 22% unemployed (25%). Our Internet survey seems to
underrepresent immigrants, with only 16% (30%), ultra-Orthodox Jews who are only 3%
(8%) and the Arab population which is only 1% (16%) in our sample. The survey data also
indicates that only 26% of ultra-Orthodox Jews have a personal Internet subscription and
the Arab population only has a 41% personal Internet subscription, compared with a 71%
national average.
The nationally representative survey was complemented by an additional sample of 124
people who stated that they were aware of the "Money Mountain" campaign, so that we
could have better statistics on this population. The complementary sample has more males,
is more educated, more employed, more secular and older.
���������������������������������������� �������������������33
NIS 1,650 and NIS 990, respectively.

16
�
4. Provident fund withdrawals
The proprietary data from the provident fund has information on actual withdrawals. While
we have each individual’s choice, we have limited information about their personal
characteristics or financial knowledge.
Informal inquiries with the provident fund indicated that during the campaign the
withdrawal rate was much higher than the usual withdrawal rate and the campaign had an
impact. The withdrawal rate from eligible inactive accounts from the provident fund was
16%, similar to the 15% stated by the CMISD.
Table 1 - Mean differences of withdrawn accounts during tax exemption campaign
by different population subsets
(Number, means, percent)
Population
subsets: Age>60 Age<35
Periphery
index above
median1
Socioeconomic
index above
median2
From Arab
locality Woman
N 1,787 3,074 6,582 6,144 499 6,852
%
Withdrew
accounts
23% 15% 18% 18% 11% 16%
Population
subsets: Age<61 Age>34
Periphery
index below
median1
Socioeconomic
index below
median2
Not from
Arab
locality
Male
N 10,937 9,650 1,311 3,109 12,236 5,883
%
Withdrew
accounts
15% 17% 15% 13% 16% 16%
T-score of
mean
difference
7.38*** -2.16** 2.7*** 7.2*** -4.09*** 0.75
1 Periphery index of local authorities in Israeli from the Israeli Central Bureau of Statistics (1 is for authorities in the outskirts of the country and 5 is for authorities in the heart of the country). The country median is 3 and the average is 2.8. Data is presented for subsets above or below the country median. 2 Socioeconomic index of local authorities in Israeli from the Israeli Central Bureau of Statistics (1 is for low economic authorities and 10 is for high socioeconomic authorities). The country median is 5 and the average is 4.8. Data is presented for subsets above or below the country median.
*** p<0.01, ** p<0.05, * p<0.1 Notes: The table shows the number of withdrawn accounts out of eligible accounts during the tax exemption campaign, from the beginning of March 2014 to the end of July 2015, for different population subsets. The data comes from the large provident fund data.
In Table 1 we present differences between the population that withdrew funds and the
population that did not withdraw funds from the provident fund. For the geographical
indices—the socioeconomic index and peripheral index—we divide our sample based on

�(��
localities above and below the median score of the indices in the general population.34 In
Table 1, using T-tests, we can see that when dividing the population by socioeconomic
conditions, the population with higher socioeconomic indices and older account owners are
more likely to withdraw funds. The percent of people withdrawing funds who come from
localities that have a high socioeconomic index is 18% versus a 13% rate of withdrawal by
account owners who come from localities with a low socioeconomic index; this is a
statistically significant difference. The withdrawal rate of account owners who come from
peripheral localities is 15% versus 18% from non-peripheral localities. Additionally, the
withdrawal rate from Arab localities is only 11%, significantly different from the 16%
average from all other localities. As noted above, in Israel, higher poverty rates have been
found in the periphery and in the Arab community. Older account owners have a
statistically significant higher withdrawal rate (account owners over 60 have a withdrawal
rate of 23% and account owners under 35 have a withdrawal rate of 15%). We do not find a
difference in withdrawal rates between men and women based on the provident fund data.
When looking at withdrawals by account size and by a socioeconomic partition, we find
interesting outcomes, which can be seen in Table 2. First, the larger the amount in the small
inactive account the higher withdrawal rate for all socioeconomic populations.
Additionally, for low socioeconomic attributes, the proportion of small funds withdrawn is
less than half of the population average; 6% of small eligible funds withdrawn versus 13%
of all eligible funds. The lack of withdrawals from small accounts is much stronger for the
low socioeconomic population than for the high socioeconomic population. This is in
reverse to an expected income effect that should make small funds more worthwhile for the
poorer population. One possible explanation for this phenomenon is that the low
socioeconomic population is more aware of accounts with larger amounts of money which
usually derive from more long term jobs, and the regulatory campaigns had less of an effect
on this population. For the high socioeconomic population, withdrawal from large accounts
is much more significant than the population average; 24% of large eligible accounts versus
18% of all eligible accounts. This high rate of withdrawal from large accounts is much
more significant for the high socioeconomic population than the relative higher rate of
withdrawal for the low socioeconomic population. If the amount of money relative to
���������������������������������������� �������������������34
The partition was chosen taking into account two considerations: By looking at localities at the edges of the distribution we are able to have a better distinction of the populations, yet at the same time, the more one limits the index scores the less observations there are and the explanatory ability is diminished.

18
�
income would be the main factor, we would expect to see higher withdrawal rates from the
larger accounts among the poorer low socioeconomic population.
Table 2 - Difference of accounts withdrawn from socio-economic population mean
by account size
Small account2 Medium account
2Large account
2
Socio-
economic
index above
median1
Account size USD 47 323 1,166
Withdrawal rate 14% 18% 24%
T-score of mean
difference from
population
-4.79*** -1.91 3.47***
Socio-
economic
index below
median1
Account size USD 48 318 1,158
Withdrawal rate 6% 14% 19%
T-score of mean
difference from
population
-6.19*** -0.93 2.13**
1 Socioeconomic index of local authorities in Israeli from the Israeli Central Bureau of Statistics (1
is for low economic authorities and 10 is for high socioeconomic authorities). The country median
is 5 and the average is 4.8. 2 Size of account calculated by dividing the accounts size to: small accounts are the first quarter,
medium are the 2nd and 3rd quarter and large accounts are the 4th largest quarter
*** p<0.01, ** p<0.05, * p<0.1
Notes: The table shows percent of withdrawn accounts out of eligible accounts during the tax
exemption campaign, beginning of March 2014 to the end of July 2015, by socio-economic index
and size of the account (amount of money): small, medium or large. NIS to USD conversion rate of
3.8. The data comes from the large provident fund data.
One of the major advantages of the provident fund data is that they describe individuals’
real choices. Using this data we were able to find an interesting geographical connection
between Arab localities, a locality’s socioeconomic index, and a locality’s periphery index
with actual financial action. The disadvantage of the provident fund data is that although we
know that financial literacy is correlated with socioeconomic characteristics, we cannot
infer if the individual’s financial literacy is responsible for the connection or if the outcome
was derived by other factors. Another disadvantage is that actual withdrawals can be
affected by behavioral biases, literacy and technical difficulties combined. The survey data

�)��
presented below enabled us to investigate factors on an individual level and to focus on the
information channel.
5. Survey Data
To examine the relationship between financial literacy and confidence in retirement
knowledge with awareness of financial regulation or financial actions, we needed to
construct measures to estimate these personal characteristics. The following section
describes the financial literacy index and how we define and evaluate subjective financial
questions.
5.1 Survey: Personal characteristics variables
5.1.1 Financial literacy index
The most comparable and widespread measure of financial literacy in the academic
literature is made up of three questions regarding interest rate, inflation and risk
diversification.35 These basic questions are the same ones used in this paper and have been
shown to differentiate well between naïve and sophisticated respondents. The responses can
characterize peoples' levels of financial knowledge and are strongly correlated with
financial behaviors. Lusardi and Mitchell (2009) found that when adding more questions to
the three stated above, the additional questions did not change any of the conclusions or the
major demographic characteristics of people with higher or lower financial literacy.
The index is calculated (in a similar manner to the literature) so that each question
answered correctly gives the respondent a score of 1, and the index value is the sum of all
three questions answered correctly.36 Main statistics on these three questions appear in
Table 3, where we can see that 76% correctly answered the interest rate question, 59%
���������������������������������������� �������������������35
An example of the status of these questions can be found in Hasting, Mandrian and Skimmyhorn’s (2012) literature review, where these three questions are called the "Big Three". In Hung, Parker and Yoong (2009) they show that the three original financial literacy questions are stable over time and have a high correlation with other financial literacy measures. The wording of the questions is presented in Table 1. 36
Unlike in Lusardi and Michell (2007) and in the Dutch DNB Household Survey (DHS) (Van Rooij, Lusardie and Alessie, 2011) the wording of the diversification question were not changed and we only presented one set of wording. We used in this paper the wording which had higher rates of response. The fact that wording matters provides evidence that respondents often do not understand the question or concepts, and some answers are simply the result of guessing. It also shows that answers to advanced financial literacy questions should not be taken at face value and the empirical work should take into account that these measures are often noisy proxies of the true level of financial literacy.

20
�
correctly answered the inflation question and 45% correctly answered the diversification
question.
Table 3 – Financial literacy question and the distribution of answers
Name of
question Interest question Inflation question Diversification question
Question
Suppose you had $100 in a savings account and the interest rate was 2% per year. After 5 years, how much do you think you would have in the account if you left the money to grow?
Imagine that the interest rate on your savings account was 1% per year and
inflation was 2% per year. After 1 year, how much would you be able to buy with the money in this account?
Do you think that the following statement is true or false? “Buying a single
company stock usually provides a safer return
than a stock mutual fund.”
Answer
More than $102
Exactly $102
Less than $102
DK1Less than
today
More than
today
Exactly the
same DK1 FALSE TRUE DK1
correct answer
wrong answer DK*correct answer
wrong answer DK* correct answer
wrong answer
DK*
76% 11% 14% 59% 14% 27% 45% 7% 47%
Do not know the answer. Notes: The table shows the wording of the questions and answers of the three financial literacy questions with the percent of individuals that answered correctly, incorrectly or stated that they do not know the answer. The data comes from the representative sample survey data.
A comparison with previous studies and other countries is presented in Figure 3 and uses
data from Hastings, Madrian and Skimmyhorn (2012). Our Israeli sample scored higher on
the interest rate question (76% answered correctly versus a 66% average), slightly higher in
the inflation question (59% versus 57%) and slightly lower in the diversification question
(45% versus 47%). The overall index score we found in Israel was a bit lower relative to
the average index score from Hastings, Madrian and Skimmyhorn (2012)—31% relative to
33%.
The findings in the main survey are very similar to those that the CBS found in the
Financial Literacy Survey from 2012 and are presented above, even though the exact
wording of the questions was different, and lower than the findings in Meir, Mugerman and
Sade (2016).37
���������������������������������������� �������������������37
This survey was done on an older population which might explain the differences.

���
Figure 3 – Financial literacy answers, past research
This figure shows the percent of individuals who answered all three financial literacy questions in
past studies, named by year and country of survey. If a country has two observations only the
later one was taken into account when calculating the average.The survey outcomes from our
paper are presented in red. The data comes from Hastings, Madrian and Skimmyhorn (2012) and
our representative sample survey data.
5.1.2 Subjective financial literacy
As stated in the literature, awareness and financial action can depend on subjective feelings
and confidence that people have with regard to their financial knowledge.38 In this paper we
wanted to isolate financial confidence with regard to retirement and pension planning and
not general financial literacy. In the question presented in this paper we specifically asked
about understanding retirement savings. The wording of the question and main statistics are
presented with the other subjective questions in Table 4.
We find that the percent of people answering that they more than moderately understand retirement
saving (if coded between 1 and 5, all those answering 3 and above) is 29%, while in Lusardi (2011)
the share of people who stated that their financial knowledge is 5 and above (5-7) is 70%. This
indicates that there might be differences between subjective retirement literacy and subjective
general financial literacy, with subjective retirement literacy being lower. It is also interesting to
���������������������������������������� �������������������38
In previous studies, Lusardi (2011), Lusardi and Tufano (2009) and Van Rooij, Lusardi, and Alessie (2011 and 2012) a general question of financial confidence in knowledge was used: "On a scale from 1 to 7, where 1 means very low and 7 means very high, how would you assess your overall financial knowledge?". In Lusardi and Mitchell (2009) the wording of the question was slightly different: The wording was: On a scale from 1 to 7, where 1 means very low and 7 means very high, how would you assess your understanding of economics?".
��
�
��
� �� ����
�� ��
�
�
�
�
�
�
Answered all three questions correct

22
�
note that the correlation between the confidence in retirement knowledge variable and the financial
literacy index is only 0.16.
Table 4 – Subjective questions and distribution of answers
Question
category
To
a v
ery la
rge
exten
t
To
a la
rge ex
tent
Mo
dera
tely
Slig
htly
No
t at a
ll
DK
1
Confidence
in
retirement
knowledge
How much do you feel you
understand pension savings
/retirement savings
/provident funds?
1% 7% 21% 37% 29% 6%
Interest in
retirement
How much are you interested
in pension savings
/retirement savings
/provident funds?
9% 17% 33% 23% 14% 4%
1 Do not know the answer
Notes: The table shows the wording of the questions and answers of the two subjective questions with the percent of individuals that answered correctly, incorrectly or stated that they do not know the answer. The data comes from the representative sample survey data.
5.1.3 Interest in retirement issues
Our question of confidence in retirement knowledge is not as validated as the financial
literacy index. That is why we included another subjective question about interest in
retirement issues in the survey. The wording of the question and main statistics are
presented in Table 4. The correlation of confidence in retirement knowledge with interest in
retirement issues is 0.3539 and the correlation between interest in retirement and the
financial literacy index is not statistically different from zero.40
5.1.4 Descriptive statistics of personal characteristics variables
Our survey results indicate (Table 5) that people with high financial literacy come from
populations that are older, more male, have higher income, have a higher education and
they most likely come from localities that have a high socioeconomic index. We can also
learn from Table 5 that people with high confidence in their retirement knowledge are
���������������������������������������� �������������������39
Spearman non-parametric correlations and significant at the 1% level. 40
Spearman non-parametric correlations 0.05.

���
older, more male, a greater percentage are Israeli born, most likely come from localities
with high socioeconomic index and from central localities.
Table 5 - Demographic characteristics and mean differences for people who have high and
low: financial literacy index score and confidence in retirement knowledge
Financial literacy5 Confidence in retirement knowledge
6
Demographic charact
eristics Low High
T-score of mean
difference between
Low and High
Low High
T-score of mean
difference between
Low and High
Age 37.19 41.97 -2.45** 39.21 43.43 -1.81*
Female 72% 35% 5.78*** 59% 23% 5.11***
Immigrants 12% 17% -0.97 18% 8% 2.2**
Income level1 1.97 2.52 -3.87*** 2.23 2.36 -0.84
Education level 2 1.61 2.13 -6.03*** 1.88 1.97 -0.82
Percent of people that
have a socioeconomic
index above median3
42% 62% -1.79* 60% 54% 0.7
Percent of people that
have a socioeconomic
index above 83
13% 35% -3.96*** 22% 21% 0.28
Percent of people that
have a socioeconomic
index below median3
21% 12% 1.57 12% 13% -0.06
Percent of people that
have a socioeconomic
index below 33
1% 1% 0.06 1% 0% 2.01**
Percent of people that
have a periphery
index above median4
63% 71% -1.19 62% 67% -0.57
Percent of people that
have a periphery
index below median4
13% 6% 1.55 8% 3% 1.77*
1 Income ranges between 1 and 3, where 1 is below average income, 2 is average income and 3 is above
average income. 2 Education ranges between 1 and 3, where 1 is high school education or below, 2 is above high school education and 3 is academic education. 3 Socioeconomic index of local authorities in Israeli from the Israeli Central Bureau of Statistics (1 is for low socioeconomic authorities and 10 is for high socioeconomic authorities). The country median is 5 and the
average is 4.8. 4 Periphery index of local authorities in Israeli from the Israeli Central Bureau of Statistics (1 is for authorities in the outskirts of the country and 5 is for authorities in the heart of the country). The country median is 3 and
the average is 2.8. 5 People with low financial literacy received o in the financial literacy index and people with high financial
literacy received 3 in the financial literacy index. 6 People with low confidence in retirement knowledge stated that they do not understand retirement issues to a large extent and more, and people with high confidence in retirement knowledge stated that they understand
retirement issues to a large extend or more.
*** p<0.01, ** p<0.05, * p<0.1
Notes: The table shows means and mean difference for individuals with high or low financial literacy and
confidence in retirement knowledge. The data comes from the representative sample survey data.

24
�
5.1.5 Descriptive statistics regarding awareness of the campaign and financial
action taken
The awareness of the "Money Mountain" campaign and of the tax exemption for small
inactive plans in provident funds campaign is the same (42% and 40%, respectively). This
is surprising because the "Money Mountain" campaign was publicized as a commercial in
major media and we would expect that a wider range of the population would have
awareness of the campaign. This might be because the survey was taken during 2015, only
two months after the tax exemption period ended but more than two years after the initial
"Money Mountain" commercial was broadcast. When comparing this outcome to the
CMISD evaluation from June 2013, we see that after two years the awareness of the
campaign is much lower (down from 67%) even though the issue remained in the public
light, this could be because the effect of interventions decays over time (Fernandes, Lynch,
and Netemeyer, 2014). In addition, most of the people who heard about the "Money
Mountain" campaign were also aware of the tax exemption; 58% in the representative
sample and 74% in the complementary sample. This is initial evidence that there might be
some features of the population making people more perceptive of financial campaigns
because most of those who were aware of one campaign were also aware of the other.
When looking at the representative sample, we find that a higher percentage of people
visited the "Money Mountain" Internet portal than those that were aware of the campaign,
53% versus 42%, which means that some people were apparently aware of the campaign
even though they answered differently. On the other hand, most of the people who visited
the site were aware of the "Money Mountain" campaign or of the tax exemption (65% and
61%, respectively). This again can be explained by the time lag between the campaign and
the surveys and it can also be because people do not fully differentiate between the two
campaigns or their names. When comparing this outcome to the CMISD evaluation from
June 2013, we see that the percentage of people who visited the "Money Mountain" Internet
portal stayed the same—53% versus 54% in the CMISD evaluation. This may imply that
the campaign's effect is short termed and that most of the people entering the Internet portal
did so close to when the campaign aired in the media.
Contacts to the retirement savings fund provider with intent to withdraw funds due to the
campaigns are much lower and stand at 14% for the main representative sample.
Individuals who contacted the retirement fund manager with intent to withdraw funds could
have done so for the intention of withdrawing tax exempt funds from provident funds or

���
funds from other retirement vehicles due to the "Money Mountain" campaign. Not all those
that contacted the retirement fund manager actually withdrew funds. The survey data
indicates that 70% of the individuals that intended to withdraw funds stated that they did so,
while 25% left the funds in the accounts. Leaving the funds in the account could be because
the individuals encountered technical difficulties or any behavioral biases. That is why we
look at an individual's intentions, which are more relevant to information dissemination,
and not at final outcomes.
It is worth noting that a high share of the people who had the intention of withdrawing
funds were fully aware of at least one of the campaigns; 68% were aware of the "Money
Mountain" campaign and 76% were aware of the tax exemption campaign. Fifty-one
percent of the people who had the intention of withdrawing funds were aware of both
campaigns.
In Figure 4A we can already see that people that have a high financial literacy index are
more aware of the financial campaigns—awareness is around 55% for individuals with high
financial literacy versus around 25% awareness for individuals with low financial literacy.41
Individuals with high financial literacy are also more likely to have entered the "Money
Mountain" Internet portal; 62% versus 41% of individuals with low financial literacy.42 Yet
at the same time, when looking at the intention of withdrawing funds, financial literacy
does not seem to matter43 and this may imply that other factors should be taken into
account, such as confidence in retirement knowledge. Financial confidence seems to play a
rule in awareness and in financial action as can also be seen in Figure 4B. Individuals with
high confidence, compared with all other individuals, are more aware of the “Money
Mountain” campaign, 73% versus 40%; are more aware of the tax exemption campaign,
78% versus 37%; were more likely to have entered the designated Internet portal, 85%
versus 50%; and had more intention of withdrawing funds, 35% versus 13%.44
���������������������������������������� �������������������41
This difference is statistically significant at the 1% level. 42
This difference is statistically significant at the 1% level. 43
Difference not statistically different from zero. 44
All differences between individuals with high and low confidence in retirement knowledge are statistically significant at the 1% level.

26
�
Figure 4 – Financial regulation outcomes by financial literacy and confidence in
retirement knowledge, representative sample
Figure 4A- Financial regulation outcomes by financial literacy
This figure shows the percent of individuals who answered that they were aware of the financial camapaigns or took financial action presented by the number of financial literacy answers they got correct. Individuals who have high financial literacy (answered all 3 questions correctly) are in blue, and individuals who have low financial literacy (did not answer correctly any question) are in red. The data comes from our representative sample survey data.
Figure 4B- Financial regulation outcomes by confidence in retirement knowledge
This figure shows the percent of individuals who answered that they were aware of the financial camapaigns or took financial action presented by their confidence in their financial knowledge. Individuals who stated that they understand retirement to a large extent or more, and have confidence in their retirement knowledge are presented in blue. Individuals who did not answer that they understand retirement to a large extent or more and do not have confidence in their own knowledge are presented in red. The data comes from our representative sample survey data.
�
�
�
�
�
�
Aware of "Mountain ofMoney" campaign
Aware of timely taxexemption campaign
Entered the "Mountainof Money" internet site
Withdrew moneybecause of the
campaigns
High financial literacy Low financial literacy
�
�
�
�
�
�
�
�
Full awareness of the"Mountain of Money"
campaign
Full awareness of thetimely tax exemption onsmall inactive plans in
provident fundscampaign
Entered the "Mountainof Money" internet site
Withdrew money frominactive retirement
funds amounting fromthe campaigns
Confident in retirement knowledge Not Confident in retirement knowledge

(��
5.2 Survey: Results
5.2.1 Empirical model
We investigated the relationship between financial outcomes and the personal attributes of
individuals, financial literacy and confidence in retirement knowledge. Awareness of
financial campaigns and financial action are dummy variables that can receive two possible
values; 0 or 1. Awareness of financial campaigns and financial action can be affected by
financial literacy45, financial confidence and demographic characteristics.46 Hence, the
specification of the main regressions is the following47:
��� � �� � ��� �� ��� ������� ��� � ��� ������������������������� ��!"��#�$
� �%� &� � '��
Where ��� is the outcome (')*+,- variable for individual i; either (1) awareness of the
"Money Mountain" campaign, (2) awareness of the tax exemption on small inactive plans
in provident funds campaign, (3) entrance to the "Money Mountain" Internet portal or (4)
had the intention of withdrawing funds from inactive retirement funds amounting from the
campaigns. X are individual i's demographic characteristics including age, gender, marital
status, income, education, religious identity, work status and an indicator for whether the
individual is an immigrant or not.48 The variable description is presented in Appendix 1.49
���������������������������������������� �������������������45
When separating the financial literacy index the outcomes are consistent with former research as shown in Lusardi and Mitchell (2011-world review) and Alessie, van Rooij, and Lusardi (2011); it is the understanding of risk diversification (understanding of advanced financial knowledge) that matters most for retirement planning. Despite this, for the specifications presented above we still believe that the financial literacy index has better explanatory power because of former research that shows the stability of the index over time and the correlation with other financial literacy measures (Hung, Parker, and Yoong 2009). 46
We believe that the correlations we find in the survey results section do not derive reverse causality, where being aware of financial regulations and/or taking financial action affects individual's financial literacy or confidence in the issue. 47
When running the regressions for awareness of the campaigns and financial action taken without the "confidence in retirement knowledge" variable, the financial literacy index variable has a stronger and more significant effect. 48
It should be stated that none of the demographic variables have a correlation higher than 0.3 with either the financial literacy variable or with the confidence in retirement knowledge variable. 49
Results remain similar when using different specifications of the sociodemographic variables. Additionally, as expected by the structure of the variable, when using a dummy which indicates if you are above or under the survey financial literacy index median score the outcomes of the models are similar except for the fact that the financial literacy variable affects are stronger. Similarly, when adding a dummy which indicates if you answered that you have a low or a very low understanding of retirement issues we receive similar outcomes for the regressions except that the two confidence in retirement knowledge dummies are not always both statistically significant. In another robustness check, for the weighted complementary sample we added income information for 82 observations where income was missing using a forecast regression from the CBS expenditure survey of 2014. The outcomes are again similar in size and significant to the main specifications in the paper.

28
�
We estimate the model using three data specifications: the first is the representative sample,
the second is the representative sample with an additional complementary sample and the
third is the representative sample with a weighted additional complementary sample. The
first and main sample selection is the representative sample that has 504 respondents. The
additional complementary sample has 124 respondents from the same Internet survey who
stated they were aware of the "Money Mountain" campaign. We surveyed the additional
sample in order to make sure we have enough observations of the population to characterize
it. The weights for the complementary sample in the third data specification are such that
respondents of the complementary sample received a 0.42 weight and respondents for the
representative sample received a weight of 1. The reason for this is that when looking at the
representative sample only 42% stated that they are fully aware of the "Money Mountain"
campaign, and the weights were built accordingly.50
We begin by examining the characteristics of individuals who are aware of the financial
campaigns (Table 6). We also examine the characteristics of individuals who took financial
action following the financial campaigns (Table 7). We present the size of the
characteristics’ effects on individuals’ awareness of financial campaigns and their financial
action (Table 8). We then continue to examine robust specifications (Table 9).
5.2.2 Characteristics of individuals who indicated that they were aware of the
campaign
In Table 651, we look at the characteristics of individuals in order to investigate what affect
the awareness of the financial campaigns had. The tables presented in this paper use a Logit
method of estimation but results are qualitatively similar when using either a linear
probability model (estimated by OLS) or Probit method of estimation. In particular, our
main coefficients of interest (financial literacy and confidence in financial knowledge) have
the same sign and similar levels of statistical significance across all three estimation
techniques.
���������������������������������������� �������������������50
A specification where a dummy variable is used instead of weights for the complementary sample produces similar outcomes. 51
When analyzing the awareness of the campaigns we only investigate the representative sample (columns 1 and 4) because the complementary sample is made up of respondents that stated upfront that they are aware of the “Money Mountain” campaign.

)��
Table 6 - Awareness of campaigns, main specification, representative sample
Full awareness of the
"Money Mountain"
campaign
Full awareness of the tax
exemption on small inactive
plans in provident funds
campaign
Variables: (1) (2)
Financial literacy index 0.281** 0.337***
(0.116) (0.125)
Confidence in retirement knowledge 0.937** 1.497***
(0.414) (0.454)
Age 0.015 0.024**
(0.01) (0.01)
Female -0.347 -0.317
(0.219) (0.231)
Married 0.054 0.348
(0.254) (0.265)
Income Level
Average income 0.469 -0.086
(0.439) (0.476)
Above average income 0.148 0.019
(0.255) (0.273)
Education Level
Above high school education
-0.046 0.993***
(0.272) (0.315)
Academic education 0.272 0.959**
(0.357) (0.392)
Religious Identity
Traditional 0.026 -0.14
(0.242) (0.259)
Religious -0.235 -0.254
(0.329) (0.344)
Ultra-Orthodox -0.214 -0.348
(0.736) (0.753)
Working Level
Unemployed -0.6** -0.594*
(0.293) (0.32)
Retiree -0.472 -0.278
(0.516) (0.53)
Immigrant -0.498* -0.135
(0.297) (0.298)
Constant -1.268*** -2.744***
(0.486) (0.555)
Observations 424 424
McFadden Pseudo R2 0.23 0.29
AIC 562 517
Standard errors in parentheses
*** p<0.01, ** p<0.05, * p<0.1
Notes: Each column represents a different regression of the effect of individual characteristics on awareness of financial campaigns. Column (1) reports Logit estimations on awareness of "Money Mountain" campaign for the representative sample. Column (2) reports Logit estimation on awareness of the tax exemption campaign for the representative sample.
Column (1) of Table 6 shows that there are a number of variables that significantly affect
the awareness of the "Money Mountain" campaign which was publicized as a commercial
on television, the radio and Internet sites. The coefficients of financial literacy and
confidence in retirement knowledge are statistically significant and positive. Immigrants

30
�
and the unemployed have negative significance correlation with awareness of the
campaign. An explanation for the negative effect of being an immigrant, mostly from the
former USSR (over 50% of immigrants in the survey come from the former USSR), can
arise from language barriers or even cultural barriers that prevented this population from
registering the campaign. When looking at immigrants from 1989 instead of all immigrants,
the regression's outcomes are very similar (not displayed). Controlling for all other related
variables, in the representative sample, age was not found to have a significant effect.52 Age
and age squared were also found to have no effect in the regression where the working level
dummies, which have a high correlation of over 0.4 in absolute value with the age variable,
were not added, as presented in column (1) in Table 9.
Column (2) of Table 6 shows the effect of the variables for awareness of the tax exemption
on small inactive plans in provident funds campaign. In this regression, again, the effects of
financial literacy and confidence in retirement knowledge are significant and positive, and
being unemployed remains statistically significant with a negative effect. In this regression,
age and higher education are statistically significant and positively correlated with being
aware of the tax exemption. The fact that this campaign was not broadcast using a
commercial on prime-time television or radio can explain why these effects are stronger.
For example, if the campaign was only mentioned in economic media, then only people
who listen to or read economic media are aware of the campaign. If the people who listen to
or read economic media are more educated this can explain the positive connection between
awareness of the campaign and education. Another potential explanation is the complexity
of knowledge that is needed for fully understanding the campaign. Clearly, it is more
complicated to understand tax exemption issues.
For awareness of the tax exemption campaign, the coefficient of immigrants is not
significant but the sign of the coefficient is still negative. Immigrants (who are mostly from
the former USSR), might not have been aware of the commercial which was only broadcast
in Hebrew but they could have been aware of the tax exemption which was promoted in
immigrant-oriented media in different languages as well (even though this was probably
more financial oriented media and hence the importance of the other significant variables in
the regression).
���������������������������������������� �������������������52
Age has a correlation of 0.41 with the working status variable.

����
Age is positively correlated with awareness of the tax exemption campaign and when
adding age squared and dropping the variable for working level (which includes retirees
and is strongly correlated with age) both age variables are statistically significant, where
age squared is negative and age stays positive—column (2) in Table 9. This is in
accordance with the literature, where the effect of age on financial outcomes has been
found to have an inverse U shape.
5.2.3 Characteristics of individuals that took financial action
Table 7 presents the effect of the dependent variables on entering the Internet portal and or
contacting the provider with intent to withdraw funds.53 One of the regulator's objectives
was not only to raise the awareness of the population but also to provide the population
with a digital tool to help them check if they have inactive accounts, and where. In columns
(1)-(3) of Table 7, we investigate the variable of entering the "Money Mountain" Internet
portal. We do not have the timing of when individuals entered the "Money Mountain"
Internet portal or contacted the fund managers with intent to withdraw funds. This means
that we do not know if the people are entering the site because of the "Money Mountain"
campaign or because of the tax exemption or because of both.54 In these regressions,
financial literacy, confidence in retirement knowledge, age, being female and academic
education55 are positive and statistically significant. We also find that the effect of age has
an inverse U shape even when controlling for working level variables (not presented, the
regression without the working level variables is presented in column (3) in Table 9). The
nature of the financial action in this regression is technological and needs individuals to be
comfortable with the Internet and technology as well as with the subject. It is reasonable
that this kind of financial action has a strong inverse U shape with regard to age. The
gender effect found in these regressions is consistent with the literature on financial
literacy, although we didn’t find such unequivocal outcome for awareness of financial
���������������������������������������� �������������������53
When running the financial action regressions only on the population that indicates that it has retirement savings in pension funds, provident funds or in insurance policies (412 respondents in the representative sample instead of 504), we see that education is no longer statistically significant for entering the Internet site and the unemployed variable is no longer statistically significant for withdrawing funds but all other outcomes are hardly changed (not presented). We believe that a large part of the population does not know if it has retirement savings or not and looking at the more general sample gives a better indication of actual outcomes. 54
From matching the overall entries to the CMISD data from June 2013 we find little differences which could mean that most of the entries resulted from the "Money Mountain" campaign. 55
In column (2) the education variables are not statistically significant but we believe that this sample suffers from uncorrected sample selection.
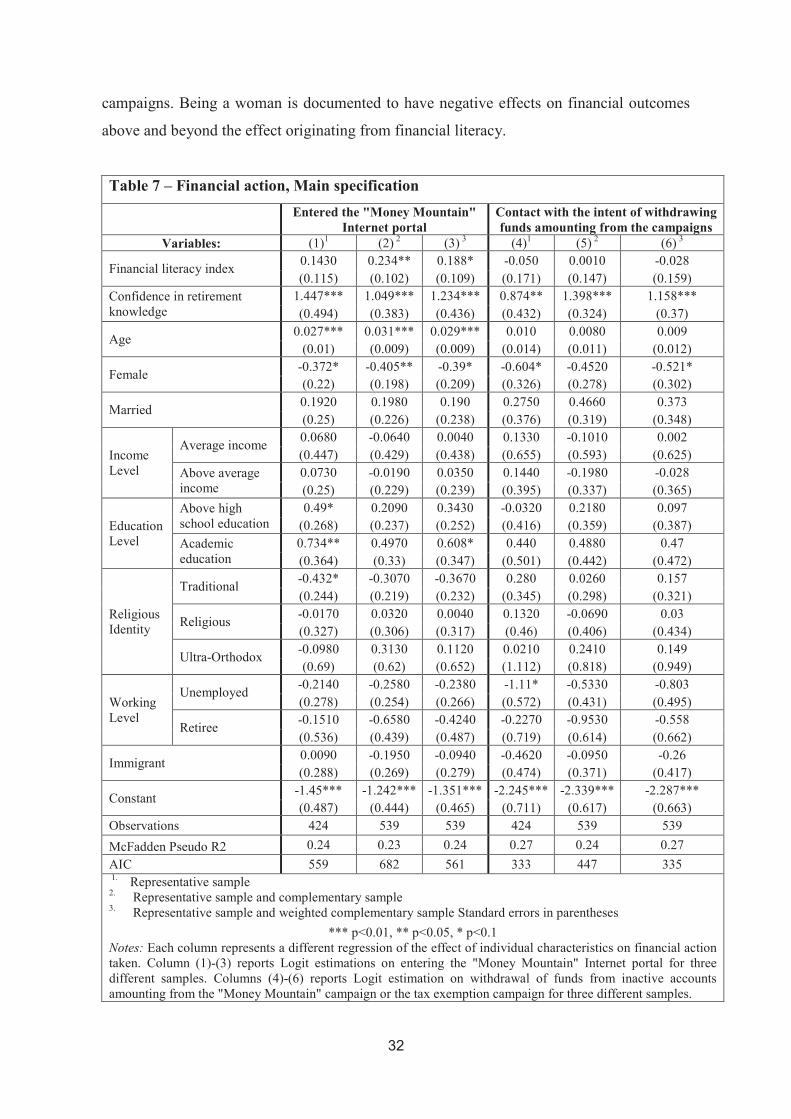
32
�
campaigns. Being a woman is documented to have negative effects on financial outcomes
above and beyond the effect originating from financial literacy.
Table 7 – Financial action, Main specification
Entered the "Money Mountain"
Internet portal
Contact with the intent of withdrawing
funds amounting from the campaigns
Variables: (1)1 (2) 2 (3) 3 (4)1 (5) 2 (6) 3
Financial literacy index 0.1430 0.234** 0.188* -0.050 0.0010 -0.028
(0.115) (0.102) (0.109) (0.171) (0.147) (0.159)
Confidence in retirement knowledge
1.447*** 1.049*** 1.234*** 0.874** 1.398*** 1.158***
(0.494) (0.383) (0.436) (0.432) (0.324) (0.37)
Age 0.027*** 0.031*** 0.029*** 0.010 0.0080 0.009
(0.01) (0.009) (0.009) (0.014) (0.011) (0.012)
Female -0.372* -0.405** -0.39* -0.604* -0.4520 -0.521*
(0.22) (0.198) (0.209) (0.326) (0.278) (0.302)
Married 0.1920 0.1980 0.190 0.2750 0.4660 0.373
(0.25) (0.226) (0.238) (0.376) (0.319) (0.348)
Income Level
Average income 0.0680 -0.0640 0.0040 0.1330 -0.1010 0.002
(0.447) (0.429) (0.438) (0.655) (0.593) (0.625)
Above average income
0.0730 -0.0190 0.0350 0.1440 -0.1980 -0.028
(0.25) (0.229) (0.239) (0.395) (0.337) (0.365)
Education Level
Above high school education
0.49* 0.2090 0.3430 -0.0320 0.2180 0.097
(0.268) (0.237) (0.252) (0.416) (0.359) (0.387)
Academic education
0.734** 0.4970 0.608* 0.440 0.4880 0.47
(0.364) (0.33) (0.347) (0.501) (0.442) (0.472)
Religious Identity
Traditional -0.432* -0.3070 -0.3670 0.280 0.0260 0.157
(0.244) (0.219) (0.232) (0.345) (0.298) (0.321)
Religious -0.0170 0.0320 0.0040 0.1320 -0.0690 0.03
(0.327) (0.306) (0.317) (0.46) (0.406) (0.434)
Ultra-Orthodox -0.0980 0.3130 0.1120 0.0210 0.2410 0.149
(0.69) (0.62) (0.652) (1.112) (0.818) (0.949)
Working Level
Unemployed -0.2140 -0.2580 -0.2380 -1.11* -0.5330 -0.803
(0.278) (0.254) (0.266) (0.572) (0.431) (0.495)
Retiree -0.1510 -0.6580 -0.4240 -0.2270 -0.9530 -0.558
(0.536) (0.439) (0.487) (0.719) (0.614) (0.662)
Immigrant 0.0090 -0.1950 -0.0940 -0.4620 -0.0950 -0.26
(0.288) (0.269) (0.279) (0.474) (0.371) (0.417)
Constant -1.45*** -1.242*** -1.351*** -2.245*** -2.339*** -2.287***
(0.487) (0.444) (0.465) (0.711) (0.617) (0.663)
Observations 424 539 539 424 539 539
McFadden Pseudo R2 0.24 0.23 0.24 0.27 0.24 0.27
AIC 559 682 561 333 447 335 1. Representative sample
2. Representative sample and complementary sample 3. Representative sample and weighted complementary sample Standard errors in parentheses
*** p<0.01, ** p<0.05, * p<0.1 Notes: Each column represents a different regression of the effect of individual characteristics on financial action taken. Column (1)-(3) reports Logit estimations on entering the "Money Mountain" Internet portal for three different samples. Columns (4)-(6) reports Logit estimation on withdrawal of funds from inactive accounts amounting from the "Money Mountain" campaign or the tax exemption campaign for three different samples.
����
We have data on whether people contacting the fund managers with intent to withdraw
funds did so because of the "Money Mountain" campaign or because of the tax exemption,
but we don't have data on the date of the contact. Hence we analyze the intention of
withdrawing funds data per se while realizing that it can be driven by both campaigns
together in columns (4)-(6) of Table 7. In the regression presented in these columns,
confidence in retirement knowledge, female56 and unemployed57 are the only statistically
significant variables.58
Our results suggest that in this case, taking financial action, which is contacting one’s
retirement fund manager, is significantly correlated more with the confidence in knowledge
of the subject than with actual general financial knowledge. This confidence can be the
mechanism that facilitates reception of financial information as well as overcoming apathy
and procrastination. This can suggest that financial regulation aimed at transparency and
disclosure does not affect actual financial action unless the population has high confidence
in their knowledge of the subject. This might also explain some of the contradictory
outcomes in the literature for the effects of financial literacy and financial education on
economic behaviors.59
As found for entering the “Money Mountain” site, being a woman has an effect on financial
action above and beyond financial confidence. The fact that the unemployed withdrew
fewer funds might be because current working status is positively correlated with past
working status and hence the unemployed do not have funds in retirement funds, but there
may also be an effect originating from the attentiveness of this population to the issue at
hand.
It is interesting to note that age has no effect on the intention to withdraw funds, as seen in
columns (4)-(6) of Table 7 and in column (4) in Table 9. This may be because the younger
population has a bigger ability to enjoy the tax exemption. All funds saved before 2008
���������������������������������������� �������������������56
In column (5) the female variable is not statistically significant but we believe that this sample suffers from uncorrected sample selection. 57
In the representative sample. 58
When running the regressions only on the population that indicated that they are aware of at least one of the financial campaigns, confidence in retirement knowledge is the only statistically significant variable and its size effect is similar to the regressions presented in Table 7.�59
Many papers find that people's financial behavior is better when people were offered or attended financial education curriculum at the work place, at school or in other facilities (Bernheim, Garrett, and Maki, 2001, Bayer, Bernheim, Scholz, 2009), while others found mixed results (Fernandes, Lynch and Netemeyer, 2014, especially regarding financial education in school programs (Mandell and Klein, 2009, and Cole and Shastry, 2009).

34
�
already have a tax exemption on lump sum withdrawals. The outcomes for the age variable
are consistent with the outcomes from the CMISD evaluation from June 2013.
5.2.4 Illustration of size effects of individuals' characteristics
To illustrate the size of the effects from the main regression in Table 6 and in Table 7 on
different populations, Table 8 displays the probability of being aware of the financial
campaigns or taking financial action with regards to financial literacy, confidence in
retirement knowledge and demographic characteristics. We can see that both the
demographic characteristics and the financial literacy effects are substantial. The model
states that over 65% of individuals (depending on gender and campaign) with high financial
literacy and confidence in financial knowledge will be aware of the campaigns. For
individuals with high demographic attributes (55 years old, academically educated, with an
above-average income) the awareness rises to over 82%. Individuals with low financial
literacy and confidence in retirement knowledge have a maximum awareness of 51% and it
reaches as low as 13% for woman with low demographic attributes (35 years old, with a
high school degree or lower and below-average income) for awareness of the tax exemption
campaign. Between 77% and 95% of individuals (depending on high or low demographic
attributes and gender) with high financial literacy and confidence in financial knowledge
will enter the “Money Mountain” Internet portal compared with between 33% and 74% of
individuals with low financial literacy and confidence. Additionally, between 18% and 48%
of individuals (depending on high or low demographic attributes and gender) with high
financial literacy and confidence in financial knowledge intend to withdraw funds versus
between 10% and 30% of individuals with low financial literacy and confidence.

����
Table 8 - Probability of being affected by the financial regulation for specific
populations
��
Full awareness
of the "Money
Mountain" campaign
Full awareness of the tax
exemption on small inactive
plans campaign
Entered the "Money
Mountain" Internet portal
Contact with the intent of
withdrawing funds
amounting from the campaigns
Have a high
financial
literacy index
and have
confidence in
retirement
knowledge
Male
High demographic
attributes 86% 92% 95% 48%
Low demographic
attributes 75% 72% 83% 29%
Female
High demographic
attributes 82% 89% 93% 32%
Low demographic
attributes 68% 65% 77% 18%
Have a low
financial
literacy index
and do not
have
confidence in
retirement
knowledge
Male
High demographic
attributes 51% 47% 74% 30%
Low demographic
attributes 34% 17% 42% 16%
Female
High demographic
attributes 43% 40% 66% 19%
Low demographic
attributes 26% 13% 33% 10%
Notes: The table shows the representative sample regulatory outcomes (being aware of financial regulation or taking financial action) deriving from the Logit model in Tables 9 and 10 for individuals who are married, non-immigrant, secular and working. The table displayed data for women and men who have either a high (3) or low (0) financial literacy index and are confident in their retirement knowledge, which means that they stated they understand retirement to a large extent or more, or are not confident in their knowledge and answered otherwise. The data also represents results by high and low demographic attributes. People with high demographic attributes are 55 years old academically educated with above average income. People with low demographic attributes are 35 years old with a high school degree or lower and below average income
5.2.5 Robustness test inquiry of inactive accounts and additional subjective
questions
We were also able to look at individuals who contacted their retirement management firm
in order to inquire about inactive funds. This inquiry referred to any inquiries about inactive
funds and not specifically at inquiries resulting from the financial campaigns. When
looking at the variables effecting this financial action, we find that only confidence in
retirement knowledge is statistically significant, column (5) in Table 9. This strengthens the
emphasis of subjective financial literacy with regard to financial action.
As mentioned above, the question of confidence in retirement knowledge is not as validated
as the financial literacy index. That is why for a robustness check we looked at the effect of
the subjective question that asks about general interest in retirement issues instead of

36
�
confidence in retirement knowledge. When adding this question to the main specification
for the representative sample60 as presented in columns (6)-(9) in Table 9, we find that
interest in retirement works in the same direction as confidence in retirement knowledge
and is positively correlated with financial awareness and action, as expected, and that all
other outcomes remain similar. It should be noted that interest in retirement is only
significant for awareness of the tax exemption campaign and entering the "Money
Mountain" Internet portal. We believe that confidence in one's knowledge is a better
variable as it significantly captures more of the individual's financial behavior.
���������������������������������������� �������������������60
When running the additional regressions on the weighted complementary sample as well as the representative sample the outcomes are very similar and the conclusions are the same.

�(��
Tab
le 9
- R
ob
ust
nes
s te
sts:
Age
squ
are
an
d I
nte
rest
in
ret
irem
ent
issu
es
Ag
e sq
uare
In
qu
iry
In
teres
t in
ret
irem
en
t is
sues
Vari
ab
les:
Aw
are
ness
of
the
"M
on
ey
Mou
nta
in"
cam
paig
n
Aw
are
ness
of
the
tax
exem
pti
on
on
small
in
act
ive
pla
ns
cam
paig
n
En
tered
the
"M
on
ey
Mou
nta
in"
Inte
rn
et
po
rtal
Con
tact
wit
h t
he
Inte
nt
of
wit
hd
raw
ing
fu
nd
s
am
ou
nti
ng
fro
m
the
ca
mp
aig
ns
Inq
uir
ing
ab
ou
t
inact
ive
acc
ou
nts
Vari
ab
les:
Aw
are
ness
of
the
"M
on
ey
Mou
nta
in"
cam
paig
n
Aw
are
ness
of
the
tax
exem
pti
on
on
small
in
act
ive
pla
ns
ca
mp
aig
n
En
tered
the
"M
on
ey
Mou
nta
in"
Inte
rn
et
po
rtal
Con
tact
wit
h t
he
Inte
nt
of
wit
hd
raw
ing
fu
nd
s
am
ou
nti
ng
fro
m
the
ca
mp
aig
ns
(1)
(2)
(3)
(4)
(5)
(6)
(7)
(8)
(9)
Fin
an
cial
lite
racy
in
dex
0
.26
2**
0.3
3***
0
.14
6
-0.0
68
0.0
94
Fin
an
cial
lite
racy
ind
ex
0.2
98
***
0.3
62
***
0.1
60
-0.0
220
(-0.1
15)
(-0.1
24)
(-0.1
14)
(-0.1
69)
(0.1
64
) (0
.116
) (0
.126
) (0
.115
) (0
.168
)
Con
fid
en
ce
in
reti
rem
en
t k
now
led
ge
1.0
45
**
1.5
85
***
1.4
67
***
0.9
89
**
0.8
48
*
Inte
res
t in
ret
irem
en
t
issu
es
0.3
20
0.9
92
***
0.7
74
***
0.4
940
(-0.4
11)
(-0.4
53)
(-0.4
9)
(-0.4
31)
(0.4
46
) (0
.244
) (0
.26)
(0.2
6)
(0.3
22
)
Ag
e 0
.08
2
0.1
57
**
0.1
29
**
0.0
74
-0.0
21
Ag
e 0
.01
6*
0.0
24
**
0.0
27
***
0.0
10
(-0.0
59)
(-0.0
66)
(-0.0
59)
(-0.0
88)
(0.0
89
) (0
.009
) (0
.01)
(0.0
1)
(0.0
14
)
Ag
e S
qu
are
-0
.00
1
-0.0
02
**
-0.0
01
*
-0.0
01
0
Fem
ale
-0
.40
4*
-0.3
780
-0.4
32
**
-0.6
67
**
(-0.0
01)
(-0.0
01)
(-0.0
01)
(-0.0
01)
(0.0
01
) (0
.216
) (0
.23)
(0.2
19
) (0
.32)
Fem
ale
-0
.36
6*
-0.3
41
-0.3
74
*
-0.6
2*
-0.0
89
Inco
me
Lev
el
Aver
ag
e
inco
me
0.4
280
-0.2
20
-0.0
280
0.0
990
(-0.2
17)
(-0.2
3)
(-0.2
2)
(-0.3
25)
(0.3
1)
(0.4
37
) (0
.476
) (0
.444
) (0
.649
)
Inco
me
Lev
el
Aver
ag
e
inco
me
0.4
98
-0.0
71
0.0
81
0.1
58
-0.3
72
Ab
ove
avera
ge
inco
me
0.1
230
-0.0
270
0.0
360
0.1
10
(-0.4
38)
(-0.4
78)
(-0.4
47)
(-0.6
53)
(0.6
77
) (0
.254
) (0
.274
) (0
.25)
(0.3
93
)
Ab
ove
avera
ge
inco
me
0.2
19
0.0
32
0.0
67
0.2
48
-0.0
62
Ed
uca
tio
n L
evel
Ab
ove
hig
h
sch
ool
edu
cati
on
-0.0
710
0.9
48
***
0.4
55
*
-0.0
770
(-0.2
52)
(-0.2
73)
(-0.2
49)
(-0.3
92)
(0.3
54
) (0
.27)
(0.3
11
) (0
.265
) (0
.414
)
Ed
uca
ti
on
Lev
el
Ab
ove
hig
h
sch
ool
edu
cati
on
-0.0
4
0.9
2***
0
.38
8
-0.0
09
0.1
41
Aca
dem
ic
edu
cati
on
0.2
670
0.9
79
**
0.7
61
**
0.4
0
(-0.2
76)
(-0.3
17)
(-0.2
74)
(-0.4
13)
(0.3
95
) (0
.356
) (0
.392
) (0
.365
) (0
.499
)
Aca
dem
ic
edu
cati
on
0.2
8
0.8
51
**
0.5
87
0.4
76
0.1
66
Imm
igra
nt
-0.5
53
*
-0.2
190
-0.0
530
-0.5
470
(-0.3
68)
(-0.4
) (-
0.3
75)
(-0.5
07)
(0.5
24
) (0
.297
) (0
.304
) (0
.29)
(0.4
74
)
Imm
igra
nt
-0.4
77
-0.0
76
0.0
65
-0.4
36
0.2
21
Con
sta
nt
-1.2
3**
-2.7
93
***
-1.4
53
***
-2.2
46
***
(-0.2
96)
(-0.2
98)
(-0.2
9)
(-0.4
74)
(0.3
96
) (0
.485
) (0
.558
) (0
.487
) (0
.707
)
Con
sta
nt
-2.7
24
**
-5.4
5***
-3
.37
9***
-3.8
43
**
-1.8
34
Con
trol
for
oth
er
vari
ab
les
pres
en
ted
in
the
ma
in s
peci
fica
tio
n
Y
Y
Y
Y
(-1.1
32)
(-1.3
2)
(-1.1
43)
(-1.7
49)
(1.7
39
) 4
24
424
424
424
Con
trol
for
oth
er
vari
ab
les
pres
en
ted
in
the
ma
in s
peci
fica
tio
n
Y
Y
Y
Y
Y
McF
ad
den
Pse
ud
o R
20
.22
0.2
9
0.2
4
0.2
7
AIC
5
66.2
4
51
4.8
4
55
9.8
4
33
4.4
4
McF
ad
den
Pse
ud
o R
20
.23
0.2
9
0.2
5
0.2
7
0.1
6
A
IC
56
4.2
7
51
5.0
9
55
4.3
7
33
5.0
7
35
3.1
1
Sta
nd
ard e
rro
rs i
n p
aren
thes
es
**
* p
<0
.01
, ** p
<0
.05,
* p
<0
.1
Note
s: E
ach c
olu
mn r
epre
sents
a d
iffe
rent
regre
ssio
n o
f th
e ef
fect
of
indiv
idual
char
acte
rist
ics
on a
war
enes
s of
finan
cial
cam
pai
gns.
Colu
mns
(1)-
(4)
rep
ort
LO
GIT
est
imat
ions
on a
war
enes
s of
the
finan
cial
ca
mp
aigns
and f
inan
cial
act
ion t
aken
when
contr
oll
ing f
or
age
and a
ge
squar
e w
ithout
contr
oll
ing f
or
work
ing l
evel
var
iable
s. C
olu
mn (
5)
report
s L
ogit
est
imat
ion o
n t
akin
g f
inan
cial
act
ion a
nd i
nq
uir
ing a
bout
inac
tive
acco
unts
. C
olu
mns
(6)-
(9)
rep
ort
Logit
est
imat
ion o
n a
war
enes
s of
the
finan
cial
cam
pai
gns
and f
inan
cial
act
ion t
aken
when
contr
oll
ing f
or
an a
ddit
ional
sub
ject
ive
ques
tion a
bout
inte
rest
in r
etir
emen
t is
sues
. A
ll c
olu
mns
hav
e 4
24
obse
rvat
ions
that
wer
e ta
ken
fro
m t
he
rep
rese
nta
tive
sam
ple
.

38
�
5.3 How to reconcile provident fund data and survey data
Data about actual withdrawals from provident funds during the campaign is largely
compatible with the representative survey data.61 We find that taking financial action is
negatively affected by age and weaker socioeconomic conditions. The effect of
socioeconomic conditions on financial action can be seen by the positive effect of education
and the negative effect of unemployment on financial action but also through the positive
effect of financial literacy and confidence in financial knowledge on financial actions.
Financial literacy and confidence in financial knowledge are positively correlated with the
investigated indices: the socioeconomic index and the periphery index, which therefore
indicate a positive correlation between these socioeconomic conditions and financial action.
We did not find differences in withdrawals between men and women in the provident fund
data, as suggested by the survey data and literature. We believe that it is because we don't
know precisely who withdrew the money, but only the gender of the account owner. It is quite
probable that in some households the husband (or other male family member) could have
taken the initiative to withdraw the wife's (or other female family members) accounts for her.
The fact that the data from the provident fund is missing information on the actual
characteristics of the individuals shows us the advantages of using survey data when trying to
separate out the effects of interventions on the population. The survey data allows us to
investigate factors on an individual level, and specifically, shows us the importance of gender
as well as other factors on financial action.
6. Conclusion, discussion and further research suggestions
The outcomes of financial campaigns were researched in this paper by looking at specific
regulatory campaigns in Israel aimed at the public, were the regulator reached out to the
population to inform them of a new service intended to help individuals find inactive
retirement plans and withdraw small funds in provident funds, on a tax exempt basis. By
analyzing provident fund data and survey data we conclude that the campaigns did not reach
all subpopulations equally, and less privileged population with lower socioeconomic
geographical indices took less advantage of the campaigns. The regulator's unintentional
���������������������������������������� �������������������61
It should be stated that the representative sample is younger than the provident fund population; 41.77 relative to 44.34 in the large provident fund and that the representative sample also has less women; 50% relative to 54% in the large provident fund. The provident funds also have a higher representation of people living in Arab localities which are underrepresented in the representative Internet survey.

39
bypass of underprivileged populations can also be found in the strong positive correlation
between the effectiveness of the financial regulation with individuals’ financial literacy,
financial confidence and specific sociodemographic characteristics such as age, gender,
education and working status. The sociodemographic and age effects seem to be the most
pronounced when looking at the use of the "Money Mountain" Internet portal.
We also found evidence that the effect of the campaign is short termed, and most of the
people entering the "Money Mountain" Internet portal did so close to when the campaign ran
in the media.
The paper also contributes to the understanding of financial literacy and the difference
between objective financial literacy and subjective financial literacy. These personal
attributes, and subjective financial literacy in particular, are important for the effectiveness of
financial regulation, and future regulatory campaigns and interventions will need to address
this.
Regulators should be aware of the effectiveness of their regulations and the spillover effects
they have on inequality and it seems that using digital media exasperates this effect. We hope
this research will be the basis for better regulatory interventions in the future.
We documented that the current policy of informing the public about regulatory changes via
the mass media and use of an Internet portal is not fully efficient. We leave for future research
the investigation of different strategies that can promote regulatory changes with higher
participation of different subsets of the population that will address the attributes we found to
be important.
�

40
�
Bibliography
Allgood, S., & Walstad, W. (2012). “The effects of perceived and actual financial literacy on
financial behaviors”, Paper presented to the National Financial Capability Study
Roundtable, The George Washington School of Business, 2012 . Available at SSRN
2191606.
Atkinson, A. and Messy, F. (2012). “Measuring Financial Literacy: Results of the OECD /
International Network on Financial Education” (INFE) Pilot Study, OECD Working
Papers on Finance, Insurance and Private Pensions, No. 15, OECD Publishing, Paris.
Baumberg, B. (2016). "The stigma of claiming benefits: A quantitative study". Journal of
Social Policy, 45(2), 181-199. doi:10.1017/S0047279415000525
Bayer, P. J., Bernheim, B. D., & Scholz, J. K. (2009). “The effects of financial education in
the workplace: Evidence from a survey of employers”, Economic Inquiry, 47(4),
605-624.
Bernheim, D. (1995). “Do households appreciate their financial vulnerabilities? An analysis
of actions, perceptions, and public policy”, Tax Policy and Economic Growth, 3, 11-13.
Bernheim, D. D. (1998). Financial Illiteracy, Education, and Retirement Saving, Olivia S.
Mitchell and Sylvester Schieber (eds.), Living with Defined Contribution Pensions,
Philadelphia:University of Pennsylvania Press, pp. 38-68.
Bernheim, B. D., Garrett, D. M., & Maki, D. M. (2001). “Education and saving: The long-
term effects of high school financial curriculum mandates”, Journal of Public Economics,
80(3), 435-465.
Brown, M., & Graf, R. (2013). “Financial literacy and retirement planning in Switzerland”,
Numeracy, 6(2), 6.
Bucher-Koenen, T., Lusardi, A., Alessie, R., & van Rooij, M. (2014). “How Financially
Literate are Women? An Overview and New Insights”, No. w20793. National Bureau of
Economic Research, 2014.
Calvet, L. E., Campbell, J. Y., & Sodini, P. (2006). “Down or Out: Assessing the Welfare
Costs of Household Investment Mistakes”, No. w12030. National Bureau of Economic
Research, 2006.
Campbell, J. Y. (2016). Richard T. Ely lecture restoring rational choice: The challenge of
consumer financial regulation. The American Economic Review, 106(5), 1-30.

41
Capital Markets, Insurance and Savings Division, Annual Report 2014. Israel Ministry of
Finance.
Christelis, D., Jappelli, T., and Padula, M., (2010). “Cognitive abilities and portfolio choice”,
The European Economic Review, vol. 54, Issue 1, 18-38.
Clark, R., Lusardi, A., & Mitchell, O. S. (2015). “Employee Financial Literacy and
Retirement Plan Behavior: A Case Study”, No. w21461. National Bureau of Economic
Research, 2015.
Coe, R. (1983).” Nonparticipation in welfare programs by eligible households: The case of
the food stamp program”, Journal of Economic Issues 17: 1035–1056.
Cole, S. A., & Shastry, G. K. (2009). “Smart money: The effect of education, cognitive
ability, and financial literacy on financial market participation”, Boston, MA: Harvard
Business School, 2009.
Daponte, B.O., Sanders, S. and Taylor, L. (1998). “Why do low-income households not use
food stamps? Evidence from an experiment”, Journal of Human Resources 34(3):
612–628
DellaVigna, S. (2009). “Contract design and self-control: theory and evidence", Journal of
Economic Literature, American Economic Association, vol. 47(2), pages 315-72, June
Drolet, Marie. "Gender differences in the financial knowledge of Canadians." (2016).
Drexler, A., Fischer, G., Schoar, A. (2014). “Keeping it simple: Financial literacy and rules
of thumb”, American Economic Journal: Applied Economics, vol. 6, no. 2, pp. 1-31.
Ebenstein ,A. and Stage, K. (2010). “Does inconvenience explain low take-up? Evidence
from UI claiming procedures”. Journal of Policy Analysis and Management 29(1):
111–136.
Fernandes, D., Lynch Jr, J. G., & Netemeyer, R. G. (2014). “Financial literacy, financial
education, and downstream financial behaviors”. Management Science, 60(8),
1861-1883.
Financial Literacy Survey: Knowledge, Opinions and Behavior in Financial Issues, November
2012, Central Bureau of Statistics.
Gabaix, X., Krishnamurthy, A., & Vigneron, O. (2007). “Limits of arbitrage: Theory and
evidence from the Mortgage.Backed securities market”. The Journal of Finance, 62(2),
557-595.

42
�
Hadar, L., Sood, S., & Fox, C. R. (2013). “Subjective knowledge in consumer financial
decisions”. Journal of Marketing Research, 50(3), 303-316.
Hastings, Justine S., Madrian, Brigitte C., and Skimmyhorn, William L. (2012). “Financial
literacy, financial education and economic outcomes”. No. w18412. National Bureau of
Economic Research.
Hastings, J. S., Mitchell, O. S., & Chyn, E. T. (2010). “Fees, framing, and financial literacy in
the choice of pension manager”. Pension Research Council WP2010-09,
Hastings, Justine S., and Tejeda-Ashton, Lydia (2008). “Financial literacy, information, and
demand elasticity: Survey and experimental evidence from Mexico”. No. w14538.
National Bureau of Economic Research.�
Hastings, Justine S., and Mitchell, Olivia S. “How financial literacy and impatience shape
retirement wealth and investment behaviors”. No. w16740. National Bureau of Economic
Research, 2011.
Heath, C., & Tversky, A. (1991). “Preference and belief: Ambiguity and competence in
choice under uncertainty”. Journal of Risk and Uncertainty, 4(1), 5-28.
Herd, P., Deleire, T., Harvey, H., & Moynihan, D. P. (2013). "Shifting administrative burden
to the state: The case of Medicaid take-up". Public Administration Review, 73(S.1),
1–47.
Hilgert, M. A., Hogarth, J. M., & Beverly, S. G. (2003). “Household financial management:
The connection between knowledge and behavior”. Fed. Res. Bull., 89, 309.
Hung, A., Parker, A. M., & Yoong, J. (2009). “Defining and measuring financial literacy”
RAND Working Paper Series WR-708. Available at SSRN:
https://ssrn.com/abstract=1498674
Jianakoplos, N. A., & Bernasek, A. (1998). “Are women more risk averse?” Economic
Inquiry, 36(4), 620-630.
Leventhal, Howard, Singer, R., and Jones, S. (1965). “Effects of Fear and Specificity of
Recommendation upon Attitudes and Behaviour. “Journal of Personality and Social
Psychology, 2 (2), 20 29.
Li, G. (2014). “Information sharing and stock market participation: Evidence from extended
families”. Review of Economics and Statistics, 96(1), 151-160.

43
Lusardi, Annamaria (2008). “Household saving behavior: The role of financial literacy,
information, and financial education programs”. No. w13824. National Bureau of
Economic Research.
Lusardi, A., & Beeler, J. (2006). “Savings between cohorts: The role of planning”, Michigan
Retirement Research Center Research Paper no.WP, 122
Lusardi, A., Keller, P. A., & Keller, A. M. (2009). “New Ways to Make People Save: A Social
Marketing Approach", No. w14715. National Bureau of Economic Research, 2009.
Lusardi, A., & Mitchell, O. S. (2007). “Financial literacy and retirement planning: New
evidence from the rand American life panel”. Michigan Retirement Research Center
Research Paper no.WP, 157
Lusardi, A., & Mitchell, O. S. (2008). “Planning and Financial Literacy: How do Women
Fare?”, No. w13750. National Bureau of Economic Research, 2008.
Lusardi, A., & Mitchell, O. S. (2009). “How Ordinary Consumers make Complex Economic
Decisions: Financial Literacy and Retirement Readiness”, No. w15350. National Bureau
of Economic Research
Lusardi, A., & Mitchell, O. S. (2011a). “Financial Literacy and Planning: Implications for
Retirement Wellbeing” No. w17078. National Bureau of Economic Research.
Lusardi, A., & Mitchell, O. S. (2011b). “Financial literacy around the world: An overview”.
Journal of Pension Economics and Finance, 10(04), 497-508.
Lusardi, A., & Mitchell, O. S. (2014). “The economic importance of financial literacy: Theory
and evidence.” Journal of Economic Literature, 52(1), 5-44.
Lusardi, A., Mitchell, O. S., & Curto, V. (2010). “Financial literacy among the young”.
Journal of Consumer Affairs, 44(2), 358-380.
Lusardi, A., Samek, A., Kapteyn, A., Glinert, L., Hung, A., & Heinberg, A. (2014). “Visual
tools and narratives: New ways to improve financial literacy”. Journal of Pension
Economics and Finance, 1-27
Lusardi, A., & Tufano, P. (2009). “Debt Literacy, Financial Experiences, and
Overindebtedness”, No. w14808. National Bureau of Economic Research.
Mandell, L. (2008). “Financial literacy of high school students”. Handbook of Consumer
Finance Research, 163-183.
Mandell, L., & Klein, L. S. (2009). “The impact of financial literacy education on subsequent
financial behavior”. Journal of Financial Counseling and Planning, 20(1)

44
�
Meir, A., Mugerman, Y., Sade, O., (2016). “Financial literacy and retirement planning:
Evidence from Israel”, Israel Economic Review Vol. 14, No. 1, 75-95.
Moffitt, R. (1983). "An economic model of welfare stigma". American Economic Review,
73(5), 1023–1035.
Mugerman,, Y. Orly, S., and Moses, S., (2014). "Long term savings decisions: Financial
reform, peer effects and ethnicity." Journal of Economic Behavior & Organization 106:
235-253.
National Insurance Institute of Israel, Poverty and Social Gaps Report, 2014.
OECD. (2005). Improving financial literacy: Analysis of issues and policies.
Parker, A. M., Bruin, W. B., Yoong, J., & Willis, R. (2012). “Inappropriate confidence and
retirement planning: Four studies with a national sample”. Journal of Behavioral
Decision Making, 25(4), 382-389.
Riphahn, R. T. (2001). "Rational poverty or poor rationality? The take-up of social assistance
benefits". Review of Income and Wealth, 47(3), 379–398.
Russell, B. D., Moulton, S., & Greenbaum, R. T. (2014). "Take-up of mortgage assistance for
distressed homeowners: The role of geographic accessibility". Journal of Housing
Economics, 24, 57–74.
Schmeiser, M. D., & Seligman, J. S. (2013). “Using the right yardstick: Assessing financial
literacy measures by way of financial well.being”. Journal of Consumer Affairs, 47(2),
243-262.
Stango, V., & Zinman, J. (2009). “What do consumers really pay on their checking and credit
card accounts? Explicit, implicit, and avoidable costs”. American Economic Review,
99(2), 06-09.
Tversky, A., & Shafir, E. (1992). “Choice under conflict: The dynamics of deferred decision”.
Psychological Science, 3(6), 358-361.
Uppal, S. (2016). Financial literacy and retirement planning”. Statistics Canada.
Van Rooij, M. C., Lusardi, A., & Alessie, R. J. (2011). “Financial literacy and stock market
participation”. Journal of Financial Economics 101.2 (2011): 449-472.
Van Rooij, M. C., Lusardi, A., & Alessie, R. J. (2012). “Financial literacy, retirement
planning and household wealth”. The Economic Journal 122.560 449-478.
Zingales. Luigi. (2015). Presidential address: Does finance benefit society? The Journal of
Finance 70 (4): 1327-63.

45
Appendix 1-Variable description
Y Variables Description
Full awareness of the "Money
Mountain" campaign
Binary variable for people who stated that they have full
awareness of the campaign
Full awareness of the tax
exemption on small inactive
plans campaign
Binary variable for people who stated that they have full
awareness of the campaign
Entered the "Money Mountain"
Internet portal
Binary variable for people who stated that they have
entered the "Money Mountain” Internet portal
Contact with the intent of
withdrawing funds amounting
from the campaigns
Binary variable for people who stated that they contacted
their retirement fund manager about withdrawing funds
from inactive provident funds because of one of the
campaigns.
X Variables Description
Financial literacy index Financial literacy index which is the sum of three questions answered correctly regarding: interest rate, inflation and diversification risk.
Age Value in years.
Confidence in retirement
knowledge
Dummy variable for all those answering they understand
retirement issues to a large extent and more
Interested in retirement Dummy variable for all those answering they are interested
in retirement issues to a large extent and more
Interest rate question Dummy variable for all those who answered correctly
Inflation question Dummy variable for all those who answered correctly
������������������������� Dummy variable for all those who answered correctly
Female Dummy variable for female
Married Dummy variable for married
Income level Dummy variables for below average income, average
income and above average income
Education level Dummy variables for high school education, above high
school education and academic education
Religious identity Dummy variables for secular, traditional, religious and
ultra-Orthodox
Working status Dummy variables for working (including voluntary army
service and part time), unemployed (including mandatory
service and students) and retiree
Immigrant Dummy variable for immigrant