Bank of Cyprus Group (BoC) Relations/Presentations... · with further planned strategic actions to...
48
Bank of Cyprus Group (BoC) Non-Deal Roadshow December 2014
Transcript of Bank of Cyprus Group (BoC) Relations/Presentations... · with further planned strategic actions to...

Bank of Cyprus Group (BoC)
Non-Deal Roadshow
December 2014

Presenters
2
John Hourican
Chief Executive Officer
Euan Hamilton
Director of Restructuring and
Recoveries Division
Constantinos Pittalis
Investor Relations Manager
Dr. Chris Patsalides
Finance Director
Michalis Athanasiou
Group Chief Risk Officer
Eliza Livadiotou
Group Chief Financial Officer
3
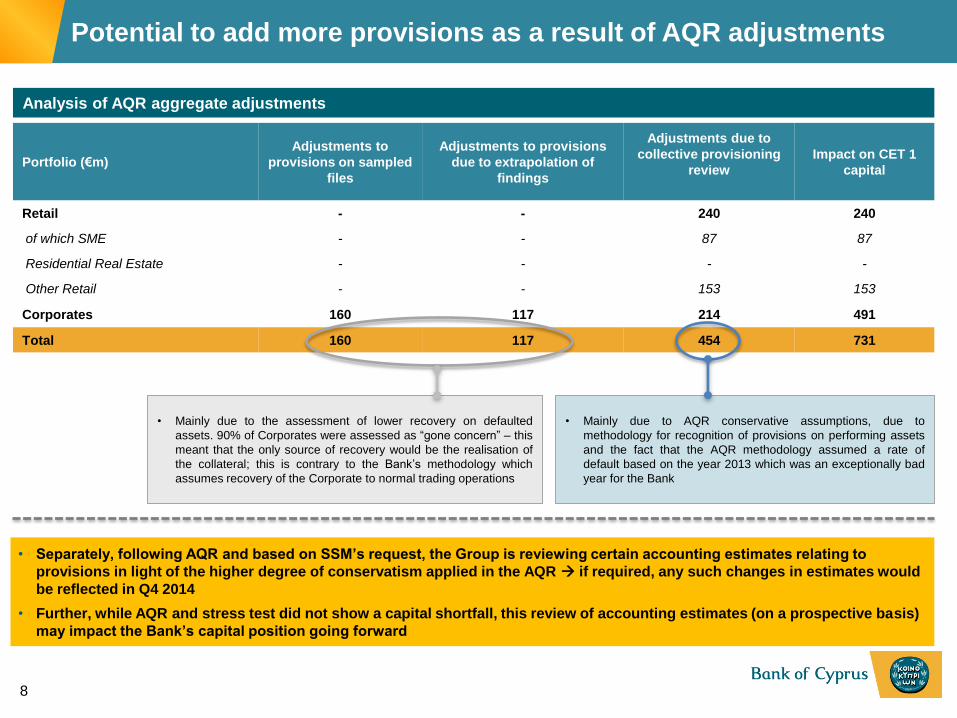
Well-capitalised bank post equity raise with a world class
Board of Directors
• A solid Basel III capital position with a FL CET1 ratio at 14.9%
• New world-class Board of Directors with significant financial institutions management expertise
• Pro-active strengthening of the capital base enabled the Bank to pass the AQR and the stress test
(1) Loans with a specific provision (impaired loans) and loans past due for more than 90 days but not impaired
Dominant position in a recovering Cypriot economy,
evidenced in positive rating action for Cyprus and the Bank
• c.41% market share of gross loans, c.25% of deposits, c.26% of life premiums and c.13% of non-life premiums
• Faster economic recovery evidenced by Moody’s upgrade, improved credit outlook and positive revisions to GDP forecasts
Stronger liquidity position and reduced reliance on
Eurosystem funding
• ELA funding reduced by €3.9bn since peak
• Further repayment planned in 2015 through wholesale market funding, repos and deleveraging actions
• Stabilising deposit base
Loan book deterioration being contained; dedicated NPL
management unit and adoption of foreclosure legislation
• 90+DPD1 loans fully covered through provisions and conservatively valued collateral
• Progress made on foreclosure law – further clarity around implementation likely to be available in the coming year
Clear strategic focus — attractive and profitable core
businesses
• Group profitability driven by core Cyprus operations
• Deleveraging actions to further support core market focus
• Steady progress in improving profitability of core operations
Strong management team with significant turn-around and
restructuring experience
• Present management has accomplished several key milestones with further planned strategic actions to come in 2015:
– Successful Laiki system integration
– €1bn equity raise and ongoing balance sheet derisking
– Significant progress in the restructuring of top NPL exposures
Bank of Cyprus will continue to benefit significantly from the economic recovery in Cyprus and vice versa
A stronger Bank of Cyprus – key investment highlights

48%
31%
5% 10%
6% Customer deposits
ELA
ECB
Total equity
Other liabilities
Euro system
funding
36%
Period of growth
4
(1) As of December 2012
(2) As of June 2014
(3) As of September 2014
(4) Moody’s upgrade of BoC’s long-term deposits to Caa3 as of 17 Nov 2014
2009 - 2013 Pre-2009 2013 2014
Following a traumatic 2013, significant steps were taken in 2014 to
stabilise the Bank
Cyprus bailout by IMF/EC
Resolution & shares suspension
Sale of Greek operations
Sh
are
ho
ldin
g
evo
luti
on
Equity raise
New Board
Rating upgrade4 Depositor bail-in
Laiki acquisition
New CEO
Greek
sovereign
crisis
recession
& property
crisis
81%
18%
1% Bailed-in depositors
Legacy Laiki Bank
Shareholders & debt security holders as at March 2013
72%
5%
10%
13%
Retail investors
Cypriot / Greek institutionals
Foreign institutionals
Others
47%
10%
43%
Bailed-in depositors
Legacy Laiki Bank
New shareholders
Pre bail-in1 Pre-capital increase2 Post-capital increase3
Fu
nd
ing
evo
luti
on
49%
28%
3% 14%
6% Customer deposits
ELA
ECB
Total equity
Other liabilities
92%
1% 7%
Customer deposits
Total equity
Other liabilities
Euro system
funding
31%
Relisting

11,3%
15,4% 14,9%
4.3%
(0.2%) (0.5%)
Jun-14 CET1 ratio (transitional
basis)
Capital increase Q3'14 movement Sep-14 CET1 ratio (transitional basis)
Fully loaded impact Sep-14 CET1 ratio (fully loaded)
Capital
increase of
€1bn
€1.6bn buffer
vs 8%
(1) Fully Loaded – main capital deduction from CRD IV transitional to fully loaded is in relation to Deferred Tax Assets (DTAs)
Capital raise increased CET1 position to around 15%
1
5

14.9%
14.9%
12.7%12.4%
12.0% 11.8% 11.7% 11.5% 11.4% 11.3% 11.2%
10.4% 10.4% 10.2%9.9%
BoC Peer 1 Peer 2 Peer 3 Peer 4 Peer 5 Peer 6 Peer 7 Peer 8 Peer 9 Peer 10 Peer 11 Peer 12 Peer 13 Peer 14
A solid Basel III capital position leading to successfully clearing the AQR and the stress test
Source: Company financials
(1) Banks include Alpha Bank, National Bank of Greece, Creval, BPS, Piraeus Bank, BPM, BPER, Sabadell, Popular, Carige, Liberbank, BCP, Eurobank and Hellenic bank
BoC now appropriately capitalised relative to peers
6
Basel III fully loaded CET1 ratio of Southern European banks (9M 2014)1
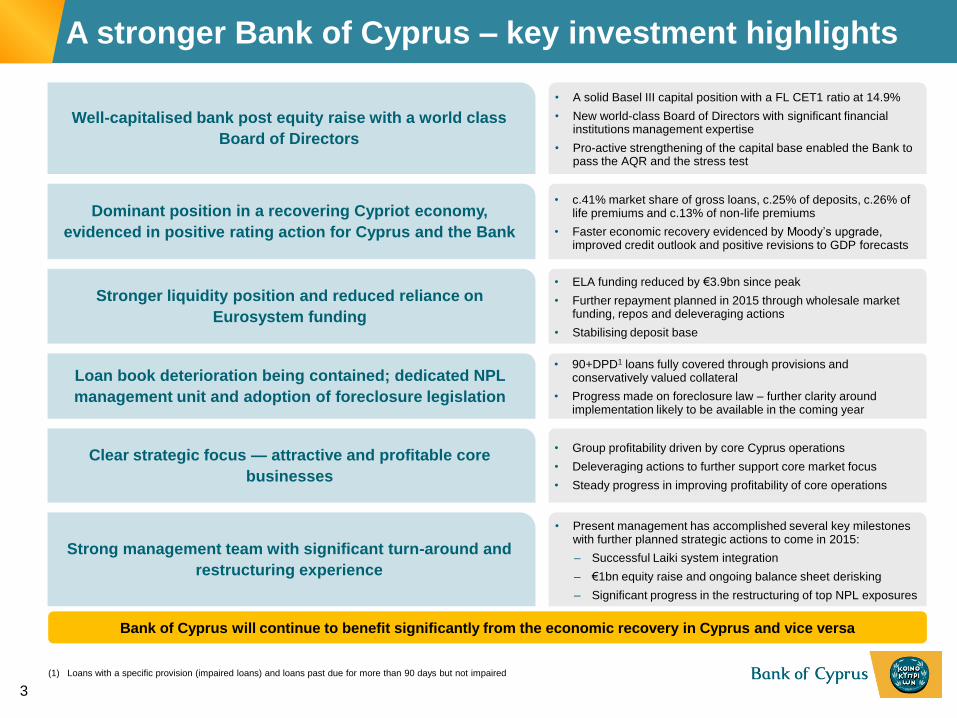
10,4%
7,3% 7,3% 7,7%
7,3%
1,5%
5,9%
(3.1%)
0,5%
(5.8%)
4,3%
CET1 ratio 2013
AQR adjustment
CET1 ratio AQR
adjusted
CET1 ratio AQR
adjusted
Baseline scenario impact
CET1 post baseline
CET 1 AQR adjusted
Adverse scenario impact
CET1 post adverse
Capital increase Sep-
2014
CET1 post capital
increase
Baseline Adverse AQR
Adverse
scenario
threshold
5.5%
Capital raise helped the Bank pass ECB Comprehensive Assessment
11.5%
Adjusted
for capital
increase
11.6%
Adjusted
for capital
increase
Surplus
€81m
Result of the Comprehensive Assessment validated timing and size of capital raise
7
AQR and stress test impacts
Surplus
€931m
1
(1) Excludes retail offer of €100m
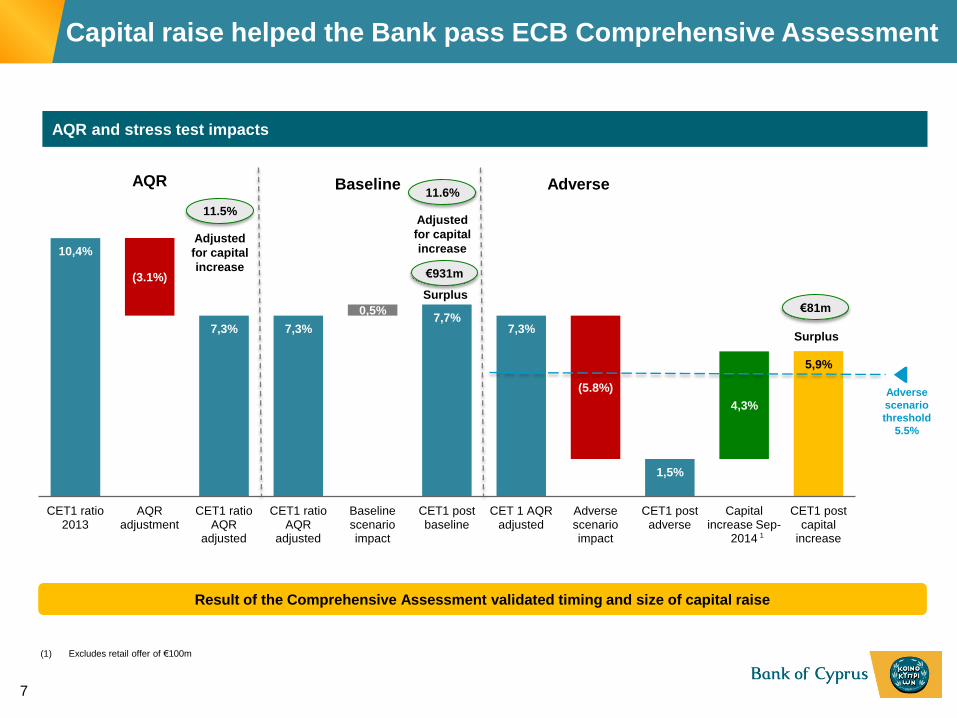
• Separately, following AQR and based on SSM’s request, the Group is reviewing certain accounting estimates relating to
provisions in light of the higher degree of conservatism applied in the AQR if required, any such changes in estimates would
be reflected in Q4 2014
• Further, while AQR and stress test did not show a capital shortfall, this review of accounting estimates (on a prospective basis)
may impact the Bank’s capital position going forward
Potential to add more provisions as a result of AQR adjustments
Portfolio (€m)
Adjustments to
provisions on sampled
files
Adjustments to provisions
due to extrapolation of
findings
Adjustments due to
collective provisioning
review
Impact on CET 1
capital
Retail - - 240 240
of which SME - - 87 87
Residential Real Estate - - - -
Other Retail - - 153 153
Corporates 160 117 214 491
Total 160 117 454 731
Analysis of AQR aggregate adjustments
• Mainly due to the assessment of lower recovery on defaulted
assets. 90% of Corporates were assessed as “gone concern” – this
meant that the only source of recovery would be the realisation of
the collateral; this is contrary to the Bank’s methodology which
assumes recovery of the Corporate to normal trading operations
• Mainly due to AQR conservative assumptions, due to
methodology for recognition of provisions on performing assets
and the fact that the AQR methodology assumed a rate of
default based on the year 2013 which was an exceptionally bad
year for the Bank
8

47%
18%
10%
5%
5%
15%
Bailed-in depositors WL Ross and WL Ross introduced investors
Legacy Laiki Bank Renova Group
EBRD Other new shareholders
9
Current shareholding of BoC (9M’14)
Post-capital increase
Revised Board composition
Name Designation
Dr. Josef Ackermann Chairman
Independent
Mr. Wilbur Ross Vice Chairman
Independent
Mr. Vladimir Strzhalkovskiy Vice Chairman
Independent
Mr. John Patrick Hourican CEO
Dr. Christodoulos Patsalides Finance Director
Mr. Arne Berggren Represents EBRD
Independent
Mr. Maxim Goldman Represents Renova
Mr. Marios Kalochoritis Independent
Mr. Michalis Spanos Senior Independent
Mr. Ioannis Zographakis Independent
Newly elected directors
• AGM of BoC was held on 20 Nov 2014
• 6 directors were newly appointed to the board
• 4 directors were re-elected
Equity raise has attracted high quality professional investors and a world class Board of Directors
• Significant investor interest in all aspects of the Bank of Cyprus
story, including equity, but also potential future corporate actions
• Targeted marketing effort led to 100+ investor meetings and 27 new
high quality investors being added to the shareholder base

10
2014 2015
16
Dec
Cyprus and
Athens
relisting
Retail offer
begins
15
Dec
Listing on a
major
European
exchange
Medium
-term
18
Sep
Close of
€1bn share
capital
increase
20
Nov
AGM and
new Board
election
27
Nov
Q3 results
published
Non-deal
roadshow
Investors have the opportunity to gain or increase exposure in BoC stock following the re-listing - an element of
liquidity is likely to be available from certain bailed in depositors (who have been locked in since the shares were
suspended in Cyprus and Athens)
Scope for investor participation in Bank of Cyprus equity post re-listing
Retail offer
closes
9
Jan
Medium-
term

11
(1,6%)
(2,5%) (2,0%)
(3,7%)
(5,3%)
(6,1%) (5,2%) (5,1%)
(4,0%)
(3,7%)
(4,9%)
(6,2%) (7,4%)
(8,7%)
(7,1%)
(5,5%)
(3,9%)
(2,5%) (2,8%)
0,4% 1,6%
2,0% 2,2% 2,1%
Q1'12 Q2'12 Q3'12 Q4'12 Q1' 13 Q2 '13 Q3 '13 Q4 '13 Q1 '14 Q2 '14 2014E 2015E 2016E 2017E 2018E 2019E
Actual Troika original forecast Forecast
GDP growth expected to be positive from 2015E – significant improvement relative to original Troika expectations
Source: EC, EIU, CBC, Troika, company reports, Cyprus Centre of Economic Research and University of Cyprus
Economic sentiment — values seasonally adjusted
Significant uptick in sentiment – has entered into positive territory in Q3’14 after bottoming in Q3’13
Q1'03 Q1'04 Q1'05 Q1'06 Q1'07 Q1'08 Q1'09 Q1'10 Q1'10 Q1'12 Q1'13 Q1'14
ESI-Cyprus index
Similar to 2008 levels
Improving macro indicators supportive of Cyprus’s economic recovery
Nov-14
Zero level (100)

33,3%
31,4%
30,0%
29,6%
26,0%
23,0%
21,0%
12,5%
12,5%
Business hub given strategic location at the crossroads of Europe, Asia, Middle East and Africa
Small, flexible economy; real unit labour costs dropped by 11% during 2012-2014 boosting competitiveness
Growth prospects in tourism, education & R&D, health & medical, professional and financial services
Budget deficit contracted faster than anticipated- expected to meet the Maastricht criteria in 2014
Potential for energy / hydrocarbon industry (potential c.5Tcf on Aphrodite site)
1
2
3
4
Upside potential for macro recovery
Recovery supported by a resilient tourism sector…
1,5 1,5
1,7
1,9
2,1
2009 2010 2011 2012 2013
Tourism revenues (€bn)
2014 corporate tax rates
Double taxation avoidance treaties
with c. 50 countries
20,7%
40,4%
38,9%
Upper secondary
Less than
Upper Secondary
Tertiary
Education for persons 20-64 (2013)
Cyprus has the highest number
of university graduates per capita
in Europe
…and significant additional growth levers
…an enabling business environment…
Drivers of
macro-
economic
recovery
12 Source: EC, EIU, CBC, Troika, and company reports
1
2
3
CAGR:
9%
5

13
Ratings uplift for Cyprus and the Bank
0
2
4
6
8
10
12
14
Jan-13 Apr-13 Jul-13 Oct-13 Jan-14 Apr-14 Jul-14 Oct-14
Cyprus Portgual Italy Spain Greece Ireland BoC
Baa1
Baa3 Ba2
B1
B3 Caa2
Ca
Source: Bloomberg, Moody’s, S&P, Fitch, DBRS
0
200
400
600
800
1.000
Jan-13 Apr-13 Jul-13 Oct-13 Jan-14 Apr-14 Jul-14 Oct-14
CDS spreads significantly narrowed vs. periphery peers
Baa1
Baa2
Ba1
B3 Caa1
Caa3
Baa2
Investor confidence returning as CDS trades inside Greece since February 2014…
…also reflected in ratings, with gap narrowing for Bank of Cyprus
Positive outlook evidenced in credit confidence and ratings
Agency Rating Last
action Outlook
Moody's B3 Upgrade Stable
S&P B+ Upgrade Stable
Fitch B- Affirmed Positive
DBRS B (low) Upgrade Stable
Cyprus sovereign ratings
Moodys ratings

20
30
40
50
60
70
80
Nov-05 Nov-06 Nov-07 Nov-08 Nov-09 Nov-10 Nov-11 Nov-12 Nov-13
Loans Deposits
A smaller, stronger and more stable banking system
14
Recent developments in the Cypriot banking system
Monthly change in banking system deposits (€bn)
• Monthly change in banking system deposits
remain at a manageable level since lifting of
domestic capital restrictions - but significant
system wide funding gap from the bail-in
remains; part of reduction of deposits utilised
to repay loans
• The bulk of the Cyprus banking system is now
under direct supervision of the SSM
• 4 banks participated in the ECB assessment
(BoC, CCB, Hellenic and RCB) – only Hellenic
failed the assessment but then confirmed plans
to raise capital
Source: Central Bank of Cyprus, IMF, ECB and company reports
Loans and deposits (€bn)
Oct-14
0,2
(1,7)
(1,0)
(3,8)
(6,3)
(1,4)
(5,3)
(1,0) (1,4)
(0,8) (0,2) (0,1) (0,2) (0,1)
(0,5) (0,2)
0,2 0,5
(0,4)
0,0
(0,2) (0,4) (0,2)
Dec-12 Mar-13 Jun-13 Sep-13 Dec-13 Mar-14 Jun-14 Sep-14 Oct-14

25.8 21.9
13.3
4,4 5,2 1,2 0,8
91
81
15
Gross loans
€bn
Branch network
# branches
Deposits
€bn
26% Insurance
premiums1
€m
Source: CBC, IMF, company disclosure (Bank of Cyprus and competitors) as of 9M 2014
(1) FY2013
(2) 49.9% owned by the Bank
Life
13%
56
54
Non-life
2 2
24.6
11.2 13.4 6,1 2,3 2,8 1,1
203
130
349
68 29 7
14
(Pre-bail in) 9M2014
BoC
Laiki
Laiki
Laiki
(Pre-bail in)
(Pre-bail in)
BoC
BoC
9M2014
9M2014
37%
39%
41%
25%
Dominant position in the Cypriot banking & insurance market
xx% Market share as of Sep 2014

16
BoC: steady balance sheet reduction Q-o-Q
30,3
33,0
30,3
29,4 28,6
27,5
Dec-12 Jun-13 Dec-13 Mar-14 Jun-14 Sep-14
+9%
-3% -8%
-4% -3%
-17% (30 Jun 2013 to 30 Sep 2014)
Combined impact of 2014 transactions on Group: increase in CET1 ratio of 0.8% and
improvement in Group liquidity of about €1.8bn
Continued momentum to execute
specific deleveraging / de-risking
H1 2013 (Resolution)
H2 2013 Q1 2014 Q2 2014 Pending actions
Greek ops (Piraeus)
Romanian assets
(Marfin)
Kyprou AM
(Alpha Trust)
Banca Transilvania
(stake sell down)
Ukrainian operations
(Alfa)
Serbian exposure
(Piraeus)
Govt. bond repayment
“Fix or sell” strategy
• Romania (remaining
exp.)
• Uniastrum
• Cyprus / Greece RE
As
se
t (B
uye
r)
Q3 & Q4 2014
UK loan book
Marriot related assets
in Romania
€bn
Shrink to core strength: significant deleveraging progress
(Pre-bail in)

11,4
9,9 9,6 9,5 8,8
7,7 7,5
1,3 1,4 1,4
1,4
0,9 0,9
11,4 11,2 11,0 10,9
10,2
8,6
Apr-13 Sep-13 Dec-13 Mar-14 Jun-14 Sep-14 Nov-14
8.4
ELA ECB funding
(€ bn)
~ €1bn capital market transactions
~ €0.5bn repos & deleveraging
Further actions planned for
2015
37%
Eurosystem funding reliance reducing fast
36% 36% 36% 31% Eurosystem Funding as xx% of
balance sheet
Continuous reduction of ELA and ECB funding with further potential going forward
17
3,9 6,2 7,2 7,2 7,0 7,1
1,9
2,6 3,3 3,3 3,2 3,4
1,9
2,2
2,5 2,5 2,4 2,5
Dec-12 Jun-13 Sep-13 Dec-13 Jun-14 Sep-14
Corporate SMEs Retail
1
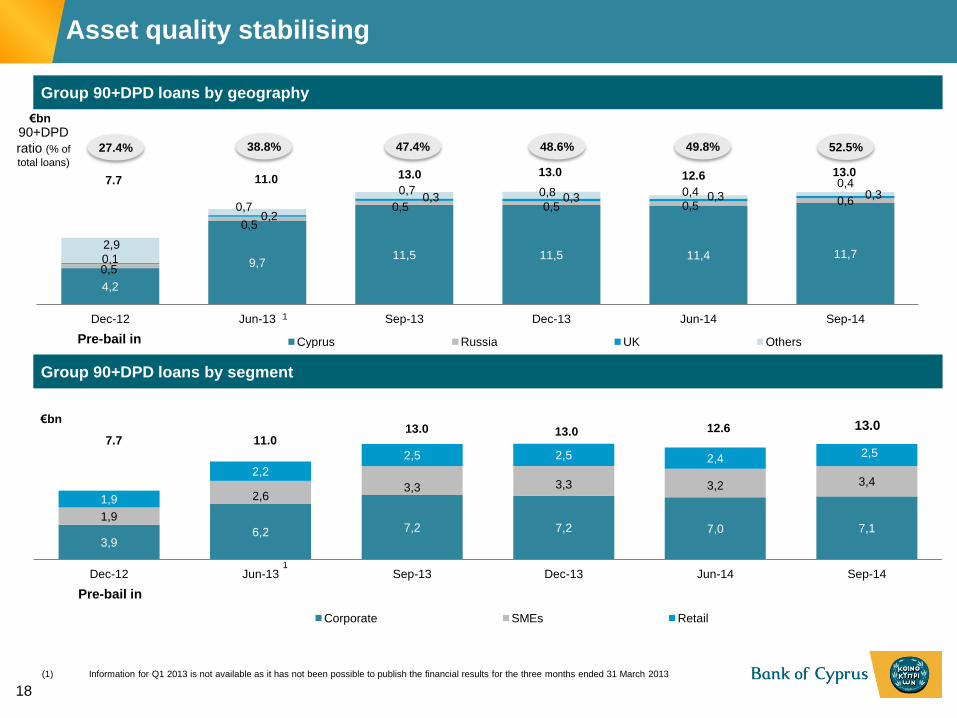
13.0
4,2
9,7 11,5 11,5 11,4 11,7
0,5
0,5
0,5 0,5 0,5 0,6
0,1
0,2
0,3 0,3 0,3 0,3
2,9
0,7
0,7 0,8 0,4 0,4
Dec-12 Jun-13 Sep-13 Dec-13 Jun-14 Sep-14
Cyprus Russia UK Others
1
27.4% 38.8% 47.4% 48.6% 49.8%
(1) Information for Q1 2013 is not available as it has not been possible to publish the financial results for the three months ended 31 March 2013
€bn
11.0 13.0 13.0 12.6 7.7
€bn
11.0 13.0 13.0 12.6
7.7
Pre-bail in
Pre-bail in
Group 90+DPD loans by geography
Group 90+DPD loans by segment
90+DPD
ratio (% of
total loans)
52.5%
13.0
18
Asset quality stabilising

19
3,2 1,8 3,8 1,6
11,5
21,9
22,7% 30,5% 16,2%
29,0%
81,9% 53,7%
Loan Loss
Reserve (LLR)
coverage
Tangible
coverage
Total
coverage
90+DPD loans
by segment1
Corporate SMEs Housing Consumer RRD Cyprus
46,0% 29,3% 18,4% 48,6% 36,8% 36,5%
66,0% 81,6% 84,1% 45,7% 76,6% 75,4%
112,0% 110,9% 102,5% 94,3% 113,4% 111,9%
Gross loans
(€bn)
xx % of total gross loans (Cyprus only)
52.3% 7.3% 17.5% 8.1% 14.8%
Significant provision and collateral coverage, with additional comfort from personal guarantees
100.0%
Credit Risk – 90+ DPD fully covered by provisions & tangible collateral
(1) Shown as a % of segmental loans
9M2014

Dedicated NPL unit is fully operational and showing early successes
20
(1) Currently using the services of external property consultants
(2) No retail client ownership within RRD
Restructuring & Recoveries Division (RRD): structure
Strategy
and
analytics
Real estate
manage-
ment1
Corporate
Financial
solutions
Retail2 and
SME
Debt
recovery
services
Restructuring
& Recoveries Division
Dedicated unit housing €11.5bn of exposures supported by c.490 employees, reporting directly to the CEO in
order to manage arrears in an independent and centralised way as required by the Arrears Management Directive
CEO
2 A single unit to manage the customer from early
delinquency until foreclosure
3
Dedicated channels for addressing delinquent
customers per segment (e.g., Retail2, SME and
Corporate)
4
Build internal capabilities in a centralised manner to
effectively and efficiently address arrears (e.g.,
analytics, systems)
1
An independent and centralised unit that is
responsible for and specialises in the management
and monitoring of customers in arrears
€
91 166 222
€5.7 bn €1.6 bn €4.3 bn

22%
41%
26%
6% 5%
Restructuring agreed and implemented
Detailed non binding heads of terms for restructuring agreed
Diligence ongoing
Receiver/manager appointed
Other recovery cases
21
Achievements over the last 6 months (April to September)
Summary of restructuring efforts for
top 30 exposures
€5.0bn
Good progress in restructuring efforts
€330m
Sold the Group’s largest single name NPL exposure
• Loans extended to a Serbian real estate management company sold
to Piraeus Bank for approximately €165m and realised an accounting
gain of €27m
€1.2bn
Restructured loans
• Addressed the restructuring backlog: de-bottlenecking of restructuring
processes
• Designing a workflow process for managing arrears in the retail book
following the restoration of limited underwriting authority within Retail
Arrears Management, following positive discussions with the Central
Bank of Cyprus
• Delivered specialised trainings to upskill employees
€1.1bn Removed from 90+DPD
• Initiated a transformational project to implement best practices and
driving cultural change in managing arrears following a Central Bank
of Cyprus driven audit
15
Appointed Receivers/Managers for the recovery of debt in 2014
• Recently appointed a receiver in a c. €200m Bank exposure – the
island’s largest receivership

• Untested process
• Courts are not adequately
resourced
• Managing reputational
implications
• Delay in the enactment of
related accompanying
regulations
Summary
• Establishes clear procedures for timing of repossession, valuation and
auction, aiming to reduce repossession timetable from 10+ years to as
little as 18 months
• Passing of the Bill was a key requirement for further disbursement of
funds from the Troika
• Insolvency framework (designed to protect vulnerable parties from
foreclosure) is still being discussed at Government and supranational
levels
Passing of Foreclosure law a key step in the recovery process
22
• Bill passed by the House of Representatives on 6 September
• Supreme Court ruled on 31 October, four of the six bills that limited the
effect of the foreclosure bill on low-income groups as unconstitutional
• An internal working group established to design and coordinate the
Bank's processes and procedures in implementing the newly set
provisions of the Law
Recent Developments
Key challenges & issues

23
Phase 1: Restructuring
Phase 2: Today
Phase 3: Delivering
returns
Medium-term objective
(1) Data as of 30 September 2014
Core bank
• Gross loans: 10.41
• Deposits: 10.91
Restructuring & Recoveries
Division • Gross loans: 11.51
• Deposits: 0.31
Overseas & Disposal Group
• Gross loans: 3.01
• Deposits: 2.11
• Comprised of Banking
(Consumer, SME, Corporate,
International), Insurance, AM,
Wealth and Brokerage
• Self funded but largely
encumbered to fund the non-
core balance sheet
• Already generating attractive
returns
• Manages all exposures above
€100m and problem loans
• Decent cash flow generation
• Key remaining transactions
include Romania, Russia, UK
and select Cypriot / Greek
exposures
• Break-even or negative
returns
• Consumes capital and parent
funding
• Engine of growth for Cyprus
• Maintain strong profitability
• Actively manage and collect
• Accelerate run-off where
possible
• Exit as appropriate to repatriate
capital and funding
€bn
Clear strategic segregation leading to a strong Core Bank

42%
46%
12%
Cyprus Core
RRD
Overseas and Disposal Group
Cyprus Core forms 42% of Group loans…
52%
17%
23%
8%
Cyprus Core
… as well as a key driver of profitability (9M’14)
Profit after tax and before one-offs for Cyprus operations of €171m for 9M’14, compared to Group total of €84m
704 826
-280 -373
171
790 941
-367 -492
84
Net interest income Total income Total expenses Provisions Profit after tax & before one-offs
Cyprus (Core + RRD)
Group
89% 88% 76% 76% 204% %
% contribution of
Cyprus operations
Group balance sheet and P&L primarily driven by Cyprus core
Consumer
September 2014: €13.3bn
SME
Corporate
IBS & Others
Time
Current
Savings
€10.4bn
By type
… and 82% of Group deposits
By type
€10.9bn
September 2014: €24.7bn
L/D: Cyprus core — 88% vs. Group — 148%
24
€m
82%
2%
16%
Cyprus Core
RRD
Overseas and Disposal Group
63%
31%
6%
Cyprus Core

Category
Key
performance
indicators
Group
2013
Group
9M’ 14
Cyprus
9M’ 14
Medium-
term
target
(2017)
Asset
quality
90+ DPD
coverage 38% 38% 37% 40%-50%
Provisioning
charge 3.7% 2.6% 2.2% <1.0%
Funding
Eurosystem
funding % total
balance sheet
36% 31% n.a. <25%
Capital
Basel 3
transitional
CET1
10.4% 15.4% n.a. >12%
Margins
and
efficiency
Net interest
margin 3.5% 4.0% 3.9% ~3.25%
Fee and
commission
income/ total
income
14.3% 13.9% 14.2% Increase
Cost to income
ratio 47% 39% 34% 40%-45%
Significant progress made on Group KPIs, with a clear plan of action to
achieve medium-term targets
Key Pillars & Plan of action
• Continue re-structuring capitalising on the foreclosure law
• Seek FDI to enhance business viability • Re-cycle re-structured loans into the lending
business for continued support and service
1. Reverse
trend on
overdue
loans
• Boost deposits by leveraging on stronger capital position
• Access DCM on the back of improved ratings, stronger financial soundness and better prospects
• Proceeds from exiting non-core overseas activities
2. Normalise
funding;
Eliminate
ELA
• Direct lending into promising sectors with a view to funding the recovery of the Cypriot economy
• Further diversify income stream by boosting fee income from new sources in international business and wealth
3. Focus on
core
markets
in Cyprus
• Set-out a digital vision and introduce appropriate technology to enhance product distribution channels
• Introduce technology and processes to reduce operating costs
• Introduce HR policies aimed at enhancing productivity
4. Achieve a
lean
operating
model
• Strengthen governance and risk- management to
deliver appropriate medium-term risk-adjusted returns • Listing of shares on a larger and more liquid
exchange
5. Deliver
returns
25
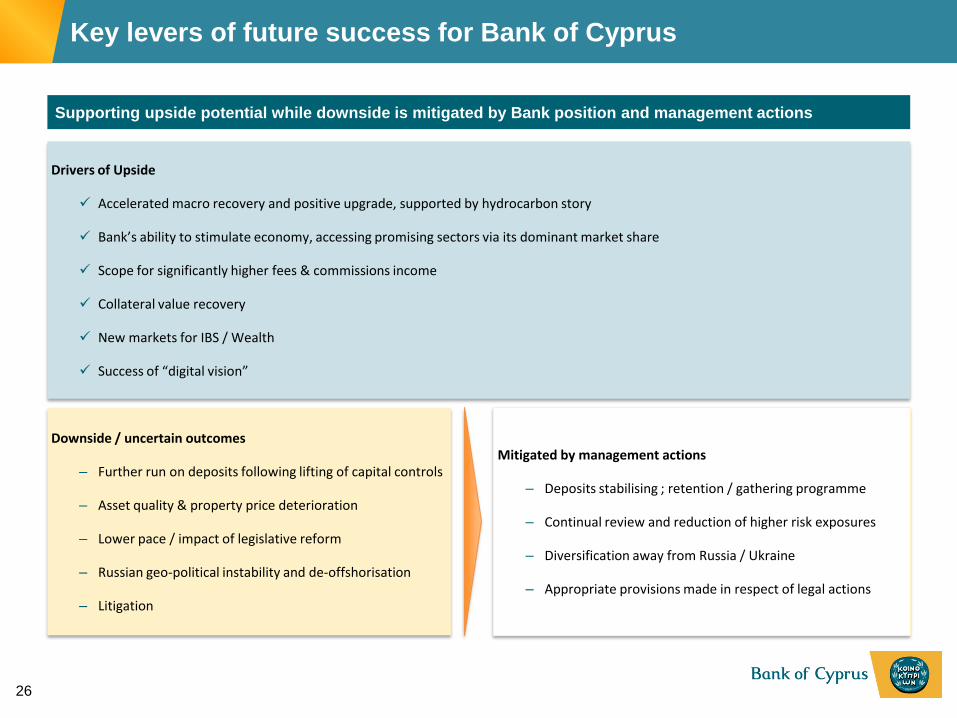
Key levers of future success for Bank of Cyprus
26
Supporting upside potential while downside is mitigated by Bank position and management actions
Drivers of Upside
Accelerated macro recovery and positive upgrade, supported by hydrocarbon story
Bank’s ability to stimulate economy, accessing promising sectors via its dominant market share
Scope for significantly higher fees & commissions income
Collateral value recovery
New markets for IBS / Wealth
Success of “digital vision”
Downside / uncertain outcomes
– Further run on deposits following lifting of capital controls
– Asset quality & property price deterioration
– Lower pace / impact of legislative reform
– Russian geo-political instability and de-offshorisation
– Litigation
Mitigated by management actions
– Deposits stabilising ; retention / gathering programme
– Continual review and reduction of higher risk exposures
– Diversification away from Russia / Ukraine
– Appropriate provisions made in respect of legal actions

Key takeaways
27
• Leading financial institution in an economy that is on the road to economic recovery, as evidenced
by the Moody’s upgrade
• MoU implementation on track with 5th Troika review mission being another positive one
• CET1 ratio improved to 15.4% (transitional basis, 14.9% CET1 B3 FL) driven the successful €1
bn share capital increase through a private placement with international institutional investors and
existing investors
• Deposit base showing signs of stabilisation, with 3Q2014 deposit outflows in Cyprus reduced to
just 3%; early release of all blocked decree deposits
• ELA reduced through deleveraging actions and capital proceeds
• RRD up and running with signs that measures are yielding results, despite the lack of the
appropriate legal infrastructure
• Loan quality challenges remain; 90+ DPD remain high; imperative that the Bank is given the tools
to engage effectively with borrowers
• Election of a new Board with members bringing a wealth of banking and broader corporate
experience

Appendices

Appendices
29
> Income statement 30 - 34
> Balance sheet 35 - 46
> Management team 47

Selected lines from Income Statement (€m) 9M2014 3Q2014 2Q2014 qoq
change % 1Q2014
Net interest income 790 244 279 -12% 267
Net fee and commission income 131 43 43 +1% 45
Insurance income net of insurance claims 35 10 12 -13% 13
Other (expenses)/income (15) (6) (24) -66% 15
Total income 941 291 310 -7% 340
Total expenses (367) (122) (121) +0% (124)
Profit before provisions for impairment of customer loans, restructuring costs and discontinued operations
574 169 189 -11% 216
Provisions for impairment of customer loans (492) (163) (183) -11% (146)
Share of profit /(loss) from associates 2 (2) 2 n/a 2
Profit before tax, restructuring costs and discontinued operations 84 4 8 -68% 72
Tax (15) (5) (8) -27% (2)
Loss attributable to non-controlling interests 15 7 6 2
Profit after tax and before restructuring costs, discontinued operations and net profit from disposal of non-core assets
84 6 6 -15% 72
Restructuring costs (32) (11) (16) - (5)
Loss from discontinued operations (36) - - - (36)
Net profit from disposal of non-core assets1 60 - 60 - -
Profit/(loss) after tax 76 (5) 50 n/a 31
Net interest margin 4.03% 3.83% 4.26% -43 b.p. 3.99%
Cost-to-Income ratio 39% 42% 39% +3 p.p. 36%
b.p. = basis points, p.p. = percentage points ; 100 b.p. = 1 p.p.
(1) This relates to the loss on disposal of the Ukrainian operations (€114m), the profit on disposal of the stake in Banca Tnansilvania (€47m) the profit on disposal of the
loans in Serbia (€27m) and the profit from the early repayment of the Cyprus Government Bond (€100m)
Income Statement Review
30

310
394 380 399
426 383
1H'13¹ 3Q'13 4Q'13 1Q'14 2Q'14 3Q'14
FY2013: 354 9M2014: 403
Net Interest Income (€m)
Net Interest Margin (bp)
• 3Q2014 Net Interest Income (NII) at €244m
(compared to €279m for 2Q2014) on the back of
lower customer spread reflecting reduced lending
rates and lower interest income following the
repayment of €950m of a sovereign bond by the
Republic of Cyprus (Laiki recapitalisation bond)
in July 2014
• During 3Q2014 the Bank reduced its Base
lending rates in order to help the rejuvenation of
the domestic economy
• 3Q2014 Group Net Interest Margin (NIM) at
3.83% (compared to 4.26% for 2Q2014) due to
reduction of net interest income
• NII and NIM continue to be affected by the
competitive conditions in the domestic banking
market and by the high-though-declining reliance
on Eurosystem funding which is cheaper than the
cost of customer deposits
Net Interest Income and Net Interest Margin
246 224 224 235 218
44 44 43 44
26
3Q'13 4Q'13 1Q'14 2Q'14 3Q'14
290 268 267 279
244
Interest income from Laiki Recapitalisation Bond
(1) Information for 1Q2013 and 2Q2013 is not available as it has not been possible to publish the financial results for the three months ended 31 March 2013.
31

Analysis of Non Interest Income (€m)
41 43 45 43 43
12 14 13 12 10 9
23 14
-30
-5
3
-38
1 6
-1
65 42 73 31 47
3Q'13 4Q'13 1Q'14 2Q'14 3Q'14
Fee and commission Income Insurance income net of insurance claims
FX income & Net income/(loss) from financial instruments Other income/(expense)
%
Non Interest
Income %
Operating income 10% 13% 18%
x
Non Interest
income (€m)
• The majority of non-interest income is recurring deriving from fees and commission income
and income from the insurance business
• All businesses are focusing on increasing fee income; e.g. International Banking Services
(IBS), a significant contributor of fee income in the past, is focused on reactivating volumes
in incoming and outgoing payments to improve non-interest income
• Recurring income from insurance business reflecting the Group’s leading position in the
insurance business in Cyprus
21% 16%
Analysis of Non-interest income
32

Group Cost to Income Ratio
Quarterly Total expenses (€m) • 3Q2014 Total expenses of €122m compared
to €121m for 2Q2014
• Staff costs for 3Q2014 at €67m broadly at the
same level as in the previous quarters
• The cost-to-income ratio for 9M2014 has been
broadly stable at 39%
57%
49% 47%
36% 38% 39%
1H'13¹ 9M'13 FY'13 1Q'14 1H'14 9M'14
82 64 67 68 67
52 62 57 53 55
134 126 124 121 122
3Q'13 4Q'13 1Q'14 2Q'14 3Q'14
Other operating expenses Staff costs
Total Expenses
33
(1) Information for 1Q2013 and 2Q2013 is not available as it has not been possible to publish the financial results for the three months ended 31 March 2013.
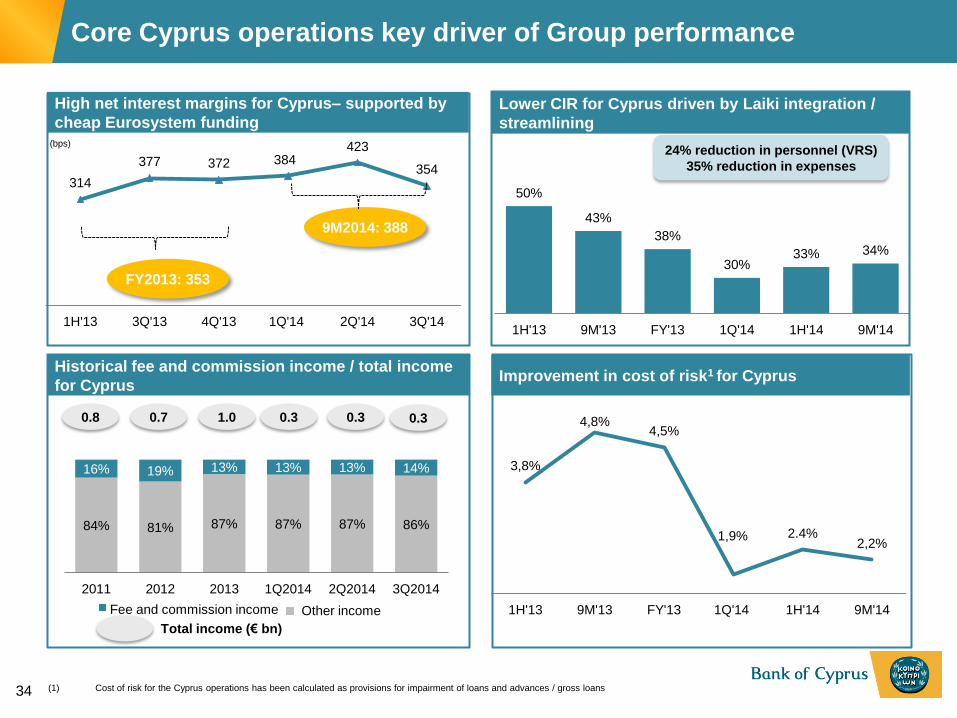
84% 81% 87% 87% 87% 86%
16% 19% 13% 13% 13% 14%
2011 2012 2013 1Q2014 2Q2014 3Q2014
314
377 372 384 423
354
1H'13 3Q'13 4Q'13 1Q'14 2Q'14 3Q'14
3,8%
4,8% 4,5%
1,9% 2.4% 2,2%
1H'13 9M'13 FY'13 1Q'14 1H'14 9M'14
High net interest margins for Cyprus– supported by
cheap Eurosystem funding
50%
43%
38%
30% 33% 34%
1H'13 9M'13 FY'13 1Q'14 1H'14 9M'14
Lower CIR for Cyprus driven by Laiki integration /
streamlining
Historical fee and commission income / total income
for Cyprus
24% reduction in personnel (VRS)
35% reduction in expenses
(bps)
Improvement in cost of risk1 for Cyprus
Fee and commission income Other income
(1) Cost of risk for the Cyprus operations has been calculated as provisions for impairment of loans and advances / gross loans
FY2013: 353
0.8
Total income (€ bn)
0.7 1.0 0.3 0.3
9M2014: 388
Core Cyprus operations key driver of Group performance
0.3
34

€m Jun
2013
Sep
2013
Dec
2013
Mar
2014
Jun
2014
Sep
2014
Change
Since
Jun
2013
Cash & bank placements 3,012 2,578 2,530 2,105 1,973 2,417 -595
Investments 3,413 3,505 3,433 3,475 3,538 2,578 -835
Net Loans 23,769 22,575 21,764 21,234 20,063 19,794 -3,975
Other assets 2,762 2,739 2,622 2,564 2,984 2,694 -68
Total assets 32,956 31,397 30,349 29,378 28,558 27,483 -5,473
Customer deposits 16,970 15,468 14,971 14,066 13,803 13,330 -3,640
ECB funding - 1,301 1,400 1,400 1,400 920 +920
ELA 11,107 9,856 9,556 9,506 8,785 7,684 -3,423
Interbank funding 983 1,038 790 753 802 707 -276
Other liabilities 976 944 895 894 954 1,057 +81
Total equity 2,920 2,790 2,737 2,759 2,814 3,785 +865
Total liab. & equity 32,956 31,397 30,349 29,378 28,558 27,483 -5,473
Balance sheet
deleverage qoq
-1,559 -1,048 -971 -820 -1,075
CET1 ratio
(transitional basis) n/a n/a 10.4% 10.6% 11.3% 15.4%
Leverage ratio
(Assets/Equity) 11.3x 11.2x 11.1x 10.6x 10.1x 7.3x
Deposit reduction less than
reduction in gross loans
Net loans reduction driven by
disposal of non-core assets and
the ongoing deleveraging
Overall ELA reduction from peak
about €3.9 bn (including November
repayment)
CET1 ratio and Leverage ratio
strengthened by Share Capital
Increase
Steady reduction of total assets
Balance Sheet Deleverage - Shrinking to Strength
35

2,95 4,05
4,82
6,66
8,25
10,21
13,13 14,04 14,44 14,58 14,74
4,97 5,13
6,45 7,69
11,01 12,98 13,00 12,76 12,59 12,98
Dec-11 Mar-12 Jun-12 Sep-12 Dec-12 Mar-13 Jun-13 Sep-13 Dec-13 Mar-14 Jun-14 Sep-14
NPLs (Old definition)
NPLs (New definition)
90+ DPD
+1%
NPLs>90+DPD
by €1.8 bn
Problem Loans (€ bn)
Quarterly change in problem loans (€ bn)
+0% +18%
+29% +7%
-2%
+3%
(1) 90+ DPD are loans with a specific provision (i.e. impaired loans) and loans past-due for more than 90 days but not impaired
(2) NPLs as per the Central Bank of Cyprus definition
+1%
-1%
Credit Risk – Quality of Loan portfolio
+3%
1.97
0,02
-0,25 -0,17
0,45 0,39
2.92
0,91
0,40 0,14 0,59
0,15
3Q'13 4Q'13 1Q'14 2Q'14 2Q'14 3Q'14
90+ DPD NPLs
pro-forma
excl.
deleverage
• In 3Q2014, 90+ DPD1 increased by €387m
reflecting the recessionary conditions and
difficult legislative environment.
• NPLs2 continue to rise as restructured loans
remain classified as NPLs for longer
• NPLs growth rate maintained at 1% for 3Q2014
• Adjusting for the disposal of the Ukraine
operations and Serbian loans, the 3Q2014
increase in 90+DPD and NPLs was lower than
the 2Q2014 increase
36

Group loan quality indicators
Trends in 90+DPD and provisions
30% 48% 42% 37% 38% 39% 39% 38%
17,2%
27,4%
38,8%
47,4% 48,6% 48,6% 49,8% 52,5%
Dec-11 Dec-12 Jun-13 Sep-13 Dec-13 Mar-14 Jun-14 Sep-14
90+ DPD provision coverage 90+ DPD ratio
Accumulated provisions
1,5 3,7 4,6 4,8 5,0 5,0 4,9 4,9
5,2%
13,1%
16,2% 17,6%
18,6% 19,1% 19,3% 20,0%
Dec-11 Dec-12 Jun-13 Sep-13 Dec-13 Mar-14 Jun-14 Sep-14
Accumulated provisions (€ bn)
Provisions % Gross loans
• 90+ DPD ratio at 52.5%
• 90+ DPD provision coverage stood
at 38%; Taking into account
tangible collateral, 90+ DPD are
fully covered
• Accumulated provisions at €4.9 bn
or 20% of gross loans
• Conservative provisioning
assessment takes into account
property value indexation, expected
future evaluation of property prices
and costs incurred during the
recovery period
Credit Risk – Provisions
37

6,2 7,2 7,2 6,8
1,6 1,6
2,6 3,3 3,3 3,5
0,8 0,8
1,0
1,3 1,3 1,3
0,5 0,6
1,2
1,2 1,2 1,2
0,6 0,6
3,9 3,8
1,2 1,2
4,0 4,4
Jun-13 Sep-13 Dec-13 Mar-14 Jun-14 Sep-14
Corporate SMEs Retail Housing Retail Consumer and other RRD- Mid and Large Corporates RRD- SMEs RRD- Recoveries
13.0 12.8
11.0 13.0 13.0
12.6
Group 90+DPD loans by type/business line (new presentation adopted as of June 20141)
(1) As part of the restructuring of the Group, management is currently monitoring the loan portfolio of the Group using new business line definitions. An important
component of the Group’s new operational structure is the establishment of the RRD for the purposes of centralising and streamlining the management of its
delinquent loans. No comparative information is available.
Credit Risk – Gross loans and 90+ DPD by Business Line
13,1 12,5 12,2 11,9
5,2 4,9
6,4 6,2 6,1 6,1
2,7 2,6
5,4 5,3 5,4 5,3
3,9 3,9
3,4 3,4 3,0 2,9
2,0 1,9
5,8 5,6
1,5 1,5
4,1 4,4
Jun-13 Sep-13 Dec-13 Mar-14 Jun-14 Sep-14
Corporate SMEs Retail Housing Retail Consumer and other RRD- Mid and Large Corporates RRD- SMEs RRD- Recoveries
28.4
Gross loans by type/business line (new presentation adopted as from June 20141)
27.4 26.7 26.3 25.3
(€ bn)
Total 24.7
(€ bn)
Total
38

6,2 7,2 7,2 6,8 7,0 7,1
2,6 3,3 3,3 3,5 3,2 3,4
2,2
2,5 2,5 1,3 2,4
2,5
Jun-13 Sep-13 Dec-13 Mar-14 Jun-14 Sep-14
Corporate SMEs Retail
2
13.0 Total 12.6
(€bn)
11.0 13.0 13.0 12.8
Group 90+DPD loans by segment
39
Credit Risk – Gross loans and 90+ DPD by Segment
13,1 12,5 12,2 11,9 12,6 12,2
6,4 6,2 6,1 6,1 5,5 5,5
8,9 8,7 8,4 8,2 7,2 7,0
Jun-13 Sep-13 Dec-13 Mar-14 Jun-14 Sep-14
Corporate SMEs Retail
28.4
Gross loans by segment
27.4 26.7 26.3 25.3
(€ bn)
Total 24.7

(1) Other countries: Romania, Ukraine (until March 2014) and Greece
(2) Other countries: Romania and Ukraine (until March 2014)
Gross Loans by Geography
€m 31.12.13 31.03.14 30.06.14 30.09.14
Cyprus 22,964 22,763 22,185 21,881
UK 1,284 1,194 1,172 1,112
Russia 1,429 1,290 1,304 1,208
Other
countries1
1,066 1,016 639 541
Group 26,743 26,263 25,300 24,742
Deposits by Geography
€m
31.12.13 31.03.14 30.06.14 30.09.14
Cyprus non-IBU 8,658 8,196 8,094 7,785
Cyprus IBU 4,047 3,789 3,594 3,458
Cyprus – Total 12,705 11,985 11,688 11,243
UK 1,244 1,249 1,252 1,289
Russia 919 767 845 794
Other countries2 103 65 18 4
Group 14,971 14,066 13,803 13,330
Loans and Deposits by Geography
88,4%
4,5% 4,9% 2,2%
Cyprus
UK
Russia
Romania
Gross Loans by Geography
58,4% 25,9%
9,7%
6,0% 0,0% Cyprus
Cyprus - IBU
UK
Russia
Romania
Total Cyprus
84.3%
Deposits by Geography
40

9,7 8,9 8,7 8,2 8,1 7,8
4,8 4,1 4,0 3,8 3,6 3,5
1,3 1,3 1,2 1,2 1,3 1,3
1,2 1,1 0,9
0,8 0,8 0,8
0.10 0,1 0,1
0,1 0,0 0,0
17,0 15,5 15,0
14,1 13,8 13,3
Jun-13 Sep-13 Dec-13 Mar-14 Jun-14 Sep-14
Other countries*
Russia
UK
Cyprus IBU
Cyprus non-IBU
12,7 11,3 10,6 9,6 9,1 8,5
0,8 0,9 0,9
0,9 0,9 0,8
3,4 3,3 3,5
3,5 3,7 4,0
17,0 15.47 15,0
14,1 13,8 13,3
Jun-13 Sep-13 Dec-13 Mar-14 Jun-14 Sep-14
Current & demand accounts
Savings accounts
Time deposits
Total
(€ bn)
* Other countries: Romania and Ukraine
Total
(€ bn)
Deposits by geography
Deposits by type of deposit
Analysis of Deposits by Geography and by Type
41

9,7 8,9 8,7 8,2 8,1 7,8
4,8 4,1 4,0 3,8 3,6 3,5
14,4 13,0 12,7 12,0 11,7 11,2
Jun-13 Sep-13 Dec-13 Mar-14 Jun-14 Sep-14
IBUs
Non-IBUs
Cyprus Deposits (€ bn)
10,3 9,9 9,9 9,8 3,4 3,2
5,4 5,3 5,2 5,2
1,9 1,8
5,3 5,2 5,3 5,2
3,9 3,8
3,0 2,9 2,6 2,6
1,7 1,6
5,8 5,6
1,5 1,5
4,1 4,4
Jun-13 Sep-13 Dec-13 Mar-14 Jun-14 Sep-14
RRD- Recoveries
RRD- Mid Corporations
RRD- Large Corporations
Retail Consumer and other
Retail Housing
SMEs
Corporate
24.0
Gross loans by type/business line (presentation adopted as from June 20141)
23.3 23.0 22.8 22.2
(€ bn)
Total 21.9
(1) As part of the restructuring of the Group, management is currently monitoring the loan portfolio of the Group using new business line definitions. An important
component of the Group’s new operational structure is the establishment of the RRD for the purposes of centralising and streamlining the management of its delinquent
loans
Loans and Deposits in Cyprus
42

90+ DPD ratios by economic activity
40
,7%
37
,6%
40
,1%
54
,8%
46
,0%
25
,6%
40
,8%
41
,1%
44
,1%
49
,7%
51
,1%
69
,6%
51
,7%
32
,1%
56
,8%
64
,7%
44
,4%
51
,1%
46
,8%
72
,1%
50
,4%
33
,0%
53
,5%
64
,0%
44
,8%
53
,3%
51
,9%
76
,7%
48
,0%
34
,1%
54
,9%
59
,6%
46
,7%
55
,3%
59
,8%
78
,3%
51
,2%
36
,8%
57
,7%
60
,5%
30.06.13 31.12.13 31.03.14 30.06.14 30.09.14
3,1
2
1,1
1
1,9
3
4,1
5
4,6
1 8
,73
2,7
8
1,9
2
2,8
3
1,0
0
1,8
9
4,2
5
4,2
0
8,5
4
2,3
1
1,7
3
2,8
2
0,9
5
1,8
5
4,2
1
4,1
2
8,4
1
2,1
8
1,7
2
2,7
4
0,9
6
1,8
2
4,1
3
3,6
3
8,0
5
2,4
4
1,5
3
2,7
0
0,9
5
1,6
1 4,0
9
3,5
9
7,9
6
2,3
2
1,5
3
30.06.13 31.12.13 31.03.14 30.06.14 30.09.14
Trade Manufacturing Hotels &
Restaurants
Construction Real estate Private
Individuals
Professional
& other
services
Other
sectors
Gross loans by economic activity (€ bn)
Trade Manufacturing Hotels &
Restaurants
Construction Real estate Private
Individuals
Professional
& other
services
Other
sectors
15% 11% 32% 9% 6% % of
total 17% 6% 4%
Analysis of Loans and 90+ DPD ratios by Economic Activity
43

90+ DPD (€ bn) and Quarterly change of 90+ DPD (€m)
(1) Information for 1Q2013 and 2Q2013 is not available as it has not been possible to publish the financial results for the three months ended
31 March 2013.
321
380
329
-85
265
410
558
96
232
156
402
609
100
64
1.3
19
1.2
40
3.3
19
1.9
72
20
-247
-165
387
1,3 1,6 2,0 2,3 2,2 2,5 2,9
3,5 3,6 3,8 4,0 4,4
5,0 5,1 5,1
6,5
7,7
11,0
13,0 13,0 12,8 12,6 13,0
De
c-0
8
Mar-
09
Ju
n-0
9
Sep-0
9
De
c-0
9
Mar-
10
Ju
n-1
0
Sep-1
0
De
c-1
0
Mar-
11
Jun
-11
Se
p-1
1
De
c-1
1
Mar-
12
Ju
n-1
2
Sep-1
2
De
c-1
2
Jun-1
3¹
Sep-1
3
De
c-1
3
Mar-
14
Ju
n-1
4
Sep-1
4
Quarterly change of 90+ DPD (€ mn)
90+ DPD (€ bn)
90+ DPD and Quarterly Change of 90+ DPD
FY2009
€945m FY2010
€1,329m FY2011
€1,399m
FY2012
€2,723m FY2013
€5,311m
9M2014
-€25m
90+ DPD
formation
44
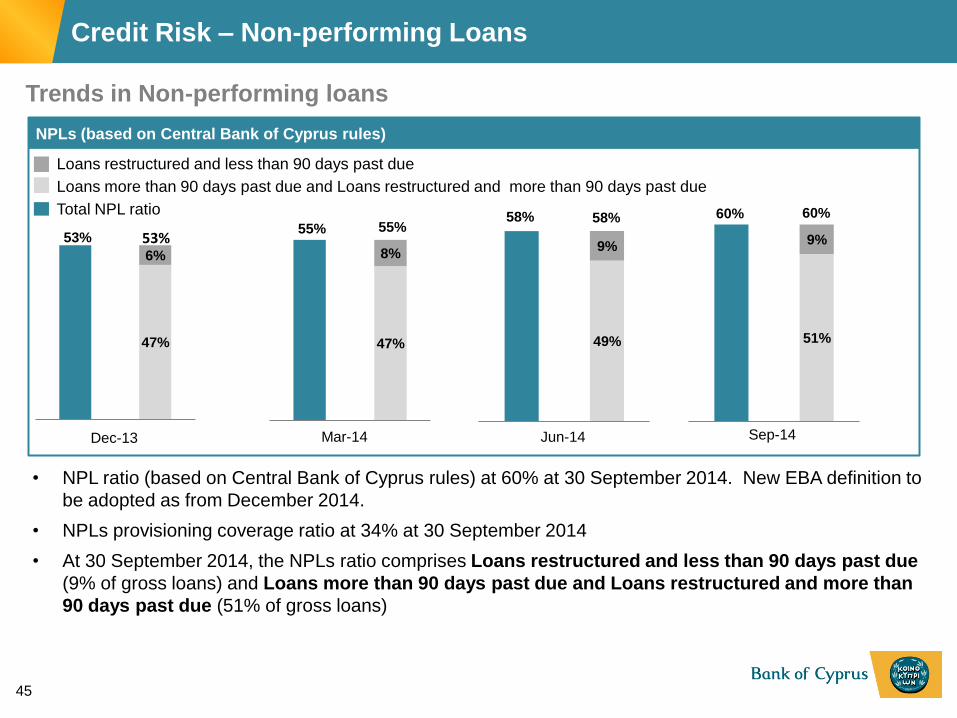
58%
49%
9%
58% 60%
51%
9%
60%
53%
47%
6%
53% 55%
47%
8%
55%
Loans more than 90 days past due and Loans restructured and more than 90 days past due
NPLs (based on Central Bank of Cyprus rules)
Total NPL ratio
Loans restructured and less than 90 days past due
Dec-13
Trends in Non-performing loans
Mar-14
• NPL ratio (based on Central Bank of Cyprus rules) at 60% at 30 September 2014. New EBA definition to
be adopted as from December 2014.
• NPLs provisioning coverage ratio at 34% at 30 September 2014
• At 30 September 2014, the NPLs ratio comprises Loans restructured and less than 90 days past due
(9% of gross loans) and Loans more than 90 days past due and Loans restructured and more than
90 days past due (51% of gross loans)
Sep-14 Jun-14
Credit Risk – Non-performing Loans
45

Reversal in customer outflows during H2 2014
46
(49,7) (44,9)
(20,0)
(11,4) (8,8) (4,7)
6,0 1,0
15,0
(8,0) (8,0) (5,0) (4,0)
3,0 4,0 1,0
(3,0)
2,0 3,0 6,0
Ap
r-1
3
Ma
y-1
3
Ju
n-1
3
Ju
l-1
3
Au
g-1
3
Se
p-1
3
Oct-
13
Nov-1
3
Dec-1
3
Ja
n-1
4
Fe
b-1
4
Ma
r-1
4
Ap
r-1
4
Ma
y-1
4
Ju
n-1
4
Ju
l-1
4
Au
g-1
4
Se
p-1
4
Oct-
14
Nov-1
4
Average daily customer flows per month (€m) • Customer outflows significantly abated during
H2 2014 and the deposit base showed signs of
stabilisation
• Customer outflows during Q1 2014 reflect one
off items and seasonality factors such as
payments of taxes, dividends by international
companies and the impact from the release of
the 6m decree deposits as well as the
relaxation of restrictive measures
• Since May 2014, the Bank experienced
customer inflows every month (with the
exception of August) despite:
– The release of €1.2 bn of blocked
decree deposits in July and October
2014
– The full abolition of internal controls at
the beginning of June 2014
• Fresh funds balance1 increased to €1,538m.
The amount of fresh money is approximately
9.3% of total customer deposits
Increasing fresh funds balances1 (€m)
443 507 599 610 652 700 740
898
1.119 1.188 1.240 1.336 1.394
1.538
Oct-
13
Nov-1
3
Dec-1
3
Ja
n-1
4
Fe
b-1
4
Ma
r-1
4
Ap
r-1
4
Ma
y-1
4
Ju
n-1
4
Ju
l-1
4
Au
g-1
4
Se
p-1
4
Oct-
14
Nov-1
4
(1) Funds received from abroad minus funds sent abroad per customer, post March 2013 and not subject to restrictive measures

A strong and experienced Management team
47
• Blend of extensive restructuring experience and long standing local market knowledge and client relationships
• Clearly defined separation among business lines, particularly NPL management
Executive management Business segments (origination of new business)
• Wealth/Brokerage/AM: Costas Argyrides
• International Operations: Miltiades Michaelas
• Eurolife: Artemis Pantelidou
• General Insurance: Stelios Christodoulou
• Human Resources: Solonas Matsias
RRD (NPL management and large exposures >€100m)
Finance Director
• Joined 1996
• Strong financial markets experience and longevity
with the Bank
• Former executive at CBC; familiar with local regulations
and government policy making Dr. Chris
Patsalides
Chief Executive Officer
• Joined in October 2013
• Formerly Chief Executive of RBS’s investment bank
division John
Hourican
Group Chief Risk Officer
• Joined Laiki in 1995
• Extensive local and international experience including the
disposal of 2 banking subsidiaries
• Formerly Treasurer and Director of International
Operations of Cyprus Popular Bank
Michalis
Athanasiou
Group Chief Financial Officer
• Joined 1999
• Robust financial knowledge and longevity with the Bank
• Chartered Accountant, formerly at Arthur Andersen Eliza
Livadiotou
Nicolas
Sparsis
Corporate banking
• Joined in 1983
• Significant knowledge of the local business market and
extensive experience in customer relationship
management
Dr. Charis
Pouangare
Consumer & SME banking
• Joined in 1991
• Significant experience with the bank in all local sectors,
Retail, SME and Corporate
• Excellent knowledge of customer needs and market
dynamics
Louis
Pochanis
International Banking Services
• Joined in 1993
• Set up Private Banking and Wealth Management in
Cyprus and then Greece
Director of Restructuring and Recoveries Division
• Joined in December 2013
• Oversaw the run-down of c.£75bn of non-core assets at
RBS Euan
Hamilton

Disclaimer
48
This presentation has been prepared for information and background purposes only. It is confidential and neither it nor
any part of it may be reproduced (electronically or otherwise) or redistributed, passed on, or the contents otherwise
divulged, directly or indirectly, to any other person (excluding the recipient's professional advisers) or published in whole
or in part for any purpose without the prior written consent of the Bank of Cyprus Public Company Ltd (the "Bank"). This
presentation does not purport to be all-inclusive or to contain all of the information that a person considering the
purchase of any offered securities may require to make a full analysis of the matters referred to herein. Certain
statements, beliefs and opinions in this presentation are forward-looking. Such statements can be generally identified
by the use of terms such as “believes”, “expects”, “may”, “will”, “should”, “would”, “could”, “plans”, “anticipates” and
comparable terms and the negatives of such terms. By their nature, forward-looking statements involve risks and
uncertainties and assumptions about the Group that could cause actual results and developments to differ materially
from those expressed in or implied by such forward-looking statements. These risks, uncertainties and assumptions
could adversely affect the outcome and financial effects of the plans and events described herein. We have based
these forward-looking statements on our current expectations and projections about future events. Any statements
regarding past trends or activities should not be taken as a representation that such trends or activities will continue in
the future. Readers are cautioned not to place undue reliance on forward-looking statements, which are based on facts
known to and/ or assumptions made by the Group only as of the date of this presentation. The Bank's ability to achieve
its projected results depends on many factors which are outside management's control. Actual results may differ
materially from those contained or implied in the forward-looking statements. We assume no obligation to update such
forward -looking statements or to update the reasons that actual results could differ materially from those anticipated in
such forward-looking statements. This presentation does not constitute an offer to sell, or a solicitation of an offer to
buy, any security in the United States, or any other jurisdiction. The delivery of this presentation shall under no
circumstances imply that there has been no change in the affairs of the Group or that the information set forth herein is
complete or correct as of any date. This presentation shall not be used in connection with any investment decision
regarding any of our securities, which should only be made based on expressly authorised materials from us identified
as such, nor in connection with any decision whether or how to vote on any matter submitted to our stockholders. The
securities issued by the Bank have not been, and will not be, registered under the US Securities Act of 1933 (“the
Securities Act”), or under the applicable securities laws of any other jurisdiction and may only be offered or sold in the
United States to “qualified institutional buyers” as defined in Rule 144A under the Securities Act and outside the United
States in compliance with Regulation S under the Securities Act.