
BANK OF CHINA LIMITED JOHANNESBURG BRANCH Pillar 3 ...
38
1 / 38 BANK OF CHINA LIMITED JOHANNESBURG BRANCH Pillar 3 Disclosure December 2019 (Annual)
Transcript of BANK OF CHINA LIMITED JOHANNESBURG BRANCH Pillar 3 ...

1 / 38
BANK OF CHINA LIMITED JOHANNESBURG BRANCH
Pillar 3 Disclosure
December 2019 (Annual)

2 / 38
Table of contents
Regulatory framework for disclosures 4
Pillar 3 disclosures 4
Reporting oversight 5
Overview of risk management and RWA 6
Key Metrics (KM1) 6
Bank risk management approach (OVA) 7
Overview of RWA (OV1) 8
Linkages between financial statements and regulatory exposures 9
Differences between accounting and regulatory scopes of consolidation and mapping of
financial statement categories with regulatory risk categories (LI1) 9
Main sources of differences between regulatory exposure amounts and carrying values in
financial statements (LI2) 10
Explanation of differences between accounting and regulatory exposure amounts (LIA)
Prudential valuation adjustments (PV1) 11
Composition of capital and TLAC 12
Composition of regulatory capital (CC1) 12
Reconciliation of regulatory capital to balance sheet (CC2) 15
Main features of regulatory capital instruments and of other TLAC-eligible instruments
(CCA) 16
Macro-prudential Supervisory Measures 17
Geographical distribution of credit exposures used in the countercyclical capital buffer (CCyB1)
Leverage ratio 18
Summary comparison of accounting assets vs leverage ratio exposure (LR1) 18
Leverage ratio common disclosure template (LR2) 19
Liquidity Risk 20
Liquidity risk management (LIQA) 20
Liquidity Coverage Ratio (LIQ1) 20
Net Stable Funding Ratio (LIQ2) 21
Credit risk 23
General qualitative information about credit risk (CRA) 23
Credit quality of assets (CR1) 23
Changes in stock of defaulted loans and debt securities (CR2) 23
Additional disclosure related to the credit quality of assets (CRB) 23
Qualitative disclosure requirements related to credit risk mitigation techniques (CRC) 28
Credit risk mitigation techniques – overview (CR3) 28

3 / 38
Qualitative disclosures on bank’s use of external credit ratings under the standardized
approach for credit risk (CRD) 28
Standardised approach – credit risk exposure and credit risk mitigation effects (CR4) 29
Standardised approach – exposures by asset classes and risk weights (CR5) 30
Counterparty credit risk 31
Qualitative disclosure related to counterparty credit risk (CCRA) 31
Analysis of counterparty credit risk (CCR) exposure by approach (CCR1) 31
Credit valuation adjustment (CVA) capital charge (CCR2) 32
Standardised approach of CCR exposures by regulatory portfolio and risk weights 32
(CCR3)
Exposures to central counterparties (CCR8) 33
Market Risk
General qualitative disclosure requirements related to market risk (MRA) 34
Market Risk under SA (MR1) 35
Remuneration
Remuneration policy (REMA) 36
Remuneration awarded during the financial year (REM1) 37
Special payments (REM2) 37
Deferred Remuneration (REM3) 38

4 / 38
Regulatory framework for disclosures
Bank of China Limited – Johannesburg Branch (“The Branch”) is supervised by the South
African Reserve Bank, which receives information on the capital adequacy of, and sets capital
requirements for South African banks. The capital requirements is calculated based on the
various regulations relating to financial services, including Basel Capital Accord (Basel) III. The
Basel Committee’s framework is structured around three ‘pillars’: the Pillar 1 minimum capital
requirements and Pillar 2 supervisory review process are complemented by Pillar 3 market
discipline. The aim of Pillar 3 is to produce disclosures that allow market participants to assess
the scope of application by banks of the Basel Committee’s framework and the rules in their
jurisdiction, their capital condition, risk exposures and risk management processes, and hence
their capital adequacy. Pillar 3 requires all material risks to be disclosed, enabling a
comprehensive view of a bank’s risk profile.
Pillar 3 disclosures
The Branch’s Pillar 3 disclosures of 2019 comprise all information required under Pillar 3, both
quantitative and qualitative. Pillar 3 requirements may be met by inclusion in other disclosure
media. Where we adopt this approach, references are provided to the relevant pages of the
Annual Report and Accounts or other location. Any disclosures not relevant to the Branch are
not included or mentioned in this report. The numbers are reported in Rand millions if there are
no specific units in the report.
Financial Position
As at the end of December 2019 the financial position of the Branch was as follows:
Total Assets R46.87 billion
Total Liabilities R38.41 billion
Total Equity R8.46 billion
Total assets increased by 6% compared to that of 31 December 2018. This is a combination
result of business development and regulatory requirements.
Financial Performance
As at the end of December 2019 the Branch reported that operating revenue is line with
expectation and operating expenditure is within the budget set for the 2019 financial year.
International Financial Reporting Standards (IFRS) 16 has been implemented and did not
negatively impact the Branch’s financial performance.

5 / 38
Report oversight
The review of the report has been completed by Branch and the external auditors of the
Branch (Ernst & Young). As at 31 December 2019, the Branch is satisfied of the following:
• Risk, compliance, treasury and capital management generally operated effectively
• Business activities have been managed within the Branch approved risk appetite
• Operation is adequately funded and capitalized to support the execution its strategy.

6 / 38
Overview of risk management and RWA
Table 1: Key Metrics (KM1)
The table provides an overview of a Branch’s key prudential metrics.
On 1 January 2019, the Branch adopted IFRS 16 – Financial Instruments. For more
information on the IFRS 16 transition adjustment, please refer to the Branch’s 2019 annual
financial statement. The Branch adopted IFRS 16 using the modified retrospective approach.
However, the adoption of IFRS16 did not have a significant impact on the key metrics.
The quarter on quarter decrease in the risk weighted assets, increase in capital adequacy ratio
and net stable funding ratio is due to repayment of corporate loans. The decrease in liquidity
coverage ratio is due to the decrease in the loans which resulted in the increase in net cash
outflow during the quarter ended 31 December 2019.
December
2019 ('m)
September
2019 ('m)
June 2019
('m)
March 2019
('m)
December
2018 ('m)
a a a a d
Available capital (amounts)
1 Common Equity Tier 1 (CET1) 7,820 7,827 7,828 7,229 7,198
1a Fully loaded ECL accounting model 7,820 7,827 7,828 7,229 7,198
2 Tier 1 7,820 7,827 7,828 7,229 7,198
2a Fully loaded ECL accounting model Tier 1 7,820 7,827 7,828 7,229 7,198
3 Total capital 8,105 8,056 8,242 7,582 7,529
3a Fully loaded ECL accounting model total capital 8,105 8,056 8,242 7,582 7,529
Risk-weighted assets (amounts)
4 Total risk-weighted assets (RWA) 34,100 37,015 35,469 30,854 28,528
Risk-based capital ratios as a percentage of RWA
5 Common Equity Tier 1 ratio (%) 22.93 21.15 22.07 23.43 25.23
5a Fully loaded ECL accounting model Common Equity Tier 1 (%) 22.93 21.15 22.07 23.43 25.23
6 Tier 1 ratio (%) 22.93 21.15 22.07 23.43 25.23
6a Fully loaded ECL accounting model Tier 1 ratio (%) 22.93 21.15 22.07 23.43 25.23
7 Total capital ratio (%) 23.77 21.76 23.24 24.57 26.39
7a Fully loaded ECL accounting model total capital ratio (%) 23.77 21.76 23.24 24.57 26.39
Additional CET1 buffer requirements as a percentage of RWA
8 Capital conservation buffer requirement (2.5% from 2019) (%) 2.50 2.50 2.50 2.50 1.88
9 Countercyclical buffer requirement (%) 0.52 0.61 0.61 0.27 0.55
10 Bank G-SIB and/or D-SIB additional requirements (%) N/A N/A N/A N/A N/A
11Total of bank CET1 specific buffer requirements (%) (row 8 + row 9 + row
10)3.02 3.11 3.11 2.77 2.43
12 CET1 available after meeting the bank’s minimum capital requirements (%) 14.91 13.04 13.96 15.66 16.93
Basel III leverage ratio
13 Total Basel III leverage ratio exposure measure 49,984 54,950 50,947 50,788 47,010
14 Basel III leverage ratio (%) (row 2 / row 13) 15.64 14.24 15.36 14.23 15.31
14aFully loaded ECL accounting model Basel III leverage ratio (%) (row 2a /
row13)15.64 14.24 15.36 14.23 15.31
Liquidity Coverage Ratio
15 Total HQLA 11,314 10,760 9,139 7,790 7,275
16 Total net cash outflow 4,974 4,219 1,859 1,501 2,205
17 LCR ratio (%) 227 255 492 519 330
Net Stable Funding Ratio
18 Total available stable funding 26,798 27,023 26,971 26,583 27,397
19 Total required stable funding 23,283 26,474 25,934 24,605 23,919
20 NSFR ratio (%) 115 102 104 108 115

7 / 38
Overview of risk management and RWA
Bank Risk Management Approach (OVA)
The Branch’s major risks, namely credit risk, market risk and operational risk are well
managed and controlled through the branch’s internal policies and procedures. With regards to
Credit and Market Risk (relating to the banking book), the Branch has adopted the
Standardised Approach for Credit and Market risks whilst the Basic Indicator Approach was
selected for Operational Risk.
Liquidity Risk:
The Branch formulated three liquidity risk policies that including Liquidity Risk Management
Policy, Liquidity Risk Contingency Plan and Implementation Rules for Liquidity Risk Stress
Test; optimised the policies and forecast process of LCR and NSFR, updated the assumptions
of Contractual mismatch, Business mismatch and bank - specific stress mismatch according to
regulatory requirement, which give us much more confidence in managing liquidity risk.
Interest Rate Risk:
Our assets and liabilities are reasonably matched as per stress testing mode and the interest
rate risk in the banking book is monitored and controlled through interest rate risk indicators
periodically.
Foreign Exchange Control Risk:
The Branch ensures that its net open position is maintained within the prescribed regulatory
limit.

8 / 38
Overview of risk management and RWA (Continued)
Table 2: Overview of RWA (OV1)
The table provides an overview of total RWA forming the denominator of the risk-based capital
requirements. The current minimum capital requirement to the RWA is 12.02% which is made
up of 8% base minimum, 1% systemic risk add-on, 2.5% conservation buffer and 0.52%
countercyclical buffer (refer to table 9)
The Quarter-on-Quarter movement on the RWA is mainly due to a decrease in the lending of
about R2.5 billion. Most of the movement was attributable to loan repayments.
a b c
Dec-19 Sep-19 T
1 31,773 34,890 3,850
2 31,773 34,890 3,850
3 - - -
4 - - -
5 - - -
6 98 64 12
7 98 64 12
8 - - -
9 - - -
10 70 45 -
11 - -
12 - - -
13 - - -
14 - - -
15 - - -
16 - - -
17 - - -
18 - - -
19 - - -
20 15 9 2
21 15 9 2
22 - - -
23 - - -
24 1,956 1,825 235
25 258 227 -
26 - -
27 34,170 37,060 4,099
Of which: foundation internal ratings-based (F-IRB) approach
RWAMinimum capital
requirements
Credit risk (excluding counterparty credit risk)
Of which: standardised approach (SA)
Settlement risk
Of which: supervisory slotting approach
Of which: advanced internal ratings-based (A-IRB) approach
Counterparty credit risk (CCR)
Of which: standardised approach for counterparty credit risk
Of which: Internal Model Method (IMM)
Of which: other CCR
Credit valuation adjustment (CVA)
Equity positions under the simple risk weight approach
Equity investments in funds - look-through approach
Equity investments in funds - mandate-based approach
Equity investments in funds - fall-back approach
Total (1 + 6 + 10 + 11 + 12 + 13 + 14 + 15 + 16 + 20 + 23 + 24 +
25 + 26)
Securitisation exposures in banking book
Of which: securitisation internal ratings-based approach (SEC-
Of which: securitisation external rating-based approah (SEC-
Of which: securitisation standardised approach (SEC-SA)
Market risk
Of which: standardised approach (SA)
Of which: internal model approaches (IMA)
Capital charge for switch between trading book and banking book
Operational risk
Amounts below the thresholds for deduction (subject to 250%
risk weight)
Floor adjustment

9 / 38
Linkages between financial statements and regulatory
exposures
The Pillar 3 Disclosures at 31 December 2019 are prepared in accordance with regulatory
capital adequacy concept and rules while the annual financial statements are prepared in
accordance with IFRS. The regulatory exposure classes include an estimation of risk and are
expressed as the amount expected to be outstanding if and when the counterparty defaults.
Moreover, regulatory exposure classes are based on different criteria from accounting asset
types and are therefore not comparable on a line by line basis.
Table 3 shows the difference between the accounting and regulatory scope and a breakdown
of the accounting balances into the risk types that form the basis for regulatory capital
requirements. Table 3 then shows the main differences between the accounting balances and
regulatory exposures by regulatory risk type.
Table 3: Differences between accounting and regulatory scopes of consolidation
and mapping of financial statement categories with regulatory risk categories (LI1)
The loans and advances are usually subjected to more than one category of risk framework.
The gross carrying amount is subjected to the credit risk framework while the net amount of
the loans is subjected to the market risk framework. All liabilities denominated in foreign
currency are subjected to the Market risk framework while liabilities denominated in ZAR are
not subjected to any capital requirements.
a b c d e f g
Carrying values as
reported in published
financial statements
Carrying values
under scope of
regulatory
consolidation
Subject to credit
risk framework
Subject to
counterparty
credit
risk framework
Subject to the
securitisation
framework
Subject to the
market risk
framework
Not subject to
capital
requirements or
subject to
deduction from
capital
Assets
Cash and cash Equivalents 2,796 - - - - - -
Cash and balances at central banks - 821 821 - - - -
Property and equipment 24 24 24 - - - -
Intangible Assets - - - - - - -
Derivative financial instruments 79 79 79 79 - 4
Deferred tax income assets 104 103 103 - - - -
Loans and advances to banks 9,137 11,933 11,933 - - 9,137 -
Loans and advances to customers 22,751 22,751 22,751 - - 15,538 -
Current income tax assets 6 6 - - - - 6
Available for sale financial investments 11,147 11,147 11,147 - - - -
Other Assets 824 3 3 - - - -
Total assets 46,868 46,868 46,862 79 - 24,678 6
Liabilities
Deposits from customers 16,941 16,941 - - - 1,292 15,649
Deposits from banks 17,727 17,727 - - - 17,382 345
Derivative financial instruments 7 7 - 7 - 2 -
Provisions 77 77 - - - 45 32
Commercial Paper 3,500 3,500 - - - 3,047 453
Other liabilities 161 161 - - - 120 41
Total liabilities 38,414 38,413 - 7 - 21,888 16,520

10 / 38
Linkages between financial statements and regulatory
exposures (Continued)
Table 4: Main sources of differences between regulatory exposure amounts and
carrying values in financial statements (LI2)
Explanation of differences between accounting and regulatory exposure amounts
(LIA)
Off balance sheet amounts
Off-balance sheet amounts subject to credit risk regulatory framework include undrawn
portions of committed facilities, various trade finance commitments and guarantees. We apply
a credit conversion factor to these items.
Valuation techniques
The Branch has performs the valuation based on the unadjusted quoted prices for identical
assets or liabilities in active markets where the quoted price is readily available and the price
represents actual and regularly occurring market transactions on an arm’s length basis.
Valuation adjustments
The revaluation is performed on a daily basis and is automatically run by the Bank of China
valuation system (which originated from Head Office).
Expected credit losses
The carrying value of assets is net of credit risk adjustments. The regulatory exposure value is
the amount before deducting the credit risk adjustments.
a b c d e
Credit risk
framework
Securitisation
framework
Counterparty
credit risk
framework Market risk
1 Asset carrying value amount under scope of regulatory consolidation (as per template LI1) 46,868 46,862 - 79 24,678
2 Liabilities carrying value amount under regulatory scope of consolidation (as per template LI1) 38,413 - - 7 21,888
3 Total net amount under regulatory scope of consolidation 8,455 46,862 - 72 2,790
4 Off-balance sheet amounts 7,145 7,145 - - -
5 Differences in valuations 596 577 - 18 -
6 Differences due to different netting rules, other than those already included in row 2 - - - - -
7 Differences due to consideration of provisions -797 -797 - - -
8 Differences due to prudential filters - - - - -
10 Exposure amounts considered for regulatory purposes 15,398 53,787 - 90 2,790
Total
Items subject to:
11 / 38
Linkages between financial statements and regulatory
exposures (Continued)
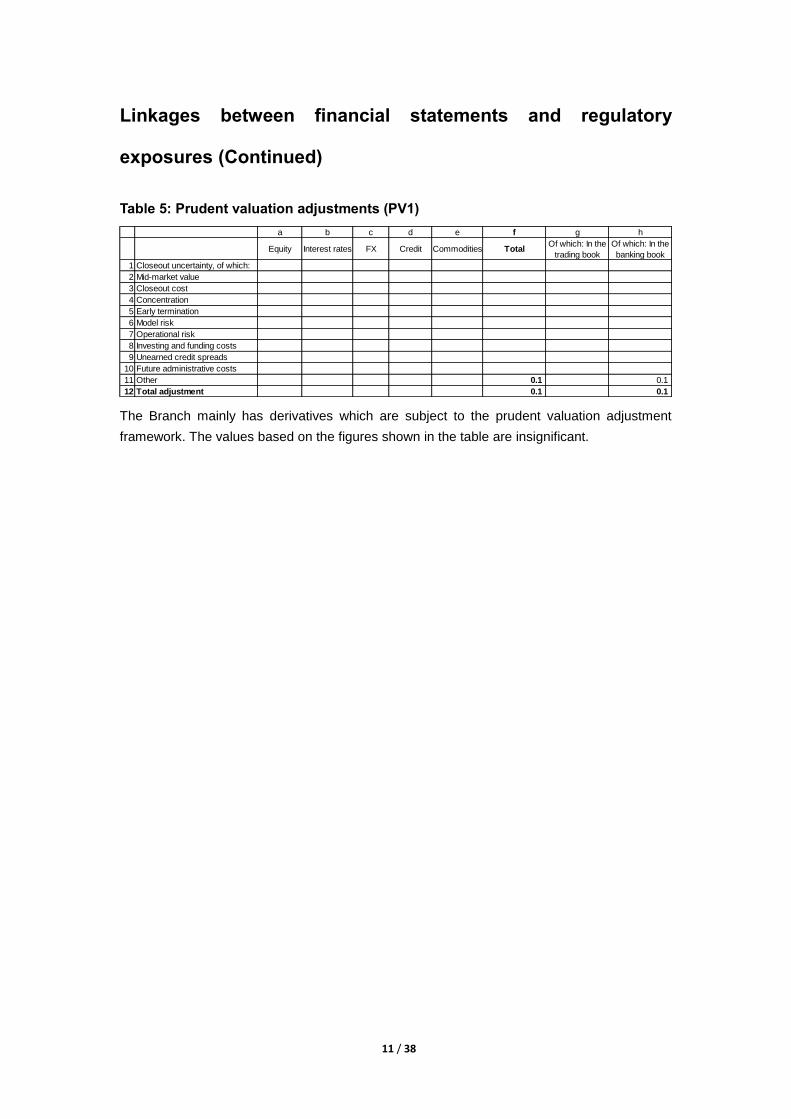
Table 5: Prudent valuation adjustments (PV1)
The Branch mainly has derivatives which are subject to the prudent valuation adjustment
framework. The values based on the figures shown in the table are insignificant.
a b c d e f g h
Equity Interest rates FX Credit Commodities TotalOf which: In the
trading book
Of which: In the
banking book
1 Closeout uncertainty, of which:
2 Mid-market value
3 Closeout cost
4 Concentration
5 Early termination
6 Model risk
7 Operational risk
8 Investing and funding costs
9 Unearned credit spreads
10 Future administrative costs
11 Other 0.1 0.1
12 Total adjustment 0.1 0.1

12 / 38
Composition of Capital
In terms of the requirements of the Banks Act and the Regulations, the Branch has met the
minimum capital requirements for periods under review.
The minimum capital requirements are defined by the following capital adequacy ratio namely:
Common Equity Tier 1 capital as a percentage of risk-weighted assets;
Tier 1 capital as a percentage of risk-weighted assets; and
Total qualifying capital as a percentage of risk-weighted assets.
The Branch assesses the capital adequacy by considering the resources necessary to cover
unexpected losses arising from risks, being those which it chooses to accept (such as credit
and market risk), and risks which may arise in the operations environment. The capital
management framework and related policies of the Branch are defined in the Internal Capital
Adequacy Assessment Process (ICAAP).
This ensures that the Branch’s level of capital:
Remains sufficient to support the Branch’s risk profile and outstanding commitments;
Exceeds the Branch’s minimum regulatory capital requirements by an appropriate buffer;
Is capable of withstanding a severe economic downturn stress scenario; and
Remains consistent with the Branch’s strategic and operational goals and BOC Group’s
expectations.
As at 31 December 2019 the Branch reported a capital adequacy ratio of 23.77%. The change
in capital adequacy is mainly as a result of credit risk which constitutes approximately 93% of
total risk exposure. There have been no significant capital movements since the R2.5 billion
capital injection which occurred in December 2018.
Table 6: Composition of regulatory capital (CC1)
.
a b
Amounts
Source based on reference
numbers/letters of the
balance sheet under the
regulatory scope of
consolidation
Common Equity Tier 1 capital: instruments and reserves
1Directly issued qualifying common share (and equivalent for non-joint stock
companies) capital plus related stock surplus 5,800 1
2 Retained earnings 1,930
3 Accumulated other comprehensive income (and other reserves) 90 2
4Directly issued capital subject to phase-out from CET1 (only applicable to non-joint
stock companies)
5Common share capital issued by subsidiaries and held by third parties (amount
allowed in group CET1)
6 Common Equity Tier 1 capital before regulatory adjustments 7,820
13 / 38
Composition of Capital (Continued)
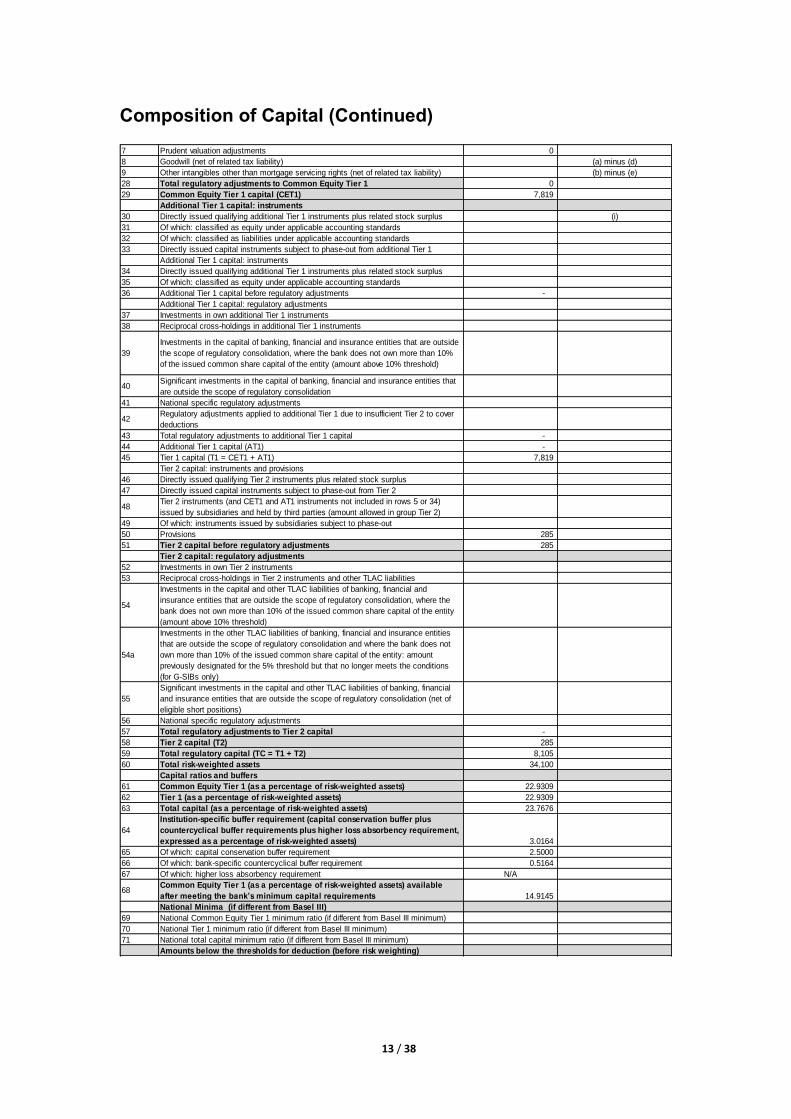
7 Prudent valuation adjustments 0
8 Goodwill (net of related tax liability) (a) minus (d)
9 Other intangibles other than mortgage servicing rights (net of related tax liability) (b) minus (e)
28 Total regulatory adjustments to Common Equity Tier 1 0
29 Common Equity Tier 1 capital (CET1) 7,819
Additional Tier 1 capital: instruments
30 Directly issued qualifying additional Tier 1 instruments plus related stock surplus (i)
31 Of which: classified as equity under applicable accounting standards
32 Of which: classified as liabilities under applicable accounting standards
33 Directly issued capital instruments subject to phase-out from additional Tier 1
Additional Tier 1 capital: instruments
34 Directly issued qualifying additional Tier 1 instruments plus related stock surplus
35 Of which: classified as equity under applicable accounting standards
36 Additional Tier 1 capital before regulatory adjustments -
Additional Tier 1 capital: regulatory adjustments
37 Investments in own additional Tier 1 instruments
38 Reciprocal cross-holdings in additional Tier 1 instruments
39
Investments in the capital of banking, financial and insurance entities that are outside
the scope of regulatory consolidation, where the bank does not own more than 10%
of the issued common share capital of the entity (amount above 10% threshold)
40Significant investments in the capital of banking, financial and insurance entities that
are outside the scope of regulatory consolidation
41 National specific regulatory adjustments
42Regulatory adjustments applied to additional Tier 1 due to insufficient Tier 2 to cover
deductions
43 Total regulatory adjustments to additional Tier 1 capital -
44 Additional Tier 1 capital (AT1) -
45 Tier 1 capital (T1 = CET1 + AT1) 7,819
Tier 2 capital: instruments and provisions
46 Directly issued qualifying Tier 2 instruments plus related stock surplus
47 Directly issued capital instruments subject to phase-out from Tier 2
48Tier 2 instruments (and CET1 and AT1 instruments not included in rows 5 or 34)
issued by subsidiaries and held by third parties (amount allowed in group Tier 2)
49 Of which: instruments issued by subsidiaries subject to phase-out
50 Provisions 285
51 Tier 2 capital before regulatory adjustments 285
Tier 2 capital: regulatory adjustments
52 Investments in own Tier 2 instruments
53 Reciprocal cross-holdings in Tier 2 instruments and other TLAC liabilities
54
Investments in the capital and other TLAC liabilities of banking, financial and
insurance entities that are outside the scope of regulatory consolidation, where the
bank does not own more than 10% of the issued common share capital of the entity
(amount above 10% threshold)
54a
Investments in the other TLAC liabilities of banking, financial and insurance entities
that are outside the scope of regulatory consolidation and where the bank does not
own more than 10% of the issued common share capital of the entity: amount
previously designated for the 5% threshold but that no longer meets the conditions
(for G-SIBs only)
55
Significant investments in the capital and other TLAC liabilities of banking, financial
and insurance entities that are outside the scope of regulatory consolidation (net of
eligible short positions)
56 National specific regulatory adjustments
57 Total regulatory adjustments to Tier 2 capital -
58 Tier 2 capital (T2) 285
59 Total regulatory capital (TC = T1 + T2) 8,105
60 Total risk-weighted assets 34,100
Capital ratios and buffers
61 Common Equity Tier 1 (as a percentage of risk-weighted assets) 22.9309
62 Tier 1 (as a percentage of risk-weighted assets) 22.9309
63 Total capital (as a percentage of risk-weighted assets) 23.7676
64
Institution-specific buffer requirement (capital conservation buffer plus
countercyclical buffer requirements plus higher loss absorbency requirement,
expressed as a percentage of risk-weighted assets) 3.0164
65 Of which: capital conservation buffer requirement 2.5000
66 Of which: bank-specific countercyclical buffer requirement 0.5164
67 Of which: higher loss absorbency requirement N/A
68Common Equity Tier 1 (as a percentage of risk-weighted assets) available
after meeting the bank’s minimum capital requirements 14.9145
National Minima (if different from Basel III)
69 National Common Equity Tier 1 minimum ratio (if different from Basel III minimum)
70 National Tier 1 minimum ratio (if different from Basel III minimum)
71 National total capital minimum ratio (if different from Basel III minimum)
Amounts below the thresholds for deduction (before risk weighting)

14 / 38
Composition of Capital (Continued)
72Non-significant investments in the capital and other TLAC liabilities of other financial
entities
73 Significant investments in the common stock of financial entities
74 Mortgage servicing rights (net of related tax liability)
75 Deferred tax assets arising from temporary differences (net of related tax liability) 103 3
Applicable caps on the inclusion of provisions in Tier 2
76Provisions eligible for inclusion in Tier 2 in respect of exposures subject to
standardised approach (prior to application of cap) 285
77 Cap on inclusion of provisions in Tier 2 under standardised approach 397
78Provisions eligible for inclusion in Tier 2 in respect of exposures subject to internal
ratings-based approach (prior to application of cap)
79 Cap for inclusion of provisions in Tier 2 under internal ratings-based approach
Capital instruments subject to phase-out arrangements (only applicable
between 1 Jan 2018 and 1 Jan 2022)
80 Current cap on CET1 instruments subject to phase-out arrangements
81Amount excluded from CET1 due to cap (excess over cap after redemptions and
maturities)
82 Current cap on AT1 instruments subject to phase-out arrangements
83Amount excluded from AT1 due to cap (excess over cap after redemptions and
maturities)
84 Current cap on T2 instruments subject to phase-out arrangements
85Amount excluded from T2 due to cap (excess over cap after redemptions and
maturities)

15 / 38
Composition of Capital (Continued)
Table 7: Reconciliation of regulatory capital to balance sheet (CC2)
1. The BA return does not have a separate line for cash and cash equivalent and the amount
is added to loans and advances to banks.
2. The cash and balances at central bank is added to other assets in the financial statements
The IFRS16 was implemented on 1 January 2020 and this resulted in an increase in property,
plant and equipment for the building leases that was previously expensed.
a b c
Balance sheet as
in published
financial
statements
Under regulatory
scope of
consolidation Reference
As at period-end As at period-end
Assets
Cash and cash Equivalents 2,796
Cash and balances at central banks 821
Property and equipment 24 24
Intangible Assets - -
Derivative financial instruments 79 79
Deferred tax income assets 104 103
Loans and advances to banks 9,137 11,933
Loans and advances to customers 22,751 22,751
Current income tax assets 6 6
Available for sale financial investments 11,147 11,147
Other Assets 824 3
Total assets 46,868 46,868
Liabilities
Deposits from customers 16,941 16,941
Deposits from banks 17,727 17,727
Derivative financial instruments 7 7
Provisions 77 77
Commercial Paper 3,500 3,500
Other liabilities 161 161
Total liabilities 38,413 38,413
Equity
Branch capital 5,800 5,800 1
Retained earnings 2,565 2,565
Fair value reserves 90 90 2
Total shareholders' equity 8,455 8,455
16 / 38
Composition of Capital (Continued)
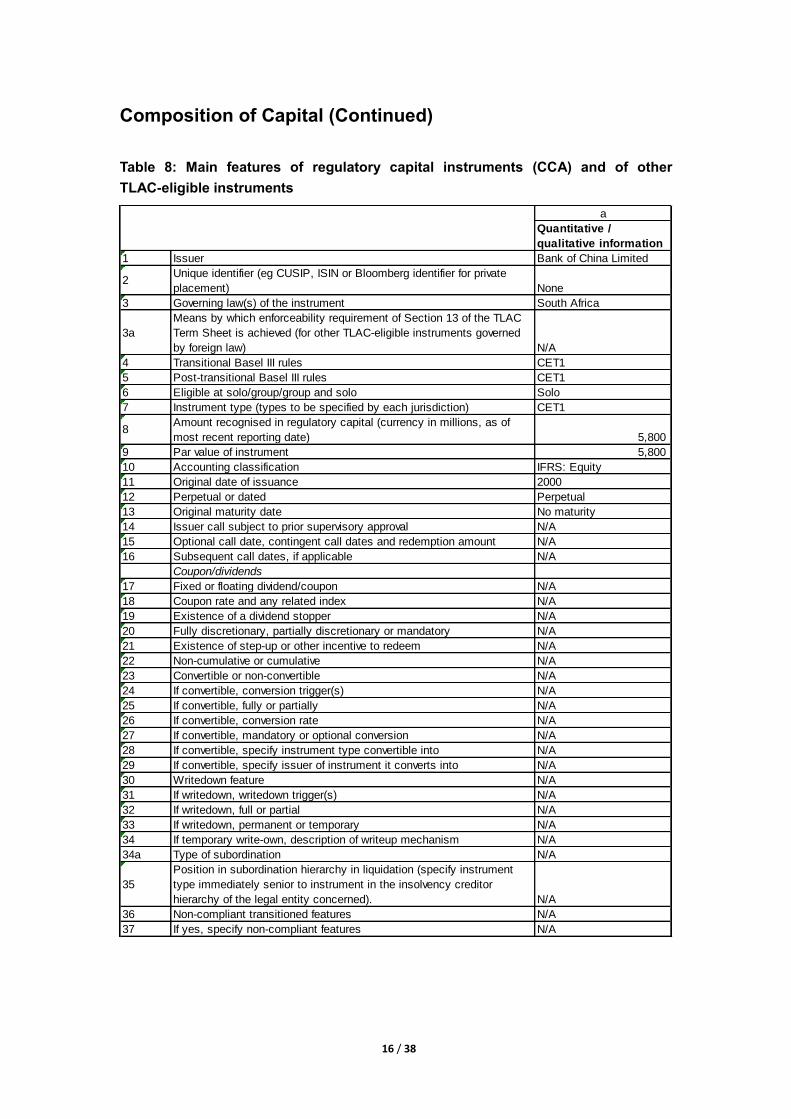
Table 8: Main features of regulatory capital instruments (CCA) and of other
TLAC-eligible instruments
a
Quantitative /
qualitative information
1 Issuer Bank of China Limited
2Unique identifier (eg CUSIP, ISIN or Bloomberg identifier for private
placement) None
3 Governing law(s) of the instrument South Africa
3a
Means by which enforceability requirement of Section 13 of the TLAC
Term Sheet is achieved (for other TLAC-eligible instruments governed
by foreign law) N/A
4 Transitional Basel III rules CET1
5 Post-transitional Basel III rules CET1
6 Eligible at solo/group/group and solo Solo
7 Instrument type (types to be specified by each jurisdiction) CET1
8Amount recognised in regulatory capital (currency in millions, as of
most recent reporting date) 5,800
9 Par value of instrument 5,800
10 Accounting classification IFRS: Equity
11 Original date of issuance 2000
12 Perpetual or dated Perpetual
13 Original maturity date No maturity
14 Issuer call subject to prior supervisory approval N/A
15 Optional call date, contingent call dates and redemption amount N/A
16 Subsequent call dates, if applicable N/A
Coupon/dividends
17 Fixed or floating dividend/coupon N/A
18 Coupon rate and any related index N/A
19 Existence of a dividend stopper N/A
20 Fully discretionary, partially discretionary or mandatory N/A
21 Existence of step-up or other incentive to redeem N/A
22 Non-cumulative or cumulative N/A
23 Convertible or non-convertible N/A
24 If convertible, conversion trigger(s) N/A
25 If convertible, fully or partially N/A
26 If convertible, conversion rate N/A
27 If convertible, mandatory or optional conversion N/A
28 If convertible, specify instrument type convertible into N/A
29 If convertible, specify issuer of instrument it converts into N/A
30 Writedown feature N/A
31 If writedown, writedown trigger(s) N/A
32 If writedown, full or partial N/A
33 If writedown, permanent or temporary N/A
34 If temporary write-own, description of writeup mechanism N/A
34a Type of subordination N/A
35
Position in subordination hierarchy in liquidation (specify instrument
type immediately senior to instrument in the insolvency creditor
hierarchy of the legal entity concerned). N/A
36 Non-compliant transitioned features N/A
37 If yes, specify non-compliant features N/A

17 / 38
Macro prudential Supervisory Measures
The proportion of capital held for CCyB requirements in geographies other than South Africa
are shown in the table below.
Table 9: Geographical distribution of credit exposures used in the countercyclical
capital buffer (CCyB1)
The countercyclical capital buffer rate has been calculated for BCBS jurisdictions which the
Branch have private sector credit exposure and applied it to RWA consistent with it being an
extension of the capital conservation buffer. The countercyclical buffer amount has been
added to total RWA. The Countercyclical Capital buffer rate was obtained from the BCBS
website. The change from the previous reporting period was that the Countercyclical Capital
buffer rate had changed for Hong Kong from 2.5% to 2% and the Branch no longer had
exposures relating to Sweden (loan repayment). The Countercyclical Capital buffer rate for the
United Kingdom remained unchanged.
a b c d e
Geographical breakdown
Countercyclical
capital buffer
rate
Exposure valuesRisk weighted
Assets
Hong Kong 2.00% 5,224 5,224
United Kingdom 1.00% 1,197 1,057
Sum 6,421 6,281
Total 53,956 31,775 0.5164 176
Exposure values and/or risk-weighted
assets used in the computation of the
countercyclical capital buffer
Bank-specific
countercyclical
capital buffer rate
Countercyclical
buffer amount

18 / 38
Leverage Ratio
The leverage ratio calculated in accordance with South African Banks Act, 1990 was 15.64%
at 31 December 2019, up from 14.24% at 30 September 2019. The movement was mainly due
to the decrease on the on-balance exposures of R3.7 billion (which consists of corporate loans
and bank loans) and off-balance sheet exposures of R1.3 billion (which consists of
commitments and guarantees). The exposures that have been disclosed are balances as at
each Quarter-end.
Table 10: Summary comparison of accounting assets vs leverage ratio exposure
(LR1)
The table below shows the reconciliation of the total assets in the financial statements to the
leverage ratio exposure measure.
Item R'm
1 Total consolidated assets as per published financial statements 46,868
2
Adjustment for investments in banking, financial, insurance or
commercial entities that are consolidated for accounting purposes but
outside the scope of regulatory consolidation
-
3
Adjustment for fiduciary assets recognised on the balance sheet
pursuant to the operative accounting framework but excluded from the
leverage ratio exposure measure
-
4 Adjustments for derivative financial instruments 90
5Adjustment for securities financing transactions (ie repos and similar
secured lending)
-
6Adjustment for off-balance sheet items (ie conversion to credit equivalent
amounts of off- balance sheet exposures) 3,025
7 Other adjustments -
8 Leverage ratio exposure 49,984

19 / 38
Leverage Ratio (Continued)
Table 11: Leverage ratio common disclosure template (LR2)
The table below provides a detailed breakdown of the components of the leverage ratio.
Item T T-1
Dec 2019 ('m) Sep 2019 ('m)
1On-balance sheet items (excluding derivatives and SFTs, but including
collateral)
46,789 50,533
2 (Asset amounts deducted in determining Basel III Tier 1 capital) - -0
3 Total on-balance sheet exposures (excluding derivatives and 46,789 50,533
Other risk Other risk
4Replacement cost associated with all derivatives transactions (ie
net of eligible cash variation margin)
79 3
5 Add-on amounts for PFE associated with all derivatives transactions 90 124
6Gross-up for derivatives collateral provided where deducted from the
balance sheet assets pursuant to the operative accounting framework
7(Deductions of receivables assets for cash variation margin
provided in derivatives transactions)
8 (Exempted CCP leg of client-cleared trade exposures)
9 Adjusted effective notional amount of written credit derivatives
10(Adjusted effective notional offsets and add-on deductions for written
credit derivatives)
11 Total derivative exposures (sum of lines 4 to 10) 170 127
12Gross SFT assets (with no recognition of netting), after adjusting for
sales accounting transactions
13(Netted amounts of cash payables and cash receivables of gross SFT
assets)
14 CCR exposure for SFT assets
15 Agent transaction exposures
16Total securities financing transaction exposures (sum of lines 12
to 15)
- -
17 Off-balance sheet exposure at gross notional amount 3,025 4,290
18 (Adjustments for conversion to credit equivalent amounts) - -
19 Off-balance sheet items (sum of lines 17 and 18) 3,025 4,290
20 Tier 1 capital 7,820 7,827
21 Total exposures (sum of lines 3, 11, 16 and 19) 49,984 54,950
22 Basel III leverage ratio 15.64% 14.24%
Securities financing transaction exposures
Other off-balance sheet exposures
Capital and total exposures
Leverage ratio
On-balance sheet exposures
Derivative exposures

20 / 38
Liquidity Risk
Liquidity risk is the risk that the Branch does not have sufficient financial resources to meet its
obligations as they fall due, or will have to access such resources at excessive cost. This
includes repaying depositors or maturing wholesale debt. The risk arises from mismatches in
the timing of cash flows. The Branch follows the group liquidity framework.
The objective of the Group’s internal liquidity and funding risk management framework is to
allow it to withstand very severe liquidity stresses and be adaptable to changing business
models, markets and regulations.
Liquidity Risk Management (LIQA)
The Branch has an internal liquidity and funding risk management framework which aims to
allow it to withstand severe liquidity stresses. It is designed to be adaptable to changing
business models, economic environment and regulations.
We maintain a funding structure of stable customer deposits and long term wholesale funding
well in excess of liquid assets requirements. We strive to diversify the funding base avoiding
undue concentration by investor type, maturity, market source, instrument and currency to
ensure a varied funding mix to support loan growth. We remain confident in our ability to rise
funding appropriate to our needs.
Table 12: Liquidity Coverage Ratio (LIQ1)
LCR promotes short-term resilience of the Branch’s 30 calendar day liquidity risk profile by
ensuring it has sufficient HQLA to meet potential outflows in a stressed environment. The
simple average for working days is used in the table are data from 1 October 2019 to 31
December 2019. Un-weighted value represents the outstanding balances maturing or callable
within 30 days for cash inflows and cash outflows. Total weighted value is calculated after
application of weightings of cash inflows and outflows.
The key main drivers which normally impact the movement of the LCR is the deposits (cash
outflows), loans and advances (cash inflows) and Government Bonds and Treasury Bills (High
Quality Liquid assets). The Branch is reliant on the Group for USD borrowing funds and issued
aa CNY 1.5 billion Rainbow Bond in 2017. All HQLA is in ZAR.
The following factors would cause the movements in the LCR
- Deposits and loans are nearing maturity which means that some loans and deposits
would move to within 30 days and would impact on the net cash outflow/inflow.
- The maturity or the purchase of Treasury Bills which would affect the movement of the
High Quality Liquidity Assets.

21 / 38
Liquidity Risk (Continued)
Table 13: Net Stable Funding Ratio (LIQ2)
The Branch has been subjected to the Basel III NSFR standards from 1 January 2018,
pursuant to the Banks Act D8/2017 with the objective to promote funding stability and
resilience in the banking sector by requiring banks to maintain a stable funding profile in
relation to the composition of its assets and off-balance sheet activities.
On 30 September 2019 NSFR ratio was 102%, as at 31 December 2019 NSFR ratio was
115%. Compared to Quarter 3 of 2019, the NSFR movement was caused by a significant
decrease on the RSF. This was mainly caused by decrease in the performing loans as well as
maturity of the Treasury Bills.
The Branch maintains and ensures that its NSFR remains above the specified regulatory
minimum requirements. The Branch maintained NSFR compliance in excess of the 100%
regulatory requirement and operates above risk appetite and management internal buffer
requirements.
Total unweighted valueTotal weighted value
(average) (average)
1 Total HQLA 11,314
2Retail deposits and deposits from small business customers, of
which:288 20
3 Stable deposits -
4 Less stable deposits 201 20
5 Unsecured wholesale funding, of which: 36,744 7,228
6Operational deposits (all counterparties) and deposits in networks of
cooperative banks-
7 Non-operational deposits (all counterparties) 12,568 7,228
8 Unsecured debt
9 Secured wholesale funding
10 Additional requirements, of which: 503 228
11Outflows related to derivative exposures and other collateral
requirements32 32
12 Outflows related to loss of funding on debt products -
13 Credit and liquidity facilities 303 28
14 Other contractual funding obligations 168 168
15 Other contingent funding obligations
16 TOTAL CASH OUTFLOWS 7,477
17 Secured lending (eg reverse repos) - -
18 Inflows from fully performing exposures 3,037 2,430
19 Other cash inflows 72 72
20 TOTAL CASH INFLOWS 2,502
21 Total HQLA 11,314
22 Total net cash outflows 4,974
23 Liquidity Coverage Ratio (%) 227
High-quality liquid assets
Cash outflows
Cash inflows
Total adjusted value

22 / 38
Liquidity Risk (Continued)
The ASF lines consist of the following:
Deposits from Customers and Banks as well as Capital and funding received from issuance of
Commercial Papers and Bonds.
The RSF lines consist of the following:
Loans issued to customers and banks as well as investment in government bonds and
Treasury Bills.
The following below are key drivers which would influence the movement of the NSFR ratio:
The drivers of the ASF are the deposits received from clients (based on customer type)
and residual maturity of deposits as well as capital injection.
The drivers of the RSF are the issuance of the loans to clients (based on customer
type) and residual maturity of the loans issued as well as the addition and maturity
HQLA.
a b c d e
No maturity < 6 months6 months to < 1
year≥ 1 year Weighted value
Available stable funding (ASF) item - - - - -
1 Capital: 8,105 8,105
2 Regulatory capital 8,105 8,105
3 Other capital instruments
4 Retail deposits and deposits from small business customers: 402 109 28 0 486
5 Stable deposits
6 Less stable deposits 402 109 28 0 486
7 Wholesale funding: 5,561 19,160 3,826 9,081 18,089
8 Operational deposits
9 Other wholesale funding 5,561 19,160 3,826 9,081 18,089
10 Liabilities with matching interdependent assets
11 Other liabilities:
12 NSFR derivative liabilities
13 All other liabilities and equity not included in the above categories 721 11 19 109 118
14 Total ASF 26,798
Required stable funding (RSF) item
15 Total NSFR high-quality liquid assets (HQLA) 557
16Deposits held at other financial institutions for operational
purposes821 41
17 Performing loans and securities:
18 Performing loans to financial institutions secured by Level 1 HQLA
19Performing loans to financial institutions secured by non-Level 1
HQLA and unsecured performing loans to financial institutions4,799 3,213 3,945 6,271
20
Performing loans to non-financial corporate clients, loans to retail
and small business customers, and loans to sovereigns, central
banks and PSEs, of which:
7,561 1,133 14,207 15,757
21With a risk weight of less than or equal to 35% under the Basel II
standardised approach for credit risk- - 3,327 2,163
22 Performing residential mortgages, of which: - - 23 15
23With a risk weight of less than or equal to 35% under the Basel II
standardised approach for credit risk- - 23 15
24Securities that are not in default and do not qualify as HQLA,
including exchange-traded equities- -
25 Assets with matching interdependent liabilities
26 Other assets: 212 212
27 Physical traded commodities, including gold
28Assets posted as initial margin for derivative contracts and
contributions to default funds of CCPs
29 NSFR derivative assets - 72
30NSFR derivative liabilities before deduction of variation margin
posted
31 All other assets not included in the above categories 76 6 3 127 -
32 Off-balance sheet items - - - 357
33 Total RSF 23,283
34 Net Stable Funding Ratio (%) 115

23 / 38
Credit Risk
General information about credit risk (CRA):
Credit Risk Management is defined as the risk that parties with whom the Branch has
contracted fail to meet their obligations (both on and off-balance sheet). Credit risk appetite is
monitored and reported on a monthly basis through a suite of risk metrics derived from credit
portfolio performance measures.
Table 14: General qualitative information about credit risk (CR1)
The following table provides a breakdown of the credit quality of on and off balance sheet
assets (gross and net of impairments) and reconciles to the amounts reported in the annual
financial statements.
The Branch applies a consistent definition to default for regulatory and accounting purposes.
Refer to CRB for the Branch’s default definition.
Table 15: Changes in stock of defaulted loans and debt securities (CR2)
The table below depicts the changes in the Branch’s stock of defaulted exposures, the flows
between non-defaulted and defaulted exposure categories and reductions in the stock of
defaulted exposures due to write-offs. In the last quarter of 2019, the Branch has written off
two non-performing loans. There are only two remaining default loans.
Additional disclosure related to the credit quality of assets (CRB):
The Branch applies International Financial Reporting Standard 9 for impairments. The
impairments for the Branch are determined by qualitative, quantitative and Backstop methods.
The measurement of the impairment is the Expected Credit Loss Model (“ECL”). Details
information is disclosed as below:
a b c d
Defaulted exposuresNon-defaulted
exposures
1 Loans 587 34,886 -783 34,690
2 Debt Securities - 11,147 -17 11,130
3 Off-balance sheet exposures 29 7,115 -14 7,131
4 Total 617 53,149 -815 52,951
Gross carrying values ofAllowances/
impairments
Net values
(a+b+c)
a
1 Defaulted loans and debt securities at end of the previous reporting period 859
2 Loans and debt securities that have defaulted since the last reporting period
3 Returned to non-defaulted status
4 Amounts written off 242
5 Other changes -1
6Defaulted loans and debt securities at end of the reporting period (1+2-3-4+-
5)617

24 / 38
Credit Risk (Continued)
1. Measurement of the ECL:
In accordance with IFRS-9 requirements, based on the change in credit quality since the initial
recognition of the financial instruments, ECL under different periods of time should be
recognized, and the new standard outlines a “three-stage” model to calculate the ECL as
follows:
(1) Stage 1: The financial instruments without significant increases in credit risk after initial
recognition apply the Stage I Model of the ECL to calculate its impairment allowance at an
amount equivalent to the ECL of the financial instrument for the next 12 months;
(2) Stage II: Financial instruments that have had a significant increase in credit risk since
initial recognition but have no objective evidence of impairment apply the Stage II Model of
the ECL, with their impairment provision measured at an amount equivalent to the ECL
over the lifetime of the financial instruments;
(3) Stage III: Financial assets with objective evidence of impairment at the balance sheet date
apply the Stage III Model of ECL, with their impairment provisions measured at the amount
equivalent to the ECL for the lifetime of the financial instruments.
2. Methodology for determining a significant increase in credit risk
Our Branch considers a credit asset to have experienced a significant increase in credit risk
when one or more of the following quantitative, qualitative or backstop criteria have been met:

25 / 38
Credit Risk (Continued)
2.1 Quantitative criteria
(1) At the reporting date, the increase in remaining lifetime probability of default (PD) is
considered significant, comparing with the one at initial recognition;
(2) The determination of what is ‘significant’ requires judgment. In making this judgment, the
Branch evaluates, among other factors, the changes in internal operating results of the
borrower; expected changes in interest rates and internal price indicators of credit risk;
2.2 Qualitative criteria
(1) Significant adverse change in debtor’s operation or financial status;
(2) Be classified into Special Mention category within five-tier loan classification.
2.3 Backstop criteria
The contractual payments of the debtor’s any principal, advances, interest or corporate bond
are more than 30 days past due.
3. Definition of credit impaired assets
The standard adopted by the Branch to determine whether credit impairment occurs under
IFRS 9 is consistent with the internal credit risk management objectives of the relevant
financial instrument, taking into account quantitative and qualitative criteria. When the Branch
assesses whether the credit impairment of debtor occurred, the following factors are mainly
considered:
(1) Significant financial difficulty of the issuer or the debtor;
(2) Debtors are in breach of contract, such as defaulting on interest or becoming overdue on
interest or principal payments overdue;
(3) The creditor of the debtor, for economic or contractual reasons relating to the debtor’s
financial difficulty, having granted to the debtor a concession that the creditor would not
otherwise consider;
(4) It is becoming probable that the debtor will enter bankruptcy or other financial
reorganization;
(5) The disappearance of an active market for that financial asset because of financial
difficulties;
(6) The purchase or origination of a financial asset at a deep discount that reflects the
incurred credit losses;
(7) The debtor leaves any of the principal, advances, interest or investments in corporate
bond of the Branch overdue for more than 90 days.
The credit impairment of a financial asset may result from the combined effect of multiple
events and may not be necessarily due to a single event.

26 / 38
Credit Risk (Continued)
4. Definition of Default:
The Branch defines its credit exposures as default in the case of:
4.1 exposures other than retail exposures, to be deemed to have occurred when the branch
is of the opinion that an obligor is unlikely to meet their credit obligations in full without any
resource by the branch to actions such as the realization of security, which opinion of the
Branch as a minimum, are based on the matters specified below:
(1) The Branch has assigned non-accrued status to the relevant credit obligation;
(2) The Branch has written off a portion or raised a specific provision in respect of the
relevant credit exposure due to a significant perceived decline in the credit obligor since the
branch incurred the said exposure;
(3) The Branch is about to sell the credit obligation at a material credit-related economic loss;
(4) The Branch has consented to a distressed restructuring of the credit obligation, which
restructuring is likely to result in a reduced financial obligation caused by, for example, the
postponement of principal, interest or fees;
(5) The Branch has applied for or has been placed in bankruptcy or similar protection and the
said event is likely to avoid or delay repayment of the credit obligation to the Banking Group.
(6) The Obligor has applied for or has been placed in bankruptcy or similar protection and the
said even is likely to avoid or delay repayment of the credit obligation to the BOC Group.
4.2 exposures other than retail exposures are deemed to have occurred when a material
obligation of an obligor is overdue for more than 90 days;
4.3 retail exposures to be deemed to have occurred when the criteria specified paragraph 4.1
or 4.2 above are present at a facility level instead of an obligor level;
4.4 An overdraft facility is deemed to have occurred when:
(1) An obligor exceeded an advised limit for more than 90 days, that is, the relevant obligor
failed to reduce the outstanding amount within the said period of time to an amount that is
within the authorized limit; or
(2) An obligor is advised of a limit smaller than the obligor’s existing outstanding amount and
the relevant obligor failed to reduce the outstanding amount within a period of 90 days to an
amount that is within the newly advised limit;
(3) The Branch extends credit to a person with no authorised limit, which credit is not repaid
within 90 days.
5. Definition of Write-offs
Bad debts may apply for write-offs in accordance with the following conditions:
(1) Credit facility’s capital, interest, and investment assets that are incapable to recover after
disposal;
(2) Approved Credit facility’s capital and interest debt reduction;
(3) For bad debts that have been approved for write-offs, the loss of collateral liquidation after
the disposal of collateral (the amount of collateral liquidation loss = the amount of collateral –
the recovery amount of liquidation + the cost of collateral liquidation);

27 / 38
Credit Risk (Continued)
(4) Credit facility’s capital, interest or investment assets that shall be written-off in accordance
with South Africa Law or specific requirements from regulatory authorities.
6. Definition of Restructured Exposures
The Branch defines its exposures as Restructured Exposures when the credit facility granted
to the obligor with weakened credit obligations to the Branch such as decrease interest rate,
change in repayment plan, change in debt servicing obligor, reduce the collaterals ceded to the
Branch, etc. due to its distressed financial conditions which caused their capabilities to fulfill
debt payments to the Branch. At 31 December 2019, total restructured loans are R117 million.
An analysis of gross credit exposures by industry:
Gross credit counterparty exposures by residual contractual maturity at 31 December
2019
On balance
sheet
exposure
Off balance
sheet
exposure
Derivative
instrumentsTotal
Agriculture, hunting, forestry and fishing 320 383 - 704
Mining and quarrying 2,354 1,663 - 4,017
Manufacturing 7,031 1,509 - 8,540
Electricity, gas and water supply 333 70 - 403
Construction 322 336 - 659
Wholesale and retail trade, repair of specified items, hotel103 276 2 381
Transport, storage and communication 3,704 1,559 - 5,264
Financial intermediation and insurance 24,339 924 167 25,430
Real estate 7,267 69 - 7,335
Business services 180 - - 180
Community, social and personal services - - - -
Private households 23 - - 23
Other 644 356 - 999
Total 46,620 7,145 170 53,935
Up to 3 monthsThree to Six
months
Six months to
one year
One to Five
Years
Five to Ten
Years> 10 years Total
Loans and advances to banks 2,025 - 3,189 3,923 - - 9,137
Cash placements at banks - - -
Investment securities 1,564 2,734 3,726 3,124 11,147
Derivative financial instruments 79 79
Loans and advances to customers 2,520 5,194 1,243 4,860 8,189 745 22,751
Total on-balance sheet exposures 6,188 7,928 8,157 11,908 8,189 745 43,114
Guarantees - 135 - 3 259 397
Contingent liabilities, committed facilities and other - - - - 506 - 506
Total off-balance sheet exposures - 135 - 3 765 - 902
Total gross credit exposures 6,188 8,063 8,157 11,910 8,954 745 44,017

28 / 38
Credit Risk (Continued)
An age analysis of past due and default loans and advances to customers
Qualitative disclosure requirements related to credit risk mitigation techniques
(CRC)
Credit risk mitigation refers to various actions that the manages its credit risk exposure (proactively and reactively). Generally, the Branch takes credit risk mitigation methods as the second source of debt payments from its clients; however the primary source of debt payments from the clients themselves should be the core lending consideration.
The Branch has established its credit risk mitigation appetite, and measures on how to manage the Branch’s collaterals. The collaterals are being valued at the inception of the lending business, being dynamically and regularly monitored, and periodically reviewed over the lending lifecycle.
Table 16: Credit risk mitigation techniques – overview (CR3)
The following table reports the extent of use of CRM techniques used to reduce capital
requirements as well as the extent of exposures secured by collateral and/or guarantees.
The secured exposures are reported as EAD pre any credit conversion factors or mitigation in
the current reporting period and only contains exposures that have security against them
either in full or partially.
All exposures not secured by both eligible collateral and/or a qualifying guarantee are
regarded as unsecured.
There have been no changes in the credit risk mitigation disclosure compared to prior periods.
Dec-19
Default loans 587
1 - 30 days -
31 - 60 days -
61 - 90 days -
Total 587
a b c d e f g
Exposures unsecured:
carrying amount
Exposures
secured by
collateral
Exposures
secured by
collateral, of
which secured
amount
Exposures
secured by
financial
guarantee
Exposures
secured by
financial
guarantee, of
which secured
amount
Exposures
secured by
credit
derivative
Exposures
secured by
credit derivative,
of which
secured amount
1 Loans 34,573 117 91 - - - -
2 Debt Securities 11,130 - - - -
3 Total 45,703 117 91 - - - -
4 Of which defaulted 76

29 / 38
Credit Risk (Continued)
Qualitative disclosures on bank’s use of external credit ratings under the
standardized approach for credit risk (CRD)
The Branch applies the standardized approach for calculating capital requirements in the
assessment of its credit and counterparty exposures. The Branch conducts the mapping of
credit and counterparty exposures in accordance with the mapping procedures specified by
the South African Reserve Bank.
The Branch applies the external credit rating from the external credit assessment institutions
(ECAIs), namely Standard and Poor’s, Fitch and Moody’s for standardized approach
calculation. In the case the client is rated by two institutions, the rating of the higher one will be
applied. The middle of the ratings will be applied if the client has rating from three ECAIs.
Internal and external credit ratings are included in the assessment of the credit risk of clients.
The Branch internal rating system divides the credit rating into 27 levels based on the level of
debtors rating and default risk.
Customers' credit rating results are important reference for the Branch to carry out the
management of credit approval, customer entry, risk monitoring, limit management,
post-lending management, credit policy, risk report, economic capital, risk preference, loss
reserve, risk pricing and performance appraisal.
Table 17: Standardised approach – credit risk exposure and Credit Risk Mitigation
(CRM) effects (CR4)
The table below illustrates the effect of eligible collateral as defined in the standardized
approach for credit risk.
a b c d e f
Asset classes
On-balance
sheet amount
Off-balance
sheet
amount
On-balance
sheet amount
Off-balance
sheet
amount
RWARWA
density
1 Sovereigns and their central banks 11,547 355 11,547 177 578 5%
2 Non-central government public sector entities (PSEs) 3,327 3,327 665 20%
3 Multilateral development banks (MDBs) 0%
4 Banks 12,130 424 12,130 212 8,875 72%
5 Securities firms 0%
6 Corporates 19,180 6,324 19,089 2,472 21,559 100%
7 Regulatory retail portfolios 17 13 17 2 16 90%
8 Secured by residential property 23 23 8 35%
9 Secured by commercial real estate 0%
10 Equity 0%
11 Past-due loans 587 29 76 15 45 50%
12 Higher-risk categories 0%
13 Other assets 848 848 27 3%
14 Total 47,660 7,145 47,057 2,878 31,773 64%
Exposures before CCF
and CRM
Exposures post CCF and
CRMRWA and RWA density

30 / 38
Credit Risk (Continued)
RWA is driven by exposures to corporates (68%) and Banks (28%) compared to 2018 of
corporates (71%) and Banks (24%)
Table 18: Standardised approach – exposures by asset classes and risk weights
(CR5)
The table below presents the breakdown of credit risk exposures under the market based
approach by asset class and risk weight, corresponding to the RW%. There were no
significant changes to the exposure overall. However, there was an increase in exposures
under Sovereign and Central Banks mainly due to the additional purchase of Treasury
Bills.
a b c d e f g h i j
Risk
weight
Asset classes
0% 10% 20% 35% 50% 75% 100% 150% Others
Total credit
exposures amount
(post CCF and post-
CRM)
1 Sovereigns and their central banks 11,147 578 11,725
2 Non-central government public sector entities (PSEs) 3,327 3,327
3 Multilateral development banks (MDBs) -
4 Banks 2,687 276 1,067 8,312 12,342
5 Securities firms -
6 Corporates 21,561 21,561
7 Regulatory retail portfolios 3 15 18
8 Secured by residential property 23 23
9 Secured by commercial real estate -
10 Equity -
11 Past-due loans 90 90
12 Higher-risk categories -
13 Other assets 821 27 848
14 Total 14,655 - 3,604 23 1,160 - 30,493 - - 49,935

31 / 38
Counterparty Credit Risk
Qualitative disclosure related to counterparty credit risk (CCRA)
Counterparty credit risk refers to the risk that a counterparty to a transaction may default
prior to the satisfactory final settlement of the cash flows of one of the following types of
the transactions: derivative instruments, repo transactions, securities or commodities
lending, long settlement transactions and margin lending transactions.
The Branch uses Murex system for CCR measurement purpose. The derivative portfolio
consists of FX swap, FX forward and Cross Currency swaps. The Branch applies
Standardised Approach and Standardised CVA to calculate its total CCR capital charge.
The Branch shall strictly review the counterparty eligibility criteria and scope of applicable
products before transactions. In the case of credit to corporate counterparty, the business
unit shall initiate credit application with the support of the treasury transactions
departments and manage credit limit.
The semi-annual comparison showed that there was a decrease in the valuation of the
derivative portfolios and fewer derivative transactions from 30 June 2019. This meant that
there was a decrease in the RWA.
Table 19: Analysis of counterparty credit risk (CCR) exposure by approach (CCR1)
The following table provides a summary of the methods used to calculate counterparty
credit risk regulatory requirements and the main parameters used within each method.
a b e f
Replacemen
t cost
Potential
future
exposure
EAD post-
CRMRWA
1 SA-CCR (for derivatives) 79 90 170 28
2 Internal Model Method (for derivatives and SFTs)
3 Simple Approach for credit risk mitigation (for SFTs)
4 Comprehensive Approach for credit risk mitigation (for SFTs)
5 VaR for SFTs
6 TOTAL 28

32 / 38
Counterparty Credit Risk (Continued)
Table 20: Credit valuation adjustment (CVA) capital charge (CCR2)
The following table provides a summary of the CVA regulatory calculation under the
standardised approach
Credit valuation adjustment (CVA) in the regulatory context is a capital charge to be taken
into account possible volatility in the value of derivative instruments due to changes in the
credit quality of the Branch’s counterparty. The decrease year on year is mainly due to
fewer derivatives transactions.
Table 21: Standardised approach of CCR exposures by regulatory portfolio and risk
weights (CCR3)
The following table provides a breakdown of counterparty credit risk exposures excluding
all CVA exposures that are reported in CCR2 as well as exposures to central
counterparties, calculated according to the standardised approach: by portfolio (type of
counterparties) and by risk weight.
a b
EAD post-CRM RWA
Total portfolios subject to the Advanced CVA capital charge
1 (i) VaR component (including the 3×multiplier)
2 (ii) Stressed VaR component (including the 3×multiplier)
3 All portfolios subject to the Standardised CVA capital charge 170 70
4 Total subject to the CVA capital charge 170 70
a b c d e f g h j
Risk
weight
Regulatory portfolio
0% 10% 20% 50% 75% 100% 150% Others
Total
credit
exposure
Sovereigns -
Non-central government public sector
entities (PSEs)-
Multilateral development banks (MDBs) -
Banks 39 128 0 167
Securities firms -
Corporates 2 2
Regulatory retail portfolios 0 0
Other assets -
Total 39 - 128 - - 3 - - 170

33 / 38
Counterparty Credit Risk (Continued)
Table 22: Exposures to central counterparties (CCR8)
a b
EAD (post-CRM) RWA
1 Exposures to QCCPs (total)
2
Exposures for trades at QCCPs (excluding
initial margin and default fund
contributions); of which
3 (i) OTC derivatives
4 (ii) Exchange-traded derivatives
5 (iii) Securities financing transactions
6(iv) Netting sets where cross-product
netting has been approved
7 Segregated initial margin
8 Non-segregated initial margin
9 Pre-funded default fund contributions
10 Unfunded default fund contributions
11 Exposures to non-QCCPs (total) -
12
Exposures for trades at non-QCCPs
(excluding initial margin and default fund
contributions); of which
170 -
13 (i) OTC derivatives 170 -
14 (ii) Exchange-traded derivatives
15 (iii) Securities financing transactions
16(iv) Netting sets where cross-product
netting has been approved
17 Segregated initial margin
18 Non-segregated initial margin
19 Pre-funded default fund contributions
20 Unfunded default fund contributions

34 / 38
Market Risk
General qualitative disclosure requirements related to market risk (MRA)
Strategy and processes of the Bank
The Branch is exposed to the following market related risks, the currency risk and interest
rate risk. The Branch enters into a variety of derivative financial instruments for risk
management purposes.
Interest rate risk
The strategies and objectives of the Branch is to optimise net interest income, given the
current market interest rate levels.
The Branch’s operations are subject to the risk of interest rate fluctuations to the extent
that interest-earning assets (including investments) and interest-bearing liabilities mature
or reprice at different times or in differing amounts. As such, the Branch enters into
interest rate derivatives to bridge the mismatch in the repricing of assets and liabilities.
This is done in accordance with the guidelines established by the Branch’s asset-liability
management committee.
Part of the Branch’s return on financial instruments is obtained from controlled
mismatching of the dates on which interest receivable on assets and interest payable on
liabilities are next reset to market rates or, if earlier, the dates on which the instruments
mature.
Currency risk
The Branch is exposed to currency risk through transactions in foreign currencies. The
Branch’s funding is diversified in local currency and foreign currencies. As the currency in
which the Branch presents its annual financial statements is the South African Rand, the
Branch annual financial statements are affected by movements in the exchange rates
between the South African Rand and the foreign currencies.
The Branch’s transactional exposures give rise to foreign currency gains and losses that
are recognised in the statement of other comprehensive income. As such, the Branch
would enter into FX Swaps as means to manage the transactional exposures which would
give rise to the foreign currency gains and losses.

35 / 38
Market Risk (Continued)
Structure Governance
The market risk is governed by the guidelines established by the Branch’s asset-liability
management committee. The committee meets at least on a quarterly basis and would set
guidelines in order to manage the market risk in line with the Branch’s strategy.
Scope and nature of risk reporting and/or measurement systems.
The disclosures relating to Market Risk are disclosed annually on the Annual Financial
Statements.
The Branch measures the derivatives at fair value and they determine the fair value based
on the amount the Branch would receive or pay to terminate the contract at the statement
of financial position date taking into account current market conditions and current
creditworthiness of the counterparties. The measurement systems are usually industry
Standard models.
Table 23: Market Risk under the SA (MR1)
The products that the Branch has under the Standardised Approach are outright products
which are subjected to the foreign exchange risk. The major currencies that subject to the
market risk are USD and CNY. There has been no significant movements compared with
June 2019.
a
RWA
Outright products
1 Interest rate risk (general and specific)
2 Equity risk (general and specific)
3 Foreign exchange risk 15
4 Commodity risk
Options
5 Simplified approach
6 Delta-plus method
7 Scenario approach
8 Securitisation
9 Total 15

36 / 38
Remuneration
Remuneration policy (REMA)
The Branch’s philosophy is to employ high caliber individuals who are characterized by
integrity and professionalism and who adhere and subscribe to its culture and values. The
Branch attracts and retains talents through providing a competitive annual cost-to-company
package, which includes a fixed annual salary and employee fringe benefits, and rewards it
employees for their positive contribution and performance through payment of a variable
remuneration in the form of performance bonus.
The remuneration committee at Bank of China Head Office level is an integral part of the
group’s governance structure and organization, who oversees and reviews the group’s
remuneration policy and system design. The Remuneration Division of Bank of China Head
Office Human Resource Department drafts the group’s remuneration policies, processes,
practices and procedures, and overseas the remuneration operation of the group.
The Remuneration Division of Bank of China Head Office Human Resource Department
monitors and reviews the operation relating to remuneration matters of all domestic and
overseas branches/institutions on a quarterly/bi-annually/annually basis via various reports.
The Branch subscribes to the Head Office’s remuneration policy and procedure, and adheres
to its monitoring and review program on the Branch’s remuneration related operation, and
submits periodic review reports according to the Head Office’s requirement
The Branch’s policies, processes, practices, procedures relating remuneration encompassed
the BCBS corporate governance principle to banks, thus support and promote sound
corporate governance and effective risk management.

37 / 38
Remuneration (Continued)
REM1: Remuneration awarded during the financial year
The remuneration awarded was paid in line with the Branch’s policies, processes, practices
and procedures during the 2019 financial year and there were no significant movements noted
during the year.
Table 24: Remuneration awarded during the financial year
* Employee fringe benefits
# includes 3 ex-executive members and 4 current executive members
REM2: Special payments
Table 25: Special payments
(In ZAR, before tax)
Remuneration amount Senior management Other material risk-takers
1 Number of employees 5
2 Total fixed remuneration (3 + 5 + 7) 22 -
3 Of which: cash-based 19
4 Of which: deferred -
5 Of which: shares or other share-linked instruments -
6 Of which: deferred
7 Of which: other forms * 3
8 Of which: deferred -
9 Number of employees # 7
10 Total variable remuneration (11 + 13 + 15) 20
11 Of which: cash-based 20
12 Of which: deferred 18
13 Of which: shares or other share-linked instruments -
14 Of which: deferred
15 Of which: other forms -
16 Of which: deferred
17 Total remuneration (2 + 10) 42 -
Fixed remuneration
Variable
remuneration
REM1
REM2
Number of employees Total amount Number of employees Total amount Number of employees Total amount
Senior management - - - - - -
Other material risk-takers - - - - - -
Guaranteed bonuses Sign-on awards Severance payments

38 / 38
Remuneration (Continued)
REM3: Deferred remuneration
Table 26: Deferred remuneration
REM3
a=b+e b=c+d c d e
Deferred and retained
remuneration
Total amount of
outstanding deferred
remuneration
Of which: Total amount of
outstanding deferred and
retained remuneration exposed
to ex post explicit and/or implicit
adjustment
Total amount of
amendment during the
year due to ex post
explicit adjustments
Total amount of
amendment during the
year due to ex post
implicit adjustments
Total amount of deferred
remuneration paid out in
the financial year
Senior management 20 18 12 6 2
Cash 20 18 12 6 2
Shares
Cash-linked instruments
Other
Other material risk-takers
Cash
Shares
Cash-linked instruments
OtherTotal 20 18 12 6 2