Bank of America Merrill Lynch Estate Conference -...
42
09.12.17 Prologis Bank of America Merrill Lynch 2017 Global Real Estate Conference Prologis Park Port Reading, Jersey City, New Jersey
Transcript of Bank of America Merrill Lynch Estate Conference -...
09.12.17
Prologis
Bank of America Merrill Lynch
2017 Global Real Estate Conference
Prologis Park Port Reading, Jersey City, New Jersey
2
Forward-Looking Statements
This presentation includes certain terms and non-GAAP financial measures that are not specifically defined herein.
These terms and financial measures are defined and, in the case of the non-GAAP financial measures, reconciled to the
most directly comparable GAAP measure, in our second quarter Earnings Release and Supplemental Information that is
available on our investor relations website at www.ir.prologis.com and on the SEC’s website at www.sec.gov.
The statements in this document that are not historical facts are forward-looking statements within the meaning of Section 27A of the
Securities Act of 1933, as amended, and Section 21E of the Securities Exchange Act of 1934, as amended. These forward-looking
statements are based on current expectations, estimates and projections about the industry and markets in which we operate as well
as management’s beliefs and assumptions. Such statements involve uncertainties that could significantly impact our financial results.
Words such as “expects,” “anticipates,” “intends,” “plans,” “believes,” “seeks,” “estimates” and variations of such words and similar
expressions are intended to identify such forward-looking statements, which generally are not historical in nature. All statements that
address operating performance, events or developments that we expect or anticipate will occur in the future — including statements
relating to rent and occupancy growth, development activity and changes in sales or contribution volume of properties, disposition
activity, general conditions in the geographic areas where we operate, our debt, capital structure and financial position, our ability to
form new co-investment ventures and the availability of capital in existing or new co-investment ventures — are forward-looking
statements. These statements are not guarantees of future performance and involve certain risks, uncertainties and assumptions that
are difficult to predict. Although we believe the expectations reflected in any forward-looking statements are based on reasonable
assumptions, we can give no assurance that our expectations will be attained and therefore, actual outcomes and results may differ
materially from what is expressed or forecasted in such forward-looking statements. Some of the factors that may affect outcomes and
results include, but are not limited to: (i) national, international, regional and local economic climates, (ii) changes in financial markets,
interest rates and foreign currency exchange rates, (iii) increased or unanticipated competition for our properties, (iv) risks associated
with acquisitions, dispositions and development of properties, (v) maintenance of real estate investment trust status, tax structuring
and income tax rates (vi) availability of financing and capital, the levels of debt that we maintain and our credit ratings, (vii) risks related
to our investments in our co-investment ventures, including our ability to establish new co-investment ventures and funds, (viii) risks of
doing business internationally, including currency risks, (ix) environmental uncertainties, including risks of natural disasters, and (x)
those additional factors discussed in reports filed with the Securities and Exchange Commission by us under the heading “Risk
Factors.” We undertake no duty to update any forward-looking statements appearing in this document. The materials do not constitute
an offer to sell or the solicitation of an offer to buy any securities. Unless stated otherwise, all information in this document is as of June
30, 2017.
Contents
Prologis Park Osaka #2, Osaka, Japan
04 Section 01Why Logistics Real Estate
16 Section 02Why Prologis
38 Section 03Why Prologis Now
Section 01
Prologis Park Isle d’Abeau, Lyon, France
Why Logistics Real Estate
5
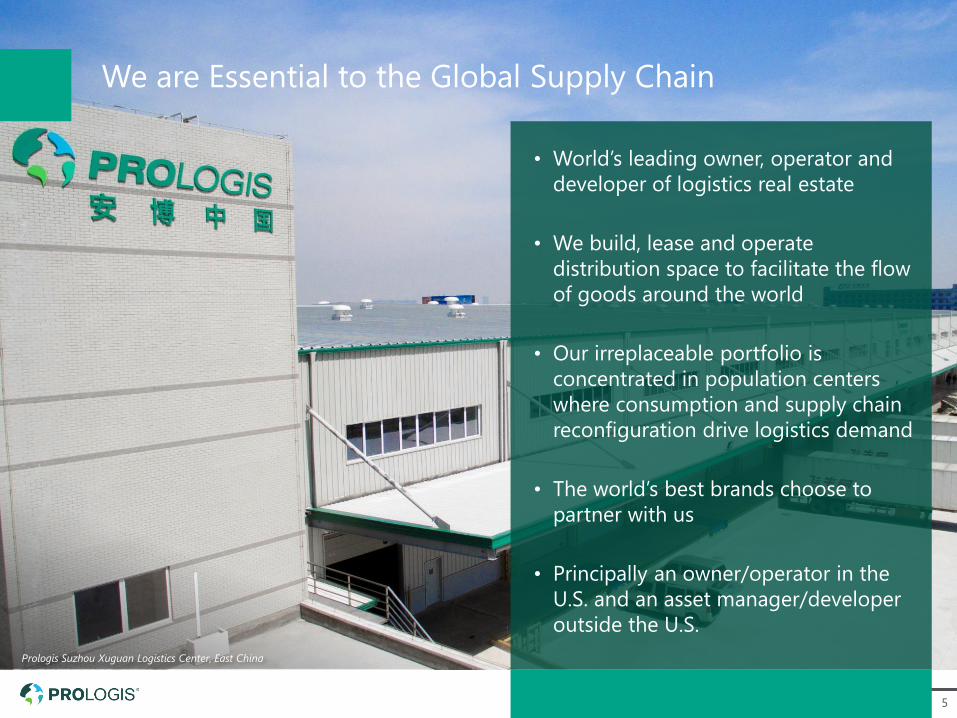
We are Essential to the Global Supply Chain
• World’s leading owner, operator and
developer of logistics real estate
• We build, lease and operate
distribution space to facilitate the flow
of goods around the world
• Our irreplaceable portfolio is
concentrated in population centers
where consumption and supply chain
reconfiguration drive logistics demand
• The world’s best brands choose to
partner with us
• Principally an owner/operator in the
U.S. and an asset manager/developer
outside the U.S.
Prologis Suzhou Xuguan Logistics Center, East China
6
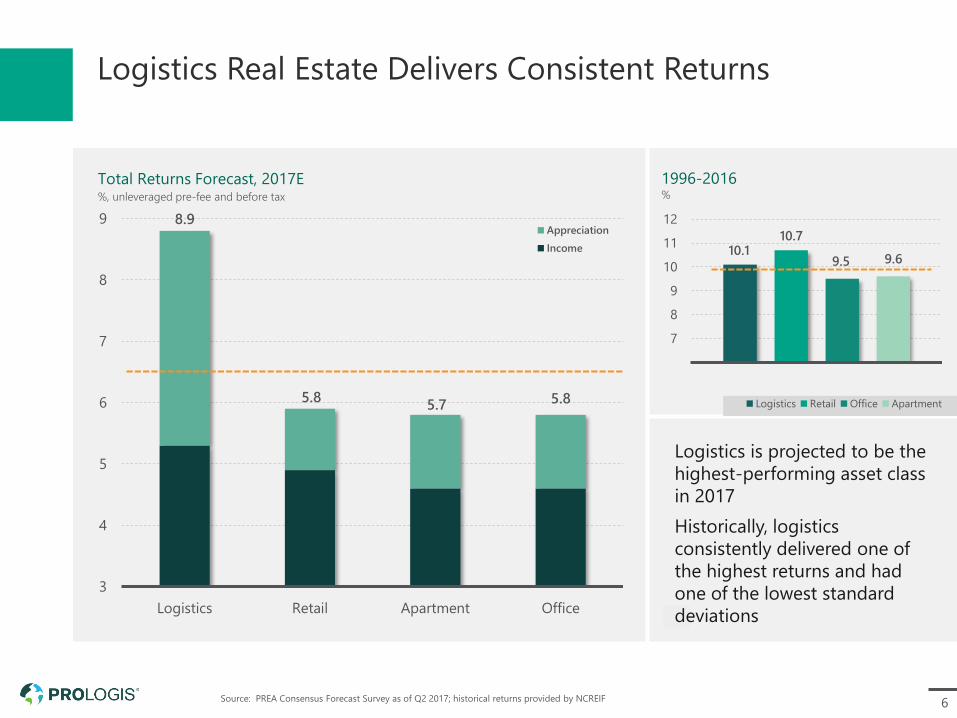
Logistics Real Estate Delivers Consistent Returns
1996-2016%
Total Returns Forecast, 2017E%, unleveraged pre-fee and before tax
10.110.7
9.5 9.6
6
7
8
9
10
11
12
Logistics Retail Office Apartment
8.9
5.85.7 5.8
3
4
5
6
7
8
9
Logistics Retail Apartment Office
Appreciation
Income
Source: PREA Consensus Forecast Survey as of Q2 2017; historical returns provided by NCREIF
Logistics is projected to be the
highest-performing asset class
in 2017
Historically, logistics
consistently delivered one of
the highest returns and had
one of the lowest standard
deviations
7
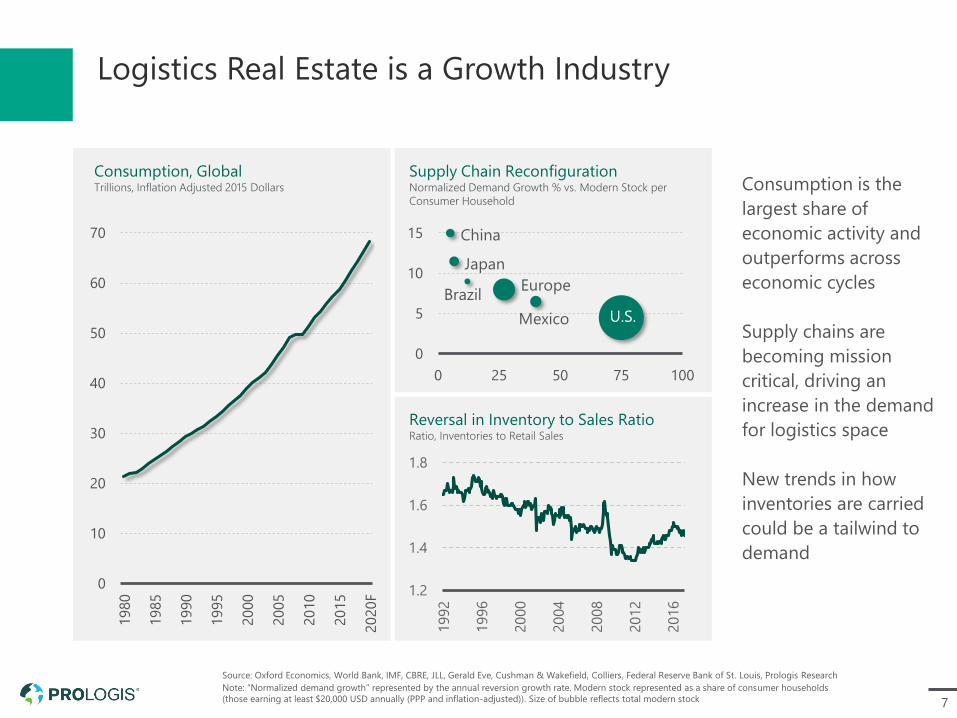
Logistics Real Estate is a Growth Industry
Consumption, GlobalTrillions, Inflation Adjusted 2015 Dollars
Supply Chain ReconfigurationNormalized Demand Growth % vs. Modern Stock per
Consumer Household
Consumption is the
largest share of
economic activity and
outperforms across
economic cycles
Supply chains are
becoming mission
critical, driving an
increase in the demand
for logistics space
New trends in how
inventories are carried
could be a tailwind to
demand
Reversal in Inventory to Sales RatioRatio, Inventories to Retail Sales
1.2
1.4
1.6
1.8
1992
1996
2000
2004
2008
2012
2016
0
10
20
30
40
50
60
70
1980
1985
1990
1995
2000
2005
2010
2015
2020F
0
5
10
15
0 25 50 75 100
U.S.
Europe
Japan
Mexico
Brazil
China
Source: Oxford Economics, World Bank, IMF, CBRE, JLL, Gerald Eve, Cushman & Wakefield, Colliers, Federal Reserve Bank of St. Louis, Prologis Research
Note: “Normalized demand growth” represented by the annual reversion growth rate. Modern stock represented as a share of consumer households
(those earning at least $20,000 USD annually (PPP and inflation-adjusted)). Size of bubble reflects total modern stock
8
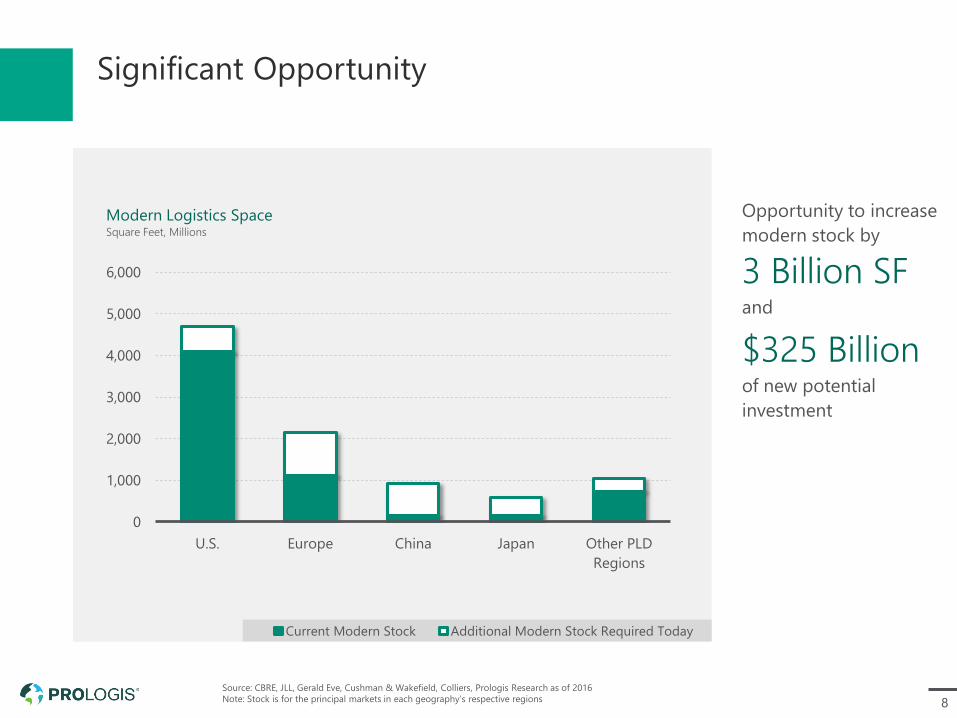
Significant Opportunity
Opportunity to increase
modern stock by
3 Billion SF and
$325 Billion of new potential
investment
0
1,000
2,000
3,000
4,000
5,000
6,000
U.S. Europe China Japan Other PLD
Regions
Current Modern Stock Additional Modern Stock Required Today
Modern Logistics SpaceSquare Feet, Millions
Source: CBRE, JLL, Gerald Eve, Cushman & Wakefield, Colliers, Prologis Research as of 2016
Note: Stock is for the principal markets in each geography’s respective regions
9
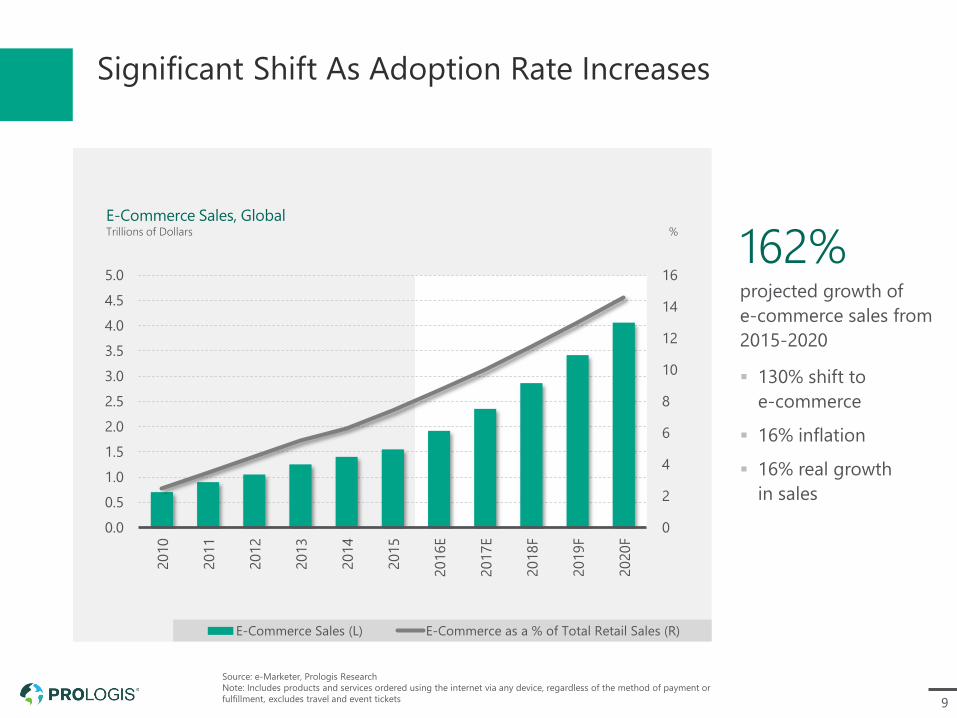
Significant Shift As Adoption Rate Increases
162%projected growth of
e-commerce sales from
2015-2020
▪ 130% shift to
e-commerce
▪ 16% inflation
▪ 16% real growth
in sales
E-Commerce Sales, GlobalTrillions of Dollars %
0
2
4
6
8
10
12
14
16
0.0
0.5
1.0
1.5
2.0
2.5
3.0
3.5
4.0
4.5
5.0
2010
2011
2012
2013
2014
2015
2016E
2017E
2018F
2019F
2020F
E-Commerce Sales (L) E-Commerce as a % of Total Retail Sales (R)
Source: e-Marketer, Prologis Research
Note: Includes products and services ordered using the internet via any device, regardless of the method of payment or
fulfillment, excludes travel and event tickets
10
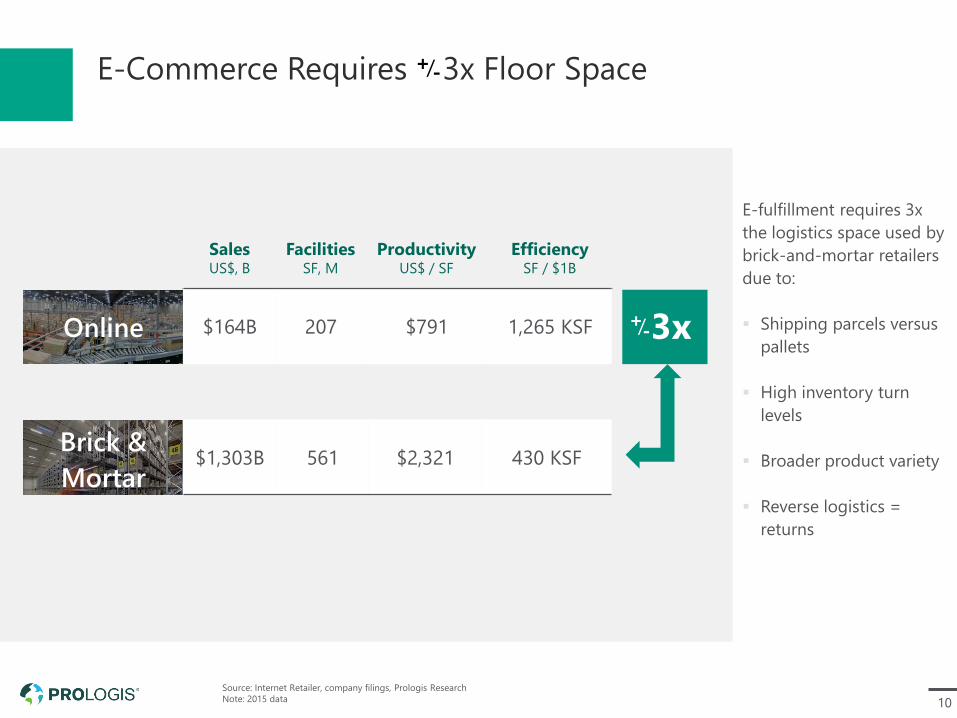
E-Commerce Requires 3x Floor Space+-/
SalesUS$, B
FacilitiesSF, M
ProductivityUS$ / SF
EfficiencySF / $1B
$164B 207 $791 1,265 KSFOnline
Brick &
Mortar $1,303B 561 $2,321 430 KSF
3x+-/
Source: Internet Retailer, company filings, Prologis Research
Note: 2015 data
E-fulfillment requires 3x
the logistics space used by
brick-and-mortar retailers
due to:
▪ Shipping parcels versus
pallets
▪ High inventory turn
levels
▪ Broader product variety
▪ Reverse logistics =
returns
11
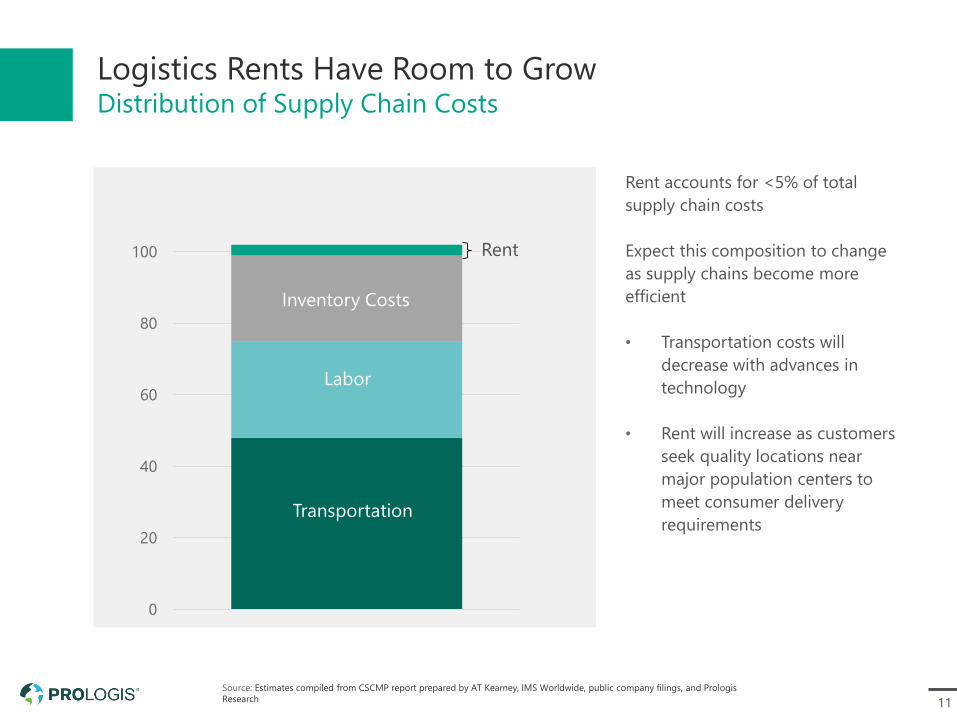
Logistics Rents Have Room to GrowDistribution of Supply Chain Costs
Source: Estimates compiled from CSCMP report prepared by AT Kearney, IMS Worldwide, public company filings, and Prologis
Research
e-commerce
0
20
40
60
80
100
Inventory Costs
Rent accounts for <5% of total
supply chain costs
Expect this composition to change
as supply chains become more
efficient
• Transportation costs will
decrease with advances in
technology
• Rent will increase as customers
seek quality locations near
major population centers to
meet consumer delivery
requirements
Labor
Transportation
Rent
12
Not All E-Commerce Facilities Are New or Large
Source: Prologis Research
140,000 SFaverage unit size for
e-commerce customers
17 yearsaverage building age for
e-commerce customers
Distribution of Leases by Unit Size%, Share of Prologis Portfolio,
Global by Size Category in Thousands SF
Distribution of Leases by Building Age%, Share of Prologis Global Portfolio
Global by Age
E-Commerce Non E-Commerce
0
2
4
6
8
10
12
0 5 10 15 20 25 30 35
0
5
10
15
20
25
10
25
50
100
200
350
500
750
1,0
00
1,2
50
1,5
00
13
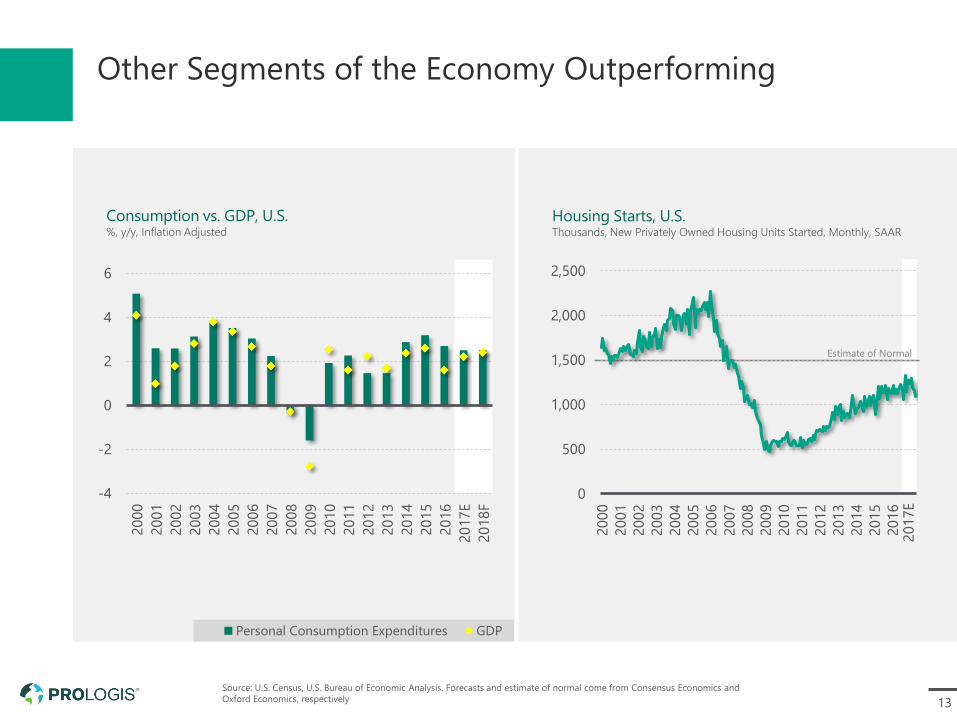
Other Segments of the Economy Outperforming
Source: U.S. Census, U.S. Bureau of Economic Analysis. Forecasts and estimate of normal come from Consensus Economics and
Oxford Economics, respectively
Consumption vs. GDP, U.S.%, y/y, Inflation Adjusted
Housing Starts, U.S.Thousands, New Privately Owned Housing Units Started, Monthly, SAAR
Estimate of Normal
-4
-2
0
2
4
6
2000
2001
2002
2003
2004
2005
2006
2007
2008
2009
2010
2011
2012
2013
2014
2015
2016
2017E
2018F
Personal Consumption Expenditures GDP
0
500
1,000
1,500
2,000
2,500
2000
2001
2002
2003
2004
2005
2006
2007
2008
2009
2010
2011
2012
2013
2014
2015
2016
2017
2017E
14
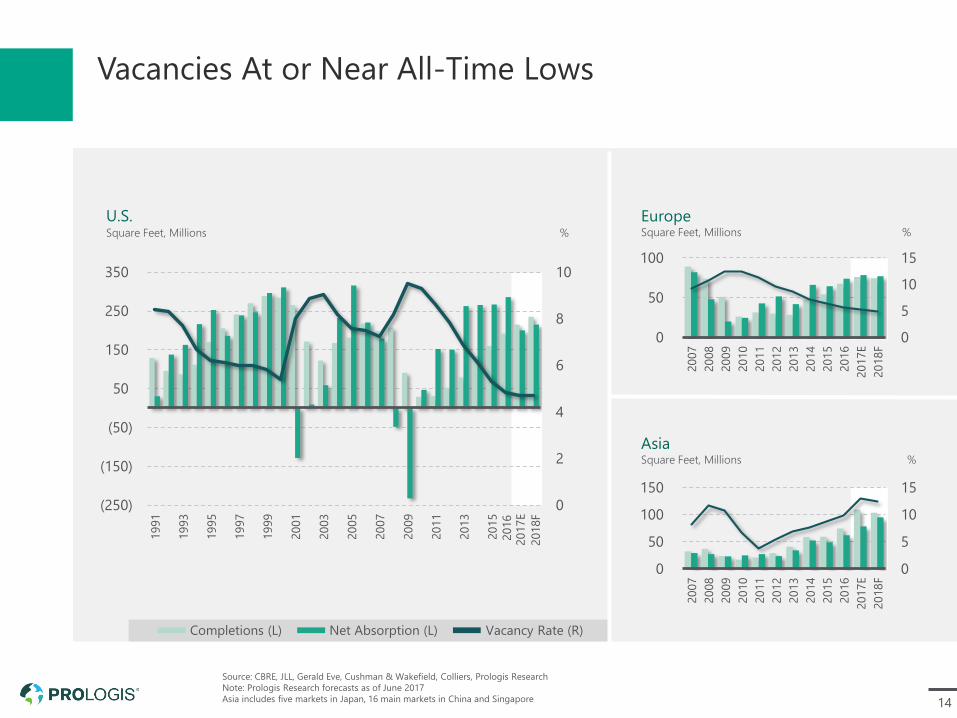
Vacancies At or Near All-Time Lows
U.S.Square Feet, Millions %
EuropeSquare Feet, Millions %
AsiaSquare Feet, Millions %
Completions (L) Net Absorption (L) Vacancy Rate (R)
2016
2018F
Source: CBRE, JLL, Gerald Eve, Cushman & Wakefield, Colliers, Prologis Research
Note: Prologis Research forecasts as of June 2017
Asia includes five markets in Japan, 16 main markets in China and Singapore
0
5
10
15
0
50
100
2007
2008
2009
2010
2011
2012
2013
2014
2015
2016
2017E
2018F
0
5
10
15
0
50
100
150
2007
2008
2009
2010
2011
2012
2013
2014
2015
2016
2017E
2018F
0
2
4
6
8
10
(250)
(150)
(50)
50
150
250
350
1991
1993
1995
1997
1999
2001
2003
2005
2007
2009
2011
2013
2015
2017E
15
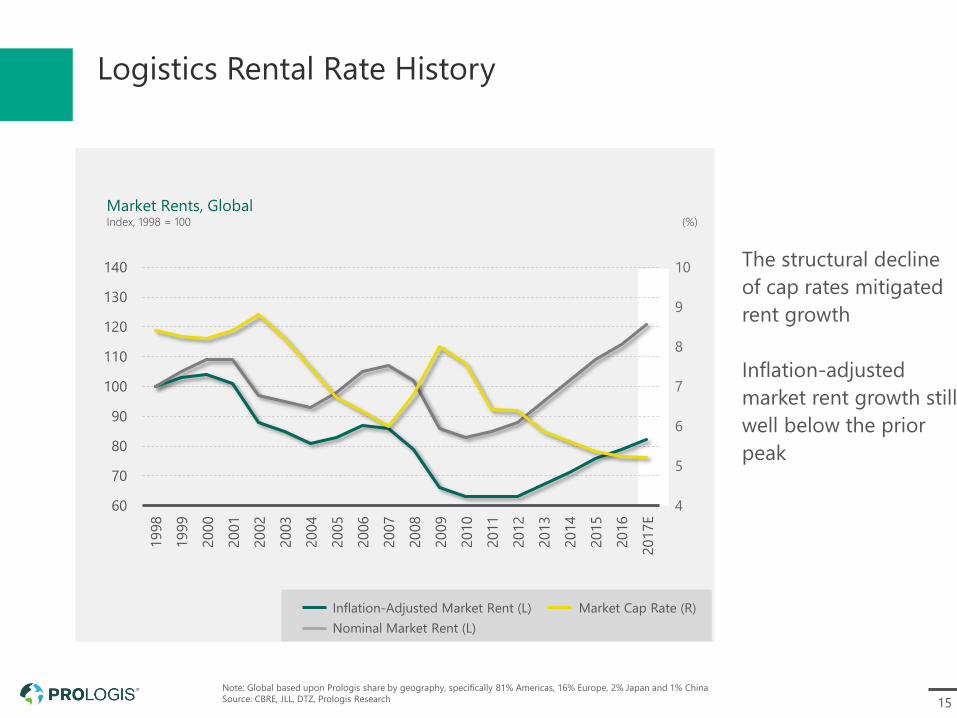
Logistics Rental Rate History
The structural decline
of cap rates mitigated
rent growth
Inflation-adjusted
market rent growth still
well below the prior
peak
Inflation-Adjusted Market Rent (L)
Nominal Market Rent (L)
Market Cap Rate (R)
Market Rents, GlobalIndex, 1998 = 100 (%)
Note: Global based upon Prologis share by geography, specifically 81% Americas, 16% Europe, 2% Japan and 1% China
Source: CBRE, JLL, DTZ, Prologis Research
4
5
6
7
8
9
10
60
70
80
90
100
110
120
130
140
1998
1999
2000
2001
2002
2003
2004
2005
2006
2007
2008
2009
2010
2011
2012
2013
2014
2015
2016
2017E
Section 02
Why Prologis
Prologis Torrance Distribution Center, Torrance, California
17
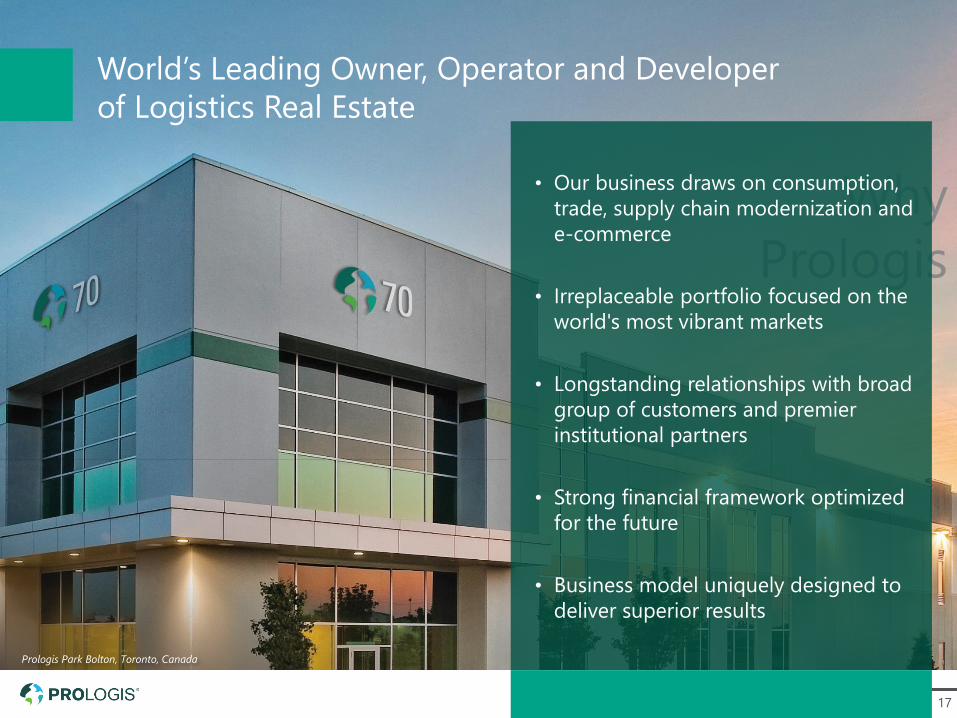
World’s Leading Owner, Operator and Developer
of Logistics Real Estate
Why
Prologis
• Our business draws on consumption,
trade, supply chain modernization and
e-commerce
• Irreplaceable portfolio focused on the
world's most vibrant markets
• Longstanding relationships with broad
group of customers and premier
institutional partners
• Strong financial framework optimized
for the future
• Business model uniquely designed to
deliver superior results
Prologis Park Bolton, Toronto, Canada
18
Prologis at a Glance
1983FOUNDED IN
$72B
ON FOUR CONTINENTS
MSF
NYSE: PLDS&P 500 MEMBER
100MOST SUSTAINABLE CORPORATIONS
GLOBAL
CREDIT RATING OF
A3/A-
684
ASSETS UNDER MANAGEMENT
Note: A securities rating is not a recommendation to buy, sell or hold securities and may be subject to revision or withdrawal at any time
19
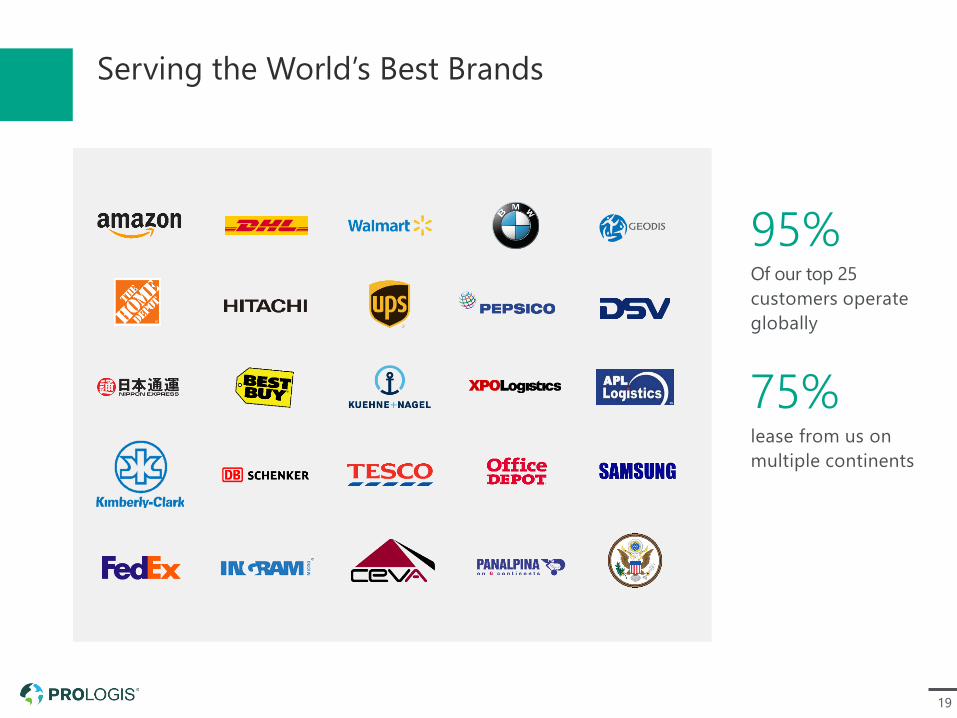
Serving the World’s Best Brands
95%Of our top 25
customers operate
globally
75%lease from us on
multiple continents
20
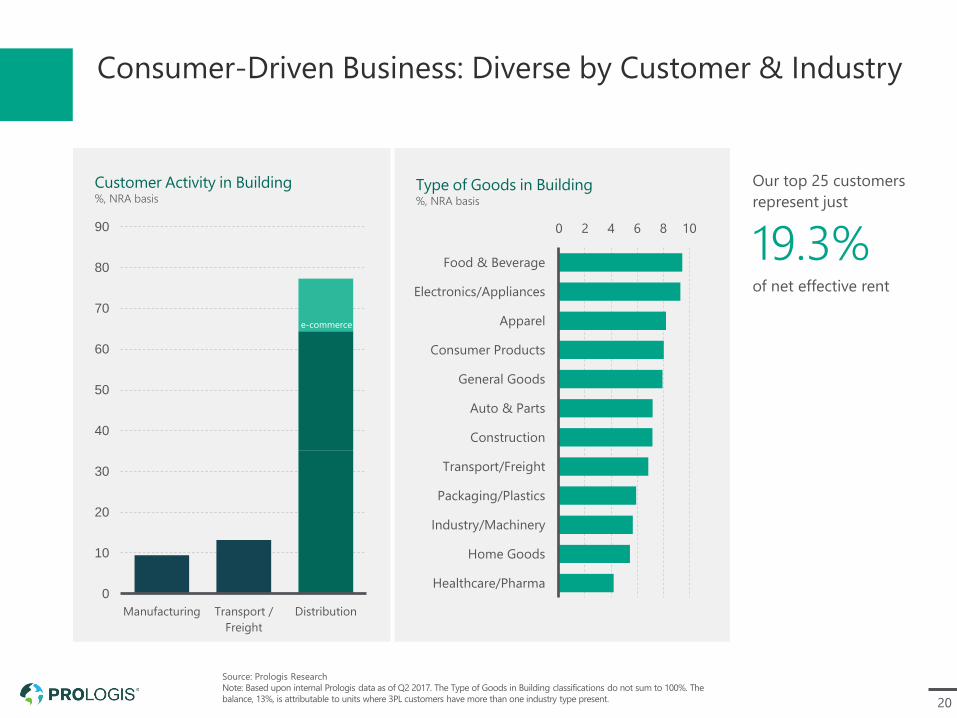
Consumer-Driven Business: Diverse by Customer & Industry
Source: Prologis Research
Note: Based upon internal Prologis data as of Q2 2017. The Type of Goods in Building classifications do not sum to 100%. The
balance, 13%, is attributable to units where 3PL customers have more than one industry type present.
Our top 25 customers
represent just
19.3%of net effective rent
Type of Goods in Building%, NRA basis
Customer Activity in Building%, NRA basis
Healthcare/Pharma
Home Goods
Industry/Machinery
Packaging/Plastics
Transport/Freight
Construction
Auto & Parts
General Goods
Consumer Products
Apparel
Electronics/Appliances
Food & Beverage
0 2 4 6 8 10
Manufacturing Transport /
Freight
Distribution
0
10
20
30
40
50
60
70
80
90
e-commerce
21
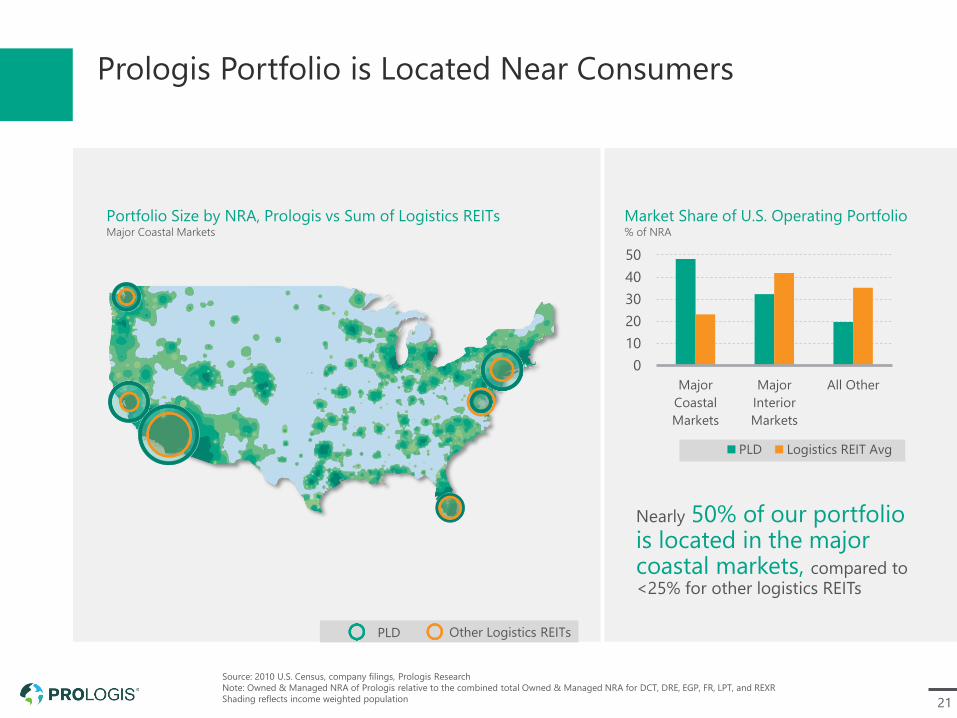
Source: 2010 U.S. Census, company filings, Prologis Research
Note: Owned & Managed NRA of Prologis relative to the combined total Owned & Managed NRA for DCT, DRE, EGP, FR, LPT, and REXR
Shading reflects income weighted population
Prologis Portfolio is Located Near Consumers
Portfolio Size by NRA, Prologis vs Sum of Logistics REITsMajor Coastal Markets
PLD Other Logistics REITs
Market Share of U.S. Operating Portfolio% of NRA
Portfolio Size by NRA, Prologis vs Sum of Logistics REITsMajor Coastal Markets
PLD Other Logistics REITs
Nearly 50% of our portfolio is located in the major coastal markets, compared to <25% for other logistics REITs
Market Share of U.S. Operating Portfolio% of NRA
0
10
20
30
40
50
Major
Coastal
Markets
Major
Interior
Markets
All Other
PLD Logistics REIT Avg
22
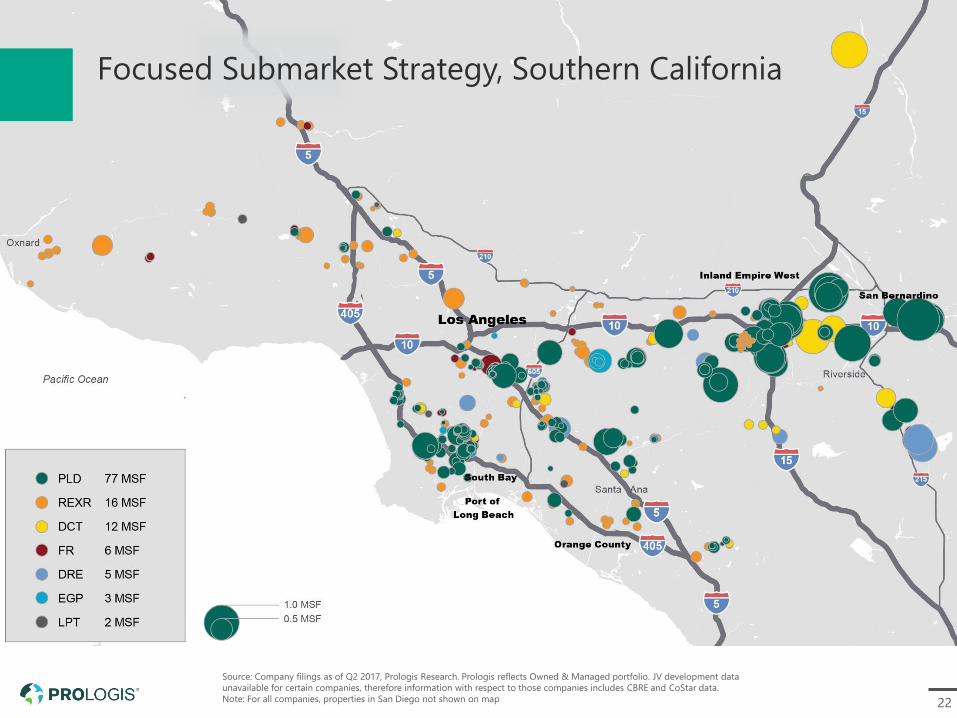
Focused Submarket Strategy, Southern California
Source: Company filings as of Q2 2017, Prologis Research. Prologis reflects Owned & Managed portfolio. JV development data
unavailable for certain companies, therefore information with respect to those companies includes CBRE and CoStar data.
Note: For all companies, properties in San Diego not shown on map
23
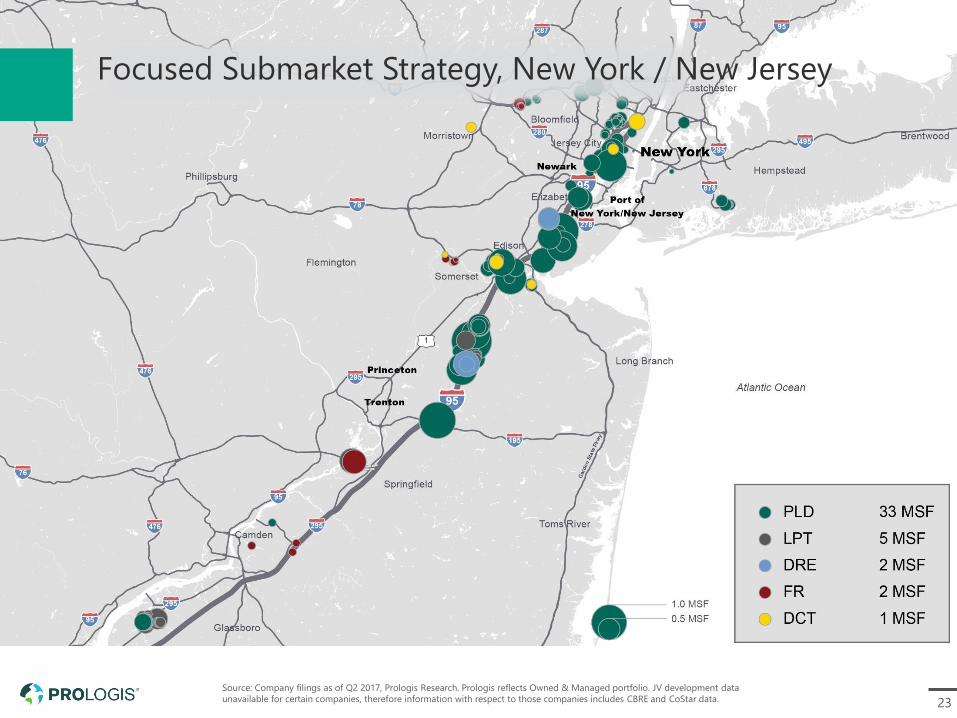
Focused Submarket Strategy, New York / New Jersey
Source: Company filings as of Q2 2017, Prologis Research. Prologis reflects Owned & Managed portfolio. JV development data
unavailable for certain companies, therefore information with respect to those companies includes CBRE and CoStar data.
24
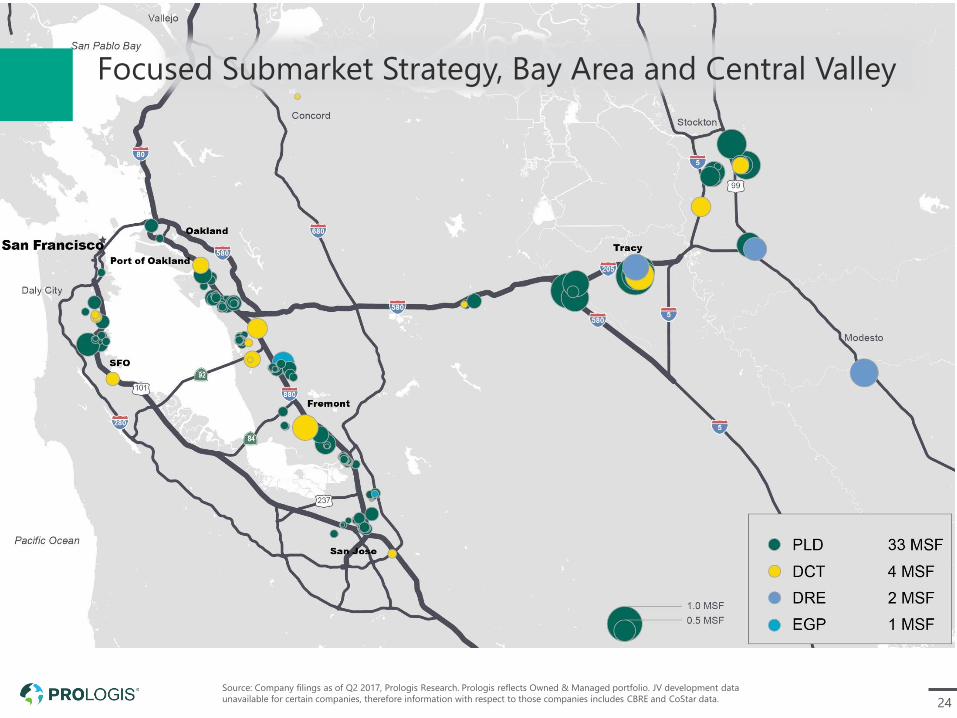
Focused Submarket Strategy, Bay Area and Central Valley
Source: Company filings as of Q2 2017, Prologis Research. Prologis reflects Owned & Managed portfolio. JV development data
unavailable for certain companies, therefore information with respect to those companies includes CBRE and CoStar data.
25
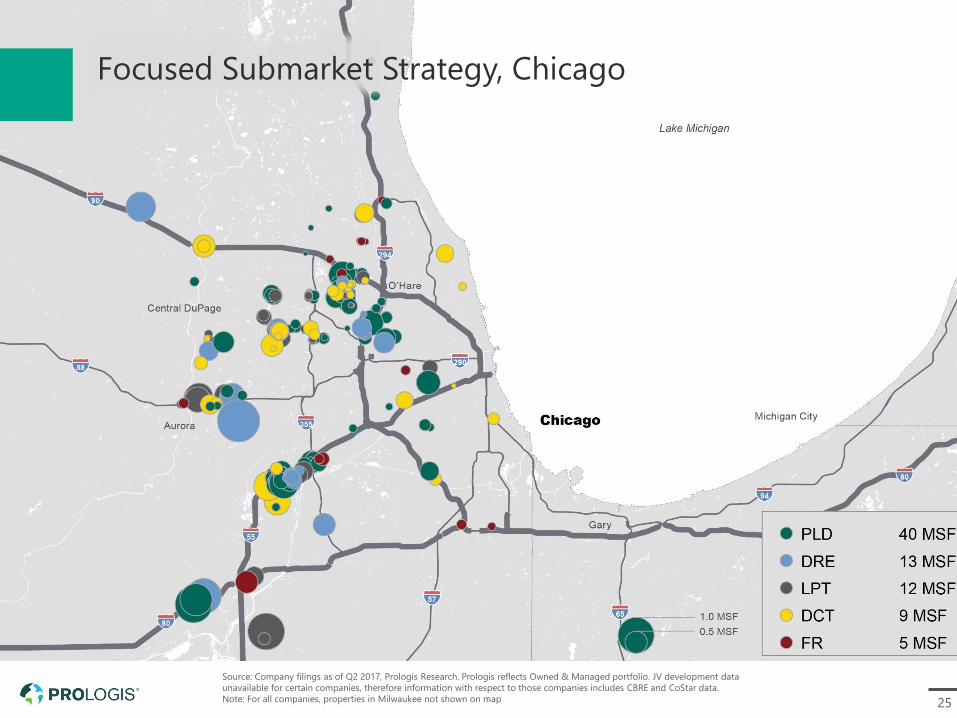
Focused Submarket Strategy, Chicago
Source: Company filings as of Q2 2017, Prologis Research. Prologis reflects Owned & Managed portfolio. JV development data
unavailable for certain companies, therefore information with respect to those companies includes CBRE and CoStar data.
Note: For all companies, properties in Milwaukee not shown on map
26
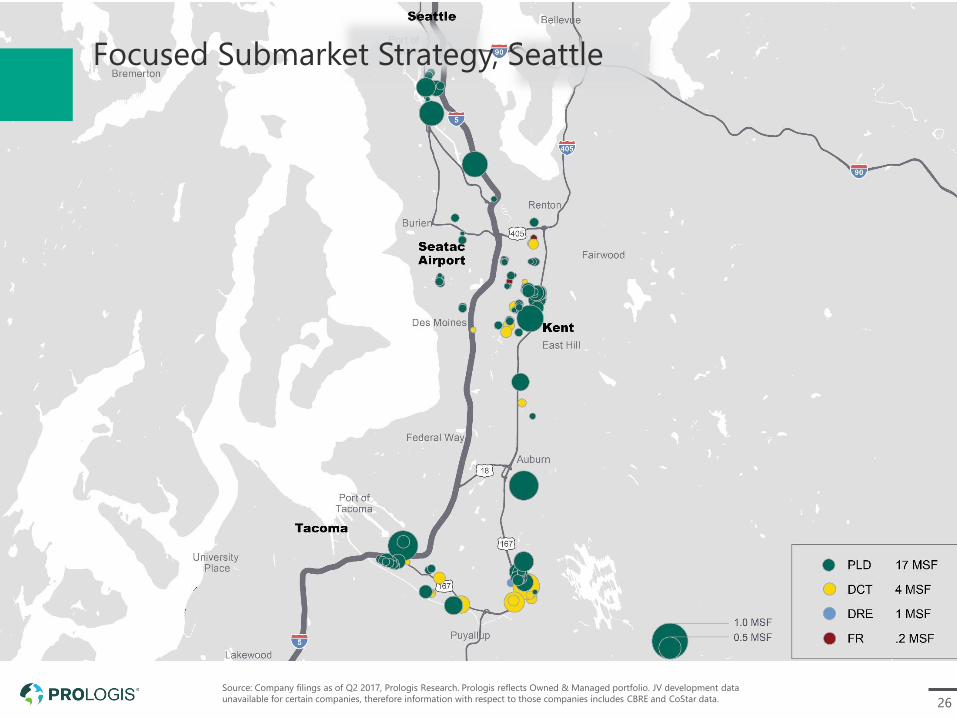
Source: Company filings as of Q2 2017, Prologis Research. Prologis reflects Owned & Managed portfolio. JV development data
unavailable for certain companies, therefore information with respect to those companies includes CBRE and CoStar data.
Focused Submarket Strategy, Seattle
27
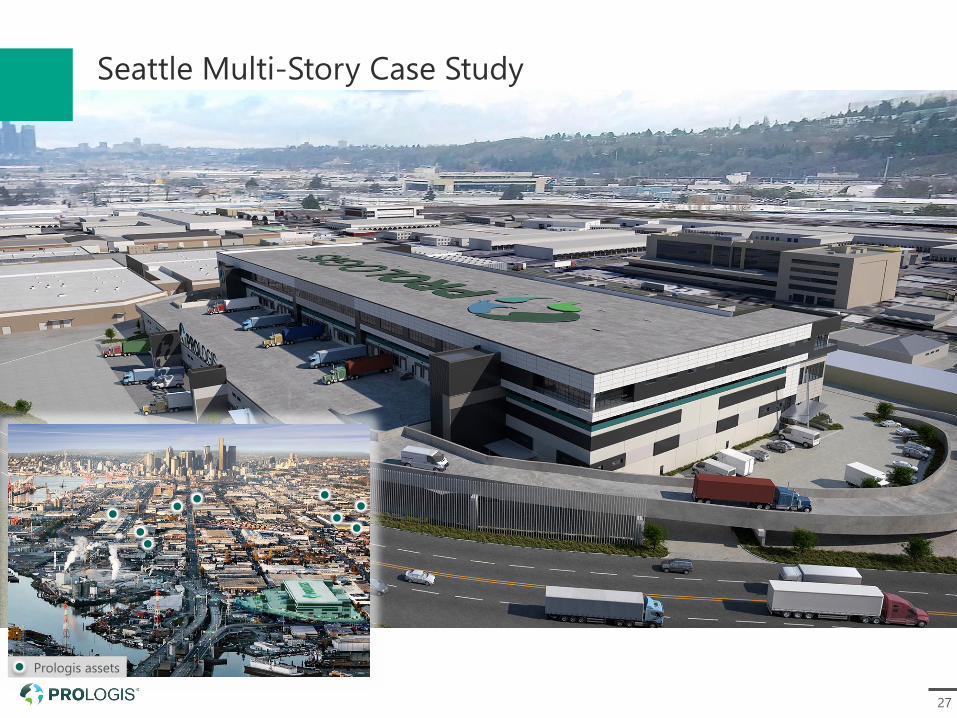
Seattle Multi-Story Case Study
Prologis assets
28
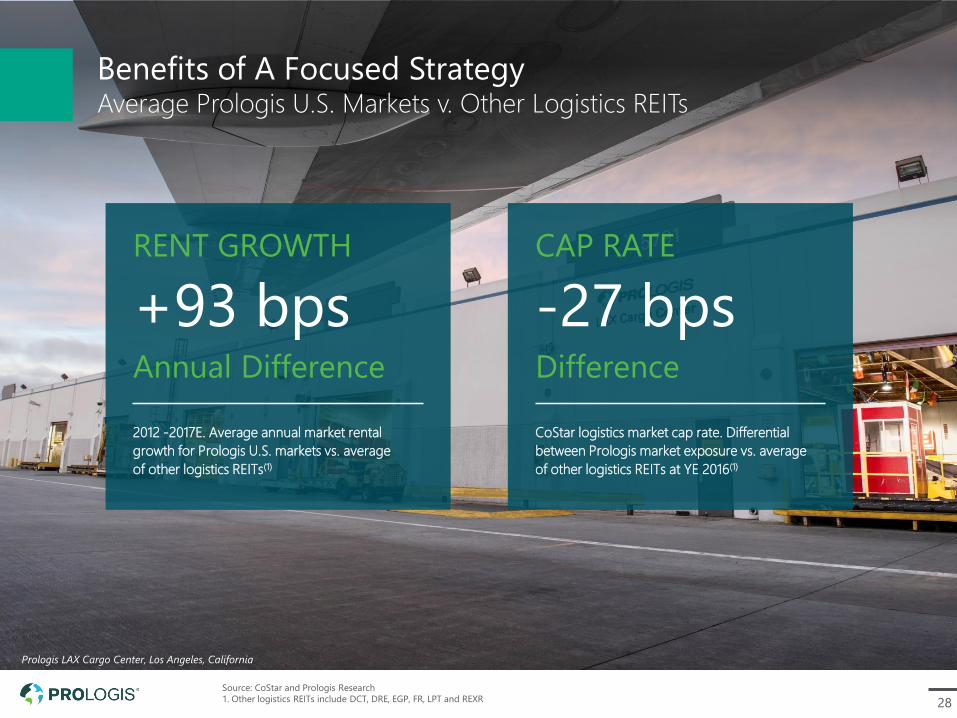
Benefits of A Focused StrategyAverage Prologis U.S. Markets v. Other Logistics REITs
Source: CoStar and Prologis Research
1. Other logistics REITs include DCT, DRE, EGP, FR, LPT and REXR
2012 -2017E. Average annual market rental
growth for Prologis U.S. markets vs. average
of other logistics REITs(1)
CAP RATE
-27 bps Difference
CoStar logistics market cap rate. Differential
between Prologis market exposure vs. average
of other logistics REITs at YE 2016(1)
Prologis LAX Cargo Center, Los Angeles, California
RENT GROWTH
+93 bps Annual Difference
29
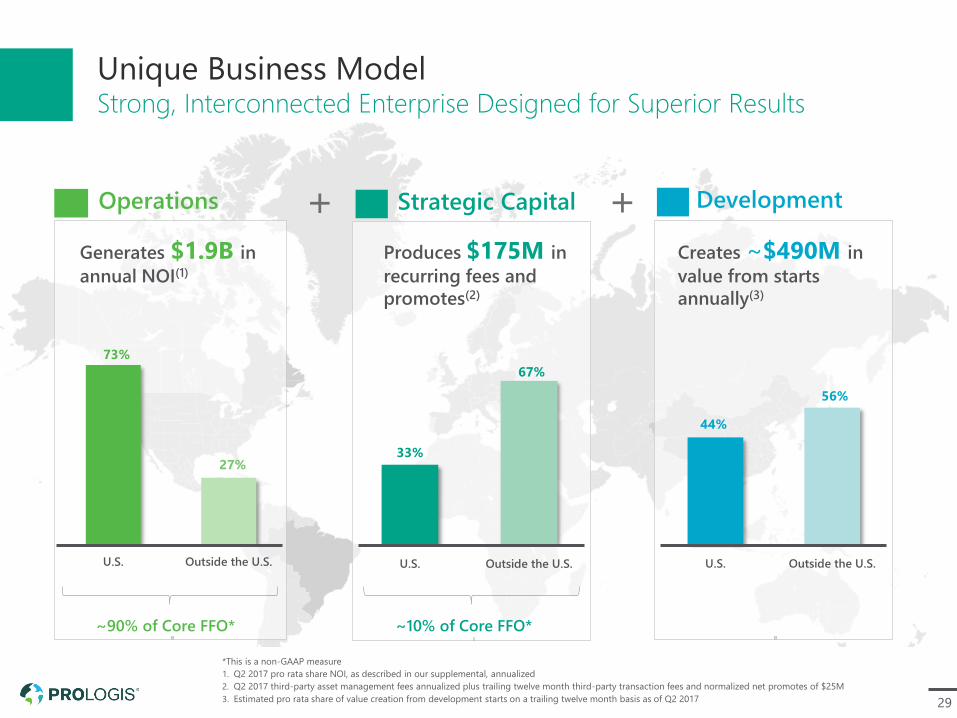
Unique Business ModelStrong, Interconnected Enterprise Designed for Superior Results
*This is a non-GAAP measure
1. Q2 2017 pro rata share NOI, as described in our supplemental, annualized
2. Q2 2017 third-party asset management fees annualized plus trailing twelve month third-party transaction fees and normalized net promotes of $25M
3. Estimated pro rata share of value creation from development starts on a trailing twelve month basis as of Q2 2017
Development
44%
56%
U.S. Outside the U.S.
Creates ~$490M in
value from starts
annually(3)
Operations
73%
27%
U.S. Outside the U.S.
~90% of Core FFO*
Generates $1.9B in
annual NOI(1)
Strategic Capital
33%
67%
U.S. Outside the U.S.
Produces $175M in
recurring fees and
promotes(2)
++
~10% of Core FFO*
30
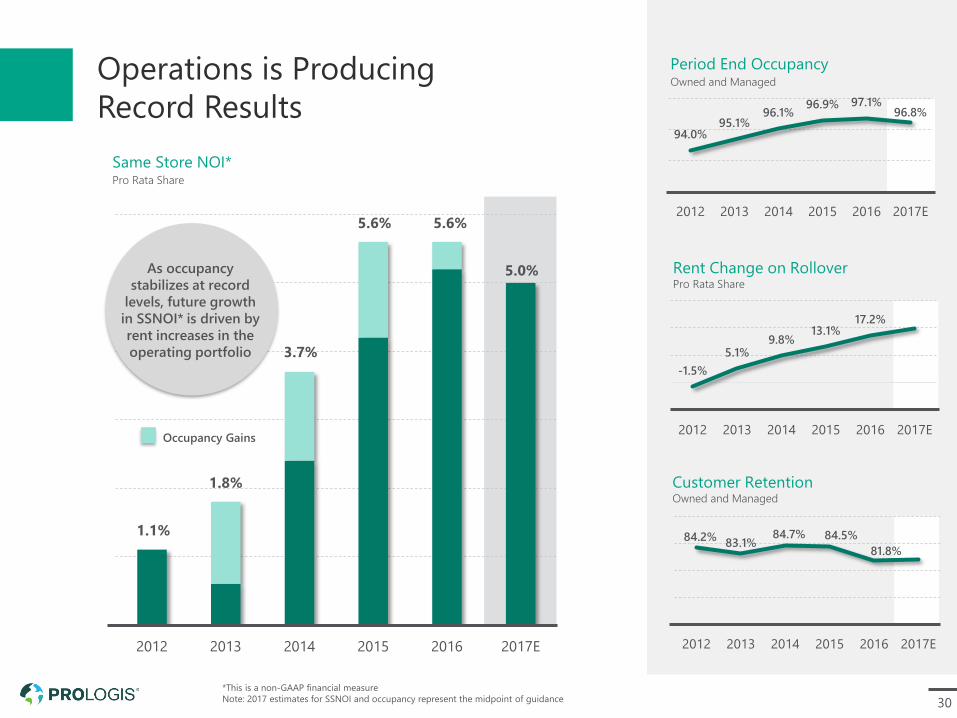
Operations is Producing
Record Results
-1.5%
5.1%9.8%
13.1%17.2%
2012 2013 2014 2015 2016 2017E
Rent Change on RolloverPro Rata Share
Customer RetentionOwned and Managed
Period End OccupancyOwned and Managed
94.0%95.1%
96.1%96.9% 97.1%
2012 2013 2014 2015 2016 2017E
84.2%83.1%
84.7% 84.5%
81.8%
2012 2013 2014 2015 2016 2017E
Same Store NOI*Pro Rata Share
2012 2013 2014 2015 2016 2017E
As occupancy
stabilizes at record
levels, future growth
in SSNOI* is driven by
rent increases in the
operating portfolio
1.8%
1.1%
3.7%
5.6% 5.6%
Occupancy Gains
5.0%
96.8%
*This is a non-GAAP financial measure
Note: 2017 estimates for SSNOI and occupancy represent the midpoint of guidance
31
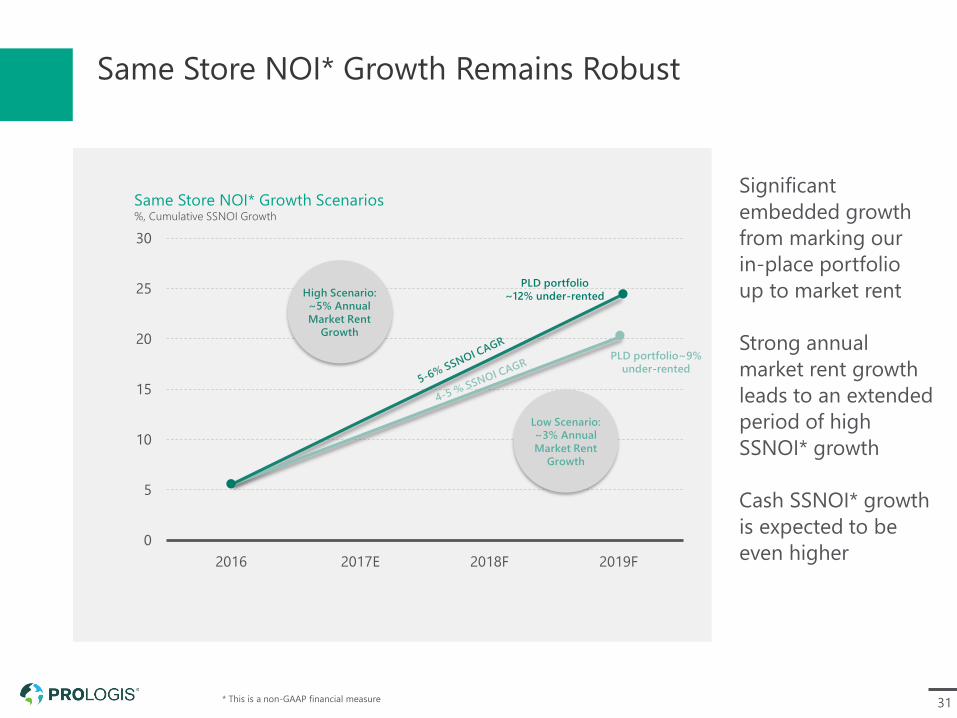
Same Store NOI* Growth Remains Robust
* This is a non-GAAP financial measure
0
5
10
15
20
25
30
2016 2017E 2018F 2019F
High Scenario:
~5% Annual
Market Rent
Growth
Low Scenario:
~3% Annual
Market Rent
Growth
Same Store NOI* Growth Scenarios%, Cumulative SSNOI Growth
Significant
embedded growth
from marking our
in-place portfolio
up to market rent
Strong annual
market rent growth
leads to an extended
period of high
SSNOI* growth
Cash SSNOI* growth
is expected to be
even higher
PLD portfolio~9%
under-rented
PLD portfolio
~12% under-rented
32
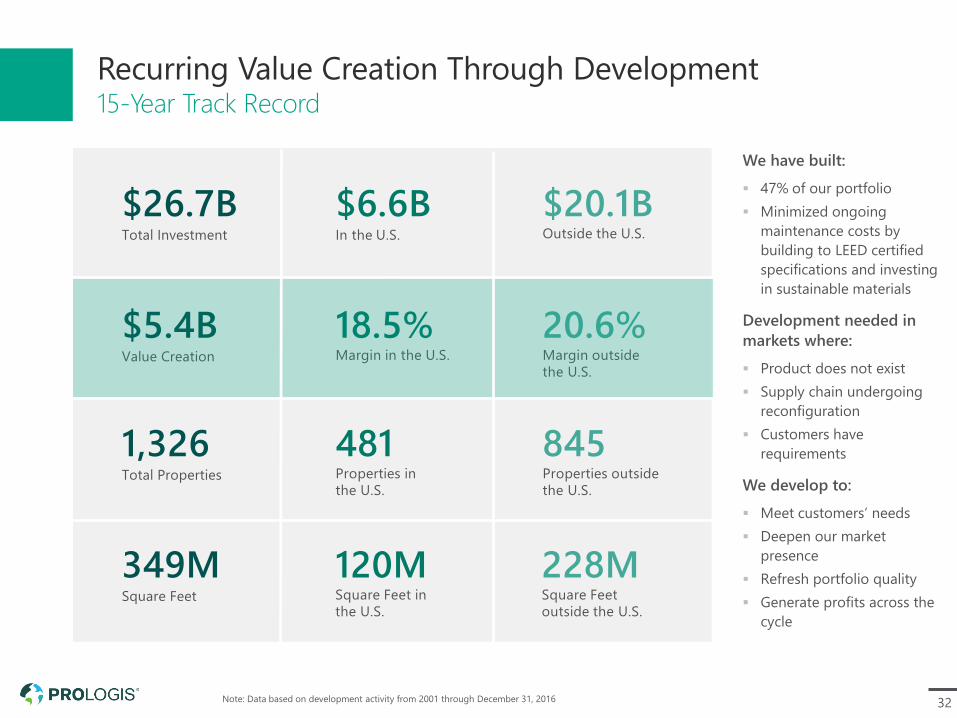
Recurring Value Creation Through Development15-Year Track Record
Note: Data based on development activity from 2001 through December 31, 2016
$20.1BOutside the U.S.
$6.6BIn the U.S.
18.5%Margin in the U.S.
20.6%Margin outside
the U.S.
$26.7BTotal Investment
$5.4BValue Creation
481Properties in
the U.S.
845Properties outside
the U.S.
1,326Total Properties
349MSquare Feet
120MSquare Feet in
the U.S.
228MSquare Feet
outside the U.S.
We have built:
▪ 47% of our portfolio
▪ Minimized ongoing
maintenance costs by
building to LEED certified
specifications and investing
in sustainable materials
Development needed in
markets where:
▪ Product does not exist
▪ Supply chain undergoing
reconfiguration
▪ Customers have
requirements
We develop to:
▪ Meet customers’ needs
▪ Deepen our market
presence
▪ Refresh portfolio quality
▪ Generate profits across the
cycle
33
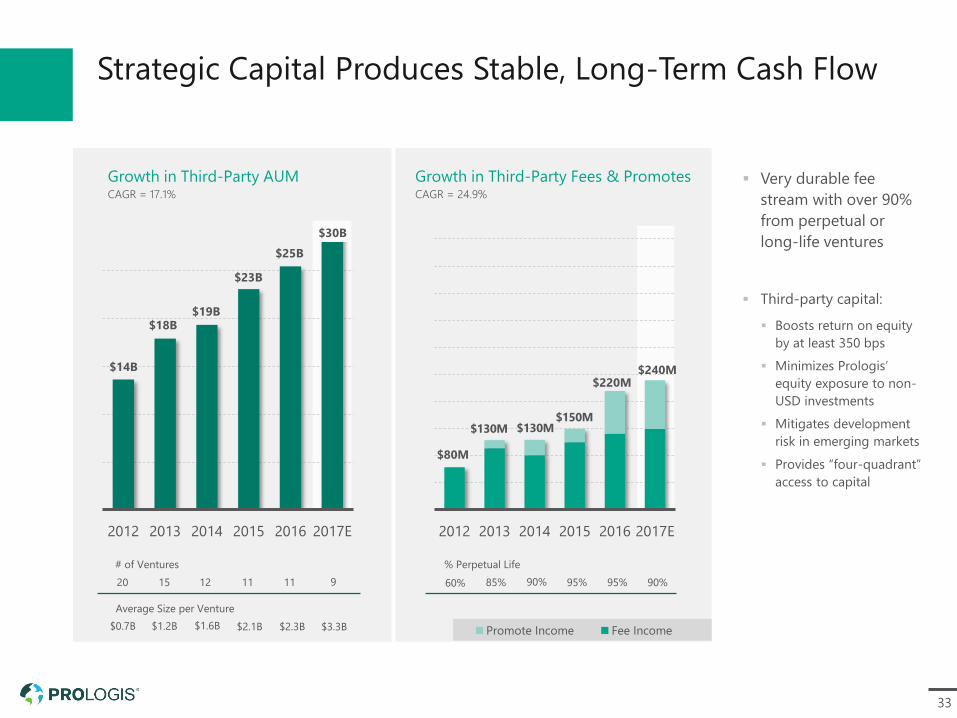
Strategic Capital Produces Stable, Long-Term Cash Flow
Growth in Third-Party Fees & PromotesCAGR = 24.9%
Growth in Third-Party AUMCAGR = 17.1%
▪ Very durable fee
stream with over 90%
from perpetual or
long-life ventures
▪ Third-party capital:
▪ Boosts return on equity
by at least 350 bps
▪ Minimizes Prologis’
equity exposure to non-
USD investments
▪ Mitigates development
risk in emerging markets
▪ Provides “four-quadrant”
access to capital
2012 2013 2014 2015 2016 2017E
$25B
$23B
$19B$18B
$14B
$30B
# of Ventures
20 15 12 11 11
$0.7B $1.2B $1.6B $2.1B $2.3B
Average Size per Venture
9
$3.3B
2012 2013 2014 2015 2016 2017E
Promote Income Fee Income
$130M$150M
$220M
$130M
$80M
$240M
% Perpetual Life
60% 85% 90% 95% 95% 90%
34
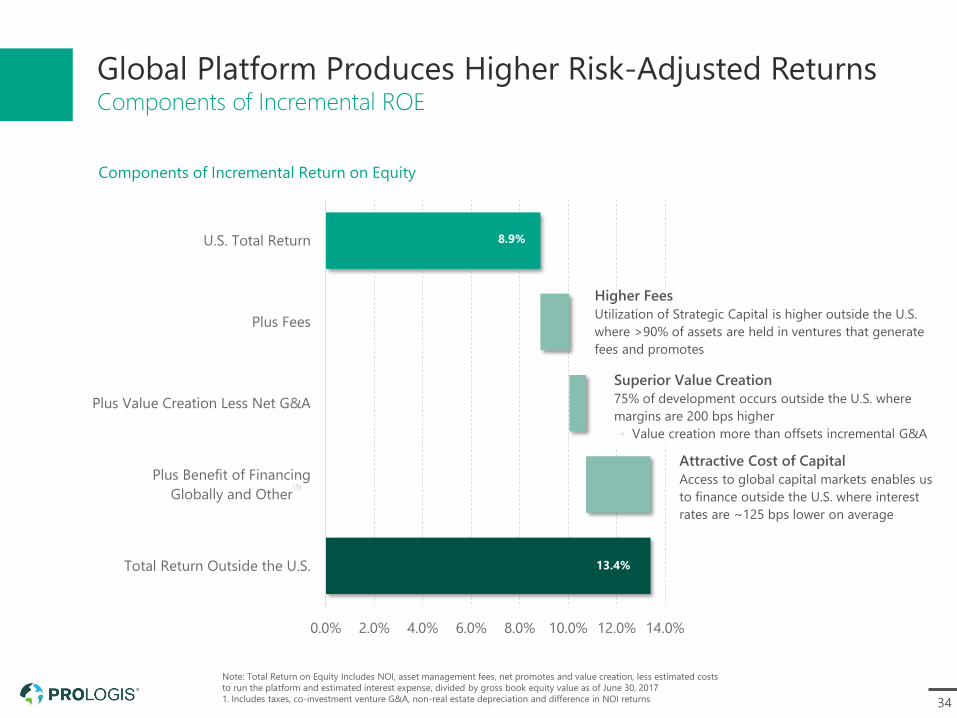
Global Platform Produces Higher Risk-Adjusted ReturnsComponents of Incremental ROE
Note: Total Return on Equity Includes NOI, asset management fees, net promotes and value creation, less estimated costs
to run the platform and estimated interest expense, divided by gross book equity value as of June 30, 2017
1. Includes taxes, co-investment venture G&A, non-real estate depreciation and difference in NOI returns
Components of Incremental Return on Equity
0.0% 2.0% 4.0% 6.0% 8.0% 10.0% 12.0% 14.0%
Total Return Outside the U.S.
Plus Benefit of Financing
Globally and Other
Plus Value Creation Less Net G&A
Plus Fees
U.S. Total Return 8.9%
13.4%
(1)
Higher Fees
Utilization of Strategic Capital is higher outside the U.S.
where >90% of assets are held in ventures that generate
fees and promotes
Attractive Cost of Capital
Access to global capital markets enables us
to finance outside the U.S. where interest
rates are ~125 bps lower on average
Superior Value Creation
75% of development occurs outside the U.S. where
margins are 200 bps higher
• Value creation more than offsets incremental G&A
35
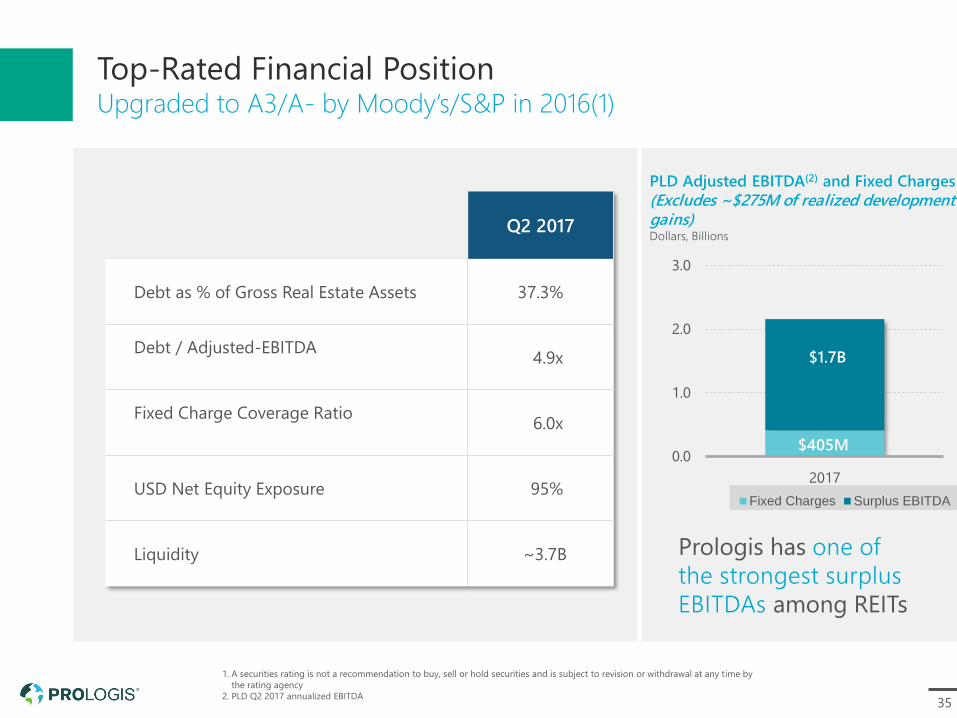
Top-Rated Financial PositionUpgraded to A3/A- by Moody’s/S&P in 2016(1)
Q2 2017
Debt as % of Gross Real Estate Assets 37.3%
Debt / Adjusted-EBITDA4.9x
Fixed Charge Coverage Ratio6.0x
USD Net Equity Exposure 95%
Liquidity ~3.7B
0.0
1.0
2.0
3.0
2017
Fixed Charges Surplus EBITDA
$1.7B
$405M
PLD Adjusted EBITDA(2) and Fixed Charges
(Excludes ~$275M of realized development gains)Dollars, Billions
Prologis has one of
the strongest surplus
EBITDAs among REITs
1. A securities rating is not a recommendation to buy, sell or hold securities and is subject to revision or withdrawal at any time by
the rating agency
2. PLD Q2 2017 annualized EBITDA
36
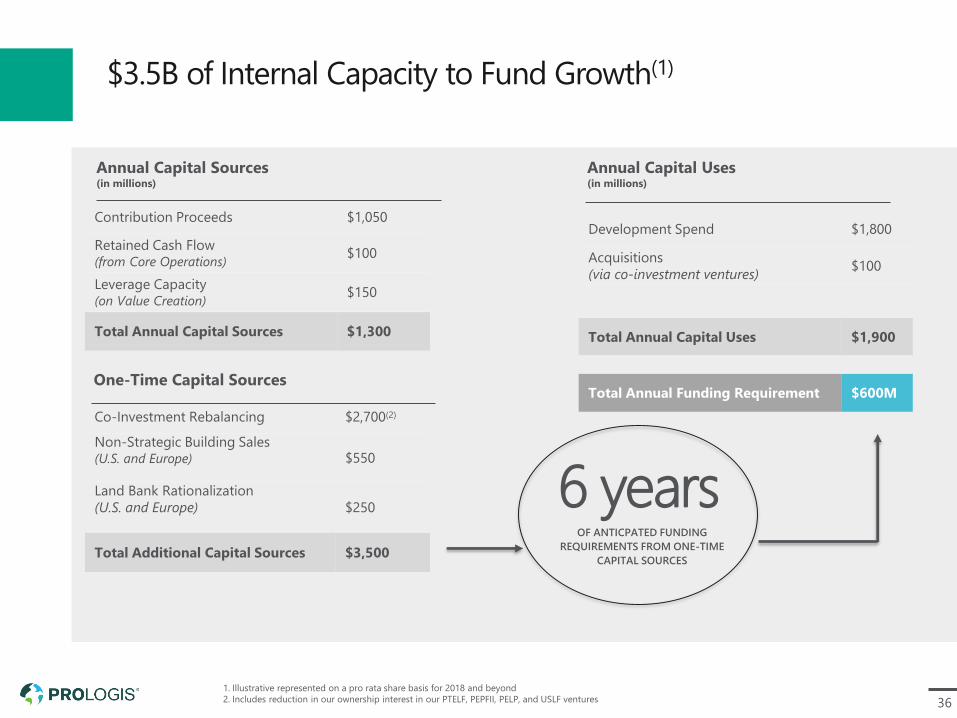
$3.5B of Internal Capacity to Fund Growth(1)
Annual Capital Uses(in millions)
Development Spend $1,800
Acquisitions
(via co-investment ventures)$100
Total Annual Capital Uses $1,900
Total Annual Funding Requirement $600M
Annual Capital Sources(in millions)
Contribution Proceeds $1,050
Retained Cash Flow (from Core Operations)
$100
Leverage Capacity (on Value Creation)
$150
Total Annual Capital Sources $1,300
6 years
One-Time Capital Sources
Co-Investment Rebalancing $2,700(2)
Non-Strategic Building Sales(U.S. and Europe) $550
Land Bank Rationalization
(U.S. and Europe) $250
Total Additional Capital Sources $3,500
OF ANTICPATED FUNDING
REQUIREMENTS FROM ONE-TIME
CAPITAL SOURCES
1. Illustrative represented on a pro rata share basis for 2018 and beyond
2. Includes reduction in our ownership interest in our PTELF, PEPFII, PELP, and USLF ventures
37
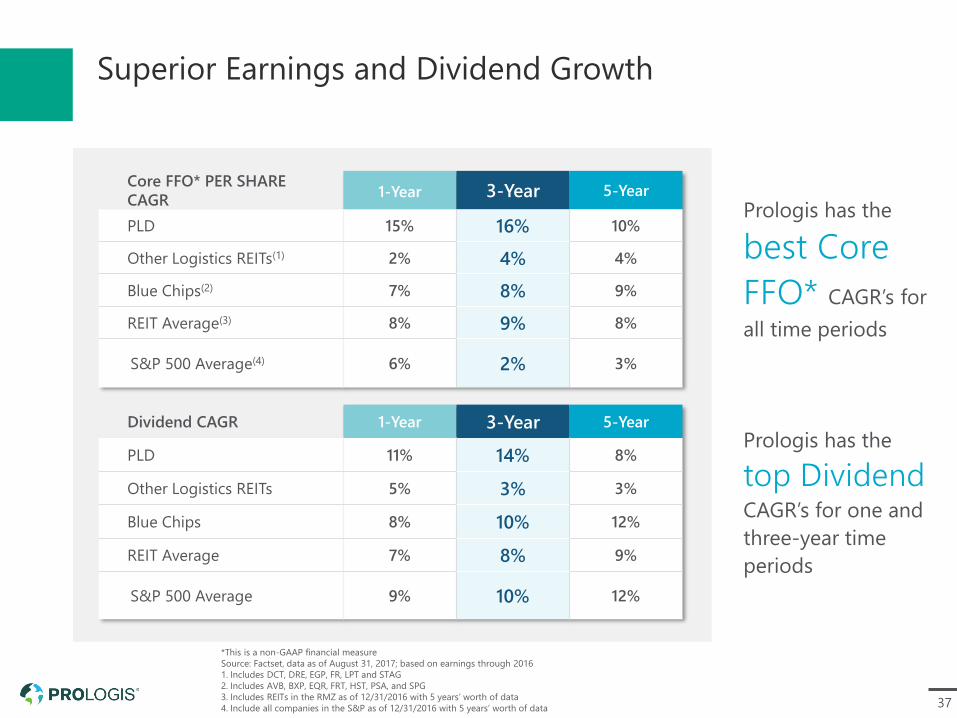
Superior Earnings and Dividend Growth
*This is a non-GAAP financial measure
Source: Factset, data as of August 31, 2017; based on earnings through 2016
1. Includes DCT, DRE, EGP, FR, LPT and STAG
2. Includes AVB, BXP, EQR, FRT, HST, PSA, and SPG
3. Includes REITs in the RMZ as of 12/31/2016 with 5 years’ worth of data
4. Include all companies in the S&P as of 12/31/2016 with 5 years’ worth of data
Prologis has the
best Core
FFO* CAGR’s for
all time periods
Prologis has the
top DividendCAGR’s for one and
three-year time
periods
Core FFO* PER SHARE
CAGR1-Year 3-Year 5-Year
PLD 15% 16% 10%
Other Logistics REITs(1) 2% 4% 4%
Blue Chips(2) 7% 8% 9%
REIT Average(3) 8% 9% 8%
S&P 500 Average(4) 6% 2% 3%
Dividend CAGR 1-Year 3-Year 5-Year
PLD 11% 14% 8%
Other Logistics REITs 5% 3% 3%
Blue Chips 8% 10% 12%
REIT Average 7% 8% 9%
S&P 500 Average 9% 10% 12%
Silicon Valley Logistics Park, Fremont, CA
Why
Prologis Now
Section 03
39
Illustrative Three-Year Total Return Potential
* This is a non-GAAP financial measure
1. Net Effective; expect Cash SSNOI to be higher
2. Based on a number of assumptions that Prologis believes to be reasonable; however, no assurance can be made that Prologis’
expectations will be attained and there actual outcomes and results may differ materially
ADDITIONAL GROWTH DRIVERS:
• Customer Experience
• Procurement, Ancillary
Revenues and Services
• Advanced Analytics
• Continuous Improvement
• Inclusion + Diversity
Global platform enables us to allocate capital
opportunistically and capture a disproportionate
share of profitable development opportunities
SSNOI*(1)
Midpoint of Low & High Scenario
4.5%-5.5%
1.5%Yield on Value
Creation
1.8%Platform Leverage
7.5-8.75%Core FFO* Growth
3.0%Dividend Yield
10.5%-11.75%Annual Total Return(2)
0.3%Assumed Interest
Rate Expansion
Conservative expectation for interest rate
expansion will be a slight drag
Scale will drive efficiency
• Ability to grow NOI and fees without increasing costs
• Balance sheet continues to strengthen
Expect to deliver sector-leading same store growth
• Superior rent growth from market selection and infill focus
• Significant embedded upside from rolling current rents in our
portfolio to market
40
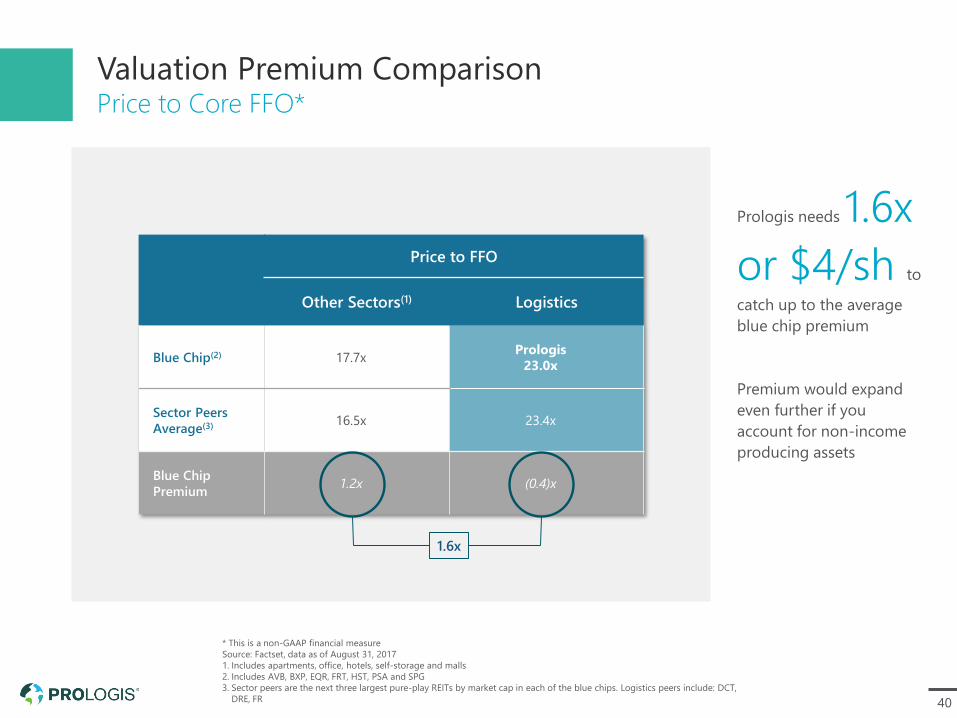
Valuation Premium ComparisonPrice to Core FFO*
* This is a non-GAAP financial measure
Source: Factset, data as of August 31, 2017
1. Includes apartments, office, hotels, self-storage and malls
2. Includes AVB, BXP, EQR, FRT, HST, PSA and SPG
3. Sector peers are the next three largest pure-play REITs by market cap in each of the blue chips. Logistics peers include: DCT,
DRE, FR
Prologis needs 1.6x
or $4/sh to
catch up to the average
blue chip premium
Premium would expand
even further if you
account for non-income
producing assets
Price to FFO
Other Sectors(1) Logistics
Blue Chip(2) 17.7xPrologis
23.0x
Sector Peers
Average(3) 16.5x 23.4x
Blue Chip
Premium1.2x (0.4)x
1.6x
41
Location and Quality Matters
Going forward it’s all about Same Store
NOI growth and value creation
Prologis has superior organic and
external growth potential

Title Goes Here