Bank of America Merrill Lynch 2016 Global Metals, Mining & Steel Conference
39
BANK OF AMERICA MERRILL LYNCH 2016 GLOBAL METALS, MINING & STEEL CONFERENCE MAY 2016
-
Upload
agnico-eagle-mines -
Category
Documents
-
view
3.362 -
download
1
Transcript of Bank of America Merrill Lynch 2016 Global Metals, Mining & Steel Conference

BANK OF AMERICA MERRILL LYNCH 2016 GLOBAL METALS, MINING & STEEL CONFERENCE
MAY 2016

AGNICO EAGLE | BAML 2016 GLOBAL METALS, MINING & STEEL CONFERENCE | 2
Forward Looking Statements The information in this presentation has been prepared by Agnico Eagle Mines Limited (“Agnico Eagle” or the “Company”) as at May 6, 2016. Certain statements contained in this document constitute “forward-looking statements” within the meaning of the United States Private Securities Litigation Reform Act of 1995 and “forward-looking information” under the provisions of Canadian provincial securities laws and are referred to herein as “forward-looking statements”. When used in this document, the words “anticipate”, “estimate”, “expect”, “forecast”, “planned”, “will”, “could”, “potential” and similar expressions are intended to identify forward-looking statements. Such statements include without limitation: the Company's forward-looking production guidance, including estimated ore grades, project timelines, drilling results, metal production, life of mine estimates, production, total cash costs per ounce, minesite costs per tonne; all-in sustaining costs per ounce and cash flows; the estimated timing and conclusions of technical reports and other studies; the methods by which ore will be extracted or processed; statements concerning expansion projects, recovery rates, mill throughput, optimization and projected exploration expenditures, including costs and other estimates upon which such projections are based; estimates of depreciation expense, general and administrative expense and tax rates; the impact of maintenance shutdowns; statements regarding timing and amounts of capital expenditures and other assumptions; estimates of future mineral reserves, mineral resources, mineral production, optimization efforts and sales; estimates of mine life; estimates of future mining costs, total cash costs per ounce, minesite costs per tonne, all-in sustaining costs per ounce and other expenses; estimates of future capital expenditures and other cash needs, and expectations as to the funding thereof; statements and information as to the projected development of certain ore deposits, including estimates of exploration, development and production and other capital costs, and estimates of the timing of such exploration, development and production or decisions with respect to such exploration, development and production; estimates of mineral reserves and mineral resources, and statements and information regarding anticipated future exploration; the anticipated timing of events with respect to the Company’s mine sites and statements and information regarding the sufficiency of the Company’s cash resources and other statements and information regarding anticipated trends with respect to the Company's operations, exploration and the funding thereof. Such statements and information reflect the Company’s views as at the date of this document and are subject to certain risks, uncertainties and assumptions, and undue reliance should not be placed on such statements and information. Forward-looking statements are necessarily based upon a number of factors and assumptions that, while considered reasonable by Agnico Eagle as of the date of such statements, are inherently subject to significant business, economic and competitive uncertainties and contingencies. The material factors and assumptions used in the preparation of the forward-looking statements contained herein, which may prove to be incorrect, include, but are not limited to, the assumptions set forth herein and in management's discussion and analysis (“MD&A”) and the Company's Annual Information Form (“AIF”) for the year ended December 31, 2015 filed with Canadian securities regulators and that are included in its Annual Report on Form 40-F for the year ended December 31, 2015 (“Form 40-F”) filed with the U.S. Securities and Exchange Commission (the “SEC”) as well as: that there are no significant disruptions affecting operations; that production, permitting and expansion at each of Agnico Eagle's properties proceeds on a basis consistent with current expectations and plans; that the relevant metals prices, exchange rates and prices for key mining and construction supplies will be consistent with Agnico Eagle's expectations; that Agnico Eagle's current estimates of mineral reserves, mineral resources, mineral grades and metal recovery are accurate; that there are no material delays in the timing for completion of ongoing growth projects; that the Company's current plans to optimize production are successful; and that there are no material variations in the current tax and regulatory environment. Many factors, known and unknown could cause the actual results to be materially different from those expressed or implied by such forward-looking statements and information. Such risks include, but are not limited to: the volatility of prices of gold and other metals; uncertainty of mineral reserves, mineral resources, mineral grades and mineral recovery estimates; uncertainty of future production, project development, capital expenditures, and other costs; currency fluctuations; financing of additional capital requirements; cost of exploration and development programs; mining risks; community protests; risks associated with foreign operations; governmental and environmental regulation; the volatility of the Company’s stock price; and risks associated with the Company’s currency, fuel and by-product metal derivative strategies. For a more detailed discussion of such risks and other factors that may affect the Company’s ability to achieve the expectations set forth in the forward-looking statements contained in this document, see the AIF and MD&A filed on SEDAR at www.sedar.com and included in the Form 40-F filed on EDGAR at www.sec.gov, as well as the Company’s other filings with the Canadian securities regulators and the SEC. Other than as required by law, the Company does not intend, and does not assume any obligation, to update these forward-looking statements and information. For a detailed breakdown of the Company’s mineral reserve and mineral resource position see the Company’s press release dated February 10, 2016.

AGNICO EAGLE | BAML 2016 GLOBAL METALS, MINING & STEEL CONFERENCE | 3
Notes to Investors
Note Regarding the Use of Non-GAAP Financial Measures
This presentation discloses certain measures, including ‘‘total cash costs per ounce’’, ‘‘minesite costs per tonne’’ and “all-in sustaining costs per ounce” that are not recognized measures under IFRS. This data may not be comparable to data presented by other gold producers. For a reconciliation of these measures to the most directly comparable financial information presented in the consolidated financial statements prepared in accordance with IFRS and for an explanation of how management uses these measures, see “Non-GAAP Financial Performance Measures” in the MD&A filed on SEDAR at www.sedar.com and included in the Form 6-K filed on EDGAR at www.sec.gov, as well as the Company’s other filings with the Canadian securities regulators and the SEC. Total cash costs per ounce of gold produced is presented on both a by-product basis (deducting by-product metal revenues from production costs) and co-product basis (before by-product metal revenues). Total cash costs per ounce of gold produced on a by-product basis is calculated by adjusting production costs as recorded in the consolidated statements of income (loss) for by-product revenues, unsold concentrate inventory production costs, smelting, refining and marketing charges and other adjustments, and then dividing by the number of ounces of gold produced. Total cash costs per ounce of gold produced on a co-product basis is calculated in the same manner as total cash costs per ounce of gold produced on a by-product basis except that no adjustment is made for by-product metal revenues. Accordingly, the calculation of total cash costs per ounce of gold produced on a co-product basis does not reflect a reduction in production costs or smelting, refining and marketing charges associated with the production and sale of by-product metals. Total cash costs per ounce of gold produced is intended to provide information about the cash generating capabilities of the Company’s mining operations. Management also uses these measures to monitor the performance of the Company’s mining operations. As market prices for gold are quoted on a per ounce basis, using the total cash costs per ounce of gold produced on a by-product basis measure allows management to assess a mine’s cash generating capabilities at various gold prices. All-in sustaining costs per ounce is used to show the full cost of gold production from current operations. The Company calculates all-in sustaining costs per ounce of gold produced on a by-product basis as the aggregate of total cash costs per ounce on a by-product basis, sustaining capital expenditures (including capitalized exploration), general and administrative expenses (including stock options) and reclamation expenses divided by the amount of gold produced. The all-in sustaining costs per ounce of gold produced on a co-product basis is calculated in the same manner as the all-in sustaining costs per ounce of gold produced on a by-product basis except that the total cash costs per ounce on a co-product basis is used, meaning no adjustment is made for by-product metal revenues. The Company's methodology for calculating all-in sustaining costs per ounce may differ from to the methodology used by other producers that disclose all-in sustaining costs per ounce. The Company may change the methodology it uses to calculate all-in sustaining costs per ounce in the future, including in response to the adoption of formal industry guidance regarding this measure by the World Gold Council. Management is aware that these per ounce measures of performance can be affected by fluctuations in exchange rates and, in the case of total cash costs per ounce of gold produced on a by-product basis, by-product metal prices. Management compensates for these inherent limitations by using these measures in conjunction with minesite costs per tonne (discussed below) as well as other data prepared in accordance with IFRS. Management also performs sensitivity analyses in order to quantify the effects of fluctuating exchange rates and metal prices. This presentation also contains information as to estimated future total cash costs per ounce, all-in sustaining costs per ounce and minesite costs per tonne. The estimates are based upon the total cash costs per ounce, all-in sustaining costs per ounce and minesite costs per tonne that the Company expects to incur to mine gold at its mines and projects and, consistent with the reconciliation of these actual costs referred to above, do not include production costs attributable to accretion expense and other asset retirement costs, which will vary over time as each project is developed and mined. It is therefore not practicable to reconcile these forward-looking non-GAAP financial measures to the most comparable IFRS measure.
Note Regarding Production Guidance
The gold production guidance is based on the Company’s mineral reserves but includes contingencies and assumes metal prices and foreign exchange rates that are different from those used in the mineral reserve estimates. These factors and others mean that the gold production guidance presented in this presentation does not reconcile exactly with the production models used to support these mineral reserves.

AGNICO EAGLE | BAML 2016 GLOBAL METALS, MINING & STEEL CONFERENCE | 4
Agnico Eagle Strategic Plan – Positioning for Next Growth Phase
Pipeline Performance People
Build a Growing, High Quality, Low Risk, Sustainable Business
• Optimize existing mines and projects
• Increase quality of mineral reserves and mineral resources
• Maximize net free cash flow per share
• Enhance financial flexibility and balance sheet strength
• Maintain high standards for health and safety and community development
Deliver on Growth Expectations
• Discover quality gold deposits through a consistent investment in exploration
• Acquire early stage, high potential gold deposits
• Develop growth opportunities at existing operations
Build and Maintain a High Quality Project Pipeline
• Develop next generation of leaders
• Provide opportunities for career development
• Expand training and development programs
• Strengthen mindset to promote decision making, engagement and accountability
Develop our People

AGNICO EAGLE | BAML 2016 GLOBAL METALS, MINING & STEEL CONFERENCE | 5
Quarterly gold production – Payable gold production in Q1 2016 was 411,336 ozs of gold at total cash costs of $573/oz and all-in sustaining costs (“AISC”) of $797/oz
Strong operational performance at Mexican operations - In Q1 2016, payable gold production was 87,899 ozs at the Company’s Mexican mines. Silver production was a new quarterly record of 752 Kozs. Total cash costs averaged $364/oz at the Mexican operations
2016 production now expected to be at the high end of guidance – 2016 production expected to be at the high end of the guidance range of approximately 1.525 to 1.565 Mozs of gold with total cash costs of between $590/oz to $630/oz and AISC of approximately $850/oz to $890/oz
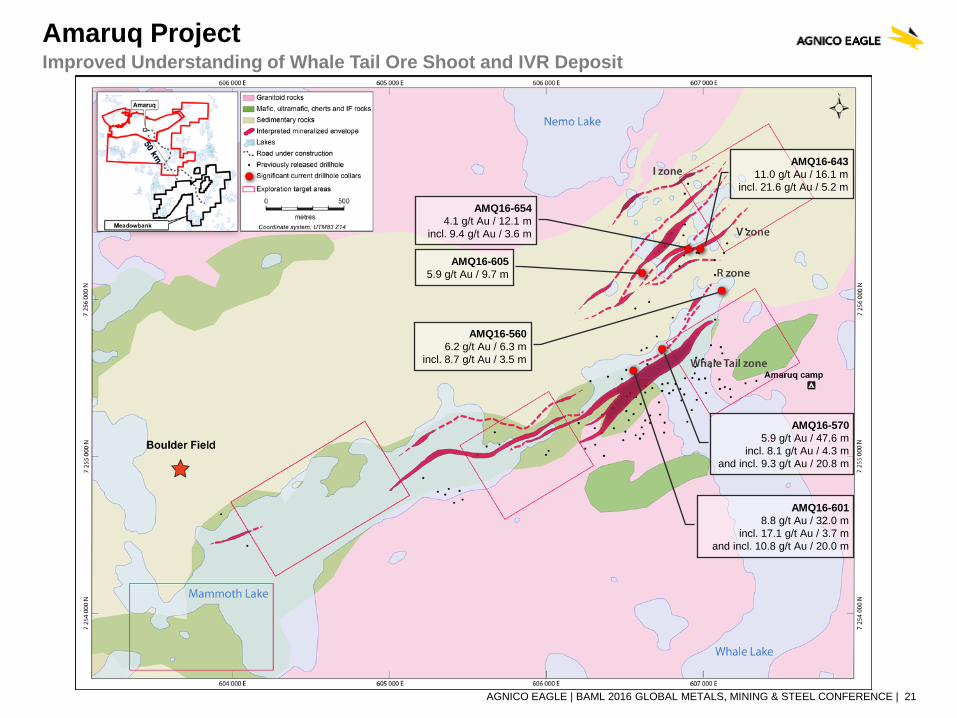
Amaruq Project, Nunavut – Further drilling refines the geometry of the Whale Tail Ore Shoot and IVR deposit – Drilling resumed in January and results show that the Whale Tail Ore shoot is larger in the central area than previously interpreted and confirms that the IVR deposit extends to the East and to a depth of 230 metres
Drilling at Barsele, in Sweden, extends the mineralization at depth and suggests the potential for a Goldex type deposit – Highlights include: 2.01 grams per tonne (“g/t”) gold (capped) over an estimated true width of 84.0 metres at a depth of approximately 310 metres in the Skirasen zone
Continued strong operating performance enhances financial flexibility – In Q1 2016, $55 million was repaid under the Company’s credit facility and net debt was reduced by approximately $89 million to $923 million at March 31, 2016
A quarterly dividend of $0.08 per share was declared
First Quarter Highlights

PERFORMANCE

AGNICO EAGLE | BAML 2016 GLOBAL METALS, MINING & STEEL CONFERENCE | 7
Operating Results Strong Operational Performance to Start 2016
Q1 2016 All amounts are in US$ (Unless Otherwise Indicated)
Production (Gold oz)
Total Cash Costs* ($/oz)
Operating Margin ($000’s)
Northern Business
LaRonde 75,337 $529 $48,055 Lapa 21,709 $668 $10,806 Goldex 32,340 $506 $22,184 Canadian Malartic (50%) 73,613 $557 $41,740 Kittila 48,127 $726 $24,086 Meadowbank 72,311 $788 $33,329
323,437 $630 $180,200
Southern Business
Pinos Altos 48,117 $343 $35,820 Creston Mascota 11,551 $460 $8,989 La India 28,231 $360 $21,549 87,899 $364 $66,358 Total 411,336 $573 $246,558
Q1 2016 Total Operating Margin – $246.6M Q1 2016 Revenue by Metal
LaRonde, 19%
Canadian Malartic, 17%
Pinos Altos, 15% Meadowbank,
14%
Kittila, 10%
Goldex, 9%
La India, 9%
Lapa, 4%
Creston Mascota, 3%
*Total cash costs are presented on a by-product basis, that is net of by-product revenue
Gold 96%
Silver 3%
Base Metals 1%

AGNICO EAGLE | BAML 2016 GLOBAL METALS, MINING & STEEL CONFERENCE | 8
1,025 1,060
1,400
1,650
1,565
1,044
1,099
1,429
1,671
$660
$690
$663
$600 $608
$640
$672
$637
$567
$500
$550
$600
$650
$700
$750
$800
900
1,000
1,100
1,200
1,300
1,400
1,500
1,600
1,700
2012 2013 2014 2015 2016
Tota
l Cas
h C
osts
per
Oun
ce
Gol
d O
unce
s (in
Tho
usan
ds)
Production Guidance Production Actual Cost Guidance Cost Actual
Strong Operational Track Record Guidance Exceeded for Fourth Consecutive Year

AGNICO EAGLE | BAML 2016 GLOBAL METALS, MINING & STEEL CONFERENCE | 9
Financial Highlights Strong Production Drives Strong Cash Flow Performance
All amounts are in US$ (Unless Otherwise Indicated) Q1 2016 Q1 2015
Realized Gold Price ($/oz) $1,192 $1,202
Revenues (millions) $491 $484
Earnings (millions) $28 $29
Earnings per share (basic) $0.13 $0.13
Cash provided by operating activities* (millions) $145.7 $143.5
Operating Cash flow per share* (basic) $0.66 $0.67
*After changes in non-cash components of working capital

AGNICO EAGLE | BAML 2016 GLOBAL METALS, MINING & STEEL CONFERENCE | 10
$168M
$990M
Cash and cash equivalents Undrawn credit facilities
Financial Position The Company has Reduced Net Debt for Six Consecutive Quarters
Strong Available Liquidity - $1.1B*
Long-term Debt Maturities
*As at March 31, 2016, excluding accordion
$55 million of debt repayments in Q1 2016
$923 million of net debt as of March 31, 2016
Manageable debt repayment schedule
Low share count of 222 million fully diluted after 59 years of operating history
$20 $20
$115
$360
$225 $100 $50 $0
$50$100$150$200$250$300$350$400
2016 2017 2020 2022 2024 2025
CAD USD

AGNICO EAGLE | BAML 2016 GLOBAL METALS, MINING & STEEL CONFERENCE | 11
High Quality Gold Reserves Higher Grade Mineral Reserves Drive Production Growth
2015 Gold reserves declined by approximately 5% to 19.1 Mozs of gold (251 million tonnes of ore grading 2.37 g/t gold), however, gold grades increased at LaRonde, Canadian Malartic, Goldex and La India
Large majority of current mineral reserves mineable at total cash costs below $900 per ounce
Mineral Reserve sensitivity: A $100 per ounce move in the gold price (all other assumptions unchanged) results in approximately a 5.4% change in mineral reserves
2015 Measured and indicated mineral resources increased approximately 1% to 15.0 Mozs of gold (309 million tonnes of ore grading 1.52 g/t gold)
2015 Inferred mineral resources increased approximately 23% to 16.5 Mozs of gold (230 million tonnes of ore grading 2.24 g/t gold)
*For a detailed breakdown of Agnico Eagle’s mineral reserve and mineral resource position see the Company’s press release dated February 10, 2016
Source: Company reports Source: Company reports, Barclays Research
2.37
1.40 1.32 1.22 1.08 1.06 1.06 0.70 0.63
0
1
2
3
AE
M
IAG
AB
X
EG
O
AV
ER
AG
E
NE
M
GG
KG
C
AU
Y
Mineral Reserve Grade (g/t)
-22%
-11% -9%
0%
21%
29% 32% 35%
44%
-30%
-20%
-10%
0%
10%
20%
30%
40%
50%
AEM IAG NGD KGC AUY GG NEM ABX EGO
5-Year Difference Between Production and Mineral Reserve Grade

AGNICO EAGLE | BAML 2016 GLOBAL METALS, MINING & STEEL CONFERENCE | 12
$-
$100,000
$200,000
$300,000
$400,000
$500,000
$600,000
$700,00019
98
1999
2000
2001
2002
2003
2004
2005
2006
2007
2008
2009
2010
2011
2012
2013
2014
2015
In T
hous
ands
of $
US
Since 1979 Cumulative
Dividends of:
~$685M
Long History of Dividend Payments to Shareholders 34 Years of Consecutive Annual Dividends

AGNICO EAGLE | BAML 2016 GLOBAL METALS, MINING & STEEL CONFERENCE | 13
AEM US Equity XAU Index Gold Spot
AEM US Equity CAGR
13.87% Gold Spot CAGR
8.74% XAU Index CAGR
1.69%
Superior Share Performance Since 1998 Agnico Eagle has Consistently Outperformed Gold and Gold Equities
0%
500%
1000%
1500%
2000%
2500%

PIPELINE

AGNICO EAGLE | BAML 2016 GLOBAL METALS, MINING & STEEL CONFERENCE | 15
Successful M&A and Exploration Strategy Significant Value Added, Key Deposits Still Open
Detailed information on mineral reserves and mineral resources can be found in the February 10, 2016 press release
Kittila
2005 2015
Mined through 2015 (koz) Proven & Probable (koz) Measured & Indicated (koz) Inferred (koz) Cost per Oz ($)
$54
$19
Purchase Discovery
2,800 koz
8,863 koz
+217%
Meadowbank (Including Amaruq)
2007 2015
$173
$28
Purchase Discovery
3,830 koz
7,693 koz
+101%
Meliadine
2010 2015
$121
$27
Purchase Discovery
5,020 koz
10,276 koz
+105%
Pinos Altos
2006 2015
$43 $46
Purchase Discovery
2,100 koz
4,133 koz
+97%
La India
2011 2015
$186
$16
Purchase Discovery
1,266 koz
3,095 koz
+144%

AGNICO EAGLE | BAML 2016 GLOBAL METALS, MINING & STEEL CONFERENCE | 16
Upper Beaver*
Strong Exploration/Development Pipeline Supports Future Growth
Hammond Reef*
El Barqueño
Meliadine
Amaruq
Pinos Altos Satellites
La India Expansion Potential
LaRonde III
Odyssey* Rimpi and New Sisar Zones at Kittila
Bousquet Zone 5
Advanced Exploration Approaching Development Mine Site – Expansion/Extension
*50% AEM Ownership **55% AEM Ownership Blue – Northern Business Gold – Southern Business
Barsele
Akasaba West
Goldex Deep 1 and 2
Long Term
Near Term

AGNICO EAGLE | BAML 2016 GLOBAL METALS, MINING & STEEL CONFERENCE | 17
LaRonde Extension and Bousquet Zone 5 Could Provide Future Production Optionality
In 2016, about 89% of the ore will come from the higher grade lower mine area (below level 248). Increased production forecasts through 2018 largely reflect grades closer to that of the reserves
Exploration and studies are continuing to assess the potential to extend the mineral reserves and carry out mining activities between the 311 and 371 levels (a depth of 3.1 to 3.7 km)
The Company is evaluating the potential to initially mine the Bousquet Zone 5 from a depth of 90 to 330 metres via an underground ramp. An internal technical study is expected to be completed by the end of 2016

AGNICO EAGLE | BAML 2016 GLOBAL METALS, MINING & STEEL CONFERENCE | 18
Goldex Deep 1 Mine Life Extended from 2018 to 2024
Deep 1 mining area includes lower part of the Dx zone and top of the D zone
Estimated annual production >100,000 ounces at an average total cash cost of ~$620 per ounce
Advancement of Deep 1 has potential to unlock other value creating opportunities: Potential to increase mill throughput Potential for additional mineral resource
conversion in Deep 1 Potential for mining at Deep 2 (below Level
120) Potential to develop the Akasaba West
deposit

AGNICO EAGLE | BAML 2016 GLOBAL METALS, MINING & STEEL CONFERENCE | 19
Canadian Malartic - 2016 Exploration Focused on Near Mine Opportunities
Odyssey - View looking NW
South Zone
North Zone
Numerous in pit/underground targets to be evaluated
60,000 metres of drilling planned on the North and South Odyssey Zones

AGNICO EAGLE | BAML 2016 GLOBAL METALS, MINING & STEEL CONFERENCE | 20
Nunavut – Production, Development and Exploration
Mineral claims in Nunavut are now ~438,335 hectares
Politically attractive and stable jurisdiction with enormous geological potential
Potential to be a strategic operating platform for Agnico Eagle with the ability to generate strong production and cash flows over several decades
AGNICO EAGLE | BAML 2016 GLOBAL METALS, MINING & STEEL CONFERENCE | 21
Amaruq Project Improved Understanding of Whale Tail Ore Shoot and IVR Deposit
AMQ16-643 11.0 g/t Au / 16.1 m
incl. 21.6 g/t Au / 5.2 m
AMQ16-605 5.9 g/t Au / 9.7 m
AMQ16-654 4.1 g/t Au / 12.1 m
incl. 9.4 g/t Au / 3.6 m
AMQ16-560 6.2 g/t Au / 6.3 m
incl. 8.7 g/t Au / 3.5 m
AMQ16-570 5.9 g/t Au / 47.6 m
incl. 8.1 g/t Au / 4.3 m and incl. 9.3 g/t Au / 20.8 m
AMQ16-601 8.8 g/t Au / 32.0 m
incl. 17.1 g/t Au / 3.7 m and incl. 10.8 g/t Au / 20.0 m

AGNICO EAGLE | BAML 2016 GLOBAL METALS, MINING & STEEL CONFERENCE | 22
Meliadine Development Project Current Focus on Optimization of the Resource Base and Potential Production Scenarios
Proven and probable gold reserves: 3.4 million ounces Indicated gold resources: 3.31 million ounces Inferred gold resources: 3.55 million ounces For additional details on Meliadine mineral reserves and mineral resources see Presentation Appendix and AEM February 10, 2016 press release

AGNICO EAGLE | BAML 2016 GLOBAL METALS, MINING & STEEL CONFERENCE | 23
Kittila Composite Longitudinal Section Additional Drilling Further Extends Scope of Sisar Zone – Ramp Development Now Underway
Inferred resources at Sisar are estimated at 651,000 ounces of gold (3.4 million tonnes at 5.91 g/t gold)
See AEM February 10, 2016 press release and appendix for detailed breakdown of mineral reserves and mineral resources

AGNICO EAGLE | BAML 2016 GLOBAL METALS, MINING & STEEL CONFERENCE | 24
Barsele Project - Sweden Drilling Extends the Central and Skirasen Zones and Suggests the Potential for a Goldex Type Deposit
CNT15-007 3.28 g/t Au / 9.0 m
CNT15-009 1.12 g/t Au / 46.5 m
and 1.15 g/t Au / 36.8 m
CNT15-017 1.72 g/t Au / 6.8 m
CNT15-010 1.59 g/t Au / 21.8 m
and 0.88 g/t Au / 71.2 m
CNT15-013 3.00 g/t Au / 13.9 m
and 5.02 g/t Au / 5.1 m
CNT15-015 6.74 g/t Au / 8.2 m
CNT15-016 5.06 g/t Au / 5.2 m
and 2.01 g/t Au / 84.0 m
SKI15-001 1.61 g/t Au / 45.8 m
and 1.42 g/t Au / 21.8 m
SKI16-001 4.85 g/t Au / 5.2 m
and 3.23 g/t Au / 15.0 m and 2.40 g/t Au / 27.1 m
SKI16-005 1.19 g/t Au / 15.0 m
and 1.25 g/t Au / 78.8 m and 1.86 g/t Au / 12.0 m

AGNICO EAGLE | BAML 2016 GLOBAL METALS, MINING & STEEL CONFERENCE | 25
EL COCHI
INDIA ESTE LA INDIA EL
REALITO MAIN ZONE
Key target area to be drill tested include El Realito, El Cochi and La India Este
An initial drill program is planned at the Kilometre 15 area which is located east and contiguous with the El Realito property
La India Exploration Potential Several Near-Mine Targets to be Evaluated in 2016

AGNICO EAGLE | BAML 2016 GLOBAL METALS, MINING & STEEL CONFERENCE | 26
Recent Drill Program Expands Known Deposits and Tests Other Target Areas
2016 Exploration focus on mineral resource development, conversion and regional exploration
Infill drilling completed at Azteca-Zapoteca deposit
Other regional targets to be tested in 2016 include: Peña Blanca Zapote-Mixteca San Diego Olmeca Huichol Tarasca
El Barqueno Project
The El Barqueño Project contains an initial total inferred mineral resource of 0.61 Mozs of gold and 3.7 Mozs of silver (19.7 million tonnes grading 0.96 g/t gold and 5.78 g/t silver)
See AEM February 10, 2016 press release and appendix for detailed breakdown of mineral reserves and mineral resources

AGNICO EAGLE | BAML 2016 GLOBAL METALS, MINING & STEEL CONFERENCE | 27
2016E 2017E 2018E 2019 and Beyond
Payable Gold Production Profile
* Approximate high end of estimated 2016 production guidance
1,565,000* 1,555,000 1,500,000
M e l i a d i n e A m a r u q
E l B a r q u e n o L a R o n d e
K i t t i l a G o l d e x
Development Pipeline Expected to Drive Further Production Growth 30% to 40% Growth in Gold Production Possible by 2020

APPENDIX

AGNICO EAGLE | BAML 2016 GLOBAL METALS, MINING & STEEL CONFERENCE | 29
PRODUCTION Q1 2016 PRODUCTION HIGHLIGHTS
LaRonde 75,337 ozs at total cash costs of $529/oz
Strong operational performance resulted in higher throughput levels in the processing facility. Higher production (due to higher throughput, higher gold grades from the lower mine area and improved recoveries from the CIP circuit)
Exploration and studies are continuing to assess the potential to extend the mineral reserves and carry out mining activities between the 311 and 371 levels
Internal scoping studies continue to evaluate the potential to develop the Bousquet Zone 5 on the adjoining Bousquet property. A certificate of authorization from the Quebec government to permit collection of a bulk sample is expected to be issued before the end of Q2 2016
Canadian Malartic GP (50%)
73,613 ozs at total cash costs of $557/oz
Production was higher in Q1 2016 primarily due to higher throughput levels and higher gold grades
Permitting activities for the Barnat Extension and deviation of Highway 117 are continuing
Drilling continued on the Odyssey North and South Zones. In 2016, approximately 60,000 metres of drilling has been approved on the Odyssey property
Goldex 32,340 ozs at total cash costs of $506/oz
Higher throughput in the 2016 period was due to continued strong underground performance (mining and ore hoisting)
Development of the Deep 1 Zone remains on time and on budget. Work on the electrical substations commenced in March 2016 and the installation of the initial components of the underground conveyor system are underway
The Akasaba West deposit could potentially create flexibility and synergies for the Company's operations in the Abitibi region by using extra milling capacity at both Goldex and LaRonde. Permitting activities at continue as planned
Lapa 21,709 ozs at total cash costs of $668/oz
Under the current life of mine plan, Lapa is expected to operate until early Q4 2016
Higher throughput in Q1 2016 period was due to the recovery of residual ore from old production areas and additional feed from stockpiles
Exploration drilling in the Zulapa 7 Up and 7 East Zones is underway which, if successful, could potentially extend the mine life
Abitibi Region Solid and Growing Production Base in Quebec
AGNICO EAGLE | BAML 2016 GLOBAL METALS, MINING & STEEL CONFERENCE | 30
EXPLORATION AND DEVELOPMENT HIGHLIGHTS
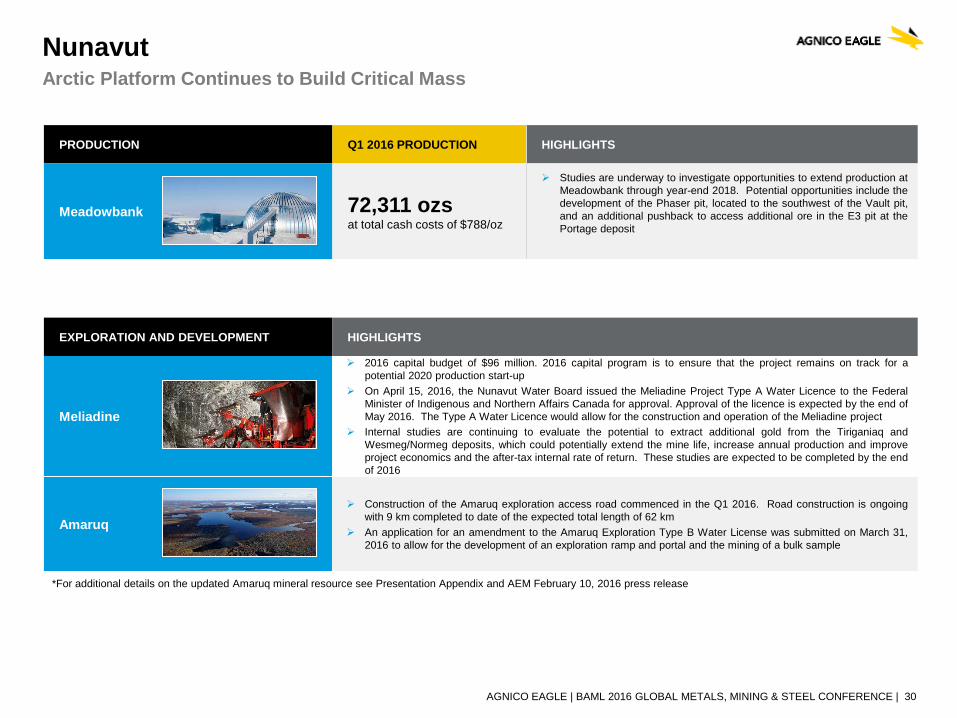
Meliadine
2016 capital budget of $96 million. 2016 capital program is to ensure that the project remains on track for a potential 2020 production start-up
On April 15, 2016, the Nunavut Water Board issued the Meliadine Project Type A Water Licence to the Federal Minister of Indigenous and Northern Affairs Canada for approval. Approval of the licence is expected by the end of May 2016. The Type A Water Licence would allow for the construction and operation of the Meliadine project
Internal studies are continuing to evaluate the potential to extract additional gold from the Tiriganiaq and Wesmeg/Normeg deposits, which could potentially extend the mine life, increase annual production and improve project economics and the after-tax internal rate of return. These studies are expected to be completed by the end of 2016
Amaruq Construction of the Amaruq exploration access road commenced in the Q1 2016. Road construction is ongoing
with 9 km completed to date of the expected total length of 62 km An application for an amendment to the Amaruq Exploration Type B Water License was submitted on March 31,
2016 to allow for the development of an exploration ramp and portal and the mining of a bulk sample
Nunavut Arctic Platform Continues to Build Critical Mass
PRODUCTION Q1 2016 PRODUCTION HIGHLIGHTS
Meadowbank 72,311 ozs at total cash costs of $788/oz
Studies are underway to investigate opportunities to extend production at Meadowbank through year-end 2018. Potential opportunities include the development of the Phaser pit, located to the southwest of the Vault pit, and an additional pushback to access additional ore in the E3 pit at the Portage deposit
*For additional details on the updated Amaruq mineral resource see Presentation Appendix and AEM February 10, 2016 press release

AGNICO EAGLE | BAML 2016 GLOBAL METALS, MINING & STEEL CONFERENCE | 31
EXPLORATION AND DEVELOPMENT HIGHLIGHTS
Rimpi Development
Previous drilling on the Rimpi Zone has outlined a significant zone of mineralization with potentially wider widths and better grades than those currently being mined at Kittilä
Main underground ramp at Kittilä is being extended to reach the Rimpi Zone at depth and facilitate further exploration. In addition, a surface ramp is being driven into the Rimpi Zone for production purposes and to provide a second egress for the Suuri ramp system
New Parallel Sisar Zone
Drilling is ongoing to infill and extend the mineralization in the Sisar Zone. Numerous holes have been completed and assay results are pending
Underground ramp construction began in March to access the upper portion of the Sisar Zone, which is located approximately 200 metres from existing underground infrastructure
Barsele Project Sweden
Agnico Eagle holds a 55% interest in the project with an option to go to 70%. The property contains intrusive- hosted gold mineralization (similar to Goldex) and gold-rich volcanogenic massive sulphide mineralization (similar to LaRonde). A $4.3 million exploration program consisting of 12,000 metres of drilling is planned for 2016 to further evaluate the intrusive hosted mineralization
Finland and Sweden Reviewing Opportunities to Increase Kittila Production, New Sisar Zone Provides Additional Optionality
PRODUCTION Q1 2016 PRODUCTION HIGHLIGHTS
Kittila 48,127 ozs at total cash costs of $726/oz
The Kittila mine and mill has shown potential to operate in excess of 4,000 tpd and efforts are ongoing to assess the optimal throughput rate
Studies are also underway to optimize underground mining rates and fully integrate the upper and lower Rimpi zones and the newly discovered Sisar Zone in a new Kittila mine plan

AGNICO EAGLE | BAML 2016 GLOBAL METALS, MINING & STEEL CONFERENCE | 32
PRODUCTION Q1 2016 PRODUCTION HIGHLIGHTS
Pinos Altos 48,117 ozs at total cash costs of $343/oz
The Pinos Altos shaft was commissioned for moving mine personnel and materials in Q1 2016. The ore handling system is on schedule to be commissioned in Q2 2016
When the shaft is fully commissioned, it will allow better matching of the mill capacity with the future mining capacity at Pinos Altos once the open pit mining operation begins to wind down as planned
Creston Mascota
11,551 ozs at total cash costs of $460/oz
During Q1 2016, an agreement was signed allowing access to the 51-hectare Madrono property for exploration and mining
The Madrono property is located in an area with good access and infrastructure between Pinos Altos and Creston Mascota, includes at least three gold-silver veins: Madrono, Santa Martha and La Curva
Exploration and infill drilling continues at the Bravo satellite target and around the Creston Mascota pit to increase the confidence in the block model and look for additional growth opportunities
La India 28,231 ozs at total cash costs of $360/oz
Surface sampling and target generation are underway at El Realito and favourable targets will then be drill-tested
Step-out drilling is also planned at the El Cochi and La India Este areas adjacent to the La India mine
An initial drill program is also planned at the Kilometre 15 area which is located east and contiguous with the El Realito
Mexico Record Silver Production in Q1 2016
EXPLORATION AND DEVELOPMENT HIGHLIGHTS
El Barqueño
2016 Exploration focus on mineral resource development, conversion and regional exploration. Infill drilling completed at Azteca-Zapoteca deposit
Other regional targets to be tested in 2016 include: Peña Blanca, Zapote-Mixteca, San Diego, Olmeca, Huichol, Tarasca

AGNICO EAGLE | BAML 2016 GLOBAL METALS, MINING & STEEL CONFERENCE | 33
Low Political Risk, Mining Friendly Jurisdictions
17%
24%
31% 33%
41% 41% 44%
51%
59%
86%
0%
10%
20%
30%
40%
50%
60%
70%
80%
90%
100%
AEM NEM ABX GG AUY NGD KGC IMG EGO CG
Fras
er In
stitu
te C
ompa
ny S
core
Source: Bloomberg, Fraser Institute

AGNICO EAGLE | BAML 2016 GLOBAL METALS, MINING & STEEL CONFERENCE | 34
Gold and Silver Reserves and Resources December 31, 2015
Gold Silver Tonnes (000’s)
Gold (g/t)
Gold (ounces) (000’s)
Tonnes (000’s)
Silver (g/t)
Silver (ounces) (000’s)
Proven & Probable Reserves
Northern Business 200,646 2.57 16,572 18,220 19.73 11,557
Southern Business 49,937 1.56 2,502 49,937 26.93 43,241
Total 250,583 2.37 19,075 68,157 25.01 54,798
Measured & Indicated Resources
Northern Business 223,513 1.88 13,535 6,842 18.25 4,014
Southern Business 85,693 0.56 1,553 38,457 14.29 17,666
Total 309,206 1.52 15,089 45,299 14.89 21,680
Inferred Resources
Northern Business 102,294 4.32 14,221 9,142 15.07 4,429
Southern Business 127,368 0.57 2,325 25,995 17.24 14,408
Total 229,662 2.24 16,546 35,137 16.67 18,837
See AEM February 10, 2016 press release for detailed breakdown of mineral reserves and mineral resources. Mineral reserves are not a subset of mineral resources

AGNICO EAGLE | BAML 2016 GLOBAL METALS, MINING & STEEL CONFERENCE | 35
Copper, Zinc and Lead Reserves and Resources December 31, 2015
Copper Zinc Lead Tonnes (000’s)
Copper (%)
Copper (tonnes)
Tonnes (000’s)
Zinc (%)
Zinc (tonnes)
Tonnes (000’s)
Lead (%)
Lead (tonnes)
Proven & Probable Reserves
Northern Business 22,979 0.30 67,915 18,220 0.81 147,927 18,220 0.04 7,500
Southern Business
Total 22,979 0.30 67,915 18,220 0.81 147,927 18,220 0.04 7,500
Measured & Indicated Resources
Northern Business 14,073 0.29 41,449 6,842 0.82 55,838 6,842 0.07 4,895
Southern Business
Total 14,073 0.29 41,449 6,842 0.82 55,838 6,842 0.07 4,895
Inferred Resources
Northern Business 12,592 0.29 35,918 9,142 0.90 82,396 9,142 0.06 5,782
Southern Business 19,658 0.19 36,451
Total 32,250 0.22 72,369 9,142 0.90 82,396 9,142 0.06 5,782
See AEM February 10, 2016 press release for detailed breakdown of mineral reserves and mineral resources. Mineral reserves are not a subset of mineral resources

AGNICO EAGLE | BAML 2016 GLOBAL METALS, MINING & STEEL CONFERENCE | 36
Mineral Reserves and Resources by Project December 31, 2015
Northern Business Gold Tonnes (Mt) Gold (g/t) Gold (Moz)
LaRonde mine
Proven Reserves 3.5 4.1 0.5 Probable Reserves 14.8 5.6 2.7 Indicated Resource 6.8 3.5 0.8 Inferred Resource 9.1 4.3 1.3
Meadowbank mine
Proven Reserves 1.2 1.5 0.1 Probable Reserves 9.6 2.9 0.9 Measured & Indicated Resource 7.0 3.2 0.7 Inferred Resource 3.4 4.0 0.4
Amaruq Project Inferred Resource 16.9 6.1 3.3
Canadian Malartic mine (50% Interest)
Proven Reserves 27.4 1.0 0.9 Probable Reserves 83.3 1.1 3.0 Measured & Indicated Resource (Undiluted), excluding reserves 12.8 1.5 0.6
Inferred Resource 4.5 1.5 0.2
Meliadine project
Proven Reserves 0.03 7.3 0.01 Probable Reserves 14.5 7.3 3.4 Indicated Resource 20.8 5.0 3.3 Inferred Resource 14.7 7.5 3.6
Kittilä mine
Proven Reserves 1.1 4.3 0.1 Probable Reserves 27.1 4.8 4.2 Measured & Indicated Resource 15.9 3.0 1.5 Inferred Resource 11.8 4.6 1.8
Goldex mine
Proven Reserves 0.3 1.5 0.02 Probable Reserves 12.6 1.6 0.7 Measured & Indicated Resource 34.4 1.9 2.1 Inferred Resource 24.6 1.5 1.2
Lapa mine
Proven Reserves 0.4 5.5 0.1 Measured & Indicated Resource 1.1 4.3 0.2
Inferred Resource 1.4 6.5 0.3
Southern Business Gold Tonnes (Mt) Gold (g/t) Gold (Moz)
Pinos Altos mine
Proven Reserves 2.8 3.1 0.3 Probable Reserves 13.0 2.8 1.2 Indicated Resource 11.1 1.8 0.7 Inferred Resource 12.6 1.3 0.5
Creston Mascota mine
Proven Reserves 0.2 0.7 0.004 Probable Reserves 4.0 1.3 0.2 Indicated Resource 4.3 0.5 0.1 Inferred Resource 4.3 1.1 0.1
La India mine
Proven Reserves 0.2 0.7 0.01 Probable Reserves 29.7 0.9 0.9 Measured & Indicated Resource 70.3 0.4 0.8
Inferred Resource 90.9 0.4 1.1
El Barqueño Project
Inferred Resource 19.7 1.0 0.6
See AEM February 10, 2016 press release for detailed breakdown of mineral reserves and mineral resources. Mineral reserves are not a subset of mineral resources

AGNICO EAGLE | BAML 2016 GLOBAL METALS, MINING & STEEL CONFERENCE | 37
Notes to Investors Regarding The Use of Mineral Resources Cautionary Note to Investors Concerning Estimates of Measured and Indicated Mineral Resources
This document uses the terms “measured mineral resources” and “indicated mineral resources”. Investors are advised that while those terms are recognized and required by Canadian regulations, the SEC does not recognize them. Investors are cautioned not to assume that any part or all of mineral deposits in these categories will ever be converted into mineral reserves.
Cautionary Note to Investors Concerning Estimates of Inferred Mineral Resources
This document also uses the term “inferred mineral resources”. Investors are advised that while this term is recognized and required by Canadian regulations, the SEC does not recognize it. “Inferred mineral resources” have a great amount of uncertainty as to their existence, and great uncertainty as to their economic and legal feasibility. It cannot be assumed that all or any part of an inferred mineral resource will ever be upgraded to a higher category. Under Canadian rules, estimates of inferred mineral resources may not form the basis of feasibility or pre-feasibility studies, except in rare cases. Investors are cautioned not to assume that part or all of an inferred mineral resource exists, or is economically or legally mineable.
Scientific and Technical Data
Cautionary Note To U.S. Investors - The SEC permits U.S. mining companies, in their filings with the SEC, to disclose only those mineral deposits that a company can economically and legally extract or produce. Agnico Eagle reports mineral resource and mineral reserve estimates in accordance with the Canadian Institute of Mining, Metallurgy and Petroleum Best Practice Guidelines for Exploration and for Estimation of Mineral Resources and Mineral Reserves in accordance with the Canadian securities regulatory authorities' (the "CSA") National Instrument 43-101 Standards of Disclosure for Mineral Projects ("NI 43-101"). These standards are similar to those used by the SEC’s Industry Guide No. 7, as interpreted by Staff at the SEC ("Guide 7"). However, the definitions in NI 43-101 differ in certain respects from those under Guide 7. Accordingly, mineral reserve information contained herein may not be comparable to similar information disclosed by U.S. companies. Under the requirements of the SEC, mineralization may not be classified as a "mineral reserve" unless the determination has been made that the mineralization could be economically and legally produced or extracted at the time the mineral reserve determination is made. A "final" or "bankable" feasibility study is required to meet the requirements to designate mineral reserves under Industry Guide 7. Agnico Eagle uses certain terms in this presentation, such as "measured", "indicated", and "inferred", and "resources" that the SEC guidelines strictly prohibit U.S. registered companies from including in their filings with the SEC.
In prior periods, mineral reserves for all properties were typically estimated using historic three-year average metals prices and foreign exchange rates in accordance with the SEC guidelines. These guidelines require the use of prices that reflect current economic conditions at the time of mineral reserve determination, which the Staff of the SEC has interpreted to mean historic three-year average prices. Given the current lower commodity price environment, Agnico Eagle has decided to use price assumptions that are below the three-year averages. The assumptions used for the mineral reserve estimates at all mines and advanced projects as of December 31, 2015 (other than the Canadian Malartic mine), reported by the Company on February 10, 2016, are $1,100 per ounce gold, $16.00 per ounce silver, $0.90 per pound zinc, $2.50 per pound copper, and US$/C$, Euro/US$ and US$/MXP exchange rates for all mines and projects other than the Lapa, Meadowbank and Creston Mascota mines and Santo Niño open pit at Pinos Altos of 1.16, 1.20 and 14.00, respectively. Due to shorter mine life, the assumptions used for the mineral reserve estimates at the short-life mines (the Lapa, Meadowbank and Creston Mascota mines and Santo Niño open pit) as of December 31, 2015, reported by the Company on February 10, 2016, include the same metal price assumptions, and US$/C$ and US$/MXP exchange rates of 1.30 and 16.00, respectively. The assumptions used for the mineral reserves estimate at the Canadian Malartic mine as of December 31, 2015, reported by the Company on February 10, 2016, are $1,150 per ounce gold, a cut-off grade between 0.30 g/t and 0.33 g/t gold (depending on the deposit) and a US$/C$ exchange rate of 1.24.
NI 43-101 requires mining companies to disclose mineral reserves and mineral resources using the subcategories of "proven mineral reserves”, "probable mineral reserves”, "measured mineral resources”, "indicated mineral resources” and "inferred mineral resources”. Mineral resources that are not mineral reserves do not have demonstrated economic viability.

AGNICO EAGLE | BAML 2016 GLOBAL METALS, MINING & STEEL CONFERENCE | 38
Notes to Investors Regarding The Use of Mineral Resources A mineral reserve is the economically mineable part of a measured and/or indicated mineral resource. It includes diluting materials and allowances for losses, which may occur when the material is mined or extracted and is defined by studies at pre-feasibility or feasibility level as appropriate that include application of modifying factors. Such studies demonstrate that, at the time of reporting, extraction could reasonably be justified.
Modifying factors are considerations used to convert mineral resources to mineral reserves. These include, but are not restricted to, mining, processing, metallurgical, infrastructure, economic, marketing, legal, environmental, social and governmental factors.
A proven mineral reserve is the economically mineable part of a measured mineral resource. A proven mineral reserve implies a high degree of confidence in the modifying factors. A probable mineral reserve is the economically mineable part of an indicated and, in some circumstances, a measured mineral resource. The confidence in the modifying factors applying to a probable mineral reserve is lower than that applying to a proven mineral reserve.
A mineral resource is a concentration or occurrence of solid material of economic interest in or on the Earth's crust in such form, grade or quality and quantity that there are reasonable prospects for eventual economic extraction. The location, quantity, grade or quality, continuity and other geological characteristics of a mineral resource are known, estimated or interpreted from specific geological evidence and knowledge, including sampling.
A measured mineral resource is that part of a mineral resource for which quantity, grade or quality, densities, shape and physical characteristics are estimated with confidence sufficient to allow the application of modifying factors to support detailed mine planning and final evaluation of the economic viability of the deposit. Geological evidence is derived from detailed and reliable exploration, sampling and testing and is sufficient to confirm geological and grade or quality continuity between points of observation. An indicated mineral resource is that part of a mineral resource for which quantity, grade or quality, densities, shape and physical characteristics are estimated with sufficient confidence to allow the application of modifying factors in sufficient detail to support mine planning and evaluation of the economic viability of the deposit. Geological evidence is derived from adequately detailed and reliable exploration, sampling and testing and is sufficient to assume geological and grade or quality continuity between points of observation. An inferred mineral resource is that part of a mineral resource for which quantity and grade or quality are estimated on the basis of limited geological evidence and sampling. Geological evidence is sufficient to imply but not verify geological and grade or quality continuity.
Investors are cautioned not to assume that part or all of an inferred mineral resource exists, or is economically or legally mineable.
A feasibility study is a comprehensive technical and economic study of the selected development option for a mineral project that includes appropriately detailed assessments of applicable modifying factors together with any other relevant operational factors and detailed financial analysis that are necessary to demonstrate, at the time of reporting, that extraction is reasonably justified (economically mineable). The results of the study may reasonably serve as the basis for a final decision by a proponent or financial institution to proceed with, or finance, the development of the project. The confidence level of the study will be higher than that of a Pre-Feasibility Study.
The effective date for all of the Company's mineral resource and mineral reserve estimates in this presentation is December 31, 2015. Additional information about each of the mineral projects that is required by NI 43-101, sections 3.2 and 3.3 and paragraphs 3.4 (a), (c) and (d) can be found in the Technical Reports filed by Agnico Eagle, which may be found at www.sedar.com. Other important operating information can be found in the Company's AIF and Form 40-F.
The scientific and technical information relating to Agnico Eagle’s mineral reserves and mineral resources contained herein (other than the Canadian Malartic mine) has been approved by Daniel Doucet, Eng., Senior Corporate Director, Reserve Development; and relating to mineral reserves and mineral resources at the Canadian Malartic mine contained herein has been approved by Donald Gervais, P.Geo., Director of Technical Services at Canadian Malartic Corporation. Each of them is a "Qualified Person" for the purposes of NI 43-101.

Trading Symbol: AEM on TSX & NYSE
Investor Relations: 416-947-1212 [email protected]
agnicoeagle.com