Bank of America Merrill Lynch 2013 Insurance Conference · Intact Financial Corporation Bank of...
20
Intact Financial Corporation Bank of America Merrill Lynch 2013 Insurance Conference February 13, 2013 (TSX: IFC)
Transcript of Bank of America Merrill Lynch 2013 Insurance Conference · Intact Financial Corporation Bank of...
Intact Financial Corporation
Bank of America Merrill Lynch2013 Insurance Conference
February 13, 2013
(TSX: IFC)
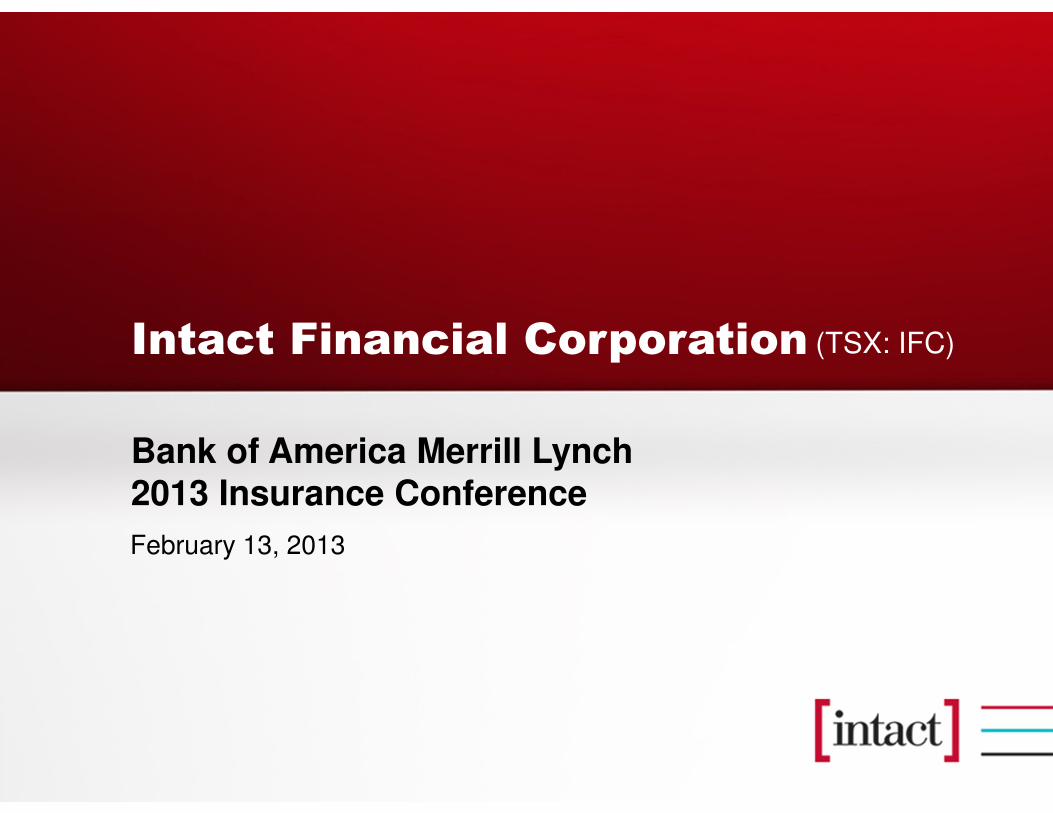
Canada’s P&C insurance leader
Leader in a fragmented industry Industry outperformer
Distinct brandsWho we are1
• Largest P&C insurer in Canada
• $7 billion in direct premiums written
• #1 in BC, Alberta, Ontario, Quebec, Nova Scotia
• $13 billion cash and invested assets
• Proven industry consolidator
Premium growth
Combined ratio3
Return on equity4
3.3 pts
3.4 pts
8.2 pts
10-year performance –IFC vs. P&C industry2
$7.0
$3.4$2.6 $2.5 $2.4
2011 Direct premiums written2
($ billions)Top five insurers represent 43.7%
of the market
1 Pro forma AXA Canada and JEVCO for a full year 2 Industry data source: MSA Research excluding Lloyd’s, ICBC, SGI, SAF, and Genworth. All data as at Dec 31, 2011.3 Combined ratio includes the market yield adjustment (MYA)4 ROEs reflect IFRS beginning in 2010. IFC's 2011 ROE is adjusted return on common shareholders' equity (AROE)
IFC1 Aviva RSA TDCo-
operators
17.2% 8.3% 6.2% 6.1% 5.9%
2
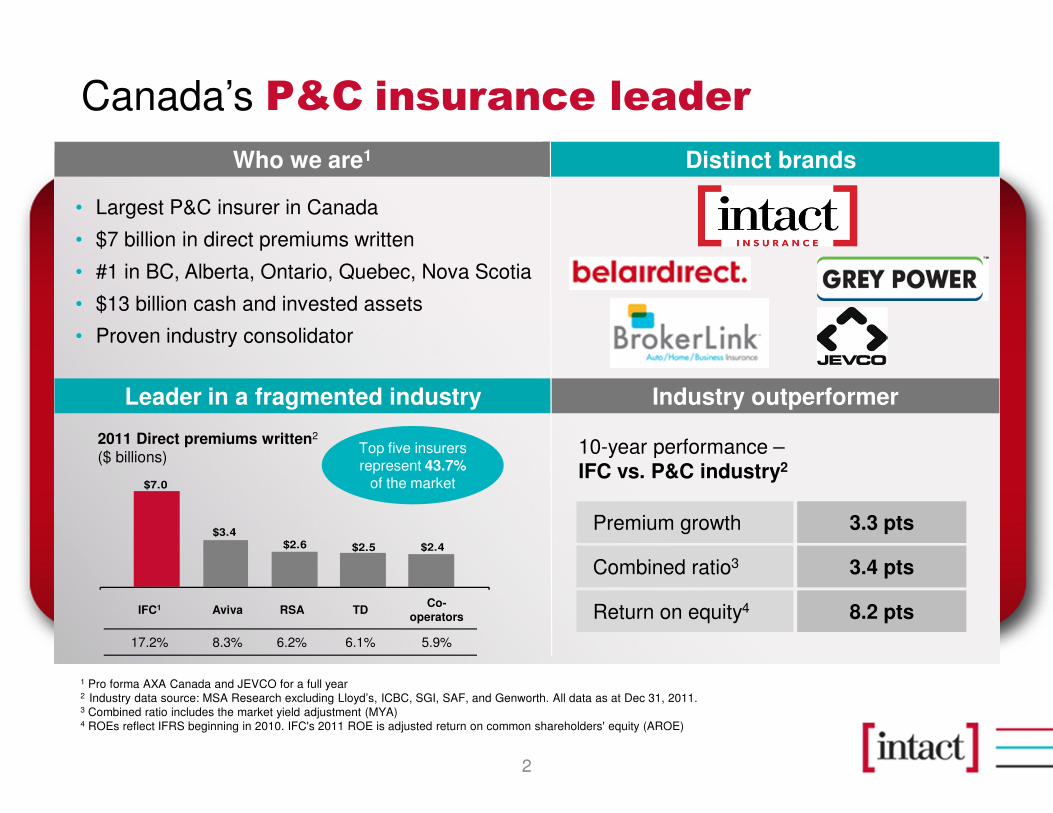
Consistent industry outperformance
3
Significant scale advantage
Sophisticated pricing and underwriting
Multi-channel distribution
Proven acquisition strategy
In-house claims expertise
Broker relationships
Solid investment returns
1 Year to date as at September 30, 2012, reflecting YTD Q3-2012 annualized numbers2 Data is for the year ended December 31, 20113 IFC’s ROE corresponds to the annualized adjusted return on equity (AROE)Industry data source: MSA Research excluding Lloyd’s, ICBC, SGI, SAF, MPI, Genworth, IFC and AXA CanadaIncludes market yield adjustment (MYA)* Top 20 excludes Lloyd’s, IFC and AXA Canada
10.1%
15.9%
0.0%
5.0%
10.0%
15.0%
20.0%
ROE
Industry Top 20
IFC
97.8%
94.1%
90.0%
92.0%
94.0%
96.0%
98.0%
100.0%
Combined Ratio
77.2%
68.2%
60.8%
69.6% 71.2%
56.2%
30%
40%
50%
60%
70%
80%
Auto Personal Property Commercial P&C
Industry
IFC
Five-year average loss ratios2YTD-20121 outperformance
3
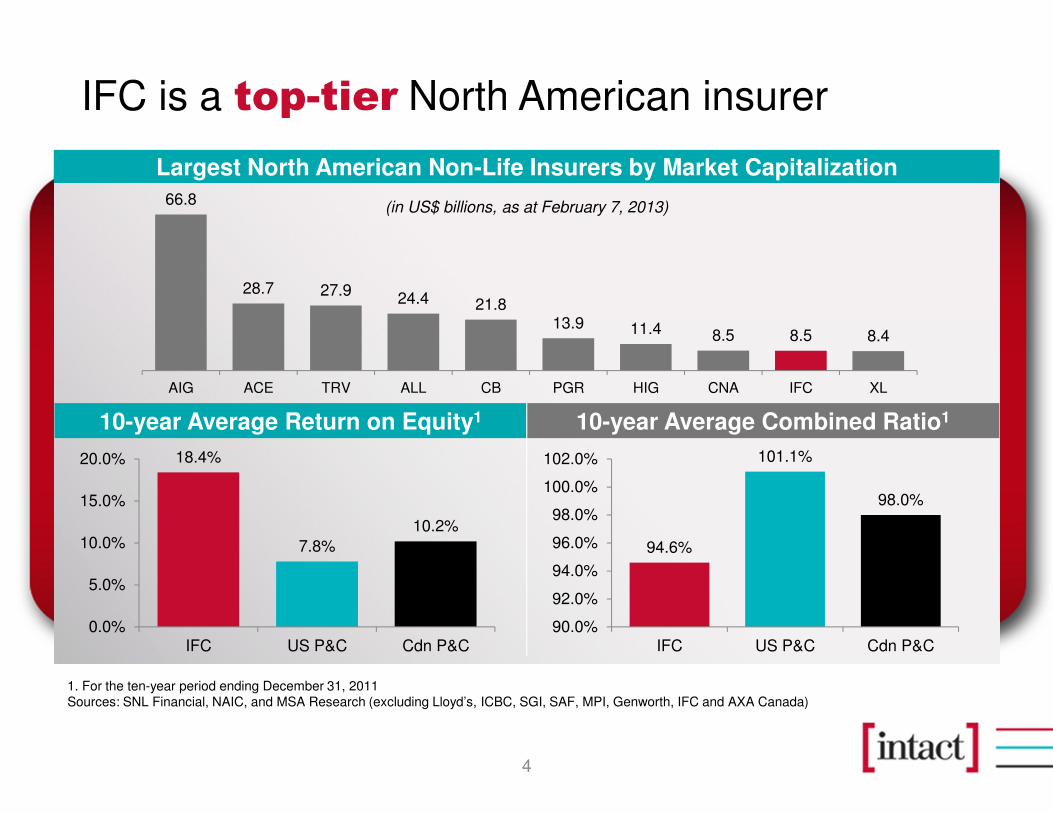
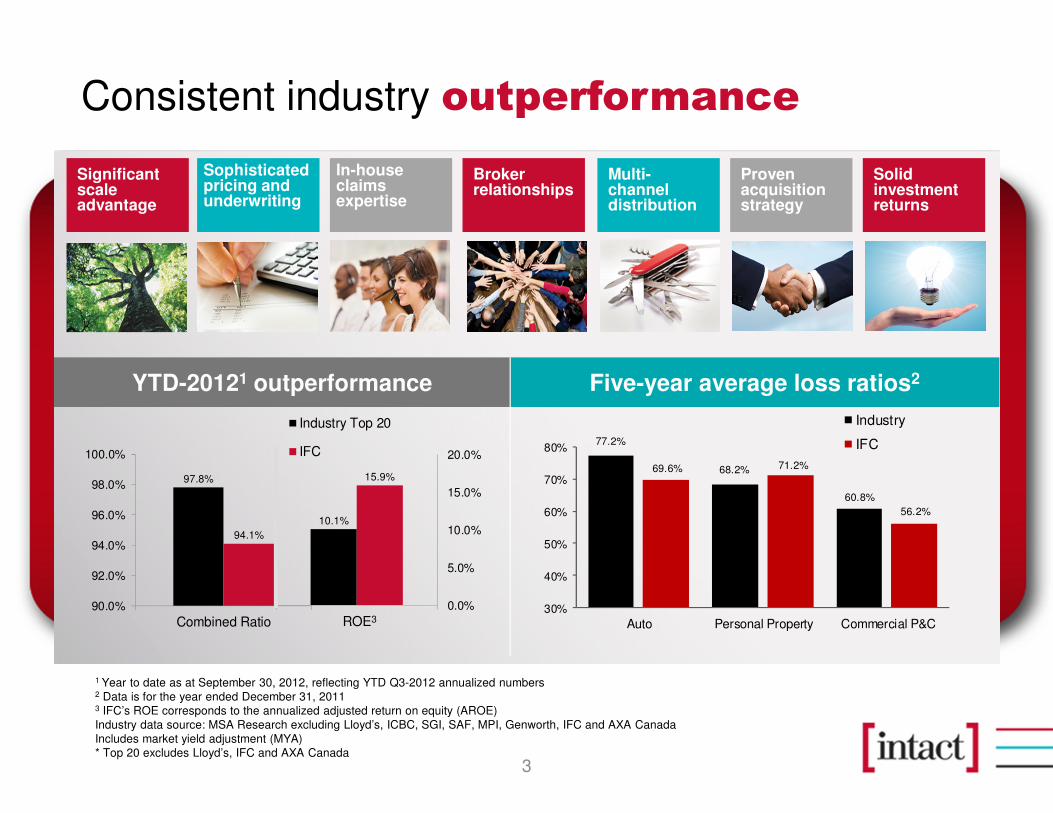
66.8
28.7 27.924.4 21.8
13.9 11.4 8.5 8.5 8.4
AIG ACE TRV ALL CB PGR HIG CNA IFC XL
IFC is a top-tier North American insurer
4
Largest North American Non-Life Insurers by Market Capitalization
1. For the ten-year period ending December 31, 2011Sources: SNL Financial, NAIC, and MSA Research (excluding Lloyd’s, ICBC, SGI, SAF, MPI, Genworth, IFC and AXA Canada)
(in US$ billions, as at February 7, 2013)
10-year Average Return on Equity1 10-year Average Combined Ratio1
94.6%
101.1%
98.0%
90.0%
92.0%
94.0%
96.0%
98.0%
100.0%
102.0%
IFC US P&C Cdn P&C
18.4%
7.8%
10.2%
0.0%
5.0%
10.0%
15.0%
20.0%
IFC US P&C Cdn P&C
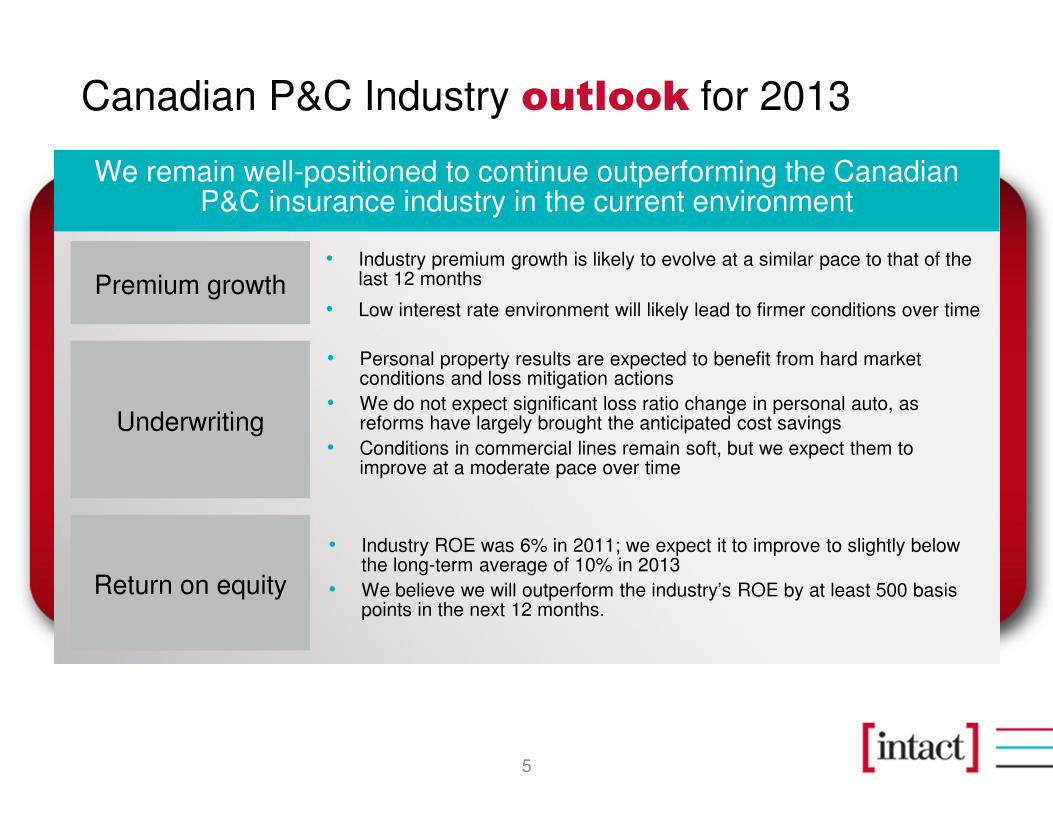
Canadian P&C Industry outlook for 2013
5
We remain well-positioned to continue outperforming the Canadian P&C insurance industry in the current environment
Premium growth
Return on equity
• Personal property results are expected to benefit from hard market conditions and loss mitigation actions
• We do not expect significant loss ratio change in personal auto, as reforms have largely brought the anticipated cost savings
• Conditions in commercial lines remain soft, but we expect them to improve at a moderate pace over time
• Industry premium growth is likely to evolve at a similar pace to that of the last 12 months
• Low interest rate environment will likely lead to firmer conditions over time
Underwriting
• Industry ROE was 6% in 2011; we expect it to improve to slightly below the long-term average of 10% in 2013
• We believe we will outperform the industry’s ROE by at least 500 basis points in the next 12 months.
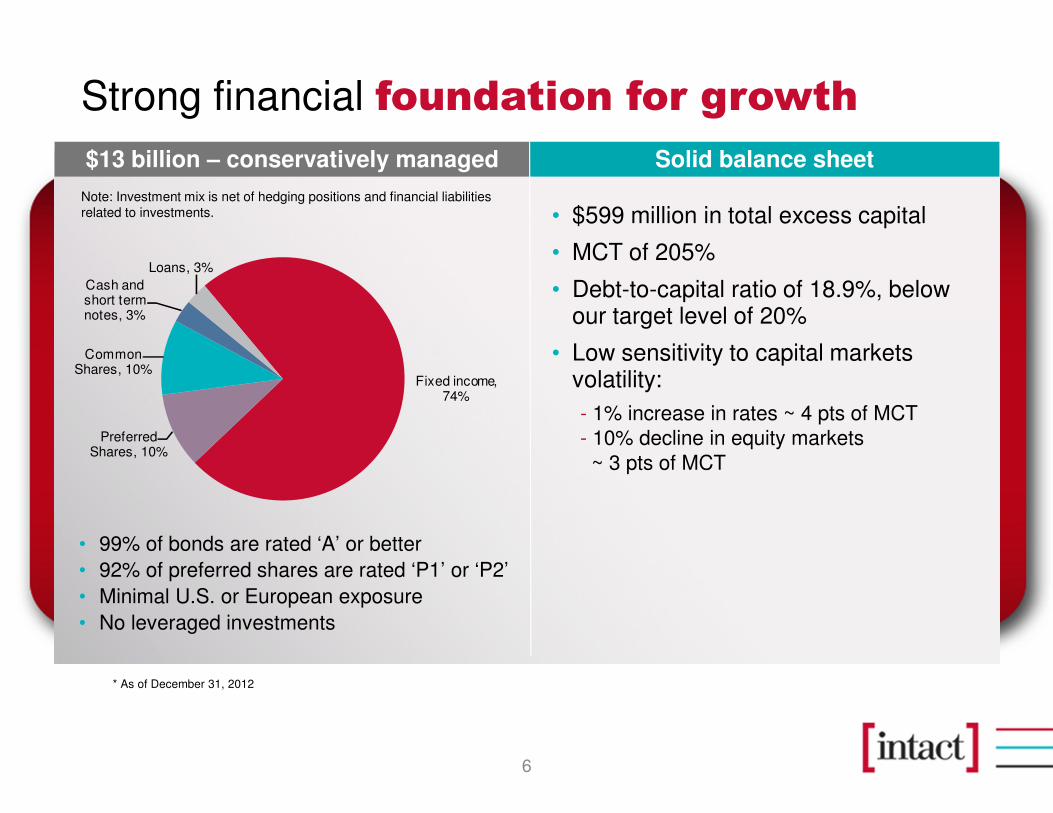
Strong financial foundation for growth
6
Note: Investment mix is net of hedging positions and financial liabilities related to investments.
• 99% of bonds are rated ‘A’ or better
• 92% of preferred shares are rated ‘P1’ or ‘P2’
• Minimal U.S. or European exposure
• No leveraged investments
• $599 million in total excess capital
• MCT of 205%
• Debt-to-capital ratio of 18.9%, below our target level of 20%
• Low sensitivity to capital markets volatility:
- 1% increase in rates ~ 4 pts of MCT- 10% decline in equity markets ~ 3 pts of MCT
Fixed income, 74%
Preferred Shares, 10%
Common Shares, 10%
Cash and short term notes, 3%
Loans, 3%
Solid balance sheet$13 billion – conservatively managed
* As of December 31, 2012
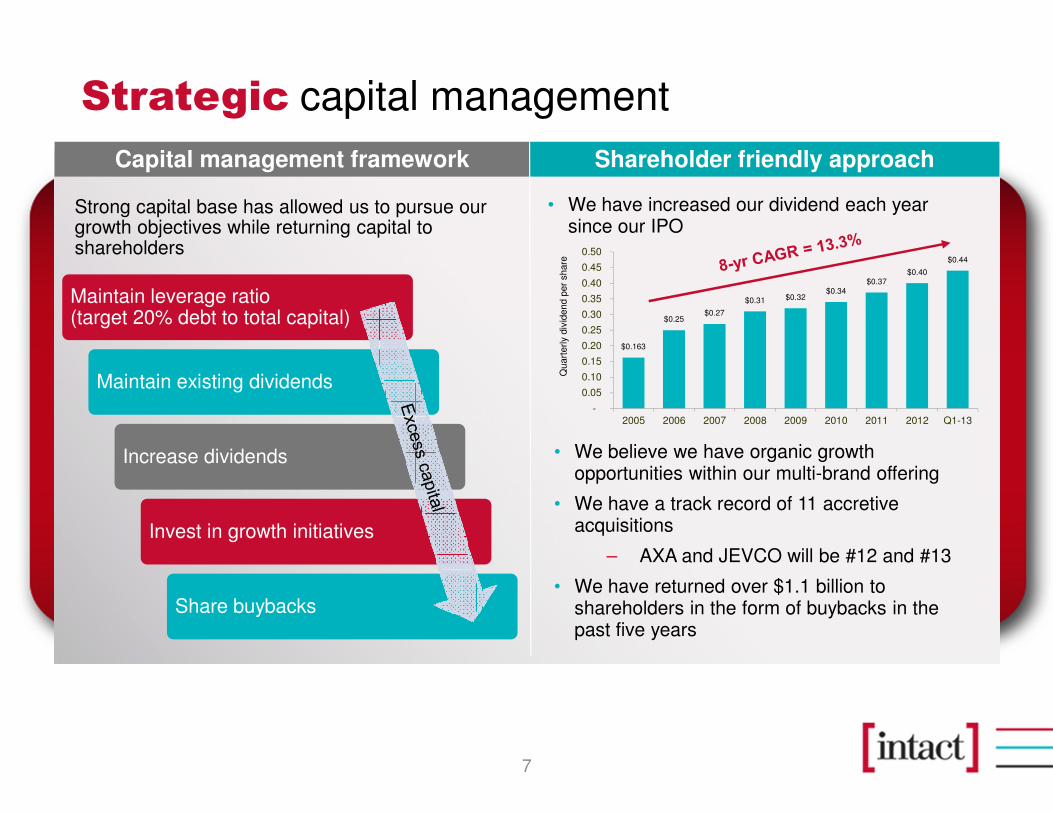
Strategic capital management
7
• We have increased our dividend each year since our IPO
Shareholder friendly approachCapital management framework
Strong capital base has allowed us to pursue our growth objectives while returning capital to shareholders
$0.163
$0.25$0.27
$0.31 $0.32$0.34
$0.37$0.40
$0.44
-
0.05
0.10
0.15
0.20
0.25
0.30
0.35
0.40
0.45
0.50
2005 2006 2007 2008 2009 2010 2011 2012 Q1-13
Quart
erly
div
idend p
er
share
• We believe we have organic growth opportunities within our multi-brand offering
• We have a track record of 11 accretive acquisitions
– AXA and JEVCO will be #12 and #13
• We have returned over $1.1 billion to shareholders in the form of buybacks in the past five years
Maintain leverage ratio (target 20% debt to total capital)
Maintain existing dividends
Increase dividends
Invest in growth initiatives
Share buybacks
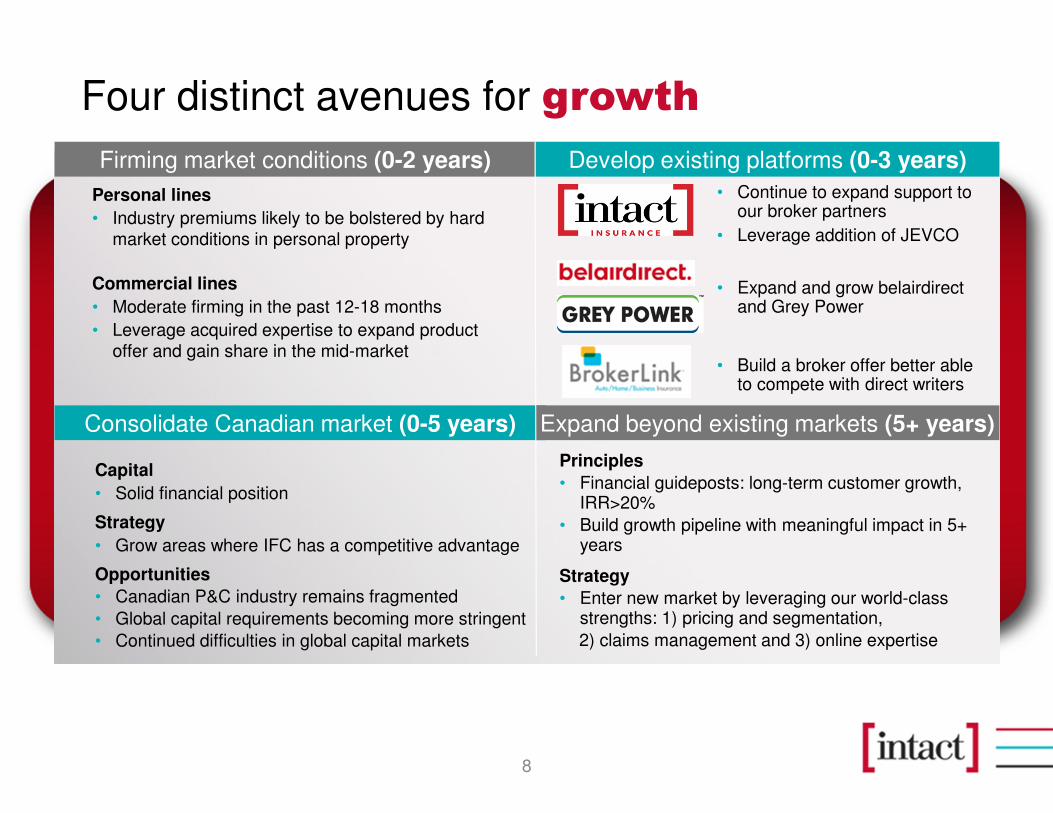
Four distinct avenues for growth
Consolidate Canadian market (0-5 years) Expand beyond existing markets (5+ years)
Develop existing platforms (0-3 years)Firming market conditions (0-2 years)
Capital
• Solid financial position
Strategy
• Grow areas where IFC has a competitive advantage
Opportunities
• Canadian P&C industry remains fragmented
• Global capital requirements becoming more stringent
• Continued difficulties in global capital markets
Principles
• Financial guideposts: long-term customer growth, IRR>20%
• Build growth pipeline with meaningful impact in 5+ years
Strategy
• Enter new market by leveraging our world-class strengths: 1) pricing and segmentation,
2) claims management and 3) online expertise
• Continue to expand support to our broker partners
• Leverage addition of JEVCO
• Expand and grow belairdirect and Grey Power
• Build a broker offer better able to compete with direct writers
8
Personal lines
• Industry premiums likely to be bolstered by hard market conditions in personal property
Commercial lines
• Moderate firming in the past 12-18 months
• Leverage acquired expertise to expand product offer and gain share in the mid-market
9
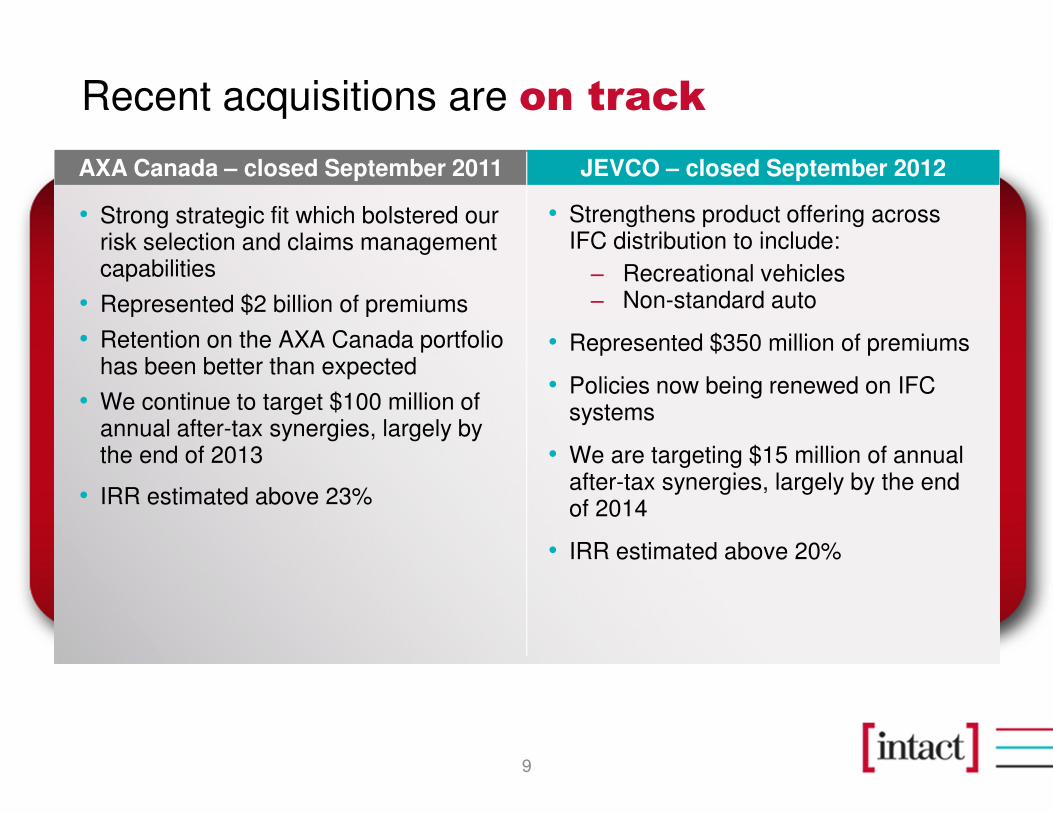
Recent acquisitions are on track
JEVCO – closed September 2012AXA Canada – closed September 2011
• Strong strategic fit which bolstered our risk selection and claims management capabilities
• Represented $2 billion of premiums
• Retention on the AXA Canada portfolio has been better than expected
• We continue to target $100 million ofannual after-tax synergies, largely by the end of 2013
• IRR estimated above 23%
• Strengthens product offering across IFC distribution to include:
− Recreational vehicles− Non-standard auto
• Represented $350 million of premiums
• Policies now being renewed on IFC systems
• We are targeting $15 million of annual after-tax synergies, largely by the end of 2014
• IRR estimated above 20%
Building on our sustainable competitive advantages
10
� We have a sustainable competitive advantage versus the industry
� We continue our shareholder-friendly approach tocapital management
� Our solid financial position enables us to take advantage of growth opportunities which may present themselves in a consolidating industry
� Integrations are progressing well, and on many fronts, better than we expected
� Best-in-class team in place to reach our goals
Intact Financial Corporation
Appendices
(TSX: IFC)
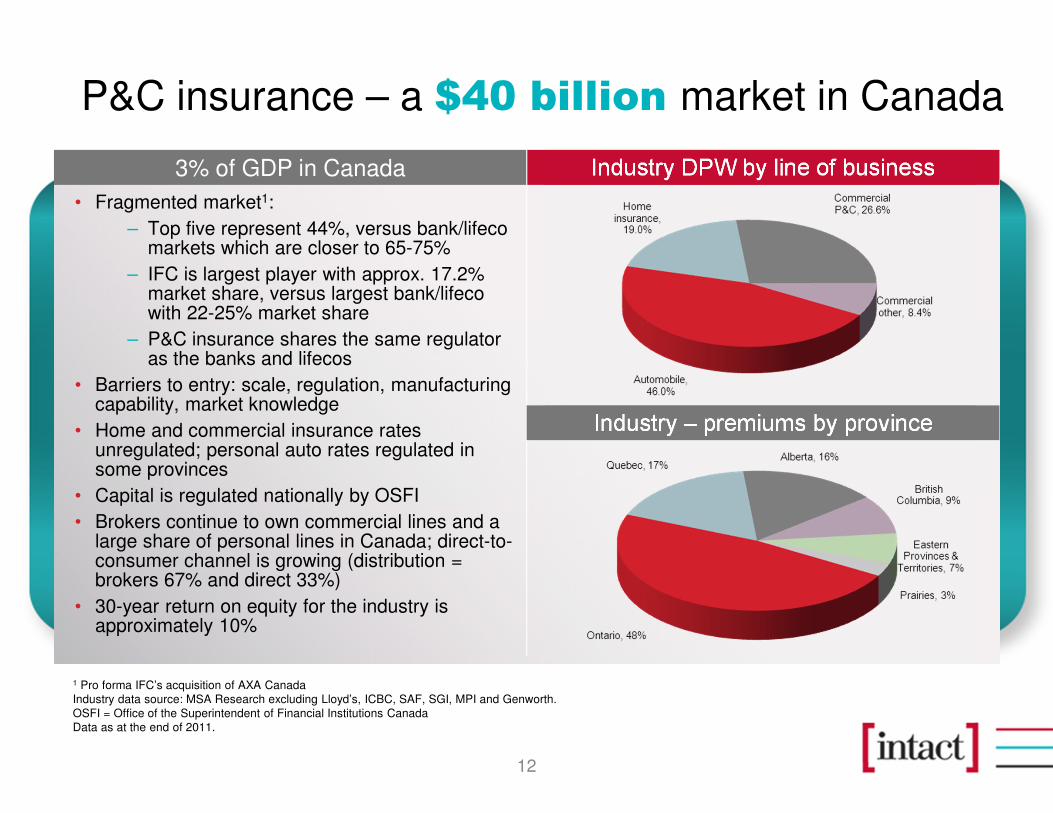
P&C insurance – a $40 billion market in Canada
12
Industry DPW by line of business3% of GDP in Canada
Industry – premiums by province
• Fragmented market1:
– Top five represent 44%, versus bank/lifecomarkets which are closer to 65-75%
– IFC is largest player with approx. 17.2% market share, versus largest bank/lifecowith 22-25% market share
– P&C insurance shares the same regulator as the banks and lifecos
• Barriers to entry: scale, regulation, manufacturing capability, market knowledge
• Home and commercial insurance rates unregulated; personal auto rates regulated in some provinces
• Capital is regulated nationally by OSFI
• Brokers continue to own commercial lines and a large share of personal lines in Canada; direct-to-consumer channel is growing (distribution = brokers 67% and direct 33%)
• 30-year return on equity for the industry is approximately 10%
1 Pro forma IFC’s acquisition of AXA CanadaIndustry data source: MSA Research excluding Lloyd’s, ICBC, SAF, SGI, MPI and Genworth. OSFI = Office of the Superintendent of Financial Institutions Canada Data as at the end of 2011.
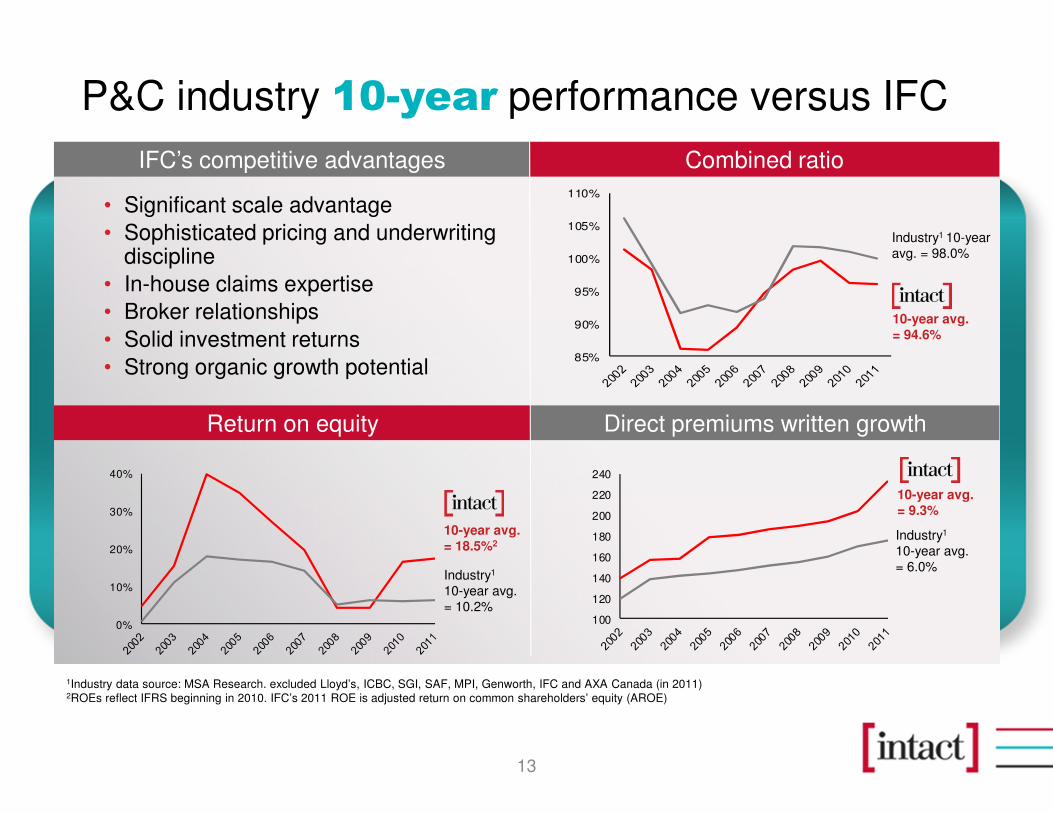
P&C industry 10-year performance versus IFC
13
Return on equity Direct premiums written growth
Combined ratioIFC’s competitive advantages
0%
10%
20%
30%
40%
85%
90%
95%
100%
105%
110%
100
120
140
160
180
200
220
240
• Significant scale advantage
• Sophisticated pricing and underwriting discipline
• In-house claims expertise
• Broker relationships
• Solid investment returns
• Strong organic growth potential
1Industry data source: MSA Research. excluded Lloyd’s, ICBC, SGI, SAF, MPI, Genworth, IFC and AXA Canada (in 2011)2ROEs reflect IFRS beginning in 2010. IFC’s 2011 ROE is adjusted return on common shareholders’ equity (AROE)
Industry1
10-year avg.= 10.2%
10-year avg.= 18.5%2
Industry1 10-year avg. = 98.0%
10-year avg.= 94.6%
10-year avg.= 9.3%
Industry1
10-year avg.= 6.0%
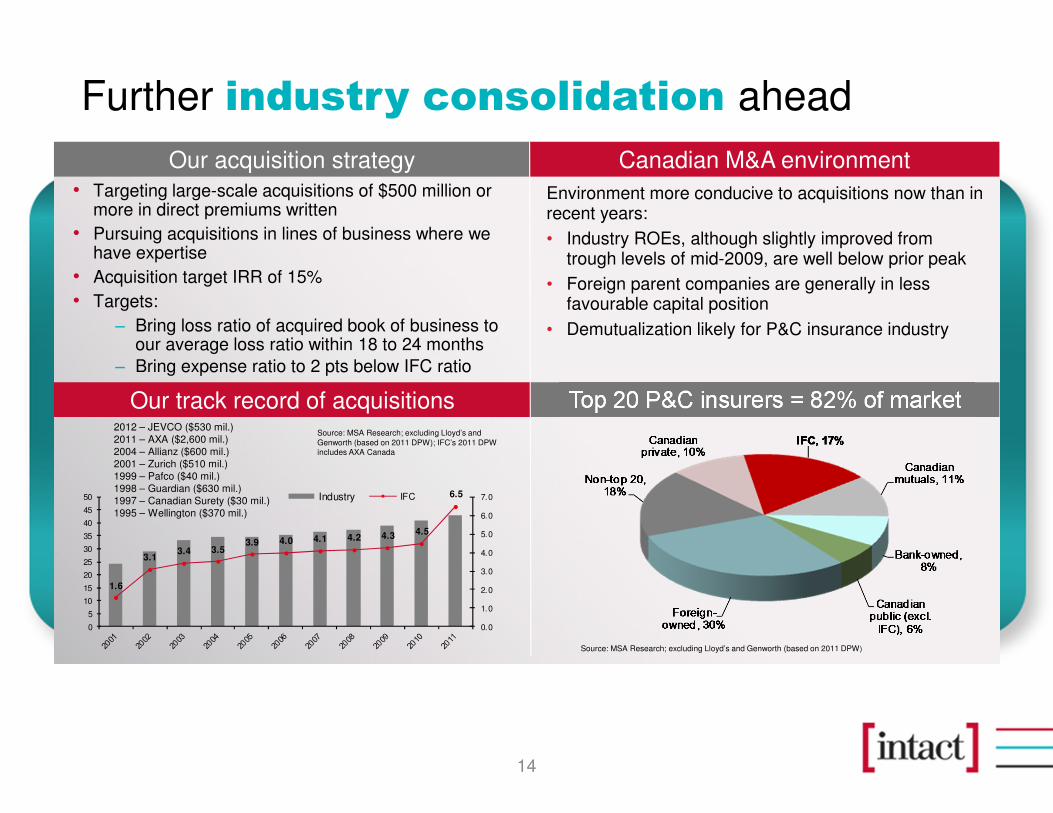
Further industry consolidation ahead
14
Our track record of acquisitions Top 20 P&C insurers = 82% of market
Canadian M&A environmentOur acquisition strategy
Source: MSA Research; excluding Lloyd’s and Genworth (based on 2011 DPW)
Environment more conducive to acquisitions now than in recent years:
• Industry ROEs, although slightly improved from trough levels of mid-2009, are well below prior peak
• Foreign parent companies are generally in less favourable capital position
• Demutualization likely for P&C insurance industry
• Targeting large-scale acquisitions of $500 million or more in direct premiums written
• Pursuing acquisitions in lines of business where we have expertise
• Acquisition target IRR of 15%
• Targets:
− Bring loss ratio of acquired book of business to our average loss ratio within 18 to 24 months
− Bring expense ratio to 2 pts below IFC ratio
1.6
3.13.4 3.5
3.9 4.0 4.1 4.2 4.3 4.5
6.5
0.0
1.0
2.0
3.0
4.0
5.0
6.0
7.0
0
5
10
15
20
25
30
35
40
45
50 Industry IFC
Source: MSA Research; excluding Lloyd’s and Genworth (based on 2011 DPW); IFC’s 2011 DPW includes AXA Canada
2012 – JEVCO ($530 mil.)2011 – AXA ($2,600 mil.)2004 – Allianz ($600 mil.)2001 – Zurich ($510 mil.)1999 – Pafco ($40 mil.)1998 – Guardian ($630 mil.)1997 – Canadian Surety ($30 mil.)1995 – Wellington ($370 mil.)
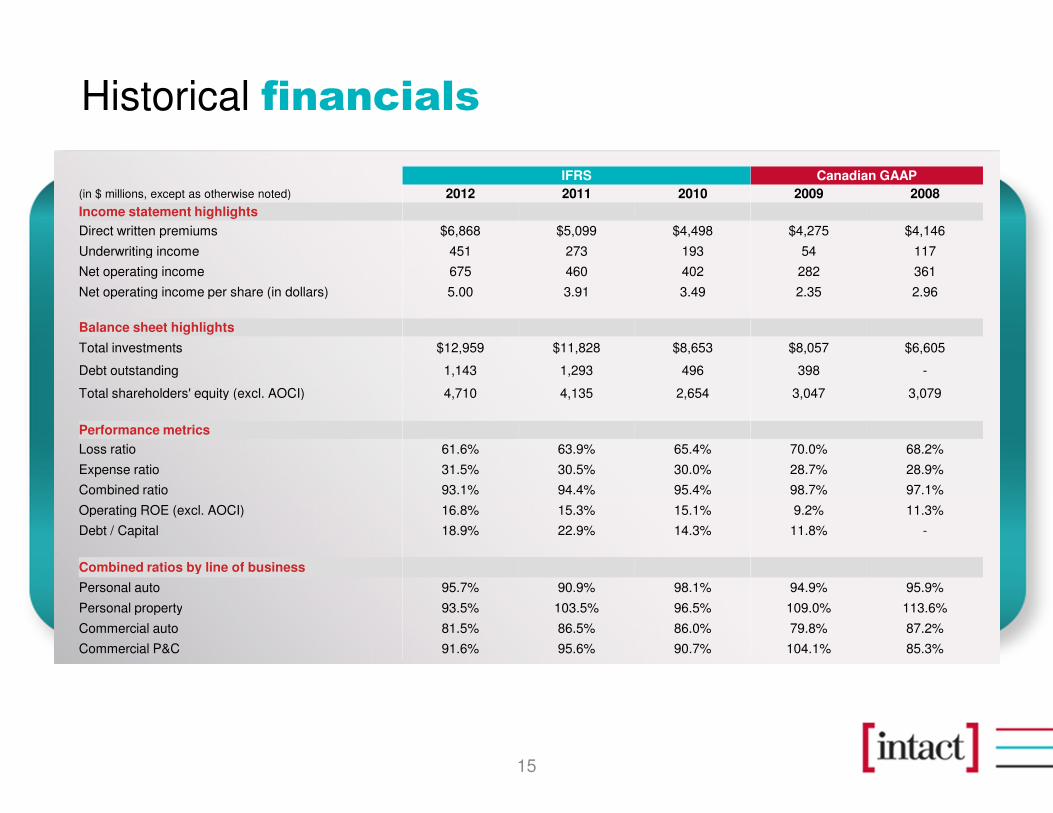
Historical financials
15
IFRS Canadian GAAP
(in $ millions, except as otherwise noted) 2012 2011 2010 2009 2008
Income statement highlights
Direct written premiums $6,868 $5,099 $4,498 $4,275 $4,146
Underwriting income 451 273 193 54 117
Net operating income 675 460 402 282 361
Net operating income per share (in dollars) 5.00 3.91 3.49 2.35 2.96
Balance sheet highlights
Total investments $12,959 $11,828 $8,653 $8,057 $6,605
Debt outstanding 1,143 1,293 496 398 -
Total shareholders' equity (excl. AOCI) 4,710 4,135 2,654 3,047 3,079
Performance metrics
Loss ratio 61.6% 63.9% 65.4% 70.0% 68.2%
Expense ratio 31.5% 30.5% 30.0% 28.7% 28.9%
Combined ratio 93.1% 94.4% 95.4% 98.7% 97.1%
Operating ROE (excl. AOCI) 16.8% 15.3% 15.1% 9.2% 11.3%
Debt / Capital 18.9% 22.9% 14.3% 11.8% -
Combined ratios by line of business
Personal auto 95.7% 90.9% 98.1% 94.9% 95.9%
Personal property 93.5% 103.5% 96.5% 109.0% 113.6%
Commercial auto 81.5% 86.5% 86.0% 79.8% 87.2%
Commercial P&C 91.6% 95.6% 90.7% 104.1% 85.3%
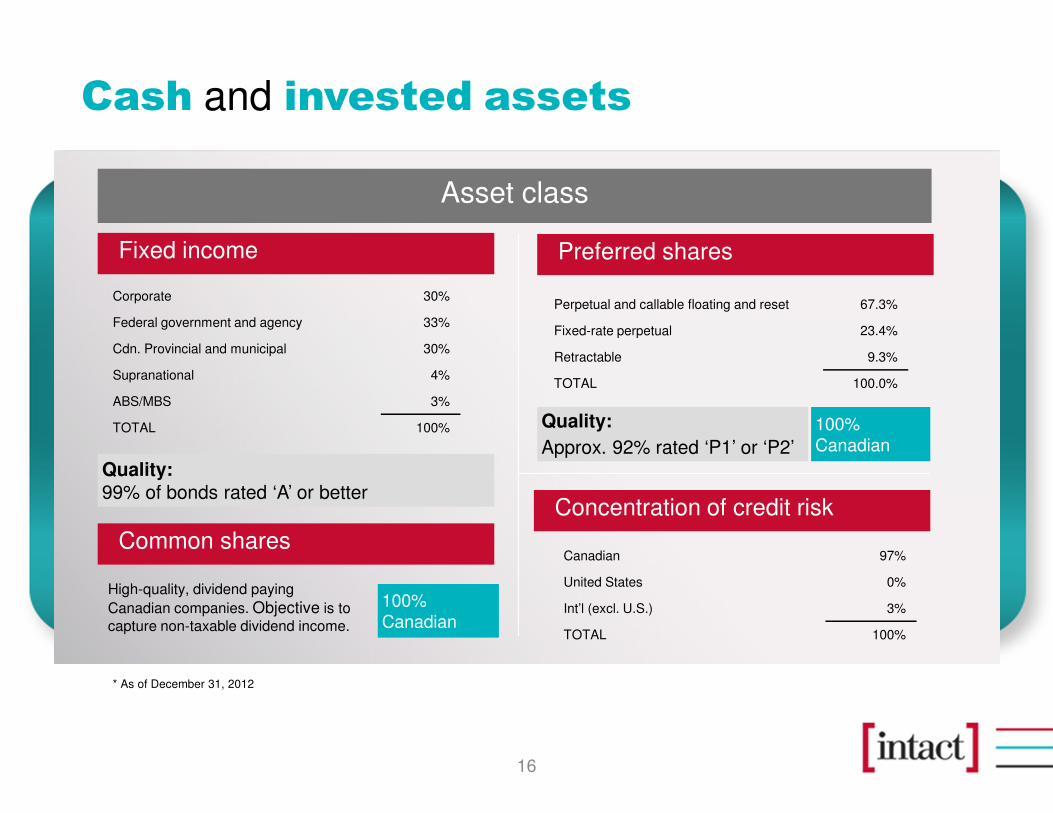
Cash and invested assets
16
Asset class
Quality:
Approx. 92% rated ‘P1’ or ‘P2’
High-quality, dividend paying
Canadian companies. Objective is to capture non-taxable dividend income.
Fixed income
Quality:99% of bonds rated ‘A’ or better
100% Canadian
* As of December 31, 2012
Preferred shares
Concentration of credit risk
100% Canadian
Corporate 30%
Federal government and agency 33%
Cdn. Provincial and municipal 30%
Supranational 4%
ABS/MBS 3%
TOTAL 100%
Perpetual and callable floating and reset 67.3%
Fixed-rate perpetual 23.4%
Retractable 9.3%
TOTAL 100.0%
Canadian 97%
United States 0%
Int’l (excl. U.S.) 3%
TOTAL 100%
Common shares
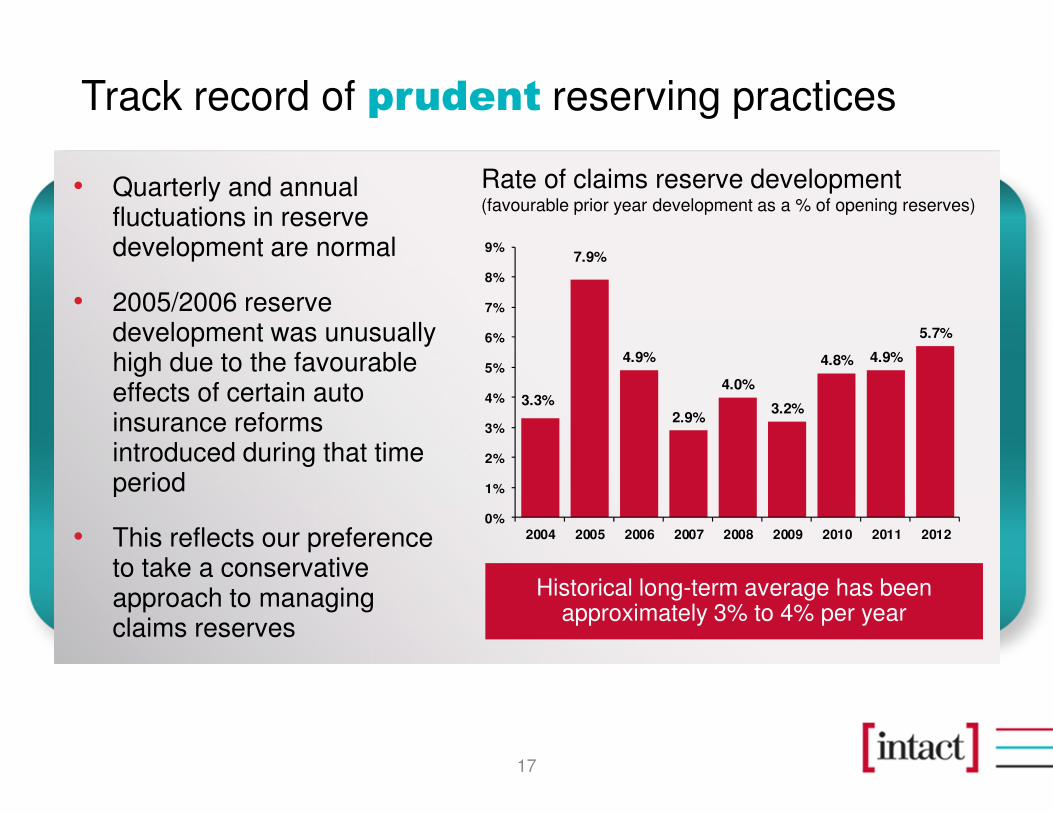
Track record of prudent reserving practices
17
3.3%
7.9%
4.9%
2.9%
4.0%
3.2%
4.8% 4.9%
5.7%
0%
1%
2%
3%
4%
5%
6%
7%
8%
9%
2004 2005 2006 2007 2008 2009 2010 2011 2012
Historical long-term average has been approximately 3% to 4% per year
• Quarterly and annual fluctuations in reserve development are normal
• 2005/2006 reserve development was unusually high due to the favourable effects of certain auto insurance reforms introduced during that time period
• This reflects our preference to take a conservative approach to managing claims reserves
Rate of claims reserve development(favourable prior year development as a % of opening reserves)
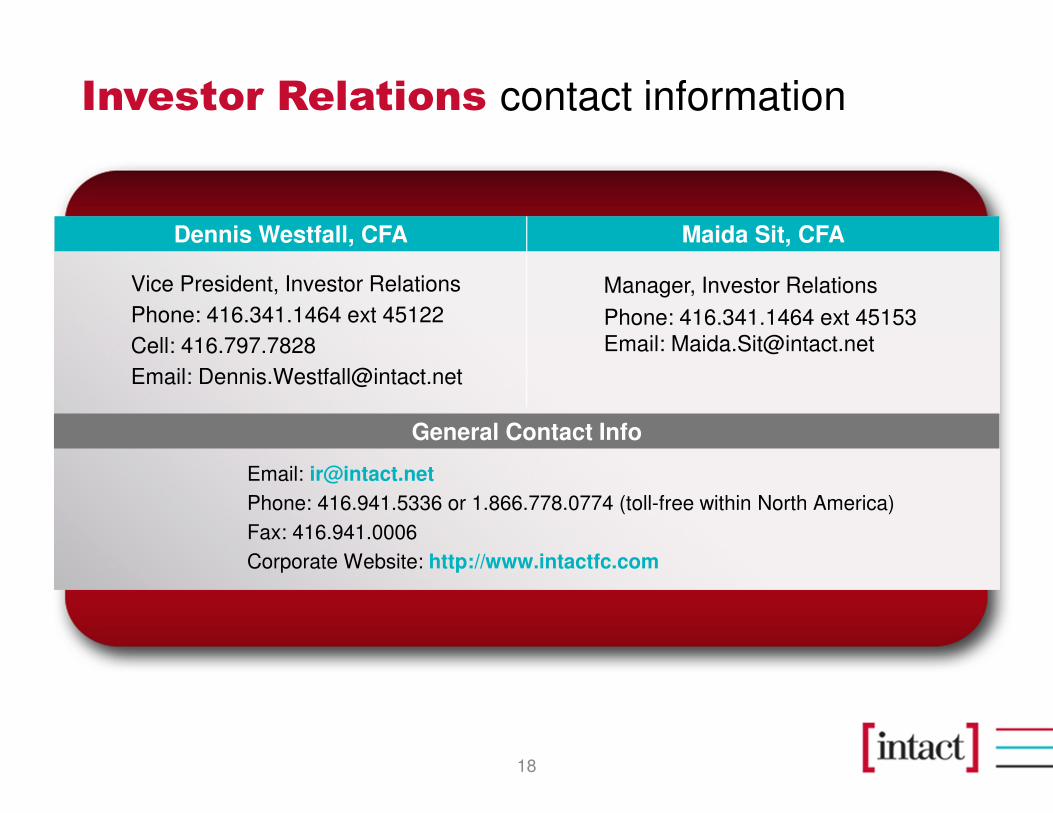
Investor Relations contact information
18
Vice President, Investor Relations
Phone: 416.341.1464 ext 45122
Cell: 416.797.7828
Email: [email protected]
Manager, Investor Relations
Phone: 416.341.1464 ext 45153 Email: [email protected]
Email: [email protected]
Phone: 416.941.5336 or 1.866.778.0774 (toll-free within North America)
Fax: 416.941.0006
Corporate Website: http://www.intactfc.com
Maida Sit, CFADennis Westfall, CFA
General Contact Info

Forward looking statements and disclaimer
19
Certain of the statements included in this presentation about the Company’s current and future plans, expectations and intentions, results, levels of activity, performance, goals or achievements or any other future events or developments constitute forward-looking statements. The words “may”, “will”, “would”, “should”, “could”, “expects”, “plans”, “intends”, “trends”, “indications”, “anticipates”, “believes”, “estimates”, “predicts”, “likely”, “potential” or the negative or other variations of these words or other similar or comparable words or phrases, are intended to identify forward-looking statements. Forward-looking statements are based on estimates and assumptions made by management based on management’s experience and perception of historical trends, current conditions and expected future developments, as well as other factors that management believes are appropriate in the circumstances. Many factors could cause the Company’s actual results, performance or achievements or future events or developments to differ materially from those expressed or implied by the forward-looking statements, including, without limitation, the following factors: the Company’s ability to implement its strategy or operate its business as management currently expects; its ability to accurately assess the risks associated with the insurance policies that the Company writes; unfavourable capital market developments or other factors which may affect the Company’s investments and funding obligations under its pension plans; the cyclical nature of the P&C insurance industry; management’s ability to accurately predict future claims frequency; government regulations designed to protect policyholders and creditors rather than investors; litigation and regulatory actions; periodic negative publicity regarding the insurance industry; intense competition; the Company’s reliance on brokers and third parties to sell its products to clients; the Company’s ability to successfully pursue its acquisition strategy; the Company’s ability to execute its business strategy; the terms and conditions of, and regulatory approvals relating to, the integration of JEVCO; various other actions to be taken or requirements to be met in connection with the JEVCO acquisition and integrating the Company and JEVCO; synergies arising from, and the Company’s integration plans relating to the AXA Canada acquisition; management's estimates and expectations in relation to resulting accretion, IRR and debt-to-capital ratio after closing of the AXA Canada and JEVCO acquisitions; various other actions to be taken or requirements to be met in connection with the AXA Canada acquisition and integrating the Company and AXA Canada; the Company’s participation in the Facility Association (a mandatory pooling arrangement among all industry participants) and similar mandated risk-sharing pools; terrorist attacks and ensuing events; the occurrence of catastrophic events; the Company’s ability to maintain its financial strength and issuer credit ratings; access to debt financing and the Company's ability to compete for large commercial business; the Company’s ability to alleviate risk through reinsurance; the Company’s ability to successfully manage credit risk (including credit risk related to the financial health of reinsurers); the Company’s reliance on information technology and telecommunications systems; the Company’s dependence on key employees; changes in laws or regulations; general economic, financial and political conditions; the Company’s dependence on the results of operations of its subsidiaries; the volatility of the stock market and other factors affecting the Company’s share price; and future sales of a substantial number of its common shares. All of the forward-looking statements included in this presentation are qualified by these cautionary statements and those made in Section 11 - Risk Management of the 2012 MD&A. These factors are not intended to represent a complete list of the factors that could affect the Company. These factors should, however, be considered carefully. Although the forward-looking statements are based upon what management believes to be reasonable assumptions, the Company cannot assure investors that actual results will be consistent with these forward-looking statements. When relying on forward-looking statements to make decisions, investors should ensure the preceding information is carefully considered. Undue reliance should not be placed on forward-looking statements made herein. The Company and management have no intention and undertake no obligation to update or revise any forward-looking statements, whether as a result of new information, future events or otherwise, except as required by law.
Forward looking statements and disclaimer
20
Disclaimer
This Presentation does not constitute or form part of any offer for sale or solicitation of any offer to buy or subscribe for any securities nor shall it or any part of it form the basis of or be relied on in connection with, or act as any inducement to enter into, any contract or commitment whatsoever.
The information contained in this Presentation concerning the Company does not purport to be all-inclusive or to contain all the information that a prospective purchaser or investor may desire to have in evaluating whether or not to make an investment in the Company. The information is qualified entirely by reference to the Company’s publicly disclosed information.
No representation or warranty, express or implied, is made or given by or on behalf of the Company or any of its the directors, officers or employees as to the accuracy, completeness or fairness of the information or opinions contained in this Presentation and no responsibility or liability is accepted by any person for such information or opinions. In furnishing this Presentation, the Company does not undertake or agree to any obligation to provide the attendees with access to any additional information or to update this Presentation or to correct any inaccuracies in, or omissions from, this Presentation that may become apparent. The information and opinions contained in this Presentation are provided as at the date of this Presentation. The contents of this Presentation are not to be construed as legal, financial or tax advice. Each prospective purchaser should contact his, her or its own legal adviser, independent financial adviser or tax adviser for legal, financial or tax advice.
The Company uses both International Financial Reporting Standards (“IFRS”) and certain non-IFRS measures to assess performance. Non-IFRS measures do not have any standardized meaning prescribed by IFRS and are unlikely to be comparable to any similar measures presented by other companies. Management of the Company analyzes performance based on underwriting ratios such as combined, general expenses and claims ratios as well as other performance measures such as return on equity (“ROE”) and operating return on equity. These measures and other insurance related terms are defined in the Company’s glossary available on the Intact Financial Corporation web site at www.intactfc.com in the “Investor Relations” section. Additional information about the Company, including the Annual Information Form, may be found online on SEDAR at www.sedar.com.