Bank of America 2Q18 Financial Results · TheCompany reports regulatory under both the Standardized...
28
Bank of America 2Q18 Financial Results July 16, 2018
Transcript of Bank of America 2Q18 Financial Results · TheCompany reports regulatory under both the Standardized...

Bank of America 2Q18 Financial Results
July 16, 2018

Second Quarter 2018 Highlights (Comparisons to 2Q17)
2
1 On December 22, 2017, the Tax Cuts and Jobs Act (the “Tax Act”) was enacted, which included a lower U.S. corporate tax rate effective in 2018.2 Represents a non-GAAP financial measure. For a description of selected items, see slide 6. For important presentation information, see slide 27.3 Regulatory capital ratios at June 30, 2018 are preliminary. The Company reports regulatory capital ratios under both the Standardized and Advanced approaches. The approach that
yields the lower ratio is used to assess capital adequacy, which for CET1 is the Standardized approach for 2Q18 and the Advanced approaches for 1Q18 and 2Q17.4 See note A on slide 24 for definition of Global Liquidity Sources.
Earnings 1 Returns and Efficiency
Client Balances Capital and Liquidity
• Net income of $6.8B, up 33%
• Diluted earnings per share of $0.63, up 43%
• Total revenue of $22.6B, down 1%
– Excluding 2Q17 selected item, up 3% 2
• Noninterest expense of $13.3B, down 5%
– Excluding 2Q17 selected item, down 3% 2
• 14 consecutive quarters of positive operating leverage
• Return on average assets of 1.17% improved 27 bps
• Return on average common shareholders’ equity of 10.8% increased 300 bps
• Return on average tangible common shareholders’ equity of 15.2% improved 428 bps 2
• Efficiency ratio of 59% improved 249 bps
• $165B of Common Equity Tier 1 Capital (CET1) and CET1 ratio of 11.4% 3
• $512B of average Global Liquidity Sources 4
• Plan to return ~$26B of capital to common shareholders over next four quarters, which includes:
– 25% increase in quarterly dividend
– More than $20B in gross share repurchases
• Average loans and leases in business segments grew 5%
– Consumer up 6% and commercial up 5%
• Average deposits increased 3%
• Merrill Edge brokerage assets increased 20%
• Client balances within Global Wealth & Investment Management increased to nearly $2.8T

3
Operating Leverage Trend
Note: Amounts may not total due to rounding.1 Operating leverage calculated as the year-over-year percentage change in revenue, net of interest expense, less the percentage change in noninterest expense. Quarterly expense
for 2017 and 2016 has been restated to reflect the accounting change for retirement-eligible equity incentives adopted in 4Q17; 2015 and 2014 periods are as reported.2 Revenue growth and operating leverage adjusted to exclude the $0.9B noninterest income charge in 4Q17 from the Tax Act; represents a non-GAAP financial measure.
(7%)
(5%)
(2%)
1%
(3%)
1%3%
2%
7% 7%
1%
7%
4%
(1%)
(29%)
(25%)
(31%)
(2%)
(10%)
(2%) (1%)
(4%)
(1%)
2%
(2%)(1%) (1%)
(5%)
1Q15 2Q15 3Q15 4Q15 1Q16 2Q16 3Q16 4Q16 1Q17 2Q17 3Q17 4Q17 1Q18 2Q18
YoY revenue growth (decline) YoY expense growth (decline) Operating leverage
Positive Operating Leverage for 14 Consecutive Quarters 1
+22% +21% +29% +3% +8% +3% +5% +6% +8% +6% +3% +8% 2
2
Reported revenue growth of 2% and
operating leverage of 3%
+5% +4%

4
1 Digital users represent mobile and / or online users in consumer businesses.2 Mobile channel usage represents the total number of application logins using a smartphone or tablet.3 Digital appointments represent the number of appointments made via online, smartphone or tablet.
30.8 32.2 34.0 35.7
17.620.2
22.9 25.3
0
10
20
30
40
2Q15 2Q16 2Q17 2Q18Digital banking usersMobile banking users
Active Digital Banking Users (MM)
Consumer Banking Digital Usage Trends 1
65% 76%
35% 24%
0%
20%
40%
60%
80%
100%
2Q15 2Q18
Digital (Mobile/ATM) Financial Center
Digital Deposit Transactions
16%18%
22% 24%
0%
5%
10%
15%
20%
25%
2Q15 2Q16 2Q17 2Q18
Digital Sales
Users (MM)
2.0
4.0
June '17Launch
July2018
2x
Erica Users (MM)
0.05
2.0
April '18Launch
July2018
34x
621
9421,061
1,379
120
289371
460
0
100
200
300
400
500
600
700
0
400
800
1,200
1,600
2Q15 2Q16 2Q17 2Q18Mobile Channel Usage (MM)Digital Appointments (000's)
Mobile Channel Usage 2, 3
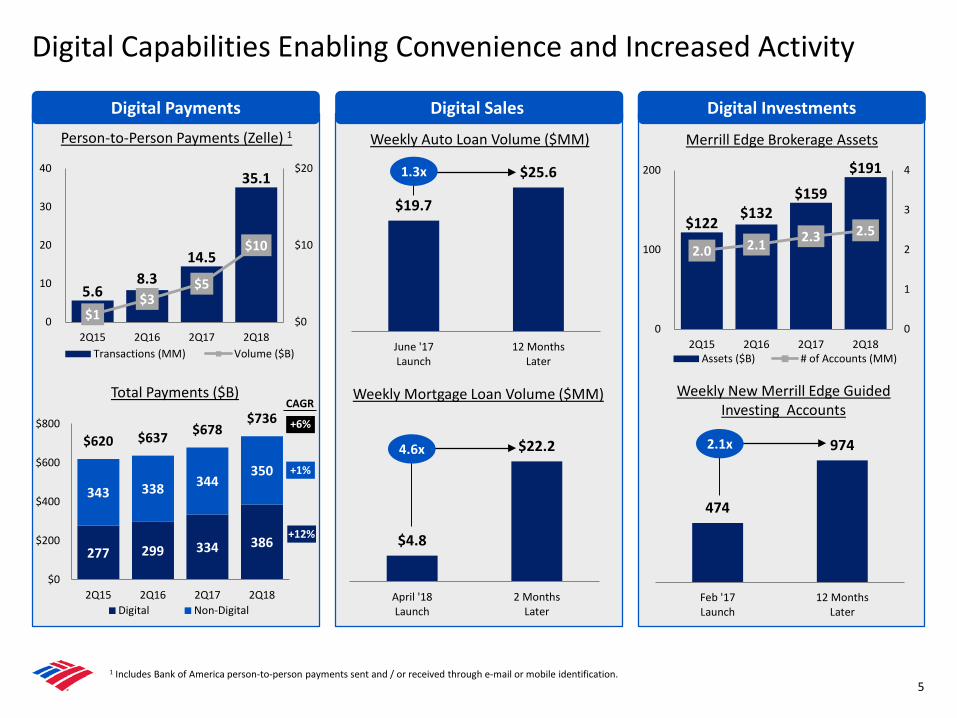
5.6 8.3
14.5
35.1
$1$3
$5
$10
$0
$10
$20
0
10
20
30
40
2Q15 2Q16 2Q17 2Q18Transactions (MM) Volume ($B)
51 Includes Bank of America person-to-person payments sent and / or received through e-mail or mobile identification.
Digital Capabilities Enabling Convenience and Increased Activity
Person-to-Person Payments (Zelle) 1Digital Payments Digital Sales Digital Investments
Weekly Auto Loan Volume ($MM)
$19.7
$25.6
June '17Launch
12 MonthsLater
1.3x
Weekly Mortgage Loan Volume ($MM)
$4.8
$22.2
April '18Launch
2 MonthsLater
4.6x
Weekly New Merrill Edge Guided Investing Accounts
474
974
Feb '17Launch
12 MonthsLater
2.1x
277 299 334 386
343 338 344 350
$620 $637 $678$736
$0
$200
$400
$600
$800
2Q15 2Q16 2Q17 2Q18Digital Non-Digital
CAGR
+6%
+1%
Total Payments ($B)
+12%
$122$132
$159
$191
2.0 2.1 2.3 2.5
0
1
2
3
4
0
100
200
2Q15 2Q16 2Q17 2Q18Assets ($B) # of Accounts (MM)
Merrill Edge Brokerage Assets

Financial Results
6
Total revenue, net of interest expense $22.6 $22.8 (1) %
Noninterest expense 13.3 14.0 (5)
Provision for credit losses 0.8 0.7 14
Pretax income 8.5 8.1 5
Income tax expense 1.7 3.0 (43)
Net income $6.8 $5.1 33
Diluted earnings per share $0.63 $0.44 43
Average diluted common shares (in millions) 10,309 10,835 (5)
Return Metrics and Efficiency
Return on average assets 1.17 % 0.90 % 27 bpsReturn on average common shareholders' equity 10.8 7.8 300
Return on average tangible common shareholders' equity 115.2 10.9 428
Efficiency ratio 59 61 (249)
2Q17
Summary Income Statement ($B, except per share data) % Inc / (Dec)
Inc / (Dec)
2Q172Q18
2Q18
Note: Amounts may not total due to rounding. 1 Represent non-GAAP financial measures. For important presentation information, see slide 27. 2 2Q17 included an after-tax gain of $0.1B for the sale of the non-U.S. consumer credit card business of which a $0.8B pretax gain was recorded in other income mostly offset by a
$0.7B tax expense.
Excl. 2Q17 Selected Items 1
Revenue +3%
Expense (3%)
Pretax income +11%
2Q17 Selected Items 2Q17Revenue, net of interest expense
Pretax gain on sale of non-U.S. consumer card 2 $0.8Noninterest expense
Data center impairment charge 0.3Pretax income $0.5

Balance Sheet, Liquidity and Capital
7
Balance Sheet ($B, EOP balances) Total assets $2,291.7 $2,328.5 $2,254.7Total loans and leases 935.8 934.1 916.7Total loans and leases in business segments 1 874.6 869.5 837.8Total deposits 1,309.7 1,328.7 1,263.0
Funding & Liquidity ($B)Long-term debt $226.6 $232.3 $223.9Global Liquidity Sources (average) 2 512 522 513Liquidity coverage ratio 2, 3 122 % 124 % n/aTime to Required Funding (in months) 2 60 56 49
Equity ($B)Common shareholders' equity $241.0 $241.6 $245.4Common equity ratio 10.5 % 10.4 % 10.9 %Tangible common shareholders' equity 4 $170.9 $171.3 $175.3Tangible common equity ratio 4 7.7 % 7.6 % 8.0 %
Per Share Data Book value per common share $24.07 $23.74 $24.85Tangible book value per common share 4 17.07 16.84 17.75Common shares outstanding (in billions) 5 10.01 10.18 9.88
2Q18 1Q18 2Q17 Basel 3 Capital ($B) 3
Common equity tier 1 capital (CET1) $164.9 $164.8 $168.7Standardized approach
Risk-weighted assets $1,444 $1,452 $1,405CET1 ratio 11.4 % 11.4 % 12.0 %
Advanced approachesRisk-weighted assets $1,438 $1,458 $1,464CET1 ratio 11.5 % 11.3 % 11.5 %
Supplementary leverage Supplementary leverage ratio (SLR) 6.7 % 6.8 % n/a
2Q18 1Q18 2Q17
Note: n/a = not applicable. 1 Excludes loans and leases in All Other. 2 See notes A, B and C on slide 24 for definitions of Global Liquidity Sources, Liquidity Coverage Ratio and Time to Required Funding, respectively. 3 Regulatory capital and liquidity ratios at June 30, 2018 are preliminary. The Company reports regulatory capital ratios under both the Standardized and Advanced approaches. The
approach that yields the lower ratio is used to assess capital adequacy, which for CET1 is the Standardized approach for 2Q18 and the Advanced approaches for 1Q18 and 2Q17. Basel 3 transition provisions for regulatory capital adjustments and deductions were fully phased-in as of January 1, 2018. Prior periods are presented on a fully phased-in basis. SLR requirements became effective January 1, 2018.
4 Represents a non-GAAP financial measure. For important presentation information, see slide 27.5 Berkshire Hathaway exercised its warrants to purchase 700 million shares of BAC common stock in 3Q17 using its Series T preferred shares, which resulted in an increase to common
shares outstanding.
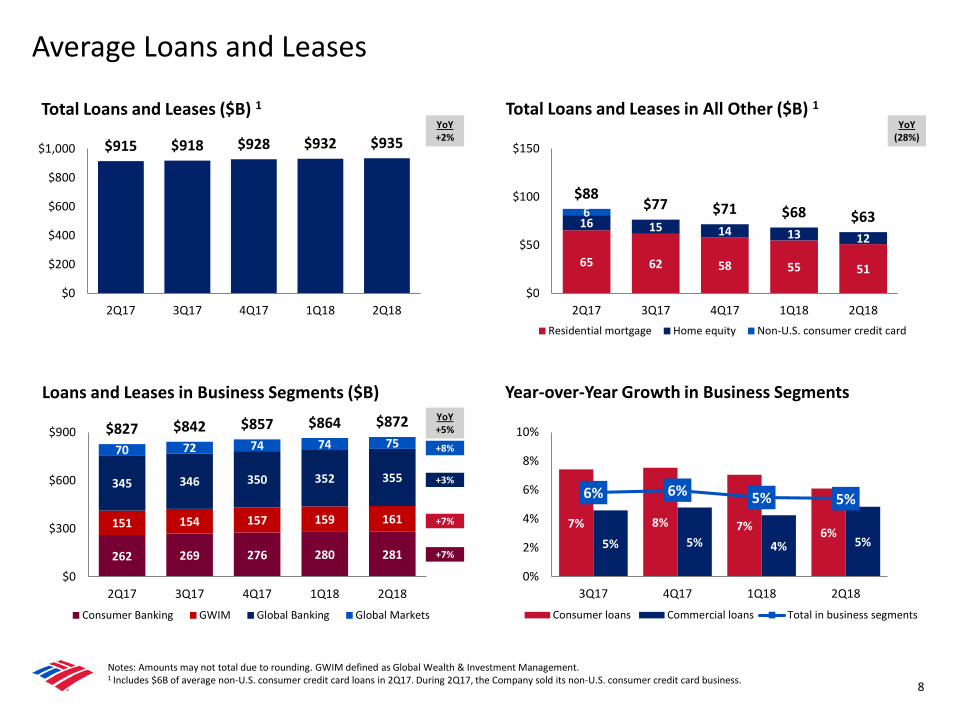
Total Loans and Leases ($B) 1
$915 $918 $928 $932 $935
$0
$200
$400
$600
$800
$1,000
2Q17 3Q17 4Q17 1Q18 2Q18
Total Loans and Leases in All Other ($B) 1
65 62 58 55 51
16 15 14 13 12
6 $88
$77 $71 $68 $63
$0
$50
$100
$150
2Q17 3Q17 4Q17 1Q18 2Q18Residential mortgage Home equity Non-U.S. consumer credit card
Notes: Amounts may not total due to rounding. GWIM defined as Global Wealth & Investment Management.1 Includes $6B of average non-U.S. consumer credit card loans in 2Q17. During 2Q17, the Company sold its non-U.S. consumer credit card business.
Loans and Leases in Business Segments ($B)
262 269 276 280 281
151 154 157 159 161
345 346 350 352 355
70 72 74 74 75$827 $842 $857 $864 $872
$0
$300
$600
$900
2Q17 3Q17 4Q17 1Q18 2Q18Consumer Banking GWIM Global Banking Global Markets
+7%
+7%
+3%
+8%
Average Loans and Leases
8
YoY+2%
YoY(28%)
YoY+5%
Year-over-Year Growth in Business Segments
7% 8% 7% 6%5% 5% 4% 5%
6% 6% 5% 5%
0%
2%
4%
6%
8%
10%
3Q17 4Q17 1Q18 2Q18Consumer loans Commercial loans Total in business segments

$908 $900
$1,237
$911 $996
0.40% 0.39%0.53%
0.40% 0.43%
0.0%
0.5%
1.0%
$0
$700
$1,400
2Q17 3Q17 4Q17 1Q18 2Q18
Net charge-offs Net charge-off ratio
1 Excludes loans measured at fair value.
Asset Quality
9
$726$834
$1,001$834 $827
$0
$700
$1,400
2Q17 3Q17 4Q17 1Q18 2Q18
• Total net charge-offs of $1.0B increased $0.1B from 1Q18; net charge-off ratio increased 3 bps to 0.43%
– Consumer net charge-offs were flat at $0.8B
Reflected seasonally higher losses in credit card, offset by improvement in home equity
Net charge-off ratio of 0.74%
– Commercial net charge-offs increased $0.1B to $0.2B
Net charge-off ratio of 0.14% (0.09% excl. small business)
• Provision expense of $0.8B decreased modestly from 1Q18
– Net reserve release of $0.2B in 2Q18, reflected improvements in consumer real estate and energy, partially offset by portfolio seasoning in consumer credit card
• Allowance for loan and lease losses of $10.1B, represented 1.08% of total loans and leases 1
• Nonperforming loans (NPLs) decreased $0.5B from 1Q18, driven by improvements in both consumer and commercial
– 47% of consumer NPLs are contractually current
• Commercial reservable criticized utilized exposure decreased $1.0B from 1Q18, reflecting broad-based improvements
Net Charge-offs ($MM) 1
Provision for Credit Losses ($MM)
$157 $169
$468
$81$166
0.14% 0.14%0.39%
0.07% 0.14%0.0%
0.5%
1.0%
1.5%
2.0%
$0
$250
$500
$750
2Q17 3Q17 4Q17 1Q18 2Q18
C&I Small business and other Commercial NCO ratio
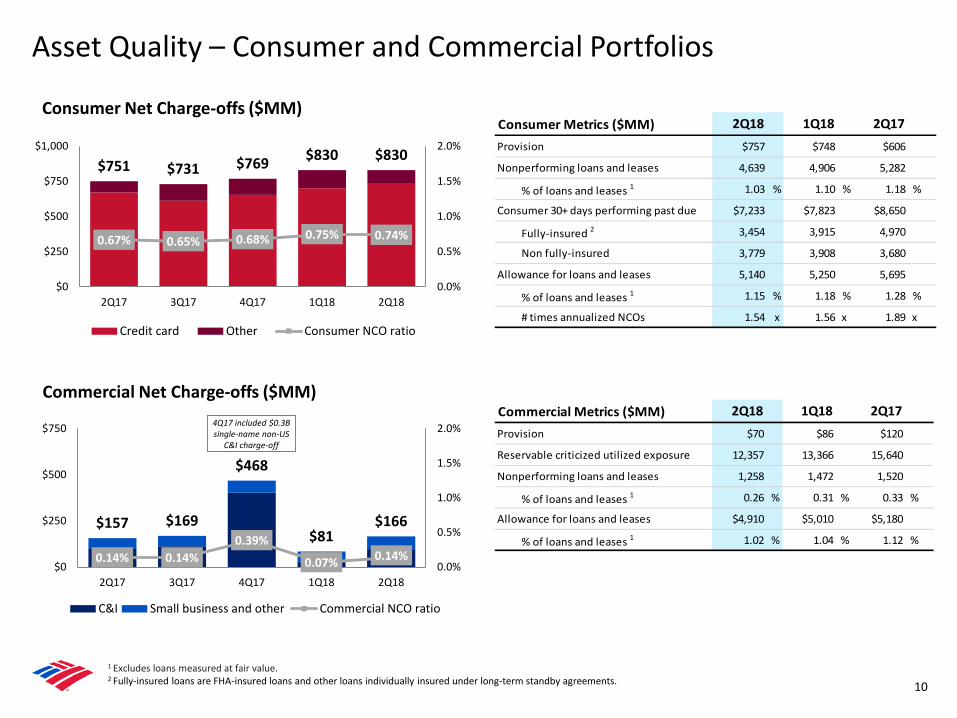
Asset Quality – Consumer and Commercial Portfolios
10
Consumer Net Charge-offs ($MM)
$751 $731 $769 $830 $830
0.67% 0.65% 0.68% 0.75% 0.74%
0.0%
0.5%
1.0%
1.5%
2.0%
$0
$250
$500
$750
$1,000
2Q17 3Q17 4Q17 1Q18 2Q18
Credit card Other Consumer NCO ratio
1 Excludes loans measured at fair value.2 Fully-insured loans are FHA-insured loans and other loans individually insured under long-term standby agreements.
Consumer Metrics ($MM) Provision $757 $748 $606
Nonperforming loans and leases 4,639 4,906 5,282
% of loans and leases 1 1.03 % 1.10 % 1.18 %
Consumer 30+ days performing past due $7,233 $7,823 $8,650
Fully-insured 2 3,454 3,915 4,970
Non fully-insured 3,779 3,908 3,680
Allowance for loans and leases 5,140 5,250 5,695
% of loans and leases 1 1.15 % 1.18 % 1.28 %
# times annualized NCOs 1.54 x 1.56 x 1.89 x
2Q18 1Q18 2Q17
Commercial Net Charge-offs ($MM) Commercial Metrics ($MM) Provision $70 $86 $120
Reservable criticized utilized exposure 12,357 13,366 15,640
Nonperforming loans and leases 1,258 1,472 1,520
% of loans and leases 1 0.26 % 0.31 % 0.33 %
Allowance for loans and leases $4,910 $5,010 $5,180
% of loans and leases 1 1.02 % 1.04 % 1.12 %
2Q18 1Q18 2Q174Q17 included $0.3B single-name non-US
C&I charge-off
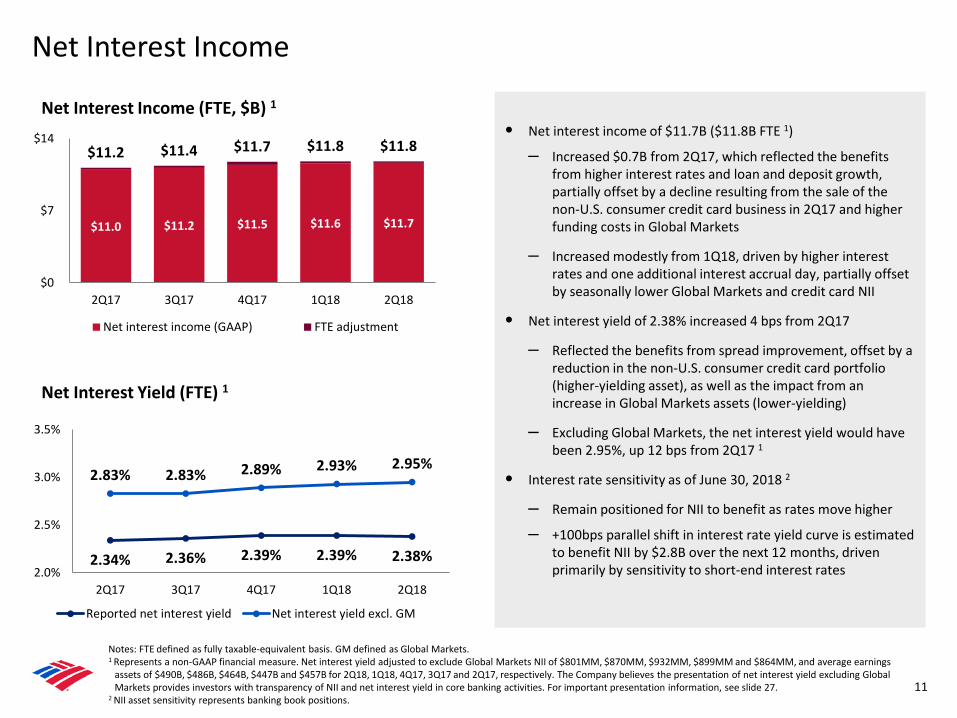
Net Interest Income
11
• Net interest income of $11.7B ($11.8B FTE 1)
– Increased $0.7B from 2Q17, which reflected the benefits from higher interest rates and loan and deposit growth, partially offset by a decline resulting from the sale of the non-U.S. consumer credit card business in 2Q17 and higher funding costs in Global Markets
– Increased modestly from 1Q18, driven by higher interest rates and one additional interest accrual day, partially offset by seasonally lower Global Markets and credit card NII
• Net interest yield of 2.38% increased 4 bps from 2Q17
– Reflected the benefits from spread improvement, offset by a reduction in the non-U.S. consumer credit card portfolio (higher-yielding asset), as well as the impact from an increase in Global Markets assets (lower-yielding)
– Excluding Global Markets, the net interest yield would have been 2.95%, up 12 bps from 2Q17 1
• Interest rate sensitivity as of June 30, 2018 2
– Remain positioned for NII to benefit as rates move higher
– +100bps parallel shift in interest rate yield curve is estimated to benefit NII by $2.8B over the next 12 months, driven primarily by sensitivity to short-end interest rates
Notes: FTE defined as fully taxable-equivalent basis. GM defined as Global Markets. 1 Represents a non-GAAP financial measure. Net interest yield adjusted to exclude Global Markets NII of $801MM, $870MM, $932MM, $899MM and $864MM, and average earnings
assets of $490B, $486B, $464B, $447B and $457B for 2Q18, 1Q18, 4Q17, 3Q17 and 2Q17, respectively. The Company believes the presentation of net interest yield excluding Global Markets provides investors with transparency of NII and net interest yield in core banking activities. For important presentation information, see slide 27.
2 NII asset sensitivity represents banking book positions.
Net Interest Income (FTE, $B) 1
$11.0 $11.2 $11.5 $11.6 $11.7
$11.2 $11.4 $11.7 $11.8 $11.8
$0
$7
$14
2Q17 3Q17 4Q17 1Q18 2Q18
Net interest income (GAAP) FTE adjustment
Net Interest Yield (FTE) 1
2.34% 2.36% 2.39% 2.39% 2.38%
2.83% 2.83% 2.89% 2.93% 2.95%
2.0%
2.5%
3.0%
3.5%
2Q17 3Q17 4Q17 1Q18 2Q18
Reported net interest yield Net interest yield excl. GM
61% 61%65%
60% 59%
30%
40%
50%
60%
70%
2Q17 3Q17 4Q17 1Q18 2Q18
Note: Amounts may not total due to rounding.
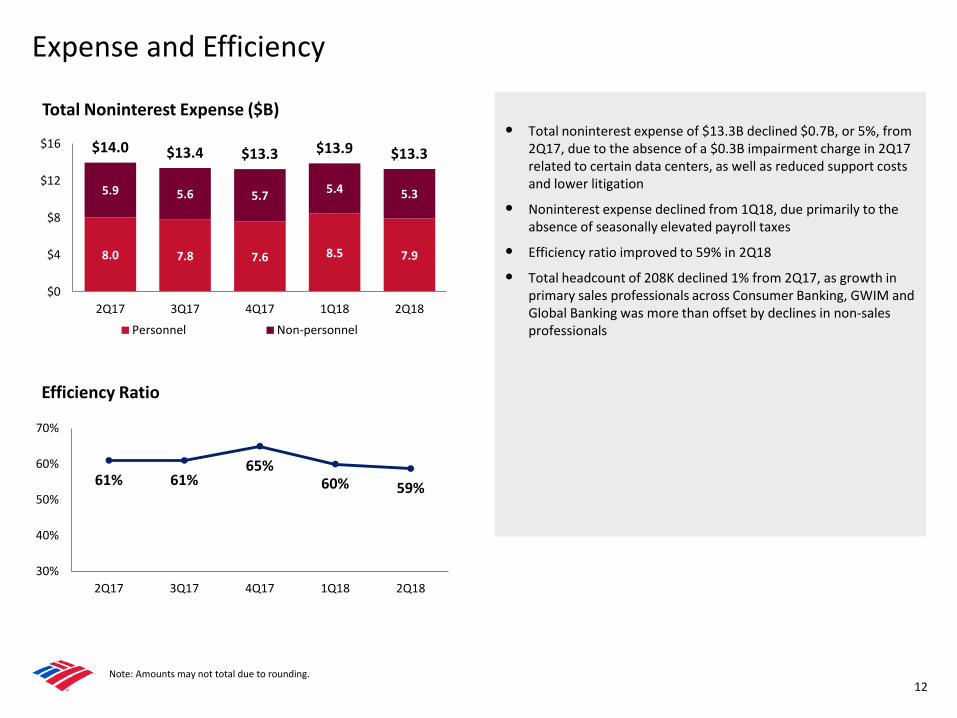
• Total noninterest expense of $13.3B declined $0.7B, or 5%, from 2Q17, due to the absence of a $0.3B impairment charge in 2Q17 related to certain data centers, as well as reduced support costs and lower litigation
• Noninterest expense declined from 1Q18, due primarily to the absence of seasonally elevated payroll taxes
• Efficiency ratio improved to 59% in 2Q18
• Total headcount of 208K declined 1% from 2Q17, as growth in primary sales professionals across Consumer Banking, GWIM and Global Banking was more than offset by declines in non-sales professionals
Total Noninterest Expense ($B)
8.0 7.8 7.6 8.5 7.9
5.9 5.6 5.7 5.4 5.3
$14.0 $13.4 $13.3 $13.9 $13.3
$0
$4
$8
$12
$16
2Q17 3Q17 4Q17 1Q18 2Q18
Personnel Non-personnel
Efficiency Ratio
Expense and Efficiency
12

• Net income of $2.9B increased 42% from 2Q17; ROAAC of 31%
– 9% operating leverage (18th consecutive quarter of positive operating leverage)
• Revenue of $9.2B increased $0.7B, or 8%, from 2Q17
– Strong NII growth, driven by higher interest rates and growth in deposits and loans
– Noninterest income increased as higher card income and service charges more than offset lower mortgage banking income
• Provision increased from 2Q17, due primarily to credit card portfolio seasoning and loan growth
– Net charge-offs increased $0.1B to $0.9B
• Noninterest expense declined modestly from 2Q17, as investments for business growth were offset by improved productivity
– Efficiency ratio improved 409 bps to 48%– Continued investment in primary sales professionals, financial
center builds/renovations and digital capabilities • Average deposits of $688B grew $35B, or 5%, from 2Q17
– 51% of deposits in checking accounts; 91% primary accounts 4
– Average cost of deposits of 1.55% 2
• Average loans and leases of $281B increased $19B, or 7%, from 2Q17, driven by growth in residential mortgage and credit card
• Client brokerage assets of $191B grew $32B, or 20%, from 2Q17, driven by strong client flows and market performance
• Combined YoY growth in card spend increased to 8% (credit +8%, debit +7%) vs. 6% in the year-ago period
• Active mobile banking users of 25.3MM, up 11% from 2Q17, and mobile channel usage up 30% from 2Q17
Consumer Banking
13
Note: ROAAC defined as return on average allocated capital.1 Revenue, pretax income, income tax expense and efficiency ratio shown on an FTE basis. Tax expense compared to prior year impacted by a lower U.S. corporate tax rate.2 Cost of deposits calculated as annualized noninterest expense as a percentage of total average deposits within the Deposits subsegment. 3 Includes U.S. consumer credit card portfolios in Consumer Banking and GWIM. 4 Represents the percentage of consumer checking accounts that are estimated to be the customer’s primary account based on multiple relationship factors (e.g., linked to their direct
deposit).
Summary Income Statement ($MM) 1
Total revenue, net of interest expense $9,211 $179 $702Provision for credit losses 944 9 110Noninterest expense 4,397 (83) (14)Pretax income 3,870 253 606Income tax expense 987 65 (246)Net income $2,883 $188 $852
Key Indicators ($B) Average deposits $687.8 $674.4 $652.8
Rate paid on deposits 0.05 % 0.05 % 0.04 %Cost of deposits 2 1.55 1.61 1.59
Average loans and leases $280.7 $279.6 $261.5Net charge-off ratio 1.28 % 1.27 % 1.21 %Client brokerage assets $191.5 $182.1 $159.1Active mobile banking users (MM) 25.3 24.8 22.9 % Consumer sales through digital channels 24 % 26 % 22 %Number of financial centers 4,411 4,435 4,542 Combined credit / debit purchase volumes 3 $147.5 $137.4 $137.0Total consumer credit card risk-adjusted margin 3 8.07 % 8.32 % 8.40 %Return on average allocated capital 31 30 22 Allocated capital $37 $37 $37Efficiency ratio 1 48 % 50 % 52 %
Inc / (Dec)2Q18 1Q18 2Q17
2Q18 1Q18 2Q17

$4.4 $4.5 $4.5 $4.5 $4.4
52% 51% 50% 50%48%
40%
50%
60%
70%
$0
$1
$2
$3
$4
$5
2Q17 3Q17 4Q17 1Q18 2Q18
Noninterest expense Efficiency ratio
14
• #1 Consumer Deposit Market Share A
• 2018 JD Power Certified Mobile App • Named North America's Best Digital Bank B
• #1 Online Banking and Mobile Banking Functionality C
• #1 Digital U.S. Credit Card Sales Functionality D
• #1 Online Broker E
• #1 Home Equity Originator and #2 bank for Retail Mortgage Originations F
• #1 in Prime Auto Credit distribution of new originations among peers G
• #2 Small Business Lender H
6.0 6.2 6.4 6.5 6.6
2.5 2.6 2.6 2.5 2.6
$8.5 $8.8 $9.0 $9.0 $9.2
$0
$2
$4
$6
$8
$10
2Q17 3Q17 4Q17 1Q18 2Q18
Net interest income Noninterest income
87 89 90 91 90
51 52 53 52 51
43 42 41 39 38
63 68 73 77 8119 19 19 19 19
$262 $269 $276 $280 $281
$0
$100
$200
$300
2Q17 3Q17 4Q17 1Q18 2Q18Consumer credit card Vehicle lendingHome equity Residential mortgageSmall business / other
Average Loans and Leases ($B)
Total Expense ($B) and Efficiency 2Total Revenue ($B) 2
22
Note: Amounts may not total due to rounding. 1 See slide 25 for business leadership sources. 2 FTE basis.
50% 50% 50% 51% 51%
$653 $659 $666 $674 $688
0.04% 0.04% 0.04% 0.05% 0.05%
0.00%
0.05%
0.10%
0.15%
0.20%
$0
$100
$200
$300
$400
$500
$600
$700
2Q17 3Q17 4Q17 1Q18 2Q18Other deposits CheckingRate paid (%)
Average Deposits ($B)
Business Leadership 1
$159 $167 $177 $182 $191
$0
$50
$100
$150
$200
2Q17 3Q17 4Q17 1Q18 2Q18
Client Brokerage Assets (EOP, $B)
Consumer Banking Trends
Global Wealth & Investment Management
15
1 Revenue, pretax income, income tax expense and efficiency ratio shown on an FTE basis. Tax expense compared to prior year impacted by a lower U.S. corporate tax rate.2 Includes financial advisors in Consumer Banking of 2,622 and 2,206 in 2Q18 and 2Q17.
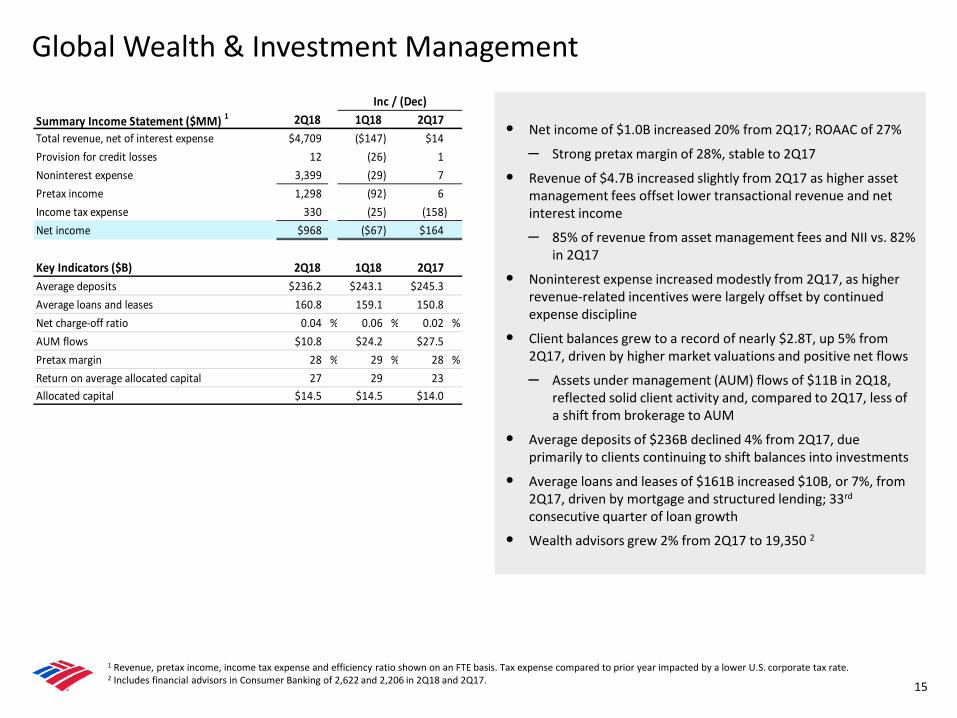
• Net income of $1.0B increased 20% from 2Q17; ROAAC of 27%
– Strong pretax margin of 28%, stable to 2Q17
• Revenue of $4.7B increased slightly from 2Q17 as higher asset management fees offset lower transactional revenue and net interest income
– 85% of revenue from asset management fees and NII vs. 82% in 2Q17
• Noninterest expense increased modestly from 2Q17, as higher revenue-related incentives were largely offset by continued expense discipline
• Client balances grew to a record of nearly $2.8T, up 5% from 2Q17, driven by higher market valuations and positive net flows
– Assets under management (AUM) flows of $11B in 2Q18, reflected solid client activity and, compared to 2Q17, less of a shift from brokerage to AUM
• Average deposits of $236B declined 4% from 2Q17, due primarily to clients continuing to shift balances into investments
• Average loans and leases of $161B increased $10B, or 7%, from 2Q17, driven by mortgage and structured lending; 33rd
consecutive quarter of loan growth
• Wealth advisors grew 2% from 2Q17 to 19,350 2
Summary Income Statement ($MM) 1
Total revenue, net of interest expense $4,709 ($147) $14Provision for credit losses 12 (26) 1 Noninterest expense 3,399 (29) 7Pretax income 1,298 (92) 6Income tax expense 330 (25) (158)Net income $968 ($67) $164
Key Indicators ($B) Average deposits $236.2 $243.1 $245.3Average loans and leases 160.8 159.1 150.8Net charge-off ratio 0.04 % 0.06 % 0.02 %AUM flows $10.8 $24.2 $27.5Pretax margin 28 % 29 % 28 %Return on average allocated capital 27 29 23 Allocated capital $14.5 $14.5 $14.0
Inc / (Dec)2Q18 1Q18 2Q17
2Q18 1Q18 2Q17

16
Business Leadership 1 Average Loans and Leases ($B)Average Deposits ($B)
• #1 U.S. wealth management market position across client assets, deposits and loans I
• #1 in personal trust assets under management J
• #1 in Barron’s U.S. high net worth client assets (2017)
• #1 in Barron’s Top 1,200 ranked Financial Advisors (2018)
• #1 in Forbes’ Top 500 America’s Top Next Generation Advisors (2017)
• #1 in Financial Times Top 401K Retirement Plan Advisers (2017)
• #1 in Barron’s Top 100 Women Advisors (2018)
1,233 1,244 1,262 1,237 1,254
991 1,036 1,081 1,085 1,101
237 238 247 242 234156 159 162 162 165$2,617 $2,676 $2,752 $2,725 $2,754
$0
$500
$1,000
$1,500
$2,000
$2,500
$3,000
2Q17 3Q17 4Q17 1Q18 2Q18
Brokerage / Other Assets under management Deposits Loans and leases
Client Balances (EOP, $B) 3
72 74 75 77 78
43 42 42 42 41
33 35 36 38 393 3 3 3 3$151 $154 $157 $159 $161
$0
$60
$120
$180
2Q17 3Q17 4Q17 1Q18 2Q18
Consumer real estate Securities-based lendingStructured lending Credit card / Other
Note: Amounts may not total due to rounding. 1 See slide 25 for business leadership sources. 2 FTE basis.3 Loans and leases include margin receivables which are classified in customer and other receivables on the consolidated balance sheet.
1.6 1.5 1.5 1.6 1.5
2.3 2.3 2.4 2.5 2.5
0.8 0.8 0.7 0.7 0.7
$4.7 $4.6 $4.7 $4.9 $4.7
$0
$1
$2
$3
$4
$5
2Q17 3Q17 4Q17 1Q18 2Q18
Net interest income Asset management fees Brokerage / Other
Total Revenue ($B) 2
$245 $240 $240 $243 $236
$0
$50
$100
$150
$200
$250
$300
2Q17 3Q17 4Q17 1Q18 2Q18
2
Global Wealth & Investment Management Trends
Global Banking
17
1 Revenue, pretax income, income tax expense and efficiency ratio shown on an FTE basis. Tax expense compared to prior year impacted by a lower U.S. corporate tax rate.2 Global Banking and Global Markets share in certain deal economics from investment banking, loan origination activities and sales and trading activities.
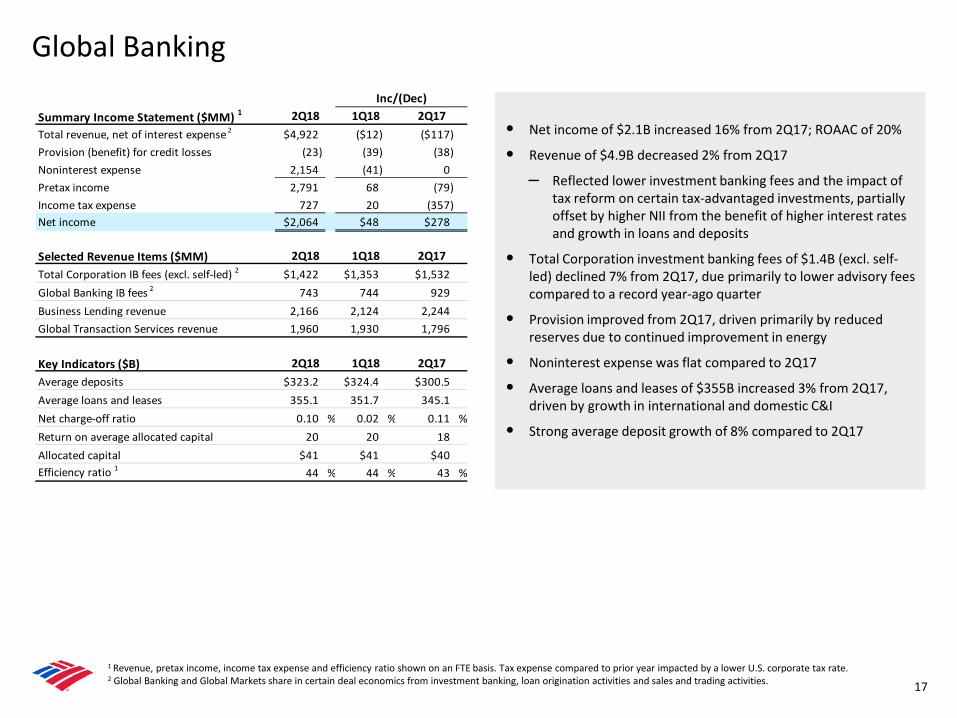
• Net income of $2.1B increased 16% from 2Q17; ROAAC of 20%
• Revenue of $4.9B decreased 2% from 2Q17
– Reflected lower investment banking fees and the impact of tax reform on certain tax-advantaged investments, partially offset by higher NII from the benefit of higher interest rates and growth in loans and deposits
• Total Corporation investment banking fees of $1.4B (excl. self-led) declined 7% from 2Q17, due primarily to lower advisory fees compared to a record year-ago quarter
• Provision improved from 2Q17, driven primarily by reduced reserves due to continued improvement in energy
• Noninterest expense was flat compared to 2Q17
• Average loans and leases of $355B increased 3% from 2Q17, driven by growth in international and domestic C&I
• Strong average deposit growth of 8% compared to 2Q17
Summary Income Statement ($MM) 1
Total revenue, net of interest expense 2 $4,922 ($12) ($117)Provision (benefit) for credit losses (23) (39) (38)Noninterest expense 2,154 (41) 0Pretax income 2,791 68 (79)Income tax expense 727 20 (357)Net income $2,064 $48 $278
Selected Revenue Items ($MM)Total Corporation IB fees (excl. self-led) 2 $1,422 $1,353 $1,532Global Banking IB fees 2 743 744 929Business Lending revenue 2,166 2,124 2,244Global Transaction Services revenue 1,960 1,930 1,796
Key Indicators ($B) Average deposits $323.2 $324.4 $300.5Average loans and leases 355.1 351.7 345.1Net charge-off ratio 0.10 % 0.02 % 0.11 %Return on average allocated capital 20 20 18 Allocated capital $41 $41 $40Efficiency ratio 1 44 % 44 % 43 %
Inc/(Dec)1Q18 2Q172Q18
2Q18 1Q18 2Q17
2Q18 1Q18 2Q17
74% 70% 68% 65% 63%
26% 30% 32% 35% 37%
$300 $316 $330 $324 $323
$0
$100
$200
$300
$400
2Q17 3Q17 4Q17 1Q18 2Q18
Noninterest-bearing Interest-bearing
Global Banking Trends
18
Note: Amounts may not total due to rounding.1 See slide 25 for business leadership sources.2 Global Banking and Global Markets share in certain deal economics from investment banking, loan origination activities and sales and trading activities.3 FTE basis.4 Advisory includes fees on debt and equity advisory and mergers and acquisitions.
901 962 846 827 874
231 193 204 314 290
483 374 429 296 303
(83) (52) (61) (84) (45)
$1,532 $1,477 $1,418 $1,353 $1,422
2Q17 3Q17 4Q17 1Q18 2Q18
Debt Equity Advisory Self-led deals
Total Corporation IB Fees ($MM) 2
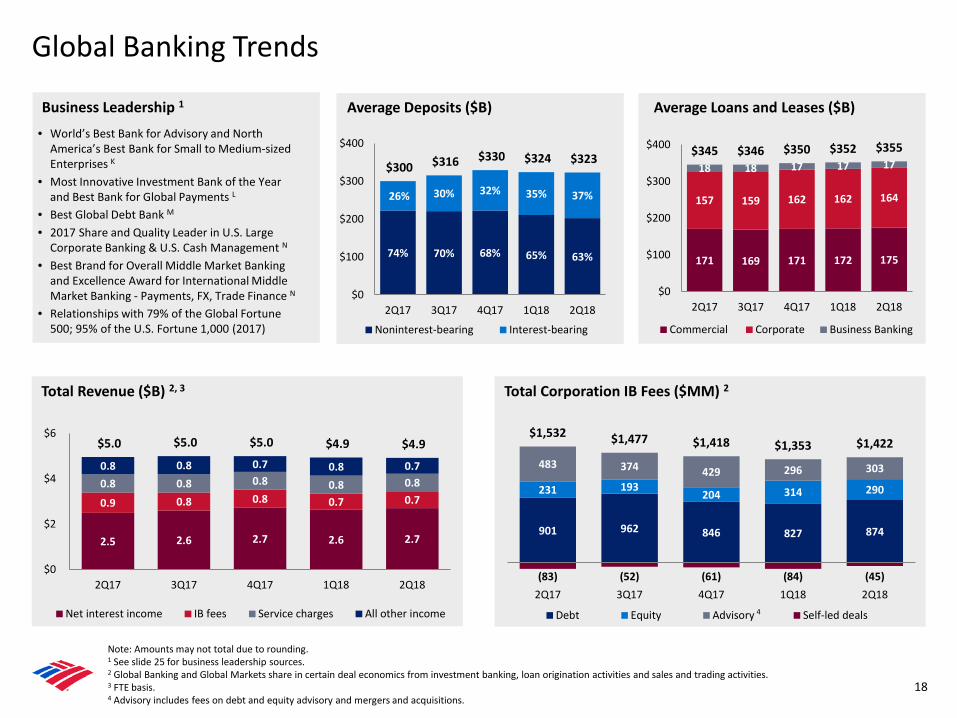
• World’s Best Bank for Advisory and North America’s Best Bank for Small to Medium-sized Enterprises K
• Most Innovative Investment Bank of the Year and Best Bank for Global Payments L
• Best Global Debt Bank M
• 2017 Share and Quality Leader in U.S. Large Corporate Banking & U.S. Cash Management N
• Best Brand for Overall Middle Market Banking and Excellence Award for International Middle Market Banking - Payments, FX, Trade Finance N
• Relationships with 79% of the Global Fortune 500; 95% of the U.S. Fortune 1,000 (2017)
2.5 2.6 2.7 2.6 2.7
0.9 0.8 0.8 0.7 0.70.8 0.8 0.8 0.8 0.80.8 0.8 0.7 0.8 0.7
$5.0 $5.0 $5.0 $4.9 $4.9
$0
$2
$4
$6
2Q17 3Q17 4Q17 1Q18 2Q18
Net interest income IB fees Service charges All other income
Total Revenue ($B) 2, 3
4
171 169 171 172 175
157 159 162 162 164
18 18 17 17 17$345 $346 $350 $352 $355
$0
$100
$200
$300
$400
2Q17 3Q17 4Q17 1Q18 2Q18
Commercial Corporate Business Banking
Average Deposits ($B) Business Leadership 1 Average Loans and Leases ($B)

Global Markets
19
• [ Bullets to come ]
1 Revenue, pretax income, income tax expense and efficiency ratio shown on an FTE basis. Tax expense compared to prior year impacted by a lower U.S. corporate tax rate.2 Global Banking and Global Markets share in certain deal economics from investment banking, loan origination activities and sales and trading activities.3 Represents a non-GAAP financial measure; see note D on slide 24.4 See note E on slide 24 for definition of VaR.
• Net income of $1.1B increased 34% from 2Q17; ROAAC of 13%
– Excluding net DVA, net income of $1.3B increased 35%
• Revenue grew 7% from 2Q17, driven by sales and trading revenue
• Sales and trading revenue of $3.4B increased 6% from 2Q17, with FICC flat at $2.1B and Equities up 19% to $1.3B
• Excluding net DVA, sales and trading revenue of $3.6B increased 7% from 2Q17 3
– FICC revenue of $2.3B increased 2% from 2Q17, primarily due to improved performance in macro-related products, partially offset by weakness in credit products
– Equities revenue of $1.3B increased 17% from 2Q17, driven by increased client activity in financing and derivatives
• Noninterest expense increased 2% versus 2Q17, driven by higher revenue-related costs and continued investment in technology
• Average total assets increased 5% from 2Q17, primarily due to targeted investments to support clients in both Equities and FICC
• Average VaR remained low at $30MM in 2Q18 4
Summary Income Statement ($MM) 1
Total revenue, net of interest expense 2 $4,221 ($565) $274Net DVA (179) (243) (20)Total revenue (excl. net DVA) 2, 3 4,400 (322) 294
Provision for credit losses (1) 2 (26)Noninterest expense 2,715 (103) 65Pretax income 1,507 (464) 235Income tax expense 391 (122) (51)Net income $1,116 ($342) $286
Net income (excl. net DVA) 3 $1,252 ($157) $323
Selected Revenue Items ($MM) 2
Sales and trading revenue $3,417 $4,117 $3,210Sales and trading revenue (excl. net DVA) 3 3,596 4,053 3,369
FICC (excl. net DVA) 2,290 2,536 2,254Equities (excl. net DVA) 1,306 1,517 1,115
Global Markets IB fees 652 609 590
Key Indicators ($B) Average total assets $678.5 $678.4 $645.2Average trading-related assets 473.1 463.2 452.6Average 99% VaR ($ in MM) 4 30 42 43Average loans and leases 75.1 73.8 69.6Return on average allocated capital 13 % 17 % 10 %Allocated capital $35 $35 $35Efficiency ratio 1 64 % 59 % 67 %
Inc/(Dec)2Q18 1Q18 2Q17
2Q18 1Q18 2Q17
2Q18 1Q18 2Q17

$411$453 $473
$46 $43$30
$0
$25
$50
$75
$100
$0
$100
$200
$300
$400
$500
2Q16 2Q17 2Q18
Avg. trading-related assets Avg. VaR
2.6 2.3 2.3
1.11.1 1.3
$3.7$3.4 $3.6
$0
$1
$2
$3
$4
2Q16 2Q17 2Q18
FICC Equities
Global Markets Trends and Revenue Mix
20
• Best Bank for Markets in Asia K
• European Trading House of the Year O
• Equity Derivatives House of the Year P
• #1 Equity Portfolio Trading Share – North American Institutions N
• 2017 U.S. Fixed Income Quality Leader in Credit and Securitized Products N
• 2018 Quality Leader in Global Top-Tier Foreign Exchange Sales and Corporate FX Sales Q
• #2 Global Research Firm R
Note: Amounts may not total due to rounding.1 See slide 25 for business leadership sources.2 Represents a non-GAAP financial measure. Reported sales & trading revenue was $3.4B, $3.2B and $3.5B for 2Q18, 2Q17 and 2Q16, respectively. Reported FICC sales & trading revenue was $2.1B, $2.1B and
$2.5B for 2Q18, 2Q17 and 2Q16, respectively. Reported Equities sales & trading revenue was $1.3B, $1.1B and $1.1B for 2Q18, 2Q17 and 2Q16, respectively. See note D on slide 24.3 Macro includes G10 FX, rates and commodities products.4 See note E on slide 24 for definition of VaR.
60%
40%
Credit / other Macro
61%
39%
U.S. / Canada International
YTD Total FICC S&T Revenue Mix(excl. net DVA) 2
YTD Global Markets Revenue Mix(excl. net DVA) 2
3
Total Sales & Trading Revenue (excl. net DVA) ($B) 2 Average Trading-related Assets ($B) and VaR ($MM) 4
Business Leadership 1

• Net loss of $0.2B improved $0.1B from 2Q17
• Revenue declined $1.2B from 2Q17
– 2Q17 revenue included a gain of $0.8B from the sale of the non-U.S. consumer credit card business, which was mostly offset by $0.7B related tax expense
– 2Q18 revenue included a $0.2B charge for the combined impact of a $0.7B charge related to the redemption of certain trust preferred securities and a $0.6B gain from the sale of non-core mortgage loans
• Excluding the impact of the aforementioned items, revenue declined $0.2B from 2Q17, due to the absence of the non-U.S. consumer card portfolio and lower gains on sale of debt securities 3
• Noninterest expense declined $0.8B from 2Q17, reflecting the absence of a $0.3B impairment charge related to certain data centers in 2Q17, as well as lower non-core mortgage costs and reduced operational costs from the sale of the non-U.S. consumer credit card business in 2Q17
• Provision benefit declined from 2Q17, due to a slowing pace of portfolio improvement in consumer real estate
1 All Other consists of asset and liability management (ALM) activities, equity investments, non-core mortgage loans and servicing activities, the net impact of periodic revisions to the MSR valuation model for both core and non-core MSRs and the related economic hedge results, liquidating businesses and residual expense allocations. ALM activities encompass certain residential mortgages, debt securities, interest rate and foreign currency risk management activities, the impact of certain allocation methodologies and hedge ineffectiveness. The results of certain ALM activities are allocated to our business segments. Equity investments include our merchant services joint venture, as well as a portfolio of equity, real estate and other alternative investments. During 2Q17, the Company sold its non-U.S. consumer credit card business.
2 Revenue, pretax income and income tax expense shown on an FTE basis. Tax expense compared to prior year impacted by a lower U.S. corporate tax rate.3 Represents a non-GAAP financial measure. For important presentation information, see slide 27.
21
Summary Income Statement ($MM) 2
Total revenue, net of interest expense ($300) $33 ($1,176)Provision (benefit) for credit losses (105) 47 54Noninterest expense 619 (357) (756)Pretax income (loss) (814) 343 (474)Income tax expense (benefit) (567) 304 (572) Net income (loss) ($247) $39 $98
Inc/(Dec)1Q18 2Q172Q18
All Other 1
Second Quarter 2018 Key Takeaways
22
• Produced solid returns
• Delivered responsible growth
• Solid client activity drove good deposit, loan and AUM growth
• Positive operating leverage for 14 consecutive quarters
• Asset quality remained strong
• Increased capital returned to shareholders; repurchased $5.0B of common shares and paid $1.2B in common dividends
• Positioned to benefit from higher interest rates and an improving economic environment
Confidential Non-Public Information

Appendix
24
A Global Liquidity Sources (GLS) include cash and high-quality, liquid, unencumbered securities, limited to U.S. government securities, U.S. agency securities, U.S. agency MBS, and a select group of non-U.S. government and supranational securities, and are readily available to meet funding requirements as they arise. It does not include Federal Reserve Discount Window or Federal Home Loan Bank borrowing capacity. Transfers of liquidity among legal entities may be subject to certain regulatory and other restrictions.
B The Liquidity Coverage Ratio (LCR) represents the consolidated average amount of high-quality liquid assets as a percent of the prescribed average net cash outflows over a 30 calendar-day period of significant liquidity stress, under the U.S. LCR final rule.
C Time to Required Funding (TTF) is a debt coverage measure and is expressed as the number of months unsecured holding company obligations of Bank of America Corporation can be met using only the Global Liquidity Sources held at the BAC parent company and NB Holdings without the BAC parent company issuing debt or sourcing additional liquidity. We define unsecured contractual obligations for purposes of this metric as maturities of senior or subordinated debt issued or guaranteed by Bank of America Corporation.
D Revenue for all periods included net debit valuation adjustments (DVA) on derivatives, as well as amortization of own credit portion of purchase discount and realized DVA on structured liabilities. Net DVA gains (losses) were ($179MM), $64MM, ($159MM) and ($164MM) for 2Q18, 1Q18, 2Q17 and 2Q16, respectively. Net DVA gains (losses) included in FICC revenue were ($184MM), $78MM, ($148MM) and ($159MM) for 2Q18, 1Q18, 2Q17 and 2Q16, respectively. Net DVA gains (losses) included in Equities revenue were $5MM, ($14MM), ($11MM) and ($5MM) for 2Q18, 1Q18, 2Q17 and 2Q16, respectively.
E VaR model uses historical simulation approach based on three years of historical data and an expected shortfall methodology equivalent to a 99% confidence level. Using a 95% confidence level, average VaR was $17MM, $22MM, $23MM and $24MM for 2Q18, 1Q18, 2Q17 and 2Q16, respectively.
Notes

25
A Estimated retail consumer deposits based on June 30, 2017 FDIC deposit data.B Euromoney, 2018.C Dynatrace 2Q18 Online Banker Scorecard and Javelin 2017 Mobile Banking Scorecard. D Forrester 2017 U.S. Credit Card Sales Functionality Benchmark.E Kiplinger’s 2017 Best of the Online Brokers Review.F Inside Mortgage Finance as of 1Q18 and FY 2017, respectively.G Experian. Largest percentage of 740+ Scorex customers among key competitors as of May 2018. H FDIC, 1Q18.I U.S.-based full-service wirehouse peers based on 1Q18 earnings releases.J Industry 1Q18 call reports.K Euromoney, 2017.L The Banker, 2017.M Global Finance, 2018.N Greenwich, 2017.O Financial News, 2017.P Risk Magazine, 2017.Q Greenwich, 2018.R Institutional Investor, 2017.
Sources

Forward-Looking Statements
26
Bank of America Corporation (the “Company”) and its management may make certain statements that constitute “forward-looking statements” within the meaning of the Private Securities Litigation Reform Act of 1995. These statements can be identified by the fact that they do not relate strictly to historical or current facts. Forward-looking statements often use words such as “anticipates,” “targets,” “expects,” “hopes,” “estimates,” “intends,” “plans,” “goals,” “believes,” “continue” and other similar expressions or future or conditional verbs such as “will,” “may,” “might,” “should,” “would” and “could.” Forward-looking statements represent the Company's current expectations, plans or forecasts of its future results, revenues, expenses, efficiency ratio, capital measures, strategy and future business and economic conditions more generally, and other future matters. These statements are not guarantees of future results or performance and involve certain known and unknown risks, uncertainties and assumptions that are difficult to predict and are often beyond the Company's control. Actual outcomes and results may differ materially from those expressed in, or implied by, any of these forward-looking statements.
You should not place undue reliance on any forward-looking statement and should consider the following uncertainties and risks, as well as the risks and uncertainties more fully discussed under Item 1A. Risk Factors of the Company's 2017 Annual Report on Form 10-K and in any of the Company's subsequent Securities and Exchange Commission filings: the Company's potential claims, damages, penalties, fines and reputational damage resulting from pending or future litigation, regulatory proceedings and enforcement actions, including inquiries into our retail sales practices, and the possibility that amounts may be in excess of the Company’s recorded liability and estimated range of possible loss for litigation exposures; the possibility that the Company could face increased servicing, securities, fraud, indemnity, contribution or other claims from one or more counterparties, including trustees, purchasers of loans, underwriters, issuers, other parties involved in securitizations, monolines or private-label and other investors; the possibility that future representations and warranties losses may occur inexcess of the Company's recorded liability and estimated range of possible loss for its representations and warranties exposures; the Company’s ability to resolve representations and warranties repurchase and related claims, including claims brought by investors or trustees seeking to avoid the statute of limitations for repurchase claims; uncertainties about the financial stability and growth rates of non-U.S. jurisdictions, the risk that those jurisdictions may face difficulties servicing their sovereign debt, and related stresses on financial markets, currencies and trade, and the Company's exposures to such risks, including direct, indirect andoperational; the impact of U.S. and global interest rates, currency exchange rates, economic conditions, trade policies, and potential geopolitical instability; the impact on the Company’s business, financial condition and results of operations of a potential higher interest rate environment; the possibility that future credit losses may be higher than currently expected due to changes in economic assumptions, customer behavior, adverse developments with respect to U.S. or global economic conditions and other uncertainties; the Company’s ability to achieve its expense targets, net interest income expectations, or other projections; adverse changes to the Company's credit ratings from the major credit rating agencies; estimates of the fair value of certain of the Company's assets and liabilities; uncertainty regarding the content, timing and impact of regulatory capital and liquidity requirements; the potential impact of total loss-absorbing capacity requirements; potential adverse changes to our global systemically important bank surcharge; the potential impact of Federal Reserve actions on the Company's capital plans; the possible impact of the Company's failure to remediate the shortcoming identified by banking regulators in the Company's Resolution Plan; the effect of regulations, other guidance or additional information on our estimated impact of the Tax Act; the impact of implementation and compliance with U.S. and international laws, regulations and regulatory interpretations, including, but not limited to, recovery and resolution planning requirements, Federal Deposit Insurance Corporation (FDIC) assessments, the Volcker Rule, fiduciary standards and derivatives regulations; a failure in or breach of the Company's operational or security systems or infrastructure, or those of third parties, including as a result of cyberattacks; the impact on the Company's business, financial condition and results of operations from the planned exit of the United Kingdom from the European Union; and other similar matters.

• The information contained herein is preliminary and based on Company data available at the time of the earnings presentation. It speaks only as of the particular date or dates included in the accompanying slides. Bank of America does not undertake an obligation to, and disclaims any duty to, update any of the information provided.
• The Company may present certain key performance indicators and ratios, including year-over-year comparisons of revenue, noninterest expense and pretax income, excluding certain items (e.g., DVA) which result in non-GAAP financial measures. The Company believes the use of these non-GAAP financial measures provides additional clarity in understanding its results of operations and trends. For more information about the non-GAAP financial measures contained herein, please see the presentation of the most directly comparable financial measures calculated in accordance with GAAP and accompanying reconciliations in the earnings press release for the quarter ended June 30, 2018 and other earnings-related information available through the Bank of America Investor Relations website at: http://investor.bankofamerica.com.
• The Company views net interest income and related ratios and analyses on a fully taxable-equivalent (FTE) basis, which when presented on a consolidated basis are non-GAAP financial measures. The Company believes managing the business with net interest income on an FTE basis provides investors with a more accurate picture of the interest margin for comparative purposes. The Company believes that the presentation allows for comparison of amounts from both taxable and tax-exempt sources and is consistent with industry practices. The FTE adjustment was $154MM, $150MM, $251MM, $240MM and $237MM for 2Q18, 1Q18, 4Q17, 3Q17 and 2Q17 respectively.
• The Company allocates capital to its business segments using a methodology that considers the effect of regulatory capital requirements in addition to internal risk-based capital models. The Company's internal risk-based capital models use a risk-adjusted methodology incorporating each segment's credit, market, interest rate, business and operational risk components. Allocated capital is reviewed periodically and refinements are made based on multiple considerations that include, but are not limited to, risk-weighted assets measured under Basel 3 Standardized and Advanced approaches, business segment exposures and risk profile, and strategic plans. As a result of this process, in the first quarter of 2018, the Company adjusted the amount of capital being allocated to its business segments.
Important Presentation Information
27