Bank Mergers and Acquisitions in the United States 1990 ... · For many banks, merging with a...
25
Bank Mergers and Acquisitions in the United States 1990 -1997: An Analysis of Shareholders Value Creation and Premium Paid to Integrate with Megabanks by Ashford Maharaj ISBN: 1-58112- 227-6 DISSERTATION.COM Boca Raton, Florida USA 2004
Transcript of Bank Mergers and Acquisitions in the United States 1990 ... · For many banks, merging with a...
Bank Mergers and Acquisitions in the United States 1990 -1997:
An Analysis of Shareholders Value Creation and Premium Paid to Integrate with Megabanks
by
Ashford Maharaj
ISBN: 1-58112- 227-6
DISSERTATION.COM
Boca Raton, Florida USA � 2004

Bank Mergers and Acquisitions in the United States 1990 -1997: An Analysis of Shareholders Value Creation and Premium Paid to Integrate with Megabanks
Copyright © 2001 Ashford Maharaj All rights reserved.
Dissertation.com
Boca Raton, Florida USA � 2004
ISBN: 1-58112- 227-6

Bank Mergers and Acquisitions in the United States 1990 - 1997: An Analysis
of Shareholders Value Creation and Premium Paid to Integrate
with Megabanks
by
Ashford Maharaj
Dissertation Submitted in Partial Fulfillment of the Requirement for
the Degree of Doctor of Philosophy
Applied Management and Decision Sciences
Walden University
May 2001
[Dissertation Committee Chair: Dr. James T. Brown Ph.D.]

Bank Mergers and Acquisitions in the United States 1990 - 1997: An Analysis
of Shareholders Value Creation and Premium Paid to Integrate
with Megabanks
by
Ashford Maharaj
Dissertation Submitted in Partial Fulfillment of the Requirement for
the Degree of Doctor of Philosophy
Applied Management and Decision Sciences
Walden University
May 2001

ii
ACKNOWLEDGMENTS
There is no situation that I know of where a dissertation was successfully completed without the input of a number of influential people who would have advised, guided, criticized, prodded, probed, and rendered support to the writer of such a colossal research initiative. This research undertaking was no exception given that several people have influenced, one way or the other, the successful preparation and completion of such a learning experience. It is my pleasure to truly thank the mentor and chair of my dissertation committee, Dr. James T. Brown, who stuck with me throughout my entire doctoral studies at Walden University. It is also my profound pleasure to thank the other members of my committee, Dr. Reza G. Hamzaee, for his witty comments and expertise in the disciplines of Economics and Finance, and Dr. Eileen Kuhns for her encouragement and perceptive clarification on empirical research and design methodologies. I also wish to thank Dr. William H. Brent, Professor of Finance at Howard University, Washington, D.C., and faculty member at Walden University for his help and encouragement at a time when this research project seemed insurmountable. I am exceedingly grateful to Professor Aswath Damodaran of Stern School of Business at

iii
New York University, New York, for lending his support in certain analytical areas of this research. I am indebted to Professor Damodaran not only for consulting many of his published works, but also for his willingness to spare the time from his busy schedule to discuss with me, issues that are germane to the analytical phase of this study. I owe a depth of gratitude to Michael Gunning, Vice President, and Ivonne Diaz, Second Vice President of Chase Manhattan Bank, for allowing me to access certain online databases. In addition, I am also indebted to Ravi Shanker at the New Jersey office of SNL Securities LC, for his guidance in ensuring that an all-inclusive data field was exhaustively examined. Finally, I would like to thank my wife, Leah, and my children, Hansen and Mark, for their sacrifices that sometimes exceeded my own forgone opportunities. My family's commitment and unwavering support guaranteed the becoming of me, the best that I could be. On this note, I wish to give thanks to God Almighty, the head of our household, who has seen me through my many years of studies while simultaneously juggling a myriad of competing socio-economic and extra-curricula activities.

iv
TABLE OF CONTENTS
List of Tables ……………………………………………………….. ix
List of Figures ………………………………………………………. xiii
CHAPTER 1: INTRODUCTION TO THE STUDY ……………………….. 1
Background of the Problem ……………………………………………. 1
Purpose of the Study ……………………………………………… 11
Theoretical Framework .……………………………………………….. 17
Research Problem …………………………………………………… 25
Specific Research Question ………………………………………….….. 27
Hypotheses to be Tested ……………………………………………… 29
Significance of the Study ……………………………………………… 32
Assumptions and Limitations of the Study ….…………………………. 34
Outline of the Study …………………………………………………….. 36
CHAPTER 2: REVIEW OF THE LITERATURE ……………………………. 39
Recent Trends in Bank Mergers and Acquisitions ………………………. 39
Review of Merger-Related Theories and Hypotheses ………………….… 42
Growth Maximization Group of Theories …………………………... 43

v
Management Self-interest Hypothesis ……………………………….. 44
The Hubris Hypothesis ……………………………………………… 44
Monopolistic Orientation ……………………………………………… 45
Geographic Diversification …………………………………………… 48
Value Maximization Group of Theories …………………………... 49
Economies of Scale …………………………………………… 49
Efficiency in Management …………………………………….. 51
Revenue Enhancement ………………………………………… 52
Reenginering Initiatives ………………………………………. 54
Concluding Comments on Hypotheses Reviewed ……………………. 56
Review of Research Methodologies in Mergers and Acquisitions …… 57
CHAPTER 3: RESEARCH METHODOLOGY …………………………. 66
Basic Event Study Methodology …………………………………….. 66
Theoretical Constructs ……………………………………………… 69
The Independent Variable …………………………………………… 72
Merger Announcements ……………………………………………... 72
The Dependent Variable …………...………………………………… 73
Abnormal Returns …………………………………………………… 73
Research Design ……………………………………………………… 78
Sample Selection ……………………………………………………... 79
Hypothesis 1 ………………………………………………………… 85
Megabank Acquirers and Abnormal Returns ……..…………… 85

vi
The Dependent Variable ………………………………………. 85
Abnormal Returns ………………………………………... 85
The Independent Variable …………………………………….. 89
Event Window Period ……………………………………. 89
Hypohesis 2 …………………………………………………………. 90
Mergers of Equals In-Market Megabanks ……………………… 90
Hypothesis 3 …………………………………………………………. 96
Acquisition Premium and Megabanks ..………….…………….. 96
Purchase Price to Book Value ………………………………….. 97
Market Price to Trailing-Four-Quarters Earnings Per Share …………….. 98
Acquisition Premium as a Percentage of Book Value …………………… 99
Threats to Validity ………………………………………… 100
Normality in Sample and Homoscedasticity …………….. 101
Sequencing Variables …………………………………….. 101
Reverse Causation ……………………………………….. 102
Rival Explanation ……………………………………….. 102
Creeping Mortality ……………….………………………. 103
Threats to Internal Validity: A Summary ……………………………. 104
Market Reaction ……………………………………………………. 104
vii
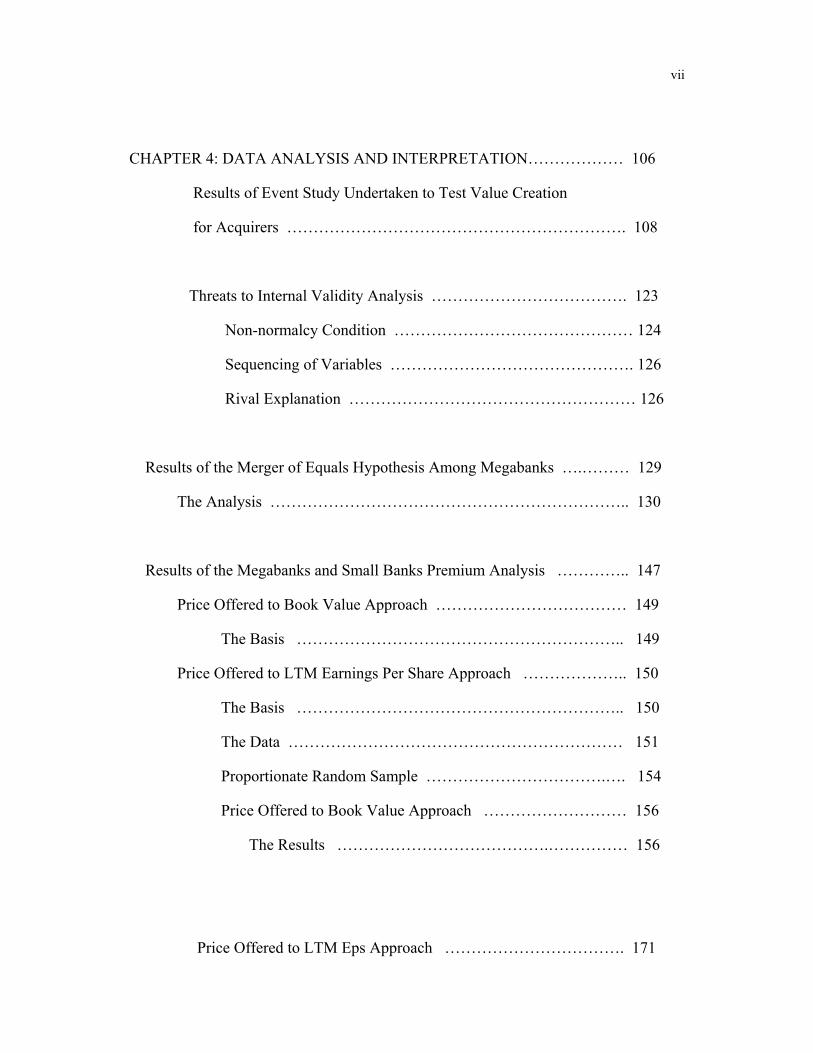
CHAPTER 4: DATA ANALYSIS AND INTERPRETATION……………… 106
Results of Event Study Undertaken to Test Value Creation
for Acquirers ………………………………………………………. 108
Threats to Internal Validity Analysis ………………………………. 123
Non-normalcy Condition ……………………………………… 124
Sequencing of Variables ………………………………………. 126
Rival Explanation ……………………………………………… 126
Results of the Merger of Equals Hypothesis Among Megabanks ….……… 129
The Analysis ………………………………………………………….. 130
Results of the Megabanks and Small Banks Premium Analysis ………….. 147
Price Offered to Book Value Approach ……………………………… 149
The Basis …………………………………………………….. 149
Price Offered to LTM Earnings Per Share Approach ……………….. 150
The Basis …………………………………………………….. 150
The Data ……………………………………………………… 151
Proportionate Random Sample …………………………….…. 154
Price Offered to Book Value Approach ……………………… 156
The Results ………………………………….…………… 156
Price Offered to LTM Eps Approach ……………………………. 171

viii
The Results …………. …………………………………….... 171
Summary of Premium Payments to Integrate ……………….. 184
CHAPTER 5: SUMMARY, CONCLUSION, AND OUTLOOK …………. 188
Summary ……………………………………………………………… 188
Practical and Theoretical Implications …………..……………………. 195
Recommendations and Future Research Initiatives……………………. 199
REFERENCES ……………………………………………………………. 203
APPENDIX A Definition of Important Terms ……………………………... 214
APPENDIX B Mathematical Explanations ………………………………… 222
RESUME ………………………………………………………………… 228

ix
LIST OF TABLES
Table 1. Mergers and Acquisitions Involving Megabanks in the United States for Period 1999 - 1997 ………………………………………… 111 Table 2. Average and Cumulative Average Excess Returns Calculated Over the 41-day Event Window with Applicable T-statistic ……………… 115 Table 3. Acquirers Grouped by Classes of Excess Returns, Frequency and Cumulative Percentages (%) for the Event Window ………………… 121 Table 4. Results of Recent Studies on Stock Market Reaction to Acquirers in Mergers and Acquisitions Covering the Period 1978 - 1997 ……… 122 Table 5. Excess Returns for Acquirers and Acquirees for Period t (-5, 5) with Signed Ranked Values for Matched Pairs …………………………… 139 Table 6. Summary of Wilcoxon Signed Rank Sum Test for Paired Samples Over the 11-Day Event Window for Merger of Equals' Megabanks ..… 143 Table 7. Number of Megabank Mergers and Acquisitions with Percentage Spread for Period 1990 - 1997 ……………………………………….. 152
x
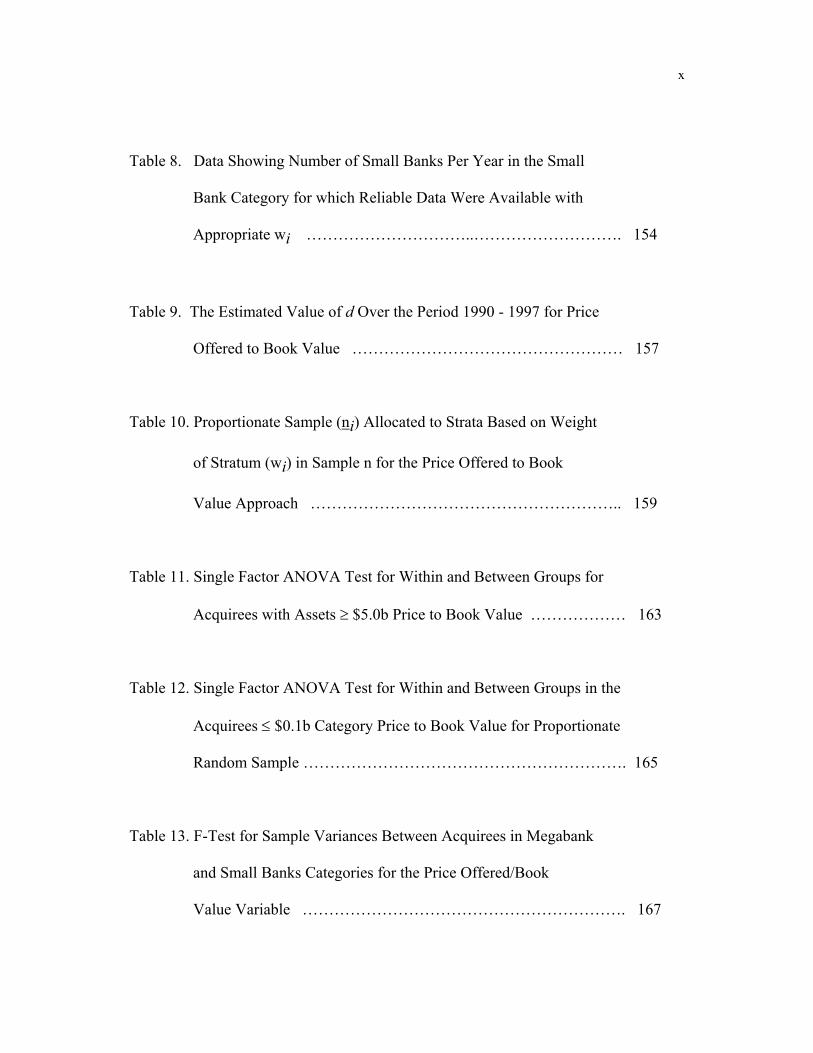
Table 8. Data Showing Number of Small Banks Per Year in the Small Bank Category for which Reliable Data Were Available with Appropriate wi …………………………..………………………. 154 Table 9. The Estimated Value of d Over the Period 1990 - 1997 for Price Offered to Book Value …………………………………………… 157 Table 10. Proportionate Sample (ni) Allocated to Strata Based on Weight of Stratum (wi) in Sample n for the Price Offered to Book Value Approach ………………………………………………….. 159 Table 11. Single Factor ANOVA Test for Within and Between Groups for Acquirees with Assets ≥ $5.0b Price to Book Value ……………… 163 Table 12. Single Factor ANOVA Test for Within and Between Groups in the Acquirees ≤ $0.1b Category Price to Book Value for Proportionate Random Sample ……………………………………………………. 165 Table 13. F-Test for Sample Variances Between Acquirees in Megabank and Small Banks Categories for the Price Offered/Book Value Variable ……………………………………………………. 167

xi
Table 14. T-test Assuming Unequal Variances on the Price Offered/Book Value Variable for Megabank and Small Bank Categories ……….. 169 Table 15. The Estimated Values of d Over the Period 1990 - 1997 for the Price Offered to LTM Eps Approach in the Small Bank Category …….. 172 Table 16. Proportionate Random Sample (ni) Allocated to Strata Based on Weight of Stratum (wi) in Sample n for the Price Offered to LTM Eps Approach in the Small Bank Category …………………. 174 Table 17. Single Factor ANOVA Test for Within and Between Groups for Megabanks with Assets ≥ $5.0b in Price to LTM Eps Variable …… 179 Table 18. ANOVA Single Factor Test for Price Offered/LTM Eps for Small Banks Acquirers with Assets ≤ $0.1b at Announcement …………... 180 Table 19. F-test for Sample Variances Between Megabank and Small Bank Categories for Price Offered/LTM Eps Variable ……………………. 181 Table 20. T-test Assuming Unequal Variances on the Price Offered / LTM Eps Variable for Megabank and Small Bank Categories ………………… 183

xii
Table 21. T-tests of Merger and Acquisition Premium Payment Hypothesis for Banks in the megabanks and Small Bank Categories: Summary Results …………………………………………………… 186 Table 22. Summary Results for Hypotheses Tested in this Study ……………... 191

xiii
LIST OF FIGURES Figure 1. Market Concentration Continuum …………………………………… 5 Figure 2. Graph of AER and CAER for Megabank Acquirers ……………… 119 Figure 3. Graph of Cumulative Frequency Distribution of the Average Excess Returns in the Acquirers' Megabank Category ……………………… 124 Figure 4. Graph Showing Frequency Distribution of the Data Points representing Average Excess Returns (AER) in the Megabank Category ………… 125 Figure 5. Histogram Depicting Price Offered to Book Value in the Megabank Category ………………………………………………… 160 Figure 6. Frequency Distribution Curve Showing Price Offered to Book Value in the Megabank Category ……………………………….. 161 Figure 7. Histogram Showing Price Offered to Book Value in the Small Bank Category ………………………………………………….. 161

xiv
Figure 8. Frequency Distribution Curve Depicting Price Offered to Book Value in the Small Bank Category ………………………………. 162 Figure 9. Histogram Showing Price Offered to LTM Eps for Banks in the Megabank Category ……………………………………………… 175 Figure 10. Frequency Distribution Curve Depicting Price Offered to LTM Eps in the Megabank Category …………………………………. 176 Figure 11. Histogram Showing Price Offered to LTM Eps for Banks in the Small Bank Category …………………………………………….. 176 Figure 12. Frequency Distribution Curve Depicting Price Offered to LTM Eps in the Small Bank Category ………………………………… 177

CHAPTER 1
INTRODUCTION TO THE STUDY
Background of the Problem
The banking industry in the United States, similar to other industries, seemed to
have enjoyed favorable economic successes on the various investment portfolios
during the period 1990 to 1997 (Allen, 1997; Johnson, 1995). For banks as a whole,
these favorable economic results were not surprising in that interests paid on deposits
were relatively low, growth in the loan portfolio was strong, and the interest rate
spreads were generally large. In addition, the legal framework, which previously
inhibited operations in areas such as insurance, relationships with mutual funds, and
other financial products, was relaxed (Spiegel, Gart, & Gart, 1996). In the light of
these new developments the dilemma facing the banking industry at the dawn of the
new millennium is whether to exploit the advantages it already possessed or to
leverage the new, open and less-restrictive fields of operation towards a horizon of
insulation from persistent bank failures. Spiegel, Gart, and Gart intimated that such
bank failures characterized the banking industry especially during the first half of the
20th century. One possible way for banks to insulate themselves from the vagaries of
future economic misfortunes is to adopt an aggressive growth path through systematic
mergers and acquisitions activities.

2
For many banks, merging with a partner bank or by acquiring the assets of
another bank will most likely result in tremendous savings in overhead costs,
especially in cases involving in-market mergers and acquisitions (Allen, 1997). For
purposes of this study, an in-market refers to the consolidation of two or more banking
entities that do business within identical markets and, or geographical areas.
Therefore, in-market mergers and acquisitions are within the purview of the horizontal
form of integration. Identical markets are those markets where each consolidating
party trades along similar product lines, whereas geographical areas may involve
physical proximity, but different product lines. The merger between Chase Manhattan
and Chemical Bank in 1995 is an example of geographic areas, whereas the 1997
merger between First Union Corporation of North Carolina and CoreStates Financial
of Pennsylvania is essentially an example of identical markets.
Commercial banks are favorably poised to wield great economic power within
the financial sector of the United States economy by virtue of their ability to dictate
the loan amortization process, despite the presence of a highly competitive operating
environment (Allen, 1997). The banking industry's sphere of influence is further
enhanced by having an effective service distribution network by way of bank
branching, the proliferation of automated teller machines (ATMs), roving teller
services, and excellent franchises built around customers' inertia. Such powers of
influence, however, are minimized in the light of fully functional quasi-banks such as
finance houses, money stores, credit unions, and mutual fund entities. In addition,
large corporations operate parallel captive finance departments that raise capital and
make loans to customers for the purposes of purchasing the corporations own

3
products. General Motors Acceptance Corporation (GMAC), Toyota Motor Credit
Corporation (TMCC), and General Electric Small Business Solutions are examples of
parallel consumers' financing entities. In addition, these large corporations have the
wherewithal to raise their own capital by way of commercial paper, corporate bonds,
and debentures, thereby affording them the luxury of circumventing the demand for
bank loans from the banking industry.
The shifting competitive environment has forced some banks to look for more
competent ways to positively impact their bottom lines and boost the return on equities
(Johnson, 1995). Clearly one of the best ways to become more efficient is to increase
market share, while simultaneously holding down costs to a ratio less comparable to
the gains in market share. In their search for economies of scale, or more particularly
in the case of banking costs function, economies of scope, a quick way to drive down
unit costs and boost income is through operating and financial synergies (Gaughan,
1996). Synergy will occur under the assumption that the existing customer base will
continue to patronize the new entity or that the new entity will produce a net addition
to the customer base. Economies of scope imply the ability of a bank to produce a
broader range of outputs from a given set of inputs (Kolari & Zardkoohi, 1987). When
banks merge they can spread the fixed costs associated with technology, operating
infrastructure, on-line services and so on, over a broader range of service offerings
such as financial advisement, trusts, loan services, and so on. In addition, financial
products comprising Certificate of Deposits (CDs), Money Market Deposit Accounts
(MMDAs), and Individual Retirement Accounts (IRAs) may be offered as
differentiated product lines.

4
In addition to the economies of scope (scale) motive for mergers and acquisition,
there are three other considerations or goals that may influence a decision to integrate
with another business entity. These are diversification, horizontal integration, and
vertical integration. Diversification occurs when one business entity acquires or
merges with another, the latter being involved in a different industry with the resulting
entity being sometimes referred to as a "conglomerate" (Cooley, 1988, p. 859). For
example, the 1996 acquisition of Life Insurance Co. of Virginia, an insurance
business, by General Electric Co., a manufacturing undertaking, is, in effect, a
diversified or conglomerate integration (Mergers & Acquisition, 1996). Diversified
mergers or acquisition involving banks are not legally allowed under United States
law, but combinations between finance related businesses are permitted. For example,
the 1998 merger between Citibank, a commercial bank, and Travelers Group, an
insurance business, is perhaps the nearest to a diversified integration. A merger
between insurance and banking may best be described as an out-market merger, since
both types of businesses belong to the finance industry with the product lines being
more or less differentiated. Whereas, in-market integration may involve banks along
identical or very similar product lines or geographic areas, out-market mergers may
involve differentiated markets with related (financial) products.
Horizontal mergers and acquisitions take place between companies in the finance
industry and may include both in-market and out-market combinations. Horizontal
mergers and acquisitions, in a strict sense, involve firms merging with or acquiring a
rival in identical or related markets, the likely end result being, increased market share
and increased market power (Gaughan, 1996). Economic theories suggest that there

5
are two extreme forms of market structures. On one end there is the pure competitive
form resting on assumptions such as numerous buyers and sellers, perfect information,
homogeneous products and so on.
On the other extreme there is the monopoly form, which rests on the assumptions
of being a single seller with the almost unrestricted ability to set a price-output
combination that maximizes its profits. Horizontal integration involves a movement
from the purely competitive end of the spectrum to the monopoly form at the other
end. Along the way, however, may be found other differentiated market structures
such as monopolistic competition (many firms with differentiated product lines),
oligopoly (only a few firms), and duopoly (only two firms). Figure 1 depicts a
continuum line of a hypothetical industry that can move from the so-called purely
competitive market form, comprising of a huge number of firms, to a monopoly
situation comprising of only a single seller.
[Perfect [Monopolistic Competition] Competition] [Oligopoly] [Duopoly] [Monopoly] →→ → →
Figure 1. Market concentration continuum.
One of the major problems with mergers leading towards the monopoly end of
the spectrum is that monopolies can cost society. Economic theories suggest that
activities such as mergers and acquisition can result in dead weight or welfare loss,
that is, losses involving both consumer and producer surpluses. The basis for such
dead weight or welfare losses hinges on the fact that the monopoly situation ultimately

6
leads to higher price and lower industrial output and possibly greater profits for the
single seller. Whether the banking industry within the United States will move closer
to even an oligopoly situation is anyone's guess. However, there is a tendency for the
number of banks that are servicing a growing United States market to be on the
decline.
In the 1990s shrinkage in the number of commercial banks was mainly due to
the dynamic nature of a competitive environment (Spiegel, Gart, & Gart, 1996),
changes in the legal and operating frameworks (Johnson, 1995), and transformation
within the global, economic, and capital markets (Allen, 1997). In 1980 there were
some 14,400 commercial banks, while in 1990 that number was reduced to 12,250. By
1997 the number of independent commercial banks operating was approximately
9,360 (U.S. Bureau of Census, 1998). According to Johnson (1995), the shrinkage is
likely to continue rapidly and may flatten out when the number reaches approximately
5,000 commercial banks.
The movement around merger and acquisition activities reveals an interesting
pattern of behavior with respect to assets size. Taking the categorization of banks as
proposed by financial information expert, SNL Securities LC, who categorizes large
banks as those banks with assets of $1 billion to $5 billion and medium-size banks as
those with less than $1 billion, this study will consider megabanks as banks with
assets of $5 billion or more. Data available for the period 1990 to 1995 reveal that
there were some 71 mergers and acquisitions in the $1 billion to $5 billion asset
category which constitute approximately 17% of banks from that group. In the
megabank category, in which case assets are in excess of $5 billion, mergers and

7
acquisitions involved some 68 banks or approximately 18% of all banks within that
group (SNL Securities LC, 1998). However, by 1997 the number of banks involved in
mergers and acquisitions in the megabank category was very much close to 80
(Mergerstat Review, 1997, 1998).
Two important effects originated from the changes to Regulation Q that took
place during the 1980s and paved the way for the favorable economic climate in the
banking industry, inclusive of the merger and acquisition impetus, for the period under
review (Johnson & Johnson, 1989). First, banks could compete for deposits among
themselves and other quasi-banks and related financial institutions. Second, the
changes allowed banks to counter the disintermediation problem, which manifested
itself in situations where consumers withdrew cash deposits from banks and invested
these funds directly in various financial products, thereby attracting higher returns on
their investments.
Regulation Q, however, facilitated the disintermediation problem faced by
banks while simultaneously setting the ceiling on interest that banks can pay on
liabilities such as demand deposits, negotiated order of withdrawals, checking
accounts, and other similar bank liabilities. The repeal of Regulation Q was a
necessary condition for the banking industry to seriously afford the luxury of growth
and value maximizations that can be generated directly from bank mergers and
acquisitions.
The period covered by this study was also characterized by low interest rates,
given that the Federal Reserve Board continuously monitored these rates and took
action by way of moral suasion and direct intervention in order to prevent the interest

8
rates from escalating too rapidly (Allen, 1997). Given that the caps on interests paid to
various types of deposits had been removed, the funds placed in banks were more rate-
sensitive. One of the main funds management techniques attributed to banks was the
ability to maximize the gap between interest income on assets and interest expense on
liabilities. A bank sought to maximize its total income by carefully managing and
periodically adjusting its mix of assets and liabilities based upon speculation of the
interest rate movements (Hatler, 1991). Banks that possessed the capabilities to
anticipate interest rate movements and manage interest rate gaps in a timely manner
experienced higher profitability ratios and abnormal stock returns. It is no surprise,
therefore, that the decade of the 1990s provided most commercial banks with safe
operating margins and relatively high returns on equities (Johnson, 1995; Allen,
1997).
Statistics compiled by the United States Bureau of Census revealed that the net
income of commercial banks moved from a low of $14 billion in 1980 to a moderate
$16 billion 10 years later (U.S. Bureau of the Census, 1996). By 1995 net income had
grown to a massive $49 billion, attesting to the fact that the first half of the 1990s was
an economically fertile period for commercial banks. In addition to very favorable
economic returns, the build-up of capital impacted the returns on equity as the capital
to asset ratio continued to improve. Capital to asset ratio strengthened from 5.8% in
1980 to 6.5% in 1990 and to 8.1% in 1995. This ratio continued to climb and in so
doing increased to 8.2% in 1996 and 8.3% for the year 1997 (U.S. Bureau of the
Census, 1998). The progression in capital strength tended to suggest that banks may
seek to either increase dividend pay outs, initiate stock buybacks in order to increase