
BANK LENDING AND INTEREST- RATE DERIVATIVES€¦ · BANK LENDING AND INTEREST- RATE DERIVATIVES...
33
BANK LENDING AND INTEREST- RATE DERIVATIVES Fang Zhao Assistant Professor of Finance Department of Finance Siena College Loudonville, New York 12211 E-mail: [email protected] Jim Moser Senior Financial Economist Office of the Chief Economist Commodity Futures Trading Commission Washington, DC 20581 Email: [email protected]
-
Upload
nguyendung -
Category
Documents
-
view
221 -
download
0
Transcript of BANK LENDING AND INTEREST- RATE DERIVATIVES€¦ · BANK LENDING AND INTEREST- RATE DERIVATIVES...
BANK LENDING AND INTEREST- RATE DERIVATIVES
Fang Zhao Assistant Professor of Finance
Department of Finance Siena College
Loudonville, New York 12211 E-mail: [email protected]
Jim Moser Senior Financial Economist
Office of the Chief Economist Commodity Futures Trading Commission
Washington, DC 20581 Email: [email protected]

2
BANK LENDING AND INTEREST- RATE DERIVATIVES
Abstract
Using recent data that cover a full business cycle, this paper documents a direct
relationship between interest-rate derivative usage by U.S. banks and growth in their
commercial and industrial (C&I) loan portfolios. This positive association holds for interest-
rate options contracts, forward contracts, and futures contracts. This result is consistent with
the implication of Diamond’s model (1984) that predicts that a bank’s use of derivatives
permits better management of systematic risk exposure, thereby lowering the cost of
delegated monitoring, and generates net benefits of intermediation services. The paper’s
sample consists of all FDIC-insured commercial banks between 1996 and 2004 having total
assets greater than $300 million and having a portfolio of C&I loans. The main results remain
after a robustness check.
JEL Classification: G21; G28 Key Words: Banking; Derivatives; Intermediation; Swaps; Futures; Option; Forward

3
1. Introduction
The relationship between the use of derivatives and lending activity has been studied
in recent years. Brewer, Minton, and Moser (2000) evaluate an equation relating the
determinants of Commercial and Industrial (C&I) lending and the impact of derivatives on
C&I loan lending activity. They document a positive relationship between C&I loan growth
and the use of derivatives over a sample period from 1985 to 1992. They find that the
derivative markets allow banks to increase lending activities at a greater rate than the banks
would have otherwise. Brewer, Jackson, and Moser (2001) examine the major differences in
the financial characteristics of banking organizations that use derivatives relative to those that
do not. They find that banks that use derivatives grow their business-loan portfolio faster
than banks that do not use derivatives. Purnanandam (2004) also reports that the derivative
users make more C&I loans than non-users. There are two major research questions that arise
in the literature: Does the use of derivatives facilitate loan growth? If not, is there a negative
association between lending activity and derivative usage? Using recent data that cover a full
business cycle, this study revisits these questions to ascertain whether a direct relationship
still exists.
This study differs from the previous research in several aspects. First, it uses more
recent data. Few of the previous research studies cover the period from 1996 through 2004.
During this period, the use of interest-rate derivatives for individual banks is even more
extensive than in earlier studies, rising from notional amounts of $27.88 trillion at the end of
December 1996 to $62.78 trillion at the end of 2004.1 Given the substantial change in the use
1The notional amount is the predetermined dollar principal on which the exchanged interest payments
are based. The notional amounts of derivatives reported are not an accurate measure of derivative use because of reporting practices that tend to overstate the actual positions held by banks. Even though notional values do
4
of derivatives, the research inferences drawn in the previous studies based on less derivative
usage may not hold under the current circumstances. Therefore, the use of more recent data
in this study will shed more light on the most recent impact of derivative usage on bank
lending activity.
Second, the sample period in this study covers a full business cycle, thereby
providing a better indication of the relative variability of lending activities experienced by
commercial banks over this period. Brewer, Minton, and Moser (2000) document a universal
downward trend of C&I lending over a sample period of 1985 to 1992, a period during which
the economy experienced a significant cyclical downturn. In contrast, our sample enables me
to focus on a more comprehensive picture regarding the impact of derivative usage on
lending activity through the different stages of the business cycle, such as economic boom
and economic recession.
Finally, the definitions of several variables in the Call Reports are different prior to
1995. For example, futures and forwards are reported together in the Call Report data. It is
more difficult for researchers to examine the effect of different derivative instruments on a
bank’s lending activities, since swaps and forwards may have different characteristics from
futures and options. The sample period of the research in this paper is a time period over
which there is a specific definition and consistent measurement of each interest-rate
derivative instrument in the Call Reports. Therefore, the construction of these variables will
be more accurate and much more detailed than the ones used in previous studies.
The sample in this study represents FDIC-insured commercial banks with total assets
greater than $300 million as of March 1996 that have a portfolio of C&I loans. Following
not reflect the market value of the contracts, they are the best proxy available for the usage and the extent of usage of interest-rate derivatives.
5
Brewer, Minton, and Moser (2000), we evaluate an equation relating the determinants of C&I
lending and the impact of derivatives on C&I lending activity. The major finding in this
study is that the interest-rate derivatives allow commercial banks to lessen their systematic
exposure to changes in interest rates, which enables banks to increase their lending activities
without increasing the total risk level faced by the banks. This consequently increases the
banks’ abilities to provide more intermediation services. Furthermore, a positive and
significant association between lending and derivative activity indicates that the net effect of
derivative use on C&I lending is complementary. That is, the complementary effect
dominates any substitution effect.
Additionally, this positive association holds for interest-rate options contracts,
forward contracts, and futures contracts, suggesting that banks using any form of these
contracts, on average, experience significantly higher growth in their C&I loan portfolios.
Furthermore, C&I loan growth is positively related to capital ratio and negatively related to
C&I loan charge-offs. The findings in this study are confirmed after a robustness check.
Examining the relationship between the C&I loan growth and derivative usage poses
a potential endogeneity problem because the derivative-use decision and lending choices may
be made simultaneously. To address this problem, an instrumental-variable approach is
employed. Specifically, we estimate the probability that a bank will use derivatives in the
first-stage specification, then we use the estimated probability of derivative usage as an
instrument for derivative activity in the second-stage C&I loan growth equation. The probit
specification for this instrumental variable is based on Kim and Koppenhaver (1992).
This paper is organized as follows: The following section describes the sample and
data sources. A discussion of the empirical specifications for commercial and industrial

6
lending is provided in the third section. Next, the empirical results are presented in the fourth
section. The fifth section provides robustness test results, and the final section concludes the
paper.
2. Data and Sample Description
This section describes the sample selection criteria, the lending activity experience by
FDIC-insured commercial banks from the fourth quarter of 1996 through the fourth quarter
of 2004, as well as the interest-rate derivative products used by sample banks during the
nine-year sample period.
2.1 Sample Description
The sample of banks includes FDIC-insured commercial banks with total assets
greater than $300 million as of March 1996. Of these institutions, banks that have no
commercial and industrial loans are excluded. The sample ranges from 942 banks in March
of 1996 to 467 banks in December of 2004. Institutions that are liquidated during the sample
period are included in the sample before liquidation and excluded from the sample for the
periods after liquidation. Banks that merge during the sample period are included in the
sample. By construction, the sample is therefore free from survivor bias. Balance sheet data
and interest-rate derivative-usage information are obtained from the Reports of Condition
and Income (Call Report) filed with the Federal Reserve System. State employment data are
obtained from the U.S. Department of Labor, Bureau of Labor Statistics.
2.2 Lending Activity
Because the accessibility of credit depends importantly on banks’ roles as financial
intermediaries, loan growth is an important measure of intermediaries’ activities. Following
Brewer, Minton, and Moser (2000), we use C&I loan growth as a measure of lending activity
7
because such a measure performs a critical function in channeling funds between the
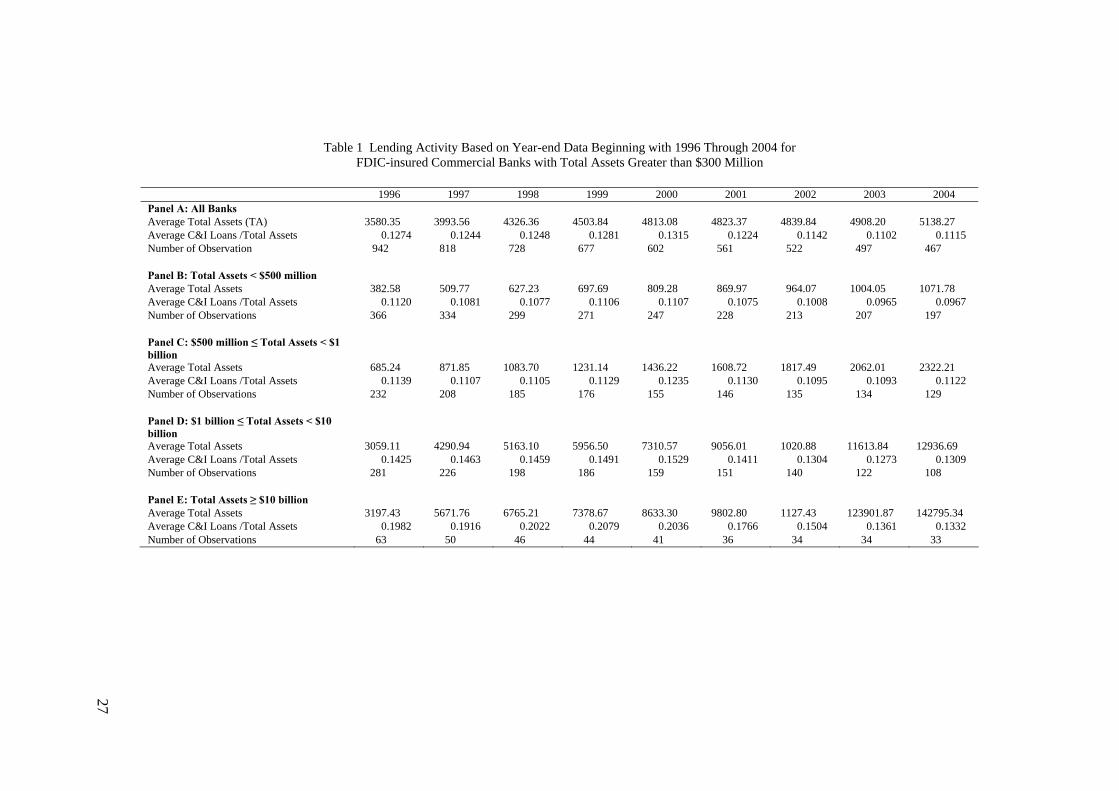
financial and the productive sectors of the economy. Table 1 presents year-end data for bank
C&I loan lending activity for the sample banks from 1996 through 2004. The sample period
covers a full business cycle and thereby provides a better indication of the relative variability
of lending activities experienced by the commercial banks in different stages of a business
cycle. Panels B through E report data for four categories of institutions classified by total
asset size. Corresponding to the acceleration of C&I loans in the late 1990s, the average ratio
of C&I loans to total assets increases steadily, from 12.44 percent at the year-end of 1997 to
13.15 percent at the year-end of 2000. Then, from year-end 2001 to year-end 2003, the
average ratio of C&I loans to total assets exhibits a downward trend, which corresponds to
the economic recession beginning in March of 2001. As panels B through E report, this
pattern exists across different sizes of banks, with the largest decline occurring for banks
having total assets greater than $10 billion. This decline stops at year-end 2004 when the
overall economy experiences more rapid growth.
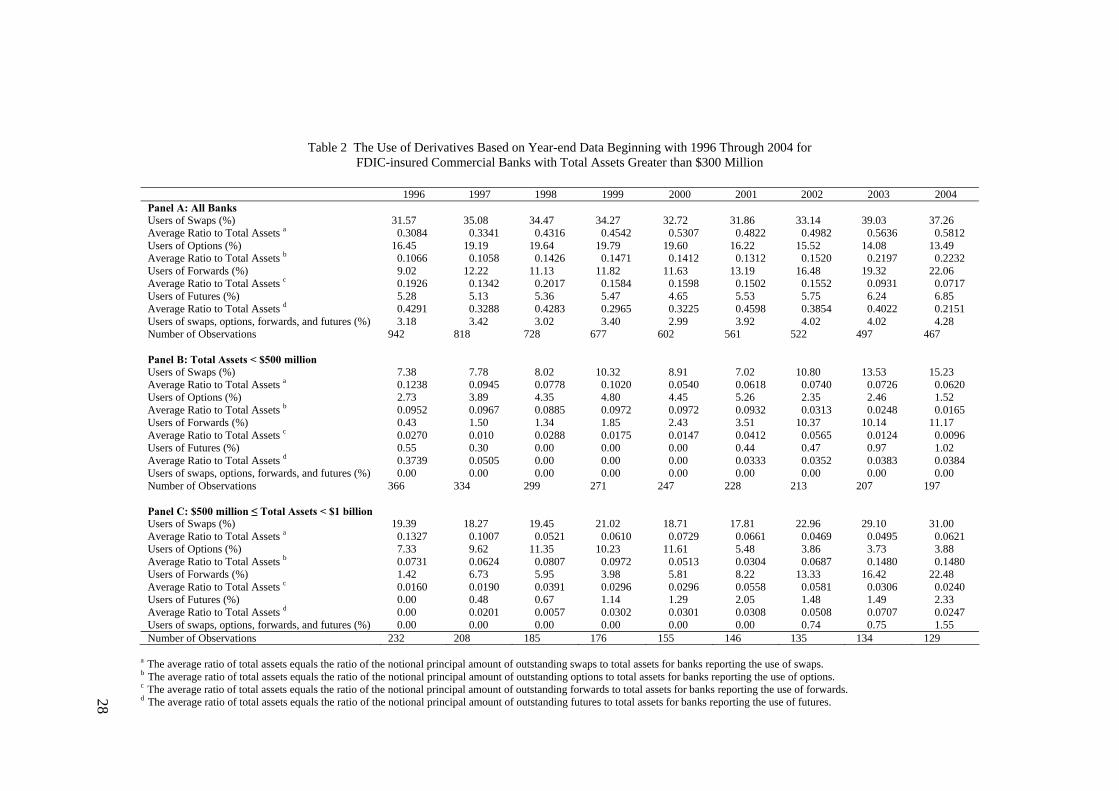
2.3 Interest-rate Derivative Products
The use of interest-rate derivatives by banks has grown dramatically in recent years,
rising from notional amounts of $27.88 trillion at the end of 1996 to $62.78 trillion at the end
of 2004. Four main categories of interest-rate derivative instruments are examined: swaps,
options, forwards, and futures. Table 2 presents the notional principal amounts outstanding
and the frequency of use of each type of interest-rate derivative by banks from year-end 1996
through year-end 2004. As in Table 1, data are reported for the entire sample of banks and
for four subgroups of banks categorized by total asset size. Consistent with the dramatic
increase in the use of derivatives in recent years, Table 2 shows extensive participation of

8
banks in the interest-rate derivative markets over the nine-year sample period. Furthermore,
the rapid growth in the use of various types of derivative instruments has not been confined
to large commercial banks; medium-size and small-size banks have also experienced a
tremendous increase in the participation of derivative markets.
As shown in Table 2, during the entire sample period, the most widely used interest-
rate derivative instrument is the swap. At the end of 1996, 31.6 percent of banks report using
interest-rate swaps. By the end of 2004, the percentage using swaps rise to 37.3 percent. Over
the nine-year sample period, more than 95 percent of banks with total assets exceeding $10
billion report using interest-rate swaps.
Another notable increase occurred in the forward-rate agreement (FRA) usage. FRA
is a contract that determines the rate of interest, or currency exchange rate, to be paid or
received on an obligation beginning at some future date. At the end of 1996, 9.02 percent of
the sample banks report using FRAs. By the end of 2004, the percentage using FRAs more
than doubled. While the percentage of banks participating in the swaps and forwards
increased over the sample period, the proportion of banks using interest-rate options fell.
This decline is most notable between year-end 2000 and year-end 2004. With the exception
of banks with total assets greater than $10 billion, less than 7.5 percent of banks report
having open positions in interest-rate futures.
Finally, less than 3 percent of the sample banks report having open positions in
interest-rate swaps, interest-rate options, interest-rate forwards, and interest-rate futures. In
contrast, nearly half of the banks with total assets greater than $10 billion report having
positions in all four types of interest-rate derivative instruments. This result strongly suggests
that large banking organizations are much more likely than small banking organization to use

9
derivatives. As shown in Panel E of Table 2, approximately 25 of the largest banks heavily
participated in the interest-rate derivative market, a result similar to the finding of Carter and
Sinkey (1998).
3. Specifications of Variables
Based on the literature regarding the determinants of bank lending, this section
describes the specification for intermediation, the independent variables used in the empirical
model, and the measure of derivative activities.
3.1 The Specification for Intermediation
The foundation of the empirical analysis in this article is the specification for bank
lending by Sharpe and Acharya (1992). They regress a measure of lending activity on a set of
possible supply and demand factors ( , 1)j tX − . Brewer, Minton, and Moser (2000), who
studied an earlier sample of commercial banks for the period June 30, 1985, through the end
of 1992, extended the specification by adding a measure of participation in interest-rate
derivative markets ( ,j tDERIV ) into the equation. Following Sharpe and Acharya (1992), we
use the quarterly change in C&I loans relative to last period’s total assets ( ,j tCILGA ) as the
dependent variable. In order to examine the relationship between the growth in bank C&I
loans and the banks’ participation in interest-rate derivative markets, we also include various
measures of participation in interest-rate derivative markets ( ,j tDERIV ) in the following
regression specification:
, , 1 ,( , )j t j t j tCILGA f X DERIV−= (1)
10
3.2 Independent variables (Traditional Supply and Demand Factors)
The explanatory variables represent both supply and demand factors , 1( )j tX − . Based
on the literature on the determinants of bank lending, we determine how these supply and
demand factors enter into the regression specification. First, Bernanke and Lown (1991) and
Sharpe and Acharya (1992), among others,2 relate overall loan growth to capital requirements.
In addition, Sharpe (1995) finds that there is a positive association between bank capital and
loan growth. In a more recent work, Beatty and Gron (2001) document that, consistent with
Sharpe’s finding, banks with higher capital growth relative to assets experience greater
increases in their loan portfolios, and banks with weak capital positions are less able to
increase their loan portfolios due to capital constraints. When a bank’s capital falls short of
the required amount, the bank could attempt to raise the capital-to-asset ratio by reducing its
assets (the denominator of the ratio) rather than raising capital (the numerator of the ratio).
One way of doing this is to shift the asset portfolio away from lending, such as cutting back
its investment in C&I loans. Banks may choose this strategy over equity issuance simply
because issuing equity is costly.3 Therefore, undercapitalized banks are less able to increase
their loan portfolios while satisfying the regulatory capital requirements. In contrast, banks
with stronger capital positions have more room to expand their loan portfolios and still be
able to satisfy the regulatory requirement for the capital-to-asset ratio. If capital-constrained
banks adjust their lending to meet some predetermined target capital-to-asset ratios, one
would expect a positive relationship between a bank’s capital-to-asset ratio and C&I loan
2Examples of this literature also include Hall (1993), Berger and Udell (1994), Haubrich and Wachtel
(1993), Hancock and Wilcox (1994), Brinkman and Horvitz (1995), and Peek and Rosengren (1995). 3For example, Stein (1998), among others, shows that asymmetric information between investors and a
bank causes adverse selection problems that make issuing new equity costly.
11
growth. In order to control for the effect of capital requirements on C&I lending activity, a
measure of the bank’s capital-to-asset ratio (CARATIO) is included in the empirical
specification for C&I loan growth. CARATIO is measured as the ratio of a bank’s total
equity capital to total assets at time t-1.
Another factor found to affect loan growth is the quality of a bank’s loan portfolio.
Following Sharpe and Acharya (1992), we use C&I loan charge-offs (CILCOFA) as a proxy
for loan quality.4 The variable CILCOFA is constructed as the ratio of C&I loan charge-offs
in the last period (t-1) to total assets in the last period (t-1). Charge-offs usually rise during a
recession and decline only after an economic recovery. Therefore, a low charge-offs ratio can
also be a signal of a favorable economic environment in a bank’s geographic region of
operations. In addition, the ratio of C&I loan charge-offs to total assets could capture the
impact of regulatory pressures on loan growth because regulators often apply pressure to
banks to increase their rates of charge-offs. For example, capital-constrained banks may be
required to increase their rates of charge-offs so that they can clear the regulatory hurdle for
capital ratios by eliminating some of their assets.5 Therefore, the ratio of C&I loan charge-
offs to total assets could reflect the impact of regulatory pressures on banks’ capital
management. Each of these reasons suggests that those banks with high charge-offs should,
other things being equal, be viewed as less well capitalized than banks with low charge-offs,
and are therefore less able to increase their loan portfolios due to capital constraints. For
4Another measure of loan quality is the provision for loan losses. The reason that charge-offs is used
instead of provision for loan losses is because the loan charge-offs variable also captures the impact of regulatory influence.
5Kim and Kross (1998) and Ahmed, Takeda, and Thomas (1999), among others, find evidence that
regulatory capital and earnings outcomes influence managers’ discretion in charge-offs, loan loss provisions, and miscellaneous gains.
12
these reasons, one would expect CILCOFA to have a negative association with C&I loan
growth.
The relationship between bank health and regional economic conditions is another
factor to consider. The idea that regional economic performance affects bank health is
intuitive and broadly consistent with the aggregate banking data.6 Avery and Gordy (1998)
find that one-half of the change in bank loan performance from 1984 to 1995 can be
explained with a group of state-level economic variables. Also, Bernanke and Lown (1991)
and Williams-Stanton (1996) point out that regional economic conditions should influence
bank C&I loan growth. The intuition is that banks in states with weak economic conditions
are likely to have fewer profitable opportunities than banks in states with stronger economies.
The state employment growth rate ( , 1j tEMPG − ) is included in the model as a proxy for local
economic conditions that are not captured by the other explanatory variables.7 If state
employment growth is a proxy for economic conditions, one would expect EMPG to be
positively related to C&I loan growth, other things being equal.
3.3 Measure of Derivative Activities
In order to capture the effects of derivative usage on bank-loan growth, we include
various measures of participation in interest-rate derivative markets ( ,j tDERIV ) in the C&I
loan growth specification (the construction of this variable is presented in equation 2). The
coefficient estimate on DERIV reflects the impact of derivative usage conditional on
adequately incorporating the intermediating process in the remaining terms of the
6For example, Daly, Krainer, and Lopez (2003) show that there is a significant trackable link between
regional economic performance and bank health. Also, Berger, Bonime, Covitz, and Hancock (2000) document that aggregate state-level and regional-level variables are important contributors to the persistence in firm-level performance (i.e., return on assets) observed in the U.S. banking industry.
7See Calomiris and Mason (2000), Avery and Gordy (1998), and Berger et al. (2000).
13
specification. Modern theories of the intermediary role of banks describe how derivative
contracting and lending can be complementary activities. Diamond (1984) develops a theory
of financial intermediation. In his model, banks optimally offer debt contracts to “depositors”
and accept debt contracts from “entrepreneurs.” Depositors delegate monitoring activities to
banks that have the ability to economize the costs of monitoring loan contracts made with
entrepreneurs. However, banks face an incentive problem that originates from the cost of
delegated monitoring on behalf of their depositors. Diamond shows that diversification
within a bank lowers the cost of delegated monitoring. An implication of his model is that
banks should not assume any nondiversifiable risks unless they have special advantages in
managing them. Thus in his model, banks find it optimal to hedge all interest-rate risk by
interest-rate derivatives.8 However, even after diversifying, banks may still face systematic
risks that cannot be diversified away.
Diamond demonstrates that derivative contracts can serve as a third form of
contracting, which enables banks to reduce their exposure to systematic risk in their loan
portfolios. This use of derivative contracts to hedge systematic risks enables banks to obtain
further reductions in delegation costs, and, in turn, allows banks to intermediate more
effectively. Empirically, Brewer, Jackson, and Moser (1996) find that there is a negative
correlation between risk and derivative usage for savings and loan institutions. In fact, they
find that S&Ls that use derivatives experience relatively greater growth in their fixed-rate
mortgage portfolios. Brewer, Minton, and Moser (2000) examine the relationship between
lending and derivative usage for an earlier sample of FDIC-insured commercial banks. Their
results indicate that banks using interest-rate derivatives, on average, experience significantly
8See Purnanandam (2004).

14
higher growth in their C&I loan portfolios. These results are consistent with the notion that
derivative usage would help banks better cope with interest-rate risk and thereby enable them
to hold more loans to earn more income from their lending activity. If interest-rate derivative
activity complements the lending activity as predicted by Diamond’s (1984) model, one
would expect a positive coefficient estimate on the DERIV variable.
In this study, a downward trend in C&I lending during the economic recession
beginning in March of 2001 is observed. Brewer, Minton, and Moser (2000) also document a
similar pattern regarding C&I lending over a sample period from 1985 to 1992, a period
during which the economy experienced a significant cyclical downturn. They argue that the
downward trend in lending activity and the concurrent increase in the use of interest-rate
derivatives suggest that derivative usage might be a substitute for lending activity. They
suggest that a negative relationship between derivative usage and lending activity could arise
in two cases. The first case is when banks use derivatives for speculative purposes. Gain
from speculating on interest-rate changes would enhance revenues from bank trading desks.
The second instance is when banks charge a fee as over-the-counter dealers for placing
derivative positions. Pursuit of either of these activities as a replacement for the traditional
lending activities of banks would imply that derivative activity would be a substitute for
lending activity. If these activities were substitutes, one would expect a negative coefficient
on the DERIV variable.
From the above discussion, a specification for Equation (2) can be written as follows:
, 0 1 , 1 2 , 12
3 , 1 4 , ,
T
j t t t j t j tt
j t j t j t
CILGA D CARATIO CILCOFA
EMPG DERIV
α α β β
β β ε
− −=
−
= + + +
+ + +
∑ (2)

15
In Equation (2), ,j tCILGA is measured as the quarterly change in C&I loans relative to last
period’s total assets. tD is a time-indicator variable equal to one for period t, or zero
otherwise. The variable , 1j tCARATIO − is the ratio of a bank’s total equity capital to total assets
in the previous period (t-1). , 1j tCILCOFA − is the ratio of C&I loan charge-offs in the previous
period (t-1) to total assets in the previous period (t-1). , 1j tEMPG − is the state employment
growth rate relative to last period (t-1), where EMP equals total employment in the state in
which the bank’s headquarters are located. The variable ,j tDERIV is a measure of participation
in interest-rate derivative markets.
Table 3 reports summary statistics for the variables used in the estimation of Equation
(2). The mean of quarter-to-quarter changes in C&I loans scaled by values of beginning-of-
quarter total assets is 0.4 percent over the full sample period. During this period, the average
capital-to-asset ratio is 9.45 percent, the average C&I loan charge-offs over assets is 0.05
percent, and the average state employment growth rate is 0.45 percent. Consistent with the
data presented in Table 2, 20.78 percent of the sample banks reported using interest-rate
swaps during the sample period, 11.26 percent of the sample banks reported using interest-
rate options, and 8.61 percent reported using FRAs. Only 3.28 percent of the sample banks
reported using interest-rate futures. Finally, over-the-counter dealers and subsidiaries of
foreign banks comprise only 1.2 percent and 4.5 percent, respectively, of the sample bank
observations.
3.4 Instrumental Variable
Examining the relationship between the C&I loan growth and derivative usage poses
a potential endogeneity problem because the derivative-use decision and lending choices may

16
be made simultaneously. As the data show, the decisions could be made jointly since a
bank’s C&I lending activity might affect its decision to use derivatives. To address this
problem, an instrumental-variable approach is used.
The probit specification for the instrumental variable is based on Kim and
Koppenhaver (1992).9 This probit specification includes the log of bank assets, the capital-
to-asset ratio, net interest margin, and the first lag of the dependent variable. Commercial
bank size as measured by the logarithm of its total assets is included to control for the
differences in derivative use that might be caused by differences in the types of businesses
and customers at large and small banks.10 The capital-to-asset ratio is included in the probit
specification because a bank’s capital adequacy is a necessary condition for its participation
in the derivative market. A bank’s net interest margin enters into the equation because banks
can use derivatives to lock-in the spread between interest income and interest expense. Since
derivative use at time t is usually dependent on derivative use at time t-1, the first lag of the
dependent variable is included to take into account the dependence over time. To determine
the probability of a bank’s derivative usage, the above probit specification for each sample
date t is estimated, and then the estimated probability from the first-stage estimation is used
as an instrument for derivative activity in the second-stage estimation.11 The results of this
first-stage regression are presented in Appendix A. Overall, the probit results show that, as
predicted, bank size, capital-to-asset ratio, and the lagged dependent variable play a
significant role in determining the probability of derivative usage by U.S. commercial banks.
9Brewer, Minton, and Moser (2000) use a similar probit specification in their study. 10Previous literature finds that size is an important indicator in a bank’s derivative activities; e.g.,
Sinkey and Carter (1997), Kim and Koppenhaver (1992), and Gunther and Siems (1996). 11A Hausman test indicates that the instrumental variable is a valid instrument.
17
Since banks’ use of derivatives increases during the sample period, a pooled cross-
sectional time-series regression is employed to incorporate this dynamic effect.12 Specifically,
we run a cross-sectional Ordinary Least Squares regression with C&I loan growth as the
dependent variable and then report the time-series means of the parameter estimates and their
corresponding t-statistics. The t-values are computed using Newey-West heteroskedasticity-
and-autocorrelation-consistent errors. We use the predicted derivative use, obtained from the
probit specification, to instrument the actual derivative-use variable as an independent
variable.
4. Empirical Results
Using the quarterly change in C&I loans relative to last period’s total assets as the
dependent variable, we utilize Equation (2) to examine the determinants of C&I lending and
the impact of derivatives on C&I lending activity. Table 4 reports the results of pooled cross-
sectional time-series regressions using quarterly data from March 1996 through December
2004.
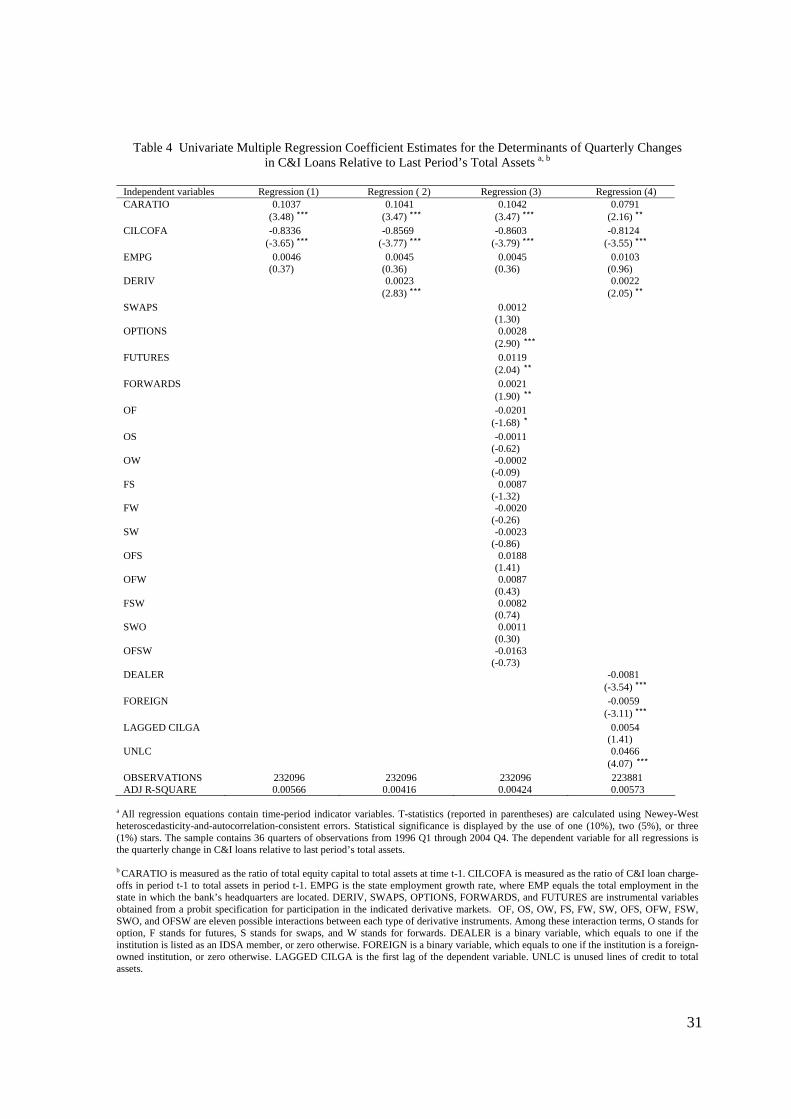
Regression (1) of Table 4 is the reduced form of the supply equation that examines
the impact of fundamental factors on C&I lending activity. This regression serves as a base
for examining the relationship between derivative activity and C&I lending. In regression (1),
C&I loan growth is significantly and positively related to the beginning-of-period CARATIO.
This result is consistent with the hypothesis that capital-constrained banks adjust their loan
portfolios in subsequent periods to meet some predetermined target capital-to-asset ratios.
Similar to Brewer, Minton, and Moser (2000), we also find a significant, negative association
between CILCOFA and C&I loan growth. This negative relationship is consistent with the
12Appendix B provides the coefficient on the time-period indication variables.

18
notion that the charge-offs variable captures the impact of regulatory pressures, a strong
economic environment, or both. The previous period’s state employment growth variable
EMPG fails to enter the equation significantly. This result is inconsistent with Brewer,
Minton, and Moser (2000), who study a sample of banks that predates the advent of interstate
banking. During the course of the 1990s, deregulation in the banking industry led to
consolidation and to banks’ geographic expansion. As a result, U.S. banks have also become
more geographically diversified. In fact, the regression results might suggest that state
economies play a lesser role in affecting banks’ health and performance following the full
expansion of interstate banking.
Regressions (2) and (3) include different measures of derivative activity. Regression
(2) augments the predicted probability of derivative usage in any type of interest-rate
derivative contract (DERIV). Regression (3) decomposes the DERIV variable into four types
of interest-rate derivative instruments: SWAPS, OPTIONS, FORWARDS, and FUTURES.
Each type of derivative activity is estimated using the probit specification discussed earlier in
this section. The estimates generated in the probit specification are then used in conjunction
with the supply and demand factors in the second-stage regression to predict C&I loan
growth.
Columns (2) and (3) of Table 4 report the estimation results for the derivative-
augmented regressions. First, the coefficient estimates on CARATIO, CILCOFA, and EMPG
are qualitatively similar to those in the base model. Second, the CARATIO and CILCOFA
coefficient estimates remain statistically significant.
19
Regression (2) of Table 4 shows that banks using any type of interest-rate derivative,
on average, experience significantly higher growth in their C&I loan portfolios.13 This
positive relationship between derivatives use and C&I loan growth is consistent with
Diamond’s (1984) model of financial intermediation. In that model, Diamond argues that
interest-rate derivatives allow commercial banks to lessen their systematic exposure to
changes in interest rates. In addition, interest-rate derivatives create extra risk tolerance,
enabling banks to provide more C&I loans without increasing the total risk level faced by the
banks. Furthermore, a positive and significant coefficient estimate on the DERIV variable
indicates that the net effect of derivative use on C&I lending activity is complementary. That
is, the complementary effect dominates any substitution effect.
The regression reported in column (3) of Table 4 examines the relative role played by
each type of derivative instrument in explaining C&I loan growth. Since banks that invest in
the human capital and internal control systems necessary to be active in the market for
derivatives are more likely to use more than one type of derivative,14 we also control for the
effect of eleven possible interactions between each type of derivative activity in the
regression.15 The results show that the coefficient estimates on all four kinds of derivative
variables are positive. The coefficient estimates on OPTIONS, FORWARDS, and FUTURES
are statistically significant. These results suggest that the use of these three types (Options,
Forwards, and Futures) of derivatives is significantly associated with higher C&I loan growth.
13When the actual derivative use rather than the predicted derivative use is included in the C&I loan
growth specification, the coefficient estimate (not reported) on DERIV is positive and marginally significant at the 10% level. The actual derivatives-use indicator variable is a binary variable equal one if a bank engages in any interest-rate derivative activity, or zero otherwise.
14See Carter and Sinkey (1998). 15See Table 4 for a detailed breakdown of interaction terms.

20
Further, except for the interaction between options and futures, none of the coefficient
estimates on the interaction terms between each type of derivative activity is significant.16
Overall, our results suggest that aggregate use of derivative instruments, in particular
interest-rate options, interest-rate futures, and interest-rate forwards, is associated with higher
growth rates in C&I loans.
5. Robustness Check
To check the validity of the regression results, we augment the regression (2)
specification by adding variables measuring other characteristics of financial institutions that
may explain lending activity during the sample period. The augmented regression reported in
column (4) of Table 4 addresses the concern of omitting important variables that might alter
the observed positive relationship between lending activity and participation in interest-rate
derivatives.
First, the lagged dependent variable (LAGGED CILGA) is included in the regression
to account for the possibility that the derivative-participation variable is a proxy for growth
potential. we also include a control for a foreign-firm effect by introducing a binary variable
equal to one if a bank is a subsidiary of a foreign financial institution (FOREIGN), or zero
otherwise. Previous literature suggests that the operation of foreign-owned banks helps to
fund U.S. operations of foreign industrial firms.17 Therefore, foreign-owned banks may be
expected to provide both loans and interest-rate derivatives to their customers, inducing a
positive coefficient. On the other hand, foreign-owned banks also have some disadvantages
due to problems in managing from a distance and coping with multiple economic/regulatory
16Without the interaction terms, the coefficient estimates (not reported) on all four kinds of derivative
instruments have a positive sign, and the estimates on options and forwards are statistically significant. 17For example, see Bhattacharaya (1993).
21
environment.18 These disadvantages may cause foreign-owned banks to experience slower
growth in their loan portfolios, other things being equal.
In consideration of the possibility of a spurious relationship between C&I loan growth
and dealer activity performed by large banks that are heavily involved in derivative
contracting, a binary variable is included in the regression to control for membership in the
International Swaps and Derivatives Association (ISDA). The binary variable DEALER
equals one if a bank is identified as a dealer by the ISDA membership list, 19 or zero
otherwise.
Finally, the ratio of the dollar value of any unused lines of credit (UNLC) to total
assets is included as a measure of risk tolerance. The risk is two-dimensional. First, liquidity
problems may emerge as banks commit to fill larger credit lines. Second, banks’ off-balance-
sheet exposures to credit risk may increase as they extend lines of credit to manage the
interest-rate risk. Controls introduced for these possibilities provide a way of separating loan
growth from risk-taking motivations.
Regression (4) incorporates the above proxies for other activities that may cloud the
positive association between derivative activity and loan growth. As shown in column (4) of
Table 4, the results of the study remain robust. Specifically, the coefficient on predicted
derivative activity (DERIV) remains positive and statistically significant. In addition, the
coefficient on the foreign-bank variable (FOREIGN) is negative and highly significant,
suggesting that foreign-owned banks experience slower growth in C&I loan lending activities.
As Brewer, Minton, and Moser (2000) suggest, dealer activities performed by the banks
could give rise to a negative relationship between derivative usage and lending because
18For example, see Berger, Dai, Ongena, and Smith (2003) and Buch (2003). 19ISDA membership list is available at http://www.isda.org.

22
banks enhance their revenue by acting as over-the-counter (OTC) dealers and charge a fee for
placing derivative positions. Consistent with their prediction, the coefficient on the dealer
variable is negative and significant. Finally, the coefficient estimate on the lagged dependent
variable is not significantly different from zero. The ratio of unused lines of credit to total
assets, UNLC, is positive and significant, suggesting that the higher the risk tolerance as
measured by UNLC, the greater the C&I loan growth.
6. Conclusions
Commercial banks employ different methods, including the use of interest-rate
derivatives to manage interest-rate risks. The use of these derivative instruments by banks
has increased tremendously in the past decade, rising from notional amounts of $27.88
trillion at the end of December of 1996 to $62.78 trillion at the end of 2004. The relationship
between derivative usage and lending activity has been studied in related literature in recent
years. This paper addresses the question of whether derivative usage complements or
substitutes for the lending activity, investigates the relationship between bank participation in
derivative contracting and bank lending for the period of March 31, 1996, through December
31, 2004.
Overall, this study documents a direct relationship between derivative usage by U.S.
banks and growth in their commercial and industrial loan portfolios. More specifically, we
find that aggregate use of derivative instruments, in particular interest-rate options, interest-
rate futures, and interest-rate forwards, is associated with higher growth rates in C&I loans.
These findings are consistent with the results of an earlier study by Brewer, Minton, and
Moser (2000), who examine the relationship between lending and derivative usage for a
sample of FDIC-insured commercial banks between 1985 and 1992. This documented
23
positive association is consistent with Diamond’s (1984) hypothesis that derivative
contracting and lending are complementary activities. Diamond’s model predicts that banks
can reduce the cost of delegated monitoring by holding a diversified portfolio. Engaging in
derivative activities helps banks reduce the cost of monitoring contracts issued to their loan
customers, thereby enabling banks to increase their lending activities without increasing the
total risk level faced by the banks.
In addition, these results suggest that C&I loan growth has a significant positive
relationship with the capital ratio. These results are consistent with the previous banking
research in that banks with stronger capital are more able to increase their loan portfolios. we
also document a negative relationship between C&I loan charge-offs and C&I loan growth.
This negative association is in line with the notion that the charge-offs variable captures the
impact of regulatory pressures or a strong economic environment, or both. Further, the main
results are confirmed after a robustness check.
Finally, the sample shows that less than 3 percent of the sample banks report having
open positions in all four kinds of interest-rate derivative instruments. In contrast, nearly half
of the banks with total assets greater than $10 billion report having positions in all four kinds
of interest-rate derivative instruments. This result strongly suggests that large banking
organizations are much more likely than small banking organizations to fully utilize
derivatives.
24
References
Ahmed, Anwar S., Carolyn Takeda, and S. Thomas, 1999, Bank loan loss provisions: A
reexamination of capital management, earnings management and signaling effects, Journal of Accouting and Economics 28, 1-25.
Avery, R., and M. Gordy, 1998, Loan growth, economic activity, and bank performance, Working paper, Board of Governors of the Federal Reserve System.
Beatty, Anne, and Anne Gron, 2001, Capital, portfolio, and growth: Bank behavior under risk-based capital guidelines, Journal of Financial Services Research 20, 5-31.
Berger, A. N., S. D. Bonime, D. M. Covitz, and D. Hancock, 2000, Why are bank profits so persistent? The roles of product market competition, informational opacity and regional/macroeconomic shocks, Journal of Banking and Finance 24, 1203-1235.
Berger, A. N., Q. Dai, S. Ongena, and D. C. Smith, 2003, To what extent will the banking industry be globalized? A study of bank nationality and reach in 20 European nations, Journal of Banking and Finance 27, 383-415.
Berger, Allen N., and Gregory Udell, 1994, Did risk-based capital allocate bank credit and cause a ‘credit crunch’ in the U.S.? Journal of Money, Credit and Banking 26, 585-628.
Bernanke, Ben, and Cara Lown, 1991, The credit crunch, Brookings Papers on Economic Activity 2, 205-247.
Bhattacharaya, Joydeep, 1993, The role of foreign banks in developing countries: A survey of evidence, Mimeograph, Cornell University.
Brewer, Elijah, III, William E. Jackson III, and James T. Moser, 2001, The value of using interest rate derivatives to manage risk at U.S. banking organizations, Economic Perspectives, Federal Reserve Bank of Chicago 3Q, 49-66.
Brewer, Elijah, III, Bernadette A. Minton, and James T. Moser, 2000, Interest-rate derivatives and bank lending, Journal of Banking & Finance 24, 353-379.
Brewer, Elijah, III, William E. Jackson III, and James T. Moser, 1996, Alligators in the swap, Journal of Money,Credit and Banking 28, 482-502.
Brinkman, Emile J., and Paul M. Horvitz, 1995, Risk-based capital standards and the credit crunch, Journal of Money, Credit and Banking 27, 848-863.
Buch, C. M., 2003, Information versus regulation: What drives the international activities of commercial banks, Journal of Money Credit and Banking 35, 851-869.

25
Calomiris, C. W., and J. R. Mason, 2000, Causes of U.S. bank distress during the depression, NBER Working paper #7919.
Carter, David A., and Joseph F. Sinkey, Jr., 1998, The use of interest rate derivatives by end-users: The case of large community banks, Journal of Financial Services Research 14, 17-34.
Daly, M., J. Krainer, and J. A. Lopez, 2003, Does regional economics performance affect bank conditions? New analysis of an old question, Working paper, Federal Reserve Bank of San Francisco.
Diamond, Douglas W., 1984, Financial intermediation and delegated monitoring, Review of Economic Studies 51, 393-414.
Gunther, Jeffery W., and Thomas F. Siems, 1995, The likelihood and extent of banks’
involvement with interest-rate derivatives as end-users, Working paper, Federal Reserve Bank of Dallas.
Hall, Brian, 1993, How has the Basel Accord affected bank portfolios? Journal of the Japanese and International Economies 7, 408-440.
Hancock, Diana, and James A. Wilcox, 1994, Bank capital and the credit crunch: The roles of risk-weighted and unweighted capital regulation, Journal of the American Real Estate and Urban Economics Association 22, 59-94.
Haubrich, Joseph, and Paul Wachtel, 1993, Capital requirements and shifts in commercial bank portfolios, Federal Reserve Bank of Cleveland Economic Review 29, 2-15.
Kim, M., and A. Kross, 1998, The impact of the 1989 change in bank capital standards on loan loss provisions and loan write-offs, Journal of Accounting and Economics 25, 69-99.
Kim, S., and G. D. Koppenhaver, 1992, An empirical analysis of bank interest rate swaps, Journal of Financial Services Research 7, 57-72.
Minton, Bernadette A., Rene Stulz, and Rohan Williamson, 2005, How much do banks use credit derivatives to reduce risk? Working paper, Ohio State University.
Peek, Joe, and Eric Rosengren, 1995, The capital crunch: Neither a borrower nor a lender be, Journal of Money, Credit and Banking 27, 625-638.
Purnanandam, A., 2004, Interest rate risk management at commercial banks, Working paper, University of Michigan Business School.
Sharpe, Steven A., 1995, Bank capitalization, regulation, and the credit crunch: A critical review of the research findings, Finance and Economics Discussion Series Paper, No. 95/20, Board of Governors of the Federal Reserve System.
26
Sharpe, Steven A., and S. Acharya, 1992, Loan losses, bank capital, and the credit crunch, Federal Reserve Board of Governors, Washington, DC.
Schrand, C. M., 1997, The association between stock-price interest rate sensitivity and disclosure about derivative instruments, The Accounting Review 72, 87-109.
Sinkey, Joseph F., Jr., and David Carter, 1997, Derivatives in U.S. banking: Theory, practice,
and empirical evidence, Derivatives, Regulation and Banking. Amsterdam: Elsevier Science, 41-78.
Sinkey, Joseph F., Jr., and David Carter, 1994, The derivatives activities of U.S. commercial banks, Papers and Proceedings of the 30th Annual Conference on Bank Structure and Regulation, 165-185.
Stein, Jeremy C., 1998, An adverse-selection model of bank asset and liability management with implications for the transmission of monetary policy, RAND Journal of Economics 29, 466-86.
Williams-Stanton, S., 1996, The effects of risk-based capital on wealth and risk-taking in banking, Working paper, Ohio State University.
27
Table 1 Lending Activity Based on Year-end Data Beginning with 1996 Through 2004 for FDIC-insured Commercial Banks with Total Assets Greater than $300 Million
1996 1997 1998 1999 2000 2001 2002 2003 2004 Panel A: All Banks Average Total Assets (TA) 3580.35 3993.56 4326.36 4503.84 4813.08 4823.37 4839.84 4908.20 5138.27 Average C&I Loans /Total Assets 0.1274 0.1244 0.1248 0.1281 0.1315 0.1224 0.1142 0.1102 0.1115 Number of Observation 942 818 728 677 602 561 522 497 467 Panel B: Total Assets < $500 million Average Total Assets 382.58 509.77 627.23 697.69 809.28 869.97 964.07 1004.05 1071.78 Average C&I Loans /Total Assets 0.1120 0.1081 0.1077 0.1106 0.1107 0.1075 0.1008 0.0965 0.0967 Number of Observations 366 334 299 271 247 228 213 207 197 Panel C: $500 million ≤ Total Assets < $1 billion
Average Total Assets 685.24 871.85 1083.70 1231.14 1436.22 1608.72 1817.49 2062.01 2322.21 Average C&I Loans /Total Assets 0.1139 0.1107 0.1105 0.1129 0.1235 0.1130 0.1095 0.1093 0.1122 Number of Observations 232 208 185 176 155 146 135 134 129 Panel D: $1 billion ≤ Total Assets < $10 billion
Average Total Assets 3059.11 4290.94 5163.10 5956.50 7310.57 9056.01 1020.88 11613.84 12936.69 Average C&I Loans /Total Assets 0.1425 0.1463 0.1459 0.1491 0.1529 0.1411 0.1304 0.1273 0.1309 Number of Observations 281 226 198 186 159 151 140 122 108 Panel E: Total Assets ≥ $10 billion Average Total Assets 3197.43 5671.76 6765.21 7378.67 8633.30 9802.80 1127.43 123901.87 142795.34 Average C&I Loans /Total Assets 0.1982 0.1916 0.2022 0.2079 0.2036 0.1766 0.1504 0.1361 0.1332 Number of Observations 63 50 46 44 41 36 34 34 33
28
Table 2 The Use of Derivatives Based on Year-end Data Beginning with 1996 Through 2004 for FDIC-insured Commercial Banks with Total Assets Greater than $300 Million
1996 1997 1998 1999 2000 2001 2002 2003 2004 Panel A: All Banks Users of Swaps (%) 31.57 35.08 34.47 34.27 32.72 31.86 33.14 39.03 37.26 Average Ratio to Total Assets a 0.3084 0.3341 0.4316 0.4542 0.5307 0.4822 0.4982 0.5636 0.5812 Users of Options (%) 16.45 19.19 19.64 19.79 19.60 16.22 15.52 14.08 13.49 Average Ratio to Total Assets b 0.1066 0.1058 0.1426 0.1471 0.1412 0.1312 0.1520 0.2197 0.2232 Users of Forwards (%) 9.02 12.22 11.13 11.82 11.63 13.19 16.48 19.32 22.06 Average Ratio to Total Assets c 0.1926 0.1342 0.2017 0.1584 0.1598 0.1502 0.1552 0.0931 0.0717 Users of Futures (%) 5.28 5.13 5.36 5.47 4.65 5.53 5.75 6.24 6.85 Average Ratio to Total Assets d 0.4291 0.3288 0.4283 0.2965 0.3225 0.4598 0.3854 0.4022 0.2151 Users of swaps, options, forwards, and futures (%) 3.18 3.42 3.02 3.40 2.99 3.92 4.02 4.02 4.28 Number of Observations 942 818 728 677 602 561 522 497 467 Panel B: Total Assets < $500 million Users of Swaps (%) 7.38 7.78 8.02 10.32 8.91 7.02 10.80 13.53 15.23 Average Ratio to Total Assets a 0.1238 0.0945 0.0778 0.1020 0.0540 0.0618 0.0740 0.0726 0.0620 Users of Options (%) 2.73 3.89 4.35 4.80 4.45 5.26 2.35 2.46 1.52 Average Ratio to Total Assets b 0.0952 0.0967 0.0885 0.0972 0.0972 0.0932 0.0313 0.0248 0.0165 Users of Forwards (%) 0.43 1.50 1.34 1.85 2.43 3.51 10.37 10.14 11.17 Average Ratio to Total Assets c 0.0270 0.010 0.0288 0.0175 0.0147 0.0412 0.0565 0.0124 0.0096 Users of Futures (%) 0.55 0.30 0.00 0.00 0.00 0.44 0.47 0.97 1.02 Average Ratio to Total Assets d 0.3739 0.0505 0.00 0.00 0.00 0.0333 0.0352 0.0383 0.0384 Users of swaps, options, forwards, and futures (%) 0.00 0.00 0.00 0.00 0.00 0.00 0.00 0.00 0.00 Number of Observations 366 334 299 271 247 228 213 207 197 Panel C: $500 million ≤ Total Assets < $1 billion Users of Swaps (%) 19.39 18.27 19.45 21.02 18.71 17.81 22.96 29.10 31.00 Average Ratio to Total Assets a 0.1327 0.1007 0.0521 0.0610 0.0729 0.0661 0.0469 0.0495 0.0621 Users of Options (%) 7.33 9.62 11.35 10.23 11.61 5.48 3.86 3.73 3.88 Average Ratio to Total Assets b 0.0731 0.0624 0.0807 0.0972 0.0513 0.0304 0.0687 0.1480 0.1480 Users of Forwards (%) 1.42 6.73 5.95 3.98 5.81 8.22 13.33 16.42 22.48 Average Ratio to Total Assets c 0.0160 0.0190 0.0391 0.0296 0.0296 0.0558 0.0581 0.0306 0.0240 Users of Futures (%) 0.00 0.48 0.67 1.14 1.29 2.05 1.48 1.49 2.33 Average Ratio to Total Assets d 0.00 0.0201 0.0057 0.0302 0.0301 0.0308 0.0508 0.0707 0.0247 Users of swaps, options, forwards, and futures (%) 0.00 0.00 0.00 0.00 0.00 0.00 0.74 0.75 1.55 Number of Observations 232 208 185 176 155 146 135 134 129
a The average ratio of total assets equals the ratio of the notional principal amount of outstanding swaps to total assets for banks reporting the use of swaps. b The average ratio of total assets equals the ratio of the notional principal amount of outstanding options to total assets for banks reporting the use of options. c The average ratio of total assets equals the ratio of the notional principal amount of outstanding forwards to total assets for banks reporting the use of forwards. d The average ratio of total assets equals the ratio of the notional principal amount of outstanding futures to total assets for banks reporting the use of futures.

29
Table 2 (Continued) The Use of Derivatives Based on Year-end Data Beginning with 1996 Through 2004 for FDIC-insured Commercial Banks with Total Assets Greater than $300 Million
1996 1997 1998 1999 2000 2001 2002 2003 2004 Panel D: $1 billion ≤ Total Assets < $10 billion Users of Swaps (%) 56.58 53.09 57.57 65.59 65.41 57.62 60.00 62.29 65.74 Average Ratio to Total Assets a 0.1226 0.1245 0.1151 0.1037 0.0821 0.0991 0.0969 0.0990 0.1158 Users of Options (%) 25.62 34.51 33.84 33.87 35.22 25.83 26.43 24.59 22.22 Average Ratio to Total Assets b 0.0620 0.0460 0.0503 0.0602 0.0594 0.0685 0.0460 0.0641 0.1062 Users of Forwards (%) 13.52 19.47 17.68 19.89 18.24 19.21 20.00 24.59 27.78 Average Ratio to Total Assets c 0.0290 0.0194 0.0468 0.0178 0.0199 0.0712 0.0753 0.0341 0.0536 Users of Futures (%) 5.69 6.19 7.03 6.99 5.66 5.96 6.43 7.38 7.41 Average Ratio to Total Assets d 0.3500 0.2220 0.1831 0.1352 0.0673 0.1044 0.1086 0.0909 0.0217 Users of swaps, options, forwards, and futures (%) 2.14 2.65 1.52 3.23 2.52 3.97 2.86 2.46 2.78 Number of Observations 281 226 198 186 159 151 140 122 108 Panel E: Total Assets ≥ $10 billion Users of Swaps (%) 96.82 100 100 100 100 100 100 100 100 Average Ratio to Total Assets a 0.9196 1.1207 1.6920 1.7834 1.9616 2.3357 2.0354 2.6250 2.570 Users of Options (%) 88.89 92.00 91.30 90.91 87.80 88.89 91.18 91.18 93.94 Average Ratio to Total Assets b 0.1762 0.2285 0.3375 0.3433 0.3294 0.2610 0.3196 0.3889 0.3460 Users of Forwards (%) 66.67 74.00 67.39 70.45 63.41 69.44 76.47 67.65 66.67 Average Ratio to Total Assets c 0.3614 0.3313 0.4568 0.3780 0.3945 0.3221 0.3617 0.3033 0.2215 Users of Futures (%) 50.79 52.00 52.17 50.00 43.90 50.00 52.94 52.94 57.58 Average Ratio to Total Assets d 0.4721 0.4088 0.5964 0.4161 0.4630 0.4209 0.4883 0.5403 0.4493 Users of swaps, options, forwards, and futures (%) 38.10 44.00 41.30 38.64 34.15 44.44 47.06 47.06 45.5 Number of Observations 63 50 46 44 41 36 34 34 33
a The average ratio of total assets equals the ratio of the notional principal amount of outstanding swaps to total assets for banks reporting the use of swaps. b The average ratio of total assets equals the ratio of the notional principal amount of outstanding options to total assets for banks reporting the use of options. c The average ratio of total assets equals the ratio of the notional principal amount of outstanding forwards to total assets for banks reporting the use of forwards. d The average ratio of total assets equals the ratio of the notional principal amount of outstanding futures to total assets for banks reporting the use of futures.

30
Table 3 Summary Statistics for the Full Sample a
Variable
Mnemonic Mean Standard Deviation
Observations
Dependent variable and supply and demand factors Dependent variable C&I Loan Growth over total assets CILGA 0.004 0.0525 293568 Supply and demand factors Capital to asset ratio CARATIO 0.0945 0.0460 248278 C&I loan charge-offs over assets CILCOFA 0.0005 0.0012 232234 Employment growth EMPG 0.0043 0.0727 248277 Log total assets LNTOTASST 13.75 1.2323 293536 Additional supply and demand factors used in robustness tests Lagged dependent variable Defined Above Unused credit lines to total assets UNLC 0.0092 0.0233 224571 Classification Variable Swaps (0-Yes, 1-No) DSWAP 0.2078 0.4057 294475 Futures (0-Yes, 1-No) DFUTURES 0.0328 0.1782 294475 Forwards (0-Yes, 1-No) DFORWARD 0.0861 0.2805 294475 Options (0-Yes, 1-No) DOPTION 0.1126 0.3161 294475 Derivatives Dealer (0-No, 1-Yes) DEALER 0.0120 0.1082 294475 Foreign Bank (0-No, 1-Yes) FBANK 0.0453 0.2081 294475
a Means and standard deviations for all variables are used in the empirical analyses. The statistics are computed over the period from March 1996 through December 2004.
31
Table 4 Univariate Multiple Regression Coefficient Estimates for the Determinants of Quarterly Changes in C&I Loans Relative to Last Period’s Total Assets a, b
Independent variables Regression (1) Regression ( 2) Regression (3) Regression (4) CARATIO 0.1037 0.1041 0.1042 0.0791 (3.48) *** (3.47) *** (3.47) *** (2.16) ** CILCOFA -0.8336 -0.8569 -0.8603 -0.8124 (-3.65) *** (-3.77) *** (-3.79) *** (-3.55) *** EMPG 0.0046 0.0045 0.0045 0.0103 (0.37) (0.36) (0.36) (0.96) DERIV 0.0023 0.0022 (2.83) *** (2.05) ** SWAPS 0.0012 (1.30) OPTIONS 0.0028 (2.90) *** FUTURES 0.0119 (2.04) ** FORWARDS 0.0021 (1.90) ** OF -0.0201 (-1.68) * OS -0.0011 (-0.62) OW -0.0002 (-0.09) FS 0.0087 (-1.32) FW -0.0020 (-0.26) SW -0.0023 (-0.86) OFS 0.0188 (1.41) OFW 0.0087 (0.43) FSW 0.0082 (0.74) SWO 0.0011 (0.30) OFSW -0.0163 (-0.73) DEALER -0.0081 (-3.54) *** FOREIGN -0.0059 (-3.11) *** LAGGED CILGA 0.0054 (1.41) UNLC 0.0466 (4.07) *** OBSERVATIONS 232096 232096 232096 223881 ADJ R-SQUARE 0.00566 0.00416 0.00424 0.00573
a All regression equations contain time-period indicator variables. T-statistics (reported in parentheses) are calculated using Newey-West heteroscedasticity-and-autocorrelation-consistent errors. Statistical significance is displayed by the use of one (10%), two (5%), or three (1%) stars. The sample contains 36 quarters of observations from 1996 Q1 through 2004 Q4. The dependent variable for all regressions is the quarterly change in C&I loans relative to last period’s total assets. b CARATIO is measured as the ratio of total equity capital to total assets at time t-1. CILCOFA is measured as the ratio of C&I loan charge-offs in period t-1 to total assets in period t-1. EMPG is the state employment growth rate, where EMP equals the total employment in the state in which the bank’s headquarters are located. DERIV, SWAPS, OPTIONS, FORWARDS, and FUTURES are instrumental variables obtained from a probit specification for participation in the indicated derivative markets. OF, OS, OW, FS, FW, SW, OFS, OFW, FSW, SWO, and OFSW are eleven possible interactions between each type of derivative instruments. Among these interaction terms, O stands for option, F stands for futures, S stands for swaps, and W stands for forwards. DEALER is a binary variable, which equals to one if the institution is listed as an IDSA member, or zero otherwise. FOREIGN is a binary variable, which equals to one if the institution is a foreign-owned institution, or zero otherwise. LAGGED CILGA is the first lag of the dependent variable. UNLC is unused lines of credit to total assets.
32
Appendix A: First-stage Estimation of Probability of Derivative Usage a, b
Variable Mean Estimates Standard Error INTERCEPT -5.4338 0.30143 OPPRF -6.6702 3.7844 CARATIO 1.4606 0.2315 LNTOTASST 0.2958 0.0446 LAGDEPENDENT 3.4807 0.1187 OBSERVATIONS 232096 232096 PSEUDO R-SQUARE 0.2227
a The probit specification is estimated for each quarter for 36 quarters from 1996 Q1 through 2004 Q4. The mean estimates and the standard error are the mean and the standard error of 36 coefficient estimates. b The dependent variable for the first-stage regression is the probability of derivative usage. OPPRF is the sample banks’ net interest margin. CARATIO is the sample banks’ capital-to-asset ratio. LNTOTASST is the logarithm of the sample banks’ total assets, and LAGDEPENDENT is the first lag of the dependent variable.

33
Appendix B: Coefficient Estimates on Time Dummy Variable for Each Regression over the Period from March 1996 to December 2004. Independent variables Regression (1) Regression (2) Regression (3) Regression (4) Intercept -0.00521 -0.0054 -0.0054 -0.0055 (-3.95) *** (-1.72) * (-1.73) * (-1.49) D2 (1996Q3) -0.0075 -0.0023 -0.0023 0.0027 (-5.67) *** (-2.73) *** (-2.74) *** (1.91) ** D3 (1996Q4) -0.0048 0.0004 0.0004 0.0016 (-3.60) *** (0.27) (0.28) (3.85) *** D4 (1997Q1) -0.0059 -0.0007 -0.0007 0.0022 (-4.47) *** (-0.87) (-0.87) (4.60) *** D5 (1997Q2) -0.0054 -0.0002 -0.0002 -0.0002 (-4.05) *** (-0.24) (-0.24) (-0.38) D6 (1997Q3) -0.0079 -0.0027 -0.0027 0.0014 (-5.90) *** (-2.84) *** (-2.84) *** (2.99) *** D7 (1997Q4) -0.0063 -0.001 -0.0011 0.0071 (-4.64) *** (-1.24) (-1.26) (1.18) D8 (1998Q1) -0.0004 0.0048 0.0048 0.0013 (-0.27) (0.80) (0.80) (3.15) *** D9 (1998Q2) -0.0064 -0.0012 -0.0012 -0.0006 (-4.72) *** (-1.43) (-1.43) (-1.37) D10 (1998Q3) -0.0084 -0.0032 -0.0032 0.0012 (-6.18) *** (-3.62) *** (-3.63) *** (2.30) ** D11 (1998Q4) -0.0084 -0.0011 -0.0011 0.0013 (-6.18) *** (-1.26) (-1.27) (3.04) *** D12 (1999Q1) -0.0063 -0.001 -0.001 0.0020 (-4.58) *** (-1.13) (-1.13) (2.47) ** D13 (1999Q2) -0.0062 -0.0005 -0.0006 0.0004 (-4.55) *** (-0.51) (-0.55) (0.49) D14 (1999Q3) -0.0051 -0.0021 -0.0021 0.0028 (-1.50) (-1.86) * (-1.86) * (4.25) *** D15 (1999Q4) -0.0067 0.0007 0.0007 0.0057 (-1.94) * (0.70) (0.62) (4.12) *** D16 (2000Q1) -0.0039 0.0033 0.0032 0.0026 (-1.14) (2.07) ** (2.03) ** (6.15) *** D17 (2000Q2) -0.0014 0.0002 0.0003 0.0004 (-0.41) (0.32) (0.33) (0.98) D18 (2000Q3) -0.0049 -0.0014 -0.0014 0.0059 (-3.61) *** (-1.51) (-1.51) (1.54) D19 (2000Q4) -0.0067 0.0035 0.0035 0.0010 (-4.81) *** (0.90) (0.90) (1.50) D20 (2001Q1) -0.0017 -0.0011 -0.0011 0.0016 (-1.25) (-1.06) (-1.04) (2.54) ** D21 (2001Q2) -0.0063 -0.0009 -0.0009 -0.0012 (-4.52) *** (-1.05) (-1.05) (-2.07) ** D22 (2001Q3) -0.0062 -0.0039 -0.0038 -0.0001 (-4.84) *** (-4.07) *** (-4.07) *** (-0.15) D23 (2001Q4) -0.0091 -0.0024 -0.0024 0.0006 (-7.14) *** (-2.29) (-2.29) ** (0.49) D24 (2002Q1) -0.0077 -0.0017 -0.0017 0.0007 (-5.95) *** (-1.14) (-1.13) (1.28) D25 (2002Q2) -0.0069 -0.0019 -0.0019 -0.0014 (-5.35) *** (-2.16) ** (-2.15) ** (-2.37) ** D26 (2002Q3) -0.0072 -0.0040 -0.0040 -0.0002 (-5.59) *** (-4.35) *** (-4.34) *** (-0.04) D27 (2002Q4) -0.0093 -0.0026 -0.0026 0.0003 (-7.18) *** (-2.75) ** (-2.73) **- (0.54) D28 (2003Q1) -0.0079 -0.0022 -0.0022 -0.0007 (-6.07) *** (-2.10) ** (-2.07) ** (-1.35) D29 (2003Q2) -0.0074 -0.0032 -0.0032 -0.0022 (-5.66) *** (-3.57) *** (-3.55) *** (-3.78) *** D30 (2003Q3) -0.0085 -0.0048 -0.0048 0.0001 (-6.53) *** (-5.27) *** (-5.24) *** (0.19) D31 (2003Q4) -0.010 -0.0023 -0.0023 0.0004 (-7.74) *** (-2.47) ** (-2.44) *** (0.55) D32 (2004Q1) -0.0076 -0.0022 -0.0021 0.0002 (-5.78) *** (-2.14) ** (-2.11) *** (0.35) D33 (2004Q2) -0.0074 -0.0022 -0.0022 -0.0008 (-5.60) *** (-2.31) ** (-2.28) *** (-1.48) D34 (2004Q3) -0.0074 -0.0034 -0.0034 0.0001 (-5.64) *** (-3.83) *** (-3.79) *** (0.23) D35 (2004Q4) -0.0086 -0.0024 -0.0024 (0.079) (-6.58) *** (-2.53) ** (-2.49) ** (2.16) **


![Collateral Lending: Are there Alternatives for the Kenyan ...2].pdf · credit derivatives. The utilization of these techniques by banking institutions seems to be largely dependent](https://static.fdocuments.in/doc/165x107/5fb17648eec38b606c4386c9/collateral-lending-are-there-alternatives-for-the-kenyan-2pdf-credit-derivatives.jpg)