Bank Interventions and Options-Based Systemic Risk ... · Social Science Research Network...
32
Board of Governors of the Federal Reserve System International Finance Discussion Papers Number 1117 September 2014 Bank Interventions and Options-based Systemic Risk: Evidence from the Global and Euro-area Crisis Juan M. Londono Mary Tian Board of Governors of the Federal Reserve System NOTE: International Finance Discussion Papers are preliminary materials circulated to stimulate discussion and critical comment. References to International Finance Discussion Papers (other than an acknowledgment that the writer has had access to unpublished material) should be cleared with the author or authors. Recent IFDPs are available on the Web at www.federalreserve.gov/pubs/ifdp/. This paper can be downloaded without charge from Social Science Research Network electronic library at www.ssrn.com.
-
Upload
phungthuan -
Category
Documents
-
view
216 -
download
0
Transcript of Bank Interventions and Options-Based Systemic Risk ... · Social Science Research Network...

Board of Governors of the Federal Reserve System
International Finance Discussion Papers
Number 1117
September 2014
Bank Interventions and Options-based Systemic Risk: Evidence
from the Global and Euro-area Crisis
Juan M. Londono Mary Tian
Board of Governors of the Federal Reserve System
NOTE: International Finance Discussion Papers are preliminary materials circulated tostimulate discussion and critical comment. References to International Finance DiscussionPapers (other than an acknowledgment that the writer has had access to unpublished material)should be cleared with the author or authors. Recent IFDPs are available on the Web atwww.federalreserve.gov/pubs/ifdp/. This paper can be downloaded without charge fromSocial Science Research Network electronic library at www.ssrn.com.

Bank Interventions and Options-based Systemic Risk:Evidence from the Global and Euro-area Crisis ∗
Juan M. Londono† Mary Tian‡
This Version: September 4, 2014
Abstract
Using a novel dataset on central bank interventions to financial institutions, weexamine the impact of capital injection announcements on systemic risk for the bankingsector in the U.S. and the euro area between 2008 and 2013. We propose a new measureof options-based systemic risk called downside correlation risk premium (DCRP), whichquantifies the compensation investors demand for being exposed to the risk of largecorrelated drops in bank stock prices. DCRP is calculated using options that provide ahedge against large drops in the price of a bank index and its individual components. Wefind that, irrespective of their characteristics, intervention announcements significantlyreduce DCRP in the U.S. while for the euro area, interventions were largely unsuccessfulat reducing DCRP.
Keywords: Systemic Risk, Downside Correlation Risk Premium, Bank Interventions,Variance Risk Premium, European Banking Union. JEL Classification: G15, G21,G28, F36
∗The views in this paper are solely the responsibility of the authors and should not be interpretedas reflecting the views of the Board of Governors of the Federal Reserve System or of any other personassociated with the Federal Reserve System. An earlier version of this paper was circulated under the title“Do Agents Believe in Euro-area Bank Interventions? An Options-Based Risk Approach.” We thank conferenceparticipants at the Fed’s System Committee Conference on International Economic Analysis, the IBEFAsummer meeting, the Austrian National Bank’s Transatlantic Conference on Banks, and the IFSID and Bankof Canada Conference on Derivatives. We thank Michael Zdinak for excellent research assistance and MichaelZdinak, Clara Vega, and Juan M. Londono for providing SRisk measures.
†International Finance Division, Federal Reserve Board, Mail Stop 43, Washington DC 20551, USA; [email protected], Phone 202-973-7478.
‡International Finance Division, Federal Reserve Board, Mail Stop 43, Washington DC 20551, USA; [email protected], Phone 202-452-3661.
2

1 Introduction
The global financial crisis of 2008 and the subsequent European debt crisis highlighted theneed to understand the effectiveness of central bank interventions on systemically importantfinancial institutions (SIFIs). Since 2008, central banks worldwide have spent billions oncapital injections into financial institutions, in an attempt to prevent a collapse of the bankingsystem, which would have had disastrous effects for the global economy. In this paper, weinvestigate how effective capital injection announcements are in alleviating how investorsperceive systemic risk for the banking sector. We also explore what makes some interventionsmore or less successful than others at reducing systemic risk, and why the effectiveness ofinterventions differ between the U.S. and the euro area.
Our contribution is twofold. First, we propose a new options-based measure of systemic riskfor the banking sector, called downside correlation risk premium (DCRP), which is based onthe prices of out-of-the-money options on bank indexes and their individual components. Ourmeasure stems from the correlation risk premium literature and quantifies the compensationinvestors demand for being exposed to the risk of large correlated drops in bank stock prices.Specifically, DCRP is computed as the difference in the premium that agents demand forbearing downside variance risk in the bank index versus the average downside variance riskpremium of all individual banks within the index. Thus, DCRP can be interpreted as arisk-neutral measure of common system-wide risk. Moreover, following the intuition in Kelly,Lustig, and Nieuwerburgh (2012), DCRP might also implicitly measure investors’ expectationsof government interventions in the financial sector—an insignificant DCRP indicates thatagents do not demand a premium for being exposed to correlation risk, possibly because theyexpect a government bailout of SIFIs to prevent a system-wide failure.
We calculate our options-based measure of systemic risk, DCRP, for the U.S. and the euroarea for a sample running from 2008 to 2013. DCRP is on average negative and significantin the U.S.. In particular, U.S. DCRP has a large negative magnitude in the fall of 2008,when the bulk of U.S. bank interventions occurred. Given that DCRP is the difference inthe downside variance risk premium of the bank index and the average downside variancerisk premium of individual banks, our results suggest that investors became relatively lessconcerned about the bank index’s downside variance risk than individual banks’ downsidevariance risk, in light of the government interventions. In contrast, the DCRP for euro-areabanks is on average positive and significant over our sample period, suggesting that investorsare still willing to pay a premium to hedge downside systemic risk in the euro-area bankingsystem, despite interventions by euro-area member states.
In our second main contribution, we use a unique dataset on bank intervention announce-ments to document whether and how interventions alleviate DCRP. The database providesdetails on all stand-alone actions and programs announced from September 2008 to December2013 in 29 countries, including the U.S. and individual euro-area countries. We define atime-series dummy variable for government interventions on financial institutions, whichtakes a value of 1 on the days when capital injections were announced and 0 otherwise.In addition, to account for the unexpected component of each intervention announcement,we also construct an intervention surprise measure, which takes a value between 0 and 1depending on the impact of the capital injection announcement on the stock price of thespecific bank being intervened.
For the U.S. and the euro area, we regress DCRP on the interventions dummy or the
1
interventions surprise measure. Our regression results highlight important differences inthe effects of intervention announcements on our options-based measures of systemic riskin the U.S. versus the euro area. Specifically, we find that intervention announcements inthe U.S. have a significant and economically meaningful impact on reducing DCRP betweenthe country’s banks, while intervention announcements in the euro area have an insignificanteffect at reducing DCRP. We find that these results on the effectiveness of interventionannouncements are robust to considering alternative sample periods, controlling for liquidityand the informational content of options, and to different magnitudes of downside risk (degreesof options’ moneyness). We also confirm that our regression results are robust to categoriesof financial sector support measures other than capital injections (deposit insurance, debtguarantees, asset relief measures, and credit market interventions).
Our findings allow us to make interesting comparisons about the effect of bank interventionannouncements, especially as European authorities make substantial progress towards abanking union. Although by the end of 2012, European leaders had already agreed uponthe Single Supervisory Mechanism (SSM) involving the European Central Bank (ECB),which opened the possibility of direct pan-European interventions, interventions on euro-areafinancial institutions were still done by local authorities in the member states. One of themain goals of the proposed banking union is precisely to improve investors’ confidence andminimize the segmentation between interventions on specific euro-area banks and its effectson perceived risk in the euro area as a whole.
In addition to examining the effect of intervention announcements on our measure ofsystemic risk, we also analyze which characteristics make interventions more or less successfulin reducing DCRP. In particular, we investigate the effect on DCRP of interventions thatinvolved banks from multiple countries, multiple banks, banks that were included in stress tests,banks that are in the country/region’s bank index, banks with large market capitalizations,banks that received a large capital injection amount, and banks that have a large SRisk.We find that, irrespective of these characteristics, interventions in the U.S. are successful atalleviating DCRP, while for the euro area, only interventions that involved multiple bankshave a significant effect in reducing DCRP. For the euro area, we also analyze the effect ofcountry-specific interventions on the region’s DCRP. We find that euro-area authorities’ bankinterventions appear segmented to investors. In particular, interventions by each memberstate have an insignificant differential effect on the euro-area DCRP. Moreover, country-specific bank interventions do seem to have an effect on the downside variance risk premiumof individual banks, but this effect is economically meaningful only for banks within theintervening country but not for euro-area banks outside the intervening country.
The rest of the paper is organized as follows. Section 2 describes the related literature.Section 3 describes the data and methodology. Section 4 compares the effects of U.S. and euro-area bank intervention announcements. Section 5 investigates which types of interventionsare more successful in alleviating DCRP. Section 6 concludes.
2 Related Literature
Our paper contributes to three strands of literature. First, our paper contributes to thesystemic risk literature; in particular, to a recent literature that studies the use of financialvariables to measure systemic risk. Second, our paper contributes to the variance and
2

correlation risk premium literature that uses option prices to measure the compensation thatinvestors demand for bearing the risk of extreme individual or system-wide events. Finally,our paper also contributes to the literature on the effect of macroprudential policies; inparticular, government interventions on financial institutions.
The literature on systemic risk measures has proliferated in recent years as macroprudentialpolicies took center stage, especially after the collapse of Lehman Brothers in October 2009(see Brandt and Hartmann, 2000 and Bisias, Flood, Lo, and Valavanis, 2012 for a survey ofsystemic risk measures). More recently, several papers have proposed measures of systemicrisk based on financial variables, which have the advantage of being publicly available andat a higher frequency than more traditional balance-sheet data. The CoVaR of Adrian andBrunnermeier (2011) is a measure of the contribution of an individual institution to theoverall systemic risk calculated using individual and market stock returns. Acharya, Pedersen,Philippon, and Richardson (2010) propose a static framework to measure an institution’sexpected capital shortfall conditioned on a substantial market decline. Brownless and Engle(2012) build on this framework and propose a method to calculate time-varying expectedcapital shortfall that can be used as a measure of ex-ante systemic risk. The measure inBrownless and Engle (2012) can be aggregated to obtain a measure of overall systemic risk,which they show is a good predictor for recessions. Huang, Zhou, and Zhu (2009, 2012)also propose an aggregate measure of systemic risk calculated using individual institutions’probabilities of defaults derived from CDS and equity return correlations across financialinstitutions. We propose an aggregate measure of systemic risk in the banking system,calculated using options that provide a hedge against large drops in the price of a bankindex and of individual institutions. Thus, as the measure in Huang et al. (2009, 2012), ourmeasure involves investors’ attitudes toward risk and is therefore a risk-neutral measure.
Our measure of systemic risk stems from the variance risk premium and correlation riskpremium literature, and quantifies the compensation investors demand for being exposed tothe risk of large correlated drops in bank stock prices. Bakshi and Madan (2006) link thevariance risk premium to the desire of risk-averse agents to buy protection against extremeevents. Bekaert and Engstrom (2009), Todorov (2010), and Gabaix (2012) also rely on theinterplay between risk aversion and extreme events to explain the variance risk premium.There is extensive evidence that the variance risk of headline indexes is priced in stock markets(see, for instance, Britten-Jones and Neuberger, 2000; Jiang and Tian, 2005; Bakshi andMadan, 2006; Carr and Wu, 2009; Bollerslev, Gibson, and Zhou, 2011; Bollerslev, Tauchen,and Zhou, 2009; Londono, 2011; and Bollerslev et al., 2011). However, Bakshi and Kapadia(2003) establish that the stock-specific variance risk premium is insignificant, or at least muchsmaller than the index’s variance risk premium. In other words, in order to hedge correlationrisk, agents are willing to pay more for index options than for individual stock options. Duanand Wei (2009) establish a significant link between the price structure of individual stockoptions and the amount of systematic risk in the underlying assets. Schurhoff and Ziegler(2011) decompose total variance risk into systematic and idiosyncratic components, andconclude that both components command sizeable premiums and significantly affect optionreturns.
Driessen, Maenhout, and Vilkov (2009) use U.S. index and stock options prices todecompose the variance risk premium into idiosyncratic variance risk and correlation riskpremium. They find that most of the documented variance risk premium of the U.S. index isdue to correlation risk premium. Kelly et al. (2012) examine the price difference between
3

index and individual options but focus on tail risk—the risk of extreme drops in stock prices—for particular sectors. They find that the price difference between index and individualoptions is significant for most sectors, in line with the correlation risk premium evidencein Driessen et al. (2009). However, they find that, for the financial sector, index optionsthat provide a hedge against downside risk are relatively cheaper than a basket of individualoptions with similar characteristics, which they interpret as evidence of a too-systemic-to-failgovernment bailout guarantee.
Although of a similar nature, the options-based risk measures in Driessen et al. (2009) andKelly et al. (2012) differ in several important aspects. First, while the former is interested inmeasuring the correlation risk premium, that is, the difference between options-implied andexpected correlation, the latter is mainly focused on the cost of insurance against commonnegative events, that is, the price difference between index options and individual options.Second, the measure in Kelly et al. (2012) gives more relevance to the downside risk bycomparing only the prices of options that provide a hedge against large drops in the indexor in individual stock prices. The measures in these two papers also consider differenttime-horizons. While Driessen et al. (2009) consider one-month ahead options, Kelly et al.(2012)’s benchmark measure considers one-year ahead options.
In our contribution to the correlation risk premium literature, we propose a measureof systemic risk that alters the correlation risk premium measure in Driessen et al. (2009),focusing on options that provide a hedge against downside risk, in line with the cost-of-insurance measure in Kelly et al. (2012). In particular, our measure of DCRP uses prices ofput options with 80 percent degree of moneyness, which provide a hedge against price dropsof 20 percent or more in the next month, to calculate the options-implied downside variancefor a bank index and for its individual components.
We investigate the effect of interventions on financial institutions on our DCRP measure,and highlight the differential effect of interventions on financial institutions in the U.S. andthe euro area. Thus, we also contribute to a more general literature on the effect of centralbank interventions. Beck, Coyle, Dewatripont, Freixas, and Seabright (2010) provide asummary of the broad goals of interventions. Laeven and Valencia (2010), Calderon andKalus (2012), and Brei, Gambacorta, and von Peter (2011) among others, examine the positiveand negative effects of bank interventions. Goodhart and Schoenmaker (2006) investigatean additional dimension for macroprudential policy in Europe, namely the cross-borderexternalities from bank failures. Posen and Veron (2009) and more recently Schoenmaker(2012) examine the lessons learned from the global and European crises for a banking union,including a single mechanism for the resolution of problems that allows for pan-Europeaninterventions. Interestingly, Schoenmaker (2012) includes examples of less successful cross-border interventions in the absence of an official banking union framework and how theseinterventions raised questions about how SIFIs should be handled in the euro area. Our paperis the first to show that interventions by euro-area member authorities are not successful inreducing systemic risk to the eyes of investors, except for those that involved several banks.In other words, we show that, even following interventions, agents are willing to pay to hedgethe risk of correlated extreme drops in euro-area banks’ equity prices.
4

3 Data and Methodology
In the first part of this section, we introduce our measure of systemic risk, called downsidecorrelation risk premium (DCRP). In the second part, we describe our novel dataset of U.S.and euro-area bank intervention announcements.
3.1 The Downside Correlation Risk Premium
Our measure of DCRP relies on the intuition that the variance of an index can be expressedas a function of the average variance of its components plus a combination of pairwisecorrelations. Following this relation, the variance risk premium of an index can be expressedas a combination of the average variance risk premium of its components plus a correlationrisk premium component. More specifically, the variance risk premium of the bank index isdefined as
V RP indext = EQ
t (σ2r,t+1)− EP
t (σ2r,t+1). (1)
That is, it is the difference between the risk neutral (Q) and the physical (P ) time-t expectationof the index’s return variation, σ2
r,t+1, between dates t and t+ 1 months. Following Driessenet al. (2009), equation (1) can be decomposed into
V RP indext =
∑i
liV RPit +
∑i
∑j 6=i
ωiωj[EQt (ρrt+1
irt+1j)− EP
t (ρr,t+1ir,t+1j)], (2)
where V RP it is the variance risk premium of the i-th component of the index, ρrt+1
irt+1j
is the correlation between the return of stock i and that of stock j over the period t tot + 1 months, and li = (ωi)2 +
∑j 6=i ω
iωjσrjσriρrirj is the relative-volatility weight on each
component’s variance risk premium, assuming constant weights.∑
i
∑j 6=i ω
iωj [EQt (ρrit+1r
jt+1
)−EPt (ρrit+1r
jt+1
)] is a collection of the correlation risk premiums between all individual components
in the index, which we denote as CRP indext . Thus, equation (2) can be rewritten as
CRP indext = V RP index
t −∑
i∈index
liV RPit . (3)
The variance risk premium of the index can be interpreted as a measure of both idiosyncraticand systemic risk. Then, the correlation risk premium is the extra variance risk premium inthe index that is not accounted for by its individual components, hence a risk-neutral measureof common system-wide risk. Our measure of downside correlation risk premium, DCRP, isconstructed following equation (3), except it is calculated using 80 percent out-of-the-money(OTM) option prices, which provide a hedge against price drops of 20 percent or more.
We construct DCRP using the U.S. and euro-area benchmark bank indexes from Bloomberg(KBW and Eurostoxx, respectively) for a sample running from 2008 to 2013 at a dailyfrequency. For the duration of our sample, the Eurostoxx banks index includes banks forthe following euro-area countries: Austria, Belgium, France, Germany, Greece, Italy, Ireland,the Netherlands, and Spain. Both indexes are calculated as a weighted average of the priceof major publicly-traded banks’ stocks, and should serve therefore as a benchmark of the
5

banking sector. Specifically, the KBW (Keefe, Bruyette & Woods) index aggregates theprice of the most relevant U.S. banks (approximately 24 institutions) weighted according tofree-float market capitalization. The relevance of a bank is determined by KBW accordingto several criteria, including trading volume and market capitalization.1 The Eurostoxxbanks index aggregates the price of the largest banks in the euro area (approximately 28institutions), which are also weighted according to free-float market capitalization.2
To obtain our measure of DCRP, we calculate the variance risk premium components inequation (3) using equation (1). Specifically, to calculate the downside variance risk premiumof each bank index as well as its components, we approximate the expectation of the returnvariation under the risk-neutral measure, EQ
t (σ2r,t), as the square of the implied-volatility
of OTM put options. In particular, we use options with a fixed degree of moneyness of80 percent for the index and its individual components. In section 4.4, we investigate therobustness of our results using options with a degree of moneyness of 90 percent, whichprovide a hedge against a 10 percent or larger drop in the index’s price. The options-impliedvolatility for the indexes and their components are obtained from Bloomberg. To reducethe potential adverse effect of outliers, especially for bank-specific options, we winsorize alloptions-implied volatilities at the 1 percent level.
We approximate the expectation of the bank index’s return variation under the physicalmeasure, EP
t (σ2r,t), using a forecast of the one-month ahead realized variance, conditional on
the one-month-lagged index’s implied-variance and the one-month-lagged realized varianceitself. As is standard in the literature, we calculate the one-month realized variance as thesum of the square of daily stock returns for the last 22 days. Daily stock prices for the indexesand their components are also obtained from Bloomberg. More sophisticated approaches forcalculating the realized volatility include high-frequency return-based measures of realizedvariance (Bollerslev, Tauchen, and Zhou, 2009). To avoid any look-ahead bias caused byusing the full sample, we use only the information available at each point in time to calculatethe expectation of the realized variance under the physical measure.
To calculate the physical expectation of the return variation for each individual bankwithin the index, we use each bank-specific implied variance, the lagged realized variance ofthe bank’s stock return, and the options-implied variance of the bank index. We find thatadding the options-implied variance of the bank index improves the forecast of all banks’one-month ahead realized variance considerably, compared to a model that includes eithereach bank’s realized variance or both its realized and options-implied variance. For euro-area(U.S.) banks, the average adjusted R-squared when we forecast the one-month-ahead realizedvariance using only the realized variance is 0.45 (0.48). When we include each bank’s options-implied variance, the average adjusted R-squared increases to 0.46 (0.60), and when we addthe bank index’s implied variance, it increases to 0.50 (0.62).
To calculate li, the relative-volatility weights in equation (3), we obtain estimates ofthe variance-covariance matrices of all banks within the bank indexes (and, implicitly, thecorrelations between them) as well as their relative market capitalizations, ωi. We estimate
1The rules for inclusion of a bank in the KBW index can be found at www.kbw.com/content/equities-PDFs/IndexRules.pdf.
2The current components of the KBW index can be found at www.kbw.com/content/research-reports/BKX.pdf, and those of the Eurostoxx banks index can be found atwww.stoxx.com/download/indexes/factsheets/estxsupersectorsfs.pdf.
6

daily variance-covariance matrices using one-month (22-days) rolling windows of all banks’stock returns, and assume that their relative weights, calculated using each bank’s marketcapitalization relative to the total market capitalization of the index, remain constantthroughout this window. At each point in time, we use the one-day-lagged relative-volatilityweights to obtain the weighted average downside variance risk premium,
∑i∈index liV RP
it .
3.2 Bank Interventions
To examine the effect of central bank interventions on our options-based measure of risk, weuse a unique dataset on bank intervention announcements. This dataset builds upon the“Financial Sector Rescue Plan” database maintained by the Bank of International Settlements(BIS). The BIS database was initiated in October 2008 under the auspices of the Committeeon the Global Financial System (CGFS) and covers the following five main categories offinancial sector support measures: capital injections (emergency loans, does not includeimmediate outright nationalization); deposit insurance; debt guarantees; asset relief measures(purchase or guarantee of risky non-performing bank assets); and credit market interventions.The BIS database includes all stand-alone actions and programs announced from September2008 to December 2011 in 29 countries, including the U.S. and individual euro-area countries.Our dataset corrects the BIS database using Factiva and other news sources to make surethat the date of each intervention corresponds to the first time it was announced. Sincethe BIS database ends in 2011, we also extend the database to the end of 2013. In section4.4, we perform robustness tests on the subsample period of the original BIS database from2008-2011.
Using the intervention announcements database, we define a time-series dummy variablefor government interventions on financial institutions for the U.S. and euro area separately.This variable takes the value of 1 on the days when new capital injections were announced and0 otherwise. Since our measures of downside variance and correlation risk premiums are onlydefined over trading days, we match interventions that take place on a non-trading day to thenext trading day. While the BIS database covers five categories of central bank interventions,we focus our analysis on capital injections, as they were at the core of most rescue packagesand were critical for banks to withstand market pressures during the financial crisis (see, forinstance, Brei et al., 2011). Other types of support either did not address solvency problems,such as deposit insurance and debt guarantees, or were deployed at very few institutions,such as asset purchases and insurance. Overall, our dataset contains 46 capital injectionannouncements in the U.S. and 106 announcements across individual euro-area countriesfrom 2008-2013.
Our interventions dummy variable implicitly assumes that each intervention announcementwas entirely received by the market as a surprise, which may not always be the case. Toaccount for the unexpected component of each intervention announcement, we also constructan intervention surprise measure. This measure takes a value between 0 and 1 depending onthe impact of the intervention announcement on the stock price of the specific bank beingintervened. Specifically, the surprise measure is calculated as 1 minus the p-value that resultsfrom comparing the return of the bank stock in the day following the announcement with anormal distribution of daily returns for the full sample. If stocks of an intervened bank arenot publicly traded, the intervention surprise measure is calculated based on the impact ofthe intervention announcement on the price of the bank index of the country where the bank
7

is domiciled. If all intervention announcements had sizeable effects on the intervened banks’stock prices, the intervention surprise measure would converge to our interventions dummyvariable.
In addition to examining the effect of intervention announcements on our measure ofsystemic risk, we also analyze which characteristics make certain interventions more orless successful in reducing DCRP. To do so, we construct the following seven conditionalintervention dummy variables for the U.S. and the euro area:
1. Multiple country (defined for euro area only): equals 1 on days when capital injectionswere announced in more than one country in the euro area. The capital injections donot necessarily need to be part of the same general program.
2. Multiple bank: equals 1 on days where capital injections were announced for more thanone bank (may or may not be in the same country).
3. Involved in stress test: equals 1 on days where capital injections were announced forbanks that were involved in stress tests. For the U.S., we use the list of banks that wereinvolved in Comprehensive Capital Analysis and Review (CCAR) 2012.3 For the euroarea, we use the list of banks that were involved in the European Banking Authority’s(EBA) 2011 EU-wide stress tests.4
4. In banks index: equals 1 on days where capital injections were announced for banksthat are in the KBW index for the U.S. and in the Eurostoxx banks index for the euroarea.
5. Large bank: equals 1 on days where capital injections were announced for a bank withlarge market capitalization. A large bank is defined as having, on the day before theannouncement, a market capitalization above the median value across all intervenedbanks in our sample. Data on market capitalization is from Bloomberg.
6. Large injection: equals 1 on days where a large capital injection for a bank wasannounced. A large capital injection is defined as having a ratio of injection size to banktotal assets (on the day before the announcement) that is above the median value acrossall intervened banks in our sample. Data on injection size is from our interventionsdatabase and data on total assets is from Bloomberg.
7. Large SRisk: equals 1 on days where capital injections were announced for a bankwith a large SRisk value. A large SRisk is defined as having, on the day before theannouncement, a value above the median value across all intervened banks in oursample. SRisk is a measure of systemic risk proposed by Brownless and Engle (2012),which depends on each bank’s leverage, size, and Marginal Expected Shortfall (MES).MES is calculated as the expected loss in the total value of a firm in the event of asubstantial decline in the market, which is approximated by the S&P 500.
3See http://www.federalreserve.gov/newsevents/press/bcreg/bcreg20120313a1.pdf.
4See http://www.eba.europa.eu/risk-analysis-and-data/eu-wide-stress-testing/2011/results.
8

Finally, to disentangle the effect of bank interventions from the effect of other macroe-conomic announcements that might have an impact on our options-based risk measures,we control for the surprise in macroeconomic news announcements in the U.S. and Europe.We use daily data on real-time activity indexes from Scotti (2013). The surprise indexesin Scotti (2013) are constructed as the weighted average of the surprises from the set ofmacroeconomic releases in Aruoba, Diebold, and Scotti (2009). These macroeconomic releasesinclude industrial production, employment, real retail sales, personal income, manufacturingPMI, the slope of the yield curve, and stock market returns.
4 Effect of Bank Interventions on Options-based Risk
Measures
In this section, we examine the differences between the DCRP in the U.S. and the euro area,and investigate the effect of government intervention announcements on our options-basedrisk measures.
4.1 DCRP in the U.S. and the Euro Area
Figure 1 displays our measure of DCRP for the U.S. and euro-area bank indexes. Table 1reports the summary statistics for the DCRP and its components (see equation (3)). Figure2 plots the two components of DCRP: the bank index’s downside variance risk premium andthe relative-volatility-weighted average of the downside variance risk premium of all bankswithin the index.
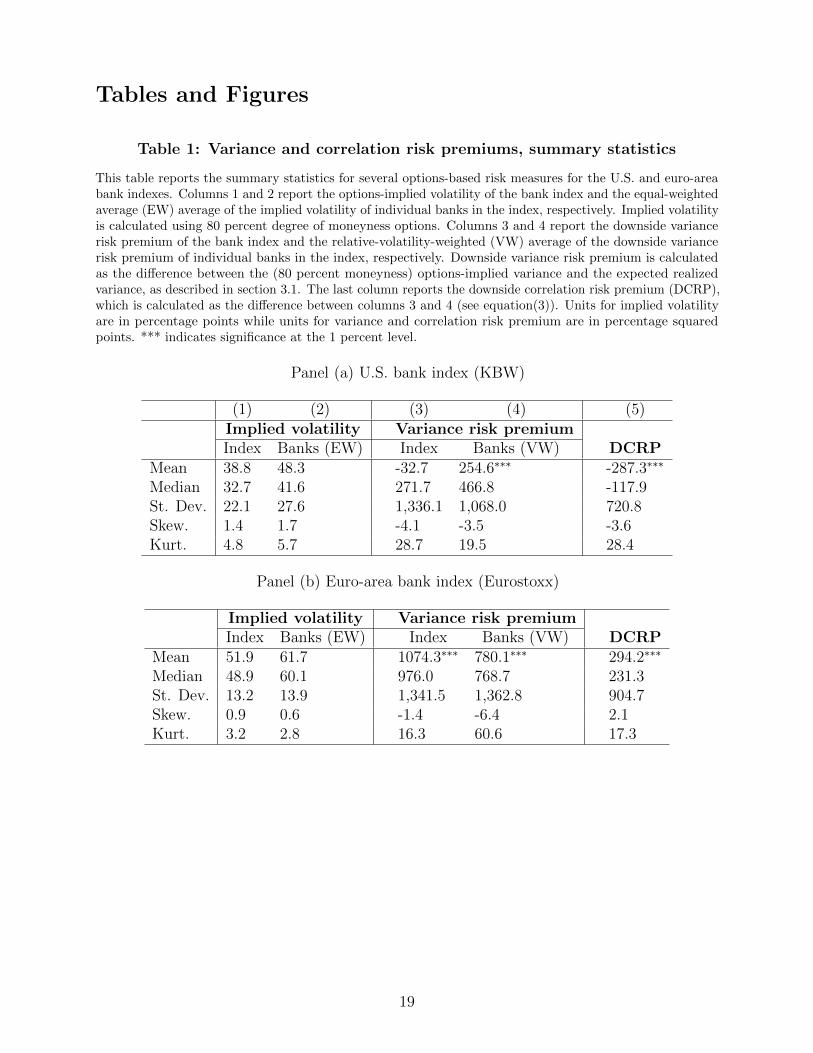
Individual options for banks in the U.S. KBW index are on average more expensive thanindex options. In particular, as shown in Table 1, the implied volatility of individual banks’OTM options is higher than that of the index options (48 percent versus 39 percent). Inaddition, the relative-volatility-weighted average of the downside variance risk premiums ofthe index’s individual components is significantly higher than the downside variance riskpremium of the bank index (255 versus -33). This difference holds irrespective of the weightsassigned to individual banks’ variance risk premiums in equation (3). As a consequence,the DCRP for U.S. banks is on average negative and significant. In fact, the U.S. DCRP isparticularly negative around the Lehman Brothers episode (Figure 1), where the largest U.S.bank interventions take place in our sample. This evidence might appear counterintuitive, asagents should demand a positive compensation for their exposure to time-varying correlationrisk among the banks in the index. However, the average negative premium and the negativeDCRP peak around the Lehman Brothers episode is in line with the evidence in Kelly et al.(2012). They show that around the 2008 U.S. bank interventions, the cost of insurance againstextreme events for individual banks increased in comparison to the cost of insurance for theU.S. bank index.
The difference between the cost of insurance of the index and its components suggeststhat agents believe a simultaneous drop in the price of all bank stocks is less likely to occur,as authorities demonstrate they are willing to prevent a collapse of the banking system byintervening in systemically important banks. Similarly, we observe in panel (a) of Figure 2that after the bulk of the 2008 bank interventions, the downside variance risk premium of boththe bank index and individual banks dropped significantly, but dropped less for individual
9

banks; that is, the OTM options-implied volatility is lower than expected realized volatility.This pattern is consistent with the view that agents became less concerned about overallvolatility risk in light of the government interventions, but relatively less concerned aboutthe bank index’s downside variance risk than about individual banks’ downside variance risk.
In contrast to the evidence for the U.S., as shown in panel (b) of Table 1, the downsidevariance risk premium of the euro-area bank index is on average larger than the relative-volatility-weighted average of the downside variance risk premiums of its individual compo-nents (1074 versus 780). Thus, the DCRP for euro-area banks—the extra downside variancerisk premium in the bank index that is not accounted for by its individual components—ison average positive (294) and significant at the 1 percent level. This evidence suggests thatagents are willing to pay a premium to hedge downside systemic risk in the euro-area bankingsystem.
The euro-area DCRP is particularly large in the second half of 2011, at the peak of theEuropean debt crisis. As can be seen in panel (b) of Figure 2, during this period the downsidevariance risk premium of the euro-area bank index increases much more than the averagedownside variance risk premium of the index components. In fact, most of the spikes inDCRP are closely linked to crisis-related news, especially in the last quarter of 2011. BetweenSeptember and December of 2011, concerns about economic growth in the euro area added toconcerns about Greece’s inability to meet its budget cut targets and the country’s increasingneeds of bailout loans. Other episodes of the European debt crisis had an impact on theDCRP, such as Spain’s intentions to seek financial support for the country’s banks betweenJune and August 2012. However, not all DCRP spikes are closely related to news and mightbe affected by other factors, such as option pricing errors. In an event study around DCRPspikes to disentangle news-related spikes from outliers, we find that a 1 percent winsorizationprovides a good balance between excluding most of the outliers without excluding importantnews-related episodes of high DCRP.
Interestingly, the DCRP for U.S. banks often increases around news in the euro area thatdeteriorated overall risk sentiment. For instance, the U.S. DCRP spiked on November 2010as markets grew concerned about Ireland’s banking sector. Also, by the end of September2011, stock markets worldwide fell significantly in reaction to weaker-than-expected euro-areaeconomic data. Concerns about the crisis in Europe increased again at the beginning ofOctober 2011 as European finance ministers began discussing plans to recapitalize the region’sfinancial institutions.
4.2 Options-based Systemic Risk
Our preliminary evidence suggests that while euro-area DCRP is closely related to episodesof high economic uncertainty, U.S. DCRP appears at times to be a counterintuitive measureof systemic risk. In particular, U.S. DCRP is largely negative around the global financialcrisis, when although economic uncertainty was large, several bank interventions seem tohave had a considerable impact on systemic risk to the eyes of investors.
A desired characteristic of systemic risk measures is for them to be useful predictors ofdistress in the economy. To formally investigate the relation between DCRP and economicdistress, we follow Brownless and Engle (2012) and model the vector autoregression (VAR)
10

process
yt =
p∑l=1
Ajyt−l + εt, (4)
where
yt =
%∆(DCRPt)∆log(INDPRDt)∆log(URATEt)
(5)
is a vector consisting of the monthly growth rates of DCRP, industrial production, andunemployment rate. Since DCRP can be negative, instead of taking the log change, wecompute the percent change in month t as 100 ∗ (DCRPt−DCRPt−1)
|DCRPt−1| . As in Brownless and Engle
(2012), we assume that the order of the VAR process is one as increasing the number of lagsdoes not change the significance but comes at the cost of an increasing number of parameters.
Table 2 shows the level and significance of the coefficients in equation (4). U.S. DCRPis not caused by either INDPRD or URATE. Thus, DCRP is not merely picking up realeconomy effects. At the same time, U.S. DCRP does not Granger cause the real variables.This is consistent with our view that DCRP is not necessarily a direct measure of systemicrisk but rather a risk-neutral measure of systemic risk. And, as we documented in section4.1, agents in the U.S. appear to be less concerned about a simultaneous drop in the price ofall bank stocks, as authorities demonstrated that they are willing to prevent a collapse of thebanking system by intervening in SIFIs.
For the euro area, DCRP is also not caused by either INDPRD or URATE. But, incontrast to the results for the U.S., euro-area DCRP Granger causes euro-area INDPRD. Theeconomic magnitude of the causality between DCRP and INDPRD is considerable—a onestandard deviation increase in euro-area DCRP decreases the region’s industrial productionby 12 basis points in the next month and is significant at the 5 percent level. While DCRPdoes not directly Granger cause URATE, INDPRD does Granger cause it. This indicatesthat DCRP will indirectly impact unemployment rate via its effect on industrial production.
In the remainder of this section, we provide an explanation for the differences in thedynamics and informational content between U.S. and euro-area DCRP. In particular, weshow that bank intervention announcements in the U.S. have a significant and economicallymeaningful effect in reducing the DCRP, while interventions by euro-area authorities seemto have been unsuccessful in reducing DCRP. In the following section, we also show thatinterventions by U.S. authorities are successful, irrespective of their characteristics, while forthe euro area, only interventions that involved multiple banks have a significant effect atreducing the DCRP.
4.3 Effect of Bank Intervention Announcements
The empirical framework we use to examine the effect of the announcement of governmentinterventions on our banks’ options-based risk premium measures is
rpi,t+h = ci,hDi,t + si,hSurpi,t + εt,h, (6)
11

where rpi,t+h is one of the following h-days ahead options-based risk measures for coun-try/region i: (a) the DCRP of the bank index, (b) the downside variance risk premium ofthe bank index, and (c) the relative-volatility-weighted average of downside variance riskpremiums of individual banks in the index. Dummy Di,t is equal to 1 if there is a capitalinjection intervention announcement in country i at time t and Surpi,t is Scotti (2013)’smacroeconomic surprise index.
Figure 3 reports the U.S. regression results for equation (6) for h = 1 to 30 days after acapital injection announcement. Panel (a) reports the coefficient of government interventionannouncements on the DCRP and panels (b) and (c) report the effect on the downsidevariance risk premium of the index and on the average downside variance risk premiums of allindividual banks within the index, respectively. The results suggest that bank interventionsin the U.S. have a significant effect on downside correlation risk to the eyes of investors.Specifically, announcements of government interventions in the U.S. reduce banks’ DCRP byapproximately 950 squared percentage points one day after the injection announcement, andthis effect remains significant for nearly all 30 days in our horizon window. As pointed outabove, the significance of government interventions might explain the highly negative DCRParound the Lehman Brothers episode in Figure 1. The results in panels (b) and (c) showthat intervention announcements are also significant at reducing both components of DCRP,where announcements have a larger impact on the U.S. bank index’s downside variance riskpremium, a measure of aggregate risk, than on the average downside variance risk premiumof its components, a measure of bank-specific risk.
Our results for the euro area in Figure 4 stand in sharp contrast to those for theU.S. Notably, announcements of bank interventions by euro-area authorities do not havea significant effect on the DCRP among euro-area banks. The insignificant effect of theseinterventions might explain the average positive DCRP among euro-area banks, particularlyduring the latter half of 2011, as seen in Figure 1. The results in panels (b) and (c) of Figure4 help us understand the lack of significance of bank interventions on the euro-area DCRP.In particular, intervention announcements in the euro area do significantly reduce both theindex’s downside variance risk premium and the average downside variance risk premiumsof its components, but the effect is similar in magnitude across these two components. Inaddition, we note that the impact of intervention announcements on the index’s downsidevariance risk premium is only about half the magnitude in the euro area as it is in the U.S.
Until now, we have assumed in our regressions that announcements of capital injectionshave similar characteristics and are a complete surprise to the market, with all of the changesin DCRP being attributed to our dummy variable on intervention announcements (aftercontrolling for macroeconomic surprises). Given that certain intervention announcementsmay have come as more of a surprise than others, we construct an alternative to our dummyvariable, Pi,t, which takes a value between 0 and 1 for an announcement in country i at timet. Pi,t, our p-value intervention variable, represents the likelihood that the capital injectionannouncement was a surprise to the market. Construction of Pi,t is described in section 3.2.Our new regression framework is then
rpi,t+h = ci,hPi,t + si,hSurpi,t + εt,h. (7)
As shown in Figure 5, accounting for the surprise component of intervention announcementsdoes not alter our primary findings for the U.S. and the euro area, in Figures 3 and 4,
12

respectively. In particular, capital injection surprises still reduce U.S. banks’ DCRP (panel(a)). Interestingly, the estimated effect of intervention surprises by U.S. authorities isconsiderably larger than the effect of the intervention dummy (1600 versus 950 squaredpercentage points) and is significant for all 30 days in our horizon window. For the euro area,accounting for capital injection surprises still does not significantly reduce euro-area banks’DCRP (panel (b)).
In sum, our results show that agents do demand a significant premium to hedge downsidecorrelation risk among banks in the euro area. Our results also show that interventions byeuro-area authorities do not significantly reduce this DCRP, as these interventions do nothave a sufficiently large differential effect on the downside variance risk premium of the indexand its components. The results for the euro area stand in sharp contrast to those for theU.S., where the DCRP is on average negative, and interventions do have a significant andeconomically meaningful alleviating effect.
4.4 Robustness Tests
In this section, we show that our benchmark results in section 4.3 are robust to the sampleperiod considered, liquidity and informational-content concerns of options, and to differentmagnitudes of downside events (degrees of options moneyness considered). In unreportedresults, we also confirm that our results are robust to considering all five categories ofcentral bank interventions: capital injections, deposit insurance, debt guarantees, asset reliefmeasures, and credit market interventions.
Our full sample period runs from 2008 to 2013. Because the original BIS database endsin 2011 and because most bank intervention announcements occurred by the end of 2011, werepeat the regression in equation (6) for the 2008-2011 subsample period. The results areconsistent with those for our full sample period. Specifically, intervention announcementsin the U.S. significantly reduce our options-based measure of systemic risk for nearly all 30days after the announcement (Figure 6 panel (a)), while announcements in the euro area areineffective at alleviating DCRP (Figure 7 panel (a)).
We also address two common concerns when dealing with options, especially at thefirm-level: their liquidity and informational content. As a robustness test, we only includethe 10 largest banks in each bank index in calculating our options-based risk measures, aslarge banks are less likely to be subject to these concerns. As of December 2013, the 10largest banks account for 86 and 76 percent of the total market capitalization of all banks inthe U.S. KBW and the euro-area Eurostoxx bank index, respectively. Results in panel (b) ofFigure 6 show that bank intervention announcements still have a significant alleviating effecton the DCRP of the largest U.S. banks. Panel (b) of Figure 7 presents the correspondingresults for the largest euro-area banks. Consistent with our benchmark results in Figure 4,intervention announcements in the euro area do not significantly reduce DCRP.
Finally, we test whether our results hold for alternative magnitudes of downside riskevents. Our benchmark measure of DCRP is calculated based on options with 80 percentdegree of moneyness. Because these options provide a hedge against downside risk, DCRPmeasures the compensation agents demand for price drops of 20 percent or more in the bankindex as well as in the individual banks in the index. We acknowledge, however, that a pricedrop of 20 percent for the index might be a much more drastic event than a price drop ofthe same magnitude for an individual bank. Thus, we examine whether our results still hold
13
under a scenario where the hedge in the price drop for the bank index is less than the hedgein the price drop for its components. In particular, panel (c) in Figures 6 and 7 show thecoefficients associated with our dummy intervention variable, where DCRP is calculatedusing options prices with 90 percent degree of moneyness for the bank index (thus a hedgeagainst price drops of 10 percent or more) and 80 percent degree of moneyness for individualbanks in the index. For the U.S., intervention announcements still reduce DCRP, althoughthe magnitude and significance are much higher than for our benchmark results. The resultsfor the euro area still indicate that intervention announcements do not alleviate DCRP; infact, the coefficient is weakly positive for some horizons.
5 Characteristics of Bank Interventions
Our results so far suggest that there are significant differences between the results for theU.S. and those for the euro area. In particular, we find that intervention announcements inthe U.S. are successful in reducing the DCRP to the point that this risk-neutral measureof systemic risk is on average negative, especially around the Lehman Brothers’ episode.However, interventions by euro-area authorities do not have a significant effect on the region’sDCRP. As a result, the euro-area DCRP is, on average, positive and displays considerablespikes, especially around the peak of the European debt crisis. In this section, we extendour investigation to understand the characteristics of successful interventions. In the firstpart of the section, we use the conditional intervention dummies described in section 3.2 tounderstand which intervention characteristics are more effective at alleviating DCRP. In thesecond part, we center the attention on the euro area, and explore the effect of country-specificinterventions.
5.1 Characteristics of Successful Interventions
To examine the effect of intervention announcements with particular charateristics on theDCRP, we propose two regression frameworks. The first framework is the following univariate(with control variables) regression setup:
DCRPi,t+h = βc,i,hDci,t + si,hSurpi,t + εt,h, (8)
where Dci,t is one of the seven conditional intervention dummies defined in section 3.2 and
only takes a value conditional on days when capital injections are announced. The secondframework is a multivariate (with control variables) regression setup that allows us to isolatethe additional effect of each type of intervention announcement,
DCRPi,t+h = β∗c,i,hDci,t + β∗int,i,hDi,t + si,hSurpi,t + εt,h, (9)
where Di,t is the intervention dummy used for the benchmark results in section 4.3.Table 3 reports the estimated effect, βc, and the additional effect, β∗c , of intervention
announcements with particular characteristics. Our results for the U.S. show that interven-tion announcements have a negative and significant effect on the DCRP across all sevencharacteristics we condition on (βc). However, the magnitude of the estimated effect is much
larger for interventions that involved more than one bank (β̂c = −1747), interventions to
14

banks involved in the Federal Reserve’s stress test (β̂c = −1680), and interventions to banks
in the U.S. KBW bank index (β̂c = −1339). In fact, the results show that interventions tobanks involved in the stress test or to one of the banks in the bank index have an additionalrelieving effect on the DCRP across U.S. banks—β∗c is negative and significant. Surprisingly,there is a disconnect between the definition of SIFIs according to the stress test and thataccording to SRisk, as interventions to banks with relatively large SRisk do not have asignificant additional alleviating effect—β∗c is insignificant.
In contrast, the results for the euro area suggest that only interventions that involvedmultiple banks are somewhat successful in alleviating the DCRP (β̂c = −558 and significantat the 10 percent confidence level). All other types of interventions have an insignificanteffect (and additional effect) on the DCRP.
5.2 Country-specific Bank Interventions in the Euro Area
To shed further light on our empirical results for the euro area, we examine the differentialeffects of country-specific bank interventions. Our results allow us to identify particularcountries within the euro area whose capital injection announcements have a greater effect onreducing the region’s DCRP. Furthermore, decomposing the euro-area intervention dummyinto country-specific dummies allows us to disentangle country-specific effects, as multipleannouncements for different countries often occur on the same day.
The regression framework to examine the joint effect of country-specific bank interventionson the DCRP in the euro area is
DCRP eurot+h =
∑i
ci,hDi,t + seuro,hSurpeuro,t + εt,h, (10)
where we decompose the euro-area capital injection dummy in equation (6) into 8 coun-tries/regions: Belgium, France, Germany, Greece, Italy, Netherlands, Spain, and the rest ofthe euro area.
Figure 8 plots the estimated coefficients, ci,h, for h = 1 to 30 days after a capital injectionannouncement. Our results suggest that, in general, interventions by euro-area membercountries do not have an economically meaningful effect on the DCRP. French interventions(panel (b)) are weakly significant in reducing the euro-area DCRP up to 4 days after anintervention. Italian and Dutch bank interventions are only significant 13 and 5 days after anintervention, and the effect is short-lived (panels (e) and (f)). For the remaining countries, theresults indicate that country-specific interventions do not reduce DCRP for euro-area banks,in line with our results in Figure 4. We also note that the coefficients from regressing on eachcountry-specific intervention dummy separately are essentially the same as the coefficientsfrom the joint regression with all country
In unreported results, we find that, for most countries, bank interventions do seem tohave an effect on the average downside variance risk premium of individual banks, but thiseffect is economically meaningful only for banks within the country intervening. The disparitybetween results for local and foreign average downside variance risk premiums suggests thatinvestors believe there are cross-border differences in banks’ interventions across the euroarea. These results serve as preliminary evidence that agents do not perceive the euro areaas having a unified banking system.
15

In sum, our results suggest that interventions by U.S. authorities have a significant allevi-ating effect on our options-based measure of systemic risk, irrespective of their characteristics.In particular, interventions to U.S. banks in the KBW bank index or to banks involved inthe Federal Reserve’s stress tests have an additional relieving effect on DCRP in the bankingsector. This evidence suggests that interventions by U.S. authorities appear credible toinvestors, as they reduce systemic risk to the eyes investors. However, for the euro area,only intervention announcements that involved multiple banks were marginally successfulin reducing the region’s DCRP. All other types of interventions, including country-specificintervention announcements, have an insignificant effect on the DCRP, often with the op-posite sign. Our evidence suggests that the lack of success of intervention announcementsby euro-area authorities is, in part, due to a segmented view of the financial system, whereinterventions only appear to have an effect on country-specific risk.
6 Conclusion
In this paper, we propose a measure of downside correlation risk premium (DCRP) toinvestigate the effect of central bank interventions on systemic risk. Our measure of DCRPis calculated as the difference between the downside variance risk premium of the majorbank index and the weighted average of the downside variance risk premiums of individualbanks within the index. We show that there are significant differences in the unconditionallevel of DCRP in the U.S. and euro-area banking sector. In particular, DCRP is on averagenegative for banks in the U.S. and positive, especially around key episodes of the Europeandebt crisis, for euro-area banks. This evidence suggests that investors are willing to buyprotection against the risk that banks in the euro area experience simultaneous large drops instock prices. We hypothesize that the main driver of this difference in the unconditional levelof DCRP is investors’ perception of how effective central bank interventions are in reducingsystemic risk.
Exploiting a novel dataset on central bank interventions, we find that irrespective of theircharacteristics, intervention announcements by U.S. authorities are successful in reducingDCRP. In contrast, intervention announcements by euro-area authorities have an insignificanteffect on DCRP, except for those involving several banks. We also document evidence thatinvestors view interventions in euro-area countries as segmented, where interventions are onlysuccessful in reducing the average downside variance risk premium of banks domiciled in thecountry of intervention, but not of banks domiciled outside of the country. However, thesecountry-specific interventions are unsuccessful in reducing DCRP for the region as a whole.
16

References
Acharya, V., L. Pedersen, T. Philippon, and M. Richardson (2010, May). Measuring systemicrisk.
Adrian, T. and M. Brunnermeier (2011). Covar. working paper Federal Reserve Bank of NewYork.
Aruoba, S. B., F. X. Diebold, and C. Scotti (2009). Real-Time Measurement of BusinessConditions. Journal of Business and Economic Statistics 27 (4), 417–427.
Bakshi, G. and N. Kapadia (2003). Volatility risk premum embedded in individual equityoptions: some new insights. Journal of Derivatives , 45–54.
Bakshi, G. and D. Madan (2006, December). A theory of volatility spreads. ManagementScience 52 (12), 1945–1956.
Beck, T., D. Coyle, M. Dewatripont, X. Freixas, and P. Seabright (2010). Bailing out banks:Reconciling stability and competition. mimeo, CEPR.
Bekaert, E. and E. Engstrom (2009). Asset return dynamics under bad environment goodenvironment fundamentals. NBER Working Paper 15222.
Bisias, D., M. Flood, A. Lo, and S. Valavanis (2012, January). A survey of systemic riskanalytics. Office of Financial Research Working Paper 0001.
Bollerslev, T., M. Gibson, and H. Zhou (2011, January). Dynamic estimation of volatilityrisk premia and investor risk aversion from option-implied and realized volatilities. Journalof Econometrics 160 (1), 235–245.
Bollerslev, T., G. Tauchen, and H. Zhou (2009). Expected stock returns and variance riskpremia. Review of Financial Studies 22, 4463–4492.
Brandt, O. D. and P. Hartmann (2000). Systemic risk: a survey. ECB working paper No. 35.
Brei, M., L. Gambacorta, and G. von Peter (2011). Rescue packages and bank lending. BISworking paper No. 357.
Britten-Jones, M. and A. Neuberger (2000). Option prices, implied price processes, andstochastic volatility. Journal of Finance 55 (2), 839–866.
Brownless, C. T. and R. Engle (2012). Volatility, correlation and tails for systemic riskmeasurement. working paper Universitat Pompeu Fabra and New York University.
Calderon, C. and S. Kalus (2012). Bank bailouts, competitive distortions, and consumerwelfare. mimeo, World Bank.
Carr, P. and L. Wu (2009, March). Variance Risk Premiums. Review of Financial Stud-ies 22 (3), 1311–1341.
17
Driessen, J., P. J. Maenhout, and G. Vilkov (2009, June). The Price of Correlation Risk:Evidence from Equity Options. Journal of Finance 64 (3), 1377–1406.
Duan, J.-C. and J. Wei (2009). Systematic risk and the price structure of individual equityoptions. Review of Financial Studies 22 (5), 1981–2006.
Gabaix, X. (2012, May). Variable Rare Disasters: An Exactly Solved Framework for TenPuzzles in Macro-Finance. Quarterly Journal of Economics 127 (2), 645–700.
Goodhart, C. and D. Schoenmaker (2006). Burden sharing in a banking crisis in Europe.Sveriges Riksbank Economic Review 2, 34–57.
Huang, X., H. Zhou, and H. Zhu (2009). A framework for assessing the systemic risk of majorfinancial institutions. Journal of Financial Economics 33, 2036–2049.
Huang, X., H. Zhou, and H. Zhu (2012). Systemic risk contributions. Journal of FinancialServices Research 42, 55–83.
Jiang, G. and Y. Tian (2005). The model-free implied volatility and its information content.Review of Financial Studies 18 (4), 1305–1342.
Kelly, B. T., H. N. Lustig, and S. V. Nieuwerburgh (2012, March). Too-systemic-to-fail:What option markets imply about sector-wide government guarantees. Working Paper,Chicago Booth School of Business.
Laeven, L. and F. Valencia (2010). Resolution of banking crises: The good, the bad, and theugly. mimeo, IMF.
Londono, J. M. (2011, September). The variance risk premium around the world.
Newey, W. K. and K. D. West (1987). A simple, positive semi-definite heteroskedasticity andautocorrelation consistent covariance matrix. Econometrica 55 (3), 703–708.
Posen, A. and N. Veron (2009). A solution for europe’s banking problem. mimeo, PetersonInstitute for International Economics.
Schoenmaker (2012). Banking supervision and resolution: The european dimension. mimeo,Duisenberg School of Finance.
Schurhoff, N. and A. Ziegler (2011, February). Variance risk, financial intermediation, andthe cross-section of expected option returns.
Scotti, C. (2013). Surprise and uncertainty indexes: Real-time aggregation of real-activitymacro surprises. mimeo, Federal Reserve Board.
Todorov, V. (2010, January). Variance Risk-Premium Dynamics: The Role of Jumps. Reviewof Financial Studies 23 (1), 345–383.
18
Tables and Figures
Table 1: Variance and correlation risk premiums, summary statistics
This table reports the summary statistics for several options-based risk measures for the U.S. and euro-areabank indexes. Columns 1 and 2 report the options-implied volatility of the bank index and the equal-weightedaverage (EW) average of the implied volatility of individual banks in the index, respectively. Implied volatilityis calculated using 80 percent degree of moneyness options. Columns 3 and 4 report the downside variancerisk premium of the bank index and the relative-volatility-weighted (VW) average of the downside variancerisk premium of individual banks in the index, respectively. Downside variance risk premium is calculatedas the difference between the (80 percent moneyness) options-implied variance and the expected realizedvariance, as described in section 3.1. The last column reports the downside correlation risk premium (DCRP),which is calculated as the difference between columns 3 and 4 (see equation(3)). Units for implied volatilityare in percentage points while units for variance and correlation risk premium are in percentage squaredpoints. *** indicates significance at the 1 percent level.
Panel (a) U.S. bank index (KBW)
(1) (2) (3) (4) (5)Implied volatility Variance risk premiumIndex Banks (EW) Index Banks (VW) DCRP
Mean 38.8 48.3 -32.7 254.6∗∗∗ -287.3∗∗∗
Median 32.7 41.6 271.7 466.8 -117.9St. Dev. 22.1 27.6 1,336.1 1,068.0 720.8Skew. 1.4 1.7 -4.1 -3.5 -3.6Kurt. 4.8 5.7 28.7 19.5 28.4
Panel (b) Euro-area bank index (Eurostoxx)
Implied volatility Variance risk premiumIndex Banks (EW) Index Banks (VW) DCRP
Mean 51.9 61.7 1074.3∗∗∗ 780.1∗∗∗ 294.2∗∗∗
Median 48.9 60.1 976.0 768.7 231.3St. Dev. 13.2 13.9 1,341.5 1,362.8 904.7Skew. 0.9 0.6 -1.4 -6.4 2.1Kurt. 3.2 2.8 16.3 60.6 17.3
19
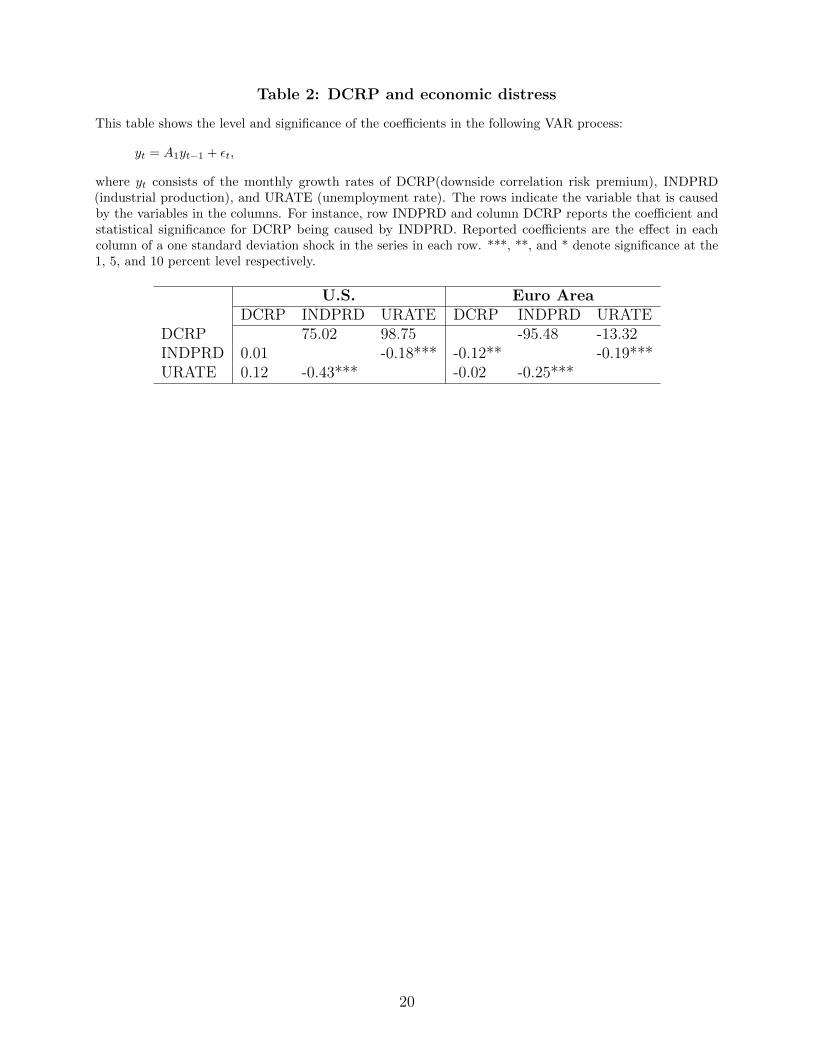
Table 2: DCRP and economic distress
This table shows the level and significance of the coefficients in the following VAR process:
yt = A1yt−1 + εt,
where yt consists of the monthly growth rates of DCRP(downside correlation risk premium), INDPRD(industrial production), and URATE (unemployment rate). The rows indicate the variable that is causedby the variables in the columns. For instance, row INDPRD and column DCRP reports the coefficient andstatistical significance for DCRP being caused by INDPRD. Reported coefficients are the effect in eachcolumn of a one standard deviation shock in the series in each row. ***, **, and * denote significance at the1, 5, and 10 percent level respectively.
U.S. Euro AreaDCRP INDPRD URATE DCRP INDPRD URATE
DCRP 75.02 98.75 -95.48 -13.32INDPRD 0.01 -0.18*** -0.12** -0.19***URATE 0.12 -0.43*** -0.02 -0.25***
20

Table 3: The effect of characteristics of intervention announcements on DCRP
This table shows the coefficients from the following regression setups:
DCRPi,t+h = βc,i,hDci,t + si,hSurpi,t + εt,h
and
DCRPi,t+h = β∗c,i,hDci,t + β∗int,i,hDi,t + si,hSurpi,t + εt,h,
where DCRP is the downside correlation risk premium for the U.S. or the euro area. Dummy Dct is one of the
following types of interventions defined in section 3.2: (1) involving multiple countries (defined only for theeuro area), (2) involving multiple banks, (3) to banks involved in stress tests, (4) to one of the banks in thebenchmark bank index, (5) to relatively large banks, (6) relatively large capital injections, or (7) relativelylarge SRisk (see Brownless and Engle, 2012). SurpUS,t is a measure of macroeconomic news surprises (seeScotti, 2013). Standard errors are corrected using Newey and West (1987) with 10 lags. We report only thecoefficient for the day following the intervention announcement, h=1.
U.S. Euro AreaType of intervention βc βc* βint* βc βc* βint*Multiple country -377 -303 -79Multiple bank -1747* -1118 -657*** -558* -743 192Involved in stress test -1680** -1190* -505** -131 -51 -82In banks index -1339** -1098* -243 202 467 -278Large bank -1069* -275 -814*** 885 1257 -394**Large injection -963** -69 -919** 590 994* -422*Large SRisk -1143** -456 -704*** 714 1179 -489**
21

Figure 1: U.S. and euro-area DCRP
The figure plots the downside correlation risk premium (DCRP) for the euro area (the bold line) and theU.S. (the dashed line) from 2008-2013. DCRP is computed as the difference between the downside variancerisk premium of the bank index and the relative-volatility-weighted average of the downside variance riskpremiums of its individual components (see equation (3)). The downside variance risk premium is calculatedas the difference between the OTM options-implied and the expected realized variance. The options-impliedvariance is calculated using options with 80 percent degree of moneyness.
2008 2009 2010 2011 2012 2013 2014
−8000
−6000
−4000
−2000
0
2000
4000
6000
euro−area DCRPU.S. DCRP
22
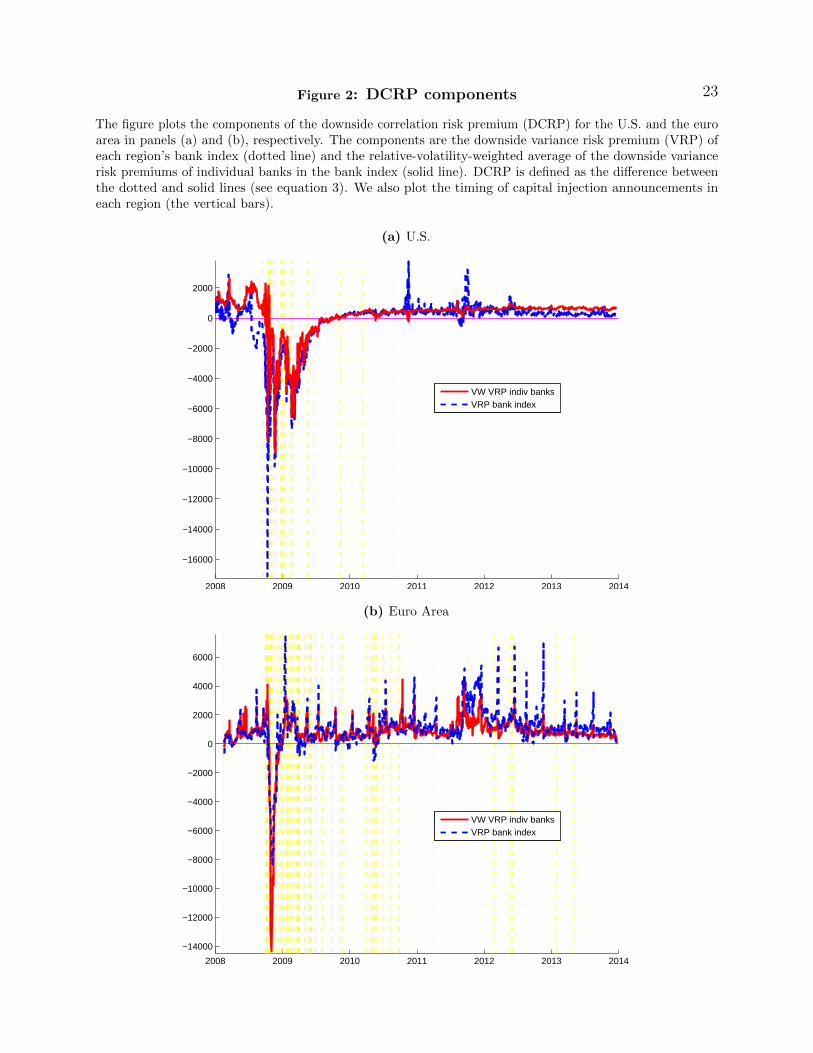
23Figure 2: DCRP components
The figure plots the components of the downside correlation risk premium (DCRP) for the U.S. and the euroarea in panels (a) and (b), respectively. The components are the downside variance risk premium (VRP) ofeach region’s bank index (dotted line) and the relative-volatility-weighted average of the downside variancerisk premiums of individual banks in the bank index (solid line). DCRP is defined as the difference betweenthe dotted and solid lines (see equation 3). We also plot the timing of capital injection announcements ineach region (the vertical bars).
(a) U.S.
2008 2009 2010 2011 2012 2013 2014
−16000
−14000
−12000
−10000
−8000
−6000
−4000
−2000
0
2000
VW VRP indiv banksVRP bank index
(b) Euro Area
2008 2009 2010 2011 2012 2013 2014
−14000
−12000
−10000
−8000
−6000
−4000
−2000
0
2000
4000
6000
VW VRP indiv banksVRP bank index

24Figure 3: Effect of intervention announcements on U.S. DCRP
This figure plots the estimated coefficient cUS,h from the following regression:
rpUS,t+h = cUS,hDUS,t + sUS,hSurpUS,t + εt,h,
for h = 1 to 30 days after the announcement of a capital injection to a bank in the U.S. The dependentvariable is one of the following options-based risk premium measures: (a) downside correlation risk premium(DCRP) for U.S. banks, (b) downside variance risk premium (VRP) of the U.S. bank index (KBW), and(c) relative-volatility-weighted (VW) average of the downside variance risk premiums of individual banksin the bank index. Dummy DUS,t is equal to 1 if there is a capital injection announcement in the U.S. attime t, and SurpUS,t is a measure of macroeconomic news surprises (see Scotti, 2013). The dotted blue linesrepresent one and two standard error deviations. Standard errors are corrected using Newey and West (1987)with 10 lags.
(a) DCRP
0 5 10 15 20 25 30−2000
−1500
−1000
−500
0
500
days after intervention
coef
ficie
nt o
n du
mm
y ca
pita
l inj
ectio
n
(b) VRP of bank index
0 5 10 15 20 25 30−5000
−4000
−3000
−2000
−1000
0
days after intervention
coef
ficie
nt o
n du
mm
y ca
pita
l inj
ectio
n
(c) VW average of VRPs of individual banks
0 5 10 15 20 25 30−4000
−3000
−2000
−1000
0
days after intervention
coef
ficie
nt o
n du
mm
y ca
pita
l inj
ectio
n

25Figure 4: Effect of intervention announcements on euro-area DCRP
This figure plots the estimated coefficient cEuro,h from the following regression:
rpEuro,t+h = cEuro,hDEuro,t + sEuro,hSurpEuro,t + εt,h
for h = 1 to 30 days after the announcement of a capital injection to a bank in the euro area. The dependentvariable is one of the following options-based risk premium measures: (a) downside correlation risk premium(DCRP) for euro-area banks, (b) downside variance risk premium (VRP) of the euro-area bank index(Eurostoxx), and (c) relative-volatility-weighted (VW) average of the downside variance risk premiums ofindividual banks in the bank index. Dummy DEuro,t is equal to 1 if there is a capital injection announcementin the euro area at time t, and SurpEuro,t is a measure of macroeconomic news surprises in the euro area(see Scotti, 2013). The dotted blue lines represent one and two standard error deviations. Standard errorsare corrected using Newey and West (1987) with 10 lags.
(a) DCRP
0 5 10 15 20 25 30−1000
−500
0
500
1000
days after intervention
coef
ficie
nt o
n du
mm
y ca
pita
l inj
ectio
n
(b) VRP of bank index
0 5 10 15 20 25 30−3000
−2000
−1000
0
1000
days after intervention
coef
ficie
nt o
n du
mm
y ca
pita
l inj
ectio
n
(c) VW average of VRPs of individual banks
0 5 10 15 20 25 30−4000
−3000
−2000
−1000
0
1000
days after intervention
coef
ficie
nt o
n du
mm
y ca
pita
l inj
ectio
n

26
Figure 5: Effect of intervention surprises on DCRP
This figure plots the estimated coefficient ch from the following regression:
DCRPt+h = chPt + shSurpt + εt,h,
for h = 1 to 30 days after the announcement of a capital injection to a bank in the U.S. (panel (a)) or in theeuro area (panel (b)). DCRP is the downside correlation risk premium. Pt represents the likelihood that acapital injection announcement was a surprise to the market. This is calculated as 1 minus the p-value thatresults from comparing the return of the intervened bank stock in the day following the announcement witha normal distribution of daily returns for the full sample. If stocks of an intervened bank are not publiclytraded, the intervention surprise measure is calculated based on the impact of the intervention on the bankindex of the country where the bank is domiciled. Surpt is a measure of macroeconomic news surprises(Scotti, 2013). The dotted blue lines represent one and two standard error deviations. Standard errors arecorrected using Newey and West (1987) with 10 lags.
(a) U.S.
0 5 10 15 20 25 30−4000
−3000
−2000
−1000
0
1000
days after intervention
coef
ficie
nt o
n du
mm
y p
valu
e
(b) Euro Area
0 5 10 15 20 25 30−1000
−500
0
500
1000
1500
days after intervention
coef
ficie
nt o
n du
mm
y p
valu
e

27Figure 6: Robustness tests on U.S. DCRP
This figure plots the estimated coefficient cUS,h for alternative specifications of the following regression:
DCRPUS,t+h = cUS,hDUS,t + sUS,hSurpUS,t + εt,h,
for h = 1 to 30 days after the announcement of a capital injection. DCRP is the downside correlation riskpremium for U.S. banks and dummy DUS,t is equal to 1 if there is a capital injection announcement in theU.S. at time t. SurpUS,t is a measure of macroeconomic news surprises (Scotti, 2013). The dotted blue linesrepresent one and two standard error deviations. Standard errors are corrected using Newey and West (1987)with 10 lags. Panel (a) shows the results for the subsample 2008-2011. Panel (b) shows the results for aspecification where DCRP is calculated using only the 10 largest U.S. banks. Panel (c) is a specificationwhere the downside variance risk premium of the bank index is calculated using options with 90 percentdegree of moneyness, while the downside variance risk premiums of the index’s components are calculatedusing options with 80 percent degree of moneyness.
(a) Subsample period: 2008-2011
0 5 10 15 20 25 30−2000
−1500
−1000
−500
0
500
days after intervention
coef
ficie
nt o
n du
mm
y ca
pita
l inj
ectio
n
(b) Largest banks
0 5 10 15 20 25 30−2000
−1500
−1000
−500
0
500
days after intervention
coef
ficie
nt o
n du
mm
y ca
pita
l inj
ectio
n
(c) DCRP(90,80)
0 5 10 15 20 25 30−3000
−2500
−2000
−1500
−1000
−500
0
days after intervention
coef
ficie
nt o
n du
mm
y ca
pita
l inj
ectio
n
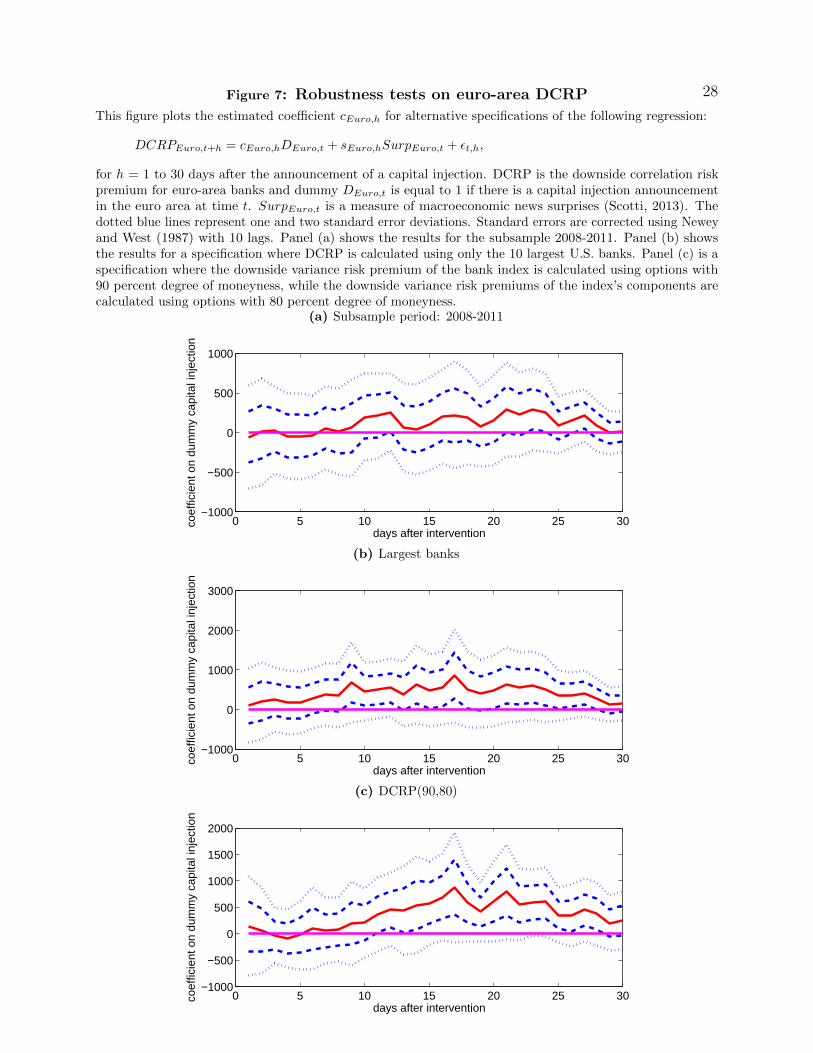
28Figure 7: Robustness tests on euro-area DCRP
This figure plots the estimated coefficient cEuro,h for alternative specifications of the following regression:
DCRPEuro,t+h = cEuro,hDEuro,t + sEuro,hSurpEuro,t + εt,h,
for h = 1 to 30 days after the announcement of a capital injection. DCRP is the downside correlation riskpremium for euro-area banks and dummy DEuro,t is equal to 1 if there is a capital injection announcementin the euro area at time t. SurpEuro,t is a measure of macroeconomic news surprises (Scotti, 2013). Thedotted blue lines represent one and two standard error deviations. Standard errors are corrected using Neweyand West (1987) with 10 lags. Panel (a) shows the results for the subsample 2008-2011. Panel (b) showsthe results for a specification where DCRP is calculated using only the 10 largest U.S. banks. Panel (c) is aspecification where the downside variance risk premium of the bank index is calculated using options with90 percent degree of moneyness, while the downside variance risk premiums of the index’s components arecalculated using options with 80 percent degree of moneyness.
(a) Subsample period: 2008-2011
0 5 10 15 20 25 30−1000
−500
0
500
1000
days after intervention
coef
ficie
nt o
n du
mm
y ca
pita
l inj
ectio
n
(b) Largest banks
0 5 10 15 20 25 30−1000
0
1000
2000
3000
days after intervention
coef
ficie
nt o
n du
mm
y ca
pita
l inj
ectio
n
(c) DCRP(90,80)
0 5 10 15 20 25 30−1000
−500
0
500
1000
1500
2000
days after intervention
coef
ficie
nt o
n du
mm
y ca
pita
l inj
ectio
n

29
Figure 8: Effect of country-specific bank interventions on euro-area DCRP
This figure plots the estimated coefficients ci,h from the following regression:
DCRPEurot+h =
∑i
ci,hDi,t + sEuro,hSurpEuro,t + εt,h,
for h = 1 to 30 days after an intervention announcement, where i is each one of the following euro-areamember states: Belgium, France, Germany, Greece, Italy, Netherlands, Spain, and rest of the euro area.The dependent variable is the euro-area DCRP, dummy Di,t is equal to 1 if there is a capital injectionannouncement in country i at time t, and SurpEuro,t is a measure of macroeconomic news surprises in theeuro area ((Scotti, 2013)). In each panel, the solid red line plots the coefficient from the joint regression onDi,t for all countries, while the dotted green line plots the coefficient from regressing on only Di,t for thecountry in the panel (ECRPEuro
t+h = ci,hDi,t + sEuro,hSurpEuro,t + εt,h). The dotted blue lines represent oneand two standard error deviations for the former specification. Standard errors are corrected using Neweyand West (1987) with 10 lags.
(a) Belgium
0 5 10 15 20 25 30−1000
−500
0
500
1000
1500
2000
2500
days after intervention
coun
try−
spec
ific
inte
rven
tion
dum
my
Joint RegIndiv Reg
(b) France
0 5 10 15 20 25 30−1000
−500
0
500
1000
1500
2000
2500
days after intervention
coun
try−
spec
ific
inte
rven
tion
dum
my
Joint RegIndiv Reg
(c) Germany
0 5 10 15 20 25 30−1000
−500
0
500
1000
1500
2000
2500
days after intervention
coun
try−
spec
ific
inte
rven
tion
dum
my
Joint RegIndiv Reg
(d) Greece
0 5 10 15 20 25 30−1000
−500
0
500
1000
1500
2000
2500
days after intervention
coun
try−
spec
ific
inte
rven
tion
dum
my
Joint RegIndiv Reg

30
Figure 8: Effect of country-specific bank interventions on euro-area DCRP, con-tinued
(e) Italy
0 5 10 15 20 25 30−1000
−500
0
500
1000
1500
2000
2500
days after intervention
coun
try−
spec
ific
inte
rven
tion
dum
my
Joint RegIndiv Reg
(f) Netherlands
0 5 10 15 20 25 30−1000
−500
0
500
1000
1500
2000
2500
days after intervention
coun
try−
spec
ific
inte
rven
tion
dum
my
Joint RegIndiv Reg
(g) Spain
0 5 10 15 20 25 30−1000
−500
0
500
1000
1500
2000
2500
days after intervention
coun
try−
spec
ific
inte
rven
tion
dum
my
Joint RegIndiv Reg
(h) Rest of Euro-area
0 5 10 15 20 25 30−1000
−500
0
500
1000
1500
2000
2500
days after intervention
coun
try−
spec
ific
inte
rven
tion
dum
my
Joint RegIndiv Reg