A data mining approach to the prediction of corporate failure
Upload
nguyencongCategory
view
218download
1
Asian Economic and Financial Review, 2016, 6(9): 522-533
522
† Corresponding author
DOI: 10.18488/journal.aefr/2016.6.9/102.9.522.533
ISSN(e): 2222-6737/ISSN(p): 2305-2147
© 2016 AESS Publications. All Rights Reserved.
BANK FAILURE PREDICTION MODELS FOR THE DEVELOPING AND DEVELOPED COUNTRIES: IDENTIFYING THE ECONOMIC VALUE ADDED FOR PREDICTING FAILURE
Yi-Shu Wang1 --- Xue Jiang2 --- Zhen-Jia-Liu3†
1,2,3School of Business, Changzhou University, Changzhou City, Jiangsu Providence, China
ABSTRACT
This study used data from 2003-2013, and used a logistic model to analyze the factors that influence financial early
warning systems in developing and developed countries. We employed a bank capital adequacy ratio less than 8%,
Tier I capital ratio less than 4%, and nonperforming loan ratio more than one third to measure bank failure and
identify the financial ratio that most accurately predicts bank failure. The results indicate that the economic value
added index is more effective than other indexes in predicting bank failure in NAFTA, ASEAN, EU, NIC, and G20
nations.
© 2016 AESS Publications. All Rights Reserved.
Keywords: Bank failure prediction, Business, Economic value added, Developing countries, Developed countries, Financial early warning.
Contribution/ Originality
The paper contributes the first logical analysis economic value added that influence financial early warning
systems in developing and developed countries.
1. INTRODUCTION
Research on corporate failure prediction is expanding worldwide. From a practical perspective, corporate failure
prediction influences the decisions of stakeholders (e.g., stockholders, creditors, managers, auditors, and employees).
From an academic perspective, several studies have identified various determinants of corporate failure and have
developed optimal models for predicting corporate failure. Banks differ from other industries because they receive
deposits and provide loans for profit. Thus, the collapse of banks, often caused by mismanagement or the economic
environment, negatively affects depositor rights and other industries, can induce international financial distress and
destabilize economic development. Consequently, evaluating bank operations and establishing an early warning
system are a top priority for global financial authority (Huang et al., 2012).
Early warning systems first appeared in the banking industry in 1970s. The effectiveness of financial ratios, such
as current (Jayadev, 2006) EBIT-to-assets (Jayadev, 2006) equity-to-debt (Jayadev, 2006; Distinguin et al., 2011)
equity-to-assets (Shkurti and Duraj, 2010; Maghyereh and Awartani, 2014) net income–to-assets (Li et al., 2011)
expenses-to-assets (Li et al., 2011) working capital-to-assets (Ecer, 2013);and profit before taxes-to-equity ratios
(Shkurti and Duraj, 2010) for predicting and explaining bank failure has been investigated. However, these ratios
follow generally accepted accounting principles, requiring conservatism in preparing financial statements that only
Asian Economic and Financial Review
ISSN(e): 2222-6737/ISSN(p): 2305-2147
URL: www.aessweb.com

Asian Economic and Financial Review, 2016, 6(9): 522-533
523
© 2016 AESS Publications. All Rights Reserved.
reflect historic costs. Thus, traditional financial ratios do not reflect the actual bank value. The economic value added
(EVA) index is calculated “after subtracting the cost of capital from the operating profits” (Stewart, 1991) and
involves using adjustment items to reflect the true value of a firm. Furthermore, Teker et al. (2011) showed that EVA
is useful in determining the true value of a bank. Conversely, numerous studies have adopted EVA to detect corporate
failure (Timo and Virtanen, 2001; Pasaribu, 2008; Klecka and Scholleova, 2010; Anvarkhatibi et al., 2013). However,
these studies have adopted only the unadjusted EVA to predict corporate failure, which does not provide a
comprehensive overview of a company’s economic performance. Therefore, in this study, we employ the unadjusted
EVA and adjusted EVA to predict bank failures and identify which index is superior in comparison to various
financial ratios (accuracy). All the countries have different types of governments and cultures, laws, economic
development. The operational system and environment of banks in nations are also substantially different and
therefore cannot be considered equivalent. We developed an optimal model and compared the early warning
indicators of bank failures in North America Free Trade
2. LITERATURE REVIEW
Classical models for predicting bank bankruptcy have been extensively researched: multivariate adaptive
regression spines (Martin et al., 2011) logistic regression (Al-Saleh and Al-Kandari, 2012; Fungacova and Weill,
2013; Valahzaghard and Bahrami, 2013; Zaghdoudi, 2013; Canicio and Blessing, 2014) back propagation neural
network (Pradhan et al., 2013) hazard model (Kiefer, 2014; Maghyereh and Awartani, 2014) Principal Component
Analysis (Adeyeye et al., 2012) multiple discriminant analysis (Ioannidis et al., 2010) fuzzy C-means clustering
(Martin et al., 2011) group method of data handling (Ravisankar and Rav, 2010) fuzzy adaptive resonance theory map
(Ravisankar and Rav, 2010) artificial neural network (Ioannidis et al., 2010) classification and regression trees
(Ioannidis et al., 2010) genetic algorithm (Martin et al., 2011) partial least square discriminant analysis (Serrano-
Cinca, 2013) k-Nearest neighbours (Ioannidis et al., 2010) counter propagation neural network (Ravisankar and Rav,
2010) ordered logistic regression (Ioannidis et al., 2010) neuro fuzzy (Yildiz and Akkoc, 2010) dynamic slacks based
model (Wanke et al., 2015) neural networks (Lopez and Pastor, 2015) geometric mean based boosting algorithm
(Kim et al., 2015) discriminant analysis (Cox and Wang, 2014). The Federal Deposit Insurance Corporation
constructed financial ratios such as capital adequacy, asset quality, management quality, earnings strength, and
liquidity (collectively referred to as CAMEL) to monitor banks and predict bank failure (Trussel and Johnson, 2012;
Valahzaghard and Bahrami, 2013; Canicio and Blessing, 2014). The application of these traditional accounting tools
for measuring corporate failures has been questioned, for various reasons. The tools are suitable for analyzing
historical data, but not for future decision-making (Rappaport, 1995). Pasaribu (2008) showed that public companies
that do not create EVA are at a high risk of distress. Timo and Virtanen (2001) indicated that EVA can warn about an
approaching bankruptcy because economic bankruptcy occurs when the value of a firm becomes negative (i.e., when
a firm is unable to earn profit in excess of the required return). Anvarkhatibi et al. (2013) asserted that the probability
of bankruptcy decreases with increasing economic value. This is because higher company economic value results in
positive EVA as a result of shareholder return and available opportunities for profitable investments and paying loan
interest. Thus, Anvarkhatibi et al. (2013) indicated that EVA is a superior index for predicting bankruptcy and
providing useful information for shareholders. Hence, the EVA measure could be dangerously susceptible as a distress
warning device. Accordingly, we proposed Hypothesis 1 as follows:
H1: The corporate failure prediction accuracy of economic value added is higher than that of other financial ratios.

Asian Economic and Financial Review, 2016, 6(9): 522-533
524
© 2016 AESS Publications. All Rights Reserved.
3. METHODOLOGY
Financial ratios were used to predict distress in the banking industry, incorporating data from 2003-2013 from
the COMPUSTAT and AREMOS database.
The study comprised 775 banks1 .
A logistic model was adopted to analyze the data. The variables and research model are presented in the
following sections.
3.1. Dependent variables: Bank failures
Lin (2010) showed that a bank capital adequacy ratio less than 8%, Tier I capital ratio less than 4%, and
nonperforming loan ratio more than one third is determined for the distressed bank. In addition, the capital adequacy
ratio is calculated by dividing total capital by average assets; the elements of total capital are used as core capital
combined with additional capital (i.e., Tier I capital plus Tier II capital).2 Tier I capital (i.e., common stock and
qualifying preferred stock) divided by risk-adjusted assets yields the Tier I capital ratio. The nonperforming loan ratio
is measured as the nonperforming loans (i.e., past due loans, the principal and/or interest of which is unpaid for 30
days or more after the due date) divided by all loans (including interbank loans). This formula is based on the 1988
Basel Capital Accord standards for the definition of equity. Overall, the value of the dummy variable was 1
(distressed group), and the value of the contrary variable was 0.
3.2. Independent Variables: Financial Ratios
Jayadev (2006) stated that successful banks have high current ratios, earnings before interest, and taxes-to-assets
ratios. Furthermore, Shkurti and Duraj (2010) stated that successful banks have high profit before taxes-to-equity
ratios, and Li et al. (2011) showed that successful banks have low expenses-to-assets ratios. EVA also can be used to
detect corporate failure (Timo and Virtanen, 2001; Pasaribu, 2008; Klecka and Scholleova, 2010; Anvarkhatibi et al.,
2013).
3.3. Control Variables: Bank Factors
Bank factors reflect bank operating environments, thus explaining how they affect bank failure. Shkurti and
Duraj (2010) showed that successful banks have low interest expenses-to-deposits ratios. Moreover, Öğüt et al.
(2012) asserted that successful banks have high interest revenue minus interest expenses-to-number of bank branches
ratios. Canicio and Blessing (2014) showed that successful banks have high deposits-to-total assets ratios and that
unsuccessful banks have high loans-to-assets ratios.
1NAFTA (North America Free Trade Area): America, Canada, Mexico. ASEAN (Association of Southeast Asian Nations): Indonesia, Thailand, Malaysia, Philippines,
Vietnam, Singapore. EU(European Union): Denmark, Belgium, Lithuania, Hungarian, Spain, Greece, Poland, France, Finland, Bulgaria, Malta, Czech, Netherlands,
Slovak, Slovenia, Cyprus, Austria, Ireland, Sweden, Italy, Portugal, Germany, Romania, United Kingdom, Luxembourg, Latvia, Es tonia).NIC (Newly industrialized
country):South- Africa, Brazil, China, India, Turkey. G20: Argentina, Austrlia, Japan, Korea, Russia, Saudi Arabia
2Tier II capital includes preferred stock, subordinated debt, and loan loss reserves.
Asian Economic and Financial Review, 2016, 6(9): 522-533
525
© 2016 AESS Publications. All Rights Reserved.
3.4. Empirical model3
The study used the logistic method. The proxy variables are as follows: tjCR , represents current assets compared
with current liabilities. tjEBITTA , represents earnings before interest and taxes compared with assets.
tjEBTE ,
represents earnings before taxes compared with equity. tjETA ,
represents expenses compared with assets. tjIED ,
represents interest expenses compared with deposits. tjNETI , represents interest revenue minus interest expenses
compared with number of bank branches. tjDTA , represents deposits compared with total assets.
tjLTA , represents
loans compared with assets. jUAEVA is the unadjusted EVA4 compared with the outstanding shares; jAEVA is the
adjusted EVA5 (join accounting adjusted items) compared with the outstanding shares ; jEDAEVA represents the
adjusted EVA6 (join accounting adjusted items and economic depreciation adjusted items) compared with the
outstanding shares.
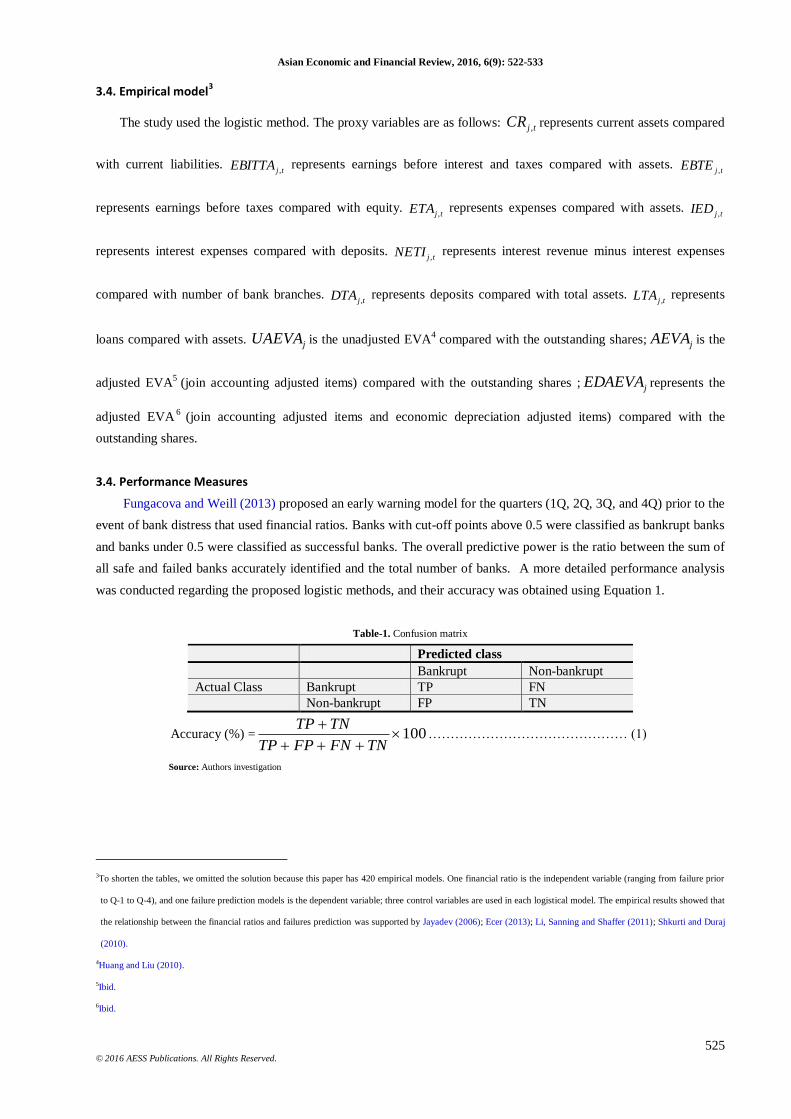
3.4. Performance Measures
Fungacova and Weill (2013) proposed an early warning model for the quarters (1Q, 2Q, 3Q, and 4Q) prior to the
event of bank distress that used financial ratios. Banks with cut-off points above 0.5 were classified as bankrupt banks
and banks under 0.5 were classified as successful banks. The overall predictive power is the ratio between the sum of
all safe and failed banks accurately identified and the total number of banks. A more detailed performance analysis
was conducted regarding the proposed logistic methods, and their accuracy was obtained using Equation 1.
Table-1. Confusion matrix
Predicted class
Bankrupt Non-bankrupt
Actual Class Bankrupt TP FN
Non-bankrupt FP TN
Accuracy (%) = 100
TNFNFPTP
TNTP……………………………………… (1)
Source: Authors investigation
3To shorten the tables, we omitted the solution because this paper has 420 empirical models. One financial ratio is the independent variable (ranging from failure prior
to Q-1 to Q-4), and one failure prediction models is the dependent variable; three control variables are used in each logistical model. The empirical results showed that
the relationship between the financial ratios and failures prediction was supported by Jayadev (2006); Ecer (2013); Li, Sanning and Shaffer (2011); Shkurti and Duraj
(2010).
4Huang and Liu (2010).
5Ibid.
6Ibid.

Asian Economic and Financial Review, 2016, 6(9): 522-533
526
© 2016 AESS Publications. All Rights Reserved.
3.5. Robustness Test7
We also repeat the same analyses out‐of‐sample to tackle a possible sample specific issue and get more robust
and general results
4. RESULTS
4.1. Descriptive Statistics
Table 2 shows that the mean of all financial ratios (including EVA). The current ratios all exceed 100%, with
NAFTA at 172.52% (highest) and EU at 117.85% (lowest). Earnings before interest, taxes compared with assets, and
earnings before taxes compared with equity had a positive value for all groups. Expenses compared with assets were
less than 30%, indicating that operating policies were robust. Conversely, the mean of the interest revenue minus
interest expenses compared with the number of bank branches exceeded 08, showing that public banks in these
countries have a large capacity for measuring and managing risk.
Interest expenses compared with deposits ranged from 11.25% to 20.11%, deposits compared with total assets
averaged approximately 50%, and loans compared with assets averaged approximately 45%. These results indicated
that credit policies were robust and stable, and appropriate loan losses are a suitable measure for risk management. In
addition, the mean of the EVA is positive9, showing that the public banks in these countries have a considerable
ability to be profitable or to manage funds efficiently.
4.2. Empirical Test
The comparisons of predicted and actual bankruptcy classifications are shown in Tables 3-6. As indicated in
Table 3 (one quarter before a failure), NAFTA banks had the highest value (the accuracy of the logistic model was
39.57%) when unadjusted EVA was employed to predict bank failure (the proxy variable is the bank capital adequacy
ratio below 8%) and the lowest value (the accuracy of the logistic model was 27.23%) when the expenses compared
with assets were employed to predict bank failure (the proxy variable is bank Tier I capital ratio below 4%);ASEAN
banks had the highest value (the accuracy of the logistic model was 35.08%) when adjusted EVA (join accounting
adjusted items) was employed to predict bank failure (the proxy variable is bank capital adequacy ratio below 8%),
and the lowest value (the accuracy of the logistic model was 26.58%) when adjusted EVA (join accounting adjusted
items) was employed to predict bank failure (the proxy variable is bank Tier I capital ratio below 4%);EU banks had
the highest value (the accuracy of the logistic model was 37.52%) when unadjusted EVA was employed to predict
bank failure (the proxy variable is bank capital adequacy ratio below 8%) and the lowest value (the accuracy of the
logistic model was 28.16%) when the earnings before interest and taxes compared with assets were employed to
predict bank failure (the proxy variable is bank Tier I capital ratio below 4%);NIC banks had the highest value (the
accuracy of the logistic model was 39.98%) when adjusted EVA (join accounting adjusted items and economic
deprecation adjusted items) was employed to predict bank failure (the proxy variable is bank capital adequacy ratio
below 8%), and the lowest value (the accuracy of the logistic model was 27.61%) when adjusted EVA (join
accounting adjusted items) was employed to predict bank failure (the proxy variable is bank Tier I capital ratio below
4%. G20 banks had the highest value (the accuracy of the logistic model was 36.94%) when adjusted EVA (join
accounting adjusted items and economic deprecation adjusted items) was employed to predict bank failure (the proxy
7We adopted 1 (in sample) to 1 (out of sample) and showed that this method is consistent with “performance measures”.
8US ten thousand dollars
9US dollars

Asian Economic and Financial Review, 2016, 6(9): 522-533
527
© 2016 AESS Publications. All Rights Reserved.
variable is bank capital adequacy ratio below 8%), and the lowest value (the accuracy of the logistic model was
19.25%) when unadjusted EVA was employed to predict bank failure (the proxy variable is bank capital adequacy
ratio below 8%).
As indicated in Table 4 (two quarters before a failure), NAFTA banks had the highest value (the accuracy of the
logistic model was 60.91%) when unadjusted EVA was employed to predict bank failure (the proxy variable is bank
capital adequacy ratio below 8%), and the lowest value (the accuracy of the logistic model was 38.57%) when the
expenses compared with assets were employed to predict bank failure (the proxy variable is bank Tier I capital ratio
below 4%);ASEAN banks had the highest value (the accuracy of the logistic model was 54.09%) when adjusted
EVA (join accounting adjusted items) was employed to predict bank failure (the proxy variable is bank capital
adequacy ratio below 8%), and the lowest value (the accuracy of the logistic model was 37.67%) when adjusted EVA
(join accounting adjusted items) was employed to predict bank failure (the proxy variable is bank’s Tier I capital ratio
below 4%);EU banks had the highest value (the accuracy of the logistic model was 57.79%) when adjusted EVA
(join accounting adjusted items and economic deprecation adjusted items) was employed to predict bank failure (the
proxy variable is bank capital adequacy ratio below 8%), and the lowest value (the accuracy of the logistic model was
39.85%) when the earnings before interest and taxes compared with assets was employed to predict bank failure (the
proxy variable is bank Tier I capital ratio below 4%);NIC banks had the highest value (the accuracy of the logistic
model was 57.91%) when adjusted EVA (join accounting adjusted items and economic deprecation adjusted items)
was employed to predict bank failure (the proxy variable is bank capital adequacy ratio below 8%), and the lowest
value (the accuracy of the logistic model was 38.34%) when the earnings before interest and taxes compared with
assets was employed to predict bank failure (the proxy variable is bank Tier I capital ratio below 4%);G20 banks
had the highest value (the accuracy of the logistic model was 56.92%) when adjusted EVA (join accounting adjusted
items and economic deprecation adjusted items) was employed to predict bank failure (the proxy variable is bank
capital adequacy ratio below 8%), and the lowest value (the accuracy of the logistic model was 27.53%) when
adjusted EVA was employed to predict bank failure (the proxy variable is bank Tier I capital ratio below 4%).
Compared to Table 3 and Table 4, as indicated in Table 5 (three quarters before a failure), NAFTA banks had the
highest value (the accuracy of the logistic model was 58.72%) when unadjusted EVA was employed to predict bank
failure (the proxy variable is bank capital adequacy ratio below 8%), and the lowest value (the accuracy of the logistic
model was 36.24%) when adjusted EVA (join accounting adjusted items and economic deprecation adjusted items)
was employed to predict bank failure (the proxy variable is bank non-performing loan ratio above one third or more)
;ASEAN banks had the highest value (the accuracy of the logistic model was 52.12%) when adjusted EVA (join
accounting adjusted items) was employed to predict bank failure (the proxy variable is bank capital adequacy ratio
below 8%), and the lowest value (the accuracy of the logistic model was 36.18%) when unadjusted EVA was
employed to predict bank failure (the proxy variable is bank’s non-performing loan ratio above one third or more);
EU banks had the highest value (the accuracy of the logistic model was 55.79%) when unadjusted EVA was
employed to predict bank failure (the proxy variable is bank capital adequacy ratio below 8%), and the lowest value
(the accuracy of the logistic model was 38.15%) when the current assets compared with current liabilities was
employed to predict bank failure (the proxy variable is bank non-performing loan ratio above one third or more);
NIC banks had the highest value (the accuracy of the logistic model was 55.81%) when adjusted EVA (join
accounting adjusted items and economic deprecation adjusted items) was employed to predict bank failure (the proxy
variable is bank capital adequacy ratio below 8%), and the lowest value (the accuracy of the logistic model was
36.73%) when the current assets compared with current liabilities was employed to predict bank failure (the proxy
variable is bank non-performing loan ratio above one third or more);G20 banks had the highest value (the accuracy
of the logistic model was 54.86%) when adjusted EVA (join accounting adjusted items and economic deprecation

Asian Economic and Financial Review, 2016, 6(9): 522-533
528
© 2016 AESS Publications. All Rights Reserved.
adjusted items) was employed to predict bank failure (the proxy variable is bank capital adequacy ratio below 8%),
and the lowest value (the accuracy of the logistic model was 26.57%) when unadjusted EVA was employed to predict
bank failure (the proxy variable is bank non-performing loan ratio above one third or more).
As indicated in Table 6 (four quarters before a failure), NAFTA banks had the highest value (the accuracy of the
logistic model was 56.59%) when unadjusted EVA was employed to predict bank failure (the proxy variable is bank
capital adequacy ratio below 8%), and the lowest value (the accuracy of the logistic model was 33.72%) when
adjusted EVA (join accounting adjusted items and economic deprecation adjusted items) was employed to predict
bank failure (the proxy variable is bank Tier I capital ratio below 4%);ASEAN banks had the highest value (the
accuracy of the logistic model was 50.36%) when adjusted EVA (join accounting adjusted items) was employed to
predict bank failure (the proxy variable is bank capital adequacy ratio below 8%), and the lowest value (the accuracy
of the logistic model was 33.14%) when unadjusted EVA was employed to predict bank failure (the proxy variable is
bank Tier I capital ratio below 4%);EU banks had the highest value (the accuracy of the logistic model was 53.74%)
when unadjusted EVA was employed to predict bank failure (the proxy variable is bank capital adequacy ratio below
8%), and the lowest value (the accuracy of the logistic model was 35.01%) when the earnings before interest and
taxes compared to assets was employed to predict bank failure (the proxy variable is bank Tier I capital ratio below
4%);NIC banks had the highest value (the accuracy of the logistic model was 53.84%) when adjusted EVA (join
accounting adjusted items and economic deprecation adjusted items) was employed to predict bank failure (the proxy
variable is bank capital adequacy ratio below 8%), and the lowest value (the accuracy of the logistic model was
33.72%) when the earnings before interest and taxes compared to assets was employed to predict bank failure (the
proxy variable is bank Tier I capital ratio below 4%);G20 banks had the highest value (the accuracy of the logistic
model was 52.94%) when adjusted EVA (join accounting adjusted items and economic deprecation adjusted items)
was employed to predict bank failure (the proxy variable is bank capital adequacy ratio below 8%), and the lowest
value (the accuracy of the logistic model was 24.48%) when adjusted EVA was employed to predict bank failure (the
proxy variable is bank Tier I capital ratio below 4%).
Overall, compared with the other traditional financial ratios for all of the tested models, the empirical solutions
show that EVA is superior in predicting bank failure. These findings support Hypothesis 1. The EVA likely reflects
an enterprise’s real economic value and can be employed to prevent the inefficient management of funds (i.e., income
excess capital cost) to ensure that corporations do not waste resources. Thus, the accuracy of bank failure prediction
has been increased. Moreover, the EVA could be the optimal index for predicting bank failure in these countries. In
addition, a bank capital adequacy ratio less than 8%, Tier I capital ratio less than 4%, and nonperforming loan ratio
more than one third can be the optimal index for predicting bank failure in these countries.
Results from variance inflation factors to explain variables for correlation; the result lies between 1.425 and
1.847 (Variance Inflation Factors<10).There is no correlation problem. We repeat the same analyses out‐of‐sample to
tackle a possible sample specific issue and get general robust results10
,11
. Overall, the analysis of the prediction model
show that all measures of predictive ability, there are differences between eight models.
10In order to shorten the tables, we omit the solution
11We adopted 1 (in sample) to 1 (out of sample)

Asian Economic and Financial Review, 2016, 6(9): 522-533
529
© 2016 AESS Publications. All Rights Reserved.
Table-2. Descriptive statistics (%;Average Values)
NAFTA ASEAN EU NIC G20
tjCR , 172.52 148.55 117.85 123.68 124.17
tjEBITTA , 89.21 77.42 93.48 112.08 113.52
tjEBTE , 66.84 56.58 77.18 103.55 128.41
tjETA , 25.36 18.25 21.54 19.23 20.12
tjIED , 17.35 19.21 11.25 19.63 20.11
tjNETI , 102.58 99.31 85.26 91.15 103.25
tjDTA , 52.38 50.05 52.38 55.12 54.31
tjLTA , 44.21 43.34 47.31 43.12 47.31
jUAEVA 0.88 1.73 0.99 1.12 0.79
jAEVA 0.72 0.99 0.78 0.97 0.66
jEDAEVA 0.62 0.98 0.64 0.86 0.56
Samples 205 162 1135 132 245
Source: Authors investigation
Table-3. Performance Measures (Accuracy %)-One quarter before a failure
Bank failure: bank capital adequacy ratio less than 8%
Panel A NAFTA ASEAN EU NIC G20
tjCR ,
37.59 33.63 29.30 28.13 19.98
tjEBITTA , 33.66 34.28 32.57 30.19 20.09
tjEBTE , 28.31 28.93 31.69 29.92 25.66
tjETA , 29.78 30.54 34.45 33.38 29.26
jUAEVA 39.57 27.62 37.52 28.72 19.25
jAEVA 28.31 35.08 29.59 35.56 36.58
jEDAEVA 27.73 34.58 30.11 39.98 36.94
Panel B Bank failure: bank Tier I capital ratio less than 4%
tjCR , NAFTA ASEAN EU NIC G20
tjEBITTA , 35.94 32.96 28.16 27.68 19.49
tjEBTE , 32.25 32.16 31.23 29.25 19.51
tjETA , 27.23 27.81 30.68 28.74 24.74
jUAEVA 28.81 29.29 33.15 31.67 28.83
jAEVA 37.96 26.58 35.88 27.61 19.75
jEDAEVA 27.55 33.59 28.43 34.43 34.74
Panel C
Bank failure: bank nonperforming loan ratio more than one third
tjCR , 36.75 32.95 28.25 27.68 19.85
tjEBITTA , 32.98 33.34 31.93 29.65 19.96
tjEBTE , 27.85 28.44 31.92 29.39 25.65
tjETA , 29.46 29.95 33.74 32.84 28.76
jUAEVA 38.65 27.18 36.68 28.24 19.68
jAEVA 27.85 34.35 29.78 34.65 35.59
jEDAEVA 27.29 33.86 29.58 36.75 36.13
Source: Authors investigation

Asian Economic and Financial Review, 2016, 6(9): 522-533
530
© 2016 AESS Publications. All Rights Reserved.
Table-4. Performance Measures (Accuracy %)-Two quarters before a failure
Bank failure: bank capital adequacy ratio less than 8%
Panel A NAFTA ASEAN EU NIC G20
tjCR , 57.91 51.88 45.35 43.53 31.13
tjEBITTA , 51.92 52.48 50.27 46.66 31.48
tjEBTE , 43.81 44.73 48.93 46.23 39.76
tjETA , 46.35 47.12 53.13 50.97 45.24
jUAEVA 60.91 42.74 57.79 44.48 30.85
jAEVA 43.62 54.09 45.74 54.81 55.94
jEDAEVA 42.91 53.32 46.53 57.91 56.92
Panel B Bank failure: bank Tier I capital ratio less than 4%
tjCR , NAFTA ASEAN EU NIC G20
tjEBITTA , 50.64 45.46 39.85 38.34 27.76
tjEBTE , 45.55 45.98 44.09 41.01 27.92
tjETA , 38.57 39.37 42.95 40.65 35.13
jUAEVA 40.75 41.41 46.53 44.69 39.87
jAEVA 53.16 37.67 50.51 39.11 27.53
jEDAEVA 38.57 47.35 40.23 47.96 48.93
Panel C
Bank failure: bank nonperforming loan ratio more than one third
tjCR , 53.78 48.38 42.48 40.89 29.78
tjEBITTA , 48.42 48.92 46.94 43.73 29.94
tjEBTE , 41.14 41.97 45.74 43.32 37.52
tjETA , 43.43 44.12 49.54 47.57 42.43
jUAEVA 56.47 40.19 53.68 41.69 29.53
jAEVA 41.14 50.36 42.88 51.15 52.26
jEDAEVA 40.34 49.67 43.59 53.78 52.93
Source: Authors investigation
Table-5. Performance Measures (Accuracy %)-Three quarters before a failure
Bank failure: bank capital adequacy ratio less than 8%
Panel A NAFTA ASEAN EU NIC G20
tjCR ,
55.81 49.99 43.63 41.91 29.92
tjEBITTA , 50.33 50.57 48.43 44.94 30.96
tjEBTE , 42.76 43.77 47.13 44.53 38.27
tjETA , 44.64 45.39 51.19 49.11 43.57
jUAEVA 58.72 41.15 55.79 42.77 29.65
jAEVA 42.35 52.12 44.05 52.82 53.91
jEDAEVA 41.31 51.38 44.82 55.81 54.86
Panel B Bank failure: bank Tier I capital ratio less than 4%
tjCR , NAFTA ASEAN EU NIC G20
tjEBITTA , 50.74 45.57 39.93 38.44 27.75
tjEBTE , 45.61 46.09 44.19 41.09 27.97
tjETA , 38.63 39.43 43.45 40.73 35.17
Continue

Asian Economic and Financial Review, 2016, 6(9): 522-533
531
© 2016 AESS Publications. All Rights Reserved.
jUAEVA 40.83 41.49 46.65 44.83 39.87
jAEVA 53.33 37.73 50.65 39.16 27.52
jEDAEVA 38.63 47.47 40.34 48.09 49.06
Panel C
Bank failure: bank nonperforming loan ratio more than one third
tjCR , 48.25 43.43 38.15 36.73 26.79
tjEBITTA , 43.46 43.91 42.14 39.24 26.93
tjEBTE , 36.95 37.77 41.06 38.97 33.71
tjETA , 39.37 39.61 44.43 42.77 38.11
jUAEVA 50.67 36.18 48.17 37.44 26.57
jAEVA 36.47 45.25 38.59 45.78 46.68
jEDAEVA 36.24 44.58 39.14 48.25 47.47
Source: Authors investigation
Table-6. Performance Measures (Accuracy %) - Fourth quarters before a failure
Bank failure: bank capital adequacy ratio less than 8%
Panel A NAFTA ASEAN EU NIC G20
tjCR , 53.84 48.33 42.32 40.72 29.36
tjEBITTA , 48.38 48.89 46.86 43.56 29.52
tjEBTE , 40.72 41.83 45.64 43.17 37.26
tjETA , 43.28 43.99 49.48 47.51 42.27
jUAEVA 56.59 39.98 53.74 41.51 29.11
jAEVA 40.62 50.36 42.72 51.02 52.05
jEDAEVA 40.13 49.66 43.45 53.84 52.94
Panel B Bank failure: bank Tier I capital ratio less than 4%
tjCR , NAFTA ASEAN EU NIC G20
tjEBITTA , 44.25 39.81 35.01 33.72 24.67
tjEBTE , 39.84 40.24 38.63 36.29 24.89
tjETA , 33.91 34.59 37.66 35.69 30.97
jUAEVA 35.78 36.34 40.72 39.15 34.97
jAEVA 46.39 33.14 44.12 34.36 24.48
jEDAEVA 33.72 41.42 35.33 41.95 42.77
Panel C
Bank failure: bank nonperforming loan ratio more than one third
tjCR , 51.57 46.32 40.59 39.05 28.24
tjEBITTA , 46.36 46.85 44.92 41.77 28.45
tjEBTE , 40.32 40.09 43.75 41.41 35.77
tjETA , 41.55 42.18 47.41 45.53 40.54
jUAEVA 54.19 38.36 51.47 39.82 28.11
jAEVA 39.28 48.25 40.97 48.88 49.86
jEDAEVA 38.51 47.58 41.67 51.57 50.71
Source: Authors investigation
5. CONCLUSION
This study used data from 2003-2013, and used a logistic model to analyze the factors that influence financial
early warning systems in developing and developed countries. The results indicate that EVA is superior in predicting

Asian Economic and Financial Review, 2016, 6(9): 522-533
532
© 2016 AESS Publications. All Rights Reserved.
bank failure in NAFTA, ASEAN, EU, NIC, and G20 nations. The EVA likely reflects an enterprise’s real economic
value and can be employed to prevent the inefficient management of funds (i.e., income excess capital cost) to ensure
that corporations do not waste resources. Thus, the accuracy of bank failure prediction has been increased. Moreover,
the EVA could be the optimal index for predicting bank failure in these countries.
In this study, we adopted cut off points greater 0.5 to classify companies as bankrupt, and points below than 0.5
indicated successful companies. However, this value is frequently used and subjective and optimal cut off points
should be determined in future. This study demonstrated the determinants of bank failure in terms of various financial
factors. Therefore, future studies should examine all relevant factors or devise new theories that predict bank crises.
6. ACKNOWLEDGMENTS
This work has been supported by a grant from the Jiangsu Provincial Department of Education
Philosophy and Social Science Foundation (Project Number 2014SJB474).
REFERENCES
Adeyeye, P.O., O.D. Fajembola, M.O. Olopete and D.B. Adedeji, 2012. Predicting bank failure in Nigeria using principal
component analysis and D-score model. Research Journal of Finance and Accounting, 3(8): 159-170.
Al-Saleh, M.A. and A.M. Al-Kandari, 2012. Prediction of financial distress for commercial banks in Kuwait. World Review of
Business Research, 2(6): 26-45.
Anvarkhatibi, S., R. Mohammadi and J. Mohammadi, 2013. Investigation of the effect of the value added, earning quality and
leverage ratio on bankruptcy in organizations accepted in Tehran’s stock market. Journal of Natural and Social Sciences,
2(2): 223-229.
Canicio, D. and K. Blessing, 2014. Determinants of bank failures in multiple-currency regime in Zimbabwe (2009–2012).
International Journal of Economics and Finance, 6(8): 229-246.
Cox, R.A.K. and G.W.Y. Wang, 2014. Predicting the US bank failure: A discriminant analysis. Economic Analysis and Policy,
44(2): 202-211.
Distinguin, I., A. Tarazi and J. Trinidad, 2011. The use of accounting and stock market data to predict bank financial distress: The
case of East Asian banks. Philippine Management Review, 18: 1-18.
Ecer, F., 2013. Comparing the bank failure prediction performance of neural networks and support vector machines: The Turkish
case. Ekonomska Istrazivanja-Economic Research, 26(3): 81-98.
Fungacova, Z. and L. Weill, 2013. Does competition influence bank failures? Evidence from Russia. Economics of Transition,
21(2): 301-322.
Huang, D.T., B. Chang and Z.C. Liu, 2012. Bank failure prediction models: For the developing and developed countries. Quality
and Quantity, 46(2): 553-558.
Huang, D.T. and Z.C. Liu, 2010. Board composition and corporate value in Taiwan high technology firms. International Journal of
Organizational Innovation, 2(4): 126-138.
Ioannidis, C., F. Pasiouras and C. Zopounidis, 2010. Assessing bank soundness with classification techniques. Omega, 38(5): 345-
357.
Jayadev, M., 2006. Predictive power of financial risk factors: An empirical analysis of default companies. Vikalpa, 31(3): 45-56.
Kiefer, M.V., 2014. Bank failures and mergers in Turkey: 1992-2014. International Journal of Finance and Banking, 1(3): 45-64.
Kim, M.J., D.K. Kang and H.B. Kim, 2015. Geometric mean based boosting algorithm with over-sampling to resolve data
imbalance problem for bankruptcy prediction. Expert Systems with Applications, 42(3): 1074-1082.
Klecka, J. and H. Scholleova, 2010. Bankruptcy models enuntiation for Czech glass making firms. Economics and Management,
15: 954-959.

Asian Economic and Financial Review, 2016, 6(9): 522-533
533
© 2016 AESS Publications. All Rights Reserved.
Li, G., L.W. Sanning and S. Shaffer, 2011. Forecasting bank failures: Timeliness versus number of failures. Applied Economics
Letters, 18(16): 1549-1552.
Lin, S.L., 2010. A two-stage logistic regression-ANN model for the prediction of distress banks: Evidence from 11 emerging
countries. African Journal of Business Management, 4(14): 3149-3168.
Lopez, I.F.J. and S.I. Pastor, 2015. Bankruptcy visualization and prediction using neural networks: A study of U.S. commercial
banks. Expert Systems with Applications, 42(6): 2857-2869.
Maghyereh, A.I. and B. Awartani, 2014. Bank distress prediction: Empirical evidence from the gulf cooperation council countries.
Research in International Business and Finance, 30(1): 126-147.
Martin, A., V. Gayathri, G. Saranya and P.V. Gayathri, 2011. A hybrid model for bankruptcy prediction using genetic algorithm,
fuzzy c-means and mars. International Journal on Soft Computing, 2(1): 12-24.
Öğüt, H., M.M. Doğanay, N.B. Ceylan and R. Aktaş, 2012. Prediction of bank financial strength ratings: The case of Turkey.
Economic Modelling, 29(3): 632-640.
Pasaribu, R.B., 2008. Financial distress prediction in indonesia stock exchange case study of trade industry public company.
Journal of Economics Business and Accounting, 11(2): 153-172.
Pradhan, R., K.K. Pathak and V.P. Singh, 2013. Bankruptcy prediction and neural networks clubbed for Z score analysis of
oriental bank of commerce. International Journal of Research in Computer Engineering and Electronics, 2(1): 1-6.
Rappaport, A., 1995. Creating shareholder value: The new standard for business n performance. New York: The Free Press.
Ravisankar, P. and V. Rav, 2010. Financial distress prediction in banks using group method of data handling neural network,
counter propagation neural network and fuzzy artmap. Knowledge Based Systems, 23(8): 823-831.
Serrano-Cinca, C., 2013. Gutiérrez-Nieto, B. Partial least square discriminant analysis for bankruptcy prediction. Decision Support
Systems, 54(3): 1245-1255.
Shkurti, R. and B. Duraj, 2010. The assessment of the financial soundness of the banking sectors in Balkan countries using early
warning indicators- a comparative study with policy implications. CEA Journal of Economics, 5(1): 33-48.
Stewart, G.B., 1991. The quest for value. New York: Harper Business.
Teker, D., S. Teker and M. Sönmez, 2011. Economic value added performances of publicly owned banks: Evidence from Turkey.
International Research Journal of Finance and Economics, 75: 132-138.
Timo, S. and I. Virtanen, 2001. Economic value added: A simulation analysis of the trendy, owner-oriented management tool.
Acta Wasaensia(90).
Trussel, J. and L. Johnson, 2012. A parsimonious and predictive model of the recent bank failures. Academy of Banking Studies
Journal, 11(1): 15-31.
Valahzaghard, M.K. and M. Bahrami, 2013. Prediction of default probability in banking industry using camels index: A case study
of Iranian banks. Management Science Letters, 3(4): 1113-1118.
Wanke, P., C.P. Barros and J.R. Faria, 2015. Financial distress drivers in Brazilian banks: A dynamic slacks approach. European
Journal of Operational Research, 240(1): 258-268.
Yildiz, B. and S. Akkoc, 2010. Bankruptcy prediction using Neuro fuzzy: An application in Turkish banks. International Research
Journal of Finance and Economics, 60: 114-126.
Zaghdoudi, T., 2013. Bank failure prediction with logistic regression. International Journal of Economics and Financial Issues,
3(2): 537-543.
Views and opinions expressed in this article are the views and opinions of the authors, Asian Economic and Financial Review shall not be
responsible or answerable for any loss, damage or liability etc. caused in relation to/arising out of the use of the content.