Bank Capital: Lessons from the Financial Crisis - IMF · Bank Capital: Lessons from the Financial...
36
Bank Capital: Lessons from the Financial Crisis Asli Demirguc-Kunt, Enrica Detragiache, and Ouarda Merrouche WP/10/286
Transcript of Bank Capital: Lessons from the Financial Crisis - IMF · Bank Capital: Lessons from the Financial...

Bank Capital: Lessons from the Financial Crisis
Asli Demirguc-Kunt, Enrica Detragiache,
and Ouarda Merrouche
WP/10/286

© 2010 International Monetary Fund WP/10/286 IMF Working Paper
INS
Bank Capital: Lessons from the Financial Crisis
Prepared by Asli Demirguc-Kunt, Enrica Detragiache, and Ouarda Merrouche1
December 2010
Abstract
This Working Paper should not be reported as representing the views of the IMF. The views expressed in this Working Paper are those of the author(s) and do not necessarily represent those of the IMF or IMF policy. Working Papers describe research in progress by the author(s) and are published to elicit comments and to further debate.
Using a multi-country panel of banks, we study whether better capitalized banks experienced higher stock returns during the financial crisis. We differentiate among various types of capital ratios: the Basel risk-adjusted ratio; the leverage ratio; the Tier I and Tier II ratios; and the tangible equity ratio. We find several results: (i) before the crisis, differences in capital did not have much impact on stock returns; (ii) during the crisis, a stronger capital position was associated with better stock market performance, most markedly for larger banks; (iii) the relationship between stock returns and capital is stronger when capital is measured by the leverage ratio rather than the risk-adjusted capital ratio; (iv) higher quality forms of capital, such as Tier 1 capital and tangible common equity, were more relevant. JEL Classification Numbers: G21, G28 Keywords: Bank capital, financial crisis, Basel capital accord Author’s E-Mail Address: [email protected]; [email protected];
1 Asli Demirguc-Kunt is Chief Economist, Financial and Private Sector Development Network and Senior Research Manager, Finance and Private Sector, Development Research Group The World Bank. Ouarda Merrouche is an Economist in the Finance and Private Sector, Development Research Group, The World Bank. Demirguc-Kunt is grateful for financial support from the U. K. Department for International Development (DFID). We thank Stijn Claessens, Noel Sacasa, and seminar participants at Williams College and the IMF Institute for useful comments.

2
Contents Page
I. Introduction ............................................................................................................................3
II. Sample Selection, Data Description, And Empirical Model .................................................6
III. The Results...........................................................................................................................9
IV. Conclusions........................................................................................................................15
Tables
1. Bank Stock Returns Before and During the Crisis ..............................................................19 2. Summary Statistics: Capital Ratios ......................................................................................20 3. Correlation Matrix ...............................................................................................................21 4. Stock Market Performance and Bank Capital over the Financial Cycle .............................23 5. Tier 1 and Tier 2 Capital and Tangible Common Equity ....................................................25 6. Stock Market Performance and Structure of Bank Capital over the Financial Cycle: Alternative Definitions of Bank Size and Alternative .......................................................26 7. Stock Market Performance and Bank Leverage: Separate Pre-Crisis and Crisis Regressions ..............................................................................................................27
8. Robustness Check: Weighted Least Squares and Alternative Clustering ............................28 9. Controlling for Recapitalizations .........................................................................................29 10. Sample Split by Initial Capital Levels ...............................................................................30 11. Credit Default Swaps Premia and Bank Capital over the Financial Cycle ........................31
Figures
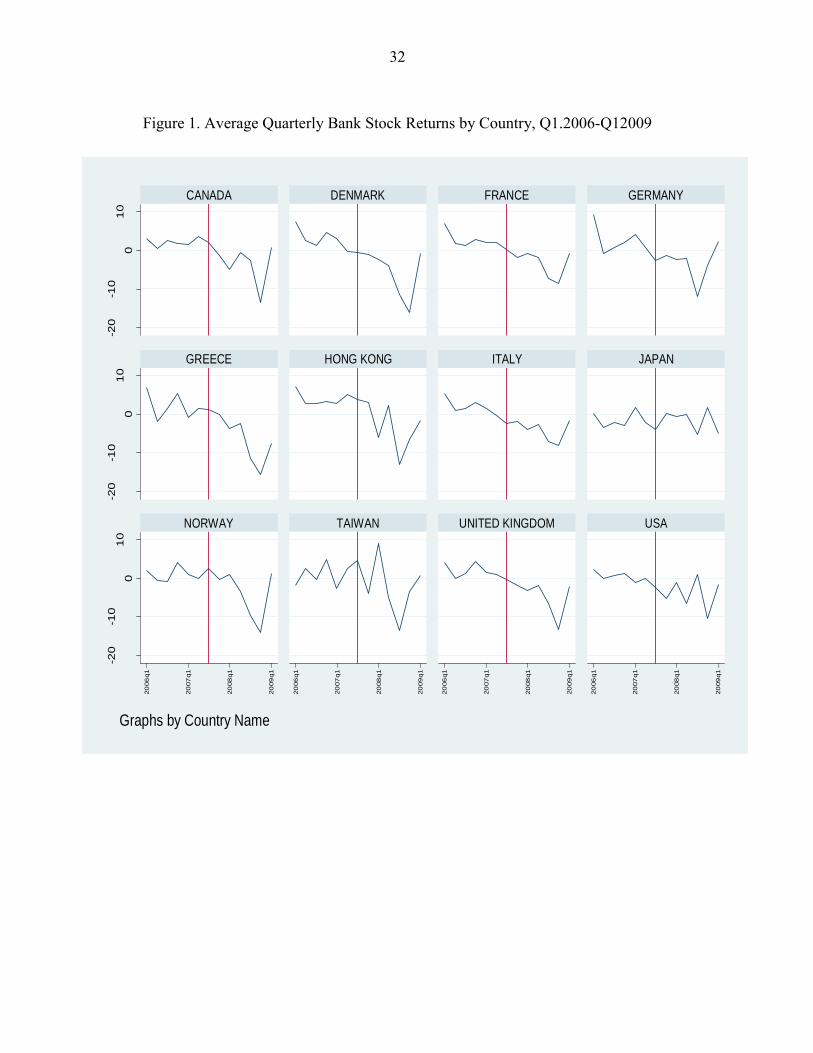
1. Average Quarterly Bank Stock Returns by Country, Q1.2006-Q12009 .............................32 2. Response of Bank Stock Returns to Lagged Bank Capital Before and During the Financial Crisis ..................................................................................................................33
Appendix Tables
1. Sample Coverage .................................................................................................................34 2. Summary Statistics: Control Variables ................................................................................35
References ................................................................................................................................17

3
I. INTRODUCTION
Since the first Basel capital accord in 1988, the prevailing approach to bank regulation has put capital at front and center: more capital should make banks better able to absorb losses with their own resources, without becoming insolvent or necessitating a bailout with public funds. In addition, by forcing bank owners to have some ―skin in the game,‖ minimum capital requirements should curb incentives for excessive risk taking created by limited liability and amplified by deposit insurance and bailout expectations. Over the last 20 years, regulatory capital requirements have been refined and broadened to cover various types of risk, differentiate among asset classes of different risk, and allow for a menu of approaches to determine the risk weights to be applied to each asset category. In the process, the rules have become increasingly elaborate, reflecting the growing complexity of modern banking, but also the need to address ongoing efforts by regulated entities to circumvent the requirements through financial innovation.2 While regulatory consensus has viewed capital as an essential tool to limit risk in banking, there has been less agreement among economic theorists. A number of theoretical models bear out the relationship posited by regulators that minimum capital requirements ameliorate the moral hazard created by deposit insurance (Furlong and Keeley, 1989; Keeley and Furlong, 1990; Rochet, 1992), but others find that such requirements, by reducing the charter value of banks, have the opposite effect (Koehn and Santomero, 1980; Kim and Santomero, 1988). Calem and Rob (1998) reconciles these different views: in a dynamic model in which banks build up capital through retained earnings, this paper shows that when capital is low relative to the regulatory minimum banks choose a very risky loan portfolio to maximize the option value of deposit insurance. As capital increases and future insolvency becomes less likely, on the other hand, incentives to take on risk are curbed by the desire to preserve the bank’s charter value. When banks are so well capitalized that insolvency is remote, an additional increase in capital induces banks to take on more risk to benefit from the upside. In this model, the relationship between bank capital and risk is U-shaped.3 The recent financial crisis undoubtedly demonstrated that existing capital regulation, in its design or implementation, was inadequate to prevent a panic in the financial sector, and once again governments around the world had to step in with emergency support to prevent a
2 See Caprio and Honohan (1999) for a discussion.
3 Diamond and Rajan (2000) presents a theory of bank capital in a framework that also explains why financial intermediaries exist. In this theory, capital helps bank deal with unexpected withdrawals from depositors, but increases ex post rent extraction from borrowers, which is undesirable ex ante. For a review of the literature on bank capital, see for instance Santos (2001).
4
collapse.4 Many of the banks that were rescued appeared to be in compliance with minimum capital requirements shortly before and even during the crisis. In the ensuing debate over how to strengthen regulation, capital continues to play an important role. A consensus is being forged around a new set of capital standards (Basel III), with the goal of making capital requirements more stringent.5 In this paper we try to make a contribution to understanding the role of bank capital by studying whether banks that were better capitalized experienced a smaller decline in their stock market value during the financial crisis. If bank capital truly helps curbing bank risk-taking incentives and absorbing losses, we would expect that, when a large, unexpected negative shock to bank value materializes – as was the case with the financial crisis that began in August 2007 – equity market participants would judge better capitalized banks to be in a better position to withstand the shock, and the stock price of these banks would not fall as much as that of poorly capitalized banks. A second question that we address in the paper is which concept of capital was more relevant to stock valuation during the crisis. Existing capital requirements are set as a proportion of risk exposure; but if the risk exposure calculation under Basel rules did not reflect actual risk, capital measures based on cruder risk-exposure proxies, such as total assets, may be have been considered as more meaningful by equity traders (Blum, 2007). A third issue is the types of instrument that are counted as capital for regulatory purposes. As recognized by the Basel Committee (2009), under current standards some banks were able to show strong capitalization while holding a limited amount of tangible common equity, which is the component of capital that is available to absorb losses while the bank remains a going concern. In our regressions, we test whether banks with higher quality capital were viewed more positively by equity market participants.
4 See, for instance, Viñals et al. (2010), Caprio, Demirgüç-Kunt and Kane (2010), Demirgüç-Kunt and Serven (2010), and Merrouche and Nier (2010).
5 In July 2010, the Basel Committee agreed to introduce a Tier 1 leverage ratio of 3 percent on a trial basis, and later on, in September 2010, it formulated new, strengthened risk-adjusted capital requirements. Specifically, the common equity ratio will increase from 2 to 4.5 percent, with an additional counter-cyclical buffer of 0-2.5 percent at the discretion of country supervisors. In addition, banks will be required to hold a ―capital conservation‖ buffer of an additional 2.5 percent of common equity, bringing the total to 7 percent. The Tier 1 capital requirement will increase to 6 percent from 4 percent, while the total risk-adjusted capital requirement will remain unchanged at the existing 8 percent level. Banks will be able to meet the difference between the total capital requirement and the Tier 1 requirement with Tier 2 capital. Definitions of various forms of capital have also become more stringent. Particularly, there will be stronger limits on the amount of intangible capital (mortgage servicing rights, deferred tax assets, minority interests). All changes will be phased in gradually, and the transition will have to be completed by 2019.
5
Because we use a panel of banks from several countries, in our tests we can use country-time dummy variables to control for all country and time-specific factors potentially affecting stock returns, including differences in interest rates and other macroeconomic variables, the severity of the financial crisis and its economic repercussions across countries, different policy responses by the authorities, different quality of bank regulation and supervision, and differences in accounting and regulatory standards. This approach greatly reduces concerns about possible omitted variables. We find support for the hypothesis that better capitalized banks experienced a smaller decline in their equity value during the crisis. However, the effect is large and robust only for a subsample comprising the larger banks. For this group, we also find that stock returns during the crisis were more sensitive to the leverage ratio than to the risk-adjusted Basel ratio, an indication that market participants may have viewed the risk-adjustment under Basel as uninformative during the crisis. Finally, we also find some evidence that Tier 1 capital was seen as the more relevant notion of capital, especially in the sample of larger banks. Our dependent variable, the stock return, is an imperfect proxy for bank performance during a crisis because it reflects changes in value to stockholders only, and does not reflect changes in the value of debt. In addition, the expectation of government support packages may have blurred the effects of the crisis on bank values. While recognizing these limitations, we believe that changes in equity values are informative as to the differential effects of the crisis on bank value. Also, to explore a possible effect of capital on the value of debt, we test whether bank capitalization explained changes in bank CDS premiums during the crisis, and we find no significant effects. Our paper is related to work by Estrella, Park, and Peristiani (2000) that tests how alternative capital ratios fared in predicting U.S. bank failures in the early 1990s, and finds that a leverage ratio performs just as well as a risk-adjusted measure of capital. Berger and Bouwman (2009) explore the relationship between bank capital and different aspects of banks performance in crises and tranquil times for U.S. banks. Crises include both banking crises and stock market crashes. Among the tests is a comparison of excess stock returns on a portfolio of well capitalized banks and one of poorly capitalized banks during the recession of the early 1990s and during the recent subprime crisis. According to this study, better capitalized banks did significantly better in the early 1990s, but not in the recent crisis. The study does not explore the potentially different role of alternative concepts of bank capital. Acharya et al. (2010) develop new measures of systemic risk for individual financial institutions, and test the ability of these measures to explain crisis performance of U.S. financial firms. Finally, Beltratti and Stulz (2009) examine how differences in bank corporate governance and country-level regulatory approaches affected bank stock returns in the financial crisis. The main findings are that banks with a board of directors that is less shareholder-oriented and banks that are located in countries with strong capital regulation

6
performed better. Consistent with our results, this study also finds that higher capital is associated with better stock market performance. The paper is structured as follows: the next section presents the data and the empirical model. Section III contains the main results. Section IV concludes.
II. SAMPLE SELECTION, DATA DESCRIPTION, AND EMPIRICAL MODEL
Sample Selection
We start with the all the banks in the Bankscope database that are listed and hence have a stock price. We then exclude banks for which no information is available on capital or other explanatory variables as well as a few banks from countries in the Persian Gulf where the financial crisis followed a different time pattern than the rest of the sample. In addition, since we rely on intra-country variation to identify the relationships of interest, we exclude from the sample countries/dates for which we have less than five banks in the sample. The baseline sample includes a total of 381 banks in 12 economies during the period Q1.2005-Q1.2009.
Not all banks enter the sample in every quarter, so the sample is unbalanced. The sample size in each quarter varies between 273 and 313.6 Appendix Table 1 lists the countries in our sample and indicators of coverage. All the countries in the sample are advanced countries, and U.S. and Japanese banks dominate the sample. In a robustness test, we estimate the model with weighed least squares to check whether this characteristic of the sample matters, and we find that it does not. The ratio of total assets of the banks in our sample to GDP varies between about 144 percent (Hong Kong) and 18 percent (U.S.), with an average of 45 percent of GDP. Throughout the paper, we also show estimation results for a subsample including only very large banks, i.e. banks with assets above US$50 billion. This sample includes a total of 91 banks from 8 countries (with sample size in each quarter between 58 and 66 banks). It accounts for about 20 percent of the number of banks and 65 percent of total assets of the full sample. The rationale for focusing on the largest banks is that typically these are the more sophisticated institutions that operate on a global scale with complex balance sheets. Thus, these may be the banks with more opaque assets and in a better position to skirt capital regulation through regulatory arbitrage. In addition, large banks are key to the stability of the system as a whole.
6 Only two banks in our sample were closed down during our sample period (both of them U.S. banks), so attrition bias should not be a serious concern.

7
The Empirical Model
We estimate various versions of the following basic equation:
where yijt is the change in the bank’s stock price between the end of quarter t-1 and the end of quarter t, the α’s, β’s, and γ’s are coefficients to be estimated, djt is a matrix of country/time dummy variables, kijt-1 is bank capital, the variables we are mostly interested in, Xijt-1 is a matrix of bank-level control variables. dnoncrisis is a dummy variable taking the value of one for the quarters preceding the financial crisis, i.e. Q1.2006-Q2.2007, while dcrisis is a dummy variable for quarters during which the financial crisis was unfolding, namely Q3.2007-Q1.2009. Finally, uijt is a disturbance term.7 Through the interaction term with the crisis dummy we allow the effect of the various explanatory variables on stock returns to differ during the crisis period. In one of the robustness tests, we estimate a specification where a separate crisis period is identified as the period following the Lehman default (Q3.2008-Q1.2009).
The country/year dummy variables control for any possible omitted effect that operates at the country level, such as macroeconomic shocks, the systemic component of the shock to bank equity prices, the policy response to the crisis, differences in accounting and regulatory definition of capital across countries and so on. In other words, what our model seeks to explain is just the cross-sectional, within-country dispersion in stock returns in each quarter. To isolate the effect of capital on this dispersion, we control for other bank-specific characteristics that may affect stock returns. Specifically, we control for bank liquidity using liquid assets/assets; the bank’s reliance on deposits for funding (deposits/total assets), asset quality (loans loss provisions/total assets), the banks’ business model (net loans/assets), and the bank size (log of total assets). Also, following standard asset pricing models, we include in the regression the stock’s beta (computed as the five-year covariance between the bank’s monthly stock return and the country stock market return) and the market-to-book value of equity.8 The price-earnings ratio (PE) measure possible mispricing of bank equity during the boom.
7 For a similar empirical model relating stock returns during the financial crisis to firm characteristics, see Tong and Wei (forthcoming).
8 For a discussion of why it is desirable to include these variables directly in the regressions as firm characteristics rather than going through a factor model, see Tong and Wei (forthcoming) and Whited and Wu (2006).
jt
ijtijtcrisisijtcrisisijtnoncrisisijtnoncrisisjtjtijt uXdkdXdkddy )*()*()*()*( 12
12
11
11
8
Explanatory variables computed from bank balance sheet information, including the variables measuring bank capital, are available on a yearly basis rather than a quarterly basis, while our dependent variable is quarterly. For these variables, we use the last available (but not contemporaneous) observation. For example, stock returns during each of the four quarters of 2007 are regressed on balance sheet variables at the end of 2006. The model is estimated with OLS, and standard errors are clustered at the bank level to take into account possible autocorrelation in the residuals. In robustness test, we check whether clustering at the country level or by quarter changes the standard errors substantially, and conclude that it does not.9 Overview of the Data
Table 1 shows summary statistics for the distribution of stock returns during the sample period for the full sample and for the sample of larger banks. Average quarterly stock returns are also plotted in Figure 1 for each of the countries in the sample. Median quarterly stock returns are positive in the pre-crisis period and, as expected, become negative in the third quarter of 2007, with a median quarterly decline of 2.6 percent in the full sample and 3.5 percent in the sample of larger banks. Returns are also much more dispersed during the crisis than in tranquil times, with the standard deviation more than doubling. The post-Lehman quarters show even more negative stock returns and somewhat higher dispersion. The main variable of interest is bank capital. As discussed in the introduction, we use a number of alternative definitions of capital: (1) the risk-adjusted regulatory capital ratio, calculated according to Basel rules. This is calculated as the sum of Tier 1 and Tier 2 capital divided by risk-adjusted assets and off-balance sheet exposures; (2) the Tier 1 regulatory ratio, which excludes Tier 2 capital from the numerator; (3) the leverage ratio (defined as regulatory capital divided by total assets); (4) the Tier 1 ratio and Tier 2 leverage ratio; and (5) the tangible common equity ratio (defined as tangible equity divided by tangible assets). Tier 1 capital comprises shareholder funds and perpetual, non-cumulative preference shares. Tier 2 capital comprises hybrid capital, subordinated debt, loan loss reserves, and valuation reserves. In the debate following the crisis, questions about the ability of the risk-adjustment used in the Basel framework to capture bank risk have been raised. Also, the increased reliance by banks (especially large banks) on lower quality capital such as non-tangible equity and Tier 2 capital has been criticized because this type of capital cannot be used to offset losses in times of distress.10 Non-tangible common equity includes tax deferred assets, mortgage servicing rights, minority interest in financial intermediaries and other items.
9 See Petersen (2009) for a study of alternative standard errors in finance datasets.
10 See for example, Viñals et al. (2010).

9
Under the new Basel III rules, intangible capital will be limited to a maximum of 15 percent of regulatory capital. Table 2 shows summary statistics on bank capital in our samples. Summary statistics for the other explanatory variables are in Appendix Table 2. For the full sample, the median risk-adjusted capital asset ratio was 11.9 percent, comfortably above the minimum Basel requirement of 8 percent, with a standard deviation of 2.8 percent. The median Tier 1 capital was a seemingly healthy 9.7 percent. The median leverage ratio was 7.8 percent, and the tangible common equity ratio was 6.7 percent. Interestingly, larger banks had lower capital than the full sample as measured by the tangible equity ratio (a median of just 4.1 percent), the leverage ratio (a median of 6.5 percent), or the Tier1 risk-adjusted ratio (8.2 percent). The standard Basel capital ratio, on the other hand, barely differed between the two groups of banks. Thus, larger banks were relying more heavily on lower quality capital and had larger ―risk-adjustments‖ of assets than smaller banks. In Table 3 we report correlations among stock returns, the various (lagged) capital ratios, and the other explanatory variables. Interestingly, there is a strong negative correlation between capital and bank size, particularly the Tier 1 leverage ratio. The regulatory ratio (RWR) and the leverage ratio (LR) have a correlation of 63 percent in the full sample and of only 31 percent in the large bank sample. In general, correlations among the various notions of capital tend to be lower for the sample of larger banks.
III. THE RESULTS
Results from the Baseline Model
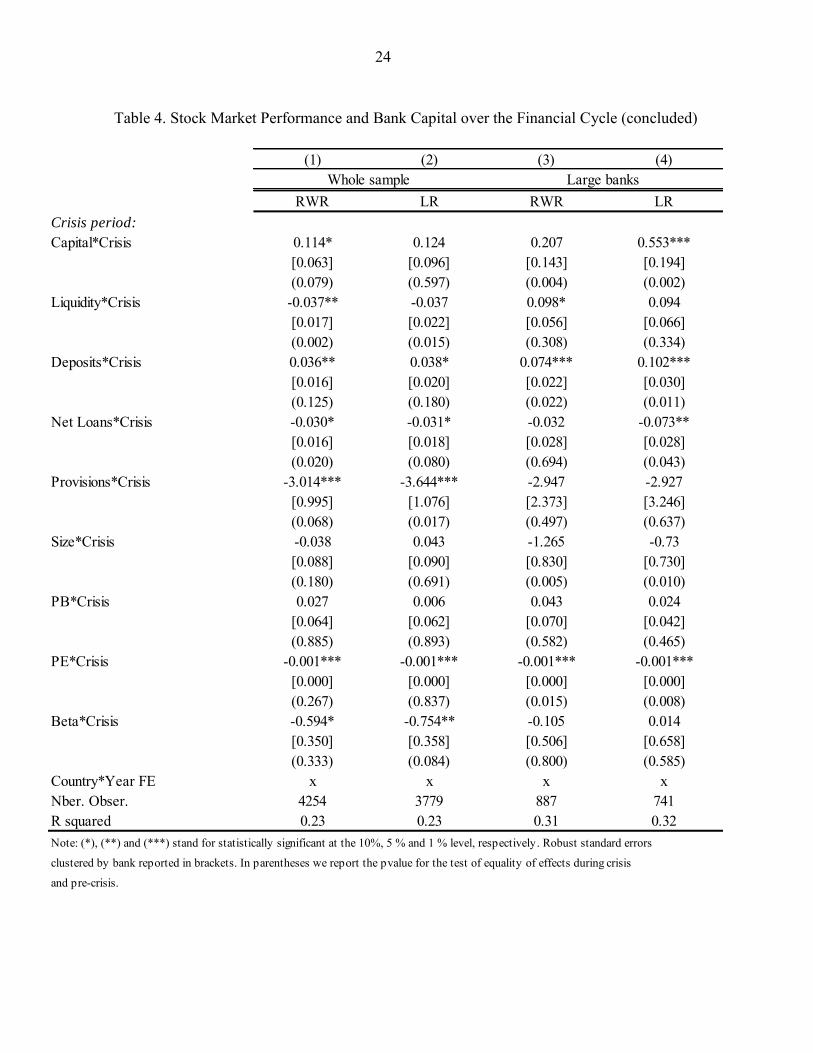
Table 4 contains estimation results for the baseline model for the full sample and the sample of larger banks. The model allows the coefficient of all explanatory variables to differ among the pre-crisis and the crisis period, and the table also reports tests for the equality of the crisis and pre-crisis coefficients. Before the crisis, several of the explanatory variables appeared to significantly affect stock returns: banks with lower loan loss provisions, a higher market-to-book ratio, and a lower P/E ratio had higher stock returns. Also, among large banks more liquidity was associated with higher returns. As for capital, there is some evidence that higher capital (measured by the leverage ratio) resulted in higher stock returns in the full sample, but the coefficient is small and the statistical significance marginal. During the crisis, the relationship between stock returns and bank characteristics changed markedly. More reliance on deposit funding was rewarded by the stock market, not surprisingly given the disruptions in wholesale funding markets throughout the crisis. On the other hand, the standard liquidity ratio has a negative and significant coefficient in one specification. Perhaps this reflects the fact that liquid assets were associated with holdings of

10
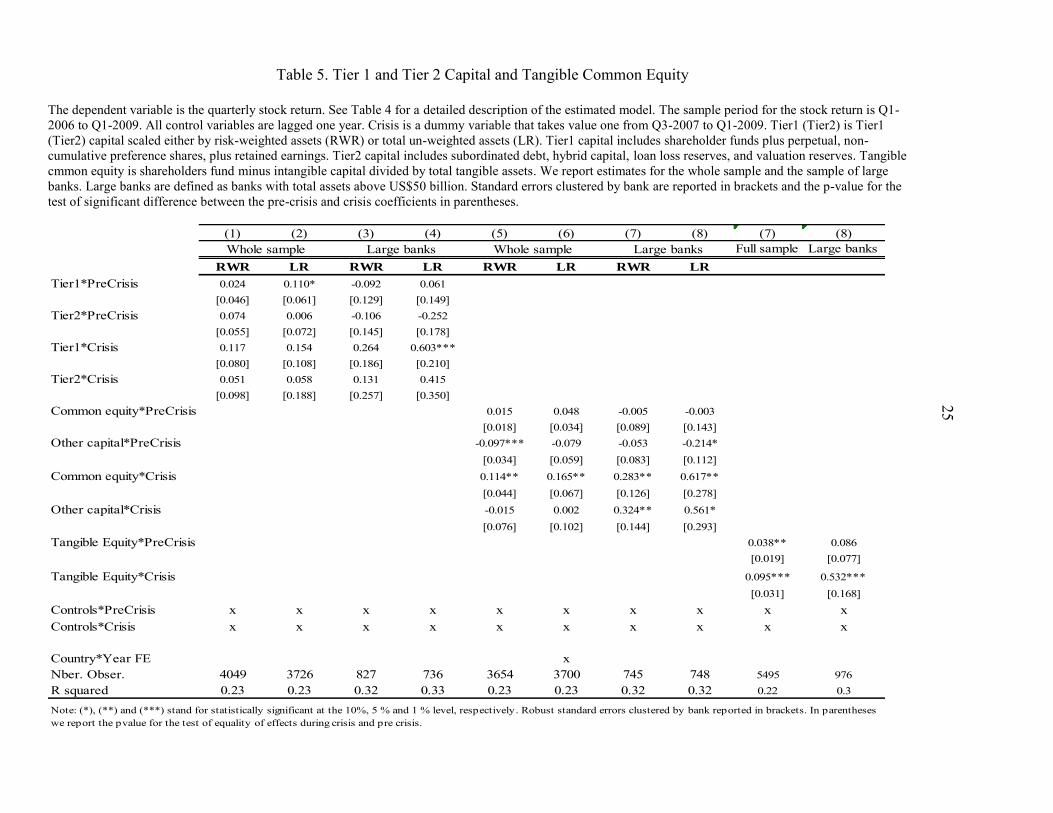
mortgage-backed securities that were at the center of the asset quality deterioration and quickly became illiquid once the crisis started (Basel Committee on Bank Supervision, 2009). Also, liquidity during a crisis may capture the extent of liquidity support by the Central Bank, a signal of trouble. The coefficient of loan loss provisions becomes much larger in the full sample, although it remains insignificant for the larger banks. The market-to-book ratio is no longer significant in the full sample. Turning to capital, the Basel ratio is positive and (marginally) significant in the full sample during the crisis. Based on our estimates, an increase in this ratio by one percentage point increases quarterly stock returns by 11 basis points, a relatively small effect. The leverage ratio is not significant in the full sample. Among the largest banks, on the other hand, the leverage ratio has a positive and strongly significant coefficient in the crisis while the Basel ratio is insignificant. As to the magnitude of the effect, for the large banks increasing the leverage ratio by one percentage point would have resulted in an additional 55 basis points in stock returns per quarter, or 12 percent of the median quarterly decline of 4.7 percent. The finding that the leverage ratio is significant while the regulatory ratio is not for large banks may suggest that market participants did not view the risk-adjustment under Basel as informative in capturing the true risk in bank portfolios during the crisis. This also suggests that the differences in stock returns among large banks with different capital levels did not just reflect expectations about actions by regulators (such as decisions to close or merge undercapitalized banks, or demand additional capital), as such decisions would presumably have been taken on the basis of shortfalls in regulatory capital. Rather, capital mattered because of its ability to absorb losses as well as its possible role as a signal of bank asset quality. When we split capital into Tier 1 and Tier 2 (Table 5), it is Tier 1 leverage that remains significant, suggesting that market participants focused more on the component of capital that is available to absorb losses while the bank continues as a going concern. In the last four columns of Table 5 we measure capital using the ratio of tangible common equity to tangible capital. When we do this, for the full sample capital is significant both before the crisis and during the crisis, but the coefficient is small. For the large bank sample, the coefficient is significant and large in magnitude during the crisis, consistent with the results for Tier 1 leverage. To summarize, we find evidence that during the crisis stock market investors placed higher value on better capitalized banks, while they did not do so before the crisis. The evidence is particularly strong for the leverage ratio in the sample of large banks. Differences in the Basel ratio do not explain differences in crisis stock returns for this group of banks, while they have limited explanatory power in the full sample.

11
To gain a better understanding of the timing of the effects under consideration, we have estimated our empirical model separately for each quarter, and plotted the estimated regression coefficients of capital and their 10 percent confidence interval in Figure 2. We do this exercise for the two concepts of capital (regulatory ratio and leverage ratio) and for the two samples (full sample and large banks only). The charts show that the ―sensitivity‖ of stock returns to bank capital was negligible before the crisis, and it became stronger as the crisis progressed, until the third quarter of 2008. The strongest effect is for the leverage ratio during the period Q4.2007-Q2.2008 in the sample of large banks. Robustness Tests
In our benchmark specification we identify large banks based on total assets. However, because of the growing securitization business, asset size may be an inaccurate measure of bank activities. An alternative proxy for bank size is total operating income (interest income plus non-interest income). In the regressions in Table 6, we define as large banks those with operating income above US$1 billion (top 20th percentile) and re-estimate the baseline model. The results remain stronger for leverage ratio and for the Tier 1 ratio, consistent with the baseline regressions. As a robustness test, we also estimate a regression in which capital is measured by Basel ratio and the ratio of risk-adjusted assets to total assets is introduced as an additional regressor. The results show that during the crisis large banks that had reported a higher ratio of risk-adjusted assets to total assets experienced significantly higher stock returns, suggesting that the market viewed the risk-adjustment under the Basel rules as not fully credible for these banks. For the full sample, the ratio is positive and in the pre-crisis quarters, a somewhat puzzling finding. In any case, the effect is small in magnitude. In Table 7 we estimate a slightly different version of the baseline regressions as an additional robustness test. Instead of carrying out the estimation for the full sample period and two separate samples (all banks and large banks), we estimate the model separately for the pre-crisis and the crisis period, and interact the coefficients of the explanatory variables with a large-bank dummy and a small-bank dummy (with the dummy switching value for banks with asset size above US$50 billion). In an additional exercise, we run a regression for the period following the Lehman bankruptcy only, to test whether the effect of capital on stock returns differed during the most acute phase of the financial crisis. The results tend to confirm our earlier findings: capital becomes more important during the crisis, and the strongest effect is that of the Tier 1 leverage ratio on stock returns of large banks. During the post-Lehman quarter, the coefficient of Tier 1 leverage for large banks is larger than in the full crisis period, suggesting that capital was affecting stock returns particularly strongly during this period.

12
In Table 8 we estimate the baseline regression using alternative estimation techniques. In the first four columns, we use weighted least squares to address possible problems with the sample composition being uneven. Though the coefficients are very similar to the OLS coefficients, the standard errors change a bit, and now the coefficients of Tier 1 capital (both the Basel ratio and the leverage ratio) during the crisis are significantly positive (albeit small in magnitude) for the full sample. As before, the Tier 1 leverage ratio has a positive and sizable impact on stock returns for large banks. In the second part of the table, we show standard errors clustered by country rather than bank. Clustering by the higher level of aggregation is generally preferable (Cameron et al., 2006), but it can give rise to distortions if the number of clusters is small and the cluster size is uneven, as is the case with our sample (Nichols and Shaffer, 2007). The results are very similar to those obtained through weighted least square estimation. Finally, in the third part of the table we cluster the standard errors by quarter. Again, we find that the baseline results do not change much. The main difference is that now the leverage ratio in crisis is significant also for the full sample.11 Finally, we estimate a specification with a dummy variable that takes the value of one if a bank has been recapitalized with government funds in a given quarter (Table 9). To identify banks that received public funds we used several sources including press articles, official documents posted online, information from central banks’ Financial Stability Report, and Treasury websites. In some countries (e.g. the U.K.) the plans were targeted to systemically important institutions, while in others (e.g. the U.S.) all banks were allowed to participate provided they fulfilled certain criteria. All in all, we identify 95 banks that were recapitalized in the full sample, of which 25 also belong to the sample of larger banks. While, the recapitalization dummy is negative and significant, indicating that stock returns for the recapitalized banks were particularly low in the quarter in which the recapitalization occurred, the relationship between capital and stock returns does not change relative to the baseline.12 To summarize, we find robust evidence that differences in the Tier 1 leverage ratio help explaining differences in stock returns during the financial crisis in a sample of large banks. For a broader sample including all listed banks with available information, the results are more mixed: there is some evidence that capital mattered during the crisis, but the evidence is 11 Using a dataset of monthly U.S. stock prices and balance sheet variables from Daniel and Titman (2008), Petersen (2009) finds that standard errors clustered by time are much larger than standard errors clustered by firm, and recommends clustering by time. In our dataset, however, there appears to be little difference. Petersen also points out that clustering by time is similar to using Fama-Macbeth regressions. 12 The negative coefficient of the recapitalization dummy may indicate that recapitalization diluted shareholders or that it signaled bad news about the future profitability of the bank.

13
not as robust as for large banks, and it does not look like the market was clearly differentiating between the regulatory ratio and the leverage ratio. Why Does Capital Affect Stock Returns Only Among Large Banks?
These results raise the question of why the leverage ratio matters for equity prices especially in the sample of larger banks. One possible interpretation is that larger banks with complex operations have more opportunities to take advantage of ―regulatory arbitrage‖ and distort the risk exposure measure used by regulators to compute capital adequacy. Also, capital’s role as a signal of a bank’s exposure to toxic assets may have been more important in the case of large banks, whose balance sheets are more opaque than those of small banks. Another interpretation is based on the Calem-Rob model. If we measure capitalization based on ―high quality‖ capital such as the Tier1 ratio or the tangible common equity ratio, the larger banks in our sample were less well capitalized than the smaller banks, as pointed out in the previous section.13 The Calem-Rob model predicts that, at low levels of capitalization, bank risk-taking is a decreasing function of capital, while for strongly capitalized banks the relationship has the opposite sign. If we take the size of the decline in stock prices during the crisis as a measure of the market’s view of how much risk a bank had taken during the good times, then the Caleb-Rob model would predict a positive relationship between capital and stock returns for less well-capitalized banks but not for better capitalized banks, which is what we find. To explore this interpretation further, in Table 10 we rerun the baseline regressions splitting the sample based on the level of capitalization at the end of 2006. Interestingly, for banks with capital above the median, higher capital did not translate into better stock performance during the crisis. On the other hand, for less well capitalized banks higher capital did result in a higher stock returns during the crisis. For this sample split, we do not see a distinction between the Basel ratio and the leverage ratio or between Tier 1 and Tier 2 capital. All in all, these findings are consistent with the implications of the Caleb-Rob model, namely that a negative relationship between risk and capital should appear only for weakly capitalized banks. CDS Spreads and Bank Capital
As an alternative measure of bank performance, we examine the premium on the 5-year senior tranche MR credit default swap (the most liquid) from MarKit. CDS spreads are widely used as indicators of default risk in pricing other securities, such as bonds or even equity (European Central Bank, 2009). While CDS spreads have the advantage that they 13 For instance, the median common equity ratio is 6.2 percent in the full sample but only 4.1 percent in the large bank sample.
14
capture expected losses to bank creditors rather than shareholders, relying on CDS spreads results in a much smaller sample of banks. Specifically, there are only 33 banks covered by Bankscope for which CDS spreads are available, and additional data requirements restrict the sample to less than 30 banks. The sample period is the same as for stock returns, namely Q1.2006-Q1.2009. Another potential drawback of using CDS spreads as indicators of bank performance is that the market was disrupted during the financial crisis, especially after the Lehman bankruptcy, potentially hampering the information content of the spreads (European Central Bank, 2009).14 Summary statistics for the CDS sample are in the Appendix, Table A3. The characteristics of these banks are quite similar to those of the large bank sample of the previous sections. The median change in the CDS spread over the pre-crisis period was minus six basis points, while during the crisis period the median increase was 167 basis points. The median increase in the spread was even more pronounced in the quarters after the Lehman bankruptcy (246 basis points). As in the case of stock returns, the dispersion of spread changes also increased sharply during the crisis. The empirical model is similar to that used to explain corporate CDS spreads by Ericsson, Jacobs, and Oviedo (2009), which is in turn inspired by the corporate bond spread models of Campbell and Taksler (2003) and Cremer, Driessen, Maenhout, and Weinbaum (2004). In a simple linear regression framework, changes in the CDS spread are regressed on changes in the bank’s leverage, defined as the book value of the bank’s debt divided by the sum of the book value of debt plus the book value of equity, the change in stock price volatility, and changes in the yield on the risk-free asset.15 According to the theory, an increase in the default probability (an increase in the CDS premium) should be increasing in the bank’s leverage and in the variability of its expected future cash flows (proxied by equity volatility), and it should be decreasing in the risk-free interest rate. Since we are interested in the role of capital, we add to these three variables various lagged measures of bank capital, as in the previous sections. We also allow the coefficients of the capital ratios to differ between crisis and non-crisis periods. Finally, in these regressions we control for region/time fixed effects rather than country/time fixed effects because we do not have a sufficiently large number of banks per country. Of course, we expected better capitalized banks to experience a smaller increase in the CDS premium during the crisis than weakly capitalized banks.
14 The notional amounts of CDS contracts fell by 25 per cent between June and December 2008, as concerns about counterparty risk grew. Hart and Zingales (2009) argues that CDS contracts should be traded on an exchange where the counterparty risk can be minimized, and the positions of the various parties are transparently disclosed. 15 The bank’s leverage (ratio of debt to assets) should not be confused with its leverage ratio (ratio of book capital to assets).
15
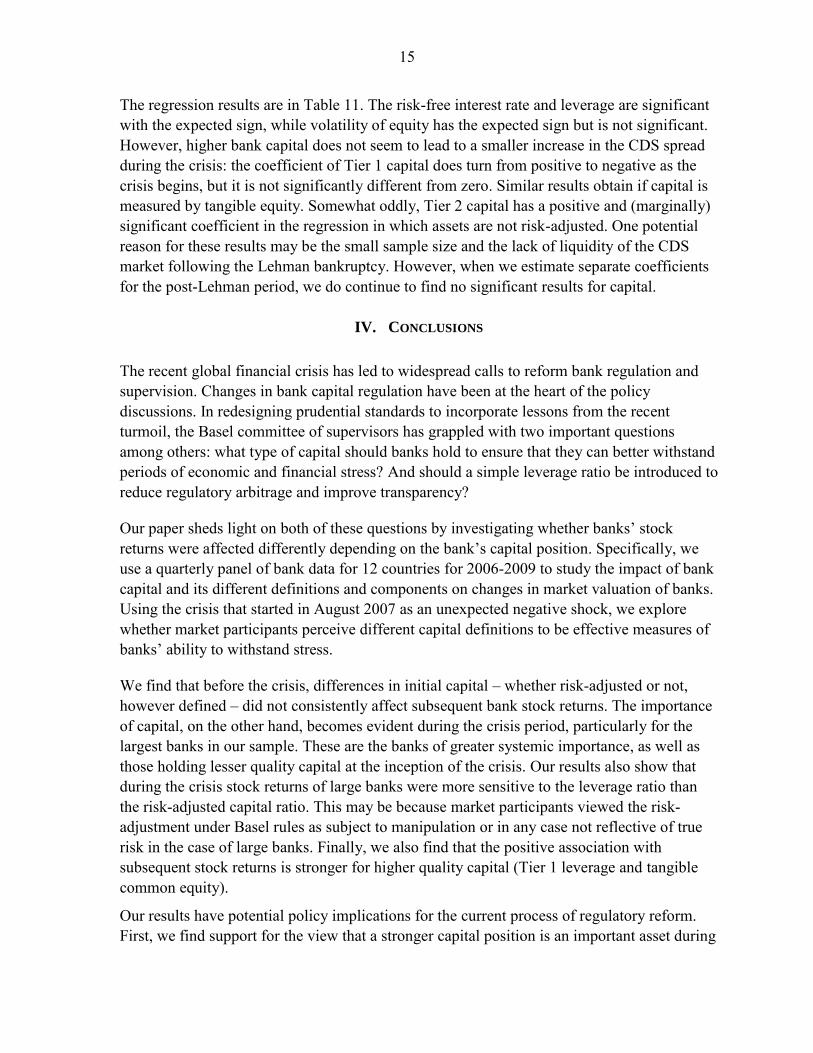
The regression results are in Table 11. The risk-free interest rate and leverage are significant with the expected sign, while volatility of equity has the expected sign but is not significant. However, higher bank capital does not seem to lead to a smaller increase in the CDS spread during the crisis: the coefficient of Tier 1 capital does turn from positive to negative as the crisis begins, but it is not significantly different from zero. Similar results obtain if capital is measured by tangible equity. Somewhat oddly, Tier 2 capital has a positive and (marginally) significant coefficient in the regression in which assets are not risk-adjusted. One potential reason for these results may be the small sample size and the lack of liquidity of the CDS market following the Lehman bankruptcy. However, when we estimate separate coefficients for the post-Lehman period, we do continue to find no significant results for capital.
IV. CONCLUSIONS
The recent global financial crisis has led to widespread calls to reform bank regulation and supervision. Changes in bank capital regulation have been at the heart of the policy discussions. In redesigning prudential standards to incorporate lessons from the recent turmoil, the Basel committee of supervisors has grappled with two important questions among others: what type of capital should banks hold to ensure that they can better withstand periods of economic and financial stress? And should a simple leverage ratio be introduced to reduce regulatory arbitrage and improve transparency?
Our paper sheds light on both of these questions by investigating whether banks’ stock returns were affected differently depending on the bank’s capital position. Specifically, we use a quarterly panel of bank data for 12 countries for 2006-2009 to study the impact of bank capital and its different definitions and components on changes in market valuation of banks. Using the crisis that started in August 2007 as an unexpected negative shock, we explore whether market participants perceive different capital definitions to be effective measures of banks’ ability to withstand stress.
We find that before the crisis, differences in initial capital – whether risk-adjusted or not, however defined – did not consistently affect subsequent bank stock returns. The importance of capital, on the other hand, becomes evident during the crisis period, particularly for the largest banks in our sample. These are the banks of greater systemic importance, as well as those holding lesser quality capital at the inception of the crisis. Our results also show that during the crisis stock returns of large banks were more sensitive to the leverage ratio than the risk-adjusted capital ratio. This may be because market participants viewed the risk-adjustment under Basel rules as subject to manipulation or in any case not reflective of true risk in the case of large banks. Finally, we also find that the positive association with subsequent stock returns is stronger for higher quality capital (Tier 1 leverage and tangible common equity).
Our results have potential policy implications for the current process of regulatory reform. First, we find support for the view that a stronger capital position is an important asset during

16
a systemic crisis, suggesting that the current emphasis on strengthening capital requirements is broadly appropriate. Second, our results indicate that the introduction of a minimum leverage ratio to supplement minimum risk-adjusted capital requirements is important, as properly measuring risk exposure is very difficult especially for large and complex financial organizations. Finally, our study indicates that greater emphasis on ―higher quality capital‖ in
the form of Tier 1 capital or tangible equity is appropriate.

17
REFERENCES
Acharya, Viral V., Lasse H. Pedersen, Thomas Philippon, and Matthew Richardson, 2010, Measuring Systemic Risk, unpublished manuscript, New York University, Stern School of Business.
Basel Committee on Banking Supervision, 2009, Consultative Proposals to Strengthen the
Resilience of the Banking Sector, Bank of International Settlements, http:// www.bis.org/ press/p091217.htm.
Berger, Allen N., and Christa H. S. Bouwman, 2009, Bank Capital, Performance, and
Survival around Financial Crises, unpublished manuscript. Betratti, Andrea, and Rene’ M. Stulz, 2009, Why Did Some Banks Perform Better During the
Credit Crisis? A Cross-Country Study of the Impact of Governance and Regulation, Fischer College of Business Working Paper 2009-12, Ohio State University.
Blum, M. Jürg, 2007, Why Basel II May Need a Leverage Ratio Restriction, Swiss National
Bank Working Paper 2007-4. Calem, Paul, and Rafael Rob, 1999, The Impact of Capital-Based Regulation on Bank Risk-
Taking, Journal of Financial Intermediation, 8, 317-352. Cameron, Colin A., Jonas B. Gelbach, and Douglas L. Miller, 2006, Robust Inference with
Multi-Way Clustering, NBER Technical Working Paper 327. Campbell, John. T., and G. B. Taksler, 2003, ―Equity Volatility and Corporate Bond Yields,‖
Journal of Finance, 58, 2321—2349 Caprio, Gerard, and Patrick Honohan, 1999, Beyond Capital Ideas: Restoring Banking
Stability, World Bank Policy Research Working Paper No. 2235. Caprio, Gerard, Asli Demirgüç-Kunt, and Edward Kane. 2010. ―The 2007 Meltdown in
Structured Securitization: Searching for Lessons, not Scapegoats.‖ The World Bank
Research Observer 25(1): 125-155. Collin-Dufresne, P., R. Goldstein, and S. Martin, 2001, ―The Determinants of Credit Spread
Changes,‖ Journal of Finance, 56, 2177—2207 Daniel, Kent, and Sheridan Titman, 2006, Market Reactions to Tangible and Intangible
Information, Journal of Finance, 61, 1605-1643. Demirgüç-Kunt, Asli, and Luis Serven. 2010. ―Are All Sacred Cows Dead? Implications of
the Financial Crisis for Macro and Financial Policies.‖ The World Bank Research Observer 25(1): 91-124.
18
Diamond, Douglas W., and Raghuram Rajan, 2000, A Theory of Bank Capital, Journal of
Finance, Ericsson, Jan, Kris Jacobs, and Rodolfo Oviedo, 2009, The Determinants of Credit Default
Swap Premia, Journal of Financial and Quantitative Analysis, 44, 109-132. Fama, Eugene F., and Kenneth R. French, 1992, ―The Cross-Section of Expected Stock
Returns,‖ Journal of Finance, vol. 47(2), pp. 427-465. Furlong, F. T., and M. C. Keeley, 1989, Capital Regulation and Bank Risk-Taking: A Note,
Journal of Banking and Finance, 13, 883-891. Hart, Oliver and Luigi Zingales, 2009, A New Capital Regulation for Large Financial
Institutions, University of Chicago mimeo. Keeley, M. C., and F. T. Furlong, 1990, A Re-Examination of the Mean-Variance Analysis
of Bank Capital Regulation, Journal of Banking and Finance, 15, 69-84. Koehn, M. and Anthony M. Santomero, 1980, Regulation of Bank Capital and Portfolio
Risk, Journal of Finance, 35, 1235-1244. Merrouche, Ouarda and Erland Nier, 2010, What Caused the Global Financial Crisis?
Evidence on Drivers of Financial Imbalances 1999-2007, IMF working paper, August 2010.
Nichols, Austin, and Mark Schaffer, 2007, Clustered Errors in Stata, Available via the
internet at: http://repec.org/usug2007/crse.pdf. Petersen, Mitchell, A., 2009, Estimating Standard Errors in Finance Panel Data Sets:
Comparing Approaches, Review of Financial Studies, 2009 22, 435-480. Santos, Joao A. C., 2001, Bank Capital Regulation in Contemporary Banking Theory: A
Review of the Literature, Financial Markets, Institutions, and Instruments, 10, 41-84. Tong, Hui, and Shang-Jin Wei, forthcoming, The Composition Matters: Capital Inflows and
Liquidity Crunch During a Global Economic Crisis, Review of Financial Studies. Viñals, Jose’, Jonathan Fiechter, Ceyla Pazarbasioglu, Laura Kodres, Aditya Narain, and
Marina Moretti, 2010, Shaping the New Financial System, IMF Staff Position Note, 10/15.
Whited, Toni M., and Guojun Wu, 2006, Financial Constraints Risk, Review of Financial
Studies, 19: 531-59.

19
Table 1. Bank Stock Returns Before and During the Crisis
In this table we report descriptive statistics of stock returns for three sample periods: (1) the pre-crisis period Q1/2006 to Q2/2007; (2) the crisis period Q3/2007 to Q1/2009; (3) and the period following Lehman bankruptcy Q3/2008 to Q1/2009. Stock returns are obtained from Datastream. The summary statistics are reported for all banks in our sample and for a subsample of large banks. Large banks are defined as banks with total assets above US$50 billion (the 20th percentile of assets). Banks in our sample operate in 12 different OECD countries (see Appendix Table 1 for the list of countries and distribution of banks across countries).
Mean Std. Dev. 25th percentile 50th percentile 75th percentile 95th percentileFull sample
Stock return pre-crisis Q1-2006 to Q2-2007 0.4 3.6 -1.6 0.3 2.2 6.1Stock return crisis Q3/2007-Q1/2009 -3.5 7.8 -6.7 -2.6 0.8 6.8Stock return post-Lehman Q3/2008-Q1/2009 -5.3 9.8 -10.0 -4.8 0.4 8.9
Large banks sample
Stock return pre-crisis Q1-2006 to Q2-2007 0.8 3.0 -1.2 0.8 2.4 6.0Stock return crisis Q3/2007-Q1/2009 -4.7 8.0 -8.0 -3.5 0.0 6.7Stock return post-Lehman Q3/2008-Q1/2009 -6.7 10.3 -11.6 -5.8 -1.0 8.7

20
Table 2. Summary Statistics: Capital Ratios
Banks in our sample operate in 12 different OECD countries (see Appendix Table 1 for the list of countries and distribution of banks across countries). The sample period for the measures of capital (lagged one period in the regression) is 2005 to 2008. The yearly data are obtained from Bankscope. RWRt is the total capital adequacy ratio under the Basle rules. It measures regulatory capital divided by risk-weighted assets and off balance sheet risks. RWRt1 is the Tier 1 risk-weighted capital ratio, defined as shareholder funds plus perpetual, non-cumulative preference shares plus retained earnings, as a percentage of risk weighted assets and off balance sheet risks measured under Basel rules. RWRt2 is the Tier 2 capital ratio, defined as subordinated debt, hybrid capital, loan loss reserves, and valuation reserves divided by risk-weighted assets and off balance sheet risks measured under Basle rules. LRt is the leverage ratio defined as regulatory capital divided by total assets. LRt1 is the Tier 1 leverage ratio and LRt2 is the Tier 2 leverage ratio. Tangible common equity is shareholder funds minus intangible capital. Summary statistics are reported for the whole sample and the sample of large banks. Large banks are defined as banks with total assets above US$50 billion (the 20th percentile of assets).
No. of Observ. Mean Std. Dev. 25th percentile 50th percentile 75th percentile 95th percentile
Full sample
RWRt 4254 12.6 2.8 10.7 11.9 13.7 19.5
RWRt1 4073 10.2 2.8 8.1 9.7 11.6 16.5
RWRt2 4049 2.3 1.5 1.2 2.4 3.1 4.9
LRt 3779 8.1 2.5 5.9 7.8 9.8 13.0
LRt1 3814 6.7 2.4 4.7 6.3 8.3 11.4
LRt2 3726 1.4 1.1 0.7 1.3 1.9 3.4
Tangible equity/Tangible assets 5495 8.1 5.2 5.0 6.7 9.2 18.1
Large banks sample
RWRt 887 12.2 2.4 10.6 11.7 13.1 19.5
RWRt1 827 8.6 1.9 7.2 8.2 9.5 12.7
RWRt2 827 3.2 1.5 2.7 3.3 4.0 5.2
LRt 741 7.2 2.2 5.4 6.5 8.5 12.4
LRt1 769 5.1 1.7 3.7 4.6 6.0 8.8
LRt2 736 2.0 1.0 1.3 1.9 2.8 3.8
Tangible equity/Tangible assets 976 4.5 2.0 2.9 4.1 5.9 8.6

21
Table 3. Correlation Matrix
This table reports Pearson correlation coefficients for the whole sample of banks and the sample of large banks. Large banks are defined as banks with total assets above US$50 billion. See Table 2 for the definition of all capital ratios. RWA is risk-weighted assets and TA is total (un-weighted) assets. The balance-sheet data are all obtained from Bankscope and the market data (stock returns, price-earnings ratio, Beta, market to book value of equity) from Datastream. See Appendix Table 2 for a detailed definition of all control variables. Full sample
Stock return % RWRt RWRt1 RWRt2 LRt LRt1 LRt2
Tangible equity ratio
Market to book value of equity
(PB)
Price-earnings ratio (PE) Beta
Loan Loss
Provisions/TA
Liquid Assets/T
A
Total Deposits/
TA Net
Loans/TA log(TA)
Stock return % 1RWRt 0.0340* 1RWRt1 0.0511* 0.8535* 1RWRt2 -0.0339* 0.1836* -0.3555* 1LRt -0.0273 0.6613* 0.5568* 0.1387* 1LRt1 -0.0125 0.6956* 0.7357* -0.1738* 0.9134* 1LRt2 -0.0287 0.0321* -0.3505* 0.7096* 0.3074* -0.1064* 1Tangible equity ratio 0.0511* 0.6027* 0.6855* -0.0987* 0.7083* 0.7699* -0.0542* 1Market to book value of equity (PB) -0.0206 0.0365* 0.0329* 0.0037 0.0532* 0.0483* 0.0124 -0.0044 1Price-earnings ratio (PE) -0.0043 -0.0079 -0.0166 0.0204 -0.0291 -0.0356* 0.0063 0.0283* 0.0015 1Beta -0.012 -0.0034 -0.0690* 0.0971* -0.1027* -0.1398* 0.0597* 0.0399* 0.0313* -0.0124 1Loan Loss Provisions/TA -0.1367* -0.1250* -0.2583* 0.1061* -0.0825* -0.1317* 0.1104* 0.0385* 0.0396* 0.0286* 0.1596* 1Liquid Assets/TA 0.0415* 0.1608* 0.0785* 0.1433* 0.2734* 0.1784* 0.1745* 0.2337* 0.0229 -0.01 0.1362* -0.0472* 1Total Deposits/TA -0.0035 -0.3005* -0.2256* -0.1664* -0.1878* -0.1074* -0.1314* -0.4414* -0.0529* -0.0118 -0.1968* 0.0338* -0.2228* 1Net Loans/TA -0.0797* -0.2574* -0.1843* -0.1291* 0.2010* 0.2435* -0.0308* -0.2947* -0.0279* -0.0304* -0.1859* 0.1656* -0.3887* 0.4872* 1log(TA) -0.0545* -0.3584* -0.5338* 0.2187* -0.5732* -0.6943* 0.1978* -0.4956* 0.0005 -0.0111 0.1505* 0.1248* -0.1116* 0.0189 -0.1141* 1(*) denotes statistical significance at the 5 % level and above.

22
Table 3. Correlation Matrix (concluded)
Large banks
Stock return % RWRt RWRt1 RWRt2 LRt LRt1 LRt2
Tangible equity ratio
Market to book value of equity
(PB)
Price-earnings ratio (PE) Beta
Loan Loss
Provisions/TA
Liquid Assets/T
A
Total Deposits/
TA Net
Loans/TA log(TA)
Stock return % 1RWRt 0.0358 1RWRt1 0.0462 0.6645* 1RWRt2 -0.0219 0.2845* -0.5274* 1LRt -0.0109 0.3150* 0.0562 0.2971* 1LRt1 -0.0101 0.4048* 0.3499* 0.0093 0.9047* 1LRt2 -0.02 0.0834* -0.4641* 0.6677* 0.6909* 0.3171* 1Tangible equity ratio 0.0692* 0.2726* 0.2883* -0.1037* 0.5874* 0.7061* 0.1415* 1Market to book value of equity (PB) -0.0486 0.0409 0.0061 0.0564 0.0369 0.0191 0.0512 0.0169 1Price-earnings ratio (PE) -0.0118 -0.0063 -0.0241 0.0217 -0.0197 -0.0275 0.0081 -0.0027 -0.0146 1Beta -0.0123 0.1424* -0.1236* 0.3487* -0.1555* -0.2590* 0.1022* 0.0466 -0.0188 -0.0610* 1Loan Loss Provisions/TA -0.1673* 0.2329* -0.0790* 0.1630* 0.2804* 0.2325* 0.2789* 0.1808* 0.1052* -0.0112 0.0924* 1Liquid Assets/TA 0.1097* -0.1288* -0.1219* 0.026 -0.3745* -0.3825* -0.2420* -0.2619* 0.0129 -0.0113 0.1128* -0.1716* 1Total Deposits/TA 0.0913* 0.0367 0.1000* -0.1990* -0.0475 0.0728* -0.1294* 0.2052* -0.2210* 0.0274 -0.2575* -0.0796* -0.3598* 1Net Loans/TA -0.0407 -0.0905* -0.2008* 0.1068* 0.4713* 0.4534* 0.3295* 0.3777* -0.0737* -0.0079 -0.2232* 0.2623* -0.5833* 0.4807* 1log(TA) -0.0628* -0.3141* -0.0621 -0.0033 -0.2607* -0.3134* -0.0890* -0.4785* -0.0053 0.021 0.1368* -0.1345* 0.3672* -0.3516* -0.4083* 1(*) denotes statistical significance at the 5 % level and above.

23
Table 4. Stock Market Performance and Bank Capital over the Financial Cycle
The estimated model is:
where yijt is the bank’s stock returns in quarter t, the α’s, β’s, and γ’s are coefficients to be estimated, djt is a matrix of country*time dummy variables, kijt-1 is bank capital, the variables we are mostly interested in, Xijt-1 is a matrix of bank-level control variables, dcrisis is a dummy variable for quarters during which the financial crisis was unfolding, and uijt is a disturbance term. The sample period for the stock return is Q1-2006 to Q1-2009. Crisis is a dummy that takes value one from Q3-2007 to Q1-2009. Capital is measured either as total regulatory capital (Tier1+Tier2) scaled by Basel risk-weighted assets (RWR) or total regulatory capital scaled by total un-weighted assets (leverage ratio, LR). See Appendix Table 2 for a detailed definition of the control variables. Liquidity stands for liquid assets , deposits for total deposits (including demand and saving deposits), provisions for loan loss provisions, and size is the logarithm of total assets. Liquidity, deposits, net loans, and loan loss provisions are all in percentage of total assets. PB stands for market to book value of equity and PE for price-earnings ratio. All explanatory variables are lagged one year. We report estimates for the whole sample and the sample of large banks. Large banks are defined as banks with total assets above US$50 billion. We report standard errors clustered by bank in brackets and the p-value for the test of significant difference between the pre-crisis and crisis coefficients in parentheses.
(1) (2) (3) (4)Whole sample Large banks
RWR LR RWR LRPre-crisis period:
Capital*PreCrisis 0.023 0.078* -0.155 -0.046[0.036] [0.046] [0.102] [0.089]
Liquidity*PreCrisis 0.016* 0.012 0.047** 0.041[0.008] [0.010] [0.022] [0.026]
Deposits*PreCrisis 0.013 0.017 0.013 0.014[0.009] [0.012] [0.014] [0.013]
Net Loans*PreCrisis 0.001 -0.001 -0.020* -0.012[0.007] [0.008] [0.012] [0.012]
Provisions*PreCrisis -1.204*** -1.043** -1.333* -1.402[0.374] [0.428] [0.760] [0.886]
Size*PreCrisis 0.053 0.07 -0.698 -0.209[0.070] [0.078] [0.839] [0.736]
PB*PreCrisis 0.018*** 0.015** 0.108 0.093[0.005] [0.006] [0.072] [0.075]
PE*PreCrisis 0.000 -0.001*** -0.009*** -0.009***[0.000] [0.000] [0.003] [0.003]
Beta*PreCrisis -0.233 -0.082 -0.239 -0.338[0.242] [0.257] [0.293] [0.349]
jt
ijtijtcrisisijtcrisisijtnocrisisijtnoncrisisjtjtijt uXdkdXdkddy )*()*()*()*( 12
12
11
11
24
Table 4. Stock Market Performance and Bank Capital over the Financial Cycle (concluded)
(1) (2) (3) (4)
Crisis period:
Capital*Crisis 0.114* 0.124 0.207 0.553***[0.063] [0.096] [0.143] [0.194](0.079) (0.597) (0.004) (0.002)
Liquidity*Crisis -0.037** -0.037 0.098* 0.094[0.017] [0.022] [0.056] [0.066](0.002) (0.015) (0.308) (0.334)
Deposits*Crisis 0.036** 0.038* 0.074*** 0.102***[0.016] [0.020] [0.022] [0.030](0.125) (0.180) (0.022) (0.011)
Net Loans*Crisis -0.030* -0.031* -0.032 -0.073**[0.016] [0.018] [0.028] [0.028](0.020) (0.080) (0.694) (0.043)
Provisions*Crisis -3.014*** -3.644*** -2.947 -2.927[0.995] [1.076] [2.373] [3.246](0.068) (0.017) (0.497) (0.637)
Size*Crisis -0.038 0.043 -1.265 -0.73[0.088] [0.090] [0.830] [0.730](0.180) (0.691) (0.005) (0.010)
PB*Crisis 0.027 0.006 0.043 0.024[0.064] [0.062] [0.070] [0.042](0.885) (0.893) (0.582) (0.465)
PE*Crisis -0.001*** -0.001*** -0.001*** -0.001***[0.000] [0.000] [0.000] [0.000](0.267) (0.837) (0.015) (0.008)
Beta*Crisis -0.594* -0.754** -0.105 0.014[0.350] [0.358] [0.506] [0.658](0.333) (0.084) (0.800) (0.585)
Country*Year FE x x x xNber. Obser. 4254 3779 887 741R squared 0.23 0.23 0.31 0.32Note: (*), (**) and (***) stand for statistically significant at the 10%, 5 % and 1 % level, respectively. Robust standard errors
clustered by bank reported in brackets. In parentheses we report the pvalue for the test of equality of effects during crisis
and pre-crisis.
Whole sample Large banks RWR LR RWR LR
25
Table 5. Tier 1 and Tier 2 Capital and Tangible Common Equity
The dependent variable is the quarterly stock return. See Table 4 for a detailed description of the estimated model. The sample period for the stock return is Q1-2006 to Q1-2009. All control variables are lagged one year. Crisis is a dummy variable that takes value one from Q3-2007 to Q1-2009. Tier1 (Tier2) is Tier1 (Tier2) capital scaled either by risk-weighted assets (RWR) or total un-weighted assets (LR). Tier1 capital includes shareholder funds plus perpetual, non-cumulative preference shares, plus retained earnings. Tier2 capital includes subordinated debt, hybrid capital, loan loss reserves, and valuation reserves. Tangible cmmon equity is shareholders fund minus intangible capital divided by total tangible assets. We report estimates for the whole sample and the sample of large banks. Large banks are defined as banks with total assets above US$50 billion. Standard errors clustered by bank are reported in brackets and the p-value for the test of significant difference between the pre-crisis and crisis coefficients in parentheses.
(1) (2) (3) (4) (5) (6) (7) (8) (7) (8)Full sample Large banks
RWR LR RWR LR RWR LR RWR LR
Tier1*PreCrisis 0.024 0.110* -0.092 0.061[0.046] [0.061] [0.129] [0.149]
Tier2*PreCrisis 0.074 0.006 -0.106 -0.252[0.055] [0.072] [0.145] [0.178]
Tier1*Crisis 0.117 0.154 0.264 0.603***[0.080] [0.108] [0.186] [0.210]
Tier2*Crisis 0.051 0.058 0.131 0.415[0.098] [0.188] [0.257] [0.350]
Common equity*PreCrisis 0.015 0.048 -0.005 -0.003[0.018] [0.034] [0.089] [0.143]
Other capital*PreCrisis -0.097*** -0.079 -0.053 -0.214*[0.034] [0.059] [0.083] [0.112]
Common equity*Crisis 0.114** 0.165** 0.283** 0.617**[0.044] [0.067] [0.126] [0.278]
Other capital*Crisis -0.015 0.002 0.324** 0.561*[0.076] [0.102] [0.144] [0.293]
Tangible Equity*PreCrisis 0.038** 0.086[0.019] [0.077]
Tangible Equity*Crisis 0.095*** 0.532***[0.031] [0.168]
Controls*PreCrisis x x x x x x x x x xControls*Crisis x x x x x x x x x x
Country*Year FE xNber. Obser. 4049 3726 827 736 3654 3700 745 748 5495 976R squared 0.23 0.23 0.32 0.33 0.23 0.23 0.32 0.32 0.22 0.3
Note: (*), (**) and (***) stand for statistically significant at the 10%, 5 % and 1 % level, respectively. Robust standard errors clustered by bank reported in brackets. In parentheses we report the pvalue for the test of equality of effects during crisis and pre crisis.
Whole sample Whole sample Large banks Large banks
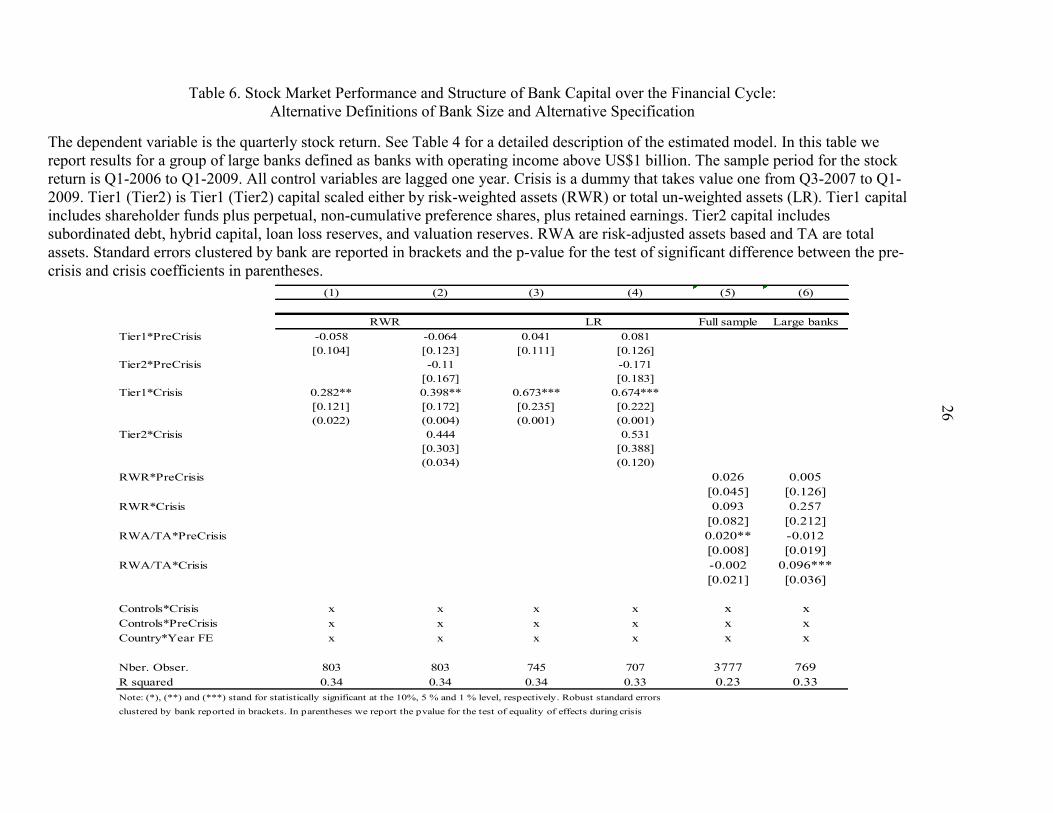
26
Table 6. Stock Market Performance and Structure of Bank Capital over the Financial Cycle:
Alternative Definitions of Bank Size and Alternative Specification
The dependent variable is the quarterly stock return. See Table 4 for a detailed description of the estimated model. In this table we report results for a group of large banks defined as banks with operating income above US$1 billion. The sample period for the stock return is Q1-2006 to Q1-2009. All control variables are lagged one year. Crisis is a dummy that takes value one from Q3-2007 to Q1-2009. Tier1 (Tier2) is Tier1 (Tier2) capital scaled either by risk-weighted assets (RWR) or total un-weighted assets (LR). Tier1 capital includes shareholder funds plus perpetual, non-cumulative preference shares, plus retained earnings. Tier2 capital includes subordinated debt, hybrid capital, loan loss reserves, and valuation reserves. RWA are risk-adjusted assets based and TA are total assets. Standard errors clustered by bank are reported in brackets and the p-value for the test of significant difference between the pre-crisis and crisis coefficients in parentheses.
(1) (2) (3) (4) (5) (6)
Full sample Large banksTier1*PreCrisis -0.058 -0.064 0.041 0.081
[0.104] [0.123] [0.111] [0.126]Tier2*PreCrisis -0.11 -0.171
[0.167] [0.183]Tier1*Crisis 0.282** 0.398** 0.673*** 0.674***
[0.121] [0.172] [0.235] [0.222](0.022) (0.004) (0.001) (0.001)
Tier2*Crisis 0.444 0.531[0.303] [0.388](0.034) (0.120)
RWR*PreCrisis 0.026 0.005[0.045] [0.126]
RWR*Crisis 0.093 0.257[0.082] [0.212]
RWA/TA*PreCrisis 0.020** -0.012[0.008] [0.019]
RWA/TA*Crisis -0.002 0.096***[0.021] [0.036]
Controls*Crisis x x x x x xControls*PreCrisis x x x x x xCountry*Year FE x x x x x x
Nber. Obser. 803 803 745 707 3777 769R squared 0.34 0.34 0.34 0.33 0.23 0.33Note: (*), (**) and (***) stand for statistically significant at the 10%, 5 % and 1 % level, respectively. Robust standard errors
clustered by bank reported in brackets. In parentheses we report the pvalue for the test of equality of effects during crisis
RWR LR

27
Table 7. Stock Market Performance and Bank Leverage: Separate Pre-Crisis and Crisis Regressions
The dependent variable is quarterly bank stock returns. See Table 4 for a detailed description of the estimated model. In this table report estimates for three separate sample period: (1) the pre-crisis period Q1/2006 to Q2/2007; (2) the crisis period Q3/2007 to Q1/2009; (3) and the period following Lehman bankruptcy Q3/2008 to Q1/2009. We also allow all coefficients to vary by bank size. Large is a dummy variable that takes value one if the bank has total assets above US$50 billion and small a dummy that takes value one for all other banks. Tier1 (Tier2) is Tier1 (Tier2) capital scaled either by risk-weighted assets (RWR) or total un-weighted assets (LR). Tier1 capital includes shareholder funds plus perpetual, non-cumulative preference shares, plus retained earnings. Tier2 capital includes subordinated debt, hybrid capital, loan loss reserves, and valuation reserves. Common equity is shareholders fund and other capital total regulatory capital minus common equity. Standard errors clustered by bank are reported in brackets and the p-value for the test of significant difference between the pre-crisis and crisis coefficients in parentheses.
(1) (2) (3) (4) (5) (6)
RWR LR RWR LR RWR LR
Tier1*Large -0.034 0.088 0.165 0.536*** 0.123 0.720**[0.090] [0.093] [0.154] [0.181] [0.257] [0.323]
Tier1*Small 0.036 0.036 0.08 0.151 0.033 0.141[0.045] [0.066] [0.114] [0.148] [0.158] [0.214]
Tier2*Large 0.039 -0.053 0.103 0.357 0.008 0.269[0.101] [0.158] [0.189] [0.283] [0.295] [0.388]
Tier2*Small 0.08 -0.052 0.049 0.161 -0.126 0.28[0.060] [0.076] [0.130] [0.214] [0.248] [0.369]
Constant -2.575 -5.352** -2.104 -2.248 -0.826 -6.642[2.417] [2.313] [4.755] [4.258] [6.481] [7.101]
Controls*Large x x x x x xControls*Small x x x x x xCountry*Year FE x x x x x x
Nber. Obser. 1820 1650 2229 2076 949 897R squared 0.23 0.23 0.15 0.16 0.22 0.23Note: (*), (**) and (***) stand for statistically significant at the 10%, 5 % and 1 % level, respectively.
Robust standard errors clustered by bank reported in brackets.
Post-LehmanPre-Crisis Crisis

28
Table 8. Robustness Check: Weighted Least Squares and Alternative Clustering
The dependent variable is quarterly bank stock returns. See Table 4 for a detailed description of the estimated model. This table reports estimation results using weighted least squares (WLS) (with weights equal to the inverse of the number of banks reporting in the country), and using standard errors clustered at the country*year level rather than the bank level. The sample period is Q1-2006 to Q1-2009. All control variables are lagged one year. Crisis is a dummy that takes value one from Q3-2007 to Q1-2009. Tier1 (Tier2) is Tier1 (Tier2) capital scaled either by risk-weighted assets (RWR) or total un-weighted assets (LR). Tier1 capital includes shareholder funds plus perpetual, non-cumulative preference shares, plus retained earnings. Tier2 capital includes subordinated debt, hybrid capital, loan loss reserves, and valuation reserves. We report estimates for the whole sample and the sample of large banks. Large banks are defined as banks with total assets above US$50 billion. The standard errors are reported in brackets and the p-value for the test of significant difference between the pre-crisis and crisis coefficients in parentheses.
(1) (2) (3) (4) (5) (6) (7) (8) (9) (10) (11) (12)
RWR LR RWR LR RWR LR RWR LR RWR LR RWR LR
Tier1*PreCrisis 0.024 0.113 -0.083 0.05 0.024 0.110 -0.092 0.061 0.024 0.11 -0.092 0.061
[0.065] [0.089] [0.256] [0.293] [0.056] [0.088] [0.108] [0.167] [0.074] [0.114] [0.147] [0.189]
Tier2*PreCrisis 0.075 0.009 -0.094 -0.239 0.074 0.006 -0.106 -0.252 0.074 0.006 -0.106 -0.252*
[0.106] [0.147] [0.315] [0.440] [0.052] [0.059] [0.120] [0.194] [0.055] [0.076] [0.166] [0.135]
Tier1*Crisis 0.117** 0.158** 0.293 0.596*** 0.117** 0.154* 0.264 0.603*** 0.117 0.154** 0.264 0.603**
[0.058] [0.078] [0.192] [0.221] [0.054] [0.083] [0.188] [0.202] [0.080] [0.061] [0.283] [0.275]
Tier2*Crisis 0.049 0.044 0.14 0.484 0.051 0.058 0.131 0.415 0.051 0.058 0.131 0.415
[0.096] [0.128] [0.244] [0.376] [0.080] [0.226] [0.334] [0.493] [0.157] [0.197] [0.226] [0.383]
0.194 -3.355 8.314 4.089 0.244 -0.23 10.286 5.268 0.244 -0.23 10.286 5.268
Constant [3.140] [3.380] [17.779] [16.757] [2.357] [2.206] [15.934] [13.426] [3.072] [5.082] [21.074] [15.466]
Country*Year FE x x x x x x x x x x x x
Number of clusters 400 400 91 91 48 48 32 32 13 13 13 13
Nber. of Obser. 4049 3726 827 736 4049 3726 827 736 4049 3726 827 736
R squared 0.23 0.24 0.32 0.33 0.23 0.23 0.32 0.33 0.23 0.23 0.32 0.33
Note: (*), (**) and (***) stand for statistically significant at the 10%, 5 % and 1 % level, respectively.
In parentheses we report the pvalue for the test of equality of effects during crisis and pre crisis.
Standard errors clustered by quarter
Large banks Large banks
Weighted Least Squares Standard errors clustered by country
Full sample Large banks Full sample Large banks
29
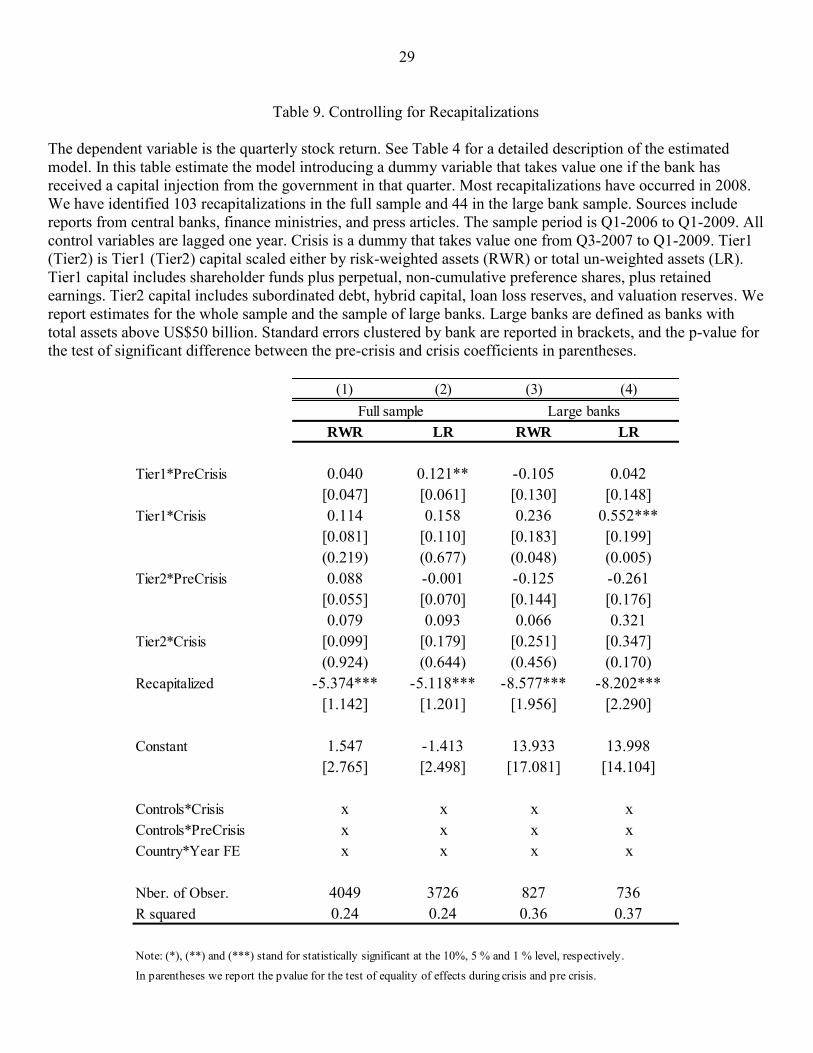
Table 9. Controlling for Recapitalizations
The dependent variable is the quarterly stock return. See Table 4 for a detailed description of the estimated model. In this table estimate the model introducing a dummy variable that takes value one if the bank has received a capital injection from the government in that quarter. Most recapitalizations have occurred in 2008. We have identified 103 recapitalizations in the full sample and 44 in the large bank sample. Sources include reports from central banks, finance ministries, and press articles. The sample period is Q1-2006 to Q1-2009. All control variables are lagged one year. Crisis is a dummy that takes value one from Q3-2007 to Q1-2009. Tier1 (Tier2) is Tier1 (Tier2) capital scaled either by risk-weighted assets (RWR) or total un-weighted assets (LR). Tier1 capital includes shareholder funds plus perpetual, non-cumulative preference shares, plus retained earnings. Tier2 capital includes subordinated debt, hybrid capital, loan loss reserves, and valuation reserves. We report estimates for the whole sample and the sample of large banks. Large banks are defined as banks with total assets above US$50 billion. Standard errors clustered by bank are reported in brackets, and the p-value for the test of significant difference between the pre-crisis and crisis coefficients in parentheses.
(1) (2) (3) (4)
RWR LR RWR LR
Tier1*PreCrisis 0.040 0.121** -0.105 0.042[0.047] [0.061] [0.130] [0.148]
Tier1*Crisis 0.114 0.158 0.236 0.552***[0.081] [0.110] [0.183] [0.199](0.219) (0.677) (0.048) (0.005)
Tier2*PreCrisis 0.088 -0.001 -0.125 -0.261[0.055] [0.070] [0.144] [0.176]0.079 0.093 0.066 0.321
Tier2*Crisis [0.099] [0.179] [0.251] [0.347](0.924) (0.644) (0.456) (0.170)
Recapitalized -5.374*** -5.118*** -8.577*** -8.202***[1.142] [1.201] [1.956] [2.290]
Constant 1.547 -1.413 13.933 13.998[2.765] [2.498] [17.081] [14.104]
Controls*Crisis x x x xControls*PreCrisis x x x xCountry*Year FE x x x x
Nber. of Obser. 4049 3726 827 736R squared 0.24 0.24 0.36 0.37
Note: (*), (**) and (***) stand for statistically significant at the 10%, 5 % and 1 % level, respectively.
In parentheses we report the pvalue for the test of equality of effects during crisis and pre crisis.
Full sample Large banks
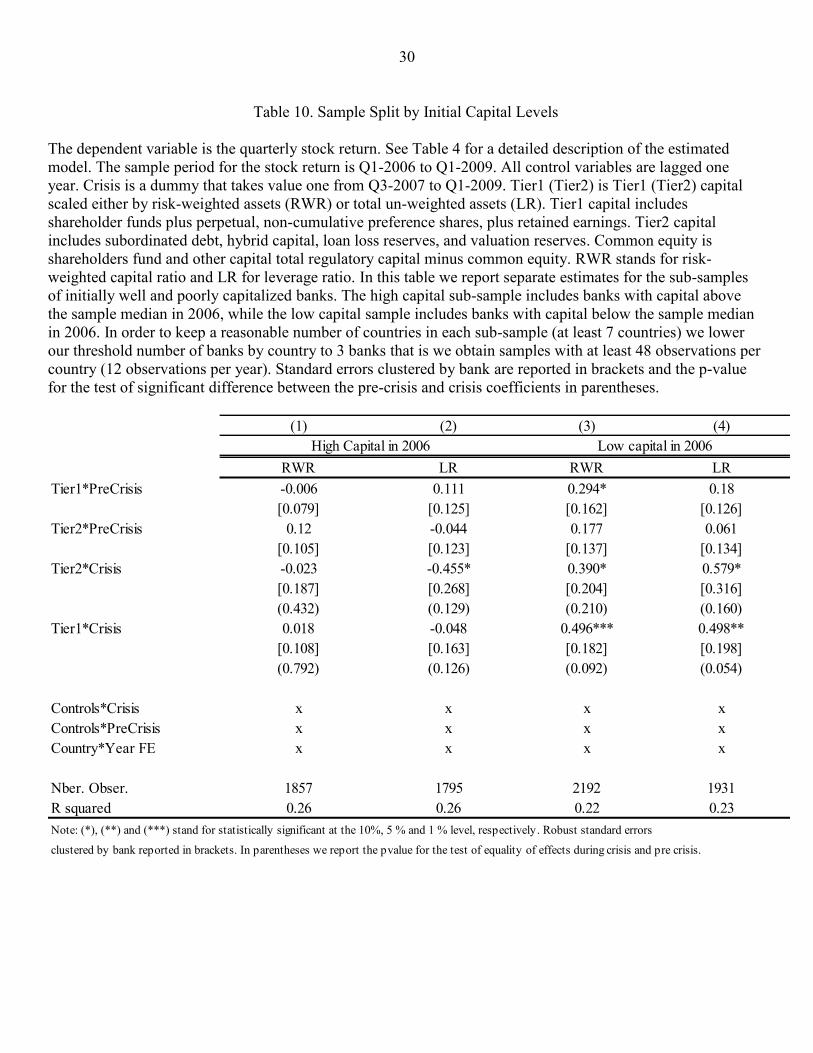
30
Table 10. Sample Split by Initial Capital Levels
The dependent variable is the quarterly stock return. See Table 4 for a detailed description of the estimated model. The sample period for the stock return is Q1-2006 to Q1-2009. All control variables are lagged one year. Crisis is a dummy that takes value one from Q3-2007 to Q1-2009. Tier1 (Tier2) is Tier1 (Tier2) capital scaled either by risk-weighted assets (RWR) or total un-weighted assets (LR). Tier1 capital includes shareholder funds plus perpetual, non-cumulative preference shares, plus retained earnings. Tier2 capital includes subordinated debt, hybrid capital, loan loss reserves, and valuation reserves. Common equity is shareholders fund and other capital total regulatory capital minus common equity. RWR stands for risk-weighted capital ratio and LR for leverage ratio. In this table we report separate estimates for the sub-samples of initially well and poorly capitalized banks. The high capital sub-sample includes banks with capital above the sample median in 2006, while the low capital sample includes banks with capital below the sample median in 2006. In order to keep a reasonable number of countries in each sub-sample (at least 7 countries) we lower our threshold number of banks by country to 3 banks that is we obtain samples with at least 48 observations per country (12 observations per year). Standard errors clustered by bank are reported in brackets and the p-value for the test of significant difference between the pre-crisis and crisis coefficients in parentheses.
(1) (2) (3) (4)
RWR LR RWR LRTier1*PreCrisis -0.006 0.111 0.294* 0.18
[0.079] [0.125] [0.162] [0.126]Tier2*PreCrisis 0.12 -0.044 0.177 0.061
[0.105] [0.123] [0.137] [0.134]Tier2*Crisis -0.023 -0.455* 0.390* 0.579*
[0.187] [0.268] [0.204] [0.316](0.432) (0.129) (0.210) (0.160)
Tier1*Crisis 0.018 -0.048 0.496*** 0.498**[0.108] [0.163] [0.182] [0.198](0.792) (0.126) (0.092) (0.054)
Controls*Crisis x x x xControls*PreCrisis x x x xCountry*Year FE x x x x
Nber. Obser. 1857 1795 2192 1931R squared 0.26 0.26 0.22 0.23Note: (*), (**) and (***) stand for statistically significant at the 10%, 5 % and 1 % level, respectively. Robust standard errors
clustered by bank reported in brackets. In parentheses we report the pvalue for the test of equality of effects during crisis and pre crisis.
High Capital in 2006 Low capital in 2006
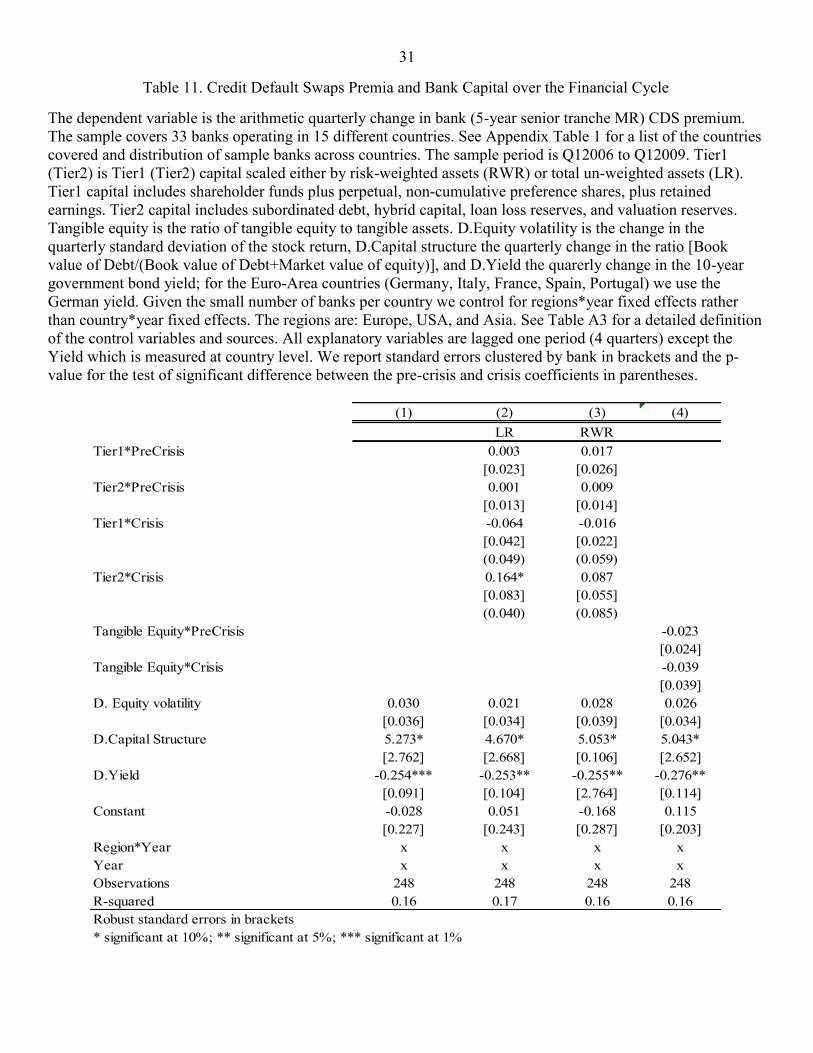
31
Table 11. Credit Default Swaps Premia and Bank Capital over the Financial Cycle
The dependent variable is the arithmetic quarterly change in bank (5-year senior tranche MR) CDS premium. The sample covers 33 banks operating in 15 different countries. See Appendix Table 1 for a list of the countries covered and distribution of sample banks across countries. The sample period is Q12006 to Q12009. Tier1 (Tier2) is Tier1 (Tier2) capital scaled either by risk-weighted assets (RWR) or total un-weighted assets (LR). Tier1 capital includes shareholder funds plus perpetual, non-cumulative preference shares, plus retained earnings. Tier2 capital includes subordinated debt, hybrid capital, loan loss reserves, and valuation reserves. Tangible equity is the ratio of tangible equity to tangible assets. D.Equity volatility is the change in the quarterly standard deviation of the stock return, D.Capital structure the quarterly change in the ratio [Book value of Debt/(Book value of Debt+Market value of equity)], and D.Yield the quarerly change in the 10-year government bond yield; for the Euro-Area countries (Germany, Italy, France, Spain, Portugal) we use the German yield. Given the small number of banks per country we control for regions*year fixed effects rather than country*year fixed effects. The regions are: Europe, USA, and Asia. See Table A3 for a detailed definition of the control variables and sources. All explanatory variables are lagged one period (4 quarters) except the Yield which is measured at country level. We report standard errors clustered by bank in brackets and the p-value for the test of significant difference between the pre-crisis and crisis coefficients in parentheses.
(1) (2) (3) (4)
LR RWRTier1*PreCrisis 0.003 0.017
[0.023] [0.026]Tier2*PreCrisis 0.001 0.009
[0.013] [0.014]Tier1*Crisis -0.064 -0.016
[0.042] [0.022](0.049) (0.059)
Tier2*Crisis 0.164* 0.087[0.083] [0.055](0.040) (0.085)
Tangible Equity*PreCrisis -0.023[0.024]
Tangible Equity*Crisis -0.039[0.039]
D. Equity volatility 0.030 0.021 0.028 0.026[0.036] [0.034] [0.039] [0.034]
D.Capital Structure 5.273* 4.670* 5.053* 5.043*[2.762] [2.668] [0.106] [2.652]
D.Yield -0.254*** -0.253** -0.255** -0.276**[0.091] [0.104] [2.764] [0.114]
Constant -0.028 0.051 -0.168 0.115[0.227] [0.243] [0.287] [0.203]
Region*Year x x x xYear x x x xObservations 248 248 248 248R-squared 0.16 0.17 0.16 0.16Robust standard errors in brackets* significant at 10%; ** significant at 5%; *** significant at 1%
32
Figure 1. Average Quarterly Bank Stock Returns by Country, Q1.2006-Q12009
-20
-10
01
0-2
0-1
0
01
0-2
0-1
0
01
0
20
06
q1
20
07
q1
20
08
q1
20
09
q1
20
06
q1
20
07
q1
20
08
q1
20
09
q1
20
06
q1
20
07
q1
20
08
q1
20
09
q1
20
06
q1
20
07
q1
20
08
q1
20
09
q1
CANADA DENMARK FRANCE GERMANY
GREECE HONG KONG ITALY JAPAN
NORWAY TAIWAN UNITED KINGDOM USA
Sto
ck r
etu
rns %
Graphs by Country Name

33
Figure 2. Response of Bank Stock Returns to Lagged Bank Capital Before and During the Financial Crisis
The charts plot estimated regression coefficients of a regression of quarterly bank stock returns on lagged bank capital. Regressions include country/time dummy variables and various control variables as described in Table 4. The coefficients are estimated for two alternative measures of bank capital, the risk-adjusted regulatory ratio (RWR) and the leverage ratio (LR), and for two alternative samples (the sample of all listed banks in the database and a sample of large banks).
-10
12
-10
12
200
6q
2
200
6q
3
200
6q
4
200
7q
1
200
7q
2
200
7q
3
200
7q
4
200
8q
1
200
8q
2
200
8q
3
200
8q
4
200
6q
2
200
6q
3
200
6q
4
200
7q
1
200
7q
2
200
7q
3
200
7q
4
200
8q
1
200
8q
2
200
8q
3
200
8q
4
LR Full sample LR Large banks
RWR Full sample RWR Large banks
Graphs by Type
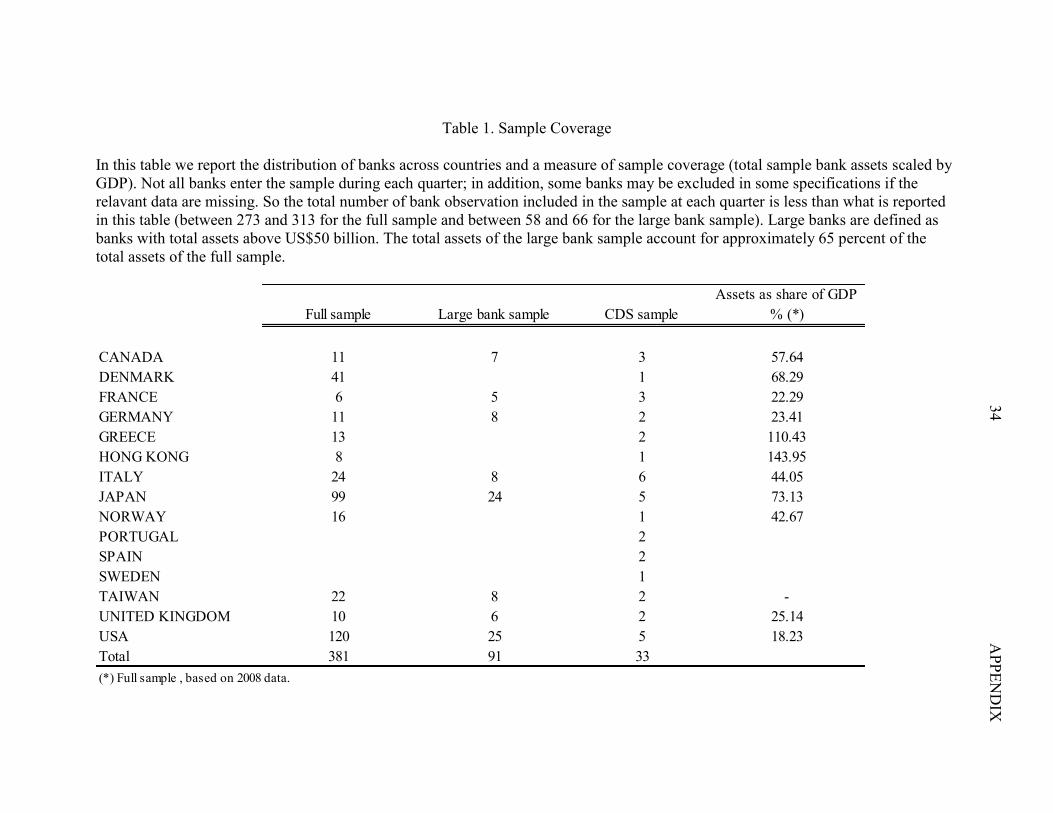
34 A
PPEND
IX
Table 1. Sample Coverage
In this table we report the distribution of banks across countries and a measure of sample coverage (total sample bank assets scaled by GDP). Not all banks enter the sample during each quarter; in addition, some banks may be excluded in some specifications if the relavant data are missing. So the total number of bank observation included in the sample at each quarter is less than what is reported in this table (between 273 and 313 for the full sample and between 58 and 66 for the large bank sample). Large banks are defined as banks with total assets above US$50 billion. The total assets of the large bank sample account for approximately 65 percent of the total assets of the full sample.
Full sample Large bank sample CDS sampleAssets as share of GDP
% (*)
CANADA 11 7 3 57.64DENMARK 41 1 68.29FRANCE 6 5 3 22.29GERMANY 11 8 2 23.41GREECE 13 2 110.43HONG KONG 8 1 143.95ITALY 24 8 6 44.05JAPAN 99 24 5 73.13NORWAY 16 1 42.67PORTUGAL 2SPAIN 2SWEDEN 1TAIWAN 22 8 2 -UNITED KINGDOM 10 6 2 25.14USA 120 25 5 18.23Total 381 91 33(*) Full sample , based on 2008 data.
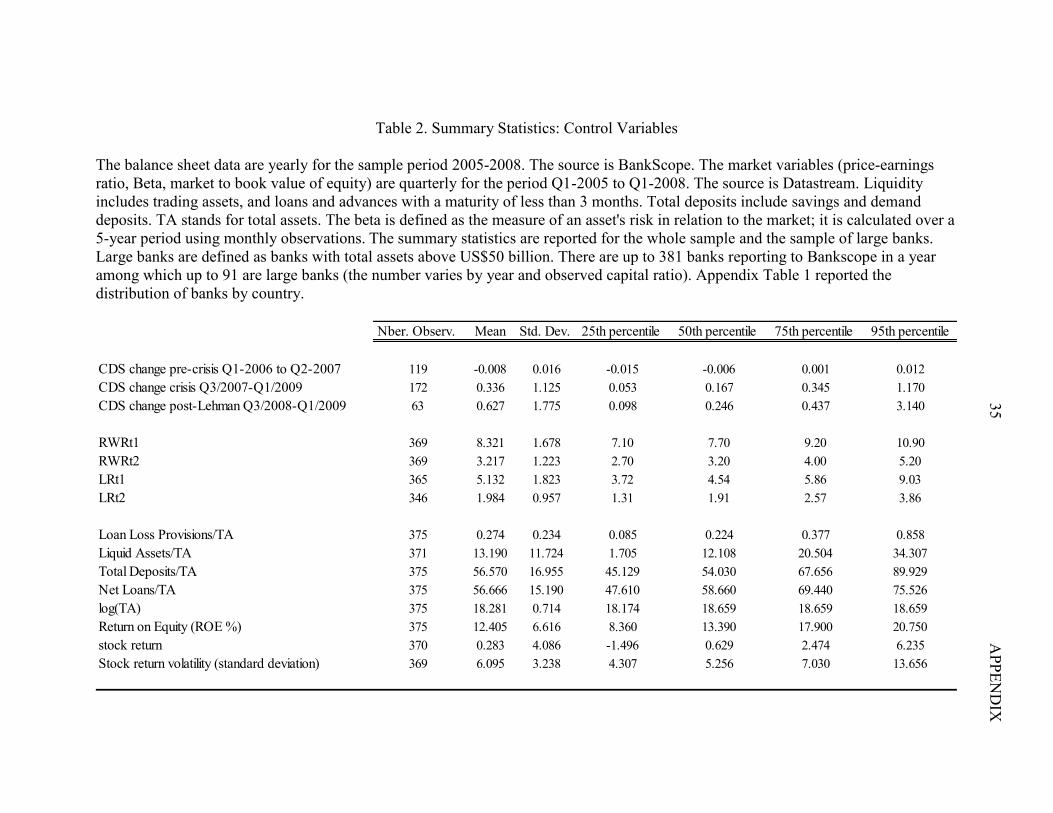
35 A
PPEND
IX
Table 2. Summary Statistics: Control Variables
The balance sheet data are yearly for the sample period 2005-2008. The source is BankScope. The market variables (price-earnings ratio, Beta, market to book value of equity) are quarterly for the period Q1-2005 to Q1-2008. The source is Datastream. Liquidity includes trading assets, and loans and advances with a maturity of less than 3 months. Total deposits include savings and demand deposits. TA stands for total assets. The beta is defined as the measure of an asset's risk in relation to the market; it is calculated over a 5-year period using monthly observations. The summary statistics are reported for the whole sample and the sample of large banks. Large banks are defined as banks with total assets above US$50 billion. There are up to 381 banks reporting to Bankscope in a year among which up to 91 are large banks (the number varies by year and observed capital ratio). Appendix Table 1 reported the distribution of banks by country.
Nber. Observ. Mean Std. Dev. 25th percentile 50th percentile 75th percentile 95th percentile
CDS change pre-crisis Q1-2006 to Q2-2007 119 -0.008 0.016 -0.015 -0.006 0.001 0.012CDS change crisis Q3/2007-Q1/2009 172 0.336 1.125 0.053 0.167 0.345 1.170CDS change post-Lehman Q3/2008-Q1/2009 63 0.627 1.775 0.098 0.246 0.437 3.140
RWRt1 369 8.321 1.678 7.10 7.70 9.20 10.90RWRt2 369 3.217 1.223 2.70 3.20 4.00 5.20LRt1 365 5.132 1.823 3.72 4.54 5.86 9.03LRt2 346 1.984 0.957 1.31 1.91 2.57 3.86
Loan Loss Provisions/TA 375 0.274 0.234 0.085 0.224 0.377 0.858Liquid Assets/TA 371 13.190 11.724 1.705 12.108 20.504 34.307Total Deposits/TA 375 56.570 16.955 45.129 54.030 67.656 89.929Net Loans/TA 375 56.666 15.190 47.610 58.660 69.440 75.526log(TA) 375 18.281 0.714 18.174 18.659 18.659 18.659Return on Equity (ROE %) 375 12.405 6.616 8.360 13.390 17.900 20.750stock return 370 0.283 4.086 -1.496 0.629 2.474 6.235Stock return volatility (standard deviation) 369 6.095 3.238 4.307 5.256 7.030 13.656