Bangladesh Asian Development Bank - hcu.portal.gov.bd
30
C1334 – January 2012 RFP HCU/CS-06 Strengthening of the Hydrocarbon Unit in the Energy and Mineral Resources Division (Phase II) Petroleum Refining & Marketing (Package # 06) HSE recommendation report in association with srgb Bangladesh Asian Development Bank
Transcript of Bangladesh Asian Development Bank - hcu.portal.gov.bd
C1334 – January 2012RFP HCU/CS-06
Strengthening of the Hydrocarbon Unit inthe Energy and Mineral Resources Division
(Phase II)
Petroleum Refining & Marketing (Package # 06)
HSE recommendation report
in association with
srgb
Bangladesh Asian Development Bank

Strengthening of Hydrocarbon Unit (Phase II) – Petroleum Refining & Marketing (Package # 06)
HSE recommendation report
SOFRECO - SRGB 1
Table of Contents Abbreviations ........................................................................................................ 2
1. HSE issues for the refinery................................................................................ 31.1 Scenario 1: Current ERL configuration (1.3 MM t/y) and purchase of refined products .............41.2 Scenario 2: Moderate Improvement of the existing ERL Refinery (1.6 MM t/y)................................61.3 Scenario 3: Modest modernization and increase of production capacity at the current ERL
refinery site (4.7 MM t/y).................................................................................................................................................... 71.4 Scenario 4/5: Full modernization of ERL refinery with addition of new units (6 MM t/y) or
new refinery..............................................................................................................................................................................9
2. General Recommendations..............................................................................132.1 HSE Management System............................................................................................................................................. 13
2.1.1 Environmental management ...................................................................................................................... 132.1.2 Safety management......................................................................................................................................... 16
2.2 Sulphur balance management....................................................................................................................................172.3 NOx emission reduction ................................................................................................................................................202.4 VOC emission reduction................................................................................................................................................. 21
2.4.1 LDAR programme.............................................................................................................................................. 212.4.2 VOC recovery...................................................................................................................................................... 22
2.5 Flare gas recovery ............................................................................................................................................................ 232.6 Clean Development Mechanism Projects (CDM)........................................................................................... 252.7 Improvement of wastewater treatment ................................................................................................................ 26
2.7.1 Primary treatment............................................................................................................................................. 262.7.2 Secondary treatment ..................................................................................................................................... 262.7.3 Tertiary treatment............................................................................................................................................. 272.7.4 Wastewater management ........................................................................................................................... 27
2.8 Waste management......................................................................................................................................................... 282.8.1 Sludge treatment.............................................................................................................................................. 282.8.2 Sludge disposal................................................................................................................................................. 29

Strengthening of Hydrocarbon Unit (Phase II) – Petroleum Refining & Marketing (Package # 06)
HSE recommendation report
SOFRECO - SRGB 2
AbbreviationsAPI American Petroleum Institute
AS Activated Sludge
BAT Best Available Techniques
CCR Catalyst Regeneration Reformer
CDM Clean Development Mechanism
CDU Crude Distillation Unit
CPI Corrugated Plate Interceptor
DAF Dissolved Air Flotation
EEA European Environmental Agency
ERL Eastern Refinery Limited
FCC Fluid Catalytic Cracking
HAP Hazardous Air Pollutants
HAZOP Hazard Operational Analysis
IAF Induced Air Flotation
LDAR Leak Detection and Repair
PPI Parallel Plate Interceptor
SCOT Shell Claus Off-gas Treating
SCR Selective Catalytic Reduction
SNCR Selective Non-Catalytic Reduction
SO2 Sulfur dioxide
SRU Sulphur Recovery Unit
US EPA U.S. Environmental Protection Agency
VDU Vacuum Distillation Unit
VOC Volatile Organic Compound
VRU Vapour recovery units

Strengthening of Hydrocarbon Unit (Phase II) – Petroleum Refining & Marketing (Package # 06)
HSE recommendation report
SOFRECO - SRGB 3
1. HSE issues for the refineryThe five technical recommendation scenarios for the refinery have different environmentalimpacts. In the following report, the environmental impacts of these scenarios are assessedand documented in a comprehensive way.
The base case Scenario 1 is more or less the existing situation including the impacts ofincreased imports. The relevant emissions for this case of the refinery including the handling ofpurchased products are given in table 1. The table is mostly the same as for the existingsituation (see Assessment Report), however, to facilitate comparison between the fivescenarios the emissions of the Chittagong tankfarms that do not belong to the refinery wereadded. This approach makes sense because for the environmental impacts the actualownership structure of the refinery and the adjacent tankfarms is irrelevant.
For all scenarios the relevant environmental and safety impacts are listed in an assessmenttables per each scenario. For easy comparison and evaluation the individual impacts areranked by means of red, yellow and green traffic light symbols:
Green: No relevant negative impact, measures applied are according to internationalstandards
Yellow: Impact still acceptable, situation has to be followed-up carefully, mitigationshould be considered based on more detailed information during the implementationphase
Red: Relevant negative impact, violation of local requirements or of World Bankrequirements, funding by World Bank and similar institutions is questionable, mitigation isrequired during the implementation phase

Strengthening of Hydrocarbon Unit (Phase II) – Petroleum Refining & Marketing (Package # 06)
HSE recommendation report
SOFRECO - SRGB 4
1.1 Scenario 1: Current ERL configuration (1.3 MM t/y) andpurchase of refined products
This scenario is considered as base case - the air emissions are given in the following table.The assumptions, on which the figures in the table are based, are described in the AssessmentReport.
The emissions of light products handling are calculated with an emission factor of 6 kg/t forthe year 2010. Heavier products do not contribute significantly to the overall air emissions andcan be neglected for this assessment.
Table 1: Air emissions inventory ERL+tankfarms - base case
Tag # Type Unit Fuel
ThermalcapacityMW
Fluegasm³/h
Emissionconcentration
mg/m³
Emission flow ratekg/h
NOx SOx NOx SOx VOCF-1101 furnace crude
distillationfuel oil 29,60 29.600 300 8,88 79,92
F-1201 furnace cat refpretreatment
ref gas 0,97 970 250 0,24 0,39
F-1202 furnace cat refpretreatment
ref gas 0,72 720 250 0,18 0,29
F-1203 furnace cat ref ref gas 0,52 520 250 0,13 0,21
F-1204 furnace cat ref ref gas 0,93 930 250 0,23 0,37
F-1205 furnace cat ref ref gas 3,29 3.290 250 0,82 1,32
F-1301 furnace hydrotreater nat gas 2,60 2.600 250 0,65
BA-3001 furnace visbreaker nat gas 17,20 17.200 250 4,30 92,88
furnace hydrogenunit
nat gas 2,40 2.400 250 0,60
10-F-01 furnace Vac unit+asphalt unit
nat gas 6,60 6.600 250 1,65
incinerator
asphalt unit nat gas 0,50 500 250 0,13
flare flare flare gas 0,50 500 250 0,13 0,20 5
steamboiler 1
utilities nat gas 10,00 10.000 250 2,50
steamboiler 2
utilities nat gas 10,00 10.000 250 2,50
dieselgenerator
utilities diesel 7,00 7.000 400 2,80
APIseparator
utilities 20
crudestorage
tank farm 20
lightproductsstorage
tank farmloading
220

Strengthening of Hydrocarbon Unit (Phase II) – Petroleum Refining & Marketing (Package # 06)
HSE recommendation report
SOFRECO - SRGB 5
diffuseemissions
refinery 60
total 26 176 325
Parameter
airemissions
Quantity
Quantityper
capacityImpact
NOx 30 kg/h 0,18 kg/t NOx is emitted from incineration processes such as furnaces,boilers and engines. The refinery does not apply any specific NOxabatement technologies. Due to the low complexity of the refinerythe overall furnace capacity is low related to more complexrefineries. Although dedicated lownox burners are not applied, thecontribution to the overall NOx air pollution in the relevantneighbourhood is less than 3 % of the air quality standard of 100µg/m³ and thus can be regarded as not relevant. Mitigationmeasures regarding the existing installations are notrecommended. Scenario 2 has no relevant impact on the NOxemissions of the refinery.
SO2 350kg/h
1,9 kg/t The origin of SO2 is the incineration of fuel containing sulphur. Thesulphur balance is entirely driven by the amount of sulphur in theimported crude. With a 25 % share of low-sulphur Forcados the totalsulphur input to the refinery will be about the same as for Scenario1. Because of the improved hydrotreating the overall SO2 emissionof the refinery is expected to double from approx. 180 to 350 kg/h.
The World Bank target of 0,5 kg/t will be clearly missed for therefinery. Additional desulphurisation measures should be applied.
VOC 325kg/h
n.a. There are no emission reduction techniques in place. The refinery isa relevant VOC polluter in the southern Chittagong area. Contrary toNOx and SO2 VOC emission come from a large number of verydifferent sources with fugitive emissions from the process anddirect emissions from tanks as the most important contributors.Including the tankfarms adjacent to the refinery the VOC emissionsare highly relevant in the vicinity of the refinery. Scenario 2 wouldcause significantly higher VOC emissions (approx. + 70 kg/hcompared to the existing situation) because of the higher tank farmthroughput by imported products. Emission reduction should beconsidered.
Wastewater
COD:
30 kg/h
COD:
0,17 kg/t
The refinery is equipped with a primary wastewater treatment (APIseparator) only . Based on international data on the efficiency ofprimary treatment facilities, the wastewater quality does not complywith international standards or with Bangladesh legal requirements.Scenario 2 has no relevant impact on the quality of the wastewater.
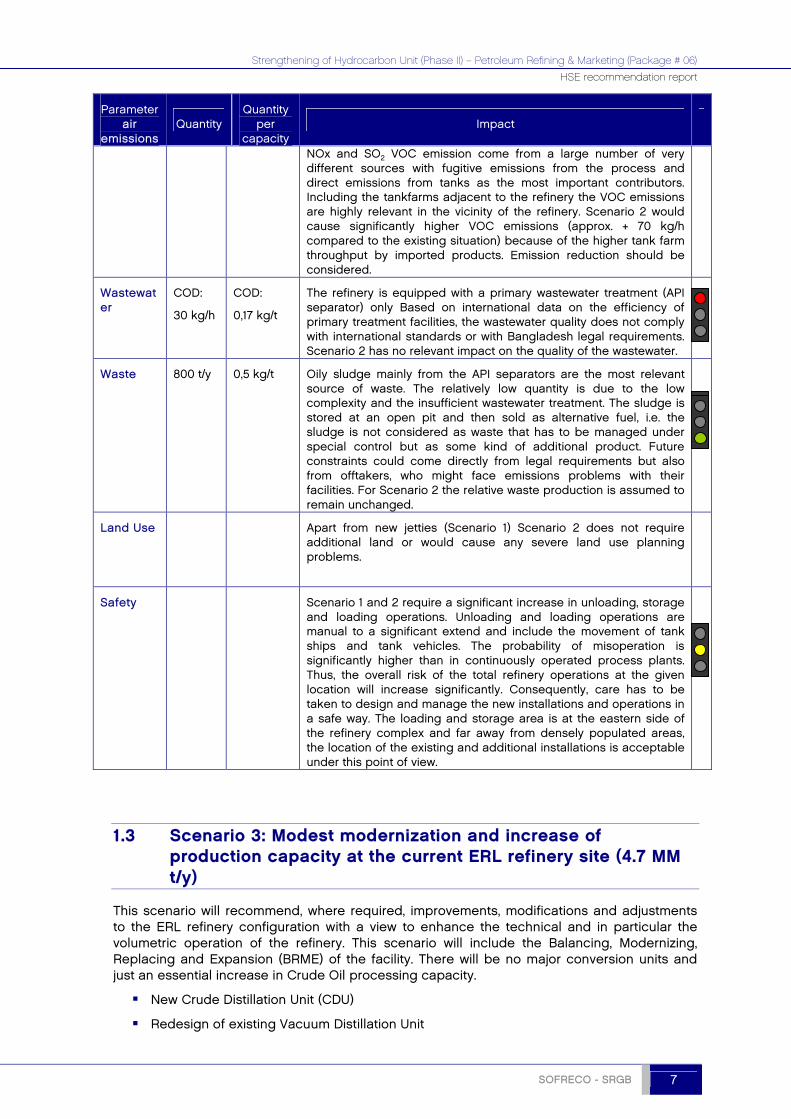
Waste 800 t/y 0,5 kg/t Oily sludge mainly from the API separators are the most relevantsource of waste. The relatively low quantity is due to the lowcomplexity and the insufficient wastewater treatment. The sludge isstored at an open pit and then sold as alternative fuel, i.e. thesludge is not considered as waste that has to be managed underspecial control but as some kind of additional product. Futureconstraints could come directly from legal requirements but alsofrom offtakers, who might face emissions problems with theirfacilities. For Scenario 2 the relative waste production is assumed toremain unchanged.
Land Use Apart from new jetties (Scenario 1) Scenario 2 does not requireadditional land or would cause any severe land use planningproblems.
Safety Scenario 1 and 2 require a significant increase in unloading, storage

Strengthening of Hydrocarbon Unit (Phase II) – Petroleum Refining & Marketing (Package # 06)
HSE recommendation report
SOFRECO - SRGB 6
and loading operations. Unloading and loading operations aremanual to a significant extend and include the movement of tankships and tank vehicles. The probability of misoperation issignificantly higher than in continuously operated process plants.Thus, the overall risk of the total refinery operations at the givenlocation will increase significantly. Consequently, care has to betaken to design and manage the new installations and operations ina safe way. The loading and storage area is at the eastern side ofthe refinery complex and far away from densely populated areas,the location of the existing and additional installations is acceptableunder this point of view.
1.2 Scenario 2: Moderate Improvement of the existing ERLRefinery (1.6 MM t/y)
This Scenario is focussed on ways to initially increase the Distillate output and operatingefficiencies, without major investment in new facilities. The basis is the existing ERL refineryoperation, but with possibly new (distillate rich) crude oils in the crude oil feedstock slate, likeForcados, Nat Gas condensate and possibly other Mid East crude oils.
Debottlenecking of the existing Crude Distillation Unit overhead and rectification andstripping section.
Debottlenecking of the Vacuum Distillation Unit by adjusting the vacuum andcondensing section.
Increase the Platformer capacity and severity of the process
Return the current inoperative Mild Hydro Cracking unit back in service at lowerpressure and in a more hydrotreating than cracking service for very light VacuumGasoils only
Improve the power generating utilities
Different crude oil types, with better performance to distillate products
Parameterair
emissionsQuantity
Quantityper
capacityImpact
NOx 30 kg/h 0,18 kg/t NOx is emitted from incineration processes such as furnaces,boilers and engines. The refinery does not apply any specific NOxabatement technologies. Due to the low complexity of the refinerythe overall furnace capacity is low related to more complexrefineries. Although dedicated lownox burners are not applied thecontribution to the overall NOx air pollution in the relevantneighbourhood is less than 3 % of the air quality standard of 100µg/m³ and thus can be regarded as not relevant. Mitigationmeasures regarding the existing installations are not recommended.Scenario 2 has no relevant impact on the NOx emissions of therefinery.
SO2 350kg/h
1,9 kg/t The origin of SO2 is the incineration of fuel containing sulphur. Thesulphur balance is entirely driven by the amount of sulphur in theimported crude. With a 25 % share of low-sulphur Forcados the totalsulphur input to the refinery will be about the same as for Scenario1. Because of the improved hydrotreating the overall SO2 emissionof the refinery is expected to double from approx. 180 to 350 kg/h.
The World Bank target of 0,5 kg/t will be clearly missed for therefinery. Additional desulphurisation measures should be applied.
VOC 325kg/h
n.a. There are no emission reduction techniques in place. The refinery isa relevant VOC polluter in the southern Chittagong area. Contrary to
Strengthening of Hydrocarbon Unit (Phase II) – Petroleum Refining & Marketing (Package # 06)
HSE recommendation report
SOFRECO - SRGB 7
Parameterair
emissionsQuantity
Quantityper
capacityImpact
NOx and SO2 VOC emission come from a large number of verydifferent sources with fugitive emissions from the process anddirect emissions from tanks as the most important contributors.Including the tankfarms adjacent to the refinery the VOC emissionsare highly relevant in the vicinity of the refinery. Scenario 2 wouldcause significantly higher VOC emissions (approx. + 70 kg/hcompared to the existing situation) because of the higher tank farmthroughput by imported products. Emission reduction should beconsidered.
Wastewater
COD:
30 kg/h
COD:
0,17 kg/t
The refinery is equipped with a primary wastewater treatment (APIseparator) only Based on international data on the efficiency ofprimary treatment facilities, the wastewater quality does not complywith international standards or with Bangladesh legal requirements.Scenario 2 has no relevant impact on the quality of the wastewater.
Waste 800 t/y 0,5 kg/t Oily sludge mainly from the API separators are the most relevantsource of waste. The relatively low quantity is due to the lowcomplexity and the insufficient wastewater treatment. The sludge isstored at an open pit and then sold as alternative fuel, i.e. thesludge is not considered as waste that has to be managed underspecial control but as some kind of additional product. Futureconstraints could come directly from legal requirements but alsofrom offtakers, who might face emissions problems with theirfacilities. For Scenario 2 the relative waste production is assumed toremain unchanged.
Land Use Apart from new jetties (Scenario 1) Scenario 2 does not requireadditional land or would cause any severe land use planningproblems.
Safety Scenario 1 and 2 require a significant increase in unloading, storageand loading operations. Unloading and loading operations aremanual to a significant extend and include the movement of tankships and tank vehicles. The probability of misoperation issignificantly higher than in continuously operated process plants.Thus, the overall risk of the total refinery operations at the givenlocation will increase significantly. Consequently, care has to betaken to design and manage the new installations and operations ina safe way. The loading and storage area is at the eastern side ofthe refinery complex and far away from densely populated areas,the location of the existing and additional installations is acceptableunder this point of view.
1.3 Scenario 3: Modest modernization and increase ofproduction capacity at the current ERL refinery site (4.7 MMt/y)
This scenario will recommend, where required, improvements, modifications and adjustmentsto the ERL refinery configuration with a view to enhance the technical and in particular thevolumetric operation of the refinery. This scenario will include the Balancing, Modernizing,Replacing and Expansion (BRME) of the facility. There will be no major conversion units andjust an essential increase in Crude Oil processing capacity.
New Crude Distillation Unit (CDU)
Redesign of existing Vacuum Distillation Unit

Strengthening of Hydrocarbon Unit (Phase II) – Petroleum Refining & Marketing (Package # 06)
HSE recommendation report
SOFRECO - SRGB 8
New Continuous Catalyst Regeneration Reformer (CCR)
New Isomerisation Unit
Return the current inoperative Mild Hydro Cracking unit back in service at lowerpressure and in a more hydrotreating than cracking service for very light VacuumGasoils only
Improvement the power generating utilities
Improvement of the oil/water separation
Different crude oil types, with better performance to distillate products
Parameter
airemissions
QuantityQuantitypercapacity
Impact
NOx 35 kg/h 0.06 kg/t NOx is emitted from incineration processes such as furnaces,boilers and engines. The existing CDU is the most relevantindividual NOx source of the refinery; it will be replaced by a newCDU. Although the production capacity is more than three times ofthe existing unit, the furnace capacity will only double from 30 to60 MW due to increased efficiency. The new CCR Reformer andthe Isomerisation Unit will add some additional 22 MW.
It is suggested to apply lownox burnes for the new units; the totalNOx emission would increase from approx. 26 to 35 kg/h. The NOxemission factor related to the new production capacity would beless than 0.1 kg/t.
The NOx ground level concentration caused by the refinery wouldincrease to some limited extend but would still be irrelevant.
SO2 400kg/h
0,7 kg/t The origin of SO2 is the incineration of fuel containing sulphur. Thesulphur balance is entirely driven by the amount of sulphur in theimported crude. With 40 % of the crude as low-sulphur Forcadosthe average sulphur content is approx. 0,75 %. This effect and theimproved efficiency of the crude distillation will bring the specificemissions down to 0,7 kg/t. The World Bank target of 0,5 kg/t is stillmissed for the refinery. Additional desulphurisation measuresshould be applied.
VOC 325kg/h
n.a. There are no emission reduction techniques in place. The refineryis a relevant VOC polluter in the southern Chittagong area.Contrary to NOx and SO2 VOC emission come from a largenumber of very different sources with fugitive emissions from theprocess and direct emissions from tanks as the most importantcontributors. Including the tankfarms adjacent to the refinery theVOC emissions are highly relevant in the vicinity of the refinery.Scenario 3 would cause significantly higher VOC emissions(approx. + 150 kg/h compared to the existing situation) because ofthe higher tank farm throughput by imported and producedproducts. Emission reduction should be considered.
Wastewater COD:
24 kg/h
COD:
0,05 kg/t
The refinery is equipped with a primary wastewater treatment (APIseparator) only. For Scenario 4 it can be expected that the totalwastewater quantity will increase from 50 m³/h to approx. 120 m³/h.As part of the Scenario 3 the existing oil/water separation and thewastewater treatment will be improved by applying at least asecondary wastewater treatment unit to comply with theBangladesh COD/BOD concentration limit.
Waste 4700 t/y 1 kg/t Due to the increasing complexity of the refinery and theimprovement of the wastewater treatment facilities it is assumedthat the specific waste quantity will increase to approx. 1 kg/t. Forthe time being the sludge is stored at an open pit and then soldas alternative fuel, i.e. the sludge is not considered as waste thathas to be managed under special control but as some kind of

Strengthening of Hydrocarbon Unit (Phase II) – Petroleum Refining & Marketing (Package # 06)
HSE recommendation report
SOFRECO - SRGB 9
Parameter
airemissions
QuantityQuantitypercapacity
Impact
additional product. It is highly questionable if this way of disposalwill still be feasible with significantly increasing quantities.Constraints could come directly from legal requirements but alsofrom offtakers, who might face emissions problems with theirfacilities. Mitigation measures should be evaluated in case ofimplementation of the scenario.
Land Use Scenario 3 implies new process units and additional land use. It isassumed for this scenario that the new units can be located withinthe perimeter fence of the existing site. There are some potentialareas for extension available at the site, however, these areas aremostly located south of the existing unit realatively close to theexisting housing area. The minimum safety distance of 200 m isalready not complied with - future extension has to be checkedcarefully also under this aspect.
Safety Apart from the safety distance considerations mentioned abovethe new units will be designed according to best practice alsoregarding process safety. The additional risk for the neighbouringhousing areas are acceptable. Special care has to be taken indesigning and arranging the new LPG sphere, because this wouldbe the most safety relevant single item of the expansion.
The additional impacts of the improved crude storage tanks andlogistics have been mentioned under Scenario 1.
1.4 Scenario 4/5: Full modernization of ERL refinery with additionof new units (6 MM t/y) or new refinery
This Scenario will take both capacity expansion and yield improvement at the existing ERLlocation into account. Scenario 5 is a completely new refinery at a location that still has to beidentified - the environmental impacts are similar to Scenario 4.
Add to the existing ERL configuration at Chittagong a second new Crude Distillation Unit(CDU) of 100 mbpd capable to produce 6 million tons oil products per year.
Add a new Vacuum Distillation Unit (VDU) capacity,
A new CCR Platformer, and for the Light Naphtha an Isomerisation Unit also capable totake the stripped gas condensates from the Gas fields besides the CDU light naphtha.(as was proposed in Scenario 3)
A new Hydrodesulphuriser, to desulphurise all CDU and Visbreaker/ Thermal Crackedproduced distillates to at least 350 ppm sulphur.
Single Stage or 2 Stage Recycle Mild Hydrocracker capable to process an extra Dieselcut from the Vacuum Gasoil fraction 375-to 430 deg C .
A new Hydrogen production unit.
A new Thermal Cracker to be fed with Vacuum Residue.
Amine Absorber/regenerator units and Sulphur recovery units for adequate sulphurremoval .
New and reliable power generation system based on a Cogen efficient Combined HeatPower Gas turbine.
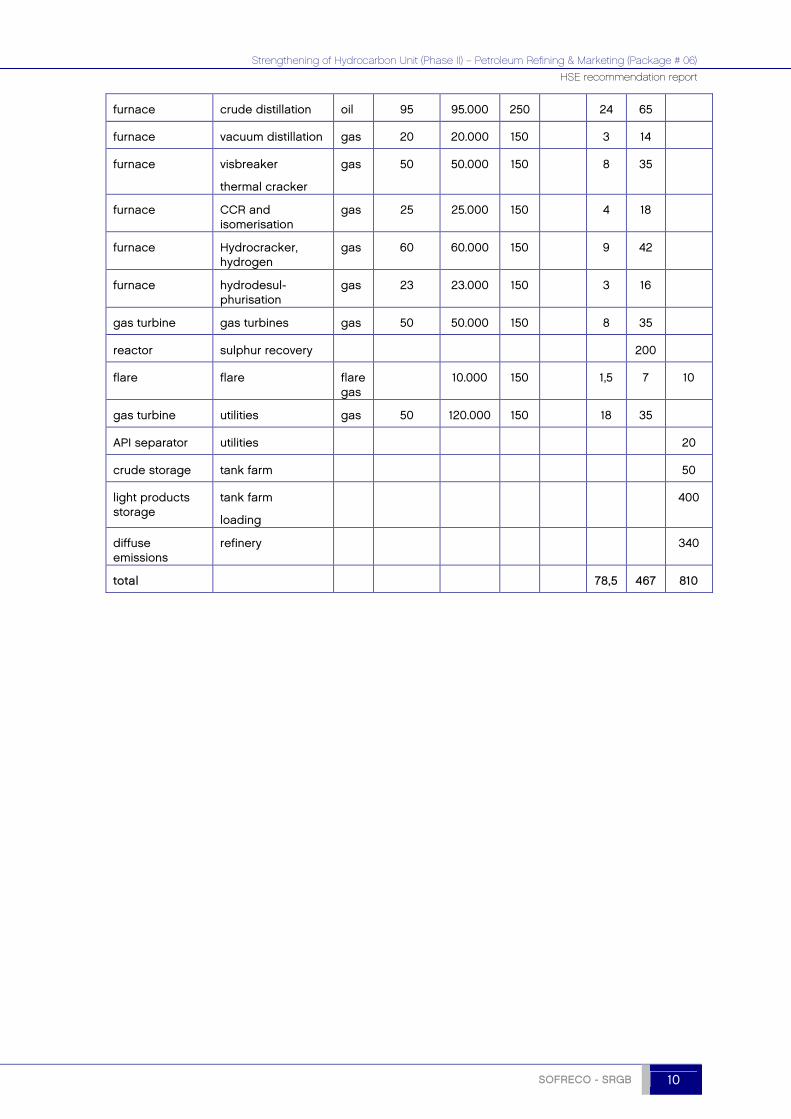
type unit fuelThermalcapacity flue gas
emissionconcentratio
n mg/m³
emission flow ratekg/h
MW m³/h NOx SOx NOx SOx VOC
Strengthening of Hydrocarbon Unit (Phase II) – Petroleum Refining & Marketing (Package # 06)
HSE recommendation report
SOFRECO - SRGB 10
furnace crude distillation oil 95 95.000 250 24 65
furnace vacuum distillation gas 20 20.000 150 3 14
furnace visbreaker
thermal cracker
gas 50 50.000 150 8 35
furnace CCR andisomerisation
gas 25 25.000 150 4 18
furnace Hydrocracker,hydrogen
gas 60 60.000 150 9 42
furnace hydrodesul-phurisation
gas 23 23.000 150 3 16
gas turbine gas turbines gas 50 50.000 150 8 35
reactor sulphur recovery 200
flare flare flaregas
10.000 150 1,5 7 10
gas turbine utilities gas 50 120.000 150 18 35
API separator utilities 20
crude storage tank farm 50
light productsstorage
tank farm
loading
400
diffuseemissions
refinery 340
total 78,5 467 810

Strengthening of Hydrocarbon Unit (Phase II) – Petroleum Refining & Marketing (Package # 06)
HSE recommendation report
SOFRECO - SRGB 11
Parameterair
emissionsQuantity
Quantityper
capacityImpact
NOx 80 kg/h 0.12 kg/t NOx is emitted from incineration processes such as furnaces,boilers and engines. Most of the furnaces will be new andequipped with low nox burners. In this case the refinery wouldcomply with best practice. Due to the increased capacity andcomplexity of the refinery the total NOx emission is about fourtimes higher compared to the base case.
The NOx ground level concentration would still be acceptable.Further mitigation is not required.
SO2 470 kg/h 0.7 kg/t The origin of SO2 is the incineration of fuel containing sulphur.The sulphur balance is entirely driven by the amount of sulphur inthe imported crude. With 40 % of the crude as low-sulphurForcados the average sulphur content is approx. 0.7 %. Thiseffect and the additional sulphur recovery will bring the specificemissions down to 0.7 kg/t, which is in line with the World Banktargets (0.5/1.0 for hydroskimming/conversion refineries).
The maximum ground level concentration would be at 20 - 30µg/m³ - this is acceptable as long as there are no other relevantsources in the neighbourhood. If further mitigation is required ornot has to be checked based on the actual conditions.
VOC 810 kg/h 1.2 kg/t There are no emission reduction techniques in place. The refineryis a relevant VOC polluter in the southern Chittagong area.Contrary to NOx and SO2 VOC emission come from a largenumber of very different sources with fugitive emissions from theprocess and direct emissions from tanks as the most importantcontributors. Including the tankfarms adjacent to the refinery theVOC emissions are highly relevant in the vicinity of the refinery.Scenario 4/5 would cause significantly higher VOC emissions(approx. + 70 kg/h compared to the existing situation) because ofthe higher tank farm throughput by imported and producedproducts. Emission reduction should be considered.
Wastewater COD:
30 kg/h
COD:
0,06 kg/t
The refinery is equipped with a primary wastewater treatment (APIseparator) only. For Scenario 4/5 it can be expected that the totalwastewater quantity will increase from 50 m³/h to approx. 150m³/h. As part of the Scenario 4/5 the existing oil/water separationand the wastewater treatment will be improved by applyingsecondary wastewater treatment to comply with the BangladeshCOD/BOD concentration limit.
Waste 6000 t/y 1 kg/t Due to the increasing complexity of the refinery and theimprovement of the wastewater treatment facilities it is assumedthat the specific waste quantity will increase to approx. 1 kg/t. Forthe time being the sludge is stored at an open pit and then soldas alternative fuel, i.e. the sludge is not considered as waste thathas to be managed under special control but as some kind ofadditional product. It is highly questionable if this way of disposalwill still be feasible with significantly increasing quantities.Constraints could come directly from legal requirements but alsofrom offtakers, who might face emissions problems with theirfacilities. Mitigation measures should be evaluated in case ofimplementation of the scenario.
Land use Scenario 4 implies new process units and significant additionalland use. It is assumed for this scenario that the new units can belocated within the perimeter fence of the existing site or atadjacent locations. There are some potential areas for extensionavailable at the site, however, these areas are mostly locatedsouth of the existing unit realatively close to the existing housing

Strengthening of Hydrocarbon Unit (Phase II) – Petroleum Refining & Marketing (Package # 06)
HSE recommendation report
SOFRECO - SRGB 12
Parameterair
emissionsQuantity
Quantityper
capacityImpact
area. The minimum safety distance of 200 m is already notcomplied with - future extension has to be checked carefully alsounder this aspect.
In case of scenario 5 a completely new site has to bedevelopped. In this case sufficient safety distances between therefinery and housing areas should be taken care of andmaintained by systematical land use planning.
Safety Apart from the safety distance considerations mentioned abovethe new units will be designed according to best practice alsoregarding process safety. The additional risk for the neighbouringhousing areas are acceptable. As a consequence of the sulphurrecovery there will be process streams with high concentrationsof H2S. H2S is highly toxic and has to be considered as anadditional risk compared to the existing situation.

Strengthening of Hydrocarbon Unit (Phase II) – Petroleum Refining & Marketing (Package # 06)
HSE recommendation report
SOFRECO - SRGB 13
2. General RecommendationsThe following general recommendations are not related to any specific technicalrecommendation scenario. These recommendations should be implemented for the currentoperations as well as for any future changes according to any recommended scenario.
2.1 HSE Management System
Recommendation: Implement a formalised management system for health,safety and environment.
HSE management system (health, safety and environment) refers to the management of anorganisation's HSE programs in a comprehensive, systematic, planned and documentedmanner. It includes the organisational structure, planning and resources for developing,implementing and maintaining policy for environmental protection.
An HSE Management System:
Serves as a tool to improve environmental and process safety performance
Provides a systematic way of managing an organisation’s environmental affairs
Is the aspect of the organisation’s overall management structure that addressesimmediate and long-term impacts of its products, services and processes on theenvironment
Gives order and consistency for organisations to address environmental concernsthrough the allocation of resources, assignment of responsibility and ongoing evaluationof practices, procedures and processes
Focuses on continual improvement of the system
The HSE Management System should be set up according to international standardssuch as ISO 14000.
For ERL and also for the marketing operation it should consist of the following mainelements:
2.1.1 Environmental management
Air emissions
Emission Inventory
Each operating unit should keep an inventory of all relevant emission sources into theatmosphere. The inventory should include the following elements:
general description short characterisation of each emission source
technical identification of the source (equipment tag number)
source height
emission temperature

Strengthening of Hydrocarbon Unit (Phase II) – Petroleum Refining & Marketing (Package # 06)
HSE recommendation report
SOFRECO - SRGB 14
type of process which causes the emission
operating time (continuous, periodically)
total flue gas flow (m³/h dry, normal conditions)
concentration of relevant air pollutants
emission flow rate
Emission data can be measured directly or derived from vendor data or other technicalsources. Emissions from tanks and loading facilities shall be determined by applying relevantstandard procedures (e.g. API Publication 2518, Manual of Petroleum Measurement StandardsChapter 19 - Evaporative Loss Measurement - Section) or computer programmes (e.g. EPATANK program).
Fugitive emissions from process units especially from flanges, valves, rotary equipment etc.can be determined by estimating the number of equipment and multiplying by emissionfactors.
Emissions from flares can be determined by estimating the total flare gas and multiplying byemission factors.
The emission factors should be taken from recognized sources (European EnvironmentalAgency (EEA), U.S. Environmental Protection Agency (US EPA)) or from vendor data. The actualdata source should be given.
Emissions shall be monitored continuously only in case of statutory requirements. In all othercases the site management decides on which sources will be measured after start-up only, orperiodically.
The inventory shall include emissions from ground or elevated flares, incinerators or otherequipment that serve multiple units. The inventory shall allow for allocating the emissions tothe originating process unit.
Relevant air pollutants that should be covered by the inventory are:
NOx (NO2 plus NO calculated as NO2)
SO2
CO
non-hazardous VOC (volatile organic compounds excluding hazardous air pollutants)
specified hazardous air pollutants (HAPs) such as specific cancerogeneic hydrocarbonsbenzene
Ground level concentrations
The site shall be aware of the actual ground level concentrations of relevant air pollutants inthe area where the plant is located. A system shall be set up to collect such information fromgovernmental bodies or any other relevant sources. Ground level concentration measurementsor dispersion calculations by the site itself are not required unless there are any statutoryrequirements.
Wastewater
Inventory
The operating site should keep an inventory of all sources of wastewater and all dischargesinto waterbodies or external sewage systems. The inventory shall include the followingelements:
Source of wastewater that are discharged from the site
Volumes and components of each waste water stream

Strengthening of Hydrocarbon Unit (Phase II) – Petroleum Refining & Marketing (Package # 06)
HSE recommendation report
SOFRECO - SRGB 15
Relevant components or parameters are:
COD
BOD
oil
components that are required by legal standards
pH
Temperature
Analytic measurements should be performed for the relevant components on a regular basis.
Waste
Inventory
Each operating site should maintain an inventory covering:
general description of the individual waste
quantities (t/y)
classification (hazardous/non hazardous)
treatment and disposal (short technical description)
costs of disposal
Soil and Groundwater
Inventory
Each operating unit / site should keep an inventory of relevant environmental risks. Theinventory shall include the following elements:
Groundwater table
Groundwater stream direction
Sensitive areas in the relevant neighbourhood (drinking water production)
Operations with specific risks of polluting open waterbodies
Environmental Noise
Inventory
The site should define relevant points in the neighbouring housing areas. At these points thesound level of the operations will be measured, documented and assessed against statutoryrequirements.
Management of change
The inventory shall be kept as-built and integrated into the existing operational managementof change procedures. For large projects or new plants emission inventories shall be set upduring the impact assessment process.
Continuous improvement
The site is committed to apply the best available techniques (BAT) as far as economicallyfeasible.

Strengthening of Hydrocarbon Unit (Phase II) – Petroleum Refining & Marketing (Package # 06)
HSE recommendation report
SOFRECO - SRGB 16
“Best” for the protection of the environment and society as a whole including consideration ofcross-media impacts and cost-benefit aspects
“Available” thus allowing implementation, under economically and technically viable conditions,taking into consideration e.g. the remaining life time of a plant unit
“Techniques” can mean technology, design and construction, but also maintenance, operatingprocedures, commissioning and decommissioning procedures. It is thus a wide term, designedto include all factors relevant to the environmental performance of an installation.
The technical criteria for selecting a technique include:
proven operation
proven reliability
availability
long term viability, taking into account the existing plant and planned development
availability of alternatives, (e.g., how does the technique compare with alternativeoptions).
There are national and international organisations, which collect and publish information onBAT e.g. for the hydrocarbon processing industry. Such information shall be used as a basis forthe determination of techniques to be applied in a specific case unless there are specific legalrequirements.
Based on this information and on the inventories, measures to improve environmentalprotection shall be identified.
Reporting, auditing and review
The data from the inventories, together with the environmental improvement plan, should bepublished on a regular basis - normally yearly -, audited by internal or external auditors andformally reviewed by the management.
2.1.2 Safety management
Organisation and personnel
Roles and responsibilities of personnel involved in the management of major hazards at alllevels in organisation have to be defined clearly and in writing.
Identification and evaluation of hazards
Adoption and implementation of procedures for systematically identifying major hazardsarising from normal and abnormal operation and the assessment of their likelihood andseverity - i.e. formalised process hazard analysis methods such as HAZOP for all safetyrelevant units. A procedure should be implemented to identify safety relevant units or safetyrelevant changes the have to be evaluated.
Operational control
Adoption and implementation of procedures and instructions for safe operation includinginspection and maintenance, of plant, processes, equipment and temporary stoppages;
Management of change
Adoption and implementation of procedures for planning modifications to, or the design ofnew installations, processes and storage facilities;

Strengthening of Hydrocarbon Unit (Phase II) – Petroleum Refining & Marketing (Package # 06)
HSE recommendation report
SOFRECO - SRGB 17
Planning for emergencies
Adoption and implementation of procedures to identify foreseeable emergencies bysystematic analysis - e.g. consequence calculations for explosions, fires and release of toxicsubstances and identification of safety distances;
Adoption and implementation of procedures to prepare test and review emergency plans torespond to such emergencies;
Monitoring performance
Adoption and implementation of procedures for the ongoing assessment of compliance withthe objectives set by the operator’s major accident protection policy and safety managementsystem, and the mechanisms for investigation and taking corrective action in case of non-compliance;
The procedure should cover the operator’s system for reporting major accidents or nearmisses, particularly those involving failure of protective measures, and their investigation andfollow-up on the basis of lessons learnt;
Audit and review
Adoption and implementation of procedures for periodic and systematic assessment of themajor-accident prevention policy and the effectiveness and suitability of the safetymanagement system and its updating by senior management;
2.2 Sulphur balance management
Recommendation: Implement a continuous quantitative sulphur balancemanagement with a special focus on sulphur emissions of therefinery and from the products.
The management of sulphur emissions can be handled as part of the environmentalmanagement; because of its crucial importance for the total emission it will be discussed insome more detail here.
SOx emissions from the refinery result directly from the combustion of sulphur contained infuels. The fuel required for the raising of steam, or for the firing of heaters and furnaces,originates either from residual fuel oil or refinery gas both produced by the refinery itself orfrom natural gas that is bought from outside the fence. The refinery fuels are the by-productsof the refinery processes. The composition and quality of these fuels, both gaseous and liquidfuels, vary with the crude oils processed.
All crude oils contain sulphur compounds. Consequently, when firing refinery fuels, SOx will beemitted. There is a direct relation between the sulphur content of the fuel and the amount ofSOx emitted - by combustion the total amount of sulphur reacts to SO2 irrespective of anydifferences between different combustion techniques. Pipeline quality natural gas normallycontains only traces of sulphur compounds.
In refineries with a higher complexity, the Fluid Catalytic Cracking (FCC) unit and the sulphurrecovery are additional major sources of SOx emissions - ERL has no FCC but therecommended Scenarios 4 and 5 do comprise a sulphur recovery unit (SRU).
The SO2 emission is only one restriction for refinery operation regarding sulphur. The othercomes from the required product quality - especially the sulphur content in middle distillates.Reducing sulphur in middle distillates requires additional desulphurisation units in the refinery,thus increasing the heat demand and adding new SO2 sources such as the incineration of highsulphur tailgases from the SRU.

Strengthening of Hydrocarbon Unit (Phase II) – Petroleum Refining & Marketing (Package # 06)
HSE recommendation report
SOFRECO - SRGB 18
It is very costly to control the refinery emissions by secondary methods such as flue gasscrubbing or by desulphurisation of fuel oil. Both methods are not considered best availabletechnology because their cost/benefit ratio is low - best available technique still is finding anappropriate balance between
crude sulphur content
sulphur recovery
applying natural gas as refinery fuel
SO2 reduction is looking at the refinery as a whole and not at individual emission sources.Consequently, refinery SO2 emissions are usually assed by assuming that the total refinery isone single source - the so-called bubble concept.
There are two different bubble concepts:
Concentration bubble; SO2 emissions are expressed as a fictive average concentrationof SO2 in the fictive total fluegas of the refinery, which can be calculated from the fuelconsumption.
Emission factor bubble: Here the SO2 emission is calculated as SO2 emitted mass flowrelated to the total crude input.
There is some historical justification for the concentration bubble concept, however, the totalflue gas quantity increases with decreasing energetic efficiency of the refinery and a certainconcentration limit is easier to achieve for a refinery with a lower energetic efficiency. Theemission factor bubble is completely independent of the energetic efficiency of the refineryand is therefore used in this paper.
The sulphur balances for the recommended scenarios are given in the following table:
Scenario 1 S quantity S S quantity S
% t/y % t/y % t/y % t/y
Murban 0,72 555.900 44 4.002 fuel oil+bitumen 3,20 360.000 29 11.520
Arab light 1,78 610.700 48 10.870 distillates 0,3 662.000 53 1.986
Forcados 0,12 0 0 0 gasolines+lpg 0,05 216.000 17 108
Gascondensate
0,01 108.400 9 11 total S in products 1.238.000 13.614
losses 1.270
Total 1,17 1.275.000 14.884 losses per capacity kg/t 1,00
Scenario 2 S quantity S S quantity S
% t/y % t/y % t/y % t/y
Murban 0,72 297.400 19 2.141 fuel oil+bitumen 2,90 440.000 29 12.760
Arab light 1,78 766.700 48 13.647 distillates 0,2 880.000 57 1.760
Forcados 0,12 400.200 25 480 gasolines+lpg 0,01 226.000 15 23
Gascondensate
0,01 136.100 9 14 total S in products 1.557.000 14.543
losses 1.740
Total 1,02 1.600.400 16.282 losses per capacity kg/t 1,09
Scenario 3 S quantity S S quantity S
% t/y % t/y % t/y % t/y
Murban 0,72 1.161.400 26 8.362 fuel oil+bitumen 1,90 1.421.000 32 26.999
Arab light 1,78 1.340.100 30 23.854 distillates 0,2 2.332.000 53 4.664

Strengthening of Hydrocarbon Unit (Phase II) – Petroleum Refining & Marketing (Package # 06)
HSE recommendation report
SOFRECO - SRGB 19
Scenario 1 S quantity S S quantity S
% t/y % t/y % t/y % t/y
Forcados 0,12 1.786.800 40 2.144 gasolines+lpg 0,01 648.000 15 65
Gascondensate
0,01 178.700 4 18 total S in products 4.401.000 31.728
losses 2.650
Total 0,77 4.467.000 34.378 losses per capacity kg/t 0,59
Scenario 4/5 S quantity S S quantity S
% t/y % t/y % t/y % t/y
Al Shaheen 2,37 600.000 10 14.220 fuel oil+bitumen 2 1.069.300 18 21.386
Murban 0,72 960.000 16 6.912 distillates 0,035 3.851.000 66 1.348
Arab light 1,78 1.800.000 30 32.040 gasolines+lpg 0,01 923.000 16 92
Forcados 0,12 2.400.000 40 2.880 S from SRU 0,4 16.948
Gascondensate
0,01 240.000 4 24 total S in products 5.843.300 39.774
losses 2.082
Total 0,70 6.000.000 100 41.856 losses per capacity kg/t 0,35
Calculating the refinery air emissions from sulphur is not very accurate at this stage. It can beassumed that most of the balancing losses are air emissions because the use of oil and gasfrom the process as fuel in the refinery is the most relevant balancing loss, however not theonly one. The accuracy is also limited because here a small figure is calculated from thedifference of larger figures.
Nevertheless, the general trends become obvious from these preliminary sulphur balances:
In Scenario 2 the additional total crude capacity is at least partially compensated byincreasing the share of low S crude. At the same time the slight increase of hydrogenation inthe refinery reduces the total S in the products but leaves the refinery with additional Semissions, because no sulphur recovery will take place.
In Scenario 3 the total capacity is more than doubled, whereas the S content in the crude isfurther reduced by a further increase of low S crude. The total losses rise in absolute figuresbut in relation to the capacity the losses decrease.
Scenario 4/5 includes sulphur recovery - sulphur losses decrease in absolute figures as well ascapacity related.
The sulphur balances show that the sulphur emissions have to be carefully balanced mainly bycontrolling the input sulphur but also by the sulphur content in products and by sulphurrecovery. Deviating sulphur contents of the crude would change the picture completely.
The World Bank standard for SO2 emissions is 0,5 kg/t for a hydroskimming and 1 kg/t for aconversion refinery. To compare these figures with the S losses given in the S balance tables,the S losses have to be multipied by 2 to convert S into SO2. Scenarios 1 and 2 would not beacceptable without further measures, Scenario 4/5 is in full compliance and Scenario 3 issomewhere in between.
To reduce suplphure emissions further possible mitigation measures are:
Increase low S crude share in the total crude
Sulphur recovery from high S process streams
Both measures are described and discussed in the technical description of the Scenarios.
Theoretically flue gas treatment - e.g. absorption by caustic washing - is another alternative.Flue gas treatment is usually applied for power stations in Europe that burn high S coal; in

Strengthening of Hydrocarbon Unit (Phase II) – Petroleum Refining & Marketing (Package # 06)
HSE recommendation report
SOFRECO - SRGB 20
refineries it is more or less not applied because there is normally a multitude of different fluegases from individual furnaces, which makes the treatment very costly. Apart from that, the SO2
concentration in refinery flue gases is generally lower compared to power stations because ofsulphur balancing, which is no option for a power station.
Depending on the technical details of the selected scenario it also has to be discussed,whether or not the tailgas from the sulphur recovery still needs further treatment. According tothe actual definitions of Scenario 4/5 tailgas treatment is not recommended.
Tail gas from a Sulphur Recovery Unit contains sulphur oxides and hydrogen sulphide, totallingup to 3 % of total sulphur intake for a plant with a yield of 97 %. Improvement of the yield andconsequently reduction of sulphur emissions can be obtained through two principaltechnologies and/or a combination of them:
addition of a third Claus reactor
addition of a Tail Gas Treatment Unit
Tail gas treatment increases the total sulphur recovery to some 98-99.99 %. The most relevantprocesses are:
In a Shell Claus Off-gas Treating (SCOT) unit the Claus tail gas is selectively hydrogenated toH2S, which is separated from the gas stream in an amine absorber. The loaded amine is routedto a regenerator where H2S is stripped off and routed back to the Claus unit. A stand-aloneSCOT has its own amine stripper, while in a cascaded SCOT the loaded amine is recombinedwith other amine streams and washed in a common column.
In a Super Claus unit, the tail gas is led through a reactor with a selective oxidation catalyst,which converts H2S with excess oxygen to sulphur.
The Clauspol process is based on the Claus reaction (hydrogen sulphide plus sulphur dioxidereacting to sulphur and water). The reaction takes place in a column with packed beds, withthe gas entering from the bottom of the column while a solvent with catalyst is distributed inthe top of the column. The sulphur is collected at the bottom of the column.
The Sulfreen process is also based on the Claus reaction. Here the sulphur produced isadsorbed on an active alumina based catalyst. Two reactors are used, while one is in theadsorbing mode, the other reactor is regenerated by stripping off the sulphur.
2.3 NOx emission reduction
Recommendation: New furnaces and boilers should be equipped with low NOxburners.
As shown in the Assessment Report, the refinery is not a relevant source of NOx emissions inthe Chittagong area. For the emission estimate of the recommended scenarios it is assumedthat Low-NOx burners will be applied for new equipment.
Low-NOx burners have the aim of reducing peak temperature, reducing oxygen concentrationin the primary combustion zone and reducing the residence time at high temperature therebydecreasing thermally formed NOx. Staging of fuel addition is also thought to provide areburning effect, further reducing the NOx. Ultra-low-NOx burners add internal recirculation offlue gases to the features of the low-NOx burner enabling further NOx reductions.
Low-NOx burners achieve NOx reduction performances of 40 -60 % for gaseous fuels and 30 -50 % for liquid fuels. Ultra-low-NOx burners applied to process heaters and boilers can achievea 60 - 75 % reduction of NOx emissions.
Low-NOx burners achieve NOx concentrations of approx. 150 mg/m³ for refinery gas and 250mg/m³ for liquid fuel oil.

Strengthening of Hydrocarbon Unit (Phase II) – Petroleum Refining & Marketing (Package # 06)
HSE recommendation report
SOFRECO - SRGB 21
For oil firing there is a direct link between NOx and particulates i.e. reduction in NOx as theflame temperature falls will lead to an increase in particulates. For low-NOx fuel oil burners, aswith conventional fuel oil burners a further reduction of thermal NOx results in an increase incarbon particulates. CO emissions are also increased.
Application is straightforward for new installations of both fired heaters and boilers. Someliquid fuels are not suitable for the latest generation of low-NOx burners and some older firedheaters are fitted with large high intensity burners which cannot be retrofitted with new low-NOx burners. Retrofitting of low-NOx burners depends on the furnace design and may besimple, difficult or - because of the increased flame volume - impossible without changing thefurnace. For instance the increased length of low-NOx burners may restrict applicability infurnaces built low above-ground. NOx abatement on older furnaces and boilers may also beless effective due mainly to the need to avoid flame impingement on the furnace tubes.
For new installations the additional costs of low-NOx burners are irrelevant and there are noadditional operation costs.
Post-combustion techniques include Selective Non-Catalytic Reduction (SNCR) and SelectiveCatalytic Reduction (SCR). SNCR and SCR have been used for large boilers and for gas-firedrefinery heaters but are not to be considered best available technology for refinery processheaters due to high cost and limited efficiency.
2.4 VOC emission reduction
Fugitive emissions from process equipment are the largest single source of VOCs emitted tothe atmosphere in a refinery and can frequently account for 50% of the total emissions.Fugitive emissions embrace the emissions that occur from items such as valves, pump andcompressor seals, flanges, vents and open ends.
Factors driving these releases of hydrocarbons are equipment design, quality of the sealingsystem, maintenance programme and properties of the line contents. Poorer designs (withwider tolerances), poor sealing systems (e.g. leak prone valve packings) and limitedmaintenance will lead to higher emissions. Valves are considered to account for approximately50-60 % of fugitive emissions. Furthermore, the major portion of fugitive emissions comes fromonly a small fraction of the sources (e.g. less than 1% of valves in gas/vapour service canaccount for over 70 % of the fugitive emissions of a refinery).
The total quantity of VOC emission losses can be as high as 0.1 % of the throughput; at leastsome measures can be economically feasible. There are numerous techniques to minimiseVOC emissions - not all of them are applicable in a retrofit situation.
2.4.1 LDAR programme
Recommendation: Implement an LDAR (Leak Detection and Repair) programme toreduce VOC emissions from process units.
LDAR - Leak Detection and Repair - is a powerful tool to identify and minimise VOC emissionsfrom a refinery. The technique for LDAR is to measure the concentration of gas at the potentialleak site on the piping component (under a prescribed procedure) and to effect a repair to theleaking item if a level of gas concentration equal to or greater than a regulatory leak definitionconcentration (10 000 ppm) is measured. Over 90% of reducible fugitive VOC emissionsoriginate from only approx. 0.1% of components.
The method is described in the US American standard 40 CFR Part 60, Appendix A, Method 21.

Strengthening of Hydrocarbon Unit (Phase II) – Petroleum Refining & Marketing (Package # 06)
HSE recommendation report
SOFRECO - SRGB 22
LDAR is applied to valves, pumps, compressors, pressure re-lief valves, flanges, connectors,and other piping components. Valves are usually the single largest source of fugitiveemissions. Emissions from any single piece of equipment are usually small. Based on the largenumber of equipment components LDAR requirements, however, cumulative emissions can bevery large.
LDAR programmes are generally comprised of four processes. Regulations vary but usuallyrequire refineries to:
Identify components to be included in the program;
Conduct routine monitoring of identified components;
Repair any leaking components;
Report monitoring results.
The LDAR programme should be developed and tailored to suit the situation concerned, usingappropriate techniques, frequencies and priorities. It should provide estimates of fugitive VOCreleases for monitoring returns and enable action to be taken to minimise releases. A LDARcontains the following elements:
type of measurement (e.g. detection limit of 500 ppm for valves and flanges. against theinterface of the flange)
frequency (e.g. once or twice a year)
type of components to be checked (e.g. pumps. control valves, heat exchangers,connectors, flanges)
type of compound lines
what leaks should be repaired and how fast the action should be taken
The equipment required for LDAR equipment is relatively simple and inexpensive, the costsare mainly for personell. LDAR is mostly contracted as an external service, however, there is noproblem in performing such programmes by the refinery personell themselves.
The refinery according to scenario 3 - 5 could have fugitive emissions in the order ofmagnitude of 100 - 200 kg/h, which is 800 - 1600 t/y. If only 50 % of these losses can bereduced by LDAR, the annual benefit would be 240,000 to 500,000 USD, which is more thanenough to cover the costs of the programme as such.
2.4.2 VOC recovery
Recommendation: Consider the technical and economical feasibility of VOC recoveryat storage and loading units.
Vapour recovery units (VRU) are installations designed for the emission reduction of volatileorganic compounds (VOC) which are emitted during loading and unloading operations of lightproducts. Generally light products are products with a vapour pressure of more than 10 - 15mbar, i.e. Diesel, Kerosine, fuel oil etc. are generally not recovered, because the cost/benefitratio is unsatifactory.
Crude oil is unloaded from ships or barges into floating roof tanks; there is no displaced gasphase in this case, so recovery is not necessary or possible also in this case. Vapour recoverywill be restricted to the handling of light products.
Several commercial techniques are available for the recovery of VOC:
Condensation: The hydrocarbons are condensated from the waste gas stream bycooling with cooling or chilled water. The efficiency depends on the coolingtemperature, the equipment is simple, stringent emission standards cannot by compliedwith.

Strengthening of Hydrocarbon Unit (Phase II) – Petroleum Refining & Marketing (Package # 06)
HSE recommendation report
SOFRECO - SRGB 23
Absorption: The vapour molecules dissolve in a suitable absorption liquid (water, lyes,glycols or mineral oil fractions such as reformate). As long as no regeneration of theliquid is required, the method is also relatively simple, stringent emission standardscannot by complied with.
Adsorption: The vapour molecules adhere physically to activate sites on the surface ofsolid materials, like activated carbon or zeolite. Mainly due to the requirement ofregeneration of the adsorbent, the method is effective and expensive.
Hybrid systems: Combinations of the VRU are on the market, which are able to meet verylow emissions standards. Examples are cooling/ybsorption andcompression/ybsorption/membrane separation.
The economics of vapour recovery are governed by the emissions requirements. In mostcases a cost-effective method is applied as first stage to recover the bulk of hydrocarbons,followed by a second step to treat the remaining tail gas according to emission controlrequirements. In many case the first step is economically feasible, i.e. the cost of the recoveryis recovered by the benefit from the recovered product. The second step recovers only limitedquantities and would never be economical feasible.
For ERL it is recommended to apply a one-stage vapour recovery system that is designed foreconomic feasibility only. Also here efficiencies of clearly over 90 % can be achieved, whichwould be a significant improvement of the situation.
The technique to be selected should be either condensation or absorption. For absorption ahydrocarbon available from the refinery could be applied as an absorbent and the loadedabsorbent could be blended into an appropriate product without regeneration.
To minimise the total vapour a balancing system should be applied. There are somerestrictions in a refinery, as e.g. the vapour that is displaced in product tanks filled fromprocess units cannot be balanced. Balancing is more or less restricted to loading processes.Vapour recovery at truck top loading points are available but require significant changes forthe loading station. For that reason, in a first stage the truck loading could be left out andintegrated later, when those installations will be replaced by new ones.
2.5 Flare gas recovery
Recommendation: Consider the technical and economical feasibility of a flare gasrecovery system.
Flares are designed for safety and environmental control of discharges from pressure safetyvalves or other safety related equipment, i.e. the flare system is primarily a safety equipment.Apart from that excess combustibles that cannot be utilised in the refinery are also routed tothe flare. This could be excess refinery gas, displaced gas phase from tanks during tank filling,gas from pressure controllers, nitrogen/hydrocarbon mixtures from purging and blanketing orother streams that cannot easily be used because of low caloric value or low pressure.
It is best practice to minimise continuous hydrocarbon streams to the flare by routing suchstreams back to the process or to the heating gas system, nevertheless there are alwayssmaller continuous or discontinuous streams that can not be used economically and arerouted to the flare system. In larger refineries these remaining flare gas streams can be in theorder of magnitude of 5 t/h and more.
Flare gas recovery system have been developed due to increasing requirements to controlvisible flaring, however, in many cases flare gas recovery systems could also be economicallyfeasible.
The basic design of a flare gas recovery system comprises a fluid ring compressor followed bya knock out/separator vessel to collect and recycle the ring fluid and separate liquidhydrocarbons. The condensed gas can be routed to the fuel gas system of the refinery.Because of the extreme variations of the heating value of the recycled gas an effective control

Strengthening of Hydrocarbon Unit (Phase II) – Petroleum Refining & Marketing (Package # 06)
HSE recommendation report
SOFRECO - SRGB 24
of the mixing of recycled flare gas and heating gas is an important part of the system. The fluidring compressor can be replaced by an ejector system in specific cases. In case of highersulphur concentration an amine washing step can also be integrated.
Flare gas recovery is economically feasible in many cases but in other cases it is not -depending on the total quantity, the composition and the variation of these parameters.
Typical economic data:
Flare gas quantity 5 t/h
Nitrogen content 50 %
Recovered hydrocarbons to fuel gas 2.5 t/h 21,000 t/y
Compressor installed electrical power 350 kW
Total investment 5,000,000 USD
Depreciation, insurance, maintenance 15 % 750,000 USD/y
Operating costs (el. energy) 0,10 USD/kWh 250,000 USD
Total costs 1,000,000 USD
Costs per hydrocarbon recovered 46.5USD/t
The costs could be further reduced by performing the project as a Clean DevelopmentMechanism (CDM) project within the framework of the Kyoto Protocol (see next paragraph).

Strengthening of Hydrocarbon Unit (Phase II) – Petroleum Refining & Marketing (Package # 06)
HSE recommendation report
SOFRECO - SRGB 25
2.6 Clean Development Mechanism Projects (CDM)
Recommendation: Consider participation in the Kyoto CO2 trading (CDM) for projectsregarding emission reduction or energy saving.
The CDM is one of the "flexibility mechanisms" that are defined in the Kyoto Protocol. Theflexibility mechanisms are designed to allow so-called Annex B countries to meet theiremission reduction commitments by sponsoring projects in developing countries.
Emission reduction is accomplished by projects in developing countries. These reductions aresubtracted against a hypothetical baseline of emissions. The emissions baseline is theemissions that are predicted to occur in the absence of a particular CDM project. CDMprojects are credited against this baseline, in the sense that developing countries gain creditfor producing these emission reductions.
The economic basis for including developing countries in efforts to reduce emissions is thatemission cuts are thought to be less expensive in developing countries. In developingcountries, environmental regulation is generally weaker than it is in developed countries. Thus,there is greater potential for developing countries to reduce their emissions than in developedcountries.
A CDM project has to follow a specific procedure:
Project Design Document (PDD): The PDD has both a prescribed format and mandatorycontent and provides the basis on which project approval decisions are made. Its maincomponent, apart from a detailed description of the project activity, is an outline of a referencescenario. The scenario describes the investment that would be made and/or the businessapproach that would be taken in the absence of the project. This is often termed as thereference scenario. When identifying the reference scenario, available technologies, stateincentive programmes and statutory requirements must be taken into account. The emissionsare estimated that would result if the reference scenario occurred. The estimate is known asthe baseline. The baseline is then compared with a forecast of the emissions that would occurif the project activity were implemented. This allows calculation of the emission reductionsexpected from the project.
A key prerequisite in the approval of a climate change project is the criterion of additionality.This requires that climate change projects only be approved if they would not have come tofruition without the incentives provided by the CDM mechanism.
Assessment/ypproval: The PDD is assessed by a certified organisation and after thatregistered by the CDM Executive Board. The CDM Executive Board will issue Certificates ofEmission Reduction based on monitoring results, which can be sold on the free market inindustrialised countries, which take part in emission trading.
The actual exchange rate for Certified Emission Reductions is in the order of magnitude of 10to 15 EUR.
1 t of recovered hydrocarbon is equivalent to approximately 3 t of CO2 - i.e. by taking part inthe CDM a significant additional positive effect can be achieved.

Strengthening of Hydrocarbon Unit (Phase II) – Petroleum Refining & Marketing (Package # 06)
HSE recommendation report
SOFRECO - SRGB 26
2.7 Improvement of wastewater treatment
Recommendation: Improve wastewater treatment by applying a secondary or tertiarystage wastewater treatment unit.
The ERL is equipped with a simple API separator for primary wastewater treatment. Accordingto the available knowledge the Bangladesh wastewater standards - especially COD 200 mg/land BOD 30 mg/l - cannot be achieved with primary wastewater treatment only.
Best practise for refineries worldwide is a three stage wastewater treatment:
2.7.1 Primary treatment
Primary treatment facilities are separators, which provide an environment in which suspendedsolids can be settled coincidentally with the separation of oil in the influent. They are facilities,which will separate free oil from waste water but will not separate soluble substances, nor willthey break emulsions. Despite their relative simplicity, most of the oil in the effluent will berecovered at the primary treatment stage. The most relevant types are:
An API separator is the simplest form of separator, the separating chamber simply consistingof an open rectangular basin. The standard API separators existing in many refineriescomprise an inlet section and oil-water separation chambers. The approach channel andtransition part are usually constructed in at least two bays in order to facilitate their cleaningand repair when required. Flight scrapers may be installed to gently move the sludge to asludge collection pit and oil to the oil skimming device. Covers may be installed to reduceodour and emissions to the air of Volatile Organic Compounds (VOC). The main advantage ofthe API separator is that its large volume can intercept large slugs of free oil and solids. Thisfactor helps to improve the performance of the downstream stages. Its main disadvantagesare that it requires a large area of land and can only remove comparatively large oil droplets.
A Parallel Plate Interceptor (PPI) is a gravity separator equipped with plates parallel to thecurrent to promote laminar flow and reduce the separation distance. Within a PPI thecombined surface area of the plates is significantly higher than the surface area of theconventional API separator, resulting in a smaller ground area. The main disadvantage is thatthe plates are susceptible to fouling and hence there is an increased maintenancerequirement.
In a Corrugated Plate Interceptor (CPI) specially designed corrugated plate packs are placedcounter current to the flow, i.e. the effluent flows downward whereas the oil flows upward to thesurface. The advantages are a small surface area and increased efficiency over API and PPIequipment as the CPI can remove smaller oil droplets. The disadvantages are again thepossibility of fouling and increased maintenance. The CPI is particularly suitable for installationon individual processing areas, as close as possible to the point of waste water generation. Inthese circumstances, there is less likelihood of fouling, the oil may be able to be recycleddirectly to the unit, and the load on the site effluent treatment plant is reduced.
2.7.2 Secondary treatment
Secondary treatment is aiming at reducing emulsified contaminants. Flotation devices areforms of enhanced gravity separation which rely on the formation of weak bonds between airbubbles and oil and solid particles. The air bubbles provide the necessary buoyancy to floatthe oil and solid particles to the water surface for skimming.
There are two main types known as Dissolved and Induced Air Flotation (DAF, IAF). They aregenerally installed downstream of separators as a secondary treatment prior to a biologicalprocess. Designed and operated correctly, they are capable of separating and removingvirtually all free oil from an effluent stream and can significantly reduce the concentration of

Strengthening of Hydrocarbon Unit (Phase II) – Petroleum Refining & Marketing (Package # 06)
HSE recommendation report
SOFRECO - SRGB 27
suspended solids, but as with normal gravity separators, they will not separate out solublesubstances. An added benefit of air operated flotation units is that they increase the dissolvedoxygen content of the effluent.
2.7.3 Tertiary treatment
Tertiary treatment is a biological treatment of effluent water based on the process in which amixed population of micro-organisms uses as nutrients substances that contaminate the water.This is the same mechanism by which healthy natural waterways, such as rivers and lakes,purify themselves. This basic process has been intensified and accelerated to give a widerange of treatment plant systems for treating refinery effluent water. Effluent water containingpolluting material is brought into contact with a dense population of suitable micro-organismsfor a time sufficient for the microbes to break down the contaminants. The pollutants areadsorbed into the microbial mass, typically oxidised, and partly converted into new cellmaterial. Aerobic processes remove a wide range of carbonaceous material, typicallycharacterised in terms of the associated oxygen demand (e.g. TOD/COD/BOD or TOC) andindividual compounds such as phenols, ammonia and sulphide.
Although there also some other processes, the activated sludge (AS) process is the mostrelevant for refineries. The activated sludge process is a dispersed or suspended growthsystem comprising a mass of micro-organisms constantly supplied with organic matter and, foraerobic treatment, oxygen. The micro-organisms grow in flocs, and in aerobic treatment, theseflocs are responsible for the transformation of organic material into new bacteria, carbondioxide and water, and for ammonia reduction into nitrite and nitrate. In anoxic treatment, thenitrate and nitrite are further reduced to gaseous nitrogen. The flocs are constantly beingwashed out of the reaction vessel to the secondary sedimentation tank or clarifier by the flowof effluent. Here they flocculate and settle under quiescent conditions. It is a characteristic ofthe activated sludge process that a proportion of this settled sludge is recycled back to themixing/yeration tank to provide sufficient biomass for contaminant removal. Any excessbiological solids are removed, dewatered, and sent for disposal.
2.7.4 Wastewater management
To minimise the wastewater treatment requirements some measures of managing the totalamount and segregation of the individual wastewater streams should be analysed:
Sour water can be used to the maximum extend possible as desalted wash water.
Equalising tanks for the storage of waste water can be used to avoid peak loads for thewastewater treatment.
Rainwater from polluted plant areas should be collected and routed to the treatment plant.Depending on the initial degree of pollution (mainly oil), an adapted partial treatmentaccording to a first flush scheme could be sufficient. Non-contaminated water may bedischarged directly or re-used in order to save costs.
Control of surfactants in wastewater - surfactants entering the refinery wastewater streams willincrease the amount of emulsions and sludges generated. Surfactants can enter the systemfrom a number of sources including washing unit pads with detergents, caustic treatment,cleaning tank truck tank interiors or using cleaners for miscellaneous tasks.
Refinery effluents can also be treated in municipal sewage treatment plants or installationsthat are shared with other industries. In these cases, the effluent will normally be given primaryand secondary treatment at the refinery to remove free oil before it is passed to the commoninstallation. There can be advantages to both parties in such treatment in that the domesticsewage provides nutrients, and dilutes any surges of chemicals which are toxic to thebiomedia. The common plant can benefit by receiving a reasonably constant flow to balanceout peak loads. Especially at locations with no existing installations like in Chittagong thisoption should be checked.

Strengthening of Hydrocarbon Unit (Phase II) – Petroleum Refining & Marketing (Package # 06)
HSE recommendation report
SOFRECO - SRGB 28
2.8 Waste management
Recommendation: Prepare for an improved waste treatment system.
Oily sludge mainly from the API separators is the most relevant source of waste at the Easternrefinery in its present state. The total sludge produced is approx. 650 t/y or 0.43 kg/t.Compared to more complex refineries, the total quantity of waste is significantly lower as thereare less spent catalysts and absorbents that have to be disposed and there is no sludge fromsecondary or tertiary wastewater treatment. The comparatively low figure is simply due to thelow complexity and low standard of wastewater treatment and does not mean that there is aneffective waste management in place.
The sludge is stored at an open pit and then sold as alternative fuel, i.e. the sludge is notconsidered as waste that has to be managed under special control but as some kind ofadditional product.
In the future and depending on the selected scenario for increasing the capacity of therefinery different problems could arise:
The current procedure of selling the sludge off as a heating medium is only possible becausethe legal framework in Bangladesh does not comply with international standards. Futureconstraints could come directly from legal requirements but also from offtakers, who might runinto problems with their combustion facilities that could have to cope with increasingly strict airemission control requirements.
The upgrading of the refinery will lead to additional quantities of oily sludge because thequantity increases with the capacity of the refinery. For the 6 million t/y case there would besome 3,000 t/y of oily sludge. It is questionable, if a market is readily available for this product.
Upgrading of the wastewater treatment will produce biotreatment sludge as new kind ofsludge that does not exist at the time being - the quantity will be only a little less than of oilysludges. Biotreatment sludge does not contain relevant quantities of oil but water - it will notbe possible to market it as a fuel like oily sludge.
2.8.1 Sludge treatment
Treatment of sludges before disposal is applied to:
to reduce the quantity of waste requiring disposal
to recover the oil for recycling
The choice of whether to treat the sludge depends on many factors including the compositionof the sludge and the choice of disposal route. For example, if the sludge is to be used as afuel, it will be important to remove the water, but not the oil. Alternatively if a biosludge which isessentially oil free is to be spread on land (so-called land farming), it may be preferable toleave it wet.
Centrifugation exploits the difference in density between solids and liquids by applyingcentrifugal force. Two main types of decanter centrifuge can be applied at refineries: 2-phase,which yields a solids cake plus a single effluent stream (mixed oil and water); and 3-phasewhich yields separate oil and water streams, as well as the cake. Advantages of decantercentrifuges include resource recovery, flexibility and high volume reduction. With goodoperation, cake suspended solid contents of 20-40 % can be achieved. Centrifugation ofsludges need not be handled by the refinery itself, but can also be contracted to specialisedcompanies on a discontinuous basis.
Filter presses mechanically dewater sludges by pressure. The benefits are high volumereduction and recovery of oil from oily sludges. In most cases, filter aids are needed toenhance dewatering and prevent clogging of the filter but will increase waste volumes.

Strengthening of Hydrocarbon Unit (Phase II) – Petroleum Refining & Marketing (Package # 06)
HSE recommendation report
SOFRECO - SRGB 29
Heating and flocculants may also be used to enhance performance. Belt filter presses canproduce a 15-20 % suspended solids filter cake but have high maintenance requirements andcan have problems with the processing of oily sludge due to filter cloth blockage. In plate andframe presses the sludge is mechanically squeezed in filter-cloth lined chambers.
By sludge treatment the quantities of sludge for scenario 4/5 (6 million t/y) could be reduced toapproximately 600 t/y of oily sludges and about the same quantity of biosludges.
Cost of pretreatment is approx. 50 - 100 USD/t for EU refineries, at least for oily sludges therecovered oil would compensate for these costs. In any case the pretreatment costs have tobe assessed against the benefit of recovered oil and the costs that can be saved on thedisposal.
2.8.2 Sludge disposal
It goes without saying that the present way of selling the sludge as a heating medium is themost feasible for the refinery. Conditions to proceed like this have to be monitored carefully,potential alternative offtakers should be identified as well their potential problems.
Depending on their processes different types of offtakers will have different problems withrefinery sludges. Heavy metals is one of the most relevant problems and can be solved betterat installations like cement kilns because here heavy metals are demobilised at least to someextent in the cement matrix. Another possibility is installations that are equipped with someflue gas treatment like power stations, which can cope with the additional problems caused bysludge burning.
Once the sludges cannot be sold for a positive price, it might be the economically mostfeasible approach to sell them for a negative price, i.e. to pay for disposal as alternative fuel.For the new biosludges it has to be expected that a positive price cannot be achieved fromthe very beginning.
If for whatever reason it will no longer be possible to market the sludges, appropriate ways fordisposing the sludges off have to be identified:
Landfill is to deposit wastes either in specially excavated or pre-existing depressions in theground or specially prepared sites above ground. After deposition, the wastes are coveredwith soil and the land is rehabilitated. Landfilling is in most cases the least costly solution but itstrongly depends on the legal framework, in many EU countries simply landfilling untreatedrefinery sludges is not possible anymore due to hazards from mobilising contaminants fromthe sludges into the groundwater despite mitigation methods such as impervious membranesor layers. Some landfills require solidification of sludges to bind contaminants in cement orsimilar materials.
Dedicate waste incineration is high temperature oxidation which converts oily sludges intosolid ash. Waste incineration plants can be operated by the refinery or by others ascooperative, commercial or municipal installations; however, this alternative is highly costly andshould be taken into account not before all other solutions have turned out not feasible.


![PPAR: Bangladesh: Ganges-Kobadak Irrigation Rehabilitation ... · Title: PPAR: Bangladesh: Ganges-Kobadak Irrigation Rehabilitation Project (Loan 671-BAN[SF]) Author: Asian Development](https://static.fdocuments.in/doc/165x107/5f87bd77888d5524a31f3544/ppar-bangladesh-ganges-kobadak-irrigation-rehabilitation-title-ppar-bangladesh.jpg)