Bangkok Expressway and Metro Public Company Limited (BEM) · PPL O&M service income Annual Income...
26
Bangkok Expressway and Metro Public Company Limited (BEM) October 2019
Transcript of Bangkok Expressway and Metro Public Company Limited (BEM) · PPL O&M service income Annual Income...
Bangkok Expressway and Metro Public Company Limited (BEM)October 2019
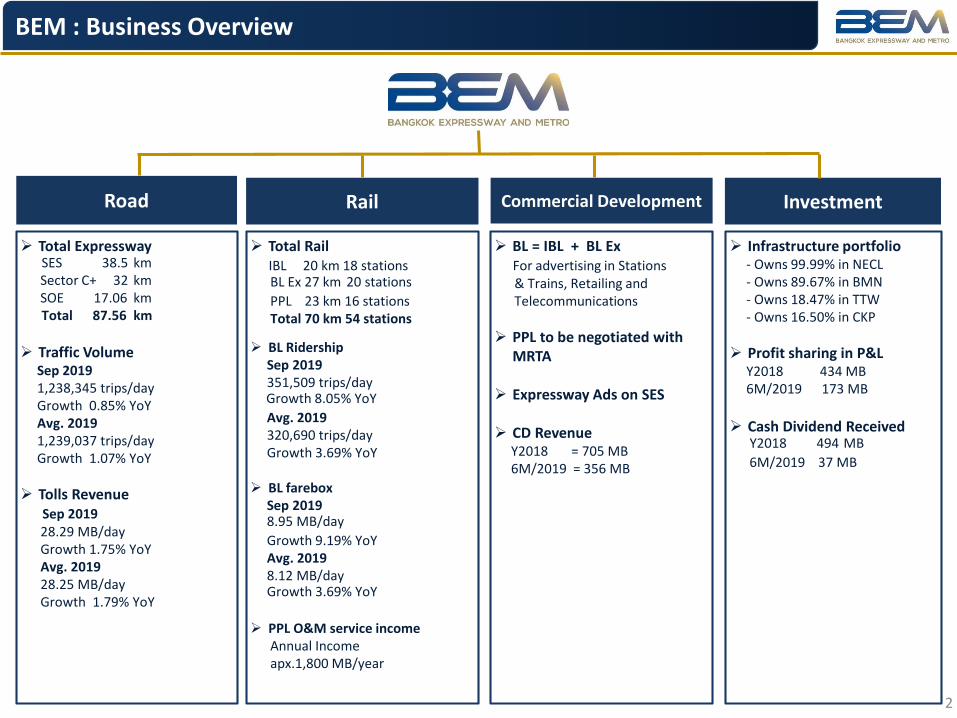
Road Rail Commercial Development Investment
➢ Total Expressway SES 38.5 kmSector C+ 32 kmSOE 17.06 kmTotal 87.56 km
➢ Traffic VolumeSep 20191,238,345 trips/dayGrowth 0.85% YoY Avg. 2019 1,239,037 trips/dayGrowth 1.07% YoY
➢ Tolls RevenueSep 201928.29 MB/dayGrowth 1.75% YoYAvg. 2019 28.25 MB/dayGrowth 1.79% YoY
➢ Total RailIBL 20 km 18 stationsBL Ex 27 km 20 stations
PPL 23 km 16 stations Total 70 km 54 stations
➢ BL RidershipSep 2019351,509 trips/dayGrowth 8.05% YoY
Avg. 2019 320,690 trips/dayGrowth 3.69% YoY
➢ BL farebox Sep 20198.95 MB/day
Growth 9.19% YoYAvg. 20198.12 MB/dayGrowth 3.69% YoY
➢ PPL O&M service incomeAnnual Income apx.1,800 MB/year
➢ BL = IBL + BL Ex For advertising in Stations& Trains, Retailing andTelecommunications
➢ PPL to be negotiated with MRTA
➢ Expressway Ads on SES
➢ CD RevenueY2018 = 705 MB6M/2019 = 356 MB
➢ Infrastructure portfolio- Owns 99.99% in NECL- Owns 89.67% in BMN- Owns 18.47% in TTW- Owns 16.50% in CKP
➢ Profit sharing in P&L Y2018 434 MB6M/2019 173 MB
➢ Cash Dividend Received Y2018 494 MB
6M/2019 37 MB
2
BEM : Business Overview
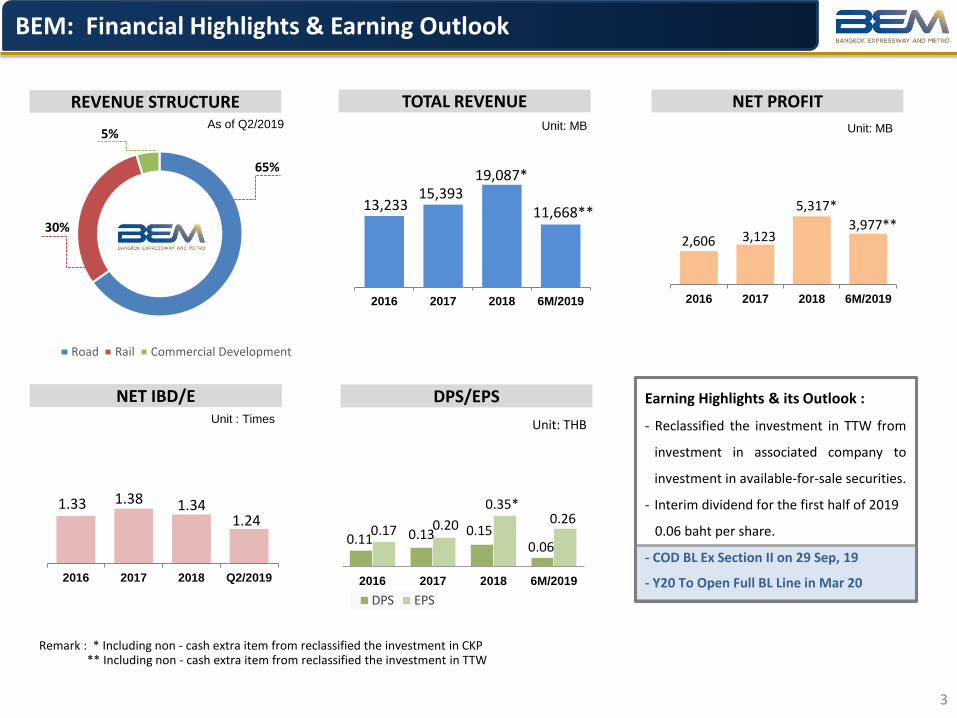
13,233 15,393
19,087*
11,668**
2016 2017 2018 6M/2019
Unit: MB
2,606 3,123
5,317*
3,977**
2016 2017 2018 6M/2019
NET PROFIT
DPS/EPS
1.33 1.38 1.341.24
2016 2017 2018 Q2/2019
NET IBD/EUnit : Times
Unit: MB
TOTAL REVENUE
3
REVENUE STRUCTURE
Earning Highlights & its Outlook :
- Reclassified the investment in TTW from
investment in associated company to
investment in available-for-sale securities.
- Interim dividend for the first half of 2019
0.06 baht per share.
- COD BL Ex Section II on 29 Sep, 19
- Y20 To Open Full BL Line in Mar 20
BEM: Financial Highlights & Earning Outlook
As of Q2/2019
Road Rail Commercial Development
65%
30%
5%
0.11 0.13 0.150.06
0.17 0.20
0.35*0.26
2016 2017 2018 6M/2019
Unit: THB
DPS EPS
Remark : * Including non - cash extra item from reclassified the investment in CKP** Including non - cash extra item from reclassified the investment in TTW
Overview of Expressway Business
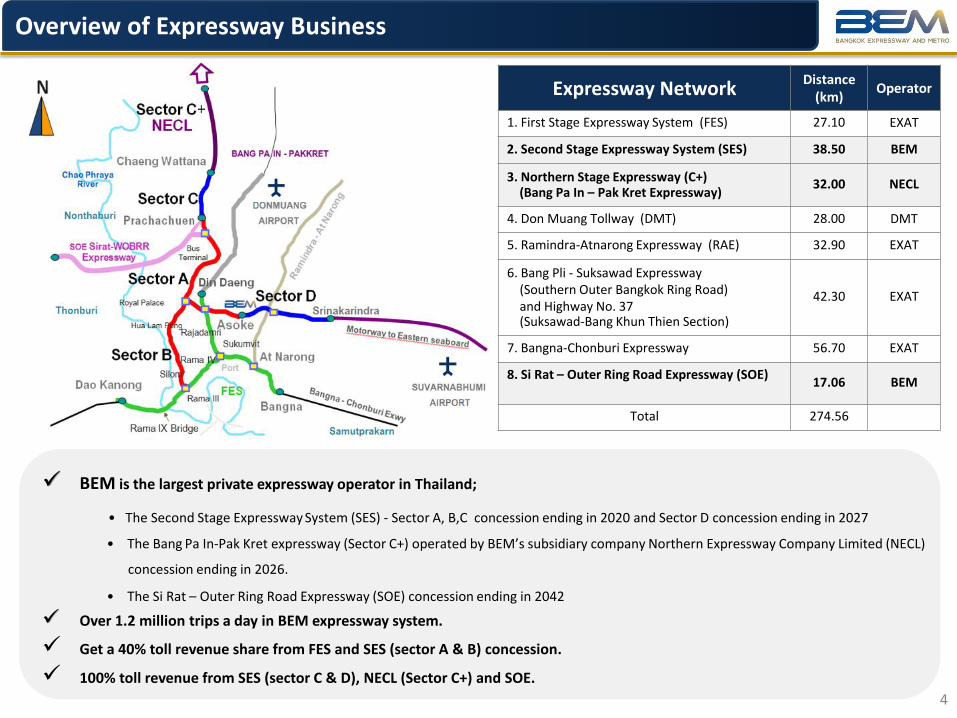
Expressway NetworkDistance
(km)Operator
1. First Stage Expressway System (FES) 27.10 EXAT
2. Second Stage Expressway System (SES) 38.50 BEM
3. Northern Stage Expressway (C+)(Bang Pa In – Pak Kret Expressway)
32.00 NECL
4. Don Muang Tollway (DMT) 28.00 DMT
5. Ramindra-Atnarong Expressway (RAE) 32.90 EXAT
6. Bang Pli - Suksawad Expressway (Southern Outer Bangkok Ring Road) and Highway No. 37 (Suksawad-Bang Khun Thien Section)
42.30 EXAT
7. Bangna-Chonburi Expressway 56.70 EXAT
8. Si Rat – Outer Ring Road Expressway (SOE)17.06 BEM
Total 274.56
4
✓ BEM is the largest private expressway operator in Thailand;
• The Second Stage Expressway System (SES) - Sector A, B,C concession ending in 2020 and Sector D concession ending in 2027
• The Bang Pa In-Pak Kret expressway (Sector C+) operated by BEM’s subsidiary company Northern Expressway Company Limited (NECL)
concession ending in 2026.
• The Si Rat – Outer Ring Road Expressway (SOE) concession ending in 2042
✓ Over 1.2 million trips a day in BEM expressway system.
✓ Get a 40% toll revenue share from FES and SES (sector A & B) concession.
✓ 100% toll revenue from SES (sector C & D), NECL (Sector C+) and SOE.

2042
2027
20268,815 9,301
9,957 10,174
5,103
1,142 1,178 1,214 1,230 1,238
2015 2016 2017 2018 6M/2019
Expressway Revenues (MB)
Traffic ('000 Trips/Day)
Remaining Concession PeriodToll Revenues & Traffic Financial Strength
2019
2020
Toll Revenues
Existing Projects
( FES&SES&C+)
✓ Reliable cash revenues✓ Toll revision every 5 years
✓ Rights to extend the contract for 10 years twice
SOE Project
✓ 15-20 mins to downtown ✓ East - West Corridor link ✓ Toll hike every 5 years
without applying CPI base
Traffic
✓ Steady traffic growth✓ CAGR = 2.65% (2011 - 2018)✓ SOE contributes highest
traffic growth.
SOE ramp to north (heading to Chaeng Wattana road) Project
2042
FES & SES (Sector A-B-C)
Udonrattaya (Sector C+)
Sirat Outer Ring
(SOE)
SES Extension(Sector D)
2040
SOE Ramp✓ SOE Ramp to north connects SES (Sector A) heading to Chaeng
Wattana road and Bang Pa In (Sector C+)
✓ More convenience for expressway users.
✓ Reduce travel time from local road and traffic congestion on Kamphaeng Phet 2 road.
✓ Approximately 360 meters long.
2030
Highlights of Expressway Business
5

Source : MOT
Future Bangkok Mass Rapid Transit Network: 10 Lines total 464 kms.
Thammasart –Mahachai(80.8 kms.)
1
2 Salaya-Hau Mark(48 kms.)
3 Airport Link (50.3 kms.)
4 Lumlukka – Bang Pu (66.5 kms.)
5 Yot Se – Bang Wa(15.5 kms.)
6
Bang Sue – Phuttamonthon Sai 4(55 kms.)
7 Bang Yai – Rat Burana (42.8 kms.)
8Taling Chan-Min Buri– Thailand Cultural Center(37.5 kms.)
10 Lat Phrao - Samrong(30.4 kms.)
9 Kae Rai– Min Buri(36 kms.)
6
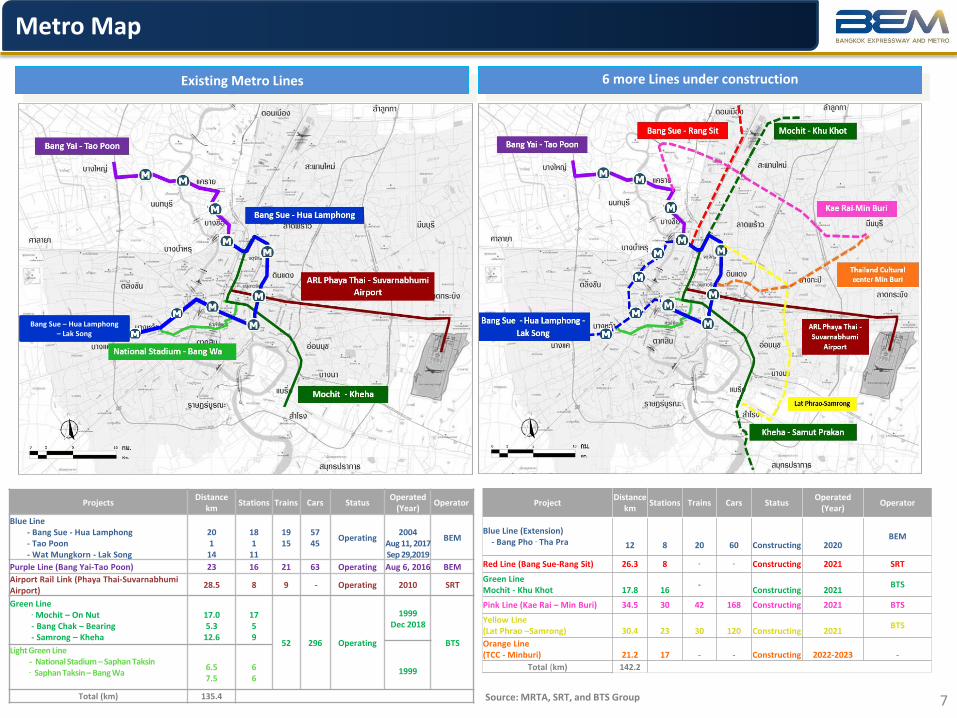
Bangkok Metropolitan Mass Rapid Transit Network Master Plan
ProjectsDistance
kmStations Trains Cars Status
Operated(Year)
Operator
Blue Line - Bang Sue - Hua Lamphong- Tao Poon- Wat Mungkorn - Lak Song
201
14
181
11
1915
5745
Operating2004
Aug 11, 2017Sep 29,2019
BEM
Purple Line (Bang Yai-Tao Poon) 23 16 21 63 Operating Aug 6, 2016 BEM
Airport Rail Link (Phaya Thai-Suvarnabhumi Airport)
28.5 8 9 - Operating 2010 SRT
Green Line - Mochit – On Nut- Bang Chak – Bearing - Samrong – Kheha
17.05.3
12.6
1759
52 296 Operating
1999Dec 2018
BTS
1999
Light Green Line- National Stadium – Saphan Taksin- Saphan Taksin – Bang Wa
6.57.5
66
Total (km) 135.4
Existing Metro Lines 6 more Lines under construction
ProjectDistance
kmStations Trains Cars Status
Operated(Year)
Operator
Blue Line (Extension)- Bang Pho - Tha Pra 12 8 20 60 Constructing 2020
BEM
Red Line (Bang Sue-Rang Sit) 26.3 8 - - Constructing 2021 SRT
Green Line Mochit - Khu Khot 17.8 16
-Constructing 2021
BTS
Pink Line (Kae Rai – Min Buri) 34.5 30 42 168 Constructing 2021 BTS
Yellow Line (Lat Phrao –Samrong) 30.4 23 30 120 Constructing 2021
BTS
Orange Line(TCC - Minburi) 21.2 17 - - Constructing 2022-2023 -
Total (km) 142.2
Source: MRTA, SRT, and BTS Group 7
Metro Map
Bang Sue – Hua Lamphong – Lak Song

Initial Blue Line
Blue Line Extension
Ch
ao P
hraya R
iver
The B
lue Lin
e Extensio
n
Tao Poon Bang Sue Kamphaeng Phet
Chatuchak Park
Phahon Yothin Lat Phrao
Ratchadaphisek
Sutthisan
Huai Khwang
Thailand Cultural Centre
Phra Ram 9
Phetchaburi
Queen Sirikit National Convention Centre
Sukhumvit
Khlong ToeiLumphiniSi LomSam YanHua Lamphong
Section ISection III
Section II
Opened 11 Aug 2017
Open Sep 2019
SCG HQ JJ Market
Chatuchak Park
Central Ladprao
Union Mall
Muang Thai Phatra complex
The Street Ratchada
Thai Life Insurance TCC
Esplanade
SET & AIA
Chinese Embassy
Fortune towerCentral Phra Ram 9
Super tower
ARL
Terminal 21
Interchange Tower
Exchange Tower
QSNCC
FYI Tower
Lumphini Park
Hua Lamphong temple Q House tower
Dusit Central Park
Chulalongkorn Hospital
Chamchuri Square
Hua Lamphong Grand station
China Town
Dragon temple
True tower
Chulalongkorn U.
G tower
Gourmet Market
Singha Complex
Sam Yan Mitrtown ONE Bangkok
Open Mar 2020
8
Map of Initial Blue Line (IBL)

Tao PoonBang PhoBang OBang Phlat
Sirindhorn
Bang Yi Khan
Bang Khun Non
Fai Chai
Bang Sue
Charan 13
Tha PhraBang WaPhetkasem 48
PhasiChareon
Bang Khae
Bang Phai
Hua LamphongWat Mangkon
Sam YotSanam Chai
Itsaraphap
Initial Blue Line
Blue Line Extension
Depot
Connect with Purple Line
Connect with Light Green Line
Connect with Light Red Line
Connect with Orange Line
Connect with Dark Red Line
Connect with Airport Rail Link
Dragon Temple
Yanhee Hospital
Wat Pho
Grand Palace
Siriraj Hospital
Central Wang Burapa
Existing : In
itial Blu
e Line
Makro Charan Br.
BIG C
The Mall Tha Pra
Seacon Bang Kae
The Mall Bang KaePaknam Temple
Hua Lumphong Grand Station
Rajini School
Royal Navy
Phayathai 3Hospital
China Town
Sampheng Wholesale Market
Pahurat Cloth Market
Lak Song
EGAT HQ
Flower Market
The Old Siam Mall
Mega Shopping Mall
Major Pinklao
Central Pinklao
EENN Hospital
Thonburi 2 Hospital
New Parliament
Thammasart U.
Ch
ao P
hraya R
iver
Siam Museum
Bank of Thailand
Depot
TiewpaingamSchool
Somdejchaopraya University
Emerald Buddha Temple
Yothinburana School
Siam University
SCG HQ
Connect with Yellow Line
Section I
Section III
Section II
Opened 11 Aug 2017
Open Mar 2020
Opened Sep 2019
Map of Blue Line Extension (BL EX)
9
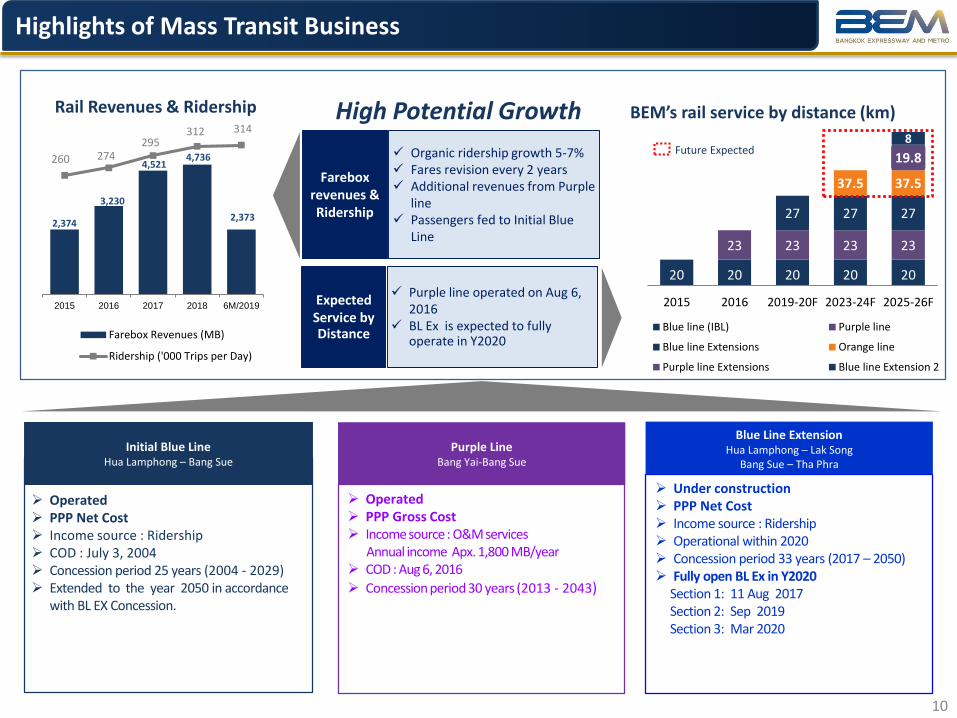
20 20 20 20 20
23 23 23 23
27 27 27
37.5 37.5
19.8
8
2015 2016 2019-20F 2023-24F 2025-26F
BEM’s rail service by distance (km)
Blue line (IBL) Purple line
Blue line Extensions Orange line
Purple line Extensions Blue line Extension 2
Future Expected
Rail Revenues & Ridership High Potential Growth
➢ Operated➢ PPP Gross Cost➢ Income source : O&M services
Annual income Apx. 1,800 MB/year➢ COD : Aug 6, 2016
➢ Concession period 30 years (2013 - 2043)
Purple Line Bang Yai-Bang Sue
➢ Under construction➢ PPP Net Cost➢ Income source : Ridership➢ Operational within 2020➢ Concession period 33 years (2017 – 2050)➢ Fully open BL Ex in Y2020
Section 1: 11 Aug 2017Section 2: Sep 2019Section 3: Mar 2020
Blue Line ExtensionHua Lamphong – Lak Song
Bang Sue – Tha Phra
Farebox revenues & Ridership
✓ Organic ridership growth 5-7%✓ Fares revision every 2 years✓ Additional revenues from Purple
line✓ Passengers fed to Initial Blue
Line
Expected Service by Distance
✓ Purple line operated on Aug 6, 2016
✓ BL Ex is expected to fully operate in Y2020
Initial Blue Line Hua Lamphong – Bang Sue
➢ Operated➢ PPP Net Cost➢ Income source : Ridership➢ COD : July 3, 2004➢ Concession period 25 years (2004 - 2029) ➢ Extended to the year 2050 in accordance
with BL EX Concession.
2,374
3,230
4,521 4,736
2,373
260 274 295
312 314
2015 2016 2017 2018 6M/2019
Farebox Revenues (MB)
Ridership ('000 Trips per Day)
10
Highlights of Mass Transit Business
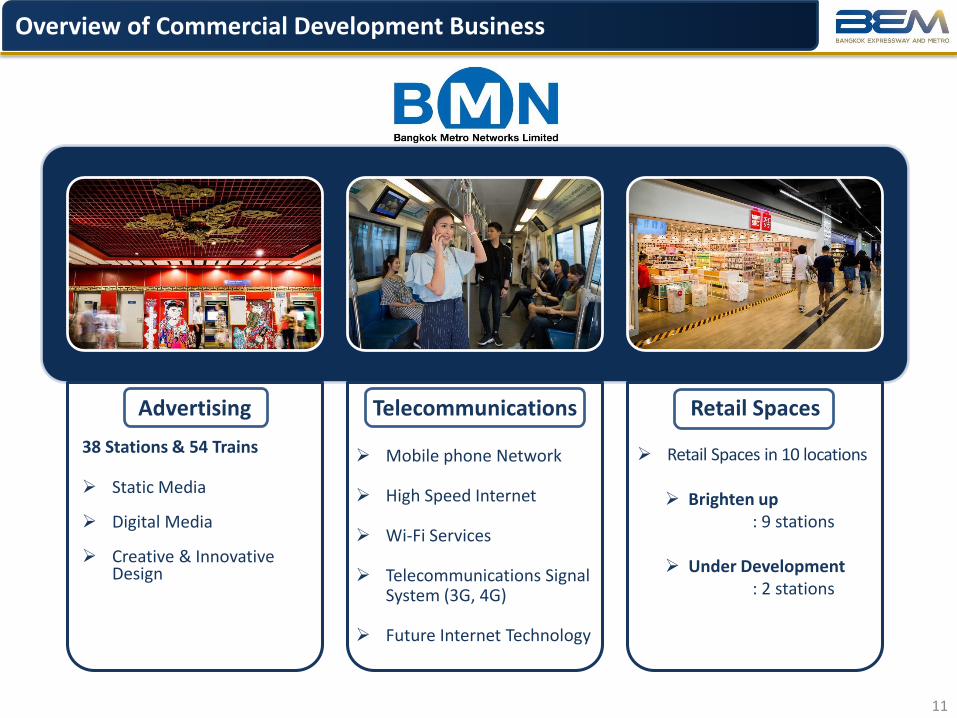
Advertising Telecommunications Retail Spaces
➢ Retail Spaces in 10 locations
➢ Brighten up: 9 stations
➢ Under Development: 2 stations
➢ Mobile phone Network
➢ High Speed Internet
➢ Wi-Fi Services
➢ Telecommunications Signal System (3G, 4G)
➢ Future Internet Technology
38 Stations & 54 Trains
➢ Static Media
➢ Digital Media
➢ Creative & Innovative Design
11
Overview of Commercial Development Business

Target
to double
CD revenue
in Y2021
549 573 675 705
356
2015 2016 2017 2018 6M/2019
Column1
CD RevenuesUnit: MB
More rooms to grow
Advertising✓ Revenue increased by eyeballs✓ Rooms to grow outside MRT
CD revenues ✓ CAGR = 5.88% p.a. (2015-2018)✓ New CD expected by 2019
Telecom ✓ Steady Cash Flow ✓ Long term contracts
Retails✓ Rental rates increased by
ridership's traffic✓ Open more locations
➢ To Operate Commercial Development➢ Tao Poon station opened on 11 Aug. 2017
Blue Line ExtensionHua Lamphong – Lak Song
Bang Sue – Tha Phra
Future Projects
➢ To Operate Commercial Development (To be negotiated with MRTA)
Purple Line Bang Yai-Bang Sue
CD projects outside MRT
➢ Advertising outside MRT, ie. Expressway.➢ Retails business➢ Telecommunications
12
Highlights of Commercial Development Business

BMN’s Retail Spaces • 9 stations , 10 locations• Total spaces 14,000 sqm.• Chatuchak Park station owns the
largest retail spaces 2,034 sqm.
BMN’s Strategic Alliances • Starbucks • Lawson • Amazon • Dunkin Donuts• Gourmet Market• Bread Talk • Au Bon Pain• S&P • A&W• Dairy Queen
Looking Ahead • Lat Phrao sation• Phahon Yothin station
Phetchaburi station
Thailand Cultural Center station
Chatuchak Park station
13
Commercial Development Update

Consolidated (Unit : MB.) 2018 2017 %CHANGE
Revenue :-
Revenue from Expressway business 10,174 9,957 2.18%
Revenue from Rail business 4,736 4,521 4.76%
Revenue from Commercial development business 705 675 4.44%
Others 3,472 240 1346.67%
Total Revenue 19,087 15,393 24.00%
Expense :-
Costs of Expressway business (1,838) (1,735) 5.94%
Costs of Rail business (3,542) (3,353) 5.64%
Costs of Commercial development business (170) (177) -3.95%
Amortization – Expressway (4,037) (3,695) 9.26%
Amortization – Rail (188) (246) -23.58%
Selling (111) (95) 16.84%
Administration (1,252) (1,049) 19.35%
Profit before share of profit from investments in associates,financial cost and income tax expenses
7,949 5,043 57.62%
Share of profit (loss) from investments in associates 433 406 6.65%
EBIT 8,382 5,449 53.83%
Financial Cost (1,857) (1,611) 15.27%
Income tax expenses (1,189) (696) 70.83%
Profit for the Period 5,336 3,142 69.83%
Profit/(Loss) Attributable to Non-controlling interests (19) (19) 0.00%
Profit Attributable to Equity Holders of the Company 5,317 3,123 70.25%
EPS (Bath)DPS (Baht)
0.350.15
0.200.13
14
Financial Highlights
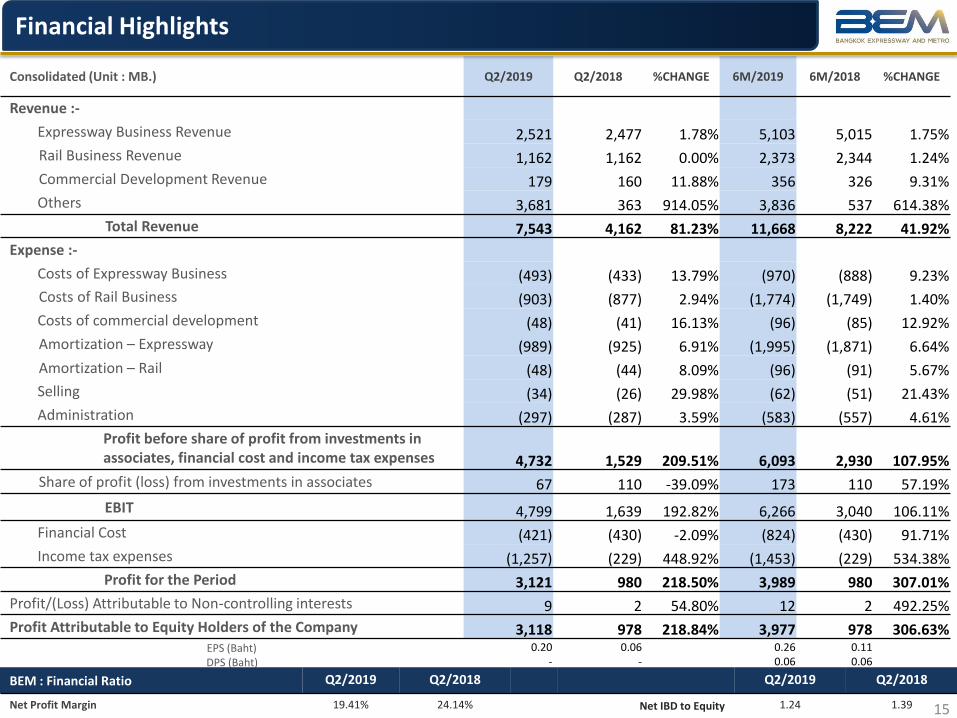
Consolidated (Unit : MB.) Q2/2019 Q2/2018 %CHANGE 6M/2019 6M/2018 %CHANGE
Revenue :-
Expressway Business Revenue 2,521 2,477 1.78% 5,103 5,015 1.75%
Rail Business Revenue 1,162 1,162 0.00% 2,373 2,344 1.24%
Commercial Development Revenue 179 160 11.88% 356 326 9.31%
Others 3,681 363 914.05% 3,836 537 614.38%
Total Revenue 7,543 4,162 81.23% 11,668 8,222 41.92%
Expense :-
Costs of Expressway Business (493) (433) 13.79% (970) (888) 9.23%
Costs of Rail Business (903) (877) 2.94% (1,774) (1,749) 1.40%
Costs of commercial development (48) (41) 16.13% (96) (85) 12.92%
Amortization – Expressway (989) (925) 6.91% (1,995) (1,871) 6.64%
Amortization – Rail (48) (44) 8.09% (96) (91) 5.67%
Selling (34) (26) 29.98% (62) (51) 21.43%
Administration (297) (287) 3.59% (583) (557) 4.61%
Profit before share of profit from investments in associates, financial cost and income tax expenses 4,732 1,529 209.51% 6,093 2,930 107.95%
Share of profit (loss) from investments in associates 67 110 -39.09% 173 110 57.19%
EBIT 4,799 1,639 192.82% 6,266 3,040 106.11%
Financial Cost (421) (430) -2.09% (824) (430) 91.71%
Income tax expenses (1,257) (229) 448.92% (1,453) (229) 534.38%
Profit for the Period 3,121 980 218.50% 3,989 980 307.01%
Profit/(Loss) Attributable to Non-controlling interests 9 2 54.80% 12 2 492.25%
Profit Attributable to Equity Holders of the Company 3,118 978 218.84% 3,977 978 306.63%EPS (Baht)DPS (Baht)
0.20-
0.06-
0.260.06
0.110.06
BEM : Financial Ratio Q2/2019 Q2/2018 Q2/2019 Q2/2018
Net Profit Margin 19.41% 24.14% Net IBD to Equity 1.24 1.39 15
Financial Highlights

Appendix (A)

1,000.00
1,050.00
1,100.00
1,150.00
1,200.00
1,250.00
1,300.00
2019 1,239.58 1,255.73 1,288.11 1,183.02 1,218.34 1,244.63 1,223.34 1260.20 1,238.35 1,239.04
2018 1,206.51 1,266.04 1,269.04 1,154.27 1,213.29 1,242.35 1,205.30 1,251.22 1,227.88 1,220.11 1,283.91 1,224.67 1,230.13 1.33%
2017 1,181.32 1,229.06 1,255.82 1,144.81 1,196.64 1,240.76 1,201.12 1,241.68 1,245.94 1,152.97 1,264.21 1,216.84 1,214.03 2.93%
2016 1,142.40 1,179.80 1,217.11 1,103.63 1,129.92 1,178.37 1,153.70 1,250.26 1,218.43 1,174.29 1,228.76 1,201.85 1,179.50 3.32%
2015 1,111.19 1,176.00 1,176.01 1,071.98 1,115.40 1,134.17 1,137.05 1,136.33 1,158.60 1,150.01 1,191.13 1,144.46 1,141.60 3.44%
%YoY 19/18 2.74% -0.81% 1.50% 2.49% 0.42% 0.18% 1.50% 0.72% 0.85%
Jan Feb Mar Apr May Jun Jul Aug Sep Oct Nov Dec Avg. % YoY
(Thousand trips / Day)
20192017
2015
2016
2018
17
Total Traffic Volume

Jan Feb Mar Apr May Jun Jul Aug Sep Oct Nov Dec Avg. % YoY
2019 28.17 28.54 29.34 26.96 27.73 28.42 27.94 28.83 28.29 28.25
2018 27.25 28.63 28.73 26.12 27.42 28.12 27.33 28.39 27.8 27.65 29.18 27.91 27.87 2.18%
2017 26.33 27.43 28.06 25.61 26.81 27.83 27.02 28.04 28.11 25.99 28.62 27.52 27.28 7.02%
2016 24.23 25.02 25.84 23.48 23.96 24.97 24.52 25.92 26.82 25.97 27.32 26.81 25.49 5.57%
2015 23.48 24.86 24.87 22.71 23.58 23.93 24.01 24.03 24.45 24.31 25.26 24.31 24.14 3.85%
%YoY 19/18 3.34% -0.81% 2.11% 3.22% 1.13% 1.08% 2.22% 1.57% 1.75%
20.00
22.00
24.00
26.00
28.00
30.00
(Million Baht / Day)
2016
2019
2015
2017
2018
18
Total Toll Revenue

YoY Sep-19 Sep-18 Change %
FES 375,417 371,602 3,815 1.03%
Sector A 220,094 223,835 -3,741 -1.67%
Sector B 98,030 97,851 179 0.18%
Urban 693,541 693,288 253 0.04%
Sector C 186,539 186,529 10 0.01%
Sector D 201,047 200,672 375 0.19%
SOE 67,066 56,245 10,821 19.24%
Sub urban 454,652 443,446 11,206 2.53%
Total BEM 1,148,193 1,136,734 11,459 1.01%
NECL (C+) 90,152 91,146 -994 -1.09%
Total BEM+NECL 1,238,345 1,227,880 10,465 0.85%
(Trips/Day) (Trips/Day)
YTD 9M-19 9M-18 Change %
FES 374,858 373,125 1,733 0.46%
Sector A 220,909 225,220 -4,311 -1.91%
Sector B 96,861 96,855 7 0.01%
Urban 692,629 695,200 -2,571 -0.37%
Sector C 188,217 185,445 2,772 1.49%
Sector D 203,078 200,267 2,811 1.40%
SOE 63,849 55,038 8,811 16.01%
Sub urban 455,144 440,750 14,394 3.27%
Total BEM 1,147,773 1,135,950 11,823 1.04%
NECL (C+) 91,264 90,024 1,240 1.38%
Total BEM+NECL 1,239,037 1,225,974 13,063 1.07%
19
Expressway : Total Traffic Volume

YoY Q2-2019 Q2-2018 Change %
FES 368,613 366,257 2,355 0.64%
Sector A 216,368 221,827 -5,459 -2.46%
Sector B 93,535 93,598 -63 -0.07%
Urban 678,516 681,682 -3,167 -0.46%
Sector C 184,878 182,988 1,890 1.03%
Sector D 199,156 196,577 2,579 1.31%
SOE 62,710 53,401 9,309 17.43%
Sub urban 446,745 432,966 13,779 3.18%
Total BEM 1,125,260 1,114,648 10,612 0.95%
NECL (C+) 90,106 88,769 1,337 1.51%
Total BEM+NECL 1,215,366 1,203,417 11,949 0.99%
(Trips/Day) (Trips/Day)
YTD 2018 2017 Change %
FES 372,745 373,215 -471 -0.13%
Sector A 224,854 226,693 -1,839 -0.81%
Sector B 97,199 99,182 -1,984 -2.00%
Urban 694,797 699,091 -4,294 -0.61%
Sector C 186,913 184,669 2,244 1.22%
Sector D 201,249 194,177 7,072 3.64%
SOE 56,090 49,946 6,145 12.30%
Sub urban 444,253 428,792 15,461 3.61%
Total BEM 1,139,050 1,127,883 11,167 0.99%
NECL (C+) 91,077 86,153 4,924 5.71%
Total BEM+NECL 1,230,126 1,214,036 16,090 1.33%
20
Expressway : Total Traffic Volume

YoY Sep-19 Sep-18 Change %
FES 7,625,345 7,528,822 96,523 1.28%
Sector A 4,338,748 4,405,820 -67,072 -1.52%
Sector B 1,976,848 1,972,012 4,836 0.25%
Urban 13,940,941 13,906,654 34,287 0.25%
Sector C 2,493,051 2,503,883 -10,832 -0.43%
Sector D 4,788,605 4,771,535 17,070 0.36%
SOE 3,153,665 2,642,647 511,018 19.34%
Sub urban 10,435,321 9,918,065 517,256 5.22%
Total BEM 24,376,262 23,824,719 551,543 2.32%
NECL (C+) 3,909,739 3,974,961 -65,222 -1.64%
Total BEM+NECL 28,286,001 27,799,680 486,321 1.75%
YTD 9M-19 9M-18 Change %
FES 7,602,058 7,567,862 34,196 0.45%
Sector A 4,354,085 4,435,049 -80,965 -1.83%
Sector B 1,954,067 1,954,505 -438 -0.02%
Urban 13,910,210 13,957,416 -47,206 -0.34%
Sector C 2,517,888 2,487,799 30,089 1.21%
Sector D 4,841,954 4,774,479 67,475 1.41%
SOE 3,002,292 2,585,659 416,633 16.11%
Sub urban 10,362,135 9,847,937 514,197 5.22%
Total BEM 24,272,345 23,827,935 444,410 1.87%
NECL (C+) 3,975,028 3,945,781 29,247 0.74%
Total BEM+NECL 28,247,373 27,751,134 496,238 1.79%
(Baht / Day) (Baht / Day)
21
Expressway : Total Toll Revenue
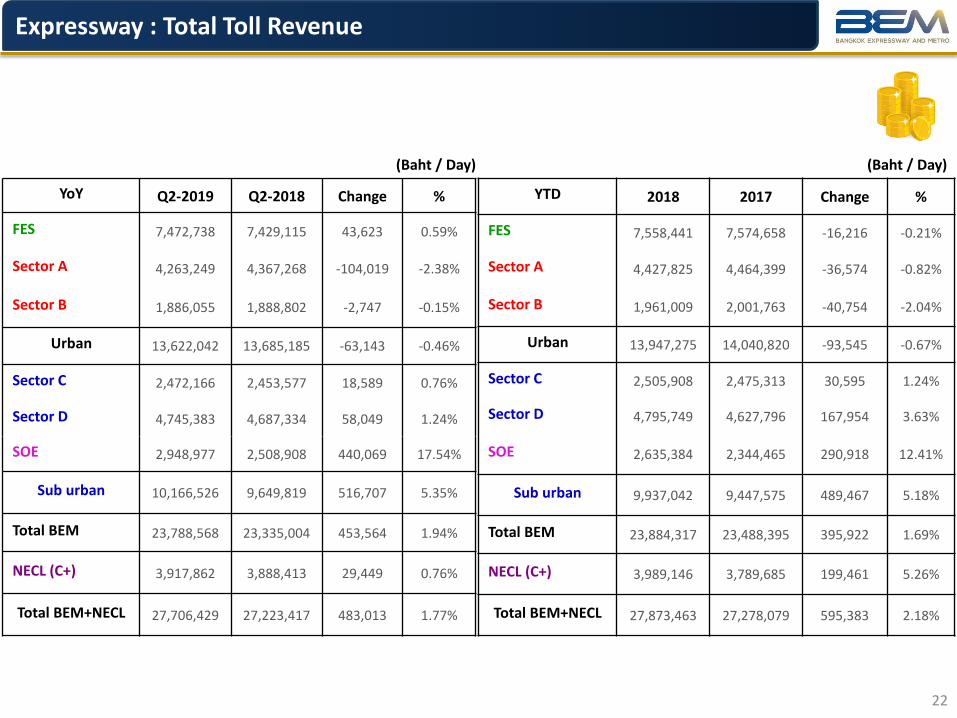
YoY Q2-2019 Q2-2018 Change %
FES 7,472,738 7,429,115 43,623 0.59%
Sector A 4,263,249 4,367,268 -104,019 -2.38%
Sector B 1,886,055 1,888,802 -2,747 -0.15%
Urban 13,622,042 13,685,185 -63,143 -0.46%
Sector C 2,472,166 2,453,577 18,589 0.76%
Sector D 4,745,383 4,687,334 58,049 1.24%
SOE 2,948,977 2,508,908 440,069 17.54%
Sub urban 10,166,526 9,649,819 516,707 5.35%
Total BEM 23,788,568 23,335,004 453,564 1.94%
NECL (C+) 3,917,862 3,888,413 29,449 0.76%
Total BEM+NECL 27,706,429 27,223,417 483,013 1.77%
(Baht / Day) (Baht / Day)
YTD 2018 2017 Change %
FES 7,558,441 7,574,658 -16,216 -0.21%
Sector A 4,427,825 4,464,399 -36,574 -0.82%
Sector B 1,961,009 2,001,763 -40,754 -2.04%
Urban 13,947,275 14,040,820 -93,545 -0.67%
Sector C 2,505,908 2,475,313 30,595 1.24%
Sector D 4,795,749 4,627,796 167,954 3.63%
SOE 2,635,384 2,344,465 290,918 12.41%
Sub urban 9,937,042 9,447,575 489,467 5.18%
Total BEM 23,884,317 23,488,395 395,922 1.69%
NECL (C+) 3,989,146 3,789,685 199,461 5.26%
Total BEM+NECL 27,873,463 27,278,079 595,383 2.18%
22
Expressway : Total Toll Revenue

200.00
220.00
240.00
260.00
280.00
300.00
320.00
340.00
360.00
380.00
2019 316 322 330 297 302 312 317 339 352 321
2018 299 324 315 278 295 316 301 331 325 321 343 292 312 5.50%
2017 273 299 308 266 274 303 282 313 319 300 322 282 295 7.65%
2016 256 278 283 248 245 279 269 286 294 291 290 264 274 5.12%
2015 245 269 269 238 239 269 266 261 275 277 273 245 260 2.79%
% YOY 19/18 5.96% -0.57% 4.80% 6.71% 2.44% -1.50% 5.18% 2.27% 8.05%
Jan Feb Mar Apr May Jun Jul Aug Sep Oct Nov Dec Avg. % YOY
(Thousand trips / Day)
2019
2015
2016
20172018
23
Metro : Average Daily Ridership : Blue Line (BL)

5.00
5.50
6.00
6.50
7.00
7.50
8.00
8.50
9.00
2019 8.04 8.15 8.35 7.51 7.65 7.87 7.98 8.58 8.95 8.12
2018 7.56 8.17 7.95 7.06 7.51 8.07 7.61 8.38 8.19 8.10 8.69 7.39 7.89 6.95%
2017 6.91 7.48 7.59 6.75 6.81 7.40 7.07 7.80 7.97 7.39 8.21 7.16 7.37 8.45%
2016 6.42 6.95 6.93 6.24 6.17 6.85 6.69 7.10 7.18 7.37 6.99 6.68 6.80 5.69%
2015 6.19 6.74 6.71 6.02 5.91 6.53 6.33 6.47 6.84 6.93 6.75 5.94 6.44 5.20%
%YoY 19/18 6.29% -0.27% 5.10% 6.45% 1.85% -2.49% 4.85% 2.38% 9.19%
Jan Feb Mar Apr May Jun Jul Aug Sep Oct Nov Dec Avg. %YoY
(Million Baht / Day)
2015
2016
20172018
24
2019
Metro : Average Daily Revenue : Blue Line (BL)
(Trips / Day)
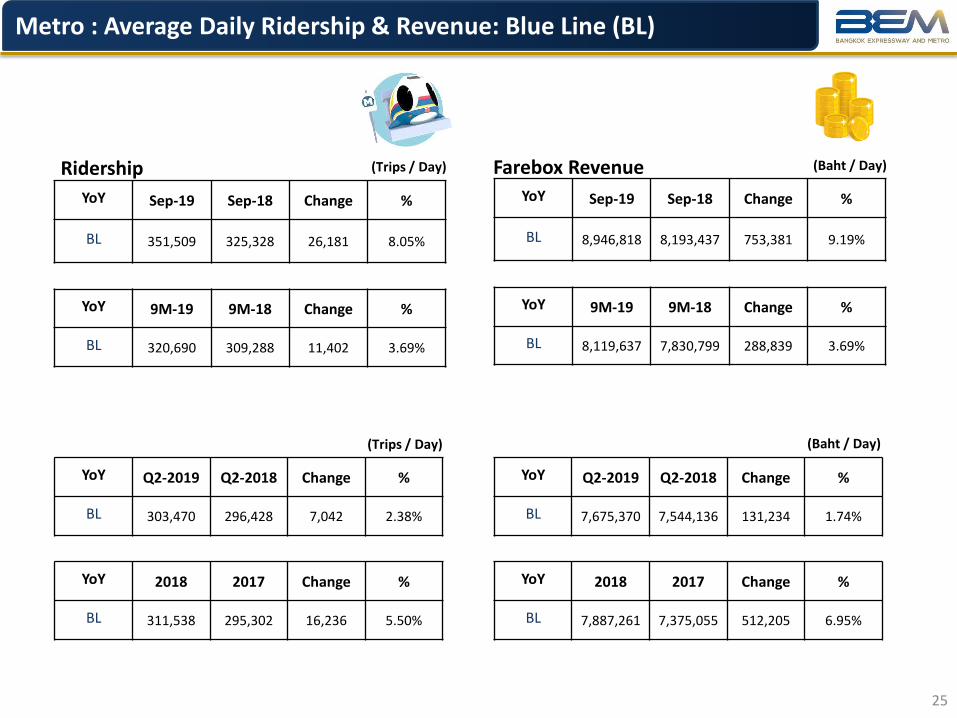
YoY Sep-19 Sep-18 Change %
BL 351,509 325,328 26,181 8.05%
YoY 9M-19 9M-18 Change %
BL 320,690 309,288 11,402 3.69%
YoY Q2-2019 Q2-2018 Change %
BL 303,470 296,428 7,042 2.38%
YoY 2018 2017 Change %
BL 311,538 295,302 16,236 5.50%
(Trips / Day)
(Baht / Day)
YoY Sep-19 Sep-18 Change %
BL 8,946,818 8,193,437 753,381 9.19%
YoY 9M-19 9M-18 Change %
BL 8,119,637 7,830,799 288,839 3.69%
YoY Q2-2019 Q2-2018 Change %
BL 7,675,370 7,544,136 131,234 1.74%
YoY 2018 2017 Change %
BL 7,887,261 7,375,055 512,205 6.95%
(Baht / Day)
Ridership Farebox Revenue
25
Metro : Average Daily Ridership & Revenue: Blue Line (BL)
DisclaimerThe information in this presentation has been prepared by Bangkok Expressway and Metro Public Company Limited (BEM) and is general background information about BEM’s activities current as at date of this presentation. This presentation is not intended to provide the basis of any investment decision, nor to substitute your own analysis and investigation and should not be considered as a recommendation to any recipient of this presentation. Before acting on any information you should consider the appropriateness of the information having regard to these matters, any relevant offer document and in particular, you should seek independent financial advice. All securities or instrument transactions involve risks and uncertainties which may cause the actual results, performance or achievements to be materially different from any future results, performance or achievements expressed or implied by such forward-looking statements. Nothing in this presentation is, or should be relied on as a promise or representation of BEM as to the future.
Thank youFor further inquiry
www.bemplc.co.th
Email : [email protected]