BANCOSTA Weekly Market Report · 2019-06-04 · dry cargo chartering Supramax sentiment has...
14
twitter.com/banchero_costa Follow us on: linkedin.com/company/banchero-costa Weekly Market Report Week 22/2019 (27 May – 31 May) Comment: Vietnam Coal Imports index comment page 2 chartering dry cargo “ 3 tankers “ 6 containers “ 8 sale & purchase newbuildings / finance “ 9 secondhand / demolition “ 10 commodities news “ 11 prices “ 13 banchero costa network chartering - sale&purchase - ship finance - insurance - agency - research - and more...
Transcript of BANCOSTA Weekly Market Report · 2019-06-04 · dry cargo chartering Supramax sentiment has...
twitter.com/banchero_costa
Follow us on: linkedin.com/company/banchero-costa
Weekly Market Report
Week 22/2019 (27 May – 31 May)
Comment: Vietnam Coal Imports
index
comment page 2
chartering
dry cargo “ 3
tankers “ 6
containers “ 8
sale & purchase
newbuildings / finance “ 9
secondhand / demolition “ 10
commodities
news “ 11
prices “ 13
banchero costa network chartering - sale&purchase - ship finance - insurance - agency - research - and more...
-42%
141%
71%
-49%-3% -14%
80%
-8% -28%
23% 15% 7%
-27% -2%
27%
60%
9%
-24% -9% -10%
32% 8%
0%
31% 10%
-27%
73%
-2%
-60%
-10%
40%
90%
140 %
190 %
240 %
290 %
0.0
0.4
0.8
1.2
1.6
2.0
2.4
2.8
3.2
3.6
4.0
Jan
-17
Feb
-17
Mar
-17
Ap
r-1
7
May
-17
Jun
-17
Jul-
17
Au
g-1
7
Sep
-17
Oct
-17
No
v-1
7
Dec
-17
Jan
-18
Feb
-18
Mar
-18
Ap
r-1
8
May
-18
Jun
-18
Jul-
18
Au
g-1
8
Sep
-18
Oct
-18
No
v-1
8
Dec
-18
Jan
-19
Feb
-19
Mar
-19
Ap
r-1
9
mln
to
nn
es
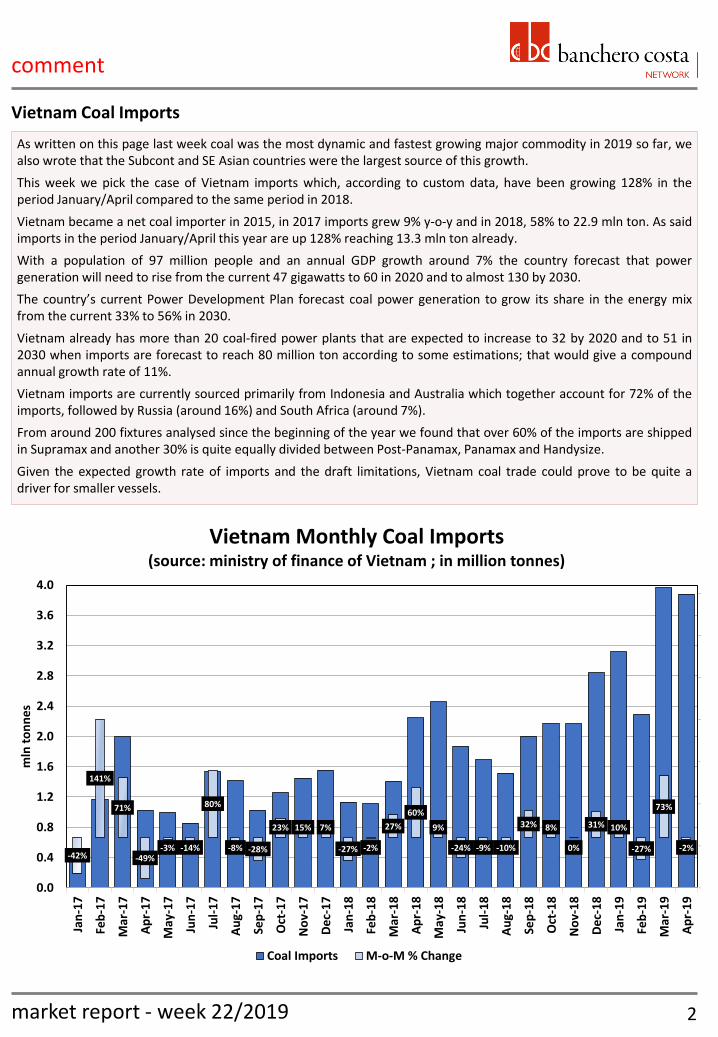
Vietnam Monthly Coal Imports(source: ministry of finance of Vietnam ; in million tonnes)
Coal Imports M-o-M % Change
comment
2 market report - week 22/2019
As written on this page last week coal was the most dynamic and fastest growing major commodity in 2019 so far, we also wrote that the Subcont and SE Asian countries were the largest source of this growth.
This week we pick the case of Vietnam imports which, according to custom data, have been growing 128% in the period January/April compared to the same period in 2018.
Vietnam became a net coal importer in 2015, in 2017 imports grew 9% y-o-y and in 2018, 58% to 22.9 mln ton. As said imports in the period January/April this year are up 128% reaching 13.3 mln ton already.
With a population of 97 million people and an annual GDP growth around 7% the country forecast that power generation will need to rise from the current 47 gigawatts to 60 in 2020 and to almost 130 by 2030.
The country’s current Power Development Plan forecast coal power generation to grow its share in the energy mix from the current 33% to 56% in 2030.
Vietnam already has more than 20 coal-fired power plants that are expected to increase to 32 by 2020 and to 51 in 2030 when imports are forecast to reach 80 million ton according to some estimations; that would give a compound annual growth rate of 11%.
Vietnam imports are currently sourced primarily from Indonesia and Australia which together account for 72% of the imports, followed by Russia (around 16%) and South Africa (around 7%).
From around 200 fixtures analysed since the beginning of the year we found that over 60% of the imports are shipped in Supramax and another 30% is quite equally divided between Post-Panamax, Panamax and Handysize.
Given the expected growth rate of imports and the draft limitations, Vietnam coal trade could prove to be quite a driver for smaller vessels.
Vietnam Coal Imports
Unit 31-May 24-May W-o-W Y-o-Y
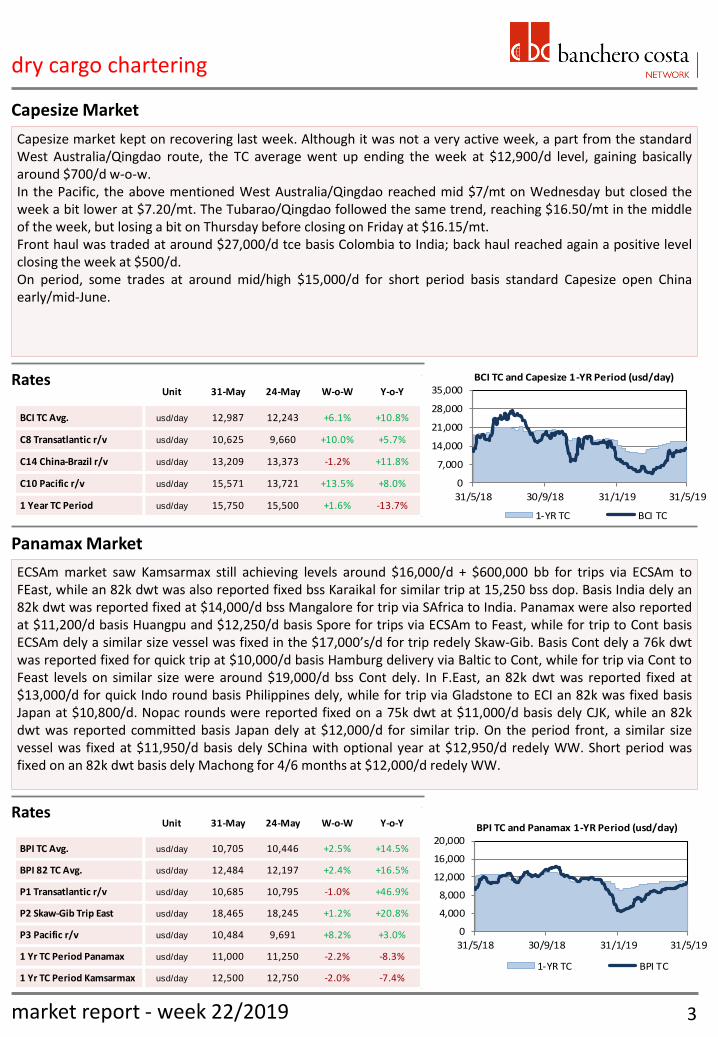
BPI TC Avg. usd/day 10,705 10,446 +2.5% +14.5%
BPI 82 TC Avg. usd/day 12,484 12,197 +2.4% +16.5%
P1 Transatlantic r/v usd/day 10,685 10,795 -1.0% +46.9%
P2 Skaw-Gib Trip East usd/day 18,465 18,245 +1.2% +20.8%
P3 Pacific r/v usd/day 10,484 9,691 +8.2% +3.0%
1 Yr TC Period Panamax usd/day 11,000 11,250 -2.2% -8.3%
1 Yr TC Period Kamsarmax usd/day 12,500 12,750 -2.0% -7.4%
Unit 31-May 24-May W-o-W Y-o-Y
BCI TC Avg. usd/day 12,987 12,243 +6.1% +10.8%
C8 Transatlantic r/v usd/day 10,625 9,660 +10.0% +5.7%
C14 China-Brazil r/v usd/day 13,209 13,373 -1.2% +11.8%
C10 Pacific r/v usd/day 15,571 13,721 +13.5% +8.0%
1 Year TC Period usd/day 15,750 15,500 +1.6% -13.7%
dry cargo chartering
Capesize market kept on recovering last week. Although it was not a very active week, a part from the standard West Australia/Qingdao route, the TC average went up ending the week at $12,900/d level, gaining basically around $700/d w-o-w. In the Pacific, the above mentioned West Australia/Qingdao reached mid $7/mt on Wednesday but closed the week a bit lower at $7.20/mt. The Tubarao/Qingdao followed the same trend, reaching $16.50/mt in the middle of the week, but losing a bit on Thursday before closing on Friday at $16.15/mt. Front haul was traded at around $27,000/d tce basis Colombia to India; back haul reached again a positive level closing the week at $500/d. On period, some trades at around mid/high $15,000/d for short period basis standard Capesize open China early/mid-June.
Capesize Market
Rates
Panamax Market
Rates
ECSAm market saw Kamsarmax still achieving levels around $16,000/d + $600,000 bb for trips via ECSAm to FEast, while an 82k dwt was also reported fixed bss Karaikal for similar trip at 15,250 bss dop. Basis India dely an 82k dwt was reported fixed at $14,000/d bss Mangalore for trip via SAfrica to India. Panamax were also reported at $11,200/d basis Huangpu and $12,250/d basis Spore for trips via ECSAm to Feast, while for trip to Cont basis ECSAm dely a similar size vessel was fixed in the $17,000’s/d for trip redely Skaw-Gib. Basis Cont dely a 76k dwt was reported fixed for quick trip at $10,000/d basis Hamburg delivery via Baltic to Cont, while for trip via Cont to Feast levels on similar size were around $19,000/d bss Cont dely. In F.East, an 82k dwt was reported fixed at $13,000/d for quick Indo round basis Philippines dely, while for trip via Gladstone to ECI an 82k was fixed basis Japan at $10,800/d. Nopac rounds were reported fixed on a 75k dwt at $11,000/d basis dely CJK, while an 82k dwt was reported committed basis Japan dely at $12,000/d for similar trip. On the period front, a similar size vessel was fixed at $11,950/d basis dely SChina with optional year at $12,950/d redely WW. Short period was fixed on an 82k dwt basis dely Machong for 4/6 months at $12,000/d redely WW.
3
0
7,000
14,000
21,000
28,000
35,000
31/5/18 30/9/18 31/1/19 31/5/19
BCI TC and Capesize 1-YR Period (usd/day)
1-YR TC BCI TC
0
4,000
8,000
12,000
16,000
20,000
31/5/18 30/9/18 31/1/19 31/5/19
BPI TC and Panamax 1-YR Period (usd/day)
1-YR TC BPI TC
market report - week 22/2019
dry cargo chartering
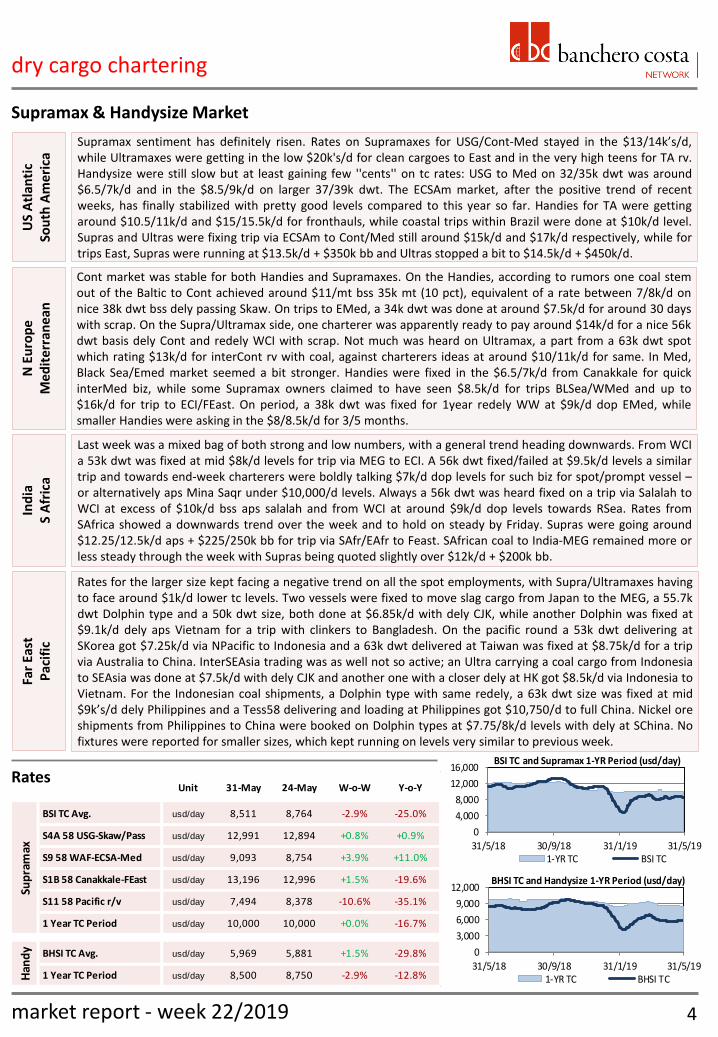
Supramax sentiment has definitely risen. Rates on Supramaxes for USG/Cont-Med stayed in the $13/14k’s/d, while Ultramaxes were getting in the low $20k's/d for clean cargoes to East and in the very high teens for TA rv. Handysize were still slow but at least gaining few ''cents'' on tc rates: USG to Med on 32/35k dwt was around $6.5/7k/d and in the $8.5/9k/d on larger 37/39k dwt. The ECSAm market, after the positive trend of recent weeks, has finally stabilized with pretty good levels compared to this year so far. Handies for TA were getting around $10.5/11k/d and $15/15.5k/d for fronthauls, while coastal trips within Brazil were done at $10k/d level. Supras and Ultras were fixing trip via ECSAm to Cont/Med still around $15k/d and $17k/d respectively, while for trips East, Supras were running at $13.5k/d + $350k bb and Ultras stopped a bit to $14.5k/d + $450k/d.
Supramax & Handysize Market
Ind
ia
S A
fric
a
Cont market was stable for both Handies and Supramaxes. On the Handies, according to rumors one coal stem out of the Baltic to Cont achieved around $11/mt bss 35k mt (10 pct), equivalent of a rate between 7/8k/d on nice 38k dwt bss dely passing Skaw. On trips to EMed, a 34k dwt was done at around $7.5k/d for around 30 days with scrap. On the Supra/Ultramax side, one charterer was apparently ready to pay around $14k/d for a nice 56k dwt basis dely Cont and redely WCI with scrap. Not much was heard on Ultramax, a part from a 63k dwt spot which rating $13k/d for interCont rv with coal, against charterers ideas at around $10/11k/d for same. In Med, Black Sea/Emed market seemed a bit stronger. Handies were fixed in the $6.5/7k/d from Canakkale for quick interMed biz, while some Supramax owners claimed to have seen $8.5k/d for trips BLSea/WMed and up to $16k/d for trip to ECI/FEast. On period, a 38k dwt was fixed for 1year redely WW at $9k/d dop EMed, while smaller Handies were asking in the $8/8.5k/d for 3/5 months.
Last week was a mixed bag of both strong and low numbers, with a general trend heading downwards. From WCI a 53k dwt was fixed at mid $8k/d levels for trip via MEG to ECI. A 56k dwt fixed/failed at $9.5k/d levels a similar trip and towards end-week charterers were boldly talking $7k/d dop levels for such biz for spot/prompt vessel – or alternatively aps Mina Saqr under $10,000/d levels. Always a 56k dwt was heard fixed on a trip via Salalah to WCI at excess of $10k/d bss aps salalah and from WCI at around $9k/d dop levels towards RSea. Rates from SAfrica showed a downwards trend over the week and to hold on steady by Friday. Supras were going around $12.25/12.5k/d aps + $225/250k bb for trip via SAfr/EAfr to Feast. SAfrican coal to India-MEG remained more or less steady through the week with Supras being quoted slightly over $12k/d + $200k bb.
Far
East
P
acif
ic
Rates for the larger size kept facing a negative trend on all the spot employments, with Supra/Ultramaxes having to face around $1k/d lower tc levels. Two vessels were fixed to move slag cargo from Japan to the MEG, a 55.7k dwt Dolphin type and a 50k dwt size, both done at $6.85k/d with dely CJK, while another Dolphin was fixed at $9.1k/d dely aps Vietnam for a trip with clinkers to Bangladesh. On the pacific round a 53k dwt delivering at SKorea got $7.25k/d via NPacific to Indonesia and a 63k dwt delivered at Taiwan was fixed at $8.75k/d for a trip via Australia to China. InterSEAsia trading was as well not so active; an Ultra carrying a coal cargo from Indonesia to SEAsia was done at $7.5k/d with dely CJK and another one with a closer dely at HK got $8.5k/d via Indonesia to Vietnam. For the Indonesian coal shipments, a Dolphin type with same redely, a 63k dwt size was fixed at mid $9k’s/d dely Philippines and a Tess58 delivering and loading at Philippines got $10,750/d to full China. Nickel ore shipments from Philippines to China were booked on Dolphin types at $7.75/8k/d levels with dely at SChina. No fixtures were reported for smaller sizes, which kept running on levels very similar to previous week.
US
Atl
anti
c
Sou
th A
mer
ica
4
0
4,000
8,000
12,000
16,000
31/5/18 30/9/18 31/1/19 31/5/19
BSI TC and Supramax 1-YR Period (usd/day)
1-YR TC BSI TC
0
3,000
6,000
9,000
12,000
31/5/18 30/9/18 31/1/19 31/5/19
BHSI TC and Handysize 1-YR Period (usd/day)
1-YR TC BHSI TC
market report - week 22/2019
Unit 31-May 24-May W-o-W Y-o-Y
BSI TC Avg. usd/day 8,511 8,764 -2.9% -25.0%
S4A 58 USG-Skaw/Pass usd/day 12,991 12,894 +0.8% +0.9%
S9 58 WAF-ECSA-Med usd/day 9,093 8,754 +3.9% +11.0%
S1B 58 Canakkale-FEast usd/day 13,196 12,996 +1.5% -19.6%
S11 58 Pacific r/v usd/day 7,494 8,378 -10.6% -35.1%
1 Year TC Period usd/day 10,000 10,000 +0.0% -16.7%
BHSI TC Avg. usd/day 5,969 5,881 +1.5% -29.8%
1 Year TC Period usd/day 8,500 8,750 -2.9% -12.8%
Sup
ram
axH
and
y
Rates
N E
uro
pe
M
ed
ite
rran
ean
Unit 31-May 24-May W-o-WPremium/
Discount
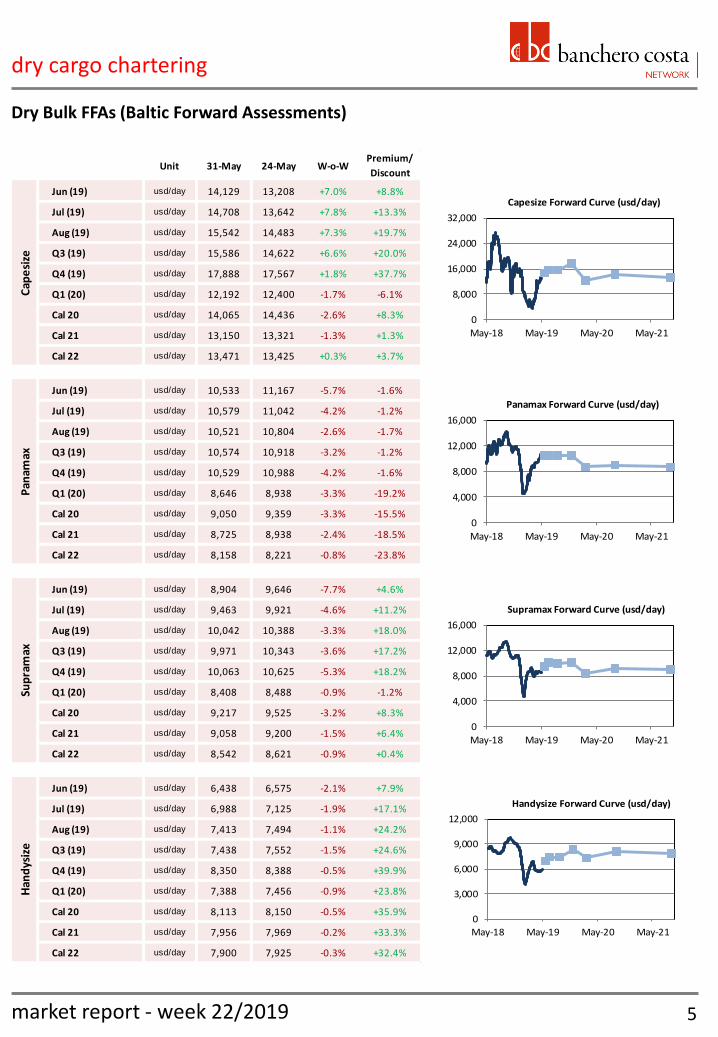
Jun (19) usd/day 14,129 13,208 +7.0% +8.8%
Jul (19) usd/day 14,708 13,642 +7.8% +13.3%
Aug (19) usd/day 15,542 14,483 +7.3% +19.7%
Q3 (19) usd/day 15,586 14,622 +6.6% +20.0%
Q4 (19) usd/day 17,888 17,567 +1.8% +37.7%
Q1 (20) usd/day 12,192 12,400 -1.7% -6.1%
Cal 20 usd/day 14,065 14,436 -2.6% +8.3%
Cal 21 usd/day 13,150 13,321 -1.3% +1.3%
Cal 22 usd/day 13,471 13,425 +0.3% +3.7%
Jun (19) usd/day 10,533 11,167 -5.7% -1.6%
Jul (19) usd/day 10,579 11,042 -4.2% -1.2%
Aug (19) usd/day 10,521 10,804 -2.6% -1.7%
Q3 (19) usd/day 10,574 10,918 -3.2% -1.2%
Q4 (19) usd/day 10,529 10,988 -4.2% -1.6%
Q1 (20) usd/day 8,646 8,938 -3.3% -19.2%
Cal 20 usd/day 9,050 9,359 -3.3% -15.5%
Cal 21 usd/day 8,725 8,938 -2.4% -18.5%
Cal 22 usd/day 8,158 8,221 -0.8% -23.8%
Jun (19) usd/day 8,904 9,646 -7.7% +4.6%
Jul (19) usd/day 9,463 9,921 -4.6% +11.2%
Aug (19) usd/day 10,042 10,388 -3.3% +18.0%
Q3 (19) usd/day 9,971 10,343 -3.6% +17.2%
Q4 (19) usd/day 10,063 10,625 -5.3% +18.2%
Q1 (20) usd/day 8,408 8,488 -0.9% -1.2%
Cal 20 usd/day 9,217 9,525 -3.2% +8.3%
Cal 21 usd/day 9,058 9,200 -1.5% +6.4%
Cal 22 usd/day 8,542 8,621 -0.9% +0.4%
Jun (19) usd/day 6,438 6,575 -2.1% +7.9%
Jul (19) usd/day 6,988 7,125 -1.9% +17.1%
Aug (19) usd/day 7,413 7,494 -1.1% +24.2%
Q3 (19) usd/day 7,438 7,552 -1.5% +24.6%
Q4 (19) usd/day 8,350 8,388 -0.5% +39.9%
Q1 (20) usd/day 7,388 7,456 -0.9% +23.8%
Cal 20 usd/day 8,113 8,150 -0.5% +35.9%
Cal 21 usd/day 7,956 7,969 -0.2% +33.3%
Cal 22 usd/day 7,900 7,925 -0.3% +32.4%
Han
dys
ize
Cap
esi
zeP
anam
axSu
pra
max
0
3,000
6,000
9,000
12,000
May-18 May-19 May-20 May-21
Handysize Forward Curve (usd/day)
0
4,000
8,000
12,000
16,000
May-18 May-19 May-20 May-21
Supramax Forward Curve (usd/day)
0
8,000
16,000
24,000
32,000
May-18 May-19 May-20 May-21
Capesize Forward Curve (usd/day)
dry cargo chartering
Dry Bulk FFAs (Baltic Forward Assessments)
5
0
4,000
8,000
12,000
16,000
May-18 May-19 May-20 May-21
Panamax Forward Curve (usd/day)
market report - week 22/2019
Unit 31-May 24-May W-o-W Y-o-Y
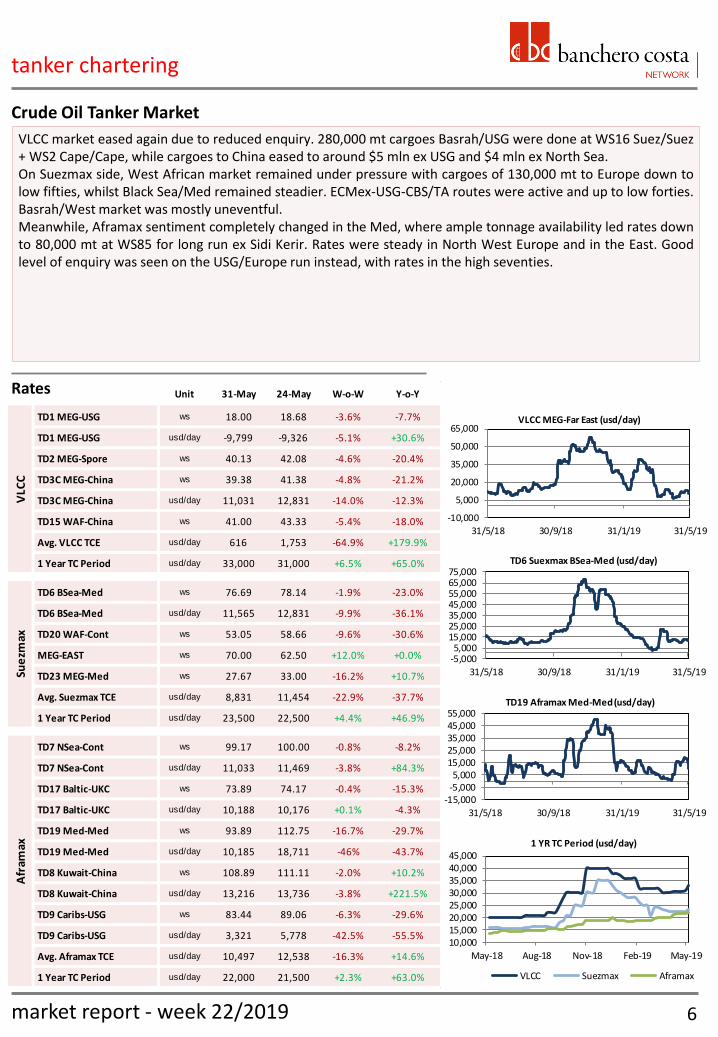
TD1 MEG-USG ws 18.00 18.68 -3.6% -7.7%
TD1 MEG-USG usd/day -9,799 -9,326 -5.1% +30.6%
TD2 MEG-Spore ws 40.13 42.08 -4.6% -20.4%
TD3C MEG-China ws 39.38 41.38 -4.8% -21.2%
TD3C MEG-China usd/day 11,031 12,831 -14.0% -12.3%
TD15 WAF-China ws 41.00 43.33 -5.4% -18.0%
Avg. VLCC TCE usd/day 616 1,753 -64.9% +179.9%
1 Year TC Period usd/day 33,000 31,000 +6.5% +65.0%
TD6 BSea-Med ws 76.69 78.14 -1.9% -23.0%
TD6 BSea-Med usd/day 11,565 12,831 -9.9% -36.1%
TD20 WAF-Cont ws 53.05 58.66 -9.6% -30.6%
MEG-EAST ws 70.00 62.50 +12.0% +0.0%
TD23 MEG-Med ws 27.67 33.00 -16.2% +10.7%
Avg. Suezmax TCE usd/day 8,831 11,454 -22.9% -37.7%
1 Year TC Period usd/day 23,500 22,500 +4.4% +46.9%
TD7 NSea-Cont ws 99.17 100.00 -0.8% -8.2%
TD7 NSea-Cont usd/day 11,033 11,469 -3.8% +84.3%
TD17 Baltic-UKC ws 73.89 74.17 -0.4% -15.3%
TD17 Baltic-UKC usd/day 10,188 10,176 +0.1% -4.3%
TD19 Med-Med ws 93.89 112.75 -16.7% -29.7%
TD19 Med-Med usd/day 10,185 18,711 -46% -43.7%
TD8 Kuwait-China ws 108.89 111.11 -2.0% +10.2%
TD8 Kuwait-China usd/day 13,216 13,736 -3.8% +221.5%
TD9 Caribs-USG ws 83.44 89.06 -6.3% -29.6%
TD9 Caribs-USG usd/day 3,321 5,778 -42.5% -55.5%
Avg. Aframax TCE usd/day 10,497 12,538 -16.3% +14.6%
1 Year TC Period usd/day 22,000 21,500 +2.3% +63.0%
VLC
CSu
ezm
axA
fram
ax
tanker chartering
VLCC market eased again due to reduced enquiry. 280,000 mt cargoes Basrah/USG were done at WS16 Suez/Suez + WS2 Cape/Cape, while cargoes to China eased to around $5 mln ex USG and $4 mln ex North Sea. On Suezmax side, West African market remained under pressure with cargoes of 130,000 mt to Europe down to low fifties, whilst Black Sea/Med remained steadier. ECMex-USG-CBS/TA routes were active and up to low forties. Basrah/West market was mostly uneventful. Meanwhile, Aframax sentiment completely changed in the Med, where ample tonnage availability led rates down to 80,000 mt at WS85 for long run ex Sidi Kerir. Rates were steady in North West Europe and in the East. Good level of enquiry was seen on the USG/Europe run instead, with rates in the high seventies.
Crude Oil Tanker Market
6
Rates
market report - week 22/2019
-10,000
5,000
20,000
35,000
50,000
65,000
31/5/18 30/9/18 31/1/19 31/5/19
VLCC MEG-Far East (usd/day)
-5,0005,000
15,00025,00035,00045,00055,00065,00075,000
31/5/18 30/9/18 31/1/19 31/5/19
TD6 Suexmax BSea-Med (usd/day)
-15,000-5,0005,000
15,00025,00035,00045,00055,000
31/5/18 30/9/18 31/1/19 31/5/19
TD19 Aframax Med-Med (usd/day)
10,00015,00020,00025,00030,00035,00040,00045,000
May-18 Aug-18 Nov-18 Feb-19 May-19
1 YR TC Period (usd/day)
VLCC Suezmax Aframax
10,00012,00014,00016,00018,00020,00022,00024,000
May-18 Aug-18 Nov-18 Feb-19 May-19
1 YR TC Period (usd/day)
LR2 MR2
0
5,000
10,000
15,000
20,000
25,000
31/5/18 30/9/18 31/1/19 31/5/19
MR Pacific Basket (usd/day)
05,000
10,00015,00020,00025,00030,00035,000
31/5/18 30/9/18 31/1/19 31/5/19
MR Atlantic Basket (usd/day)
05,000
10,00015,00020,00025,00030,00035,000
31/5/18 30/9/18 31/1/19 31/5/19
TC1 LR2 MEG-Japan (usd/day)
tanker chartering
Product Tanker Market
Delays at Turkish Straits for Daylight Restricted Vessels
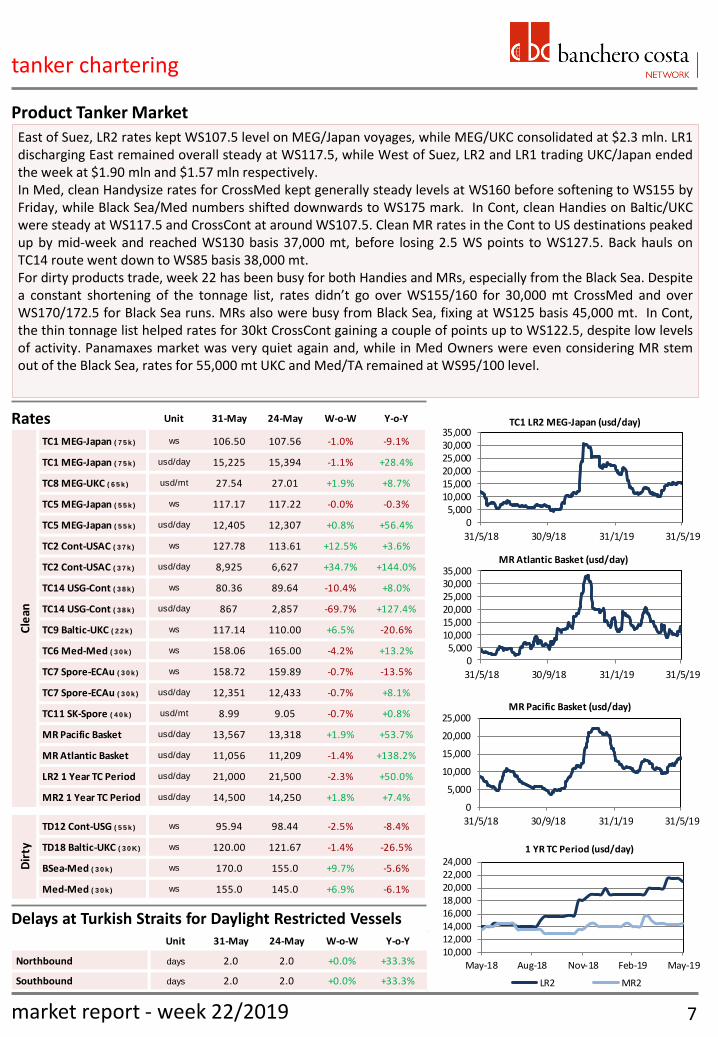
East of Suez, LR2 rates kept WS107.5 level on MEG/Japan voyages, while MEG/UKC consolidated at $2.3 mln. LR1 discharging East remained overall steady at WS117.5, while West of Suez, LR2 and LR1 trading UKC/Japan ended the week at $1.90 mln and $1.57 mln respectively. In Med, clean Handysize rates for CrossMed kept generally steady levels at WS160 before softening to WS155 by Friday, while Black Sea/Med numbers shifted downwards to WS175 mark. In Cont, clean Handies on Baltic/UKC were steady at WS117.5 and CrossCont at around WS107.5. Clean MR rates in the Cont to US destinations peaked up by mid-week and reached WS130 basis 37,000 mt, before losing 2.5 WS points to WS127.5. Back hauls on TC14 route went down to WS85 basis 38,000 mt. For dirty products trade, week 22 has been busy for both Handies and MRs, especially from the Black Sea. Despite a constant shortening of the tonnage list, rates didn’t go over WS155/160 for 30,000 mt CrossMed and over WS170/172.5 for Black Sea runs. MRs also were busy from Black Sea, fixing at WS125 basis 45,000 mt. In Cont, the thin tonnage list helped rates for 30kt CrossCont gaining a couple of points up to WS122.5, despite low levels of activity. Panamaxes market was very quiet again and, while in Med Owners were even considering MR stem out of the Black Sea, rates for 55,000 mt UKC and Med/TA remained at WS95/100 level.
7 market report - week 22/2019
Unit 31-May 24-May W-o-W Y-o-Y
TC1 MEG-Japan ( 7 5 k ) ws 106.50 107.56 -1.0% -9.1%
TC1 MEG-Japan ( 7 5 k ) usd/day 15,225 15,394 -1.1% +28.4%
TC8 MEG-UKC ( 6 5 k ) usd/mt 27.54 27.01 +1.9% +8.7%
TC5 MEG-Japan ( 5 5 k ) ws 117.17 117.22 -0.0% -0.3%
TC5 MEG-Japan ( 5 5 k ) usd/day 12,405 12,307 +0.8% +56.4%
TC2 Cont-USAC ( 3 7 k ) ws 127.78 113.61 +12.5% +3.6%
TC2 Cont-USAC ( 3 7 k ) usd/day 8,925 6,627 +34.7% +144.0%
TC14 USG-Cont ( 3 8 k ) ws 80.36 89.64 -10.4% +8.0%
TC14 USG-Cont ( 3 8 k ) usd/day 867 2,857 -69.7% +127.4%
TC9 Baltic-UKC ( 2 2 k ) ws 117.14 110.00 +6.5% -20.6%
TC6 Med-Med ( 3 0 k ) ws 158.06 165.00 -4.2% +13.2%
TC7 Spore-ECAu ( 3 0 k ) ws 158.72 159.89 -0.7% -13.5%
TC7 Spore-ECAu ( 3 0 k ) usd/day 12,351 12,433 -0.7% +8.1%
TC11 SK-Spore ( 4 0 k ) usd/mt 8.99 9.05 -0.7% +0.8%
MR Pacific Basket usd/day 13,567 13,318 +1.9% +53.7%
MR Atlantic Basket usd/day 11,056 11,209 -1.4% +138.2%
LR2 1 Year TC Period usd/day 21,000 21,500 -2.3% +50.0%
MR2 1 Year TC Period usd/day 14,500 14,250 +1.8% +7.4%
TD12 Cont-USG ( 5 5 k ) ws 95.94 98.44 -2.5% -8.4%
TD18 Baltic-UKC ( 3 0 K) ws 120.00 121.67 -1.4% -26.5%
BSea-Med ( 3 0 k ) ws 170.0 155.0 +9.7% -5.6%
Med-Med ( 3 0 k ) ws 155.0 145.0 +6.9% -6.1%
Cle
anD
irty
Rates
Unit 31-May 24-May W-o-W Y-o-Y
Northbound days 2.0 2.0 +0.0% +33.3%
Southbound days 2.0 2.0 +0.0% +33.3%
600
700
800
900
1,000
31/5/18 30/9/18 31/1/19 31/5/19
Shanghai Container Freight Index
5,000
7,000
9,000
11,000
13,000
28/5/18 28/9/18 28/1/19 28/5/19
Geared - 1 YR TC Period (usd/day)
2500 1700 1100
6,000
8,000
10,000
12,000
14,000
28/5/18 28/9/18 28/1/19 28/5/19
Gearless - 1 YR TC Period (usd/day)
4250 3500 2700
Unit 28-May 21-May W-o-W Y-o-Y
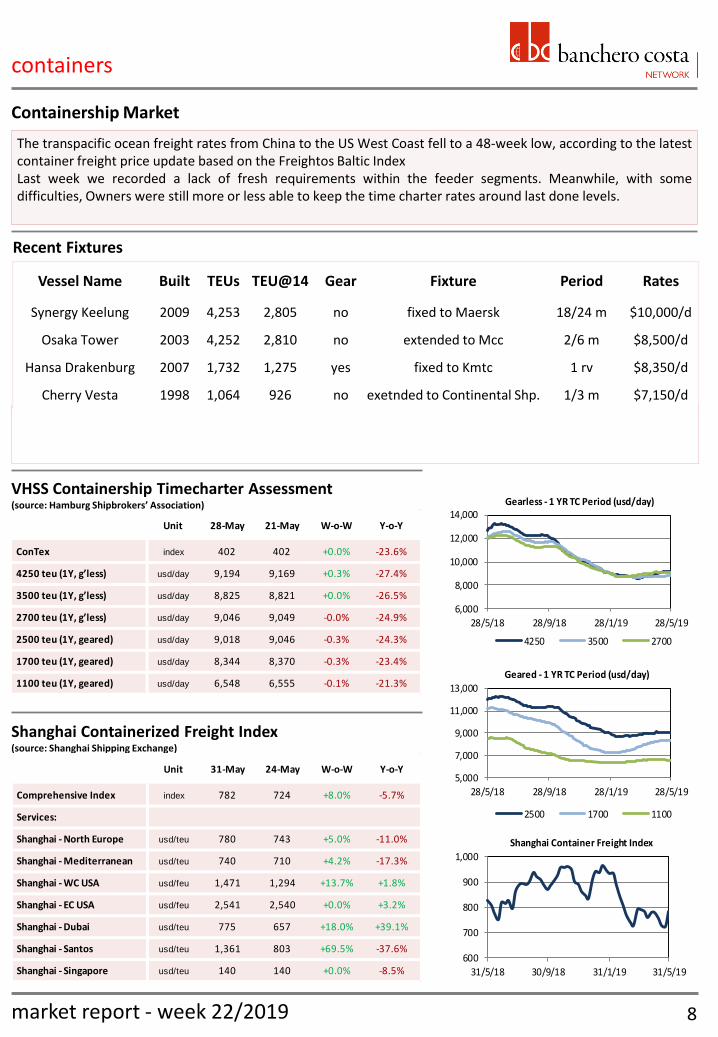
ConTex index 402 402 +0.0% -23.6%
4250 teu (1Y, g’less) usd/day 9,194 9,169 +0.3% -27.4%
3500 teu (1Y, g’less) usd/day 8,825 8,821 +0.0% -26.5%
2700 teu (1Y, g’less) usd/day 9,046 9,049 -0.0% -24.9%
2500 teu (1Y, geared) usd/day 9,018 9,046 -0.3% -24.3%
1700 teu (1Y, geared) usd/day 8,344 8,370 -0.3% -23.4%
1100 teu (1Y, geared) usd/day 6,548 6,555 -0.1% -21.3%
The transpacific ocean freight rates from China to the US West Coast fell to a 48-week low, according to the latest container freight price update based on the Freightos Baltic Index Last week we recorded a lack of fresh requirements within the feeder segments. Meanwhile, with some difficulties, Owners were still more or less able to keep the time charter rates around last done levels.
containers
VHSS Containership Timecharter Assessment (source: Hamburg Shipbrokers’ Association)
Containership Market
Shanghai Containerized Freight Index (source: Shanghai Shipping Exchange)
8
Unit 31-May 24-May W-o-W Y-o-Y
Comprehensive Index index 782 724 +8.0% -5.7%
Services:
Shanghai - North Europe usd/teu 780 743 +5.0% -11.0%
Shanghai - Mediterranean usd/teu 740 710 +4.2% -17.3%
Shanghai - WC USA usd/feu 1,471 1,294 +13.7% +1.8%
Shanghai - EC USA usd/feu 2,541 2,540 +0.0% +3.2%
Shanghai - Dubai usd/teu 775 657 +18.0% +39.1%
Shanghai - Santos usd/teu 1,361 803 +69.5% -37.6%
Shanghai - Singapore usd/teu 140 140 +0.0% -8.5%
market report - week 22/2019
Recent Fixtures
Vessel Name Built TEUs TEU@14 Gear Fixture Period Rates
Synergy Keelung 2009 4,253 2,805 no fixed to Maersk 18/24 m $10,000/d
Osaka Tower 2003 4,252 2,810 no extended to Mcc 2/6 m $8,500/d
Hansa Drakenburg 2007 1,732 1,275 yes fixed to Kmtc 1 rv $8,350/d
Cherry Vesta 1998 1,064 926 no exetnded to Continental Shp. 1/3 m $7,150/d
Type Size Built Yard Buyers Price Comment
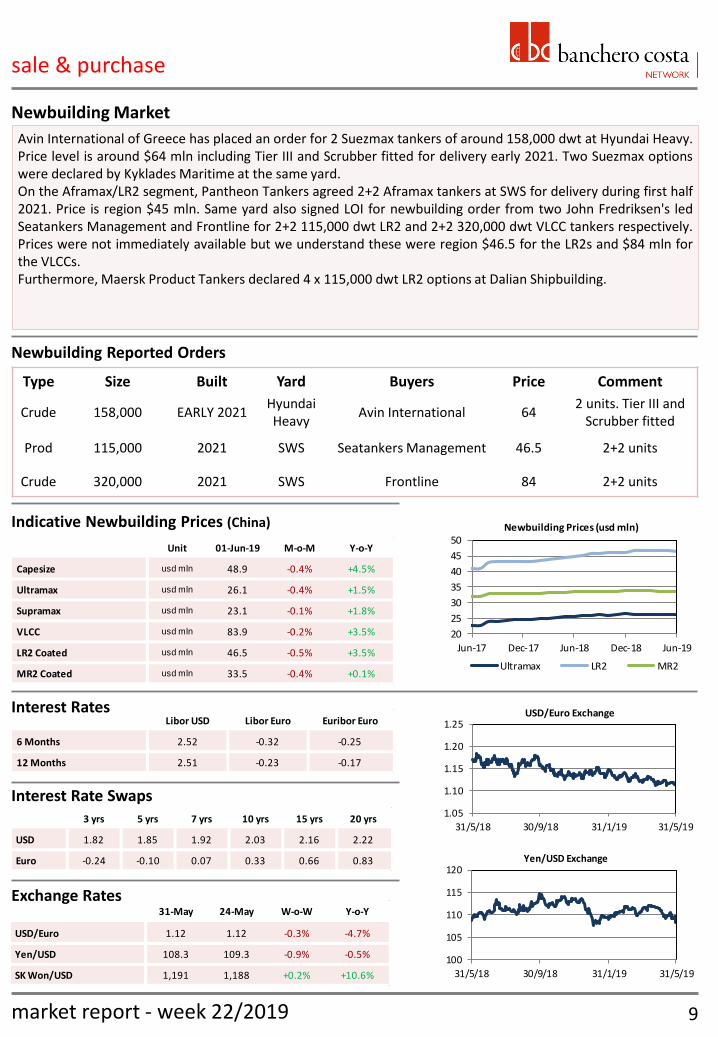
Crude 158,000 EARLY 2021 Hyundai Heavy
Avin International 64 2 units. Tier III and
Scrubber fitted
Prod 115,000 2021 SWS Seatankers Management 46.5 2+2 units
Crude 320,000 2021 SWS Frontline 84 2+2 units
100
105
110
115
120
31/5/18 30/9/18 31/1/19 31/5/19
Yen/USD Exchange
1.05
1.10
1.15
1.20
1.25
31/5/18 30/9/18 31/1/19 31/5/19
USD/Euro Exchange
20
25
30
35
40
45
50
Jun-17 Dec-17 Jun-18 Dec-18 Jun-19
Newbuilding Prices (usd mln)
Ultramax LR2 MR2
3 yrs 5 yrs 7 yrs 10 yrs 15 yrs 20 yrs
USD 1.82 1.85 1.92 2.03 2.16 2.22
Euro -0.24 -0.10 0.07 0.33 0.66 0.83
Libor USD Libor Euro Euribor Euro
6 Months 2.52 -0.32 -0.25
12 Months 2.51 -0.23 -0.17
Avin International of Greece has placed an order for 2 Suezmax tankers of around 158,000 dwt at Hyundai Heavy. Price level is around $64 mln including Tier III and Scrubber fitted for delivery early 2021. Two Suezmax options were declared by Kyklades Maritime at the same yard. On the Aframax/LR2 segment, Pantheon Tankers agreed 2+2 Aframax tankers at SWS for delivery during first half 2021. Price is region $45 mln. Same yard also signed LOI for newbuilding order from two John Fredriksen's led Seatankers Management and Frontline for 2+2 115,000 dwt LR2 and 2+2 320,000 dwt VLCC tankers respectively. Prices were not immediately available but we understand these were region $46.5 for the LR2s and $84 mln for the VLCCs. Furthermore, Maersk Product Tankers declared 4 x 115,000 dwt LR2 options at Dalian Shipbuilding.
Newbuilding Market
Newbuilding Reported Orders
Indicative Newbuilding Prices (China)
sale & purchase
Interest Rates
Interest Rate Swaps
9
Unit 01-Jun-19 M-o-M Y-o-Y
Capesize usd mln 48.9 -0.4% +4.5%
Ultramax usd mln 26.1 -0.4% +1.5%
Supramax usd mln 23.1 -0.1% +1.8%
VLCC usd mln 83.9 -0.2% +3.5%
LR2 Coated usd mln 46.5 -0.5% +3.5%
MR2 Coated usd mln 33.5 -0.4% +0.1%
31-May 24-May W-o-W Y-o-Y
USD/Euro 1.12 1.12 -0.3% -4.7%
Yen/USD 108.3 109.3 -0.9% -0.5%
SK Won/USD 1,191 1,188 +0.2% +10.6%
Exchange Rates
market report - week 22/2019
TYPE VESSEL NAME DWT BLT YARD BUYERS PRICE NOTE
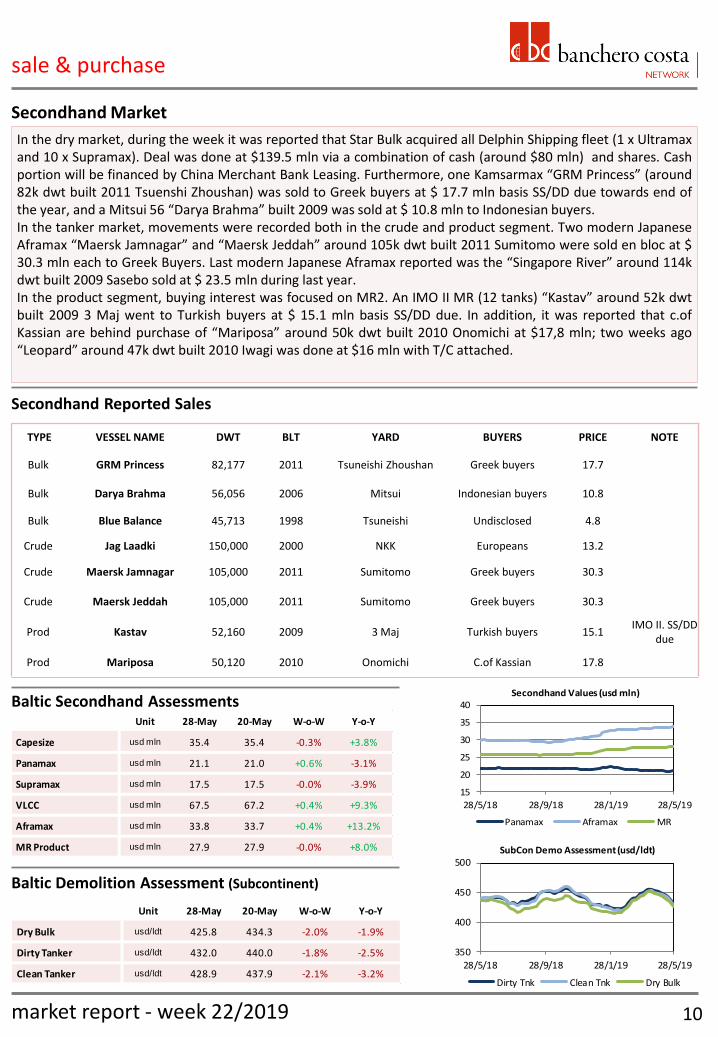
Bulk GRM Princess 82,177 2011 Tsuneishi Zhoushan Greek buyers 17.7
Bulk Darya Brahma 56,056 2006 Mitsui Indonesian buyers 10.8
Bulk Blue Balance 45,713 1998 Tsuneishi Undisclosed 4.8
Crude Jag Laadki 150,000 2000 NKK Europeans 13.2
Crude Maersk Jamnagar 105,000 2011 Sumitomo Greek buyers 30.3
Crude Maersk Jeddah 105,000 2011 Sumitomo Greek buyers 30.3
Prod Kastav 52,160 2009 3 Maj Turkish buyers 15.1 IMO II. SS/DD
due
Prod Mariposa 50,120 2010 Onomichi C.of Kassian 17.8
350
400
450
500
28/5/18 28/9/18 28/1/19 28/5/19
SubCon Demo Assessment (usd/ldt)
Dirty Tnk Clean Tnk Dry Bulk
15
20
25
30
35
40
28/5/18 28/9/18 28/1/19 28/5/19
Secondhand Values (usd mln)
Panamax Aframax MR
Unit 28-May 20-May W-o-W Y-o-Y
Dry Bulk usd/ldt 425.8 434.3 -2.0% -1.9%
Dirty Tanker usd/ldt 432.0 440.0 -1.8% -2.5%
Clean Tanker usd/ldt 428.9 437.9 -2.1% -3.2%
sale & purchase
Secondhand Market
Baltic Secondhand Assessments
Baltic Demolition Assessment (Subcontinent)
10
Unit 28-May 20-May W-o-W Y-o-Y
Capesize usd mln 35.4 35.4 -0.3% +3.8%
Panamax usd mln 21.1 21.0 +0.6% -3.1%
Supramax usd mln 17.5 17.5 -0.0% -3.9%
VLCC usd mln 67.5 67.2 +0.4% +9.3%
Aframax usd mln 33.8 33.7 +0.4% +13.2%
MR Product usd mln 27.9 27.9 -0.0% +8.0%
market report - week 22/2019
In the dry market, during the week it was reported that Star Bulk acquired all Delphin Shipping fleet (1 x Ultramax and 10 x Supramax). Deal was done at $139.5 mln via a combination of cash (around $80 mln) and shares. Cash portion will be financed by China Merchant Bank Leasing. Furthermore, one Kamsarmax “GRM Princess” (around 82k dwt built 2011 Tsuenshi Zhoushan) was sold to Greek buyers at $ 17.7 mln basis SS/DD due towards end of the year, and a Mitsui 56 “Darya Brahma” built 2009 was sold at $ 10.8 mln to Indonesian buyers. In the tanker market, movements were recorded both in the crude and product segment. Two modern Japanese Aframax “Maersk Jamnagar” and “Maersk Jeddah” around 105k dwt built 2011 Sumitomo were sold en bloc at $ 30.3 mln each to Greek Buyers. Last modern Japanese Aframax reported was the “Singapore River” around 114k dwt built 2009 Sasebo sold at $ 23.5 mln during last year. In the product segment, buying interest was focused on MR2. An IMO II MR (12 tanks) “Kastav” around 52k dwt built 2009 3 Maj went to Turkish buyers at $ 15.1 mln basis SS/DD due. In addition, it was reported that c.of Kassian are behind purchase of “Mariposa” around 50k dwt built 2010 Onomichi at $17,8 mln; two weeks ago “Leopard” around 47k dwt built 2010 Iwagi was done at $16 mln with T/C attached.
Secondhand Reported Sales
news
Dry Bulk Commodities
Trump to impose escalating tariffs on Mexican imports Trump warned that if Mexico fails to take action to "dramatically reduce or eliminate" illegal border crossings by immigrants, he will raise the tariff to 10pc on 1 July, 15pc on 1 August and a final rate of 25pc on 1 October. The levies would be imposed using the 1977 International Emergency Economic Powers Act, which grants the president broad powers to regulate commerce after declaring a national emergency. If Mexico retaliates, it could impose countervailing duties on US goods exports that reached $265bn last year, including $34bn of crude and petroleum products and $18bn worth of plastics. SE Asia buyers shun Iranian steel billet after latest US sanctions Major buyers of steel billet in Thailand and Indonesia are avoiding Iranian material, choosing instead to source from Russia, Vietnam and Malaysia, following the latest US sanctions on Iran's metals sector, market participants told S&P Global Platts this week. The shift in purchasing patterns has caused offers for Russian billet to rise by about $10/mt, or 2% over the past two weeks to $460-$465/mt CFR Southeast Asia. The latest deal done for up to 50,000 mt of Russian material took place at $445/mt CFR Manila last week, a $5/mt increase over another deal done earlier, market participants told Platts. China's metal imports from US replaceable; machinery may require tariff exemptions Chinese metal companies are unlikely to seek tariff exemptions for the import of metal concentrates and cathodes from the US, but may seek exemption for the import of machinery that are not replaceable, market sources told S&P Global Platts Monday. China's Ministry of Finance said last week that it will start accepting the first batch of applications for exemption to the 5%-25% tariff imposed on $60 billion worth of imports from the US on Monday. Effective June 1, a 25% import tariff is levied on 2,493 categories of goods, a 20% tariff on 1,078 goods, a 10% tariff on 974 goods, and a 5% tariff on 595 goods -- including copper and molybdenum concentrate and products from the US, the ministry said. Global steel output rose 6.4 percent year-on-year in April Global crude steel production rose 6.4 percent to 157 million tonnes in April from the same month a year ago, figures from the World Steel Association showed on Monday. Crude steel output from China, the world’s top producer and consumer of the alloy, rose to 85.0 million tonnes, up 12.7 percent from April 2018. India risks glut as steel capacity outstrips demand Indian steel mills are continuing to expand capacity, although domestic consumption is expected to lag the current capacity of 138mn t/yr for at least the next two fiscal years, raising the risk of a supply glut — especially if India's steel demand slackens. India's finished steel demand is expected increase by 7pc on the year to about 104m t in the April 2019-March 2020 fiscal year and by another 7pc to 111mn t in 2020-21, according to estimates by Priyesh Ruparelia, a steel analyst at India-focused Icra Ratings. Finished steel output in 2018-19 was higher than consumption. High water on Mississippi River causing headaches for coal shippers High water on the Mississippi River continues to be an issue for coal shippers, though the impact is most severe on the upper portion of the river, sources said Wednesday. An official with Knight Hawk Coal, which operates a loading terminal at mile marker 105 on the Upper Mississippi, roughly five miles south of Chester, Illinois, said it has not been able to load a barge for the last 10 days due to high water that has covered the road leading to the terminal. The official added that the terminal has only been operational for only “4 or 5 days" in the last 6 weeks due to high water. Argentina's soy planters betting the farm on trade war outcome Faced with a plunge in prices for their crops sparked by the U.S.-China trade war, Argentine soy farmers have had little choice this year but to take the losses or hold onto their stocks in a bet on an eventual truce. The local Rosario grains exchange estimates that despite a bumper harvest, the fall in soybean prices - at a decade low earlier this month - will knock $1.4 billion off the country's expected soybean-related income this season. Brazil May soybean exports fall 2% on year on China swine fever Brazil's May soybean exports fell to 10 million mt, down 2% year on year, Brazilian national crop agency Companhia Nacional de Abastecimento (Conab) said Thursday, as an outbreak of swine fever in China hit demand. "African swine fever outbreak in China is the primary reason for the year-on-year decline in May soy exports," Conab said. China is the largest buyer, taking over 75% of Brazilian soybean exports during January-April, Brazilian economy ministry data show. China's Ministry of Agriculture and Rural Affairs has acknowledged that the ASF situation remained serious, the report said. Source: Refinitiv / Argus Media / Platts
market report - week 22/2019 11
news
Oil & Gas
Trump's Mexican tariffs could hit U.S. refiners, add to fuel costs U.S. President Donald Trump's threats to tax Mexican imports could disrupt a long-standing cross-border energy trade, hitting U.S. consumers and refiners that use Mexican oil by boosting prices, and raising concerns about potential retaliation by the world's biggest buyer of U.S. energy products. Mexico sends 600,000 to 700,000 barrels of oil to the United States every day, mostly to refiners that process that crude into gasoline, diesel and other products. Mexico buys more than 1 million barrels per day (bpd) of U.S. crude and fuel, more than any other country, and analysts are concerned that retaliatory tariffs from Mexico could disrupt that trade. Oil prices plunge further on trade war fears Oil prices plunged by more than 1.5% to below $61 a barrel on Monday, extending last week’s heavy losses as deepening U.S. trade wars fanned fears of a global economic slowdown. Saudi Arabia, the de-facto leader of OPEC, sought to stem the price slide with assurances that the group of oil producers together with Russia would continue managing global crude supplies to avoid a surplus. Trump's sanctions hit OPEC oil output despite Saudi boost Top oil exporter Saudi Arabia has raised production in May, a Reuters survey found, but not by enough to compensate for lower Iranian exports which collapsed after the United States tightened the screw on Tehran. The 14-member OPEC pumped 30.17 million barrels per day (bpd) in May, the survey showed, down 60,000 bpd from April and the lowest OPEC total since 2015, the Reuters survey showed. Russia's May oil output hits 11-month low on dirty oil crisis Russian oil output fell to 11.11 million barrels per day (bpd) in May, its lowest level since June 2018, from 11.23 million bpd in April, Energy Ministry data showed on Sunday. The production fall resulted mainly from the closure due to oil contamination of Russia's Druzhba pipeline, which usually ships 1 million bpd, or 1 percent of global oil demand. As a result, Russian oil production during May fell by more than stipulated in a global deal with the Organization of the Petroleum Exporting Countries (OPEC). Asia's Iran oil imports hit 9-month high in April Asia's crude oil imports from Iran jumped to the highest in nine months in April, as buyers rushed to ship in purchases before their waivers from U.S. sanctions on Iran expired in May, data from government and trade sources showed on Friday. Top buyers China, India, Japan and South Korea imported a total 1.62 million barrels per day (bpd) of crude from Iran in April, up 3.2% from the previous month to the highest since July, the data showed. Iran's May crude exports slide to 400,000 bpd Iranian crude exports have fallen sharply in May to around 400,000 barrels per day (bpd), tanker data showed and two industry sources said, after the United States tightened the screws on Tehran's main source of income. The bulk of the crude is heading to Asia. Venezuelan crude trickles in to US Gulf coast Venezuelan crude — once the dominant source of heavy feedstocks for US refineries — trickled into just two refineries in March as sanctions and production issues strangled shipments to the US. US imports of Venezuelan crude in March averaged just under 47,000 b/d, down from 480,000 b/d in the same month of 2018, according to the latest Energy Information Administration data. U.S. crude stockpiles fall less than expected, gasoline builds sharply U.S. crude oil stockpiles fell less than expected last week, while gasoline stocks posted a hefty surprise build ahead of the Memorial Day long weekend as refiners boosted their rates to the highest in five months, the Energy Information Administration said on Thursday. Crude inventories fell 282,000 barrels in the week to May 24, compared with analysts' expectations for an decrease of 857,000 barrels and the industry group the American Petroleum Institute report of a 5.3 million-barrel draw. Brazil's Petrobras confirms it will ship crude to China storage facilities Brazil's Petroleo Brasileiro SA confirmed late on Tuesday that the firm is shipping crude during June and July to China to more quickly respond to demand by local refiners. Petrobras, as the company is widely known, has leased storage tanks in the port city of Qingdao, which will allow it to sell smaller quantities of crude promptly to the local market, the company told Reuters in an email. It said initial shipments of Lula and Buzios crude were set to arrive in China at the end of June and beginning of July. Source: Refinitiv / Argus Media / Platts
market report - week 22/2019 12
300
400
500
600
31/5/18 30/9/18 31/1/19 31/5/19
Wheat and Corn Prices (usd/t)
Corn Wheat
3,000
3,500
4,000
4,500
5,000
31/5/18 30/9/18 31/1/19 31/5/19
Steel Prices in China (rmb/t)
Rebar Plate
40
60
80
100
120
31/5/18 30/9/18 31/1/19 31/5/19
Iron Ore and Coal Prices (usd/t)
Steam Coal Iron Ore
40
50
60
70
80
90
31/5/18 30/9/18 31/1/19 31/5/19
Brent and WTI Oil Prices (usd/bbl)
Brent WTI
200
400
600
800
31/5/18 30/9/18 31/1/19 31/5/19
Bunker Prices @ Singapore (usd/t)
IFO 380 IFO 180 MGO
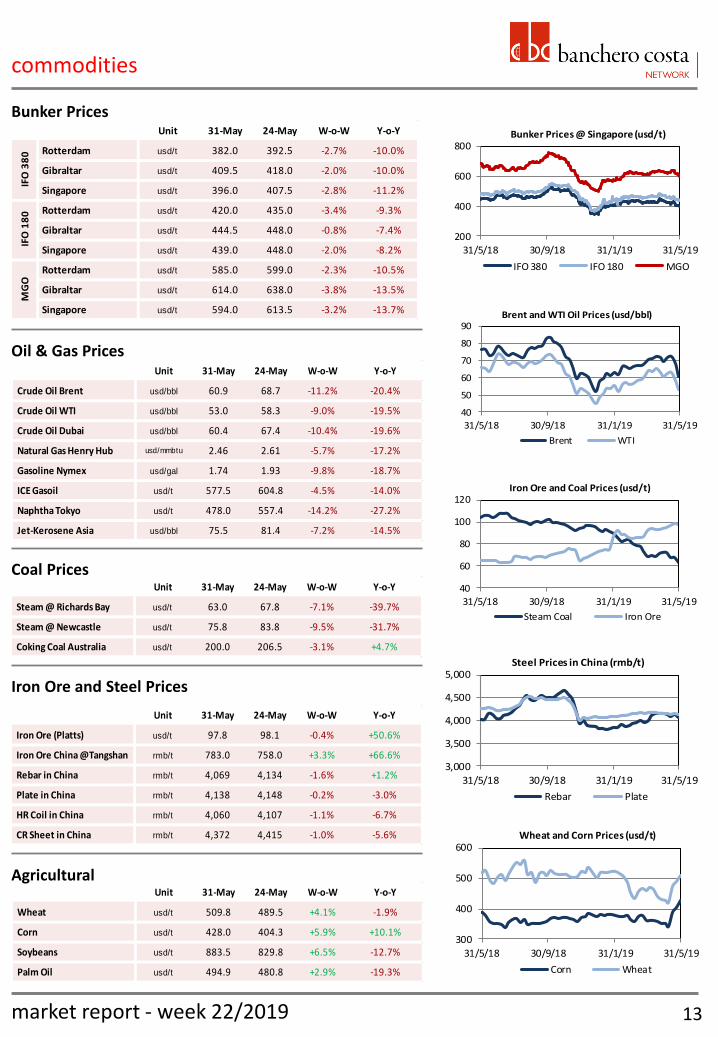
Unit 31-May 24-May W-o-W Y-o-Y
Wheat usd/t 509.8 489.5 +4.1% -1.9%
Corn usd/t 428.0 404.3 +5.9% +10.1%
Soybeans usd/t 883.5 829.8 +6.5% -12.7%
Palm Oil usd/t 494.9 480.8 +2.9% -19.3%
Unit 31-May 24-May W-o-W Y-o-Y
Iron Ore (Platts) usd/t 97.8 98.1 -0.4% +50.6%
Iron Ore China @Tangshan rmb/t 783.0 758.0 +3.3% +66.6%
Rebar in China rmb/t 4,069 4,134 -1.6% +1.2%
Plate in China rmb/t 4,138 4,148 -0.2% -3.0%
HR Coil in China rmb/t 4,060 4,107 -1.1% -6.7%
CR Sheet in China rmb/t 4,372 4,415 -1.0% -5.6%
Unit 31-May 24-May W-o-W Y-o-Y
Steam @ Richards Bay usd/t 63.0 67.8 -7.1% -39.7%
Steam @ Newcastle usd/t 75.8 83.8 -9.5% -31.7%
Coking Coal Australia usd/t 200.0 206.5 -3.1% +4.7%
Unit 31-May 24-May W-o-W Y-o-Y
Crude Oil Brent usd/bbl 60.9 68.7 -11.2% -20.4%
Crude Oil WTI usd/bbl 53.0 58.3 -9.0% -19.5%
Crude Oil Dubai usd/bbl 60.4 67.4 -10.4% -19.6%
Natural Gas Henry Hub usd/mmbtu 2.46 2.61 -5.7% -17.2%
Gasoline Nymex usd/gal 1.74 1.93 -9.8% -18.7%
ICE Gasoil usd/t 577.5 604.8 -4.5% -14.0%
Naphtha Tokyo usd/t 478.0 557.4 -14.2% -27.2%
Jet-Kerosene Asia usd/bbl 75.5 81.4 -7.2% -14.5%
Unit 31-May 24-May W-o-W Y-o-Y
Rotterdam usd/t 382.0 392.5 -2.7% -10.0%
Gibraltar usd/t 409.5 418.0 -2.0% -10.0%
Singapore usd/t 396.0 407.5 -2.8% -11.2%
Rotterdam usd/t 420.0 435.0 -3.4% -9.3%
Gibraltar usd/t 444.5 448.0 -0.8% -7.4%
Singapore usd/t 439.0 448.0 -2.0% -8.2%
Rotterdam usd/t 585.0 599.0 -2.3% -10.5%
Gibraltar usd/t 614.0 638.0 -3.8% -13.5%
Singapore usd/t 594.0 613.5 -3.2% -13.7%
IFO
38
0IF
O 1
80
MG
O
commodities
Oil & Gas Prices
Coal Prices
Iron Ore and Steel Prices
Agricultural
Bunker Prices
13 market report - week 22/2019
head office: via pammatone, 2 16121 genoa (italy)
phone: + 39-010-[5631-1]
dry - capesize 5631-200 [email protected] research 5631-535 [email protected]
dry - panamax 5631-200 [email protected] ship finance 5631-556 [email protected]
dry - handy 5631-200 [email protected] insurance 5631-700 [email protected]
dry - operation 5631-200 [email protected] p&i 5631-770 [email protected]
tankers 5631-300 [email protected] yachting 5631-764 [email protected]
containers 5631-515 [email protected] agency 5631-600 [email protected]
s&p 5631-500 [email protected] ship repair 5631-626 [email protected]
offshore 5631-550 [email protected] towage/salvage 5631-626 [email protected]
bancosta uk bancosta monaco bancosta sa medioriental
london monte carlo geneva dubai
phone: +44-207-398-1870 phone: +377-97-707-497 phone: +41-22-737-2626 phone: +971-4-360-5598
[email protected] [email protected] [email protected] [email protected]
bancosta oriente bancosta oriente bancosta oriente japan rep.office singapore hong kong beijing tokyo
phone: +65-6327-6862 phone: +852-2865-1535 phone: +86-10-8453-4993 phone: +81-362-688-958
[email protected] [email protected]
web site: www.bancosta.com
linkedin: linkedin.com/company/banchero-costa
twitter: twitter.com/banchero_costa
In addition to regular market reports, banchero costa research recognize the need for bespoke reports & analysis, tailored to specific client needs.
Reports can be produced on a wide range of shipping markets including dry bulk, tankers, gas & containers. In addition in-depth reports can be produced on specific commodity markets.
To discuss individual requirements please contact:
Phone: +65 6327 6863
Email: [email protected]
Legal notice: The information and data contained in this presentation is derived from a variety of sources, own and third party’s, public and private, and
is provided for information purposes only.
Whilst banchero costa has used reasonable efforts to include accurate and up-to-date information in this presentation, banchero costa makes no
warranties or representations as to the accuracy of any information contained herein or accuracy or reasonableness of conclusions drawn there from.
Although some forward-looking statements are made in the report, banchero costa cannot in any way guarantee their accuracy or reasonableness.
banchero costa assumes no liabilities or responsibility for any errors or omissions in the content of this report.